elmar träbert - ucl
TRANSCRIPT
Hinode / EIS is operating - is there anything on Fe in the EUV left to be done in the laboratory? Elmar Träbert
Ruhr-Universität Bochum, D-44780 Bochum, Germany, and Lawrence Livermore National Laboratory, Livermore, CA 94550, U.S.A.
in collaboration with P. Beiersdorfer, G. V. Brown, H. Chen, J. H. T. Clementson, D. B. Thorn, a. o.
German support by DFG; work at UC LLNL under US DoE Contract No. W-7405-Eng-48
E TIAL B
20 Years of
LIVERMORE
since 1986
Spectroscopy
MSSL, Dec 12, 2006
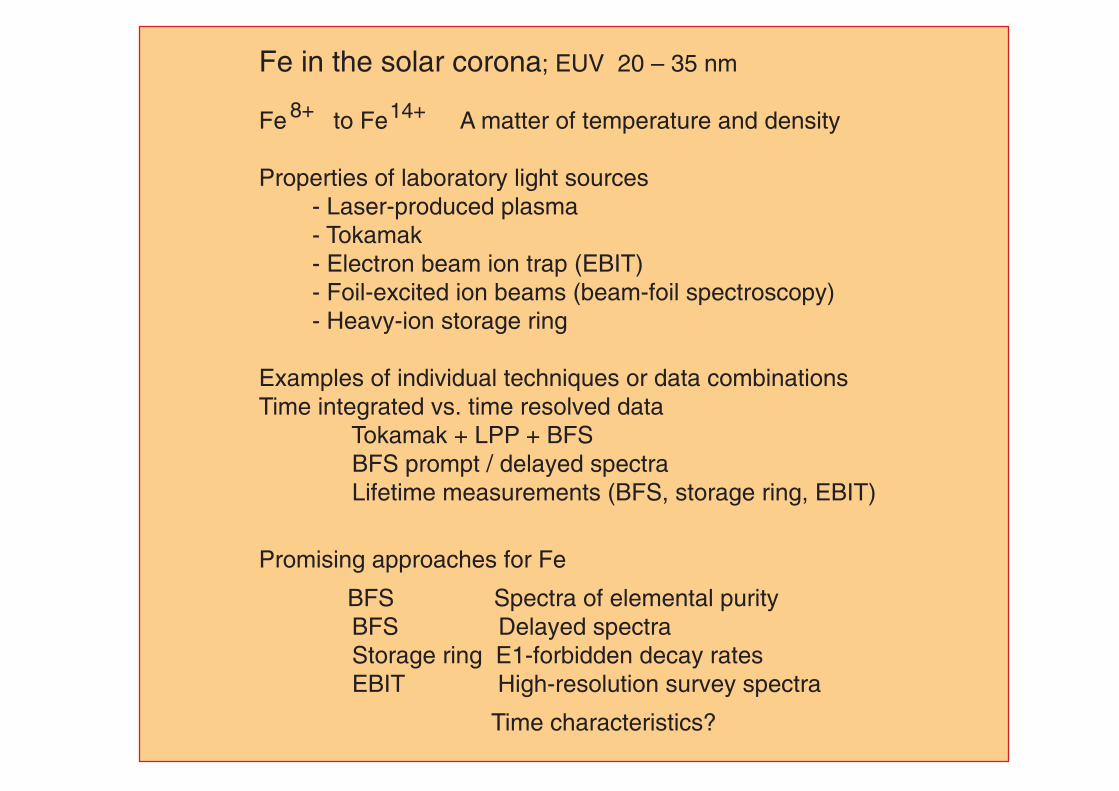
Fe in the solar corona; EUV 20 – 35 nm
Fe to Fe A matter of temperature and density
Properties of laboratory light sources - Laser-produced plasma - Tokamak - Electron beam ion trap (EBIT) - Foil-excited ion beams (beam-foil spectroscopy) - Heavy-ion storage ring
Examples of individual techniques or data combinations Time integrated vs. time resolved data Tokamak + LPP + BFS BFS prompt / delayed spectra Lifetime measurements (BFS, storage ring, EBIT)
Promising approaches for Fe
BFS Spectra of elemental purity BFS Delayed spectra Storage ring E1-forbidden decay rates EBIT High-resolution survey spectra
Time characteristics?
8+ 14+
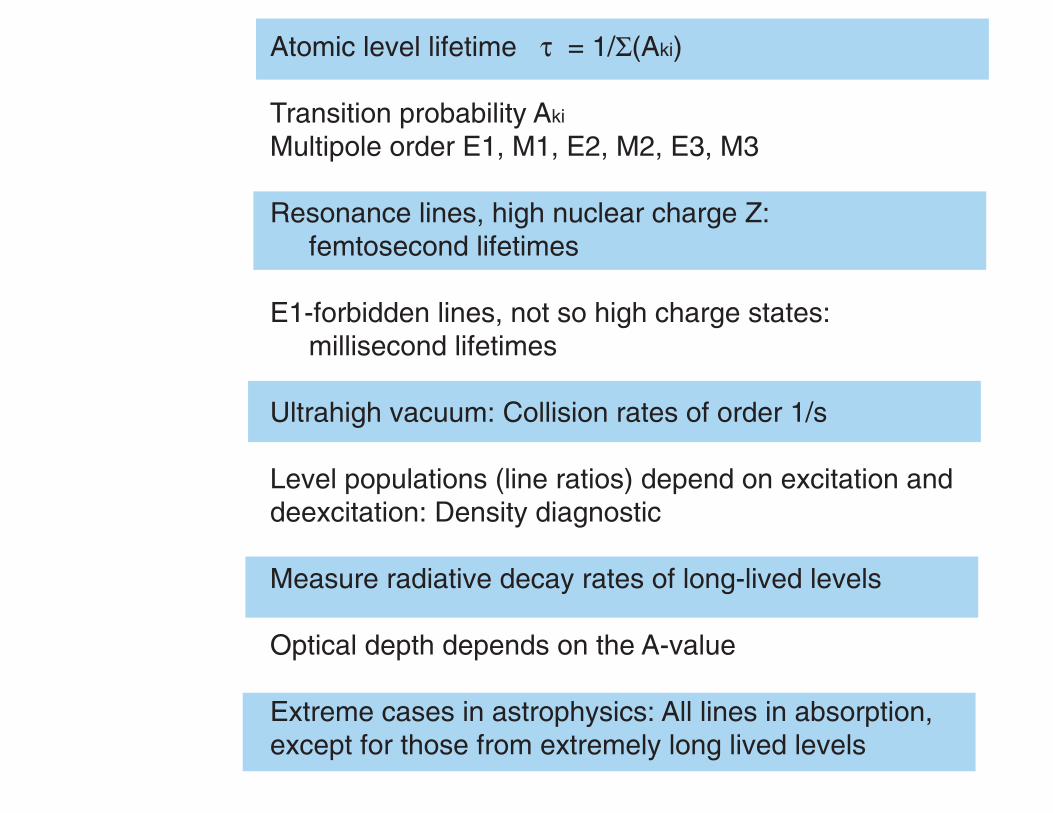
Atomic level lifetime t = 1/S(Aki)
Transition probability Aki Multipole order E1, M1, E2, M2, E3, M3
Resonance lines, high nuclear charge Z: femtosecond lifetimes
E1-forbidden lines, not so high charge states: millisecond lifetimes
Ultrahigh vacuum: Collision rates of order 1/s
Level populations (line ratios) depend on excitation and deexcitation: Density diagnostic
Measure radiative decay rates of long-lived levels
Optical depth depends on the A-value
Extreme cases in astrophysics: All lines in absorption, except for those from extremely long lived levels
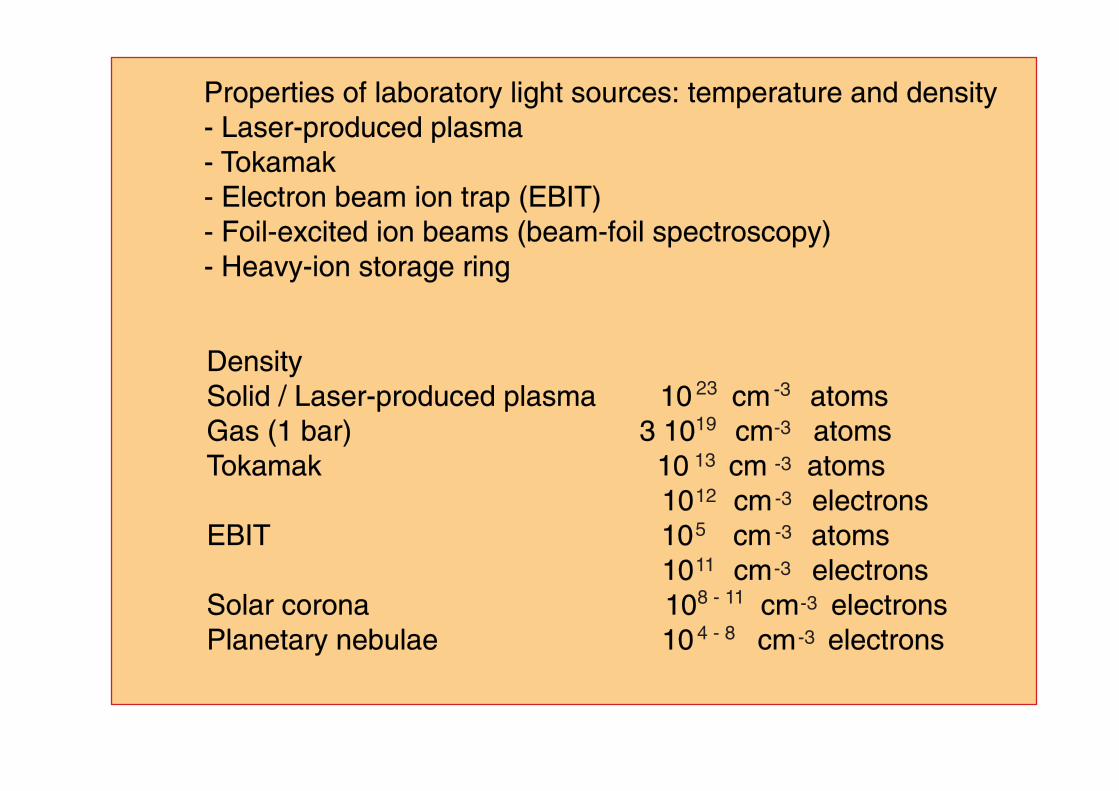
Density Solid / Laser-produced plasma 10 cm atomsGas (1 bar) 3 10 cm atomsTokamak 10 cm atoms 10 cm electrons EBIT 10 cm atoms 10 cm electrons Solar corona 10 cm electrons Planetary nebulae 10 cm electrons
Properties of laboratory light sources: temperature and density- Laser-produced plasma - Tokamak- Electron beam ion trap (EBIT)- Foil-excited ion beams (beam-foil spectroscopy) - Heavy-ion storage ring
23
19
13
12
5
11
8 - 11
4 - 8
-3
-3
-3
-3
-3
-3
-3
-3
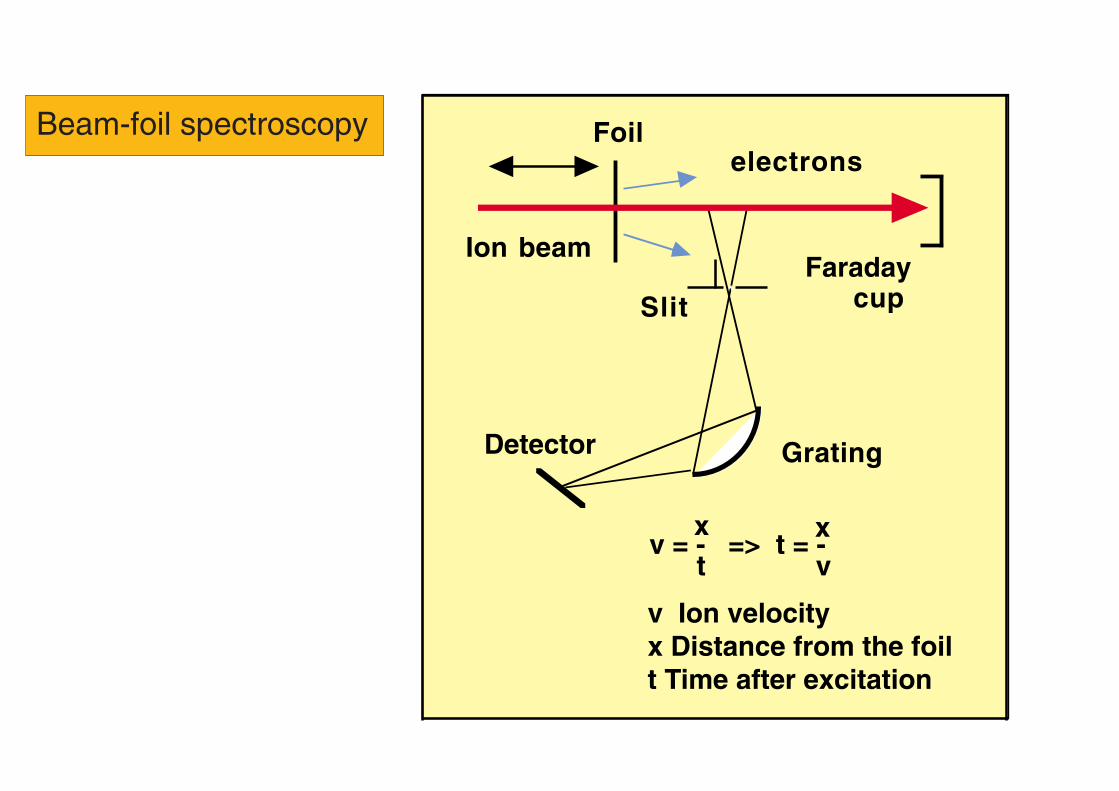
Ion beam
Foil
GratingDetector
Slit
���� electrons
Faraday cup
v = - => t = -xt
xv
v Ion velocityx Distance from the foilt Time after excitation
Beam-foil spectroscopy
0
200
400
600
800
1000
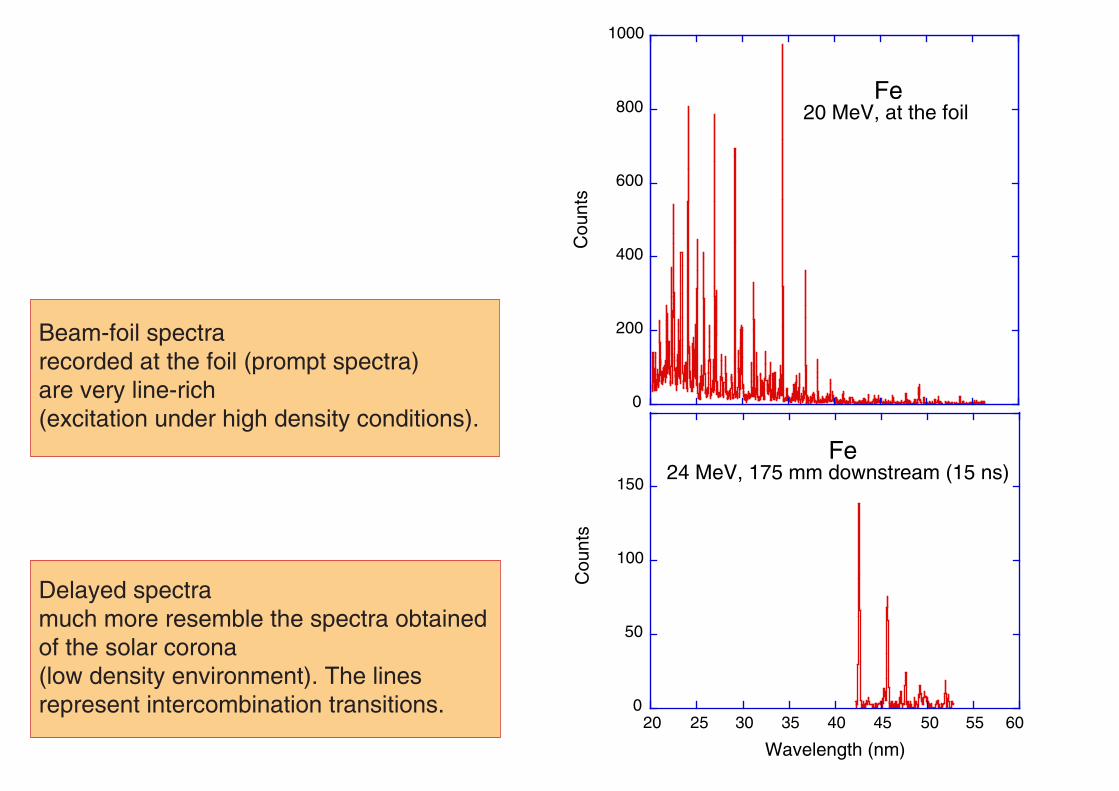
Fe 20 MeV, at the foil
Cou
nts
0
50
100
150
20 25 30 35 40 45 50 55 60
Fe 24 MeV, 175 mm downstream (15 ns)
Cou
nts
Wavelength (nm)
Beam-foil spectrarecorded at the foil (prompt spectra) are very line-rich (excitation under high density conditions).
Delayed spectra much more resemble the spectra obtained of the solar corona (low density environment). The lines represent intercombination transitions.
Signal (log)
Time
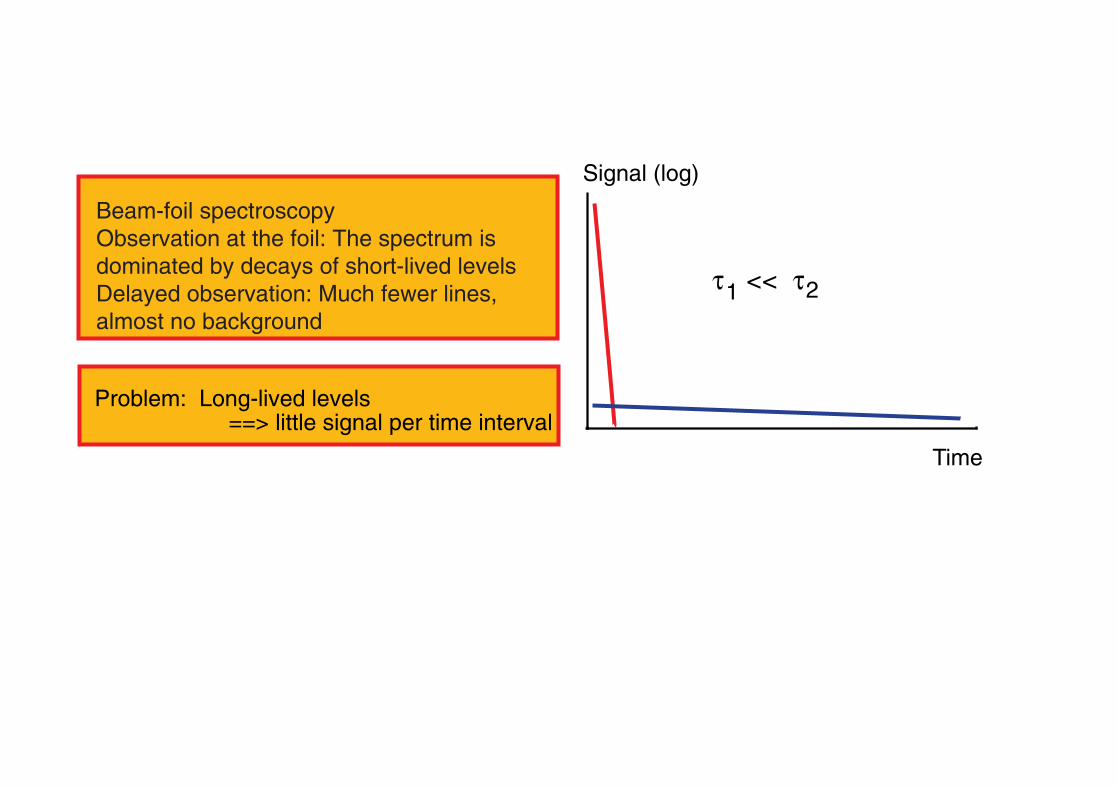
t << t1 2
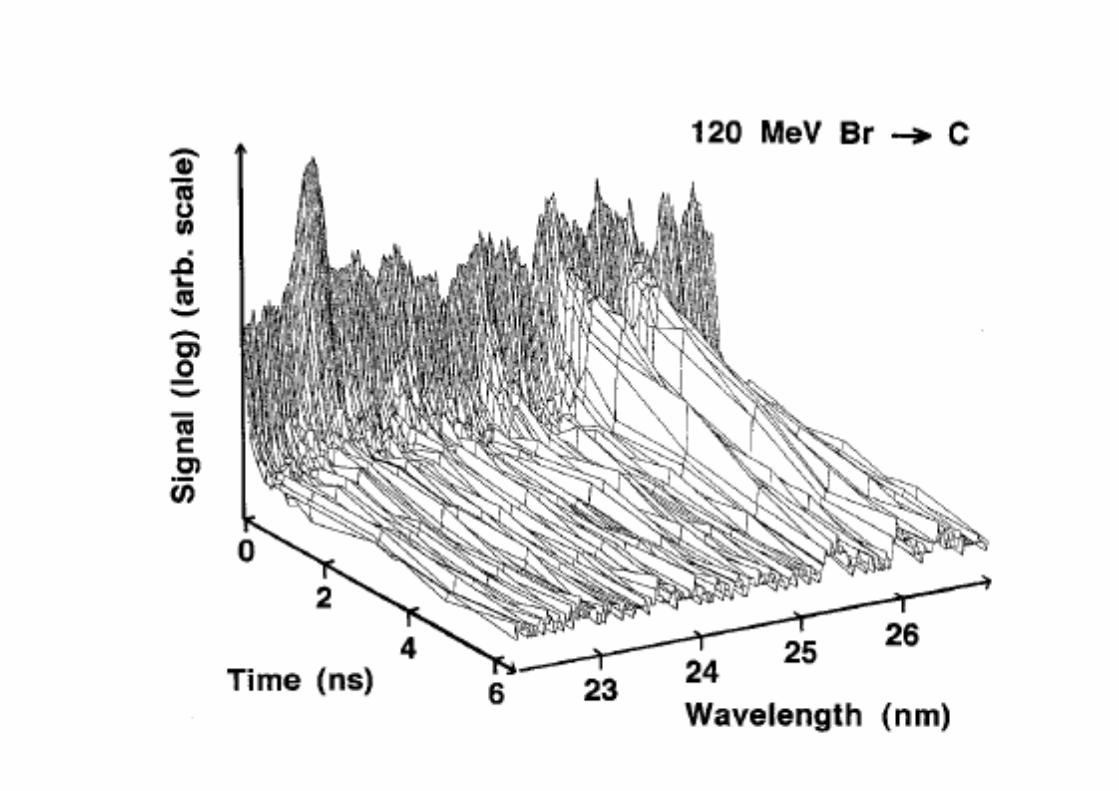
Problem: Long-lived levels ==> little signal per time interval
Beam-foil spectroscopyObservation at the foil: The spectrum is dominated by decays of short-lived levelsDelayed observation: Much fewer lines, almost no background
Signal (log)
Time
t << t1 2
Problem: Long-lived levels ==> little signal per time interval
Beam-foil spectroscopyObservation at the foil: The spectrum is dominated by decays of short-lived levelsDelayed observation: Much fewer lines, almost no background
Mg Al Si
Fe FeFe
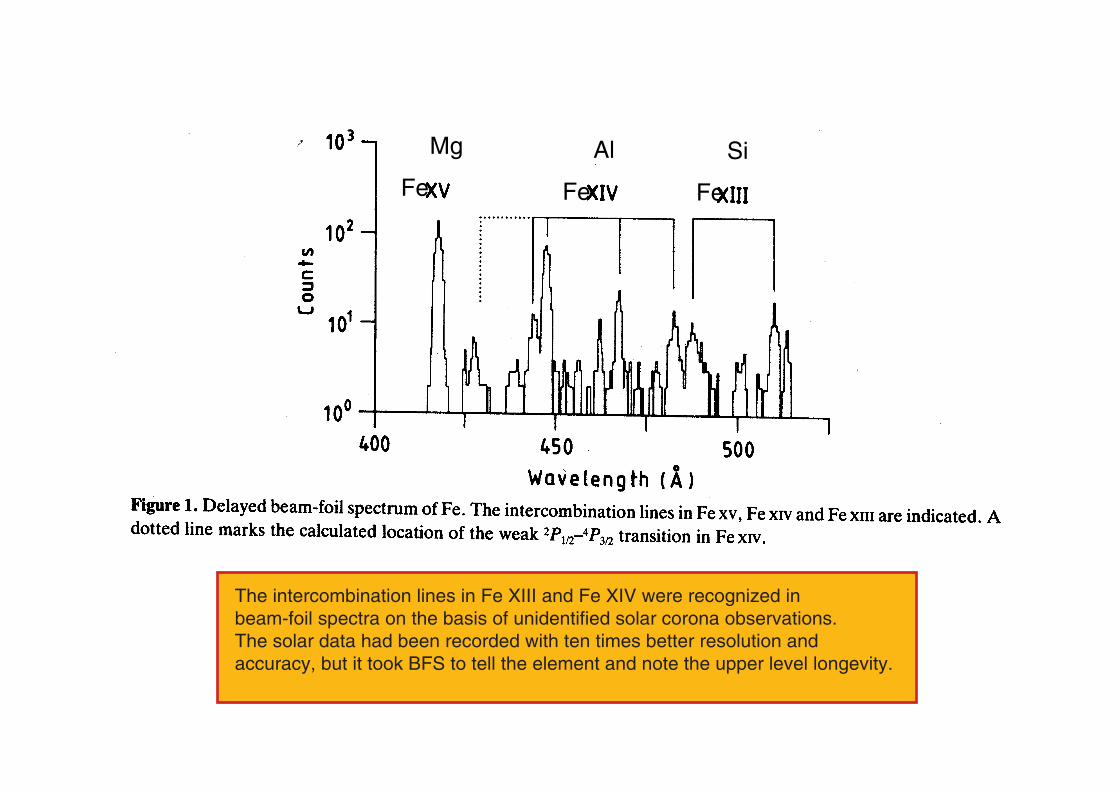
The intercombination lines in Fe XIII and Fe XIV were recognized in beam-foil spectra on the basis of unidentified solar corona observations. The solar data had been recorded with ten times better resolution and accuracy, but it took BFS to tell the element and note the upper level longevity.
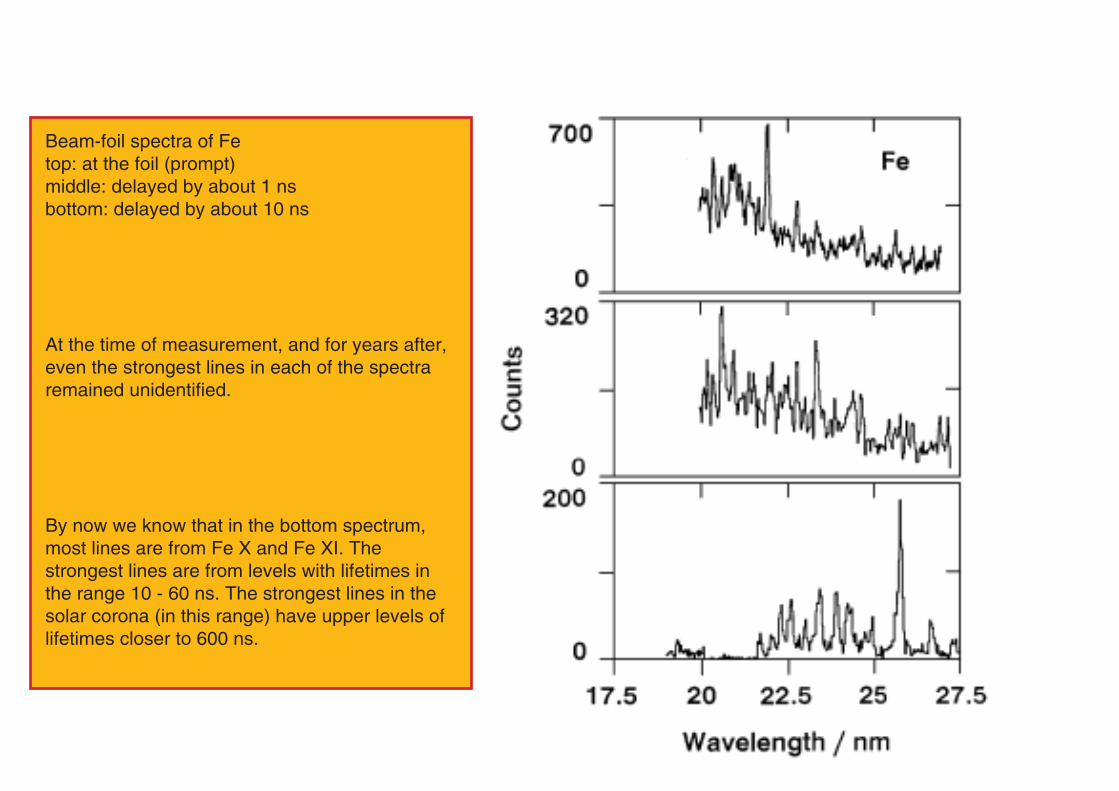
Beam-foil spectra of Fe top: at the foil (prompt)middle: delayed by about 1 nsbottom: delayed by about 10 ns
At the time of measurement, and for years after, even the strongest lines in each of the spectra remained unidentified.
By now we know that in the bottom spectrum, most lines are from Fe X and Fe XI. The strongest lines are from levels with lifetimes in the range 10 - 60 ns. The strongest lines in the solar corona (in this range) have upper levels of lifetimes closer to 600 ns.
0
25
Counts
50Fe
Ar
7 MeV
0
25
50Cl/S/P
S
S9 MeV
0
15
30
S
SSi
8 56 e eV 3 / 5 s ds; s t s .x2'=14.6" .0075"/CH
12 MeV
17.5 20.0 22.5 Wavelength / nm
25.0 27.5
0
15
30
P
P
S
P
Si
15 MeV
Beam-foil spectroscopy
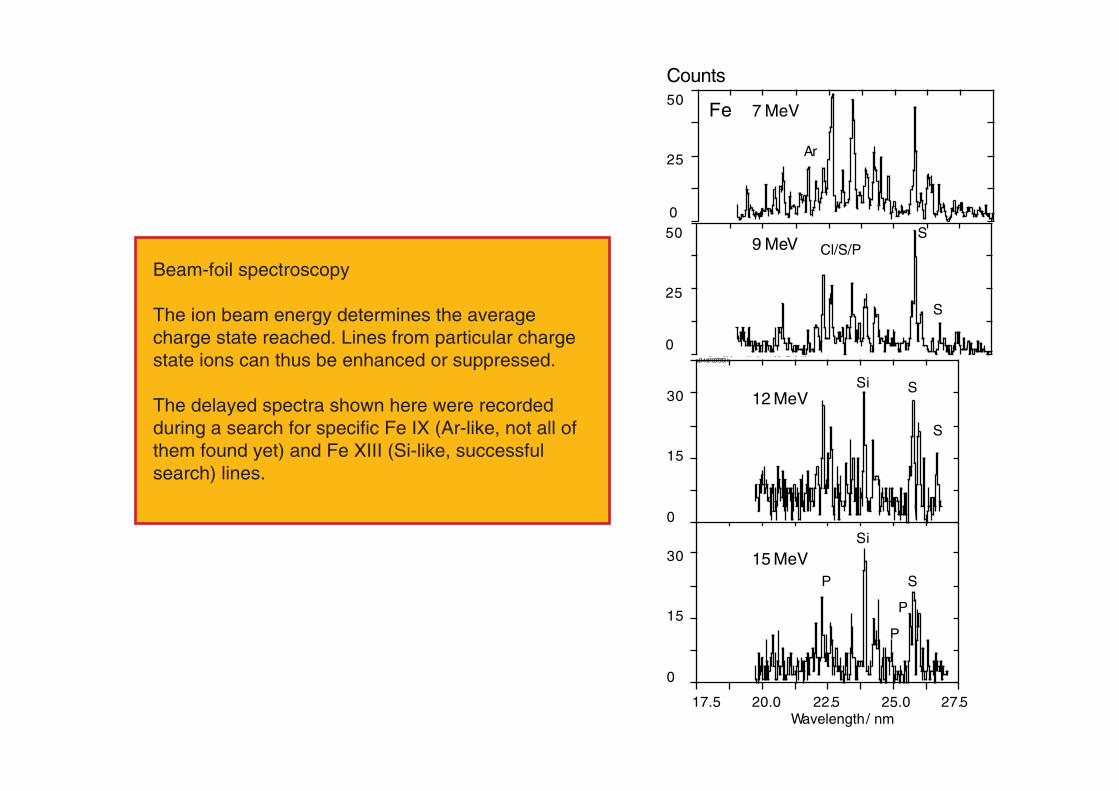
The ion beam energy determines the average charge state reached. Lines from particular charge state ions can thus be enhanced or suppressed.
The delayed spectra shown here were recorded during a search for specific Fe IX (Ar-like, not all of them found yet) and Fe XIII (Si-like, successful search) lines.
0
25
Counts
50
FeDelay 5 ns
Ar
7 MeV
0
25
50Cl/S/P
Delay 5 ns
S
S9 MeV
0
15
30P
Delay 5 ns
S
SSi
12 MeV
0
15
30
P
P
Delay 5 nsS
P
Si15 MeV
17.5 20 22.5
Wavelength / nm25 27.5
0
25
5015 MeV
PDelay 14 nsP
PSi
S
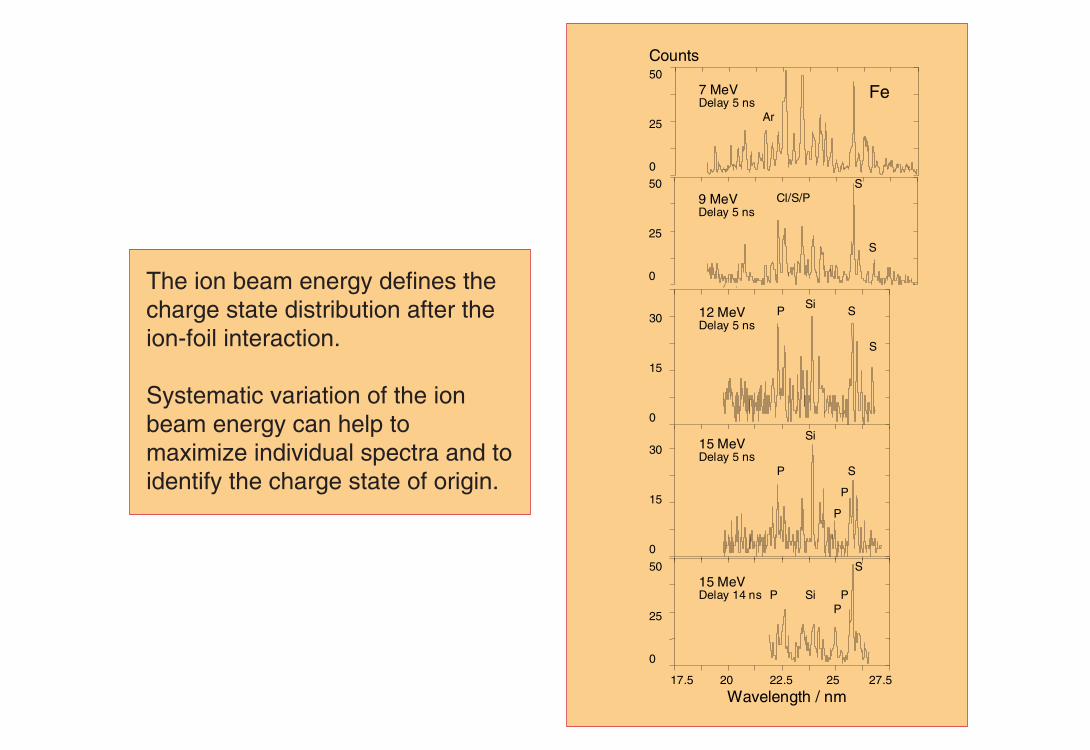
The ion beam energy defines the charge state distribution after the ion-foil interaction.
Systematic variation of the ion beam energy can help to maximize individual spectra and to identify the charge state of origin.

ns
np
2
1S P
o
0
12E1ns
P1 3 o
01
M2 M1
hfs
Mg - likeBe - like
hfs+
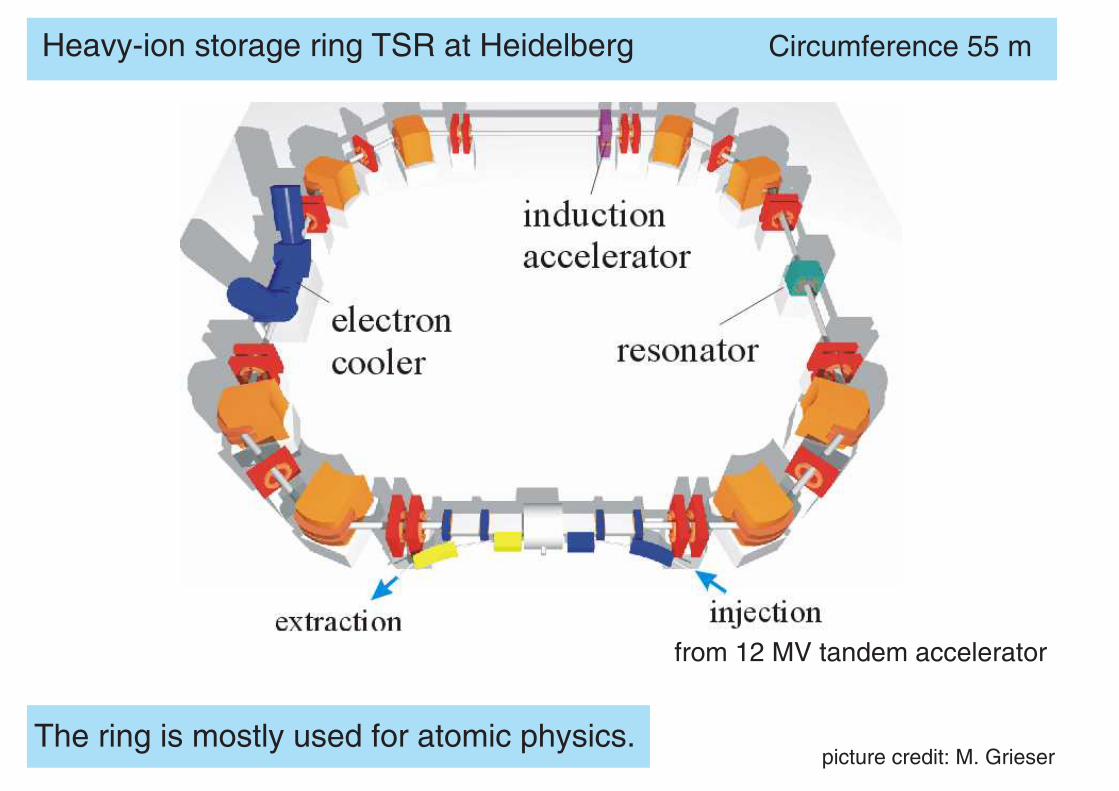
picture credit: M. Grieser
Heavy-ion storage ring TSR at Heidelberg Circumference 55 m
from 12 MV tandem accelerator
The ring is mostly used for atomic physics.
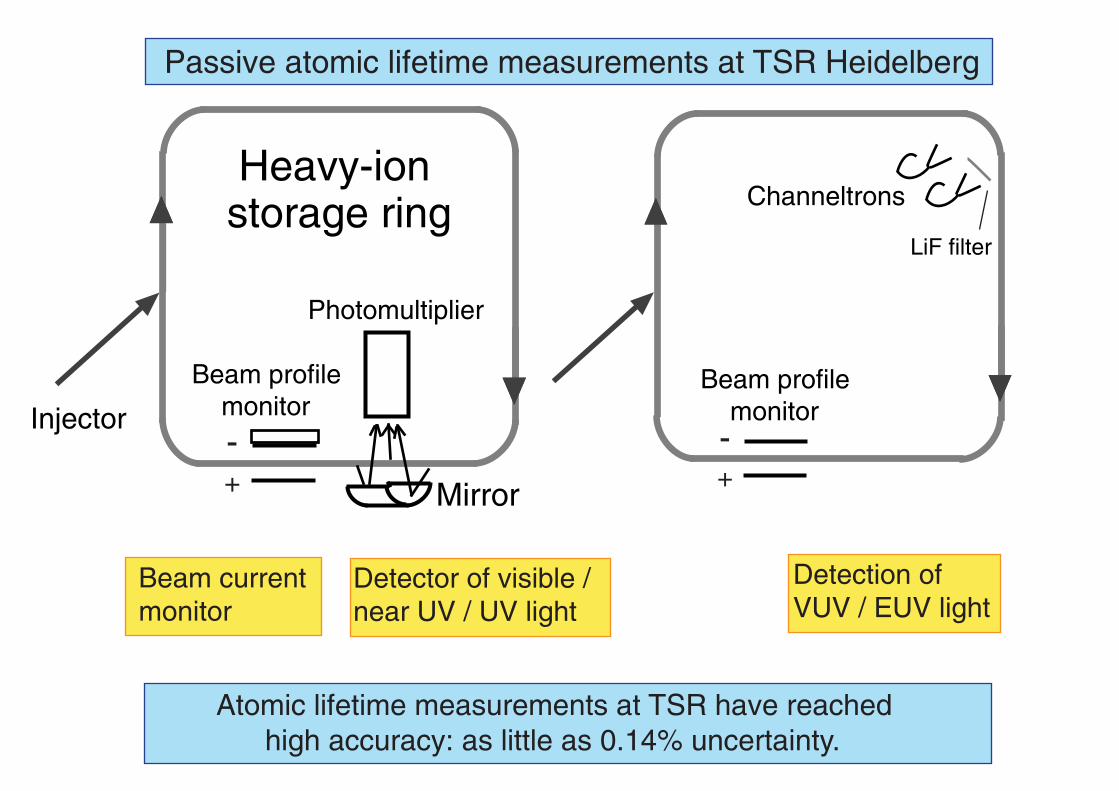
Channeltrons
+-
Beam profile monitor
LiF filter
Heavy-ion storage ring
Injector
Photomultiplier
Mirror+-
Beam profile monitor
Beam current monitor
Detector of visible / near UV / UV light
Detection of VUV / EUV light
Passive atomic lifetime measurements at TSR Heidelberg
Atomic lifetime measurements at TSR have reached high accuracy: as little as 0.14% uncertainty.
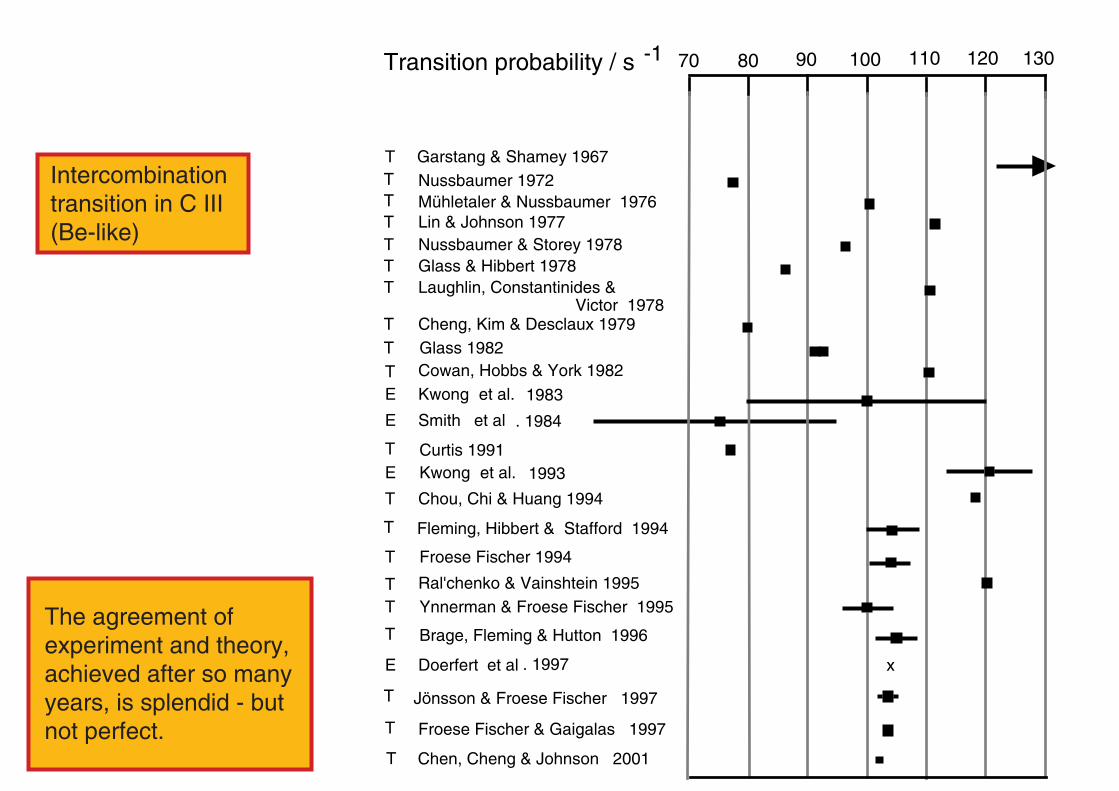
Garstang & Shamey 1967Nussbaumer 1972Mühletaler & Nussbaumer 1976Lin & Johnson 1977Nussbaumer & Storey 1978Glass & Hibbert 1978Laughlin, Constantinides & Victor 1978Cheng, Kim & Desclaux 1979Glass 1982Cowan, Hobbs & York 1982
Curtis 1991
Chou, Chi & Huang 1994
Fleming, Hibbert & Stafford 1994
Froese Fischer 1994
Ral'chenko & Vainshtein 1995Ynnerman & Froese Fischer 1995
Smith et al . 1984
Kwong et al. 1993
Doerfert et al . 1997
Transition probability / s -1 70 80 90 100 110 120 130
Brage, Fleming & Hutton 1996
Kwong et al. 1983
Jönsson & Froese Fischer 1997
T
E
E
E
E
T
T
TT
T
T
T
T
TTT
TTTTT
T
x
Froese Fischer & Gaigalas 1997T
T Chen, Cheng & Johnson 2001
Intercombination transition in C III(Be-like)
The agreement of experiment and theory, achieved after so many years, is splendid - but not perfect.
10
15
20
25
30
35
40
45
50
0 0.05 0.1 0.15 0.2 0.25
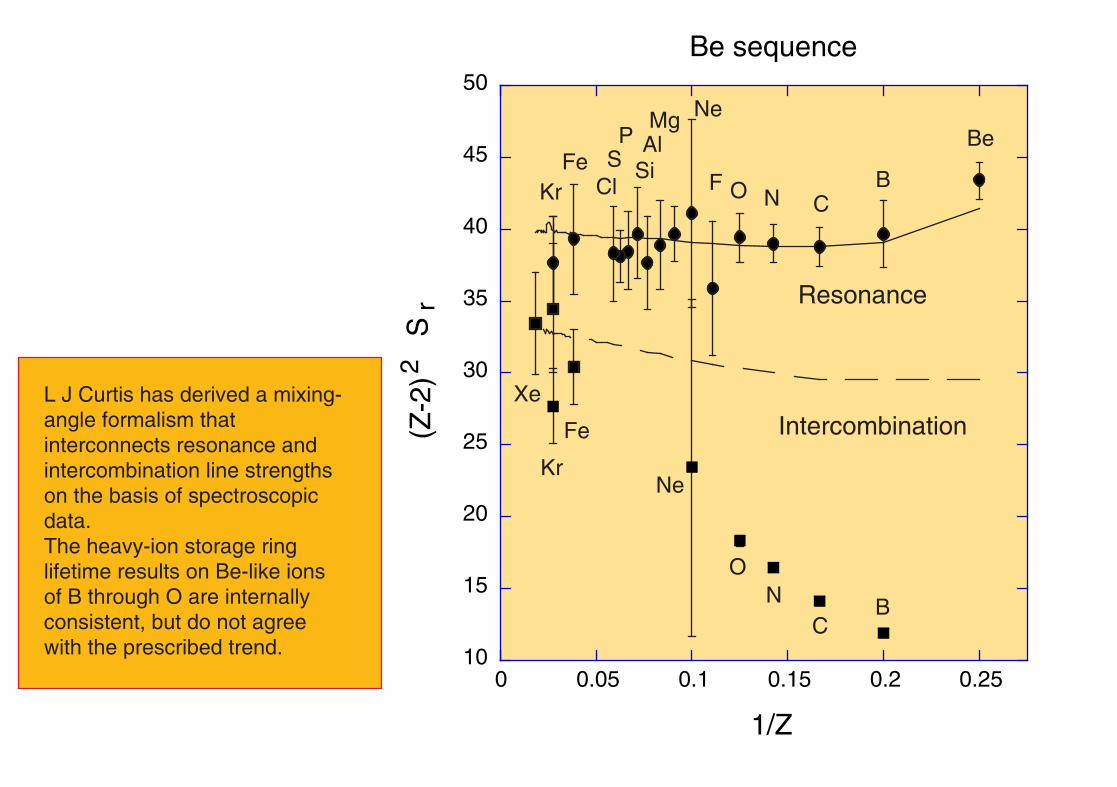
Be sequence
(Z-2
)2 S
r
1/Z
Resonance
IntercombinationXe
Kr
Fe
ON
CB
Ne
Be
F
MgAl
Si
PS
Cl
Ne
O N CBKr
Fe
L J Curtis has derived a mixing-angle formalism that interconnects resonance and intercombination line strengths on the basis of spectroscopic data. The heavy-ion storage ring lifetime results on Be-like ions of B through O are internally consistent, but do not agree with the prescribed trend.

10 5
0 500 1000 1500
Cou
nts
Time (ms)
10
10
10
10
1
2
3
4
Co XIII190 - 290 nm
150 ms
11 ms
1 ms 2.5 ms
2
4 o DS P 22
3p3s 3
1/2
3/2
3/2
3/2
5/2
P - like Fe
oo
124 nm / 135 nm
217 nm / 241 nm
290 nm - 357 nm
11+
(Co )12+
The line intensities in the ground configurations of N- and P-like ions serve as temperature diagnostics in astrophysics.
Measurement of M1 and E2 transition probabilities in the ground configuration of ions that are of astrophysical interest
Very few calculations predict all four level lifetimes in P-like ions close to the experimental findings.
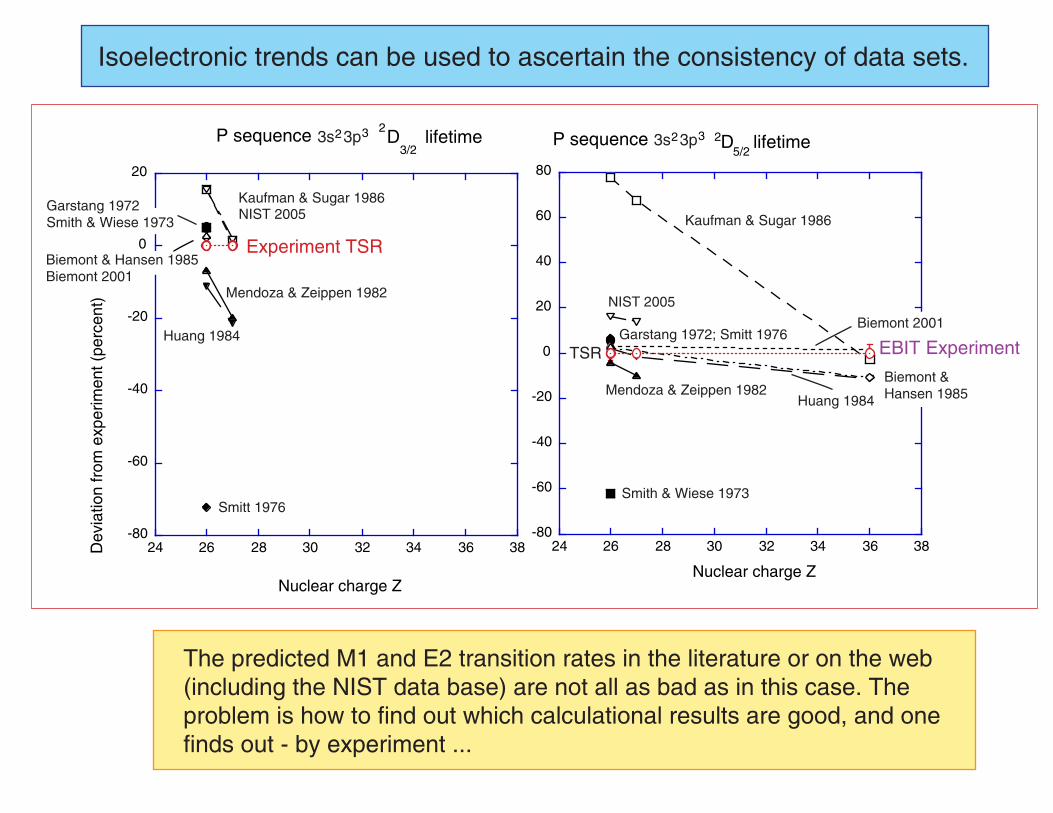
-80
-60
-40
-20
0
20
40
60
80
24 26 28 30 32 34 36 38
P sequence 2D5/2
lifetime
Nuclear charge Z
Kaufman & Sugar 1986
NIST 2005
Garstang 1972; Smitt 1976
Smith & Wiese 1973
Huang 1984Mendoza & Zeippen 1982
TSR
3s 3p2 3
-80
-60
-40
-20
0
20
24 26 28 30 32 34 36 38
P sequence 2D
3/2 lifetime
Dev
iatio
n fr
om e
xper
imen
t (pe
rcen
t)
Nuclear charge Z
3s 3p2 3
Kaufman & Sugar 1986
Smitt 1976
Experiment TSR
Huang 1984
Mendoza & Zeippen 1982
NIST 2005Garstang 1972Smith & Wiese 1973
Biemont & Hansen 1985Biemont 2001
The predicted M1 and E2 transition rates in the literature or on the web (including the NIST data base) are not all as bad as in this case. The problem is how to find out which calculational results are good, and one finds out - by experiment ...
Isoelectronic trends can be used to ascertain the consistency of data sets.
Biemont 2001
EBIT Experiment
Biemont & Hansen 1985
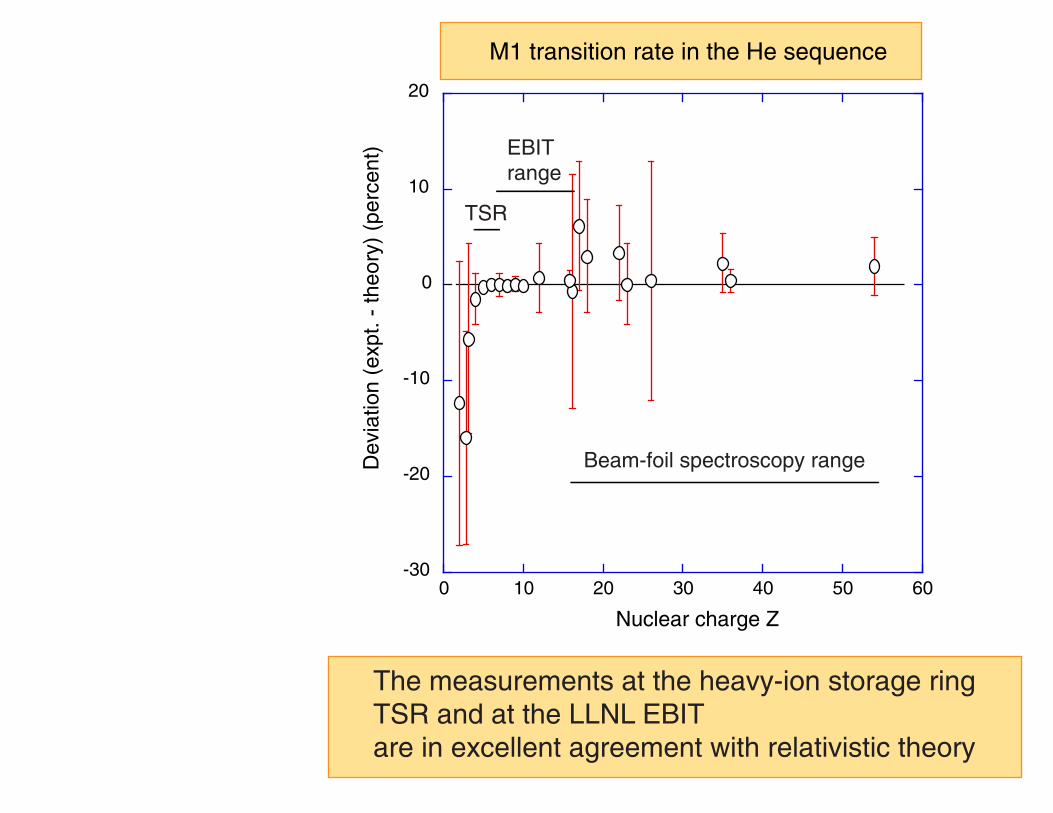
-30
-20
-10
0
10
20
0 10 20 30 40 50 60
M1 transition rate in the He sequence
Dev
iatio
n (e
xpt.
- th
eory
) (p
erce
nt)
Nuclear charge Z
EBIT range
Beam-foil spectroscopy range
TSR
The measurements at the heavy-ion storage ring TSR and at the LLNL EBIT are in excellent agreement with relativistic theory
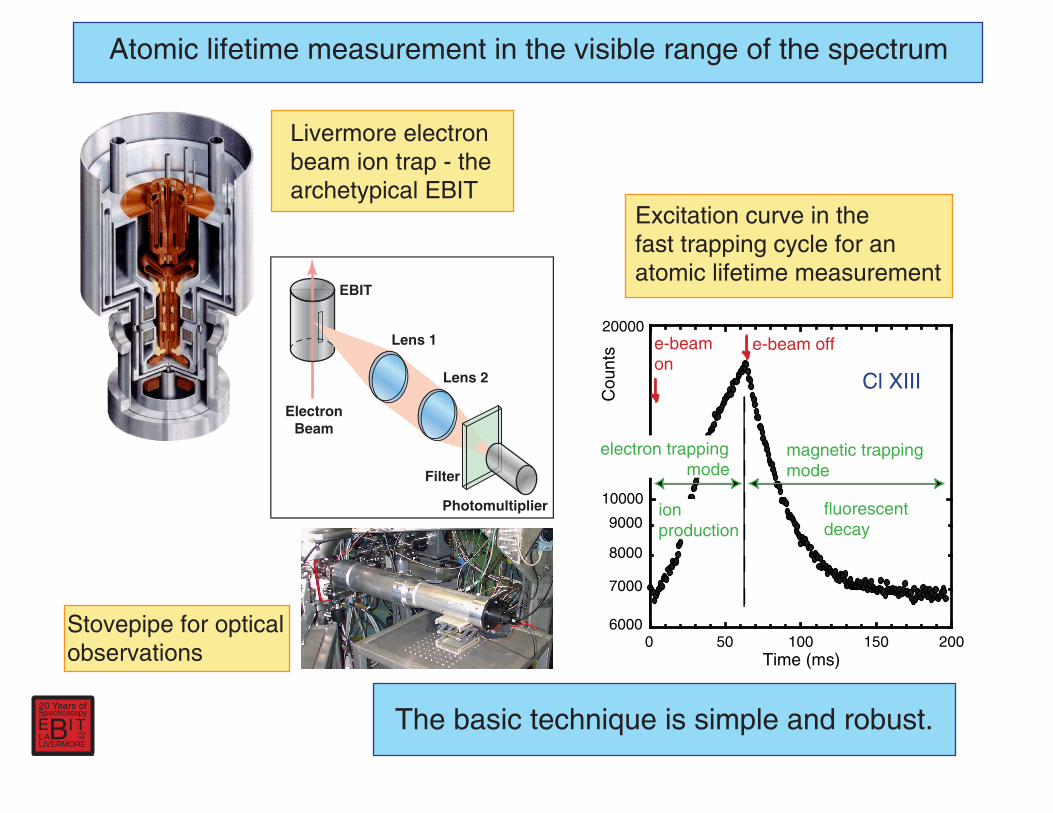
6000
7000
8000
9000
0 50 100 150 200
Cl XIII
Cou
nts
Time (ms)
20000
10000
e-beam on
e-beam off
magnetic trapping mode
fluorescent decay
ion production
electron trapping mode
Livermore electron beam ion trap - the archetypical EBIT
Excitation curve in the fast trapping cycle for an atomic lifetime measurement
Stovepipe for optical observations
Atomic lifetime measurement in the visible range of the spectrum
The basic technique is simple and robust.E TIAL B
20 Years of
LIVERMORE
since 1986
Spectroscopy
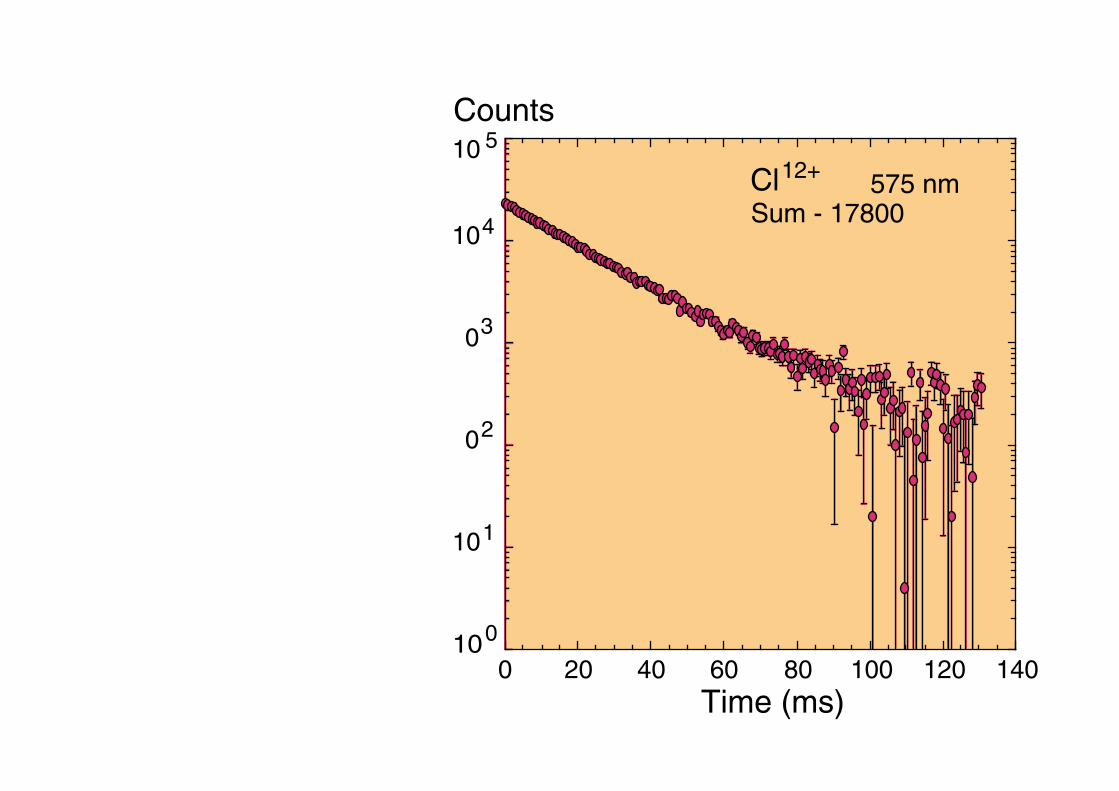
10
10
0
0
104
10 5
0 20 40 60 80 100 120 140
Cl Sum - 17800
Counts
Time (ms)
1
0
2
3
12+ 575 nm
1.25
1.30
1.35
1.40
1.45
1.50
1.55
Line Strength (M1) B-like ions
S
TSR
LLNL EBIT
NIST EBIT
EST
LLNL EBIT
LLNL EBIT
TSRHD EBIT
1.25
1.30
1.35
1.40
1.45
1.50
1.55
17 18 19 20 21 22 23
Line Strength (M1)
S
Nuclear charge Z
F-like ions
LLNL EBIT LLNL EBIT
EST
EST
TSR TSR
16 17 18 19 20 21 22 23
1+ 2ap
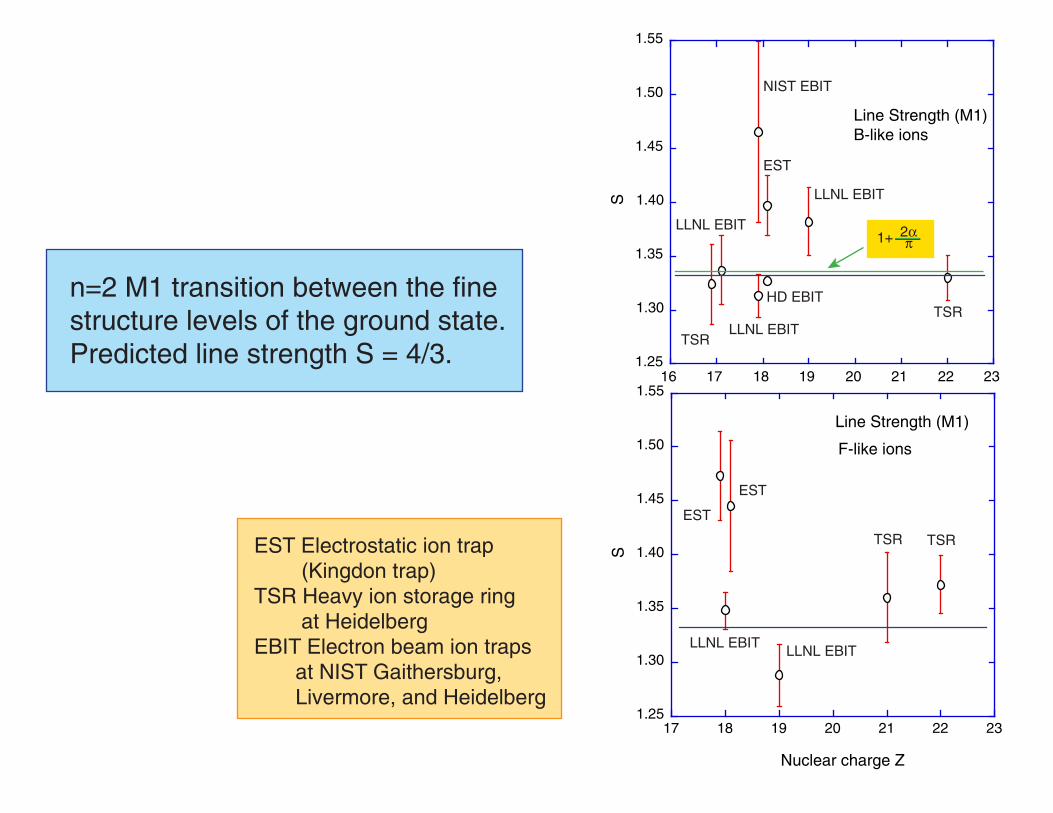
n=2 M1 transition between the fine structure levels of the ground state. Predicted line strength S = 4/3.
EST Electrostatic ion trap (Kingdon trap) TSR Heavy ion storage ring at HeidelbergEBIT Electron beam ion traps at NIST Gaithersburg, Livermore, and Heidelberg
1
10
100
1000
104
105
0 20 40 60 80 100 120
Cou
nts
Time (ms)
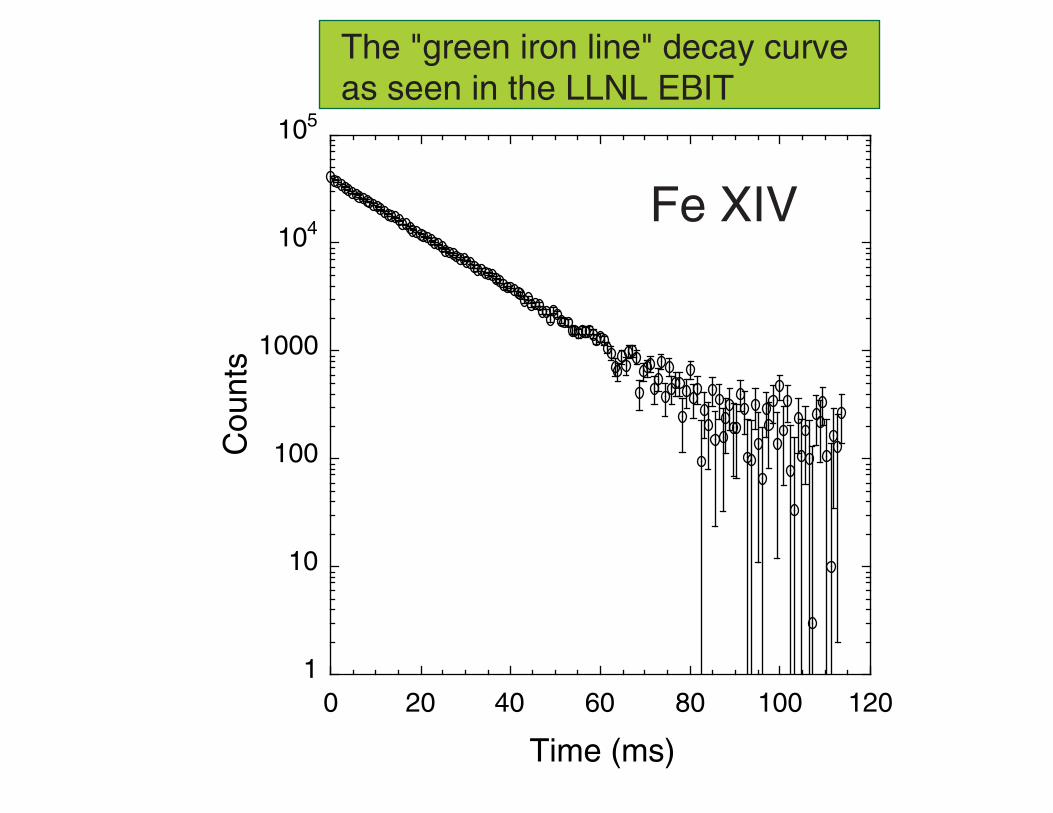
Fe XIV
The "green iron line" decay curve as seen in the LLNL EBIT

46 48 50 52 54 56 58 60 62
Fe XIVKrueger & Czyzak 1966
Warner 1968
Smith & Wiese 1973
Kastner 1976
Kafatos & Lynch 1980
Eidelsberg et al. 1981Froese Fischer � & Liu 1986Huang 1986Kaufman & Sugar 1986Biemont et al. 1988Bhatia & Kastner 1993Moehs & Church 1999
Beiersdorfer et al. 2003
Transition rate (s )-1
ab initio
ab initio
ab initio
ab initio
Vilkas & Ishikawa 2003
Storey et al. 2000
Smith et al. 2005Crespo Lopez-U. et al. 2006
The "green iron line" in the solar corona has found plenty of interest
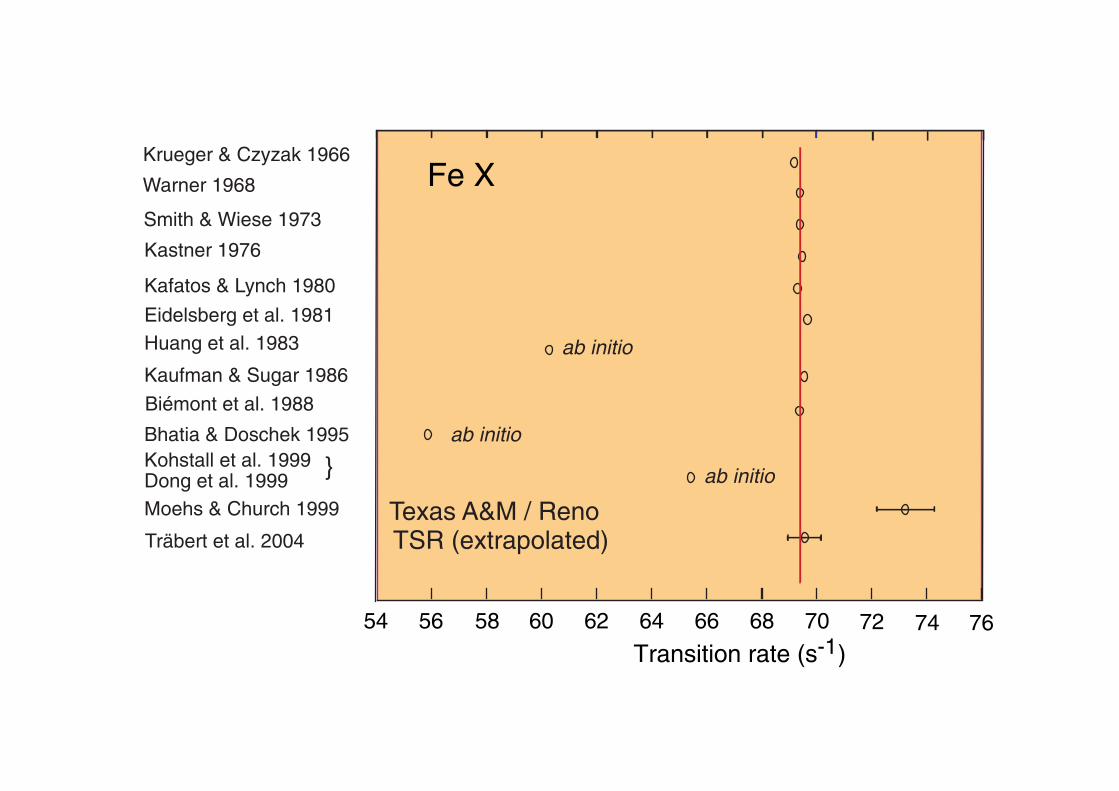
54 56 58 60 62 64 66 68 70
Fe XKrueger & Czyzak 1966
Warner 1968
Smith & Wiese 1973
Kastner 1976
Kafatos & Lynch 1980
Eidelsberg et al. 1981Huang et al. 1983
Kaufman & Sugar 1986
Bhatia & Doschek 1995
Moehs & Church 1999
Träbert et al. 2004
Transition rate (s )-1
Texas A&M / RenoTSR (extrapolated)
ab initio
767472
Kohstall et al. 1999Dong et al. 1999 ab initio
ab initio
Biémont et al. 1988
}
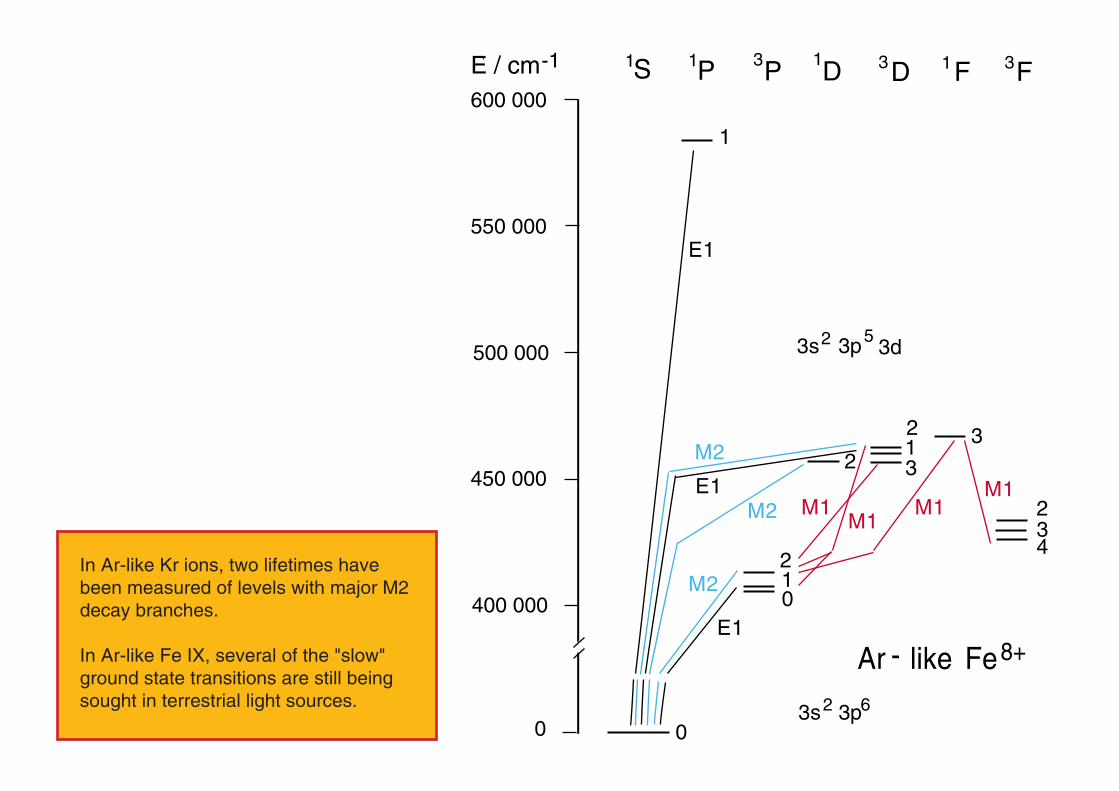
In Ar-like Kr ions, two lifetimes have been measured of levels with major M2 decay branches.
In Ar-like Fe IX, several of the "slow" ground state transitions are still being sought in terrestrial light sources.
1
2
0
3s 3p2 6
0
2M1
53s2 3p 3d
4
3
2
Ar - like Fe 8+
1S 3P D1 3F FP 3 11D
400 000
550 000
500 000
450 000
E / cm-1
0
600 000
1
1 3
32M1
M1M1
M2
E1
E1
E1
M2
M2
T / 10 cm3 -1
700
100
200
300
400
500
600
0
0J 4321 5
3s 3p
3s 3p 3d
3s 3p
2 4
5
2 3
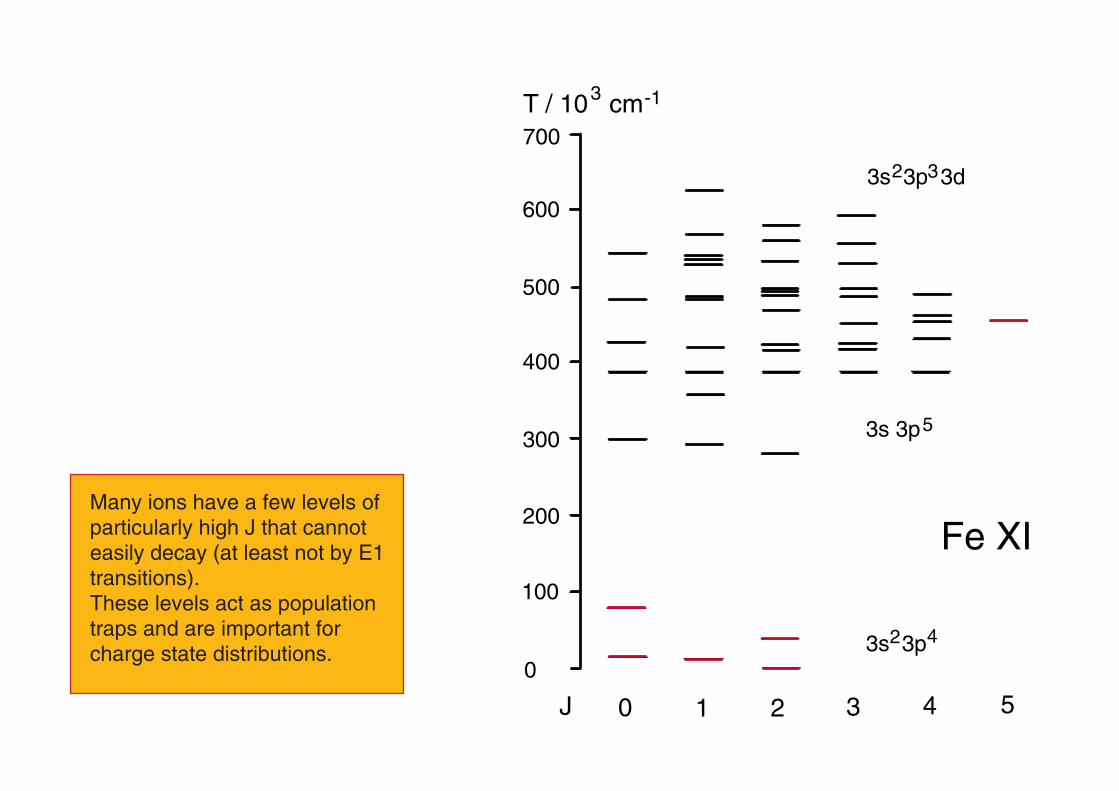
Fe XIMany ions have a few levels of particularly high J that cannot easily decay (at least not by E1 transitions). These levels act as population traps and are important for charge state distributions.
3s 3p2
1S
1
3s
Si - like Fe
3p3
2
0
3P
2
0
D
2
1
E2
M1
E2
3s 2 3p 3d
3F432
M2
12+
M2
o
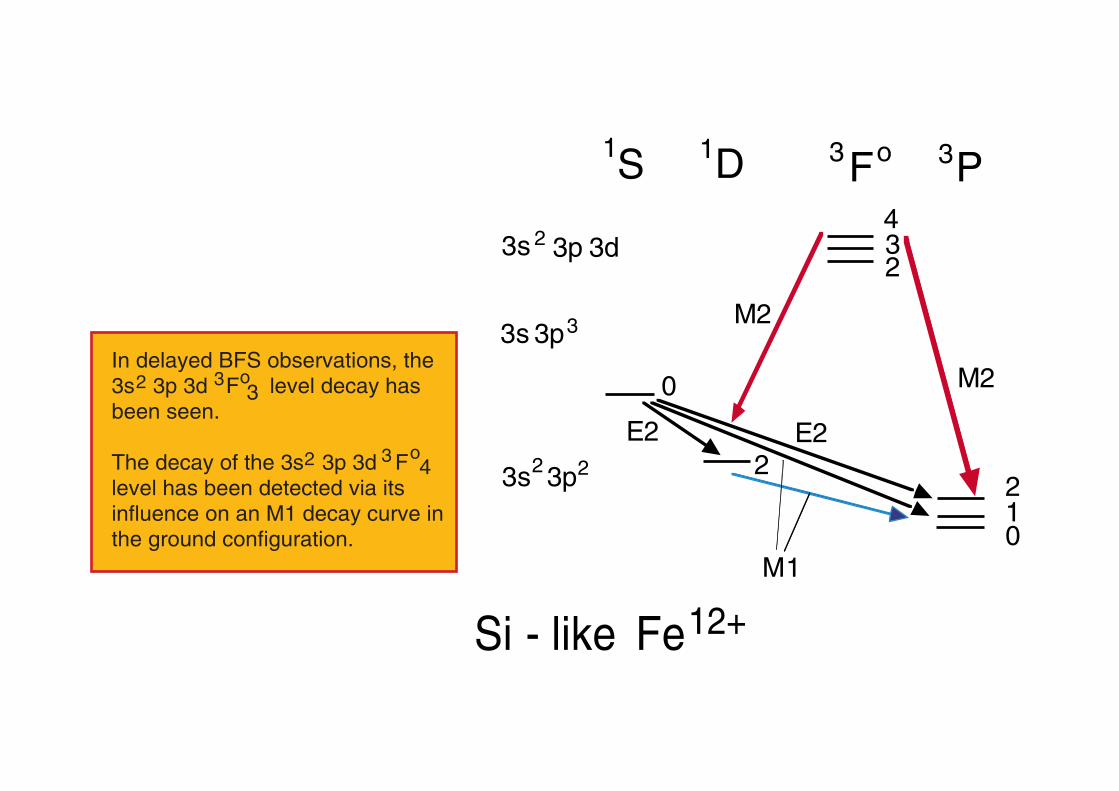
In delayed BFS observations, the 3s 3p 3d F level decay has been seen.
The decay of the 3s 3p 3d F level has been detected via its influence on an M1 decay curve in the ground configuration.
o3
4
2
2
3
3 o

-20 -15 -10 -5 0 5 10 15 20
Fe ion lifetimes
Deviation from best data (percent)
Fe XI
Fe XII
Fe XIV
Fe XIII
TSR
TSR
TSR
TSR
TSR
TSR
TSR
EKT
EKT
EKT
EKT
EKT
EKT
EBIT - I
EBIT - I
12D
12D
D
D
P
P
P
2
2
2
2
2 o
o
o
o
o5/2
3/2
1/2
3/2
3/2Fe XII
Fe XII
Fe XII
HD-EBIT oo
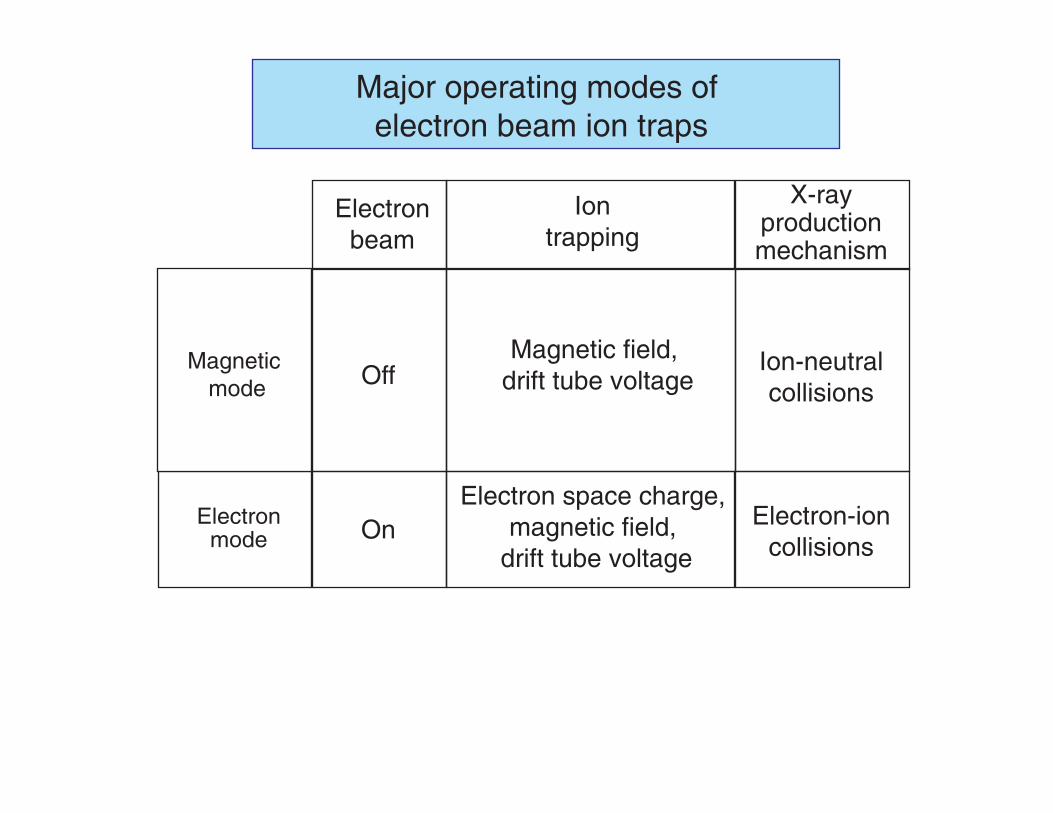
Electronmode
Magnetic mode Off
On
Magnetic field, drift tube voltage
Electron space charge, magnetic field,
drift tube voltage
Ion-neutralcollisions
Electron-ioncollisions
Iontrapping
X-rayproductionmechanism
Electronbeam
Major operating modes of electron beam ion traps
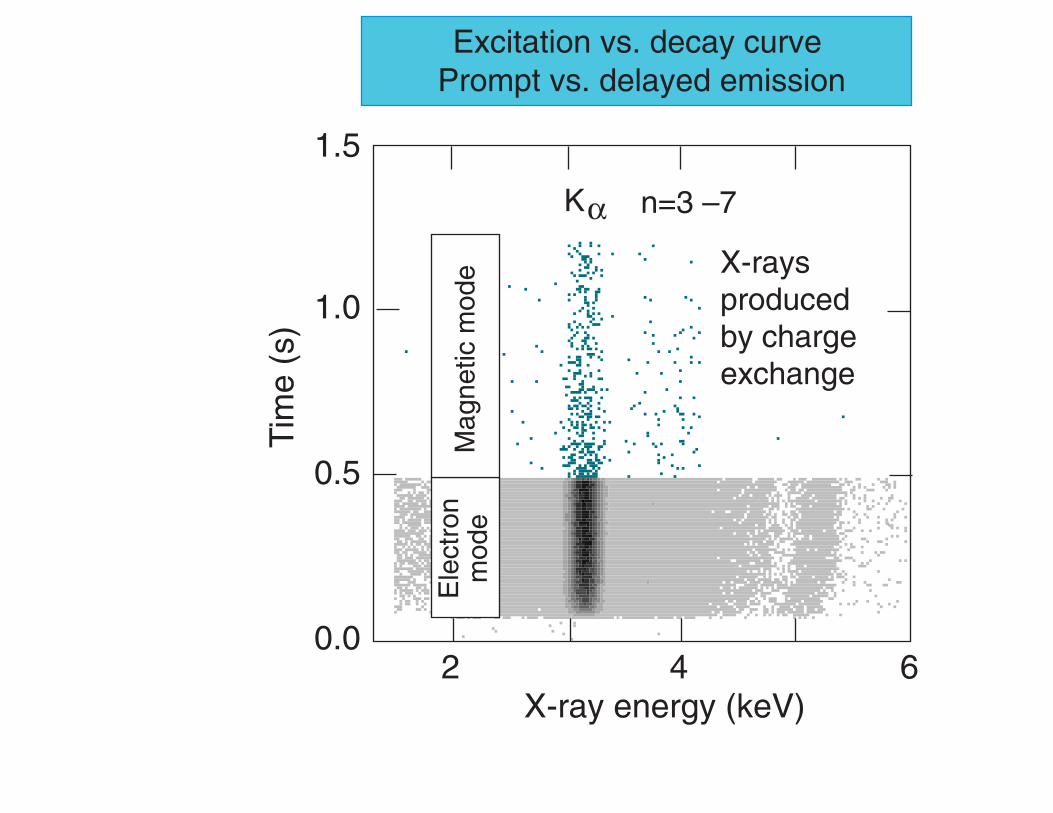
n=3 –7
X-raysproducedby chargeexchange
2 4 6X-ray energy (keV)
Tim
e (s
)
0.0
0.5
1.0
1.5
Ele
ctro
nm
ode
Mag
netic
mod
e
Ka
Excitation vs. decay curve Prompt vs. delayed emission
Charge state q0 18161412108642
E (eV)ion
0
600
500
300
100
400
200
1000
900
800
700
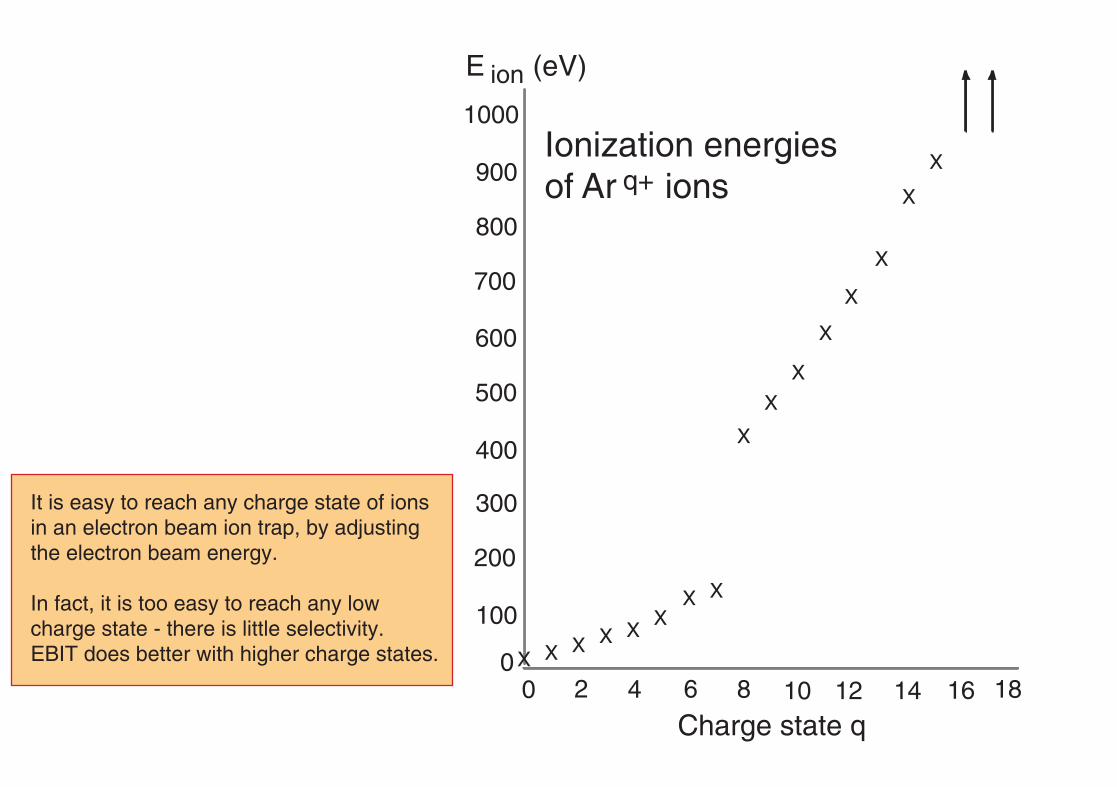
Ionization energies of Ar ions
X
X
X
X
X
X
X
X
X
XXX
XXXX
q+
It is easy to reach any charge state of ions in an electron beam ion trap, by adjusting the electron beam energy.
In fact, it is too easy to reach any low charge state - there is little selectivity. EBIT does better with higher charge states.
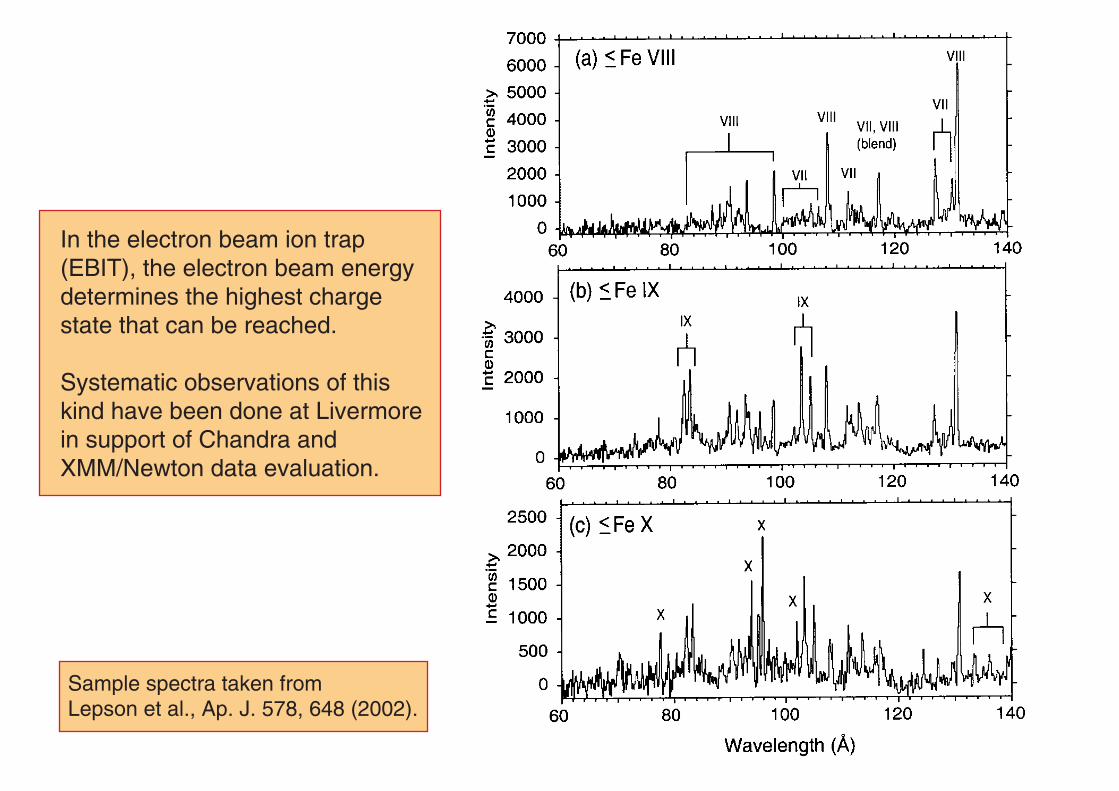
In the electron beam ion trap (EBIT), the electron beam energy determines the highest charge state that can be reached.
Systematic observations of this kind have been done at Livermore in support of Chandra and XMM/Newton data evaluation.
Sample spectra taken from Lepson et al., Ap. J. 578, 648 (2002).
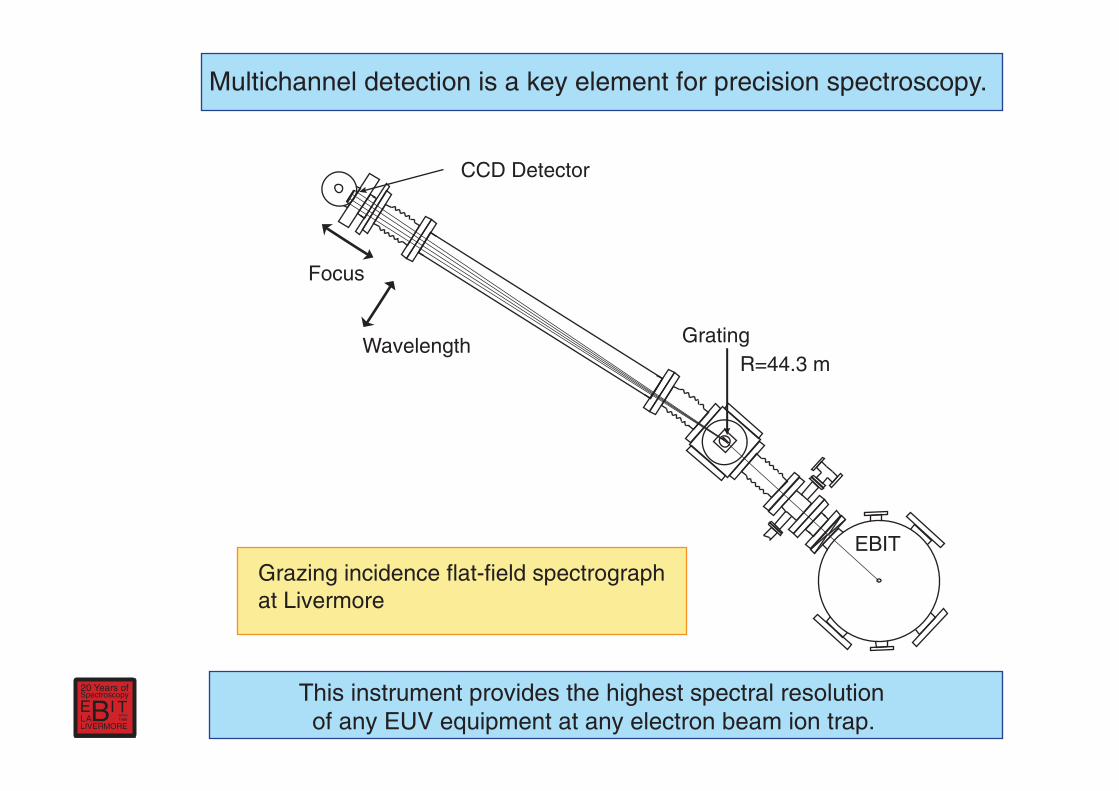
Grating
CCD Detector
EBIT
Focus
WavelengthR=44.3 m
Grazing incidence flat-field spectrograph at Livermore
Multichannel detection is a key element for precision spectroscopy.
This instrument provides the highest spectral resolution of any EUV equipment at any electron beam ion trap.
E TIAL B
20 Years of
LIVERMORE
since 1986
Spectroscopy
0
5
10
15
Oxygen
O VII1-2
O VIII1-2
O VIII1-3
O VII
1-3
1-71-6
1-51-4
016 17 18 19 20 21 22 23
Xenon
Sig
nal (
arb.
uni
ts)
2
4
8
10
12
Wavelength (A)o
20.5 21 21.5 22S
igna
l (ar
b. u
nit)
250
200
150
100
50
0
O VIIE2
M3
E2(M1)
Wavelength (A)o
Xe XXVII
a
b
c
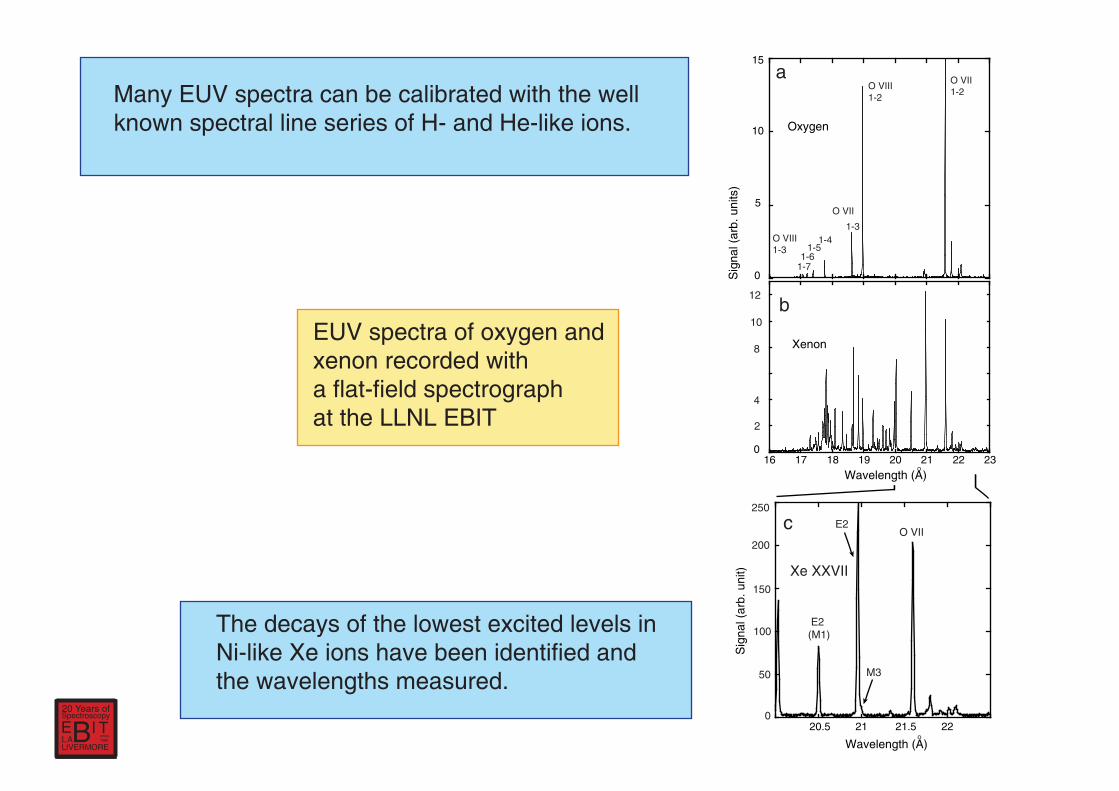
EUV spectra of oxygen and xenon recorded with a flat-field spectrograph at the LLNL EBIT
Many EUV spectra can be calibrated with the well known spectral line series of H- and He-like ions.
The decays of the lowest excited levels in �Ni-like Xe ions have been identified and �the wavelengths measured.
E TIAL B
20 Years of
LIVERMORE
since 1986
Spectroscopy
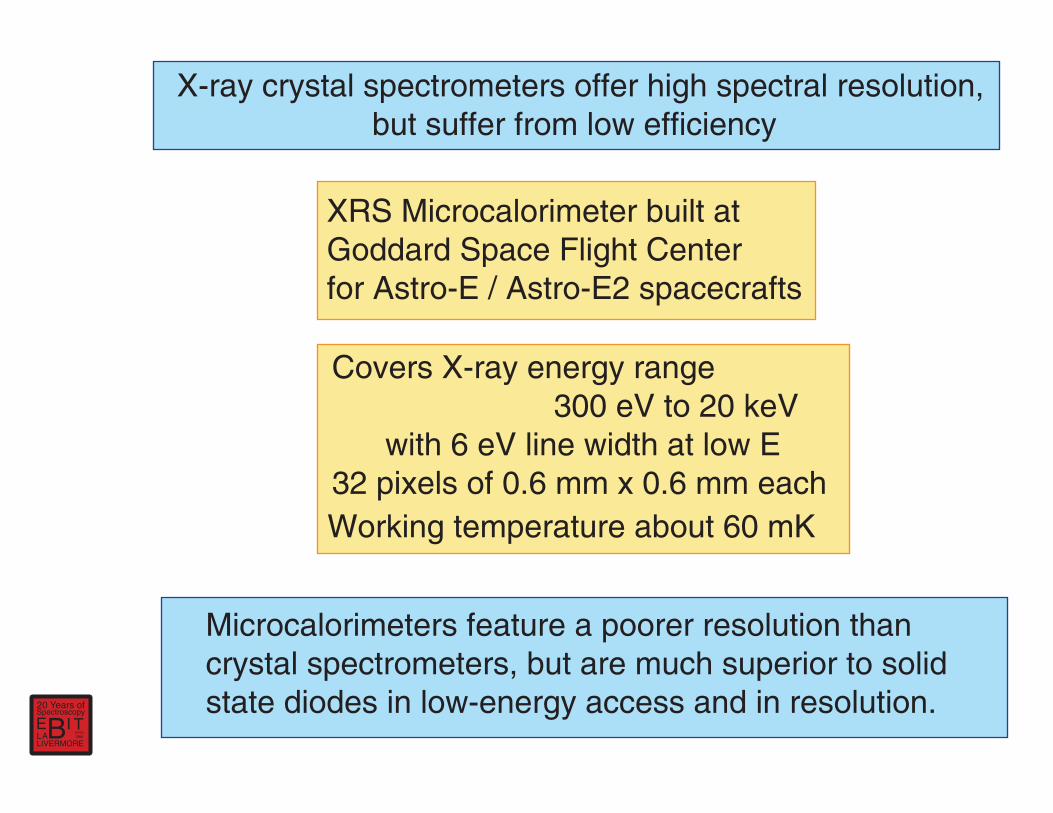
XRS Microcalorimeter built at Goddard Space Flight Center for Astro-E / Astro-E2 spacecrafts
Covers X-ray energy range 300 eV to 20 keV with 6 eV line width at low E32 pixels of 0.6 mm x 0.6 mm eachWorking temperature about 60 mK
X-ray crystal spectrometers offer high spectral resolution, but suffer from low efficiency
Microcalorimeters feature a poorer resolution than crystal spectrometers, but are much superior to solid state diodes in low-energy access and in resolution.
E TIAL B
20 Years of
LIVERMORE
since 1986
Spectroscopy
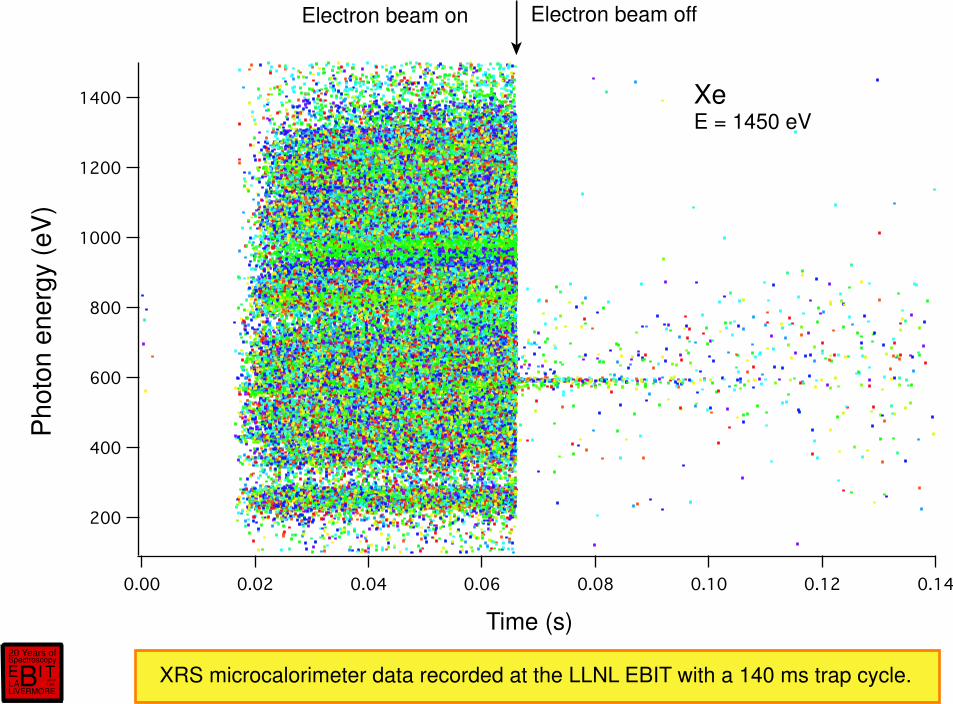
Xe E = 1450 eV
Pho
ton
ener
gy (
eV)
Time (s)
Electron beam on Electron beam off
XRS microcalorimeter data recorded at the LLNL EBIT with a 140 ms trap cycle. E TIAL B
20 Years of
LIVERMORE
since 1986
Spectroscopy
35
30
25
20
15
10
5
0
C
ount
s (1
000)
a
3d - 4s3d - 4p
3d - 4f
Xe XXVII
Xe XXVIII
300
250
200
150
100
50
01400120010008006004002000
Cou
nts
Energy (eV)
b
O VII O VIII
Xe XXVII
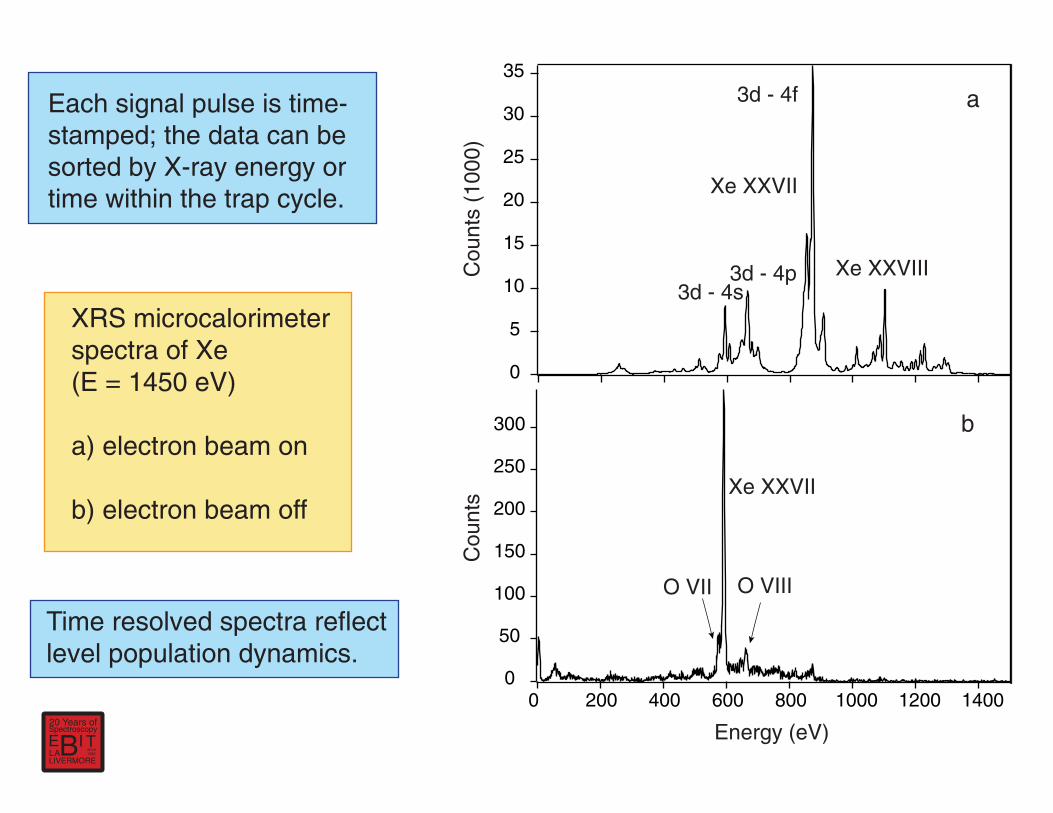
XRS microcalorimeter spectra of Xe (E = 1450 eV)
a) electron beam on
b) electron beam off
Each signal pulse is time-stamped; the data can be sorted by X-ray energy or time within the trap cycle.
Time resolved spectra reflect level population dynamics.
E TIAL B
20 Years of
LIVERMORE
since 1986
Spectroscopy
3d
3d9
10
4s
0
12
23
M1
M1
E2
E2
M3
311S DD
2.06E82.49E8
13689.2
2.26E82.72E8
53.771.3
1.86E41.88E4
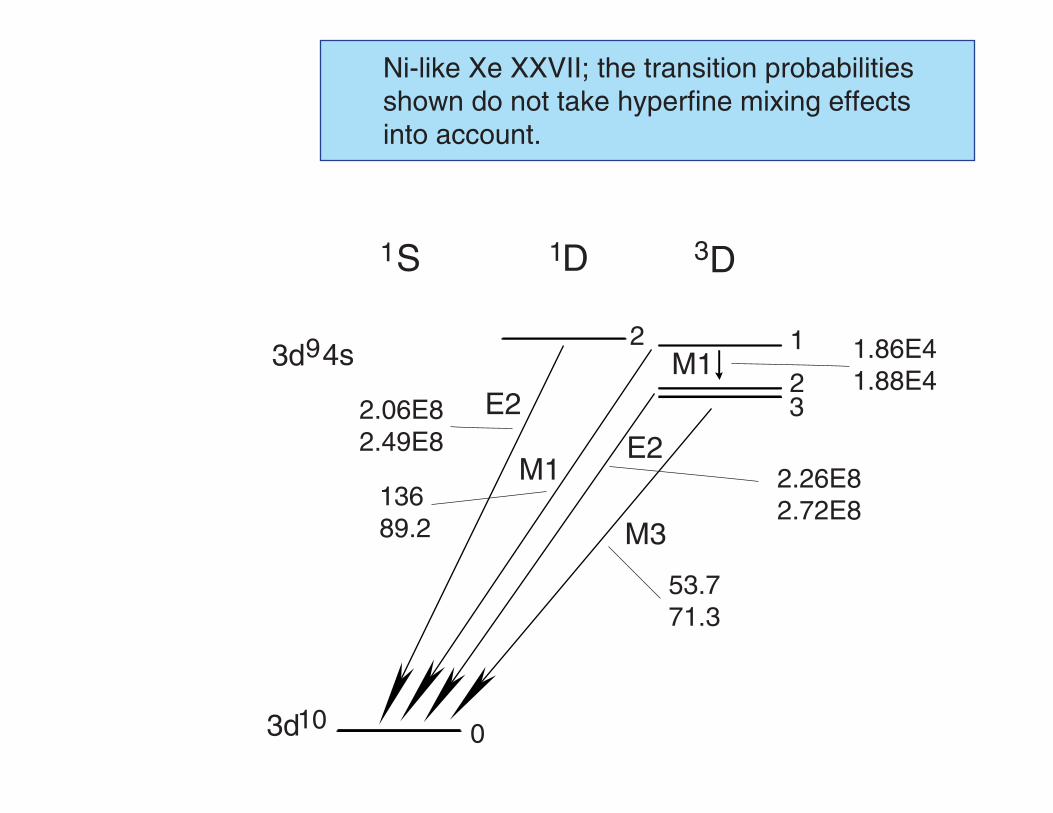
Ni-like Xe XXVII; the transition probabilities shown do not take hyperfine mixing effects into account.
1
10
100
1000
10 000
0 20 40 60 80 100 120
b
Cou
nts
(log)
Time (ms)
1
10
100
1000
10 000
a
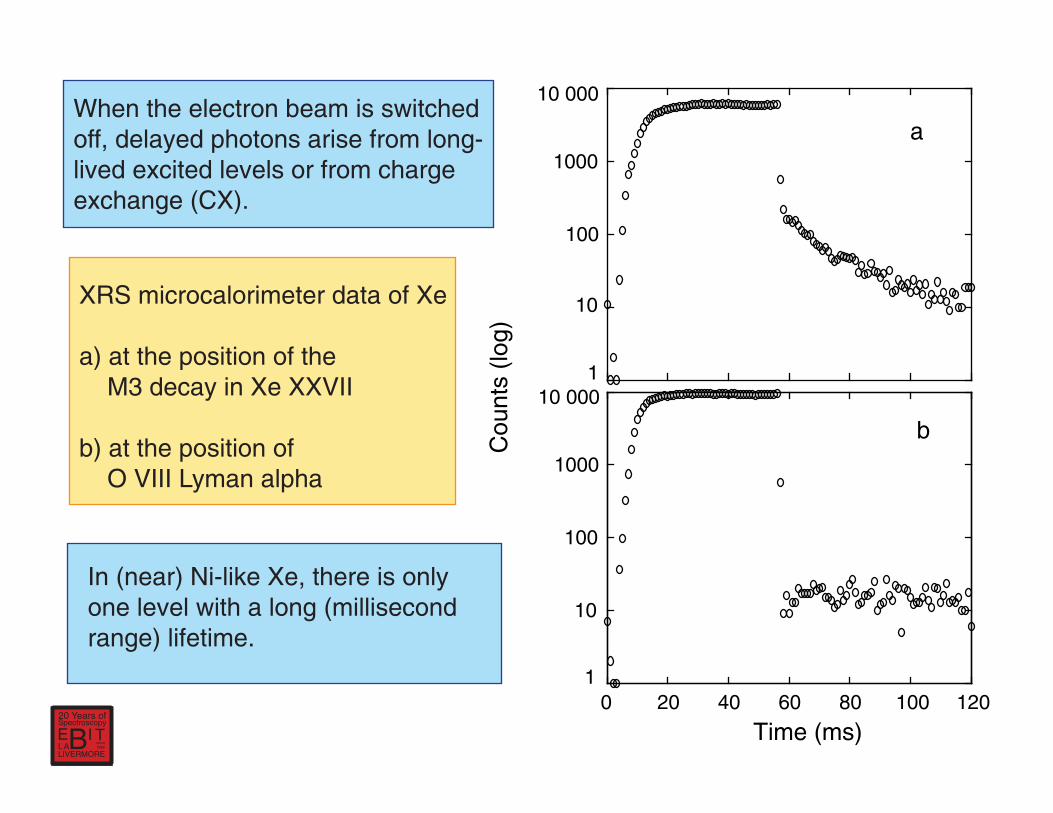
XRS microcalorimeter data of Xe
a) at the position of the M3 decay in Xe XXVII
b) at the position of O VIII Lyman alpha
When the electron beam is switched off, delayed photons arise from long-lived excited levels or from charge exchange (CX).
In (near) Ni-like Xe, there is only one level with a long (millisecond range) lifetime.
E TIAL B
20 Years of
LIVERMORE
since 1986
Spectroscopy
1
10
100
0 10 20 30 40 50 60 70 80
Xe
Counts (log)
Time (ms)
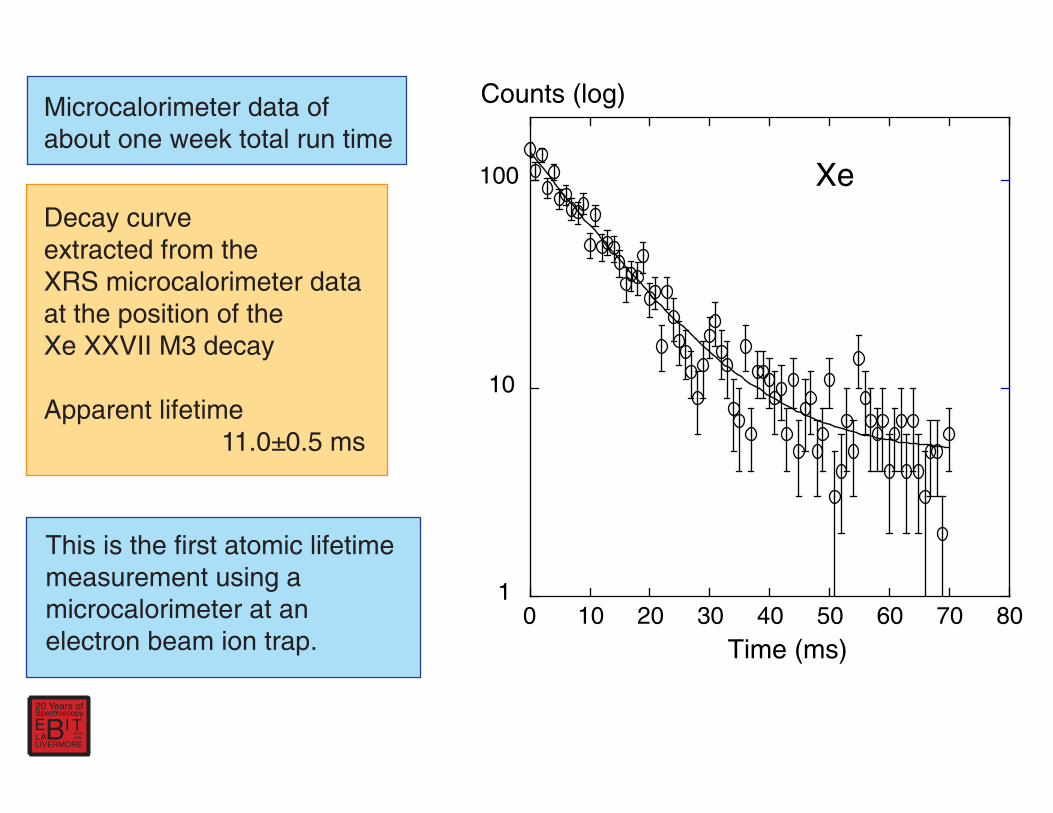
Decay curve extracted from the XRS microcalorimeter data at the position of the Xe XXVII M3 decay
Apparent lifetime 11.0±0.5 ms
Microcalorimeter data of about one week total run time
This is the first atomic lifetime measurement using a microcalorimeter at an electron beam ion trap.
E TIAL B
20 Years of
LIVERMORE
since 1986
Spectroscopy

0
5
10
15
20
25
30
35
40
52 53 54 55 56 57 58
Life
time
(ms)
Nuclear charge Z
Safronova 2005
Xe
BaCs
Results of LLNL EBIT lifetime measurements on M3 decays in Ni-like ions in comparison to theory (all neglecting any mixing due to hyperfine structure)
Very few calculations cover the magnetic octupole (M3) decays.
A shorter lifetime than predicted makes the ion less sensitive to density effects.
X
XX
Other calculations
E TIAL B
20 Years of
LIVERMORE
since 1986
Spectroscopy
3d
3d9
10
4s
0
12
23
M1
M1
E2
E2
M3
311S DD
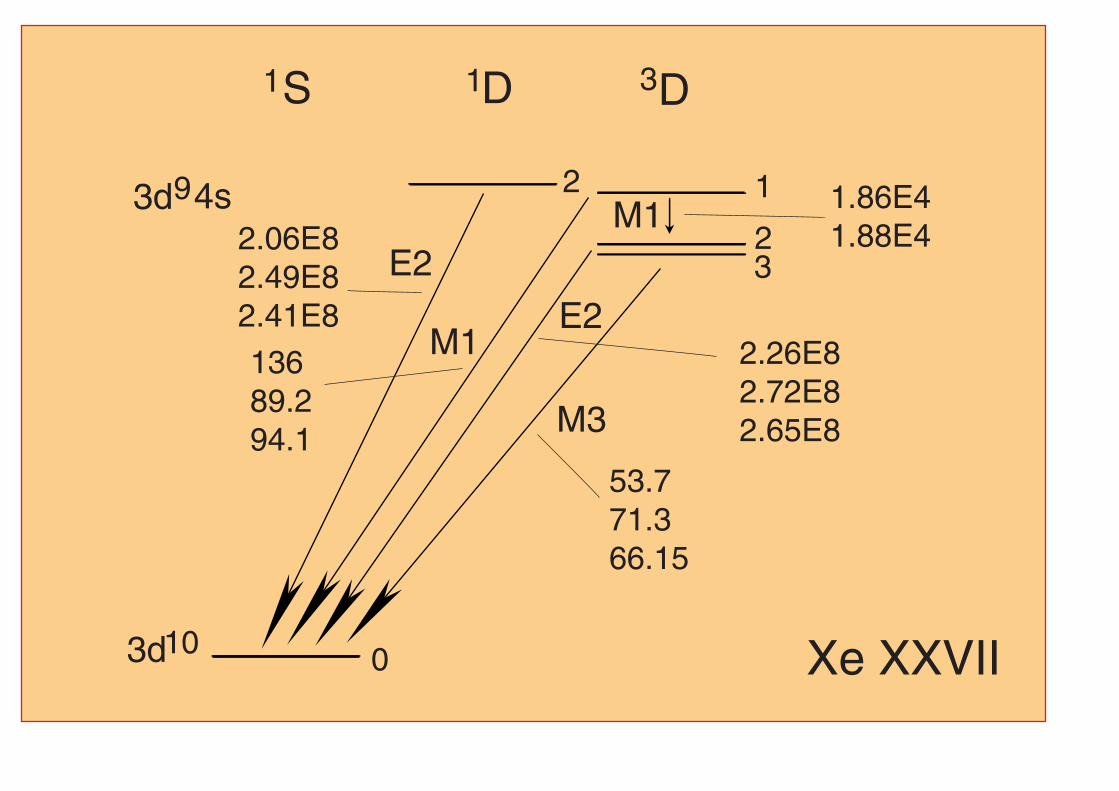
2.06E82.49E82.41E8
13689.294.1
2.26E82.72E82.65E8
53.771.366.15
1.86E41.88E4
Xe XXVII
100
1000
0 50 100 150 200
Xe XXVIIC
ount
s (lo
g)
Time (ms)
natural Xe
isotopically pure Xe132
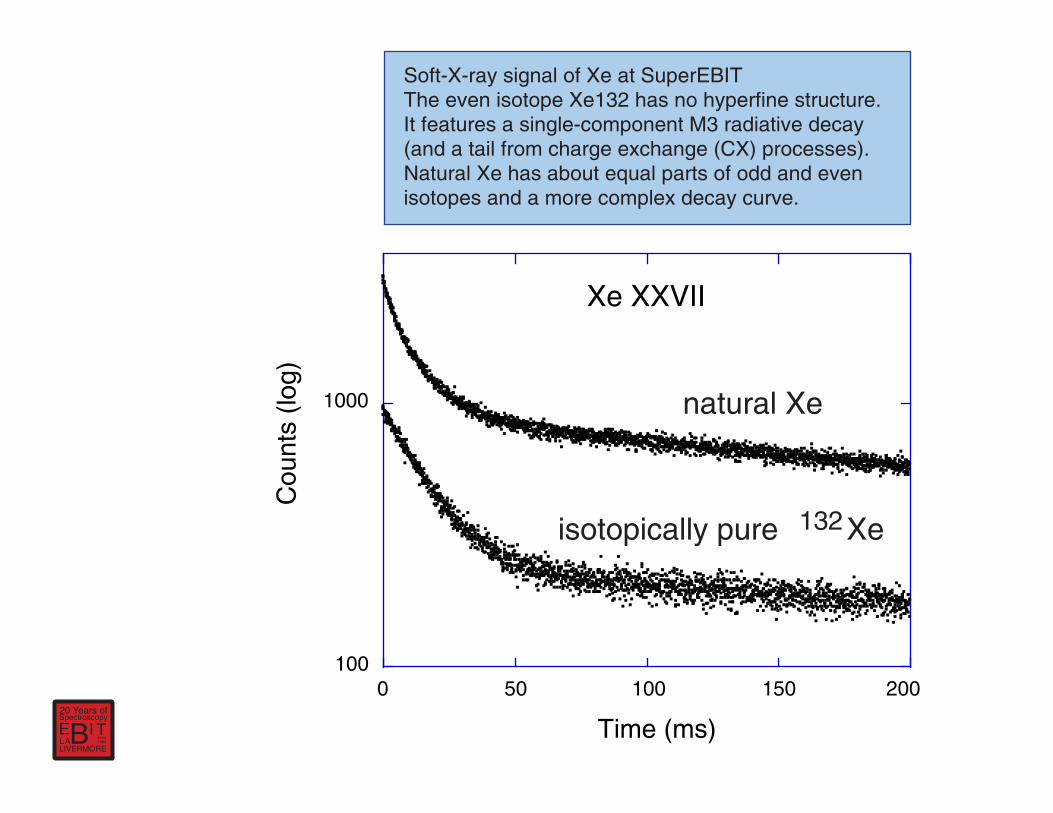
Soft-X-ray signal of Xe at SuperEBITThe even isotope Xe132 has no hyperfine structure. It features a single-component M3 radiative decay (and a tail from charge exchange (CX) processes). Natural Xe has about equal parts of odd and even isotopes and a more complex decay curve.
E TIAL B
20 Years of
LIVERMORE
since 1986
Spectroscopy
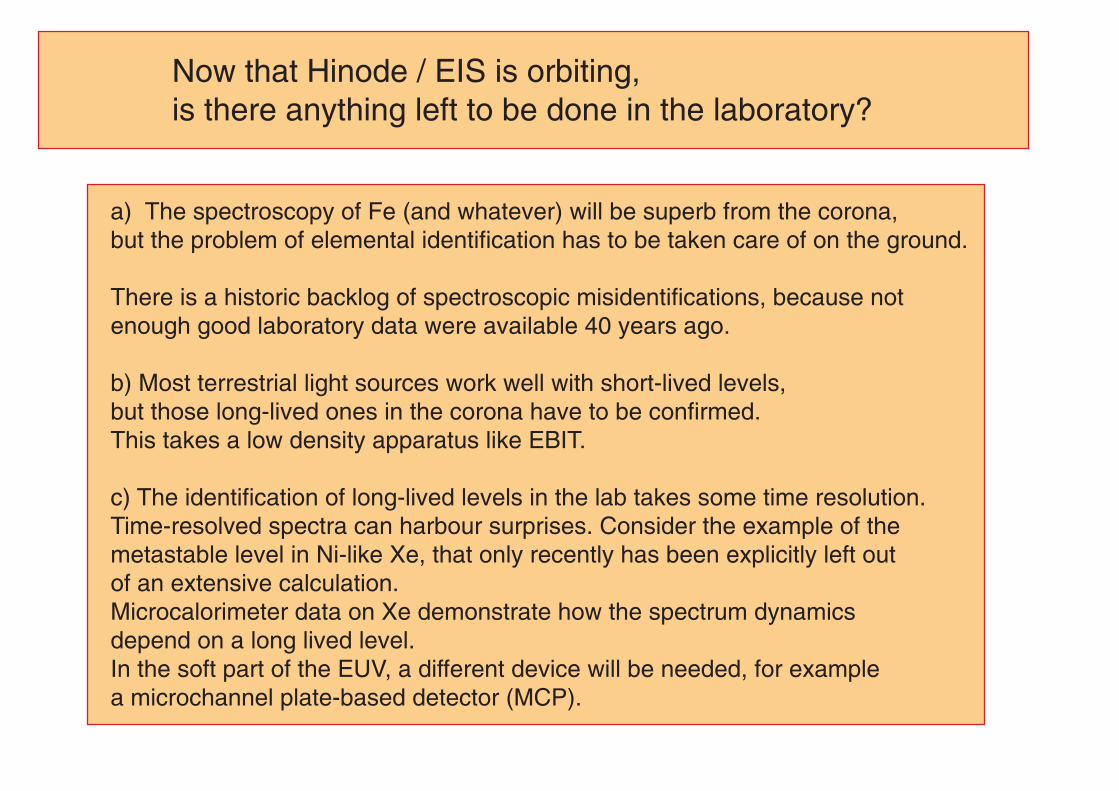
a) The spectroscopy of Fe (and whatever) will be superb from the corona, but the problem of elemental identification has to be taken care of on the ground.
There is a historic backlog of spectroscopic misidentifications, because not enough good laboratory data were available 40 years ago.
b) Most terrestrial light sources work well with short-lived levels, but those long-lived ones in the corona have to be confirmed. This takes a low density apparatus like EBIT.
c) The identification of long-lived levels in the lab takes some time resolution. Time-resolved spectra can harbour surprises. Consider the example of the metastable level in Ni-like Xe, that only recently has been explicitly left out of an extensive calculation. Microcalorimeter data on Xe demonstrate how the spectrum dynamics depend on a long lived level. In the soft part of the EUV, a different device will be needed, for example a microchannel plate-based detector (MCP).
Now that Hinode / EIS is orbiting, is there anything left to be done in the laboratory?
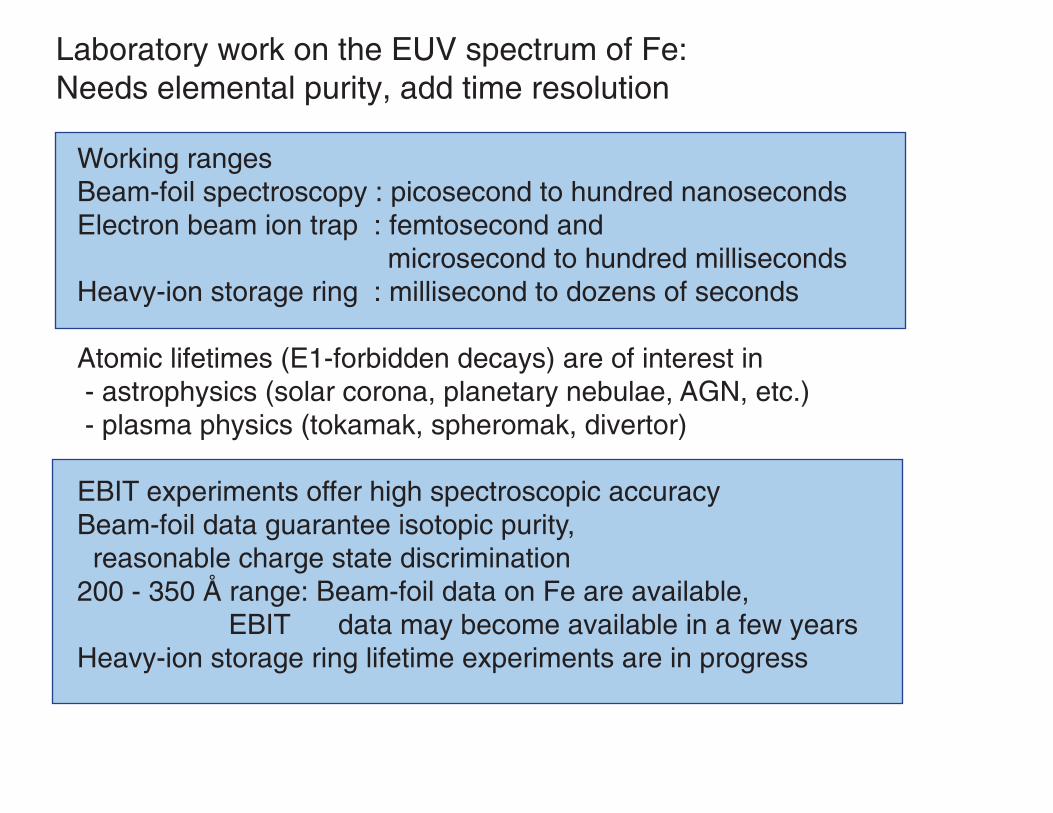
Working rangesBeam-foil spectroscopy : picosecond to hundred nanosecondsElectron beam ion trap : femtosecond and microsecond to hundred milliseconds Heavy-ion storage ring : millisecond to dozens of seconds
Atomic lifetimes (E1-forbidden decays) are of interest in - astrophysics (solar corona, planetary nebulae, AGN, etc.) - plasma physics (tokamak, spheromak, divertor)
EBIT experiments offer high spectroscopic accuracyBeam-foil data guarantee isotopic purity, reasonable charge state discrimination200 - 350 Å range: Beam-foil data on Fe are available, EBIT data may become available in a few years Heavy-ion storage ring lifetime experiments are in progress
Laboratory work on the EUV spectrum of Fe: Needs elemental purity, add time resolution