emav: otoacoustic emission averager - audres.orgaudres.org/downloads/plttm.pdf · the plt program...
TRANSCRIPT
BOYS TOWN NATIONAL RESEARCH HOSPITAL
PLT User’s Guide
Stephen T. Neely
ABSTRACT
PLT produces publication-quality plots from text files containing (1) the
data to be plotted, (2) parameters that describe how to plot the data, and
(3) keywords indicating what actions the program should perform. PLT
parameters and keywords are described in this User’s Guide along with
several PLT file examples. The program is written in C and runs under
Windows and Linux. Plots may be output directly to a printer or exported
to several different vector-graphics file formats (e.g., CGM, EPS, EMF, &
SVG).
Technical Memorandum 1 January 1989 Revision date: November 2010
555 North 30th Street, Omaha, NE 68131
(402) 498-6700

Table of Contents 1. Introduction ..................................................................................................................... 4 2. Tutorial ............................................................................................................................. 5 3. Functional Description................................................................................................... 6
3.1. Comments ............................................................................................................. 6 3.2. Parameters ............................................................................................................ 6
3.2.1 Axis Specifications ......................................................................... 7 3.2.2. Data Input Control ......................................................................... 11 3.2.3. Data Output Control ...................................................................... 11 3.2.4. Annotation Control ........................................................................ 15 3.2.5. Message Control ........................................................................... 16 3.2.6. Color Parameters .......................................................................... 17 3.2.7. Miscellaneous Parameters .......................................................... 18 3.2.8. List of Numeric Parameters ......................................................... 21 3.2.9. List of String Parameters ............................................................. 25
3.3. Messages .............................................................................................................. 25 3.4. Keywords ............................................................................................................... 27 3.5. Data Values .......................................................................................................... 28 3.6. Auxiliary Files ........................................................................................................ 29 3.7. Macros and Functions ......................................................................................... 30
3.7.1 Macros ............................................................................................. 30 3.7.2 Functions ......................................................................................... 30
4. Arithmetic Expressions ................................................................................................. 32 4.1. Mathematical Operators ...................................................................................... 32 4.2. Internal variables .................................................................................................. 32
5. Error Messages .............................................................................................................. 33 5.1. Fatal Errors ........................................................................................................... 33 5.2. Warnings ............................................................................................................... 33
6. Examples......................................................................................................................... 36 Example I ...................................................................................................................... 36 Example II ..................................................................................................................... 38 Example III .................................................................................................................... 42 Example IV .................................................................................................................... 44
Acknowledgments .............................................................................................................. 46 Appendix A. Graphical Output Formats .......................................................................... 47 Appendix B. External Font Files ....................................................................................... 48 Index ..................................................................................................................................... 49
Page 2
List of Figures
Fig. 1 Sample plot
Fig. 2 Symbol and Line Type codes
Fig. 3 Area Fill Pattern codes
Fig. 4 Message alignment
Fig. 5 Line Weight codes
Fig. 6 Standard and Alternate Fonts
Fig. 7 Example I
Fig. 8 Example II
Fig. 9 Example III
Fig. 10 Example IV
Page 3

PLT User's Guide
1. Introduction The PLT program processes text files containing PLT commands and produces plots in various output formats. Plots are displayed on the computer monitor in preview quality and may be printed or exported to a graphics file in publication quality. The PLT files (frequently referred to as pltfiles in this document) may be generated automatically, as the output of a data analysis program (such as the BTNRH-GREG program). PLT files may also be created from scratch by using any text editor.
The PLT program was developed in the research laboratories at BTNRH. The earliest versions of the program, written around 1980, ran on DEC PDP-ll/34 laboratory computers with pen plotters and PCs with Tektronix console graphics emulation. The current version of PLT provides a graphical interface that supports Windows XP or the X window system under Linux. Plots may be printed to any printer either directly attached or accessible over the local network. PLT can export plots in several different graphics file formats: CGM (computer graphics metafile), EMF (enhanced metafile format), EPS (encapsulated PostScript), PS (PostScript), and SVG (scalable vector graphics).
This document describes the pltfile language, provides examples of its use, and explains error messages that might be encountered.
Page 4

2. Tutorial The input to PLT is a text file (pltfile) that contains plotting parameters, keywords, data, and comments. Pltfiles may be generated automatically by another computer program (such as GREG) or may be created manually by entering the text into a file using a text editor.
The pltfile generally begins by specifying values for several PLT parameters followed by one or more sets of data to be plotted. PLT parameters are described in detail in the next section. Every parameter has a reasonable default value, so parameters need only be specified when their desired value differs from the default value. Here is an example of a typical pltfile.
header=no ; don't put header on plot xllc=2 ; frame 2 inches from left of page yllc=2 ; frame 2 inches from bottom of page xlen=5 ; frame 5 inches wide ylen=4 ; frame 4 inches tall xmin=0 xmax=60 xint=3.2 ; x axis has 3 major & 2 minor intervals ycycle=2 ; y axis is logarithmic ymin=10 ymax=1000 xlabel=Intensity (dB SPL) ylabel=Estimated Loudness tlabel=Average of 4 subjects pltype=symbols symbol=1 ; symbol 1 is an open circle data 10,150,1.5 20,300,1.25 50,120,0 plot symbol=10 ; symbol 10 is a filled square data 10,50,1.2 20,80,1.3 50,45,0.0 plot msgdat=yes ; position message in data coordinates mxllc=5 ; lower-left at x=5 myllc=20 ; lower-left at y=20 "Experimental Conditions: |1| F[1] = 1000 |10| F[2] = 2000"
The plot that results from this pltfile is shown in Fig. 1. This example contains a three-line message following the data in the pltfile. Messages may be placed at any point in the pltfile and are plotted as they are encountered. The first line of the message says "Experimental Conditions:", the second line indicates that F1 equals 1000 and is plotted with the open circle, and the third line indicates that F2 equals 2000 and is plotted with a filled square. Note that (1) the message continues on to the second and third lines since a terminating quotation mark has not been provided yet, (2) brackets bound subscripts, and (3) neither the bracket nor the vertical bars are plotted. Others examples of pltfiles are provided at the end of this document.
Page 5
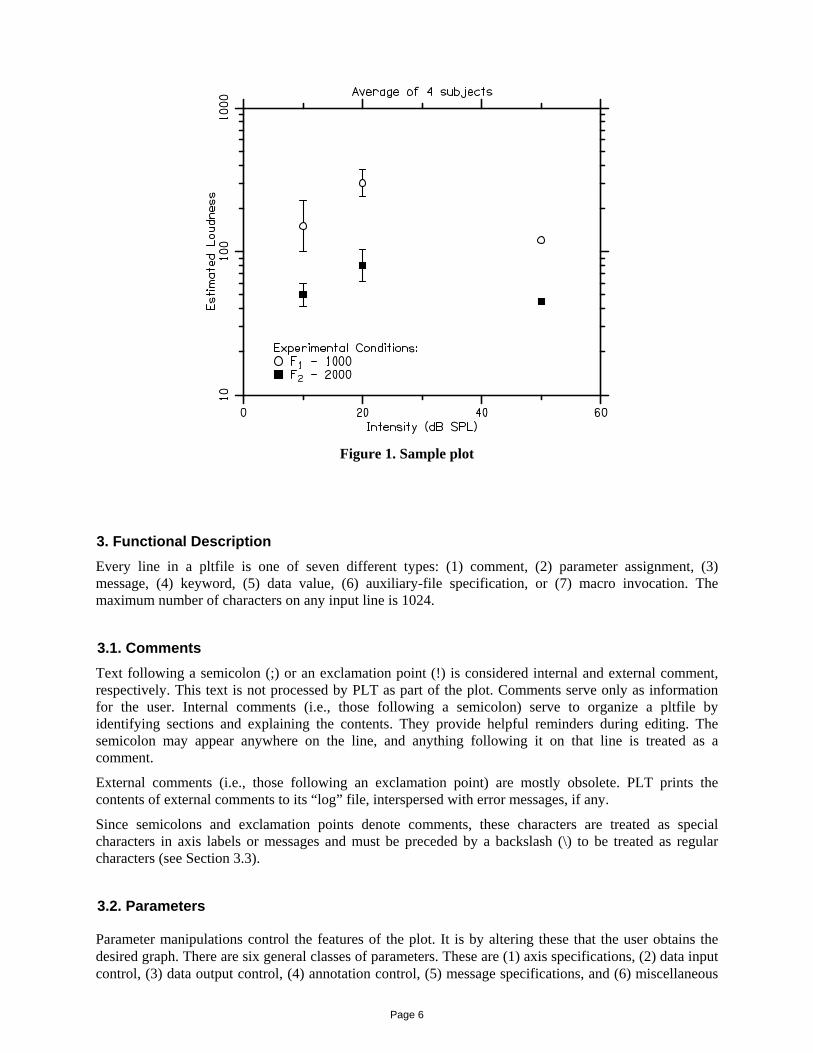
Figure 1. Sample plot
3. Functional Description Every line in a pltfile is one of seven different types: (1) comment, (2) parameter assignment, (3) message, (4) keyword, (5) data value, (6) auxiliary-file specification, or (7) macro invocation. The maximum number of characters on any input line is 1024.
3.1. Comments Text following a semicolon (;) or an exclamation point (!) is considered internal and external comment, respectively. This text is not processed by PLT as part of the plot. Comments serve only as information for the user. Internal comments (i.e., those following a semicolon) serve to organize a pltfile by identifying sections and explaining the contents. They provide helpful reminders during editing. The semicolon may appear anywhere on the line, and anything following it on that line is treated as a comment.
External comments (i.e., those following an exclamation point) are mostly obsolete. PLT prints the contents of external comments to its “log” file, interspersed with error messages, if any.
Since semicolons and exclamation points denote comments, these characters are treated as special characters in axis labels or messages and must be preceded by a backslash (\) to be treated as regular characters (see Section 3.3).
3.2. Parameters
Parameter manipulations control the features of the plot. It is by altering these that the user obtains the desired graph. There are six general classes of parameters. These are (1) axis specifications, (2) data input control, (3) data output control, (4) annotation control, (5) message specifications, and (6) miscellaneous
Page 6
parameters. The structure of a parameter manipulation consists of a word, followed by an equal sign, followed by the desired parameter value. PLT examines only the first four characters of the parameter, even though its full name may be longer.
Most parameters are numeric and their value may be integer or floating-point number. Exponential notation can be used for floating-point numbers. The parameter value may also be expressed as an arithmetic expression including operators for addition, subtraction, multiplication, division, and exponentiation (+, -, *, /, and ^). The arithmetic expression may include reference to PLT parameters or user variables. Parentheses can be used to group arithmetic expressions.
In addition to numeric parameters, there are several string parameters that are used to provide text for axis labels and annotations.
Besides predefined parameters, “user variables” may also be defined in the same way as numeric PLT parameters and referenced in any arithmetic expression.
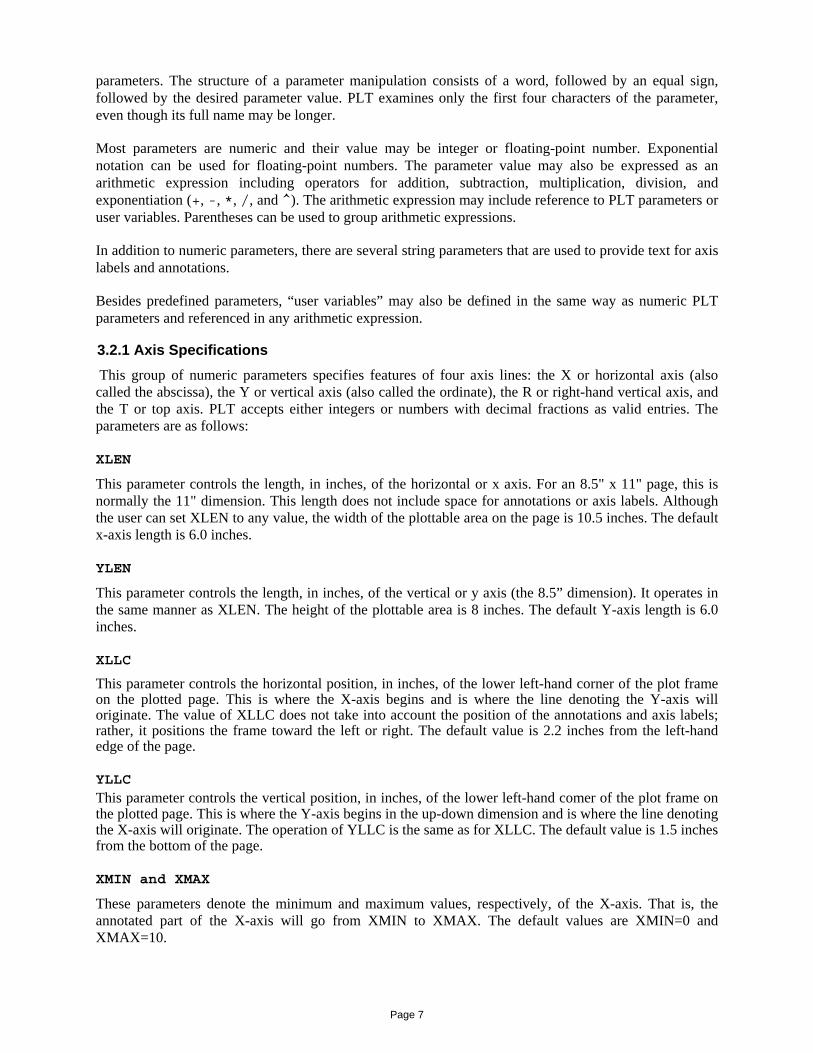
3.2.1 Axis Specifications This group of numeric parameters specifies features of four axis lines: the X or horizontal axis (also called the abscissa), the Y or vertical axis (also called the ordinate), the R or right-hand vertical axis, and the T or top axis. PLT accepts either integers or numbers with decimal fractions as valid entries. The parameters are as follows:
XLEN
This parameter controls the length, in inches, of the horizontal or x axis. For an 8.5" x 11" page, this is normally the 11" dimension. This length does not include space for annotations or axis labels. Although the user can set XLEN to any value, the width of the plottable area on the page is 10.5 inches. The default x-axis length is 6.0 inches.
YLEN
This parameter controls the length, in inches, of the vertical or y axis (the 8.5” dimension). It operates in the same manner as XLEN. The height of the plottable area is 8 inches. The default Y-axis length is 6.0 inches.
XLLC
This parameter controls the horizontal position, in inches, of the lower left-hand corner of the plot frame on the plotted page. This is where the X-axis begins and is where the line denoting the Y-axis will originate. The value of XLLC does not take into account the position of the annotations and axis labels; rather, it positions the frame toward the left or right. The default value is 2.2 inches from the left-hand edge of the page.
YLLC This parameter controls the vertical position, in inches, of the lower left-hand comer of the plot frame on the plotted page. This is where the Y-axis begins in the up-down dimension and is where the line denoting the X-axis will originate. The operation of YLLC is the same as for XLLC. The default value is 1.5 inches from the bottom of the page.
XMIN and XMAX
These parameters denote the minimum and maximum values, respectively, of the X-axis. That is, the annotated part of the X-axis will go from XMIN to XMAX. The default values are XMIN=0 and XMAX=10.
Page 7

YMIN and YMAX
These parameters denote the minimum and maximum values of the Y-axis. The operation of these and their defaults are the same as for XMIN and XMAX.
RMIN and RMAX
These parameters denote the minimum and maximum values of the right-hand axis, when one is desired. The operation for these is the same as for the other axes. The default values, RMIN=0 and RMAX=0, cause the right-hand axis to mirror the Y axis.
Note that Y position of the data is never determined by the right-hand axis. The Y position is always determined by the Y-axis. The right-hand axis mainly exists to provide a secondary Y scale for the data. However, there is an indirect way to cause the Y position to be consistent with the right-hand axis. The steps needed to do this are (1) plot any data that should be positioned according to the Y axes, (2) suppress the Y-axis by setting YAXIS=0, (c) set YMIN=RMIN and YMAX=RMAX, preceded (or followed) by the keyword NEWRANGE, (d) enter and plot the data to be positioned according to the right-hand axis.
TMIN and TMAX
These parameters denote the minimum and maximum values of the top axis, when one is desired. The operation for these is the same as for the other axes. The default values, TMIN=0 and TMAX=0, cause the top axis to mirror the X axis.
Note that X position of the data is never determined by the top axis. The X position is always determined by the X-axis. The top axis mainly exists to provide a secondary X scale for the data. However, there is an indirect way to cause the X position to be consistent with the top axis. The steps needed to do this are (1) plot any data that should be positioned according to the X axes, (2) suppress the X-axis by setting XAXIS=0, (c) set XMIN=TMIN and XMAX=TMAX, preceded (or followed) by the keyword NEWRANGE, (d) enter and plot the data to be positioned according to the top axis.
XCYCLE, YCYCLE, RCYCLE, and TCYCLE
These parameters, when non-zero, specify that the corresponding axis is to be logarithmic and indicate how many base-10 logarithmic cycles will appear on that axis. The default is 0.0 for all three CYCLE parameters, which indicates that the corresponding axis is linear.
One useful feature, when logarithmic axes are specified, is that the user may set only the number (whole or fractional) of cycles desired and either the minimum or maximum axis value. Alternatively, when the user sets the minimum and maximum axis to desired values, then the corresponding CYCLE parameter may be set to any nonzero value. For example, the sequence of parameters in any of the following columns has the same result.
(1) (2) (3) (4)
XMIN=2 XMIN=2 XMIN=0 XMIN=2
XMAX=200 XMAX=0 XMAX=200 XMAX=200
XCYCLE=2 XCYCLE=2 XCYCLE=2 XCYCLE=1
Sequence (1) defines all three parameters in a consistent manner. Sequences (2) and (3) have enough information to generate the logarithmic axis. In these cases the missing parameter is calculated and used internally. Sequence (4) has an inconsistency in it, in that XCYCLE does not agree with the axis limits. In this case, the limits XMIN and XMAX take precedence and XCYCLE will be corrected internally to the proper value, which is 2.
Page 8

Normally, each cycle of a log axis represents a multiple of 10. As a special case, the log axis can be made to have cycles which are multiples of 2 by setting the corresponding interval parameter (XINT, YINT, RINT, or TINT) to -2. Any other value for the interval parameter causes the log cycles to be multiples of 10.
Two notes of caution: First, the user should remember, when defining only two logarithmic-axis parameters, that the third parameter must be 0 (the default value). If the 'missing" parameter is non-zero, perhaps having been set in processing a previous plot frame, then incorrect (and possibly disastrous) results may occur. Second, it is valid to set the number of cycles to a fractional amount such as 2.50 or 3.10. In the case where only XMIN or XMAX is defined, PLT will generate the non-integral number of cycles specified.
XINT, YINT, RINT, and TINT
These parameters control the way tick marks describing intervals on the corresponding (linear) axes will be drawn. If the axis is logarithmic, then the number of cycles, and the number of intervals defining the number of ticks is ignored unless it has the value -2. This special value causes the log axis to have cycles that are multiples of 2, instead of multiples of 10.
The INT parameter values have the form MM.N, which defines two types of intervals, namely “major” and “minor” intervals. The integer to the left of the decimal point (MM) defines the number of major intervals (and produces MM+l tick marks) along the specified axis. Only major intervals may be annotated, and only major intervals have grid lines (when a grid is desired). The integer to the right of the decimal point (N) defines the number of minor intervals per major interval (and produces N-1 tick marks per minor interval).
For example, XINT=10.5 specifies the X axis to be plotted with 10 major intervals equally spaced between XMIN and XMAX. In addition to this, each major interval is subdivided into 5 minor intervals, making a total of 50 intervals overall. If XMIN=0 and XMAX=100, then each major interval represents 10 units and each minor represents 2 units.
The maximum number of minor intervals is 9. A minor interval is not annotated and carries no grid lines. Major intervals are indicated by tick marks that are twice as long as those denoting minor intervals. The default value for all axes is 5.
XPERCENT, YPERCENT, RPERCENT, and TPERCENT
These parameters control the percentage of the respective axis to use for determining where to position the limits, with the limits being centered along the length of the axis. Its value can vary continuously from 0 to 100, with the default being 100 in all cases.
For example, XPERCENT=50 specifies that only half of the axis length should be used to plot the intervals between XMIN and XMAX. The tick mark denoting XMIN will be positioned one-quarter of the way along the X axis and the tick mark denoting XMAX will be positioned three-quarters of the way along the X axis. The entire length of the axis is used when XPERCENT=100, the default value, so XMIN appears at the left edge and XMAX appears at the right edge.
XSHIFT, YSHIFT, RSHIFT, and TSHIFT
When the range of data values is restricted to occupy less than the full length of the axis (using the PERCENT parameters described above) then this restricted range is normally centered within the axis length. The shift parameters can be used to shift the restricted range toward one side or the other. The value of these parameters is taken as a percentage of the full axis length by which the restricted range should be shifted. Positive values shift the range in the positive direction and negative values shift the range in the negative direction . The default value of all SHIFT parameters is 0.
Page 9
XBREAK, YBREAK, RBREAK, and TBREAK
These BREAK parameters are used when two discontinuous ranges of data values are to be represented on the same axis. The axis line is broken with two short diagonal stokes at the place which is the percentage distance along the axis indicated by the value of the parameter. The default value of 0 indicates no break in the axis. Only one axis break is permitted on each axis.
XTICK, YTICK, RTICK, and TTICK
These TICK parameters specify length of the tick marks on the X, Y, right-hand, and top axes, respectively. The default value of these parameters is 1.
TICDIR and TICSIZ
TICDIR controls the direction that tick marks are plotted, which may be either inward or outward from the frame. Setting TICDIR to 0 (the default value) indicates outward ticks, and setting it to a non-zero value indicates inward ticks. Inward ticks are 1.5 times longer than outward ticks. For convenience to users, PLT recognizes the first letter of INWARD and OUTWARD as legitimate values for TICDIR. Thus, the following lines all have the same result.
TICDIR=0 TICDIR=out TICDIR=OUTWARD
TICSIZ controls the length of the tick marks as a scale factor. Its default value is 1. Negative values of TICSIZ set the absolute length of major tick marks in inches. Minor tick marks are always half the length of major tick marks.
OPENAX
The default plot frame has four sides. Tick marks are normally placed on all four axes and tick marks on the right and top axes are mirror images of those on the bottom (X) and left (Y) axes. Alternatively, setting OPENAX to a non-zero value (which may be YES or Y) causes only the bottom and left-hand axes to be drawn, leaving the plot “open”. If a right-hand axis is specified when OPENAX is non-zero, then the right-hand axis will appear in its usual place, leaving only the top of the plot frame open.
CORNER
When XPERCENT and/or YPERCENT are less than 100, a small portion of the X and Y axes falls outside the range between MIN and MAX. When CORNER=1, the default value, the axis lines are drawn for this outlying portion of the axis, so that corners are drawn at all four points where axes meet. Setting CORNER=0, suppresses drawing of the corners of the frame, so that only the range of the axis between MIN and MAX is drawn.
XAXIS, YAXIS, RAXIS, and TAXIS
These AXIS parameters the (X, Y, right-hand, and top axes, respectively) determine whether each axis is to be drawn or not drawn when the data are plotted. Setting the value of any of these parameters to 0 (or N or no) turns of the corresponding axis. The default value for these parameters is 1.
XLABEL, YLABEL, RLABEL, and TLABEL
These parameters are set to text values and specify the labels applied to the corresponding axis. Axis labels may be as long as desired and contain super-scripted and sub-scripted text or embedded symbols. The only differences between axis labels and messages, described below, are that (a) an axis label must occupy only one line in the pltfile and (b) axis labels are not delimited by quotation marks.
Axis labels are centered along the desired axis. The X-axis label is plotted below the X-axis; the Y-axis label is plotted to the left of the Y-axis line and annotations are at a 90-degree angle, with the characters
Page 10

facing upward; the R-axis label is plotted to the right of the R-axis with the same orientation as the Y label; the T-axis label is plotted above the T-axis.
LABSIZ
The default label character height is computed internally by PLT, and it is a function of the average length of the X- and Y-axis. The user can modify this by adjusting LABSIZ. When LABSIZ is positive or zero, it acts as a multiplier that operates on the default label size. A zero value produces no axis labels, and values greater or less than one produce proportionately larger-than-normal or smaller-than-normal character heights for axis labels. When LABSIZ is negative, the internal computation of label weight is overridden, and the label character height used (in inches) is the absolute value of LABSIZ. For example, If the user desires labels that are 1/2 inch tall, then the setting should be LABSIZ=-0.5.
3.2.2. Data Input Control This group of parameters determines how the numbers in the pltfile are interpreted as data values.
XGAIN, YGAIN, and ZGAIN XOFST, YOFST, and ZOFST
As each data line is read by the PLT program, the x, y, z values are multiplied by XGAIN, YGAIN, ZGAIN (default value for each is 1.0) and then added to XOFST, YOFST, ZOFST (default value 0.0) prior to being placed in the data buffer. This gives the user the opportunity to scale data values on the plot without changing data values in the pltfile. Alternatively, more general transformations of the input data are possible by using XDATA, YDATA, and ZDATA.
XDATA, YDATA, and ZDATA
The parameters XDATA, YDATA, and ZDATA are interpreted as arithmetic expressions that specify how the data are transformed prior to plotting. These arithmetic expressions may include special variables that indicate column numbers, which are written as $1, $2, …, $64. The maximum number of data columns is 64. YDATA may also include the special variable $x, which is set equal to the current X value.
NDATA
The NDATA parameter is useful for plotting functions based on arithmetic expressions. The default value specifies that each data line is read once. When NDATA is greater than one, each data line is read the number of times specified by NDATA. This feature is most often used with a single data line, in which case NDATA specifies the total number of data values. The first time the data line is read, the special variable $0 equals 1. The value of $0 is incremented each time the data line is read. Arithmetic expressions that specify XDATA, YDATA, and ZDATA may include the variable $0, so that the Z, Y, and Z values change each time the single data line is read.
3.2.3. Data Output Control This group of parameters determines how the specified data are to be plotted.
PLTYPE
This parameter defines the plot type. Ten types of plots exist: 1 Symbols only 6 Polygon 2 Lines only 7 Wave 3 Both symbols and lines 8 contiGuous rectangles
4 Histogram 9 Cumulative distribution
5 Rectangles 10 Frequency distribution
Page 11

The default plot type is Type 3 (symbols and lines). A useful feature of PLT is that the user can define PLTYPE with text or by number. For example, the following commands all produce the same result.
PLTYPE=symbols PLTYPE=SYMBOL PLTYPE=s PLTYPE=1
In order to use a text argument, the user need only provide the first letter, either upper or lower case, with “S” designating symbols only, “L” designating lines only, “B” designating both symbols and lines, “H” designating histogram, “R” designating rectangles, “P” designating polygons, “W” designating wave, “G” designating contiguous rectangles, “C” designating cumulative distribution, and “F” designating frequency distribution.
A histogram plot will cause the data to be plotted in bar-graph form along the X axis, using as many bars as there are data values. Note that empty histogram bins must be accounted for. The second data value (if any) defines an error value to be indicated by an error bar. The rectangle plot type takes two pairs of x & y data values as the corners of the rectangle. The polygon data type takes all x & y pairs as corners of a polygon.
The rectangle plot type interprets X and Y data values as successive pairs specifying the corners of rectangles. The contiguous rectangle plot type interprets X and Y values as specifying the upper-right corner of adjacent rectangles.
The wave plot type interprets the X data values as samples of a waveform and plots the position of the values along the Y axis with equal spacing along the X axis.
The cumulative distribution plot type sorts the X values and increments the Y values by an equal amount for each successive X value. The parameter NORM determines the maximum value of the cumulative distribution. The parameter CDEXT (see below) controls whether the line representing the cumulative distribution is drawn beyond the range of X values.
LINTYPE and LINSIZ
This parameter defines the type of line, dashed or solid, to use in plotting the data (when lines are specified). Values greater than 1 designate dashed lines and determine the length of the dashes, with larger values generating longer dashes. A value of 1 produces dotted lines. Setting LINTYPE equal to 0 (see Fig. 2) designates solid lines (the default).
LINSIZ specifies the relative pattern size of dotted and dashed lines. The default value is LINSIZ=1.
SYMBOL
This parameter defines the symbol number to use in plotting data (when use of symbols is specified). There are 30 symbols available, of which 10 are filled and 10 are open. The codes for the symbols are as follows (see Fig. 2):
Symbol Shape Symbol Shape Symbol Shape
0 Open square 10 Filled square 20 Ray-box1 Open circle 11 Filled circle 21 Circle-dot2 Open erect triangle 12 Filled erect triangle 22 Happy Face3 Open inverted triangle 13 Filled inv. triangle 23 Sad Face4 Open diamond 14 Filled diamond 24 Asterisk-65 Hourglass 15 Filled hourglass 25 Dot6 Asterisk-8 16 Filled pentagon 26 Open pentagon7 Plus sign 17 Filled hexagon 27 Open hexagon
Page 12

8 'Picnic table' 18 Filled Star-5 28 Open Star-59 Up-pointing arrow 19 Filled Star-6 29 Open Star-6
Note that the numbers for filled symbols 10-15 are equal to their unfilled values plus ten and the numbers for filled symbols 16-19 are equal to their unfilled values minus ten. The hollow symbols (0-5 & 26-29) are filled with white if this feature is permitted on the output device. Symbol 25 is a small dot. Symbol 30 is the PLT logo that appears in the header. Symbol 31 is an empty symbol that causes nothing to be drawn at the symbol location. The default symbol number is 1 (open circle).
Figure 2. Symbols and Line Types
SOLID
SOLID exists for compatibility with previous versions. If SOLID is non-zero or YES and the symbol number is 0-9, PLT will choose the corresponding filled symbol 10-19. The default value is SOLID=0 or NO.
SYMSIZ
This is a multiplier for symbol size. A default symbol size is determined by the size of the plot. SYMSIZ may be set to different values to adjust the symbol size accordingly. For example, setting SYMSIZ=0.5 produces half-normal-size symbols, and setting SYMSIZ=2 produces double-size symbols. When SYMSIZ is negative, internal computation of symbol size is overridden and the height of the symbol (in inches) is the absolute value of SYMSIZ.
SYMANG
SYMANG specifies a rotation angle for the symbol in degrees (counter-clockwise) relative to normal orientation. The default value is 0.
Page 13
EBNUM and EBWID
EBNUM, when set to zero, will suppress the plotting of error bars. A value of 1 produces the upper portion, and the default value of EBNUM=2 produces both the upper and lower portion of the error bar.
EBWID modifies the default error bar line widths as a scale factor. When EBWID=0, no caps appear on the error bars. When EBWID=2, the caps will be twice as wide. The default value is 1.
GAPSIZ
This parameter controls size of gap between line segments for plotting symbols when PLTYPE=3. The default value is 1.
SHADE
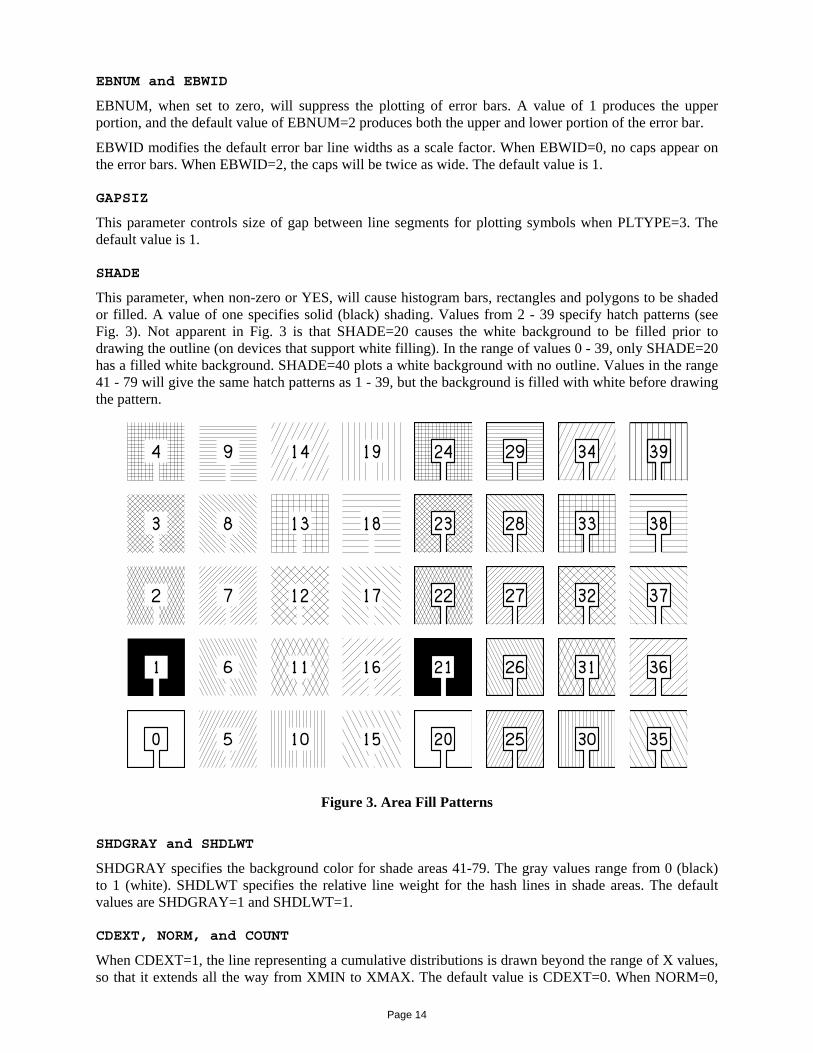
This parameter, when non-zero or YES, will cause histogram bars, rectangles and polygons to be shaded or filled. A value of one specifies solid (black) shading. Values from 2 - 39 specify hatch patterns (see Fig. 3). Not apparent in Fig. 3 is that SHADE=20 causes the white background to be filled prior to drawing the outline (on devices that support white filling). In the range of values 0 - 39, only SHADE=20 has a filled white background. SHADE=40 plots a white background with no outline. Values in the range 41 - 79 will give the same hatch patterns as 1 - 39, but the background is filled with white before drawing the pattern.
Figure 3. Area Fill Patterns
SHDGRAY and SHDLWT
SHDGRAY specifies the background color for shade areas 41-79. The gray values range from 0 (black) to 1 (white). SHDLWT specifies the relative line weight for the hash lines in shade areas. The default values are SHDGRAY=1 and SHDLWT=1.
CDEXT, NORM, and COUNT
When CDEXT=1, the line representing a cumulative distributions is drawn beyond the range of X values, so that it extends all the way from XMIN to XMAX. The default value is CDEXT=0. When NORM=0,
Page 14

the maximum value of a cumulative distribution along the Y axis equals the number of data values. Setting NORM to a positive number changes the maximum values to that number. The default value is NORM=1. Another frequently used value is NORM=100.
When COUNT=1 (or Y or yes), the Y values may specify a repetition count for the X values. This feature avoids the need to enter repeated X values on separate lines. The default value is COUNT=0.
3.2.4. Annotation Control Annotations are the values printed next to each tick mark. PLT adjusts annotations such that they are centered next to tick marks. The default condition for all axes is for annotations to run parallel to the axis. Parameters in this class are as follows:
XANSKP, YANSKP, RANSKP, and TANSKP
These parameters control the manner in which major intervals are annotated. Each is a skip factor whose values range from zero upward. A value of zero indicates that no annotations are to be skipped, so that all annotations are to be labeled. A value of one indicates that every other annotation is to be labeled, and so on. A value less than zero indicates that no annotations are to be produced, i.e., the axis has tick marks, but has no annotation values adjacent to the tick marks. The annotation skip parameters may also be specified in the form MM.NN, where MM indicates the number skipped between annotations and NN represents the number of annotations skipped at the beginning of the axis. For example, XANSKP=1.1 causes the first annotation on the X- axis to be skipped and the second, fourth, sixth, etc. to be plotted.
ANNSIZ
ANNSIZ controls the size of the characters used in annotations. If it is zero or positive, it acts as a multiplier of the internally computed annotation character size. The default value is one. Values greater than one produce larger-than- normal annotations, and values less than one produce proportionately smaller annotations. If ANNSIZ is negative, internal computation of annotation character size is over-ridden and the height of the annotation characters (in inches) is the absolute value of ANNSIZ.
XFMT, YFMT, RFMT, and TFMT
These are text strings that define annotation formats for the X-, Y-, R-, and T-axes, respectively. Allowable formats are I (for integer) and F (for floating-point). The form of the string is Im or Fm.n, where I specifies integer annotations, i.e., whole numbers, and F specifies floating-point annotations, i.e., values with a decimal point. According to standard FORTRAN format specifications, m defines the number of characters to use; however, PLT determines how many characters exist in each annotation and adjusts accordingly, so the value of m is ignored. The number of digits after the decimal point is specified by n. If n is not present, then the format is the same as I. The default formats are I for all four axes.
XANNOT, YANNOT, RANNOT, and TANNOT
These parameters are text strings which list the annotations desired separated by spaces. Each number listed in this parameter is placed at the appropriate location of the corresponding axis. The formatting of the number (number of decimal places, etc.) Is retained exactly as it appears in the list. When present, annotation strings completely override the usual automatic generation of annotations.
YHOR
This parameter, when non-zero or YES, instructs PLT to plot the Y- and R-axis annotations horizontally, i.e., In the same direction as the X-axis annotations. This allows annotations to be read somewhat more easily. When horizontal Y- and R-axis annotations are used, the axis laws are moved away from the axes by the correct distance, depending on the annotation values and formats. When employing horizontal annotations, users should allow enough space on the left- and right-hand sides of the plot for both the annotations and the axis labels. The default is YHOR=0, which specifies vertical orientation of Y- and R-axis annotations.
Page 15

3.2.5. Message Control Messages provide a means of placing additional text anywhere on the plot. Messages are plotted as they are encountered whether or not any data have been plotted.
MXLLC and MYLLC
These normally define the X- and Y-axis positions of the lower left-hand corner of the first character of the message. The values are in inches relative to the lower left- hand corner of the axes, i.e., from the point where the X-axis line meets the Y-axis line as defined by XLLC and YLLC. Messages can be positioned outside the plot boundaries. The alignment of the message relative to the LLC position (MXLLC,MYLLC) may be modified using MHALIGN and MVALIGN. The values of MXLLC and MYLLC may also be set by placing these values immediately in front of the opening quotation mark of the message. For example, the following line sets MXLLC=0.5 and MYLLC=0.5, prior to plotting the message.
0.5 0.5 "This is a message."
MSGDAT, MXDAT, and MYDAT
Setting this parameter to a non-zero value, or to YES, yes, or y, instructs PLT to interpret MXLLC and MYLLC as an (X,Y) coordinate relative to the axis values. For example, if the X- and Y-axes are both 6 inches long and both go from 0 to 100, and if MSGDAT is set to YES, then setting MXLLC=50 and MYLLC=50 causes the lower left-hand corner of the message to begin at the point where a data value of (50,50) would be positioned, i.e., three inches up from the Y-axis line and three inches to the right of the X-axis line. MXDAT and MYDAT work the same way as MSGDAT except that they apply to the X and Y coordinates separately. The default value of MSGDAT, MXDAT, and MYDAT is zero, which causes MXLLC and MYLLC to be interpreted as inches relative to XLLC and YLLC.
MSGANGLE
This parameter controls the angle at which a message is to be plotted, in degrees that move counterclockwise from the X-axis. When MSGANGLE=90, the message is oriented vertically. When MSGANGLE=180, the message is upside-down. The default value is 0.
MSGSIZ
MSGSIZ is a multiplier that controls the size of characters in messages, relative to a 'standard" message character size generated internally by PLT. Values less than 1 produce proportionately smaller-than-normal messages, and values greater than 1 produce larger-than-normal characters in messages. The default value for MSGSIZ is 1. When MSGSIZ is negative, internal computation of message character size is overridden and the height of the message characters (in inches) is the absolute value of MSGSIZ.
MSLANT
MSLANT specifies the Italic slant of characters in messages in degrees (clockwise) from upright. The default value is 0.
MHXP
This parameter controls the width (or aspect ratio) of characters in messages (and axis labels) relative to their height. The default value is 1. Values larger than 1 result in wide characters and values smaller than on result in narrow characters.
MHSP and MVSP
MHSP controls the amount of extra space inserted between characters and MVSP controls the amount of vertical space between lines within messages. Both parameters are multiplied by the current character height to determine the actual amount of space inserted. The default value of MHSP is 0. A value of
Page 16
MHSP=0.5 will leave extra space between characters equal to one-half the character height. The default value of MVSP is 1.64. A value of MVSP=2 will cause the vertical space between message lines to be twice the character height.
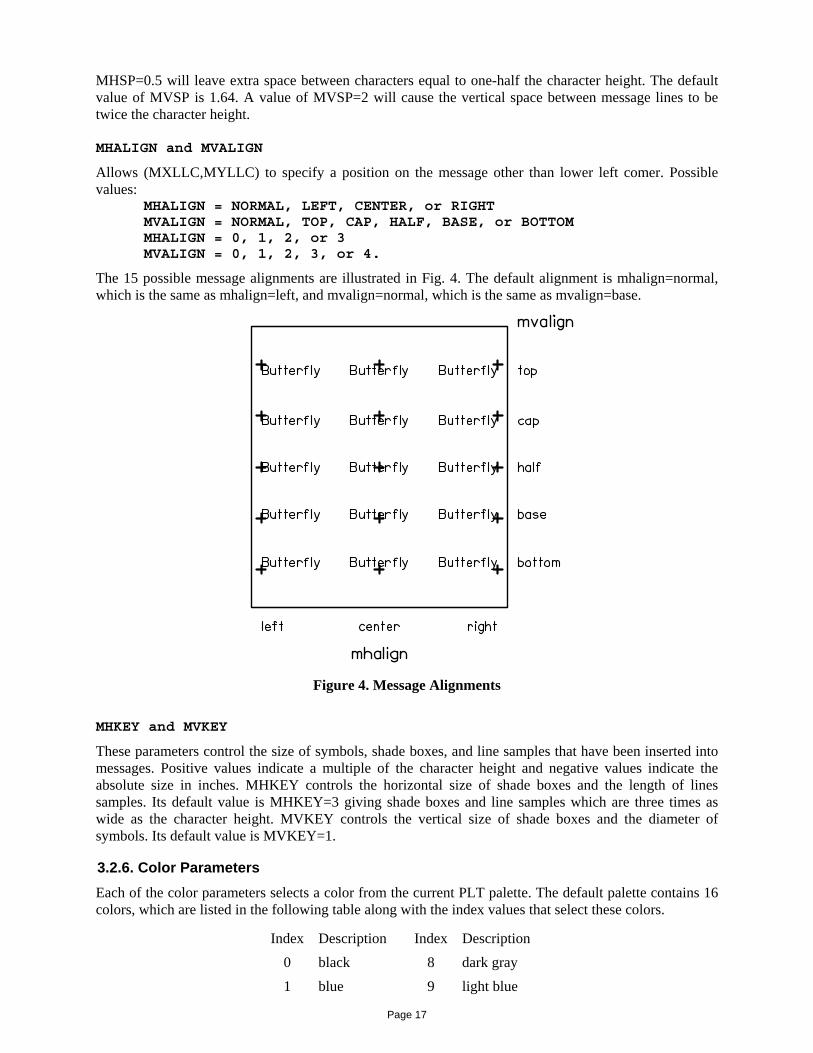
MHALIGN and MVALIGN
Allows (MXLLC,MYLLC) to specify a position on the message other than lower left comer. Possible values:
MHALIGN = NORMAL, LEFT, CENTER, or RIGHT MVALIGN = NORMAL, TOP, CAP, HALF, BASE, or BOTTOM MHALIGN = 0, 1, 2, or 3 MVALIGN = 0, 1, 2, 3, or 4.
The 15 possible message alignments are illustrated in Fig. 4. The default alignment is mhalign=normal, which is the same as mhalign=left, and mvalign=normal, which is the same as mvalign=base.
Figure 4. Message Alignments
MHKEY and MVKEY
These parameters control the size of symbols, shade boxes, and line samples that have been inserted into messages. Positive values indicate a multiple of the character height and negative values indicate the absolute size in inches. MHKEY controls the horizontal size of shade boxes and the length of lines samples. Its default value is MHKEY=3 giving shade boxes and line samples which are three times as wide as the character height. MVKEY controls the vertical size of shade boxes and the diameter of symbols. Its default value is MVKEY=1.
3.2.6. Color Parameters Each of the color parameters selects a color from the current PLT palette. The default palette contains 16 colors, which are listed in the following table along with the index values that select these colors.
Index Description Index Description 0 black 8 dark gray 1 blue 9 light blue
Page 17

2 green 10 light green 3 cyan 11 light cyan 4 red 12 light red 5 magenta 13 light magenta 6 brown 14 yellow 7 light gray 15 white
The default palette is shown in Fig. 5.
ANNCOL, AXCOL, LABCOL, MSGCOL, and PLTCOL
These parameters specify color for annotations (ANNCOL), axes (AXCOL), axis labels (LABCOL), messages (MSGCOL), and symbols with their connecting lines (PLTCOL).
BGCOL, FGCOL, and FNCOL
These parameters specify the background color (BGCOL)of the page behind the plot and the foreground color (FGCOL), which is the default color of every element of the plot. When FNCOL is non-negative, it specifies a second color for the background at the top of the pages. The page color gradually changes to the other background color toward the bottom of the page.
FILCOL, GRDCOL, and SHDCOL
FILCOL specifies the fill color for symbols 10-19. GRDCOL specifies the grid color. SHDCOL specifies the shade color.
Figure 5. Color Palette
3.2.7. Miscellaneous Parameters
ARONUM, AROSIZ, AROTIP, and AROWID
These parameters specify the drawing of arrowheads at the end of plotted lines. When ARONUM=0, which is the default value, no arrowheads are drawn. When ARONUM=1, an arrowhead is drawn at the end of the line, i.e., the position that represents the final data value. When ARONUM=-1, an arrowhead is drawn at the starting point of the line. When ARONUM=2, arrowheads are drawn at both ends of the line.
Page 18

AROSIZ controls the size of the arrowhead. The default value is AROSIZ=1. AROTIP controls the shape of the arrowhead. The arrowhead has a triangle shape when AROTIP=1 and has a diamond shape when AROTIP=2. The default value is AROTIP=0.1. AROWID controls the width of the arrowhead. The default value, AROWID=0.5, specifies that the width is half of the length of the arrowhead.
ANNLWT, AXLWT, LABLWT, MSGLWT, and PLTLWT
These parameters specify line weights for annotations (ANNLWT), axis lines (AXLWT), axis labels (LABLWT), messages (MSGLWT), and symbols with their connecting lines (PLTLWT).
Each of the parameters modifies the default line weight given to the associated aspect of the plot. The default value for all the line weights is 1 (see Fig. 6). Note in Fig. 6 that line widths vary with frame size for positive line weights, but not for negative line weights. If PLTLWT=0, the narrowest possible line will be used for plotting. If AXLWT, LABLWT, ANNLWT, or MSGLWT is set to zero, the corresponding feature of the plot will be completely eliminated.
Figure 6. Line Weight Values
CLIP
Setting CLIP=1 causes the lines between data points and the symbols at data points to be clipped at the frame boundary, which consists of the four axes. The default action is to clip only at the page boundary.
ECHO
Setting this parameter to a non-zero value (or to Yes, Y or y) will cause PLT to copy each input line in the pltfile to the PLT log file (plt.log).
Page 19
GRID
Setting this parameter to a non-zero value (or to Yes, Y or y) will cause PLT to plot grid lines at each major interval. If a right-hand axis has been specified that differs from the left-hand axis, or if OPENAX has been set to a non-zero value, then the grid will not appear. The default condition is GRID=O (or NO, N, no or n).
GRDLWT, GRDSIZ, GRDTYPE
GRDLWT specifies the relative line weight of the grid, when it is drawn. GRDSIZ specifies the relative pattern size of dashed and dotted lines. GRDTYPE specifies the line type for grid lines: 0 for solid lines, 1 for dotted lines, and greater than 1 for dashed lines. The default values are GRDLWT=1, GRDSIZ=1, and GRDTYPE=1.
HEADER
When HEADER=1, a status line will be plotted at the bottom of each page indicating the date of the pltfile, the pltfile name, and the page number. If the pltfile date is unavailable, the current date and time will be substituted. (The parameter name is a misnomer because the status line appears at the foot instead of the head of the page.)
MAGNIFY
Scales the entire plot page. The default value is 1.
ROTATE
Setting ROTATE=1 rotates the plot by 90 degrees so that the x dimension is oriented across the width of the page and the y dimension is oriented along the length. The default value is 0.
SELECT
SELECT is a logical expression that controls the inclusion of data values as they are read from the pltfile. For example, if SELECT=$x>1, then data lines will be excluded unless the X value is greater than one.
SIZFAC
Internally, PLT computes "standard" character sizes, line weights, symbol heights, etc., on the basis of the average axis length, i.e., half the sum of XLEN and YLEN. This is done so that plots retain the same aspect ratios as they differ in size.
SIZFAC allows the user to control the "standard" sizes of tick marks, axis labels, annotations, messages, symbols, etc., as well as line weights. It is used primarily to standardize aspects of multiple-panel plots in situations where the user desires constancy in the way individual panels are plotted, even though they may be of different size.
SIZFAC can take on three types of values. A negative value tells PLT to use, for the current frame, the standard sizes computed for the previous plot frame, regardless of the current plot frame's size. Thus, setting SIZFAC=-1, will cause the annotation height, tick mark length, axis label height, etc., from the previous frame to be retained for the current frame. Setting SIZFAC to a positive value instructs PLT to compute the various sizes, line weights, etc., based on the specified average axis length. Thus, if SIZFAC=7, then the various sizes, weights and lengths are determined as though the average axis length was 7.
The default value, SIZFAC=0 or NO, causes PLT to re-compute the various lengths and heights based on the current average axis length.
SMOOTH
Tells PLT to perform three-point smoothing of data. The default is NO.
Page 20
SORT
Setting SORT=1 causes the data points to be sorted in order of increasing x value. The default action (SORT=0) is not to sort the data points.
SPLINE
When this parameter is nonzero and PLTYPE=2 or 3, a B-spline curve will be drawn instead of connecting the data points. At least 4 data points are required to compute the spline curve. The curve will approximate all data points except the end points (first and last). The value of this parameter determines the number of points (and thereby the smoothness) of the spline curve. If SPLINE has a positive value, then a corresponding number of positions will be computed on the spline curve for each interval between data points. If SPLINE has a negative value, then it determines the absolute (total) number of positions used to represent the spline.
STEM
When this parameter is nonzero and PLTYPE=3, then symbol positions are connected to the X axis instead of to the adjacent symbol. The default value is STEM=0.
VXLLC and VYLLC
Allows the entire plot to be shifted relative to the lower left corner of the page. Indicates the offset (in inches) of the PLT page relative to the physical page. Default values are 0.
WXLLC and WYLLC
WXLLC and WYLLC determine the X and Y coordinates (in inches), respectively, of the virtual page offset from lower-left corner of the drawing area. Default values are 0.
WXLEN and WYLEN
Determines the page boundary window at which clipping occurs. Default values are WXLEN=10.5 and WYLEN=8 (inches). It may be desirable to change these values when the plot is rotated. For example, if ROTATE=1, then plottable area may be specified to fill the entire page by setting WXLEN=8 and WYLEN=10.5.
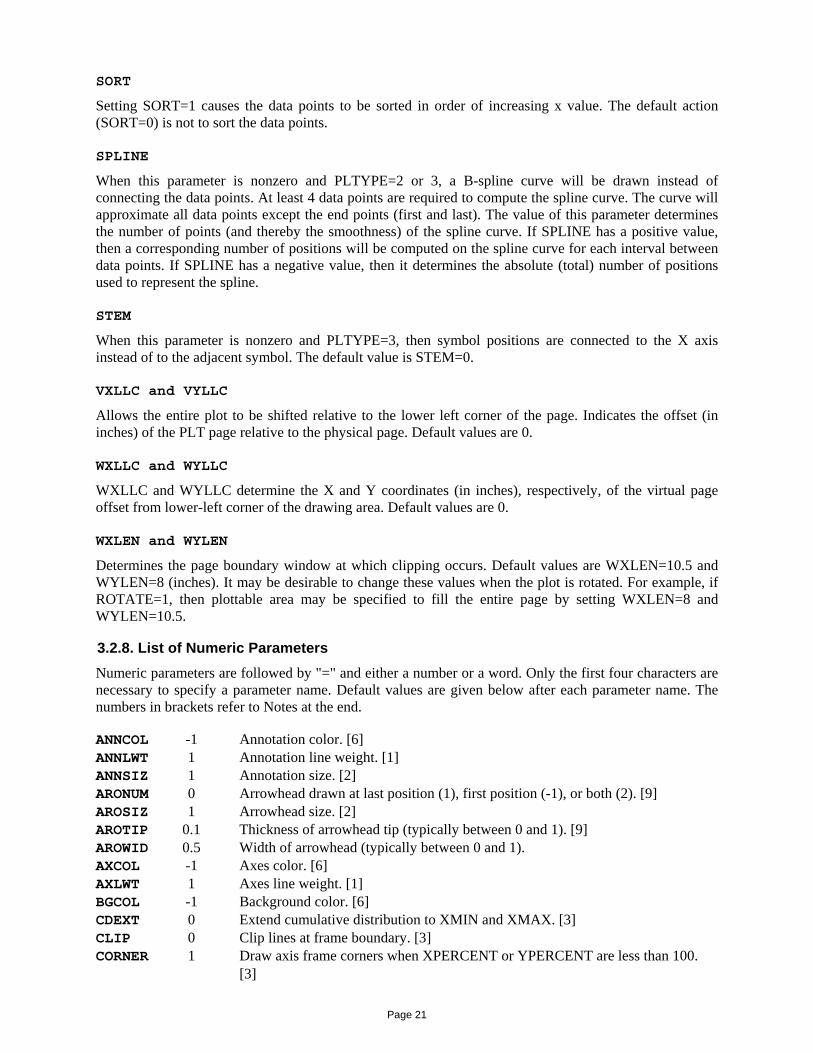
3.2.8. List of Numeric Parameters Numeric parameters are followed by "=" and either a number or a word. Only the first four characters are necessary to specify a parameter name. Default values are given below after each parameter name. The numbers in brackets refer to Notes at the end. ANNCOL -1 Annotation color. [6] ANNLWT 1 Annotation line weight. [1] ANNSIZ 1 Annotation size. [2] ARONUM 0 Arrowhead drawn at last position (1), first position (-1), or both (2). [9] AROSIZ 1 Arrowhead size. [2] AROTIP 0.1 Thickness of arrowhead tip (typically between 0 and 1). [9] AROWID 0.5 Width of arrowhead (typically between 0 and 1). AXCOL -1 Axes color. [6] AXLWT 1 Axes line weight. [1] BGCOL -1 Background color. [6] CDEXT 0 Extend cumulative distribution to XMIN and XMAX. [3] CLIP 0 Clip lines at frame boundary. [3] CORNER 1 Draw axis frame corners when XPERCENT or YPERCENT are less than 100.
[3]
Page 21
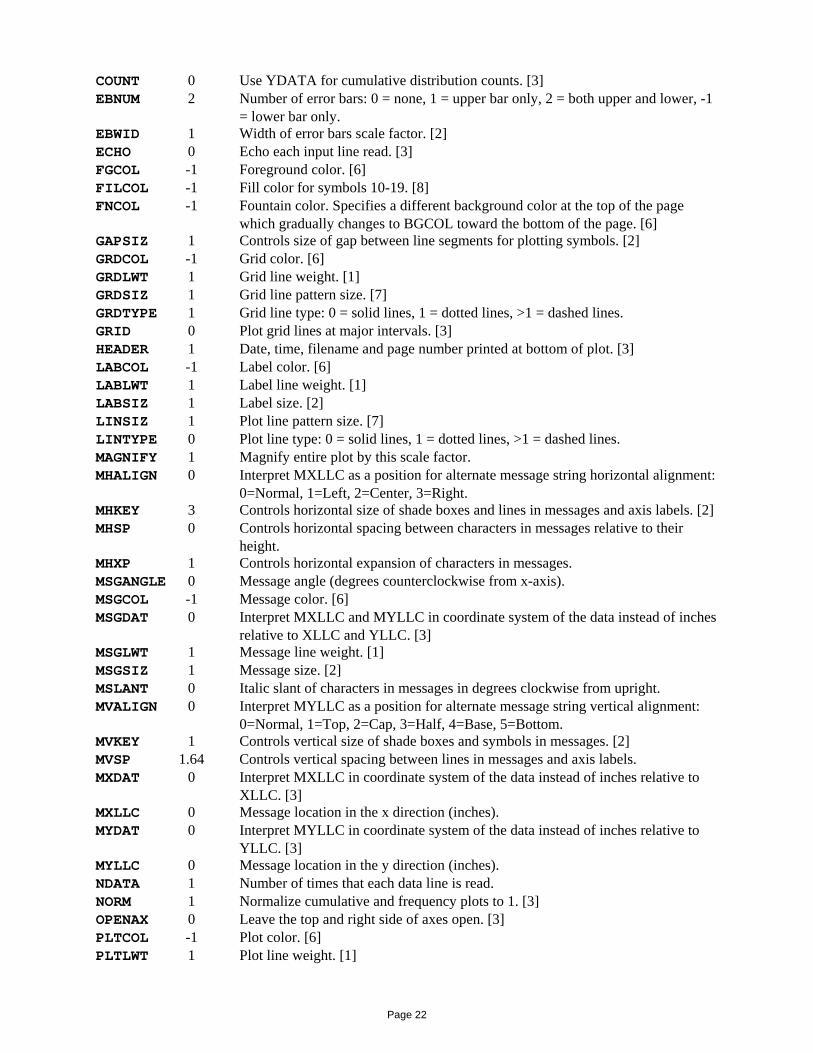
COUNT 0 Use YDATA for cumulative distribution counts. [3] EBNUM 2 Number of error bars: 0 = none, 1 = upper bar only, 2 = both upper and lower, -1
= lower bar only. EBWID 1 Width of error bars scale factor. [2] ECHO 0 Echo each input line read. [3] FGCOL -1 Foreground color. [6] FILCOL -1 Fill color for symbols 10-19. [8] FNCOL -1 Fountain color. Specifies a different background color at the top of the page
which gradually changes to BGCOL toward the bottom of the page. [6] GAPSIZ 1 Controls size of gap between line segments for plotting symbols. [2] GRDCOL -1 Grid color. [6] GRDLWT 1 Grid line weight. [1] GRDSIZ 1 Grid line pattern size. [7] GRDTYPE 1 Grid line type: 0 = solid lines, 1 = dotted lines, >1 = dashed lines. GRID 0 Plot grid lines at major intervals. [3] HEADER 1 Date, time, filename and page number printed at bottom of plot. [3] LABCOL -1 Label color. [6] LABLWT 1 Label line weight. [1] LABSIZ 1 Label size. [2] LINSIZ 1 Plot line pattern size. [7] LINTYPE 0 Plot line type: 0 = solid lines, 1 = dotted lines, >1 = dashed lines. MAGNIFY 1 Magnify entire plot by this scale factor. MHALIGN 0 Interpret MXLLC as a position for alternate message string horizontal alignment:
0=Normal, 1=Left, 2=Center, 3=Right. MHKEY 3 Controls horizontal size of shade boxes and lines in messages and axis labels. [2] MHSP 0 Controls horizontal spacing between characters in messages relative to their
height. MHXP 1 Controls horizontal expansion of characters in messages. MSGANGLE 0 Message angle (degrees counterclockwise from x-axis). MSGCOL -1 Message color. [6] MSGDAT 0 Interpret MXLLC and MYLLC in coordinate system of the data instead of inches
relative to XLLC and YLLC. [3] MSGLWT 1 Message line weight. [1] MSGSIZ 1 Message size. [2] MSLANT 0 Italic slant of characters in messages in degrees clockwise from upright. MVALIGN 0 Interpret MYLLC as a position for alternate message string vertical alignment:
0=Normal, 1=Top, 2=Cap, 3=Half, 4=Base, 5=Bottom. MVKEY 1 Controls vertical size of shade boxes and symbols in messages. [2] MVSP 1.64 Controls vertical spacing between lines in messages and axis labels. MXDAT 0 Interpret MXLLC in coordinate system of the data instead of inches relative to
XLLC. [3] MXLLC 0 Message location in the x direction (inches). MYDAT 0 Interpret MYLLC in coordinate system of the data instead of inches relative to
YLLC. [3] MYLLC 0 Message location in the y direction (inches). NDATA 1 Number of times that each data line is read. NORM 1 Normalize cumulative and frequency plots to 1. [3] OPENAX 0 Leave the top and right side of axes open. [3] PLTCOL -1 Plot color. [6] PLTLWT 1 Plot line weight. [1]
Page 22
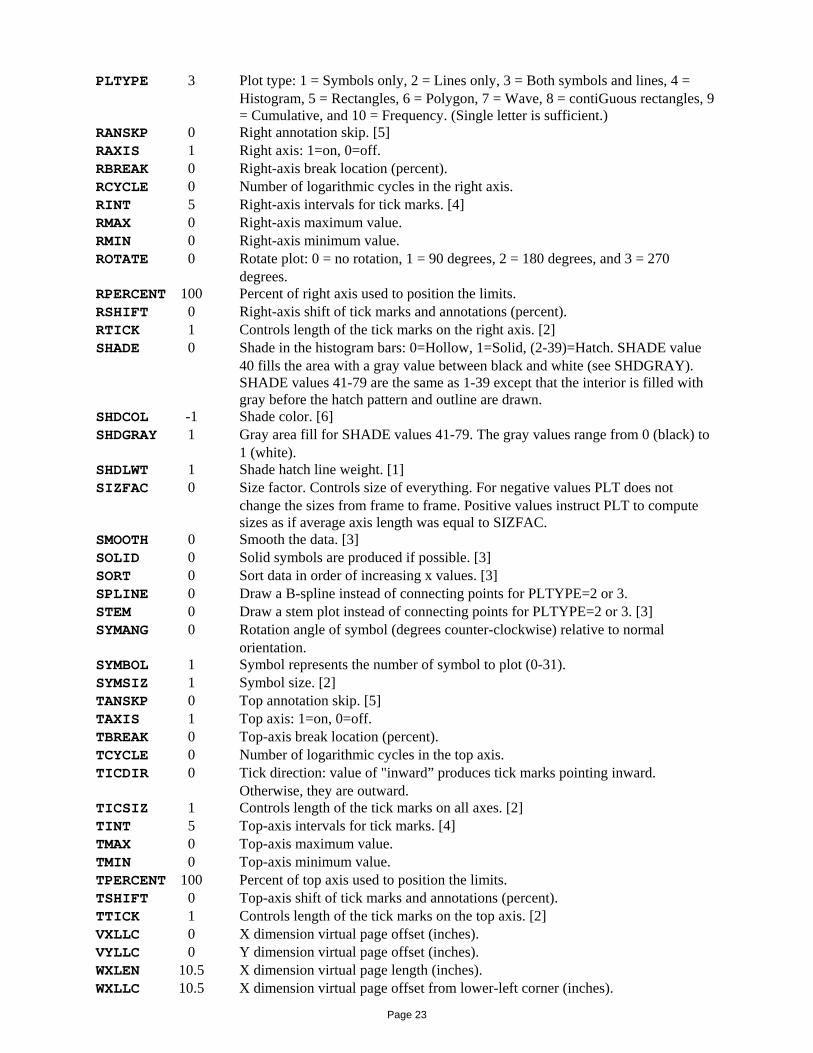
PLTYPE 3 Plot type: 1 = Symbols only, 2 = Lines only, 3 = Both symbols and lines, 4 = Histogram, 5 = Rectangles, 6 = Polygon, 7 = Wave, 8 = contiGuous rectangles, 9 = Cumulative, and 10 = Frequency. (Single letter is sufficient.)
RANSKP 0 Right annotation skip. [5] RAXIS 1 Right axis: 1=on, 0=off. RBREAK 0 Right-axis break location (percent). RCYCLE 0 Number of logarithmic cycles in the right axis. RINT 5 Right-axis intervals for tick marks. [4] RMAX 0 Right-axis maximum value. RMIN 0 Right-axis minimum value. ROTATE 0 Rotate plot: 0 = no rotation, 1 = 90 degrees, 2 = 180 degrees, and 3 = 270
degrees. RPERCENT 100 Percent of right axis used to position the limits. RSHIFT 0 Right-axis shift of tick marks and annotations (percent). RTICK 1 Controls length of the tick marks on the right axis. [2] SHADE 0 Shade in the histogram bars: 0=Hollow, 1=Solid, (2-39)=Hatch. SHADE value
40 fills the area with a gray value between black and white (see SHDGRAY). SHADE values 41-79 are the same as 1-39 except that the interior is filled with gray before the hatch pattern and outline are drawn.
SHDCOL -1 Shade color. [6] SHDGRAY 1 Gray area fill for SHADE values 41-79. The gray values range from 0 (black) to
1 (white). SHDLWT 1 Shade hatch line weight. [1] SIZFAC 0 Size factor. Controls size of everything. For negative values PLT does not
change the sizes from frame to frame. Positive values instruct PLT to compute sizes as if average axis length was equal to SIZFAC.
SMOOTH 0 Smooth the data. [3] SOLID 0 Solid symbols are produced if possible. [3] SORT 0 Sort data in order of increasing x values. [3] SPLINE 0 Draw a B-spline instead of connecting points for PLTYPE=2 or 3. STEM 0 Draw a stem plot instead of connecting points for PLTYPE=2 or 3. [3] SYMANG 0 Rotation angle of symbol (degrees counter-clockwise) relative to normal
orientation. SYMBOL 1 Symbol represents the number of symbol to plot (0-31). SYMSIZ 1 Symbol size. [2] TANSKP 0 Top annotation skip. [5] TAXIS 1 Top axis: 1=on, 0=off. TBREAK 0 Top-axis break location (percent). TCYCLE 0 Number of logarithmic cycles in the top axis. TICDIR 0 Tick direction: value of "inward” produces tick marks pointing inward.
Otherwise, they are outward. TICSIZ 1 Controls length of the tick marks on all axes. [2] TINT 5 Top-axis intervals for tick marks. [4] TMAX 0 Top-axis maximum value. TMIN 0 Top-axis minimum value. TPERCENT 100 Percent of top axis used to position the limits. TSHIFT 0 Top-axis shift of tick marks and annotations (percent). TTICK 1 Controls length of the tick marks on the top axis. [2] VXLLC 0 X dimension virtual page offset (inches). VYLLC 0 Y dimension virtual page offset (inches). WXLEN 10.5 X dimension virtual page length (inches). WXLLC 10.5 X dimension virtual page offset from lower-left corner (inches).
Page 23

WYLEN 8 Y dimension virtual page length (inches). WYLLC 8 Y dimension virtual page offset from lower-left corner (inches). XANSKP 0 X-axis annotation skip. [5] XAXIS 1 X axis: 1=on, 0=off. XBREAK 0 X-axis break location (percent). XCYCLE 0 Number of logarithmic cycles in the x-axis. XGAIN 1 Scale factor applied to X data before plotting. XINT 5 X-axis intervals. [4] XLEN 6 X-axis length (inches). XLLC 2.2 Location of lower-left corner of axes in x direction (inches). XMAX 10 X-axis maximum value. XMIN 0 X-axis minimum value. XOFST 0 Offset applied to x data before plotting. XPERCENT 100 Percent of x axis used to position the limits. XSHIFT 0 X-axis shift of tick marks and annotations (percent). XTICK 1 Controls length of the tick marks on the bottom axis. [2] YANSKP 0 Y-axis annotation skip. [5] YAXIS 1 Y axis: 1=on, 0=off. YBREAK 0 Y-axis break location (percent). YCYCLE 0 Number of logarithmic cycles in the y axis. YGAIN 1 Scale factor applied to Y data before plotting. YHOR 0 Place the labels on the y axis horizontally. [3] YINT 5 Y-axis intervals. [4] YLEN 6 Y-axis length (inches). YLLC 1.5 Location of lower-left corner of axes in y direction (inches). YMAX 10 Y axis maximum value. YMIN 0 Y axis minimum value. YOFST 0 Offset applied to y data before plotting. YPERCENT 100 Percent of y axis used to position the limits. YSHIFT 0 Y-axis shift of tick marks and annotations (percent). YTICK 1 Controls length of the tick marks on the left axis. [2] ZGAIN 1 Scale factor applied to z data before plotting. ZOFST 0 Offset applied to z data before plotting.
Note 1: Negative values select absolute line weights, positive values multiply the default line weight, and zero eliminates the lines.
Note 2: Positive values are used as multipliers of default size. Negative values are used as absolute size in inches.
Note 3: YES = Y = 1 and NO = N = 0.
Note 4: Intervals for tic marks are of the form MM.N where MM and N are the number of major and minor intervals respectively. Zero value indicates axis line with no tick marks.
Note 5: If set to zero, no annotations are to be skipped. Positive values indicate the number of annotations to be skipped. The first digit after the decimal point indicates the number of annotations skipped at the beginning of the axis. Negative values produce no annotations.
Note 6: These parameters select a predefined color index (0-15). A negative value for FGCOL, BGCOL, or FNCOL indicates that device default colors should be used. A negative value for all other color parameters indicates that the color should be set to the same value as FGCOL.
Note 7: The line pattern size controls the length of the dash plus space for line types greater than (or equal to) 1. Negative values select absolute pattern size in inches, positive values multiply the default pattern size.
Page 24

Note 8: A negative value for this parameter indicates the fill color should be the same value as PLTCOL. A positive value is an index into the PLT color palette.
Note 9: Arrowheads are only drawn for PLTYPE=2 (lines). If AROTIP is greater than 0, then arrowhead will be filled with color specified by SHDCOL.
3.2.9. List of String Parameters String parameters are followed by an equal sign and a string. Only the first four characters are necessary to specify a parameter name. The default value of all string parameters is a NULL string. RANNOT Right-axis annotation. RFMT Right-axis annotation format. RLABEL Right-axis label. SELECT Logical expression specifying selection of data rows. TANNOT Top-axis annotation. TFMT Top-axis annotation format. TLABEL Top-axis label. XANNOT X-axis annotation. XDATA X data definition. XFMT X-axis annotation format. XLABEL X-axis label. YANNOT Y-axis annotation. YDATA Y data definition. YFMT Y-axis annotation format. YLABEL Y-axis label. ZDATA Z data definition.
The parameters XDATA, YDATA, and ZDATA are interpreted as arithmetic expressions that may include column numbers, which are specified as $1, $2, …, $64.
3.3. Messages Users can place text messages inside or outside plot frames. Features of messages are (a) multiple messages may be defined and plotted without intervening PLOT commands, (b) text can be superscripted and subscripted, (c) symbols can be inserted in message strings.
"texttexttexttext"
Message strings are defined by leading and trailing double-quote marks. The message is the text inside the quotation marks, and the quotation marks do not appear on the plot. Message text may occupy several lines. The message position may be specified on the same line as (and immediately preceding) the opening double-quote mark. This provides an alternative (and often more convenient) way of setting the message parameters MXLLC and MYLLC. Messages are plotted as they are encountered in the PLT file.
Several characters are treated as special characters when they appear in the message text. A dollar sign $ may be used as a space-holder, and is converted into a blank before plotting the message. A caret ^ is used to switch between the standard font and alternate font (see Fig. 7).
Symbols in message strings are defined by enclosing the number of the desired symbol in vertical bars like this: |number| An asterisk in place of a symbol number instructs PLT to use the value of the SYMBOL parameter to determine the symbol number. Symbols in message lines are plotted at the same size of the text characters in the message, unless modified by the MVKEY parameter. If the number within the vertical bars is preceded by an underscore character like |_number| then a short line is inserted into the message instead of a symbol. The line type is determined by the number and the length of the line is controlled by the parameter MHKEY. If the number within the vertical bars is preceded by a number character like |#number|, then a small box is inserted into the message which is filled with a pattern
Page 25

determined by the value of the number. The height and width of this "shade box" are controlled by the parameters MVKEY and MHKEY. For convenience, PLT parameters may be assigned new values after the number within vertical bars, but must be separated by commas with no spaces.
Figure 7. Standard and Alternate Fonts
The user can define superscripted text by bounding the text string with { and }. Likewise, subscripted text is bounded by [ and ]. The brackets do not appear in the message. The user can force a literal interpretation of special characters such as {, }, [, ], \, “, $, *, ^, ;, and | by immediately preceding them with a backslash \.
The following list summarizes the usage of all special characters.
[str] Subscript str. {str} Superscript str. ^str^ Shift to alternate font for str. |str| If str is null or "*", then the current symbol is inserted. If str is a number (0-31), then the symbol
with the corresponding number is inserted. If the number is preceded by '_' then a line with corresponding line type is inserted. If the number is preceded by '#' then a box with corresponding shade type is inserted. Otherwise, str and the surrounding "|" are taken literally.
$ Replace "$" in string with space. ; Begin comment.
Page 26
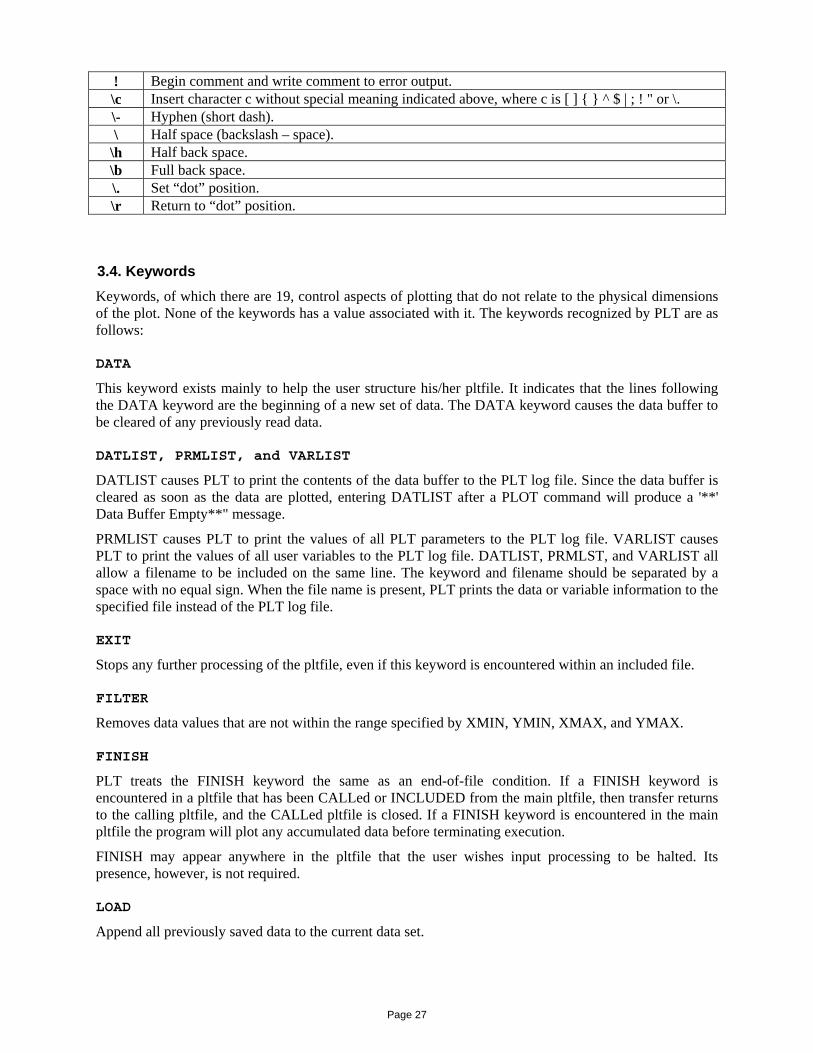
! Begin comment and write comment to error output. \c Insert character c without special meaning indicated above, where c is [ ] { } ^ $ | ; ! " or \. \- Hyphen (short dash). \ Half space (backslash – space).
\h Half back space. \b Full back space. \. Set “dot” position. \r Return to “dot” position.
3.4. Keywords Keywords, of which there are 19, control aspects of plotting that do not relate to the physical dimensions of the plot. None of the keywords has a value associated with it. The keywords recognized by PLT are as follows:
DATA
This keyword exists mainly to help the user structure his/her pltfile. It indicates that the lines following the DATA keyword are the beginning of a new set of data. The DATA keyword causes the data buffer to be cleared of any previously read data.
DATLIST, PRMLIST, and VARLIST
DATLIST causes PLT to print the contents of the data buffer to the PLT log file. Since the data buffer is cleared as soon as the data are plotted, entering DATLIST after a PLOT command will produce a '**' Data Buffer Empty**" message.
PRMLIST causes PLT to print the values of all PLT parameters to the PLT log file. VARLIST causes PLT to print the values of all user variables to the PLT log file. DATLIST, PRMLST, and VARLIST all allow a filename to be included on the same line. The keyword and filename should be separated by a space with no equal sign. When the file name is present, PLT prints the data or variable information to the specified file instead of the PLT log file.
EXIT
Stops any further processing of the pltfile, even if this keyword is encountered within an included file.
FILTER
Removes data values that are not within the range specified by XMIN, YMIN, XMAX, and YMAX.
FINISH
PLT treats the FINISH keyword the same as an end-of-file condition. If a FINISH keyword is encountered in a pltfile that has been CALLed or INCLUDED from the main pltfile, then transfer returns to the calling pltfile, and the CALLed pltfile is closed. If a FINISH keyword is encountered in the main pltfile the program will plot any accumulated data before terminating execution.
FINISH may appear anywhere in the pltfile that the user wishes input processing to be halted. Its presence, however, is not required.
LOAD
Append all previously saved data to the current data set.
Page 27

NEWFRAME
This keyword instructs PLT to begin a new plot frame on the current page. NEWFRAME is the command given when the user wants to end one plot frame and put another plot frame on the same page, and is used when multi-panel plots are desired.
NEWPAGE
NEWPAGE instructs PLT to advance to a new page.
NEWRANGE
This keyword instructs PLT to begin a new data range within the current frame. NEWRANGE is the command given when the user wants to plot more than one data range on the same axis.
PALETTE
Interprets X, Y, and Z data values as red, green, and blue components (RGB) of a new color palette. These palette colors may subsequently be referenced by their sequential number when setting the value of any PLT parameter that specifies a color.
PLAY
Tells PLT to interpret the data as musical notes. The X value specifies the frequency of the note in Hertz and the Y value specifies the duration of the note in seconds. (Not currently implemented.)
PLOT and KEEP
This instructs PLT to plot a frame based on the current values of all of the parameters and existing data. After a PLOT command has been given, the data buffer is cleared. KEEP is the same as PLOT except that the data are retained for subsequent plotting.
RESET
This keyword causes all parameter values and internal status flags to be reset to their default values, i.e., their initial values when the PLT program begins execution.
SAVE
Stores the current data set for later retrieval using the keyword LOAD. This keyword also empties the current data set.
STAT
Calculates simple statistics based on the current data set and stores the results as internal variables. See the Internal Variables section (4.1) for a list of variables set by the STAT keyword.
UWPH
Unwraps phase assuming that the Y data values represent phase in cycles. The first Y value is unaltered and subsequent values are adjusted as needed, by adding or subtracting an integer value, so that the difference between adjacent phases will not be greater than 0.5.
3.5. Data Values Data values may be put into PLT's data buffer by entering X,Y,Z values into the pltfile and have PLT interpret them. These values are interpreted such that the first two values correspond to the X- and Y-
Page 28

coordinates of the datum, and the third or Z value corresponds to an error measure for Y that, if it exists, is plotted as an error bar. Histogram bin values occupy only the X value.
Valid data values are interpreted automatically by PLT. The user need not precede data values with a DATA keyword. Consider the following two data lists:
(1) (2)DATA 010,10 420,20,3 1030 5
Sequence (1) causes three values to be read and put at the current end of the data buffer. The first value has an X-coordinate of 10 and a Y-coordinate of 10, with no error bar. The second value has X- and Y-coordinates of 20, with an error bar three units long on either side. The third value has an X-axis coordinate of 30. The Y-coordinate, since it is unspecified, is set to 0. Sequence (2) causes PLT to read 4 values into the data buffer, assigning them to consecutive X-axis values. Each Y-value is zero. These are valid histogram bin values.
Data values may also be written as arithmetic expressions including operators for addition, subtraction, multiplication, division, and exponentiation (+, -, *, /, and '). The arithmetic expressions may reference parameter values or user variables. Parentheses can be used to group arithmetic expressions and may be required in some cases for proper interpretation by the PLT program.
Data are added to the buffer as they occur in the pltfile. It is only when a PLOT, NEWFRAME, NEWPAGE, or FINISH command is given that they are actually plotted and the data buffer is cleared.
3.6. Auxiliary Files These parameters instruct PLT to switch the input to another file. The operation is as follows:
BDATA datafile
PLT can also read binary data files using the BDATA command. The "datafile" contains integer data values preceded by a short header. The header contains four, two-byte integers. (1) A magic number (12345 decimal) for identification as a PLT binary data file, (2) the number of bytes (must be 2) per integer value in the following data, (3) the number of coordinate values (x,y,z) specified for each data point (must be 1, 2, or 3), and (4) the number of data points in the file. The default filename extension is ".dat".
CALL filespec INCLUDE filespec
These parameters cause PLT to open the pftfile named "filespec" and take subsequent input from it, continuing until that pltfile is exhausted or until a FINISH command is encountered. When this happens, the CALLed pltfile is closed, and control reverts back to the original pltfile at the line following the CALL command. INCLUDE files may be nested to a depth of 15. The default filename extension is ".plt".
STDFNT fontfile ALTFNT fontfile SYMFNT fontfile
PLT can use external files to redefine the normal text characters and symbols. STDFNT redefines the standard character font, ALTFNT redefines the alternate character font, and SYMFNT redefines the
Page 29
symbol font. The fontfiles are created and modified by a separate program called PLTFNT. If PLT encounters one of these keywords without a fontfile argument, then the corresponding font reverts to its internal definition. The default filename extension is ".pft".
3.7. Macros and Functions Macros are sections of PLT commands that are given a name, so that those PLT commands may be repeatedly invoked simply by specifying the name of the macro. A macro that is defined on a single line may be used as a function in any subsequent arithmetic expression. In addition to user-defined macros and functions, PLT provides several predefined macros and functions.
3.7.1 Macros Macros are invoked by a line that begins with "%macro_name" followed by up to 99 arguments (delimited by spaces). There are five internal macros, %define, %undefine, %repeat, %for, and %msg. %define <macro_name>
New macros may be defined using the %define macro. The first argument of %define is the new macro name (without the % character) and the second argument may contain the body of the new macro. If the %define macro has no second argument, the body of the new macro will be obtained from the succeeding lines of the pltfile up to a line that begins with “%%". Occurrences of $1, $2 ... $99 within the body of the macro are replaced by arguments when the new macro is invoked. %undefine <macro_name>
The %undefine macro removes the macro definition. %msg <x> <y> <format> …
Formatted messages are produced by the %msg macro. The first two arguments are the x and y locations used to locate the message on the plot. The third argument is a format string, which may contain C-style, floating-point format specifications embedded in text. For each floating-point specification in the format string, there should be an additional argument with an arithmetic expression for the value of the corresponding floating-point number. %repeat <count>
The %repeat macro is similar to the %define macro except that the first argument is a repeat count instead of a new macro name. Any occurrence of $0 in the macro body will be replaced by an index of the current iteration. %for <item> …
The %for macro is similar to the %repeat macro except that the number of repetitions is determined by the number of arguments on the first line. Any occurrence of $0 in the macro body of %for will be replaced by an index of the current iteration. Any occurrence of $1 in the body of %for will be replaced by the corresponding argument on the first line.
In addition to these internal macros, PLT has one pre-installed macro. A pre-installed macro differs from an internal macro in that its definition can be replaced by a new definition or removed by %undefine. %straline <slope> <y_intercept> <lintype> <x1> <x2>
draws a line between x1 and x2 with the specified slope, y_intercept, and lintype, and also assigns to variables a & b the y-values at x1 & x2.
3.7.2 Functions Any macro that is defined by a single arithmetic statement may also be used as a function within another arithmetic statement. Functions are invoked by the function name followed by parentheses. Any function
Page 30

arguments are delimited by commas within the parentheses. In addition to user-defined functions, there are several pre-defined functions:
abs(x) absolute value of x
atan(x) arctangent of x
atanh(x) inverse hyperbolic tangent of x
ceil(x) least integer greater than x
cos(x) cosine of x
cms(x,y) complex magnitude squared
cmr(x,y,u,v) complex multiply real part
cmi(x,y,u,v) complex multiply imaginary part
cdr(x,y,u,v) complex divide real part
cdi(x,y,u,v) complex divide imaginary part
erf(x) error function of x
exp(x) natural number e to the power of x
floor(x) greatest integer less than x
ifelse(c,x,y) returns x if c is non-zero, otherwise returns y
limit(a,x,b) returns a if x is less than a, returns b if x is greater than b, otherwise returns x
ln(x) natural logarithm of x
log(x) base 10 logarithm of x
max(x,y,...) maximum value of x, y, ...
min(x,y,...) minimum value of x, y, ...
round(n) nearest integer
select(n,...) return the nth argument after the first argument
sin(x) sine of x
sqrt(x) square-root of x
tan(x) tangent of x
tanh(x) hyperbolic tangent of x
xdat(i) returns the i-th value from the x-data list
xsav(i) returns the i-th value from the x-save list
ydat(i) returns the i-th value from the y-data list
ysav(i) returns the i-th value from the y-save list
zdat(i) returns the i-th value from the z-data list
zsav(i) returns the i-th value from the z-save list
zdev(p) converts percentile score to z-score
ztop(z) converts z-score to percentile score
Page 31
4. Arithmetic Expressions Arithmetic expressions may also include the name of any numeric parameter, internal variable, internal function, or single-line, user-defined macro. The value of any numeric parameter may be specified as an arithmetic expression. When specifying a numeric parameter, if the first character is “n” or “y”, the value is taken to be 0 or 1, respectively. Certain numeric parameters (mhalign, mvalign, pltype, and ticdir) give additional special meaning to the first character.
Several string parameters (xdata, ydata, zdata, and select) may also be specified by arithmetic expressions. The evaluation of these expressions is deferred until data are read. Data columns are referenced within these expressions as $1, $2, …, $64. Data rows may be conditionally included by specifying a logical expression for the selected parameter..
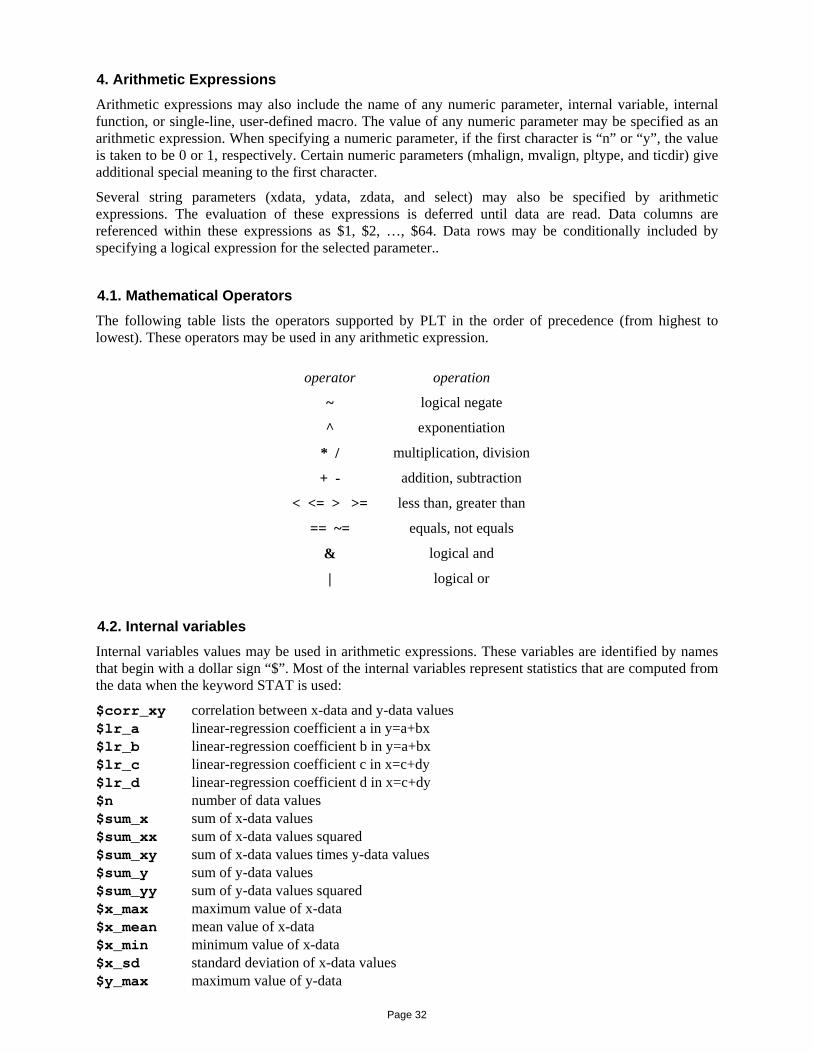
4.1. Mathematical Operators The following table lists the operators supported by PLT in the order of precedence (from highest to lowest). These operators may be used in any arithmetic expression.
operator operation
~ logical negate
^ exponentiation
* / multiplication, division
+ - addition, subtraction
< <= > >= less than, greater than
== ~= equals, not equals
& logical and
| logical or
4.2. Internal variables Internal variables values may be used in arithmetic expressions. These variables are identified by names that begin with a dollar sign “$”. Most of the internal variables represent statistics that are computed from the data when the keyword STAT is used:
$corr_xy correlation between x-data and y-data values $lr_a linear-regression coefficient a in y=a+bx $lr_b linear-regression coefficient b in y=a+bx $lr_c linear-regression coefficient c in x=c+dy $lr_d linear-regression coefficient d in x=c+dy $n number of data values $sum_x sum of x-data values $sum_xx sum of x-data values squared $sum_xy sum of x-data values times y-data values $sum_y sum of y-data values $sum_yy sum of y-data values squared $x_max maximum value of x-data $x_mean mean value of x-data $x_min minimum value of x-data $x_sd standard deviation of x-data values $y_max maximum value of y-data
Page 32

$y_mean mean value of y-data $y_min minimum value of y-data $y_sd standard deviation of y-data values There are five additional internal variables: $device number of the current output device $random random number, uniformly distributed between zero and one. $x current x-data value, useful for defining y=f($x) $y current y-data value $z current z-data value
5. Error Messages The possible error messages generated by the PLT program are listed below. When an error is encountered, the PLT program will attempt to open a log file named 'plt.log'. Subsequent error messages will be written to the log file.
5.1. Fatal Errors The errors in this section are the most severe and will cause the PLT program to terminate.
ERROR: Can't allocate memory for data arrays.
An error was encountered when trying to allocate memory for the X,Y,Z data arrays. The program probably needs more memory to run successfully.
plt can't open file ...
The PLT file specified on the command line was not found or could not be opened for reading. If no extension was specified in the filaname, the PLT program will first look for a file with no extension and then for a file with a ".pit" extension before printing this error message.
plt can't open device #...
An error was encountered opening the PLT output device. The number indicates which device was being opened. See the PLT manual page for device information.
5.2. Warnings The errors in this section are less severe and the PLT program will continue to process the remainder of the pltfile.
… is not a valid keyword
A line with no ‘=’ begins with a word (... ) that is not recognized as a valid keyword.
*** BAD header in BDATA file: ...
There is an error in the header of the binary data file (... ).
*** can't open BDATA file: ... Either the binary data file (... ) wasn't found or it couldn't be opened for reading.
Page 33
*** can't open FONT file: ... An error was encountered trying to open a font file ( ... ). Either the file does not exist or an error was made specifying the file name.
*** can't open INCLUDE or CALL file: ... Either the INCLUDE file (... ) wasn't found or it couldn't be opened for reading.
*" FONT file has incorrect format: ... The PLT program has found invalid data in the font file ( ... ) header. The file is not a valid font file.
*** not enough memory to load FONT file:
The specified font file (... ) cannot be loaded because available memory is insufficient. An internal font definition will be used.
cnglun: tried to close invalid file
This indicates a programming error and should never be encountered in normal use.
Data Buff or Empty
A DATLIST command was encountered, but there's no data to list.
error keyboard DATA input requested
The PLT facility for inputting data from the console as the pltfile is being processed should not be used when the graphics output of the PLT program is also directed to the console screen.
error in data value: …
Syntax error encountered while trying to parse a line ( ... ) that seemed to be a data value line.
ERROR: too many data points for spline smoothing
The spline computation needs temporary space in the data buffer and the size of the data buffer (2048) is inadequate. The value of the spline parameter should be decreased.
Illegal CALL/INCLUDE nesting
INCLUDE files are nested too deep. The maximum is 15 levels of nested include files.
Invalid Parameter : …
A line with an equals sign “=” was encountered in the PLT file, but the word (... ) at the beginning of the line was not recognized as a valid parameter.
Unknown command: …
PLT encountered a line (... ) in the pltfile which was not recognized as a valid command line. This line probably begins with a character which is not a number or a letter.
Page 34
WARNING: error reading binary data
An error was encountered while reading from a binary data (BDAT) file.
WARNING: Number of data points exceeds buffer size.
There is a fixed size for the data buffer (2048). If this data buffer becomes full while reading data from the pltfile, then a plot keyword is automatically inserted to flush the buffer.
Page 35
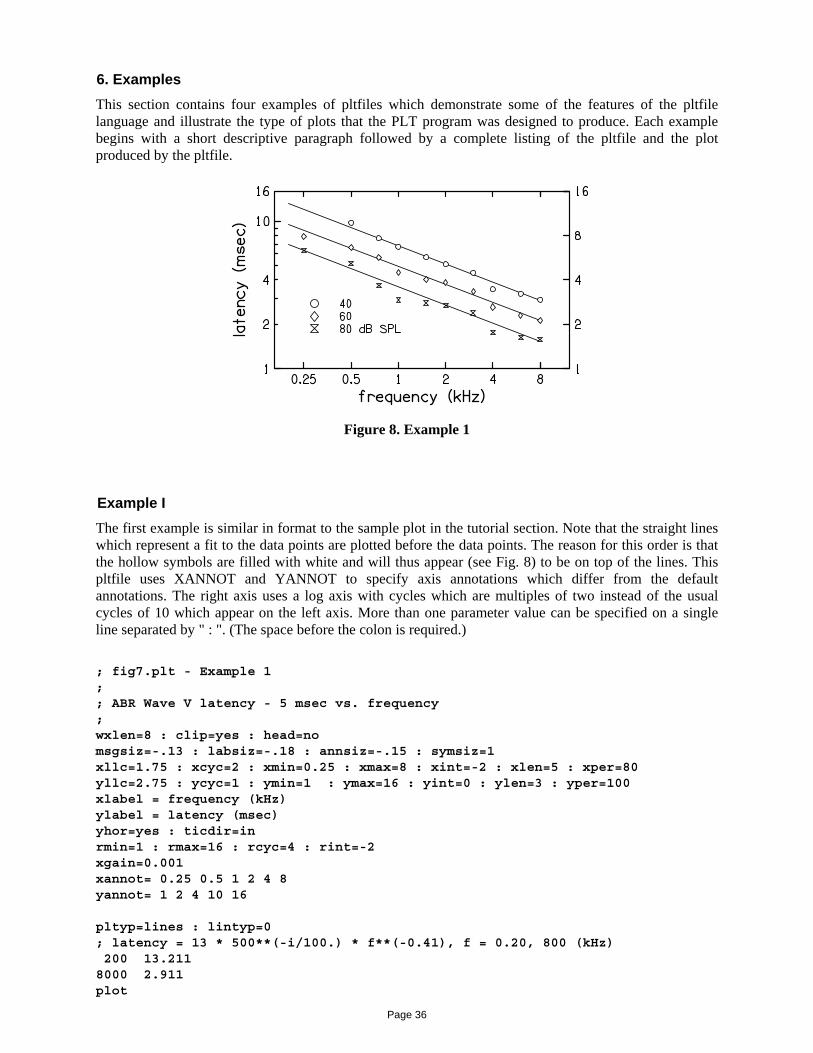
6. Examples This section contains four examples of pltfiles which demonstrate some of the features of the pltfile language and illustrate the type of plots that the PLT program was designed to produce. Each example begins with a short descriptive paragraph followed by a complete listing of the pltfile and the plot produced by the pltfile.
Example I The first example is similar in format to the sample plot in the tutorial section. Note that the straight lines which represent a fit to the data points are plotted before the data points. The reason for this order is that the hollow symbols are filled with white and will thus appear (see Fig. 8) to be on top of the lines. This pltfile uses XANNOT and YANNOT to specify axis annotations which differ from the default annotations. The right axis uses a log axis with cycles which are multiples of two instead of the usual cycles of 10 which appear on the left axis. More than one parameter value can be specified on a single line separated by " : ". (The space before the colon is required.)
Figure 8. Example 1
; fig7.plt - Example 1 ; ; ABR Wave V latency - 5 msec vs. frequency ; wxlen=8 : clip=yes : head=no msgsiz=-.13 : labsiz=-.18 : annsiz=-.15 : symsiz=1 xllc=1.75 : xcyc=2 : xmin=0.25 : xmax=8 : xint=-2 : xlen=5 : xper=80 yllc=2.75 : ycyc=1 : ymin=1 : ymax=16 : yint=0 : ylen=3 : yper=100 xlabel = frequency (kHz) ylabel = latency (msec) yhor=yes : ticdir=in rmin=1 : rmax=16 : rcyc=4 : rint=-2 xgain=0.001 xannot= 0.25 0.5 1 2 4 8 yannot= 1 2 4 10 16 pltyp=lines : lintyp=0 ; latency = 13 * 500**(-i/100.) * f**(-0.41), f = 0.20, 800 (kHz) 200 13.211 8000 2.911 plot
Page 36

200 9.575
6.940
type=1 : lintype=4 dB
mbol = 4 ; 60 dB
mbol = 5 ; 80 dB
gsiz=-.13
B SPL
8000 2.110 plot 200 8000 1.529 plot plsymbol = 1 ; 40 500 9.77 750 7.65 1000 6.74 1500 5.69 2000 5.13 3000 4.47 4000 3.46 6000 3.23 8000 2.94 plot sy 250 7.91 500 6.64 750 5.69 1000 4.51 1500 4.04 2000 3.83 3000 3.35 4000 2.62 6000 2.31 8000 2.12 plot sy 250 6.33 500 5.17 750 3.67 1000 2.93 1500 2.80 2000 2.69 3000 2.40 4000 1.76 6000 1.63 8000 1.58 plot ms0.6 1.25 " |1| 40 |4| 60 |5| 80 d"
Page 37

Figure 9. Example 2
Example II The four-panel plot in Fig. 9 is created using four frames in the pltfile. Note the use of XANSKP and YANSKP in the pltfile to suppress annotations where they would be inappropriate. The axis labels must be done with messages to position them properly. Note the use of user defined variables (a, b, c, and d) in the pftfile to control the positioning of the frames and the positioning of the message inside each frame. Also, note the shift to the alternate font in the second message to obtain the Greek letter mu.
; fig8.plt - Example 2 ; ; Gap detection for four subjects for apical-basal ; and mono-bipolar comparisons ; a=1.7 : b=1.2 : c=0.4 : d=0.9 xllc=a : xlen=4 : xmin=20 : xmax=1000 : xcyc=3 : xper=80 yllc=b : ylen=3 : ymin=1 : ymax=64 : ycyc=6 : yper=80 : yint=-2 head=0 : ticdir=inward : annsiz = 1.5 : yhor=yes msgsize=2 : mhalign=center xlen, 6.2, "Cochlear Implant Gap Detection" msgsize=2.5 xlen, -.7, "Level (^m^A)" msgangle=90 -.6, ylen, "Gap Threshold (msec)" msgsize=1.25 : msgangle=0 : mhalign=left pltype=both : lintype=0 : symsiz=1 : axlwt=1.5
Page 38
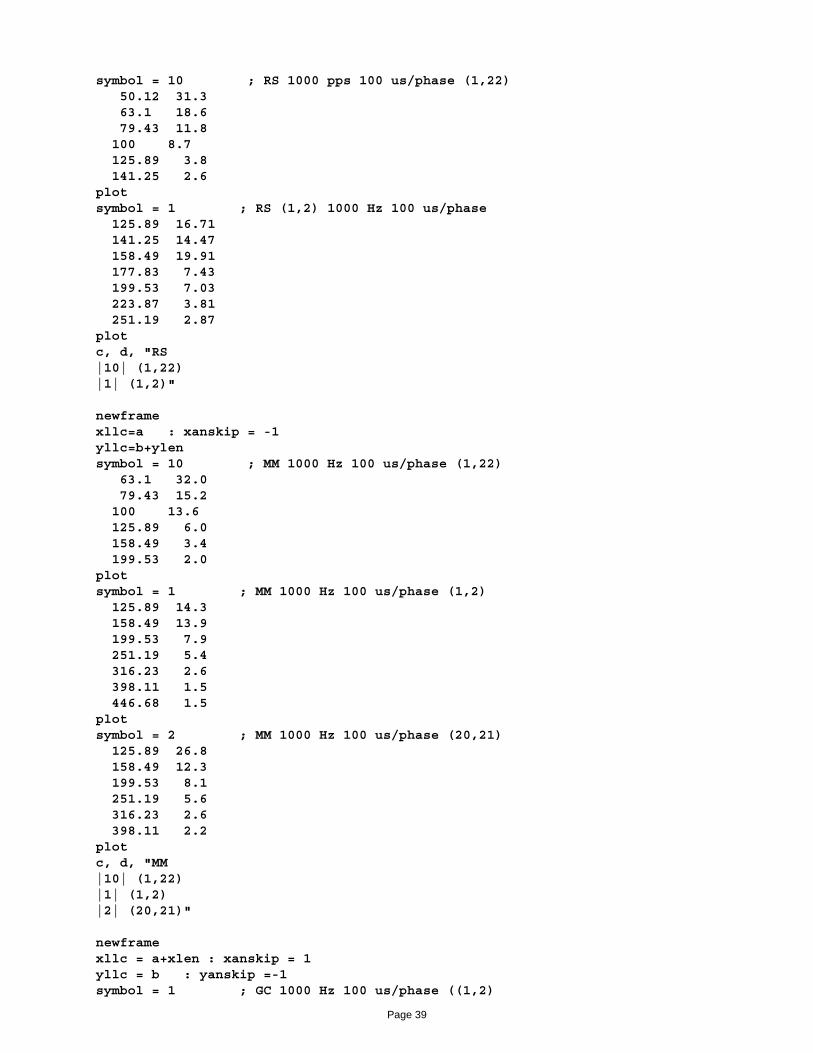
symbol = 10 ; RS 1000 pps 100 us/phase (1,22) 50.12 31.3 63.1 18.6 79.43 11.8 100 8.7 125.89 3.8 141.25 2.6 plot symbol = 1 ; RS (1,2) 1000 Hz 100 us/phase 125.89 16.71 141.25 14.47 158.49 19.91 177.83 7.43 199.53 7.03 223.87 3.81 251.19 2.87 plot c, d, "RS |10| (1,22) |1| (1,2)" newframe xllc=a : xanskip = -1 yllc=b+ylen symbol = 10 ; MM 1000 Hz 100 us/phase (1,22) 63.1 32.0 79.43 15.2 100 13.6 125.89 6.0 158.49 3.4 199.53 2.0 plot symbol = 1 ; MM 1000 Hz 100 us/phase (1,2) 125.89 14.3 158.49 13.9 199.53 7.9 251.19 5.4 316.23 2.6 398.11 1.5 446.68 1.5 plot symbol = 2 ; MM 1000 Hz 100 us/phase (20,21) 125.89 26.8 158.49 12.3 199.53 8.1 251.19 5.6 316.23 2.6 398.11 2.2 plot c, d, "MM |10| (1,22) |1| (1,2) |2| (20,21)" newframe xllc = a+xlen : xanskip = 1 yllc = b : yanskip =-1 symbol = 1 ; GC 1000 Hz 100 us/phase ((1,2)
Page 39

35.48 47.2 44.67 38.7 56.23 36.34 70.79 11.47 89.13 12.5 112.2 6.62 141.25 5.73 177.83 3.72 199.53 3.12 plot symbol = 2 ; GC 1000 Hz 100 us/phase (15,16) 251.19 26.55 316.23 19.81 398.11 10.22 501.19 11.11 562.34 8.1 630.96 3.51 707.95 2.95 plot symbol = 10 ; GC 1000 Hz 100 us/phase (1,16) 35.48 21.65 44.67 5.88 56.23 7.43 70.79 3.82 89.13 4.41 112.2 3.04 plot c, d, "GC |10| (1,16) |1| (1,2) |2| (15,16)" newframe xllc=a+xlen : xanskip = -1 yllc=b+ylen : yanskip = -1 symbol = 10 ; BC (1,22) 1000 pps 100 us/phase 39.81 40.77 50.12 15.29 63.1 5.24 79.43 5.2625 100 2.78 plot symbol = 2 ; BC (10,11) 1000 pps 100 us/phase 316.23 26.34 398.11 10.83 501.19 6.25 630.96 4.94 794.33 2.7 1000 1.97 plot symbol = 1 ; BC (1,3) 1000 pps 100 us/phase 223.87 12.11 251.19 8.33 281.84 5.24 316.23 4.81 354.81 3.04 398.11 2.14 446.68 2.02
Page 40

plot c, d, "RC |10| (1,22) |1| (1,3)
Page 41

Figure 10. Example 3
Example III This example uses the histogram style plot (PLTYPE=4) to create a vertical bar chart (see Fig. 10). Four separate histograms are plotted, each with a different SHADE value. Note the use of shade boxes in the message to provide a key to the meaning of each SHADE value. Also, note the use of EBNUM=L to obtain only the upper error bars at the top of the histogram bins. ; fig9.plt - Example 3 ; ; Mecamylamine Pump Study (3 Day) ; head=no : openax=yes : ticdir=out : yhor=yes xlen=8 : xllc=1.9 : xmin=2 : xmax=18 : xper=80 ylen=6 : yllc=1.4 : ymin=0 : ymax=0.14 xint=0 : xfmt=i3 : xanskip=-1 yint=14 : yfmt=f6.2 : yanskip=1 ylabel=pmol/mg protein %define bars ; <order> <shade> <data1> <data2> <data3> pltype=histo : ebnum=1 : shade=$2 %repeat ($1-1) 0 $3 %repeat 5 0 $4 %repeat 5 0 $5
Page 42
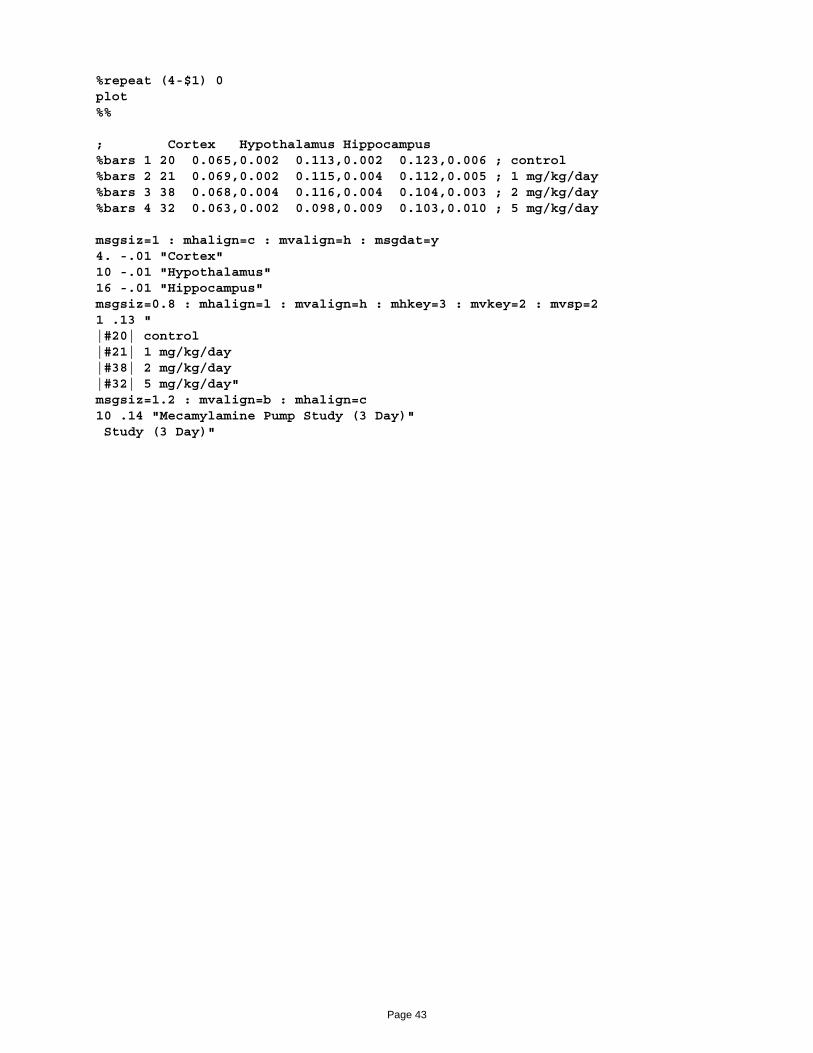
%repeat (4-$1) 0 plot %% ; Cortex Hypothalamus Hippocampus %bars 1 20 0.065,0.002 0.113,0.002 0.123,0.006 ; control %bars 2 21 0.069,0.002 0.115,0.004 0.112,0.005 ; 1 mg/kg/day %bars 3 38 0.068,0.004 0.116,0.004 0.104,0.003 ; 2 mg/kg/day %bars 4 32 0.063,0.002 0.098,0.009 0.103,0.010 ; 5 mg/kg/day msgsiz=1 : mhalign=c : mvalign=h : msgdat=y 4. -.01 "Cortex" 10 -.01 "Hypothalamus" 16 -.01 "Hippocampus" msgsiz=0.8 : mhalign=l : mvalign=h : mhkey=3 : mvkey=2 : mvsp=2 1 .13 " |#20| control |#21| 1 mg/kg/day |#38| 2 mg/kg/day |#32| 5 mg/kg/day" msgsiz=1.2 : mvalign=b : mhalign=c 10 .14 "Mecamylamine Pump Study (3 Day)" Study (3 Day)"
Page 43
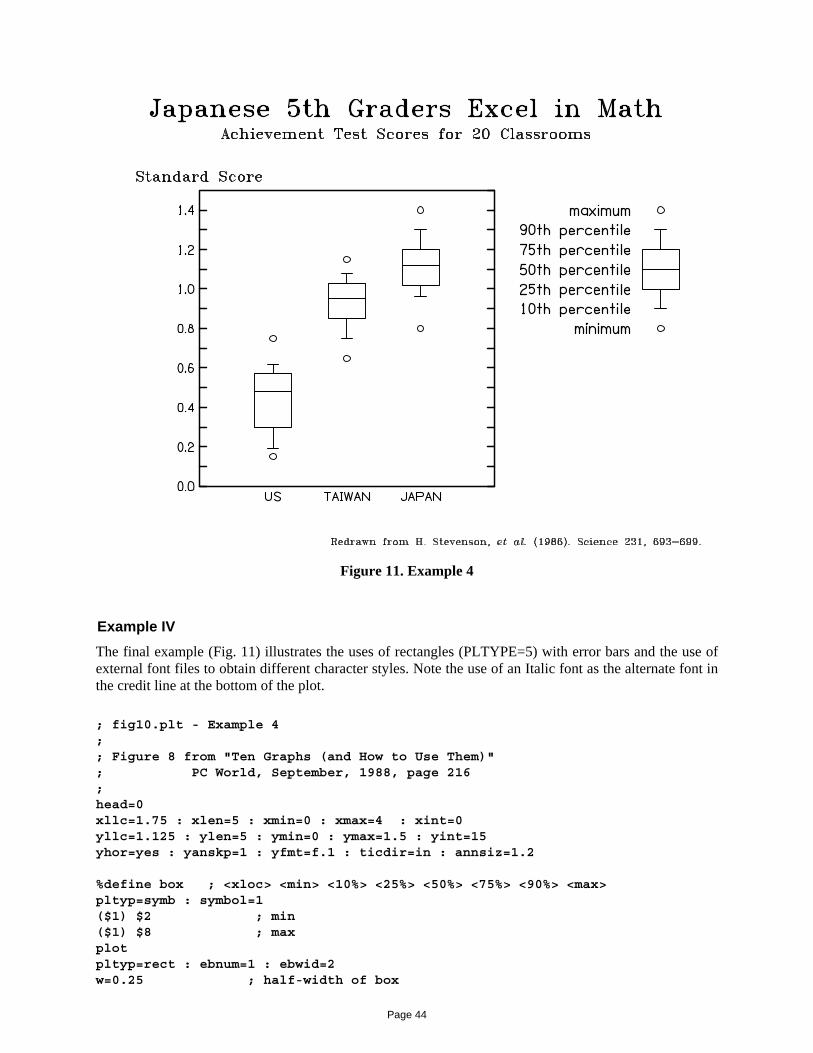
Figure 11. Example 4
Example IV The final example (Fig. 11) illustrates the uses of rectangles (PLTYPE=5) with error bars and the use of external font files to obtain different character styles. Note the use of an Italic font as the alternate font in the credit line at the bottom of the plot. ; fig10.plt - Example 4 ; ; Figure 8 from "Ten Graphs (and How to Use Them)" ; PC World, September, 1988, page 216 ; head=0 xllc=1.75 : xlen=5 : xmin=0 : xmax=4 : xint=0 yllc=1.125 : ylen=5 : ymin=0 : ymax=1.5 : yint=15 yhor=yes : yanskp=1 : yfmt=f.1 : ticdir=in : annsiz=1.2 %define box ; <xloc> <min> <10%> <25%> <50%> <75%> <90%> <max> pltyp=symb : symbol=1 ($1) $2 ; min ($1) $8 ; max plot pltyp=rect : ebnum=1 : ebwid=2 w=0.25 ; half-width of box
Page 44
($1-w) $4 ($4-$3) ; 10 & 25 percentile ($1+w) $5 ; 50 percentile ($1-w) $6 ($7-$6) ; 75 & 90 percentile ($1+w) $5 ; 50 percentile plot %% u=1 : t=2 : j=3 : k=6.25 xanno= u,US t,TAIWAN j,JAPAN ; min 10% 25% 50% 75% 90% max %box u 0.15 0.19 0.30 0.48 0.57 0.62 0.75 ; US %box t 0.65 0.75 0.85 0.95 1.03 1.08 1.15 ; TAIWAN %box j 0.80 0.96 1.02 1.12 1.20 1.30 1.40 ; JAPAN %box k 0.80 0.90 1.00 1.10 1.20 1.30 1.40 ; KEY m=k-0.4 : p=-1/72 msgdat=yes : mhalign=right : mvalign=half : msgsiz=12*p (m) 1.4 "maximum" (m) 1.3 "90th percentile" (m) 1.2 "75th percentile" (m) 1.1 "50th percentile" (m) 1.0 "25th percentile" (m) 0.9 "10th percentile" (m) 0.8 "minimum" stdfnt trprom altfnt trpita msgdat=no : mhalign=center : mvalign=bottom : msgsiz=12*p : m=0.1 0 ylen+m "Standard Score" mxdat=no : mhalign=center : mvalign=base : msgsiz=20*p 3.5 6.250 "Japanese 5th Graders Excel in Math" msgsiz=12*p 3.5 5.875 "Achievement Test Scores for 20 Classrooms" mhalign=right : mvalign=bottom : msgsiz=8*p : m=0.1-yllc 8.5 m "Redrawn from H. Stevenson, ^et al.^ (1986). Science 231, 693-699."
Page 45
Acknowledgments The development of the PLT program has been partially funded by various grants from the National Institutes of Health (NIH-NIDCD) and the National Science Foundation. PLT was first designed and written in Fortran for the Psychoacoustics Laboratory at BTNRH in about 1980. The program was maintained and expanded by Eric Javel and Michael Collins in the early 80’s and then by Stephen Neely in the late 80’s. Matt Prucka spent a summer helping to design the font used for PLT characters. Theresa Langer contributed to an earlier version of the PLT User’s Manual. Edward Carney wrote an expanded PLT User’s Guide in 1991 for version 4.0. Brenda Hoover improved the current version of this document.
Page 46
Appendix A. Graphical Output Formats Besides displaying plots on the user’s console, PLT can also export plots to the following vector-graphic file formats.
• Tektronix 4663 pen-plotter language [0]
• Tektronix 4010 graphics-terminal language. [1]
• Imagen Impress language [2]
• Hewlett-Packard HPGL plotter language [3]
• Console output [4]
• Adobe PostScript (PS) [5]
• Computer Graphics Metafile (CGM) [6]
• Enhanced Meta-File (EMF) [7]
• Scalable Vector Graphics (SVG) [8]
In DOS and Linux versions of PLT, the number in brackets following each gaphic format may be used to specify this format as a command line option –mN.
In Windows version of PLT, the the File/Export options are EPS, PS, CGM, EMF, and SVG. The EPS format is identical to the PS format except that (1) the BoundingBox is copied to the file header and (2) the plot is rotated from Landscape to Portrait orientation. The default export format is EPS.
The PS (or EPS) format is preferable for publication-quality figures in professional journals or book chapters. The EMF format is preferable for inserting into Microsoft Word documents or PowerPoint presenations. The SVG format is a word-wide-web standard for vector graphics.
Page 47

Appendix B. External Font Files PLT has two internal fonts that are named “standard” and “alternate.” Within any message or label the caret character “^” switches between these two fonts.
The internal fonts may be replaced by external fonts that are stored in specially-formated binary files. For example, the PLT command “stdfnt filename” replaces the standard font with the external font stored in the “filename.pft”. Likewise, the PLT command “altfnt filename” replaces the alternate font. The external font must be located either in the current directory or in a special font directory (The font directory is c:\fonts on a Windows PC or /usr/local/lib/pltfont on a Linux computer.)
A separate, command-line program called PLTFNT is used to create and view PLT font files. The characters in a font are initially defined by a .TXT file that specifies the strokes required to draw each character. PLTFNT converts the font described in a .TXT file into the binary .PFT file used by PLT. PLTFNT can also convert a .PFT file back into a .TXT file. Fonts may be modified by editing the .TXT file with any text editor.
For example, to modify the character “a” in an existing PLT font called smprom, first covert the .PFT file to a .TXT file using the command “pltfnt –t smprom”. This creates a new file “smprom.txt” from the existing file “smprom.pft”. The entire set of characters contained in the font may be viewed using the command “pltfnt –s smprom”. This step identifies the character “a” as having the ASCII code 97. This character may be viewed by itself using the command “pltfnt –s97 smpfont”.
To add an accent over the character “a”, open the file smprom.txt in a text editor and look at the fourth line, which starts with “fval”. The third number on this line indicates that the “cap” position for this set of characters is “12” and the fourth number indicates that the “half” position is 0. Find the line that begins with “{“ and “97” separated by four spaces: “{ 97”. Following this line are “move” and “draw” instructions that define the character “a”. Examine the coordinates of the moves and draws to see that the horizontal extent of this charater is from -6 to 6. Add a stroke above the “a” by adding one move and one draw to the end of the character definition: “m -6 8” and “d 6 11”. The result of the modification may be viewed by exiting the text editor and using the command “pltfnt –s97 smpfont”. The modified character looks like “á”.
To use the modified font in PLT, the font file must be converted from text to binary using the command “pltfnt –p smprom”. This procedure allows minor changes to characters in a font or may be automated to create entirely new fonts.
Page 48

Page 49
Index abs ................................................................. 30 ALTFNT ......................................................... 29 ANNCOL ................................................. 18, 21 ANNLWT ................................................. 18, 21 ANNSIZ ................................................... 15, 21 ARONUM ................................................ 18, 21 AROSIZ .................................................... 18, 21 AROTIP .................................................... 18, 21 AROWID .................................................. 18, 21 atan .............................................................. 30 atanh ............................................................ 31 AXCOL .................................................... 18, 21 AXLWT .................................................... 18, 21 BDATA .......................................................... 29 BGCOL .................................................... 18, 21 CALL .............................................................. 29 CDEXT ..................................................... 14, 21 cdi ................................................................. 31 cdr ................................................................. 31 ceil .............................................................. 31 CLIP ......................................................... 19, 21 cmi ................................................................. 31 cmr ................................................................. 31 cms ................................................................. 31 CORNER .................................................. 10, 21 cos ................................................................. 31 COUNT .................................................... 14, 21 DATA ............................................................. 27 DATLIST ....................................................... 27 define .......................................................... 30 EBNUM .................................................... 13, 21 EBWID ..................................................... 13, 21 ECHO ....................................................... 19, 21 erf ................................................................. 31 exp ................................................................. 31 FGCOL ..................................................... 18, 21 FILCOL .................................................... 18, 21 FINISH ........................................................... 27 floor ............................................................ 31 FNCOL ..................................................... 18, 21 for ................................................................. 30 GAPSIZ .................................................... 13, 21 GRDCOL .................................................. 18, 21 GRDLWT ................................................. 19, 21 GRDSIZ .................................................... 19, 21 GRDTYPE ................................................ 19, 21 GRID ........................................................ 19, 21 HEADER .................................................. 20, 22 ifelse .......................................................... 31 INCLUDE ...................................................... 29 KEEP ........................................................ 27, 28 LABCOL .................................................. 18, 22 LABLWT ................................................. 18, 22 LABSIZ .................................................... 10, 22 limit ............................................................ 31 LINSIZ ..................................................... 12, 22 LINTYPE ................................................. 12, 22
ln ................................................................... 31 log ................................................................. 31 MAGNIFY ............................................... 20, 22 max ................................................................. 31 MHALIGN ............................................... 16, 22 MHKEY ................................................... 17, 22 MHSP ....................................................... 16, 22 MHXP ...................................................... 16, 22 min ................................................................. 31 msg ................................................................. 30 MSGANGLE ............................................ 16, 22 MSGCOL ................................................. 18, 22 MSGDAT ................................................. 16, 22 MSGLWT ................................................. 18, 22 MSGSIZ ................................................... 16, 22 MSLANT .................................................. 16, 22 MVALIGN ............................................... 16, 22 MVKEY ................................................... 17, 22 MVSP ....................................................... 16, 22 MXDAT ................................................... 16, 22 MXLLC .................................................... 15, 22 MYDAT ................................................... 16, 22 MYLLC .................................................... 15, 22 NDATA .................................................... 11, 22 NEWFRAME ................................................. 27 NEWPAGE .................................................... 28 NEWRANGE ................................................. 28 NORM ...................................................... 14, 22 OPENAX .................................................. 10, 22 PLOT .............................................................. 28 PLTCOL ................................................... 18, 22 PLTLWT .................................................. 18, 22 PLTYPE ................................................... 11, 22 PRMLIST ................................................. 27, 28 RANNOT ................................................. 15, 24 RANSKP .................................................. 15, 22 RAXIS ...................................................... 10, 22 RBREAK .................................................... 9, 22 RCYCLE .................................................... 8, 22 repeat .......................................................... 30 RESET ............................................................ 28 RFMT ....................................................... 15, 24 RINT ........................................................... 9, 22 RLABEL .................................................. 10, 24 RMAX ........................................................ 8, 22 RMIN .......................................................... 8, 22 ROTATE .................................................. 20, 22 round ............................................................ 31 RPERCENT ................................................ 9, 22 RSHIFT ...................................................... 9, 22 RTICK ........................................................ 9, 22 select .......................................................... 31 SELECT ................................................... 20, 24 SHADE ..................................................... 14, 22 SHDCOL .................................................. 18, 23 SHDGRAY ............................................... 14, 23 SHDLWT ................................................. 14, 23

sin ................................................................. 31 SIZFAC .................................................... 20, 23 SMOOTH ................................................. 20, 23 SOLID ...................................................... 13, 23 SORT ........................................................ 20, 23 SPLINE .................................................... 20, 23 sqrt .............................................................. 31 STDFNT ......................................................... 29 STEM ....................................................... 21, 23 straline ..................................................... 30 SYMANG ................................................. 13, 23 SYMBOL ................................................. 12, 23 SYMFNT ........................................................ 29 SYMSIZ ................................................... 13, 23 tan ................................................................. 31 tanh .............................................................. 31 TANNOT .................................................. 15, 24 TANSKP .................................................. 15, 23 TAXIS ...................................................... 10, 23 TBREAK .................................................... 9, 23 TCYCLE .................................................... 8, 23 TFMT ....................................................... 15, 24 TICDIR ..................................................... 10, 23 TICSIZ ...................................................... 10, 23 TINT ........................................................... 9, 23 TLABEL ................................................... 10, 24 TMAX ........................................................ 8, 23 TMIN .......................................................... 8, 23 TPERCENT ................................................ 9, 23 TSHIFT ...................................................... 9, 23 TTICK ........................................................ 9, 23 undefine ..................................................... 30 VARLIST ....................................................... 27 VXLLC ..................................................... 21, 23 VYLLC ..................................................... 21, 23 WXLEN .................................................... 21, 23 WXLLC .................................................... 21, 23 WYLEN .................................................... 21, 23 WYLLC .................................................... 21, 23 XANNOT ................................................. 15, 24 XANSKP .................................................. 15, 23 XAXIS ...................................................... 10, 23 XBREAK .................................................... 9, 23 XCYCLE .................................................... 8, 23 xdat .............................................................. 31 XDATA .................................................... 11, 24 XFMT ....................................................... 15, 24 XGAIN ..................................................... 11, 23 XINT .......................................................... 9, 23 XLABEL .................................................. 10, 25 XLEN ......................................................... 7, 23 XLLC .......................................................... 7, 23 XMAX ........................................................ 7, 23 XMIN ......................................................... 7, 23 XOFST ..................................................... 11, 23 XPERCENT ............................................... 9, 23 xsav .............................................................. 31 XSHIFT ...................................................... 9, 23
XTICK ........................................................ 9, 23 YANNOT ................................................. 15, 25 YANSKP .................................................. 15, 23 YAXIS ...................................................... 10, 23 YBREAK .................................................... 9, 24 YCYCLE .................................................... 8, 24 ydat .............................................................. 31 YDATA .................................................... 11, 25 YFMT ....................................................... 15, 25 YGAIN ..................................................... 11, 24 YHOR ....................................................... 15, 24 YINT .......................................................... 9, 24 YLABEL .................................................. 10, 25 YLEN ......................................................... 7, 24 YLLC .......................................................... 7, 24 YMAX ........................................................ 7, 24 YMIN ......................................................... 7, 24 YOFST ..................................................... 11, 24 YPERCENT ............................................... 9, 24 ysav .............................................................. 31 YSHIFT ...................................................... 9, 24 YTICK ........................................................ 9, 24 zdat .............................................................. 31 ZDATA .................................................... 11, 25 zdev .............................................................. 31 ZGAIN ...................................................... 11, 24 ZOFST ...................................................... 11, 24 zsav .............................................................. 31 ztop .............................................................. 31
Page 50