emd-82-124 possible effects of increased royalty rate … · possible effects of increased royalty...
TRANSCRIPT

Report To The Subcommittee On Oversight And investigations, Commi,ttee On Interior And Insular Affairs, House Of Representatives
Possible Effects Of Increased Royalty Rate For Federal Onshore Oil And Gas Leases
The Commission on Fiscal Accountability of the Nation’s Energy Resources recently recommended increasing the current 12-l 12 percent onshore Federal oil and gas royalty rate. By the year 2000, a 16-2/3 percent royalty rate for Federal onshore noncompetitive oil and gas leases could be generating additional annual revenues of from $300 million to $1.2 billion. However, uncertainty surrounds these projections be- cause of the assumptions involved in their preparation, and other factors that could influence their realization.
Oil and gas leases negotiated in the private sector usually have a 12-l /2 percent royalty rate, but leases on state and Indian lands tend to have a higher rate. There is also some evidence of a trend toward higher rates. However, different leasing systems and provisions make a direct comparison , difficult.
119429
GAOIEMD-82-124
SEPTEMBER 3,19S2

Request for copies of GAO reports should be sent to:
U.S. General Accounting Office Document HanIdling and Information
Services Facility P.O. Box 6015 Gaithersb’urg, Md. 20760
Telephone (202) 275-6241
The first five copies of individual reports are free of charge. Additional copies of bound audit reports are $3.25 each. Additional copies of unbound report (i.e., letter reports) and most other publications are $1.00 each. There will be a 25% discount on all orders for 100 or more copies mailed to a single address. Sales ordiers must b’e prepaimd on a cash, check, or mon’ey order basis. Check should be made
i out to the “Superintendent of Documents”.

ENERGY AND MINERALS DIVISION
UNITED STATES GENERAL ACCOUNTING OFFICE WASHINGTON, D.C. 20548
September 3, 1982
R-208519
The Honorable Edward Markey Chairman, Subcommittee on Oversight
and Investigations House Committee on Interior and
Insular Affairs
Dear Mr. Chairman:
Your March 9, 1982, letter requested that we undertake a study of royalty rates for oil and gas produced from Federal and Indian lands. As part of this study you requested us to include (1) the estimated revenue increase that would result from royalty rates of 16-2/3 and 20 percent, (2) the basis for the Commission on Fiscal Accountability for the Nation's Energy Resources recommending an increase in oil and gas royalty rates from 12-l/2 percent to 16-2/3 percent, and (3) an analysis of the reasonableness of royalty rates currently applied to Federal and Indian lands.
To expedite issuance of this report, your office asked that we not obtain agency comments on the matters discussed in this
* report. As arranged with your office, unless you publicly announce its contents earlier, we plan no further distribution of this report until 30 days from its date. At that time we will send the report to interested parties and make copies available to others upon request.
Sincerely yours,
Dexter Peach


REPORT BY THE GENERAL ACCOUNTING OFFICE TO THE SUBCOMMITTEE ON OVERSIGHT AND INVESTIGATIONS, COMMITTEE ON INTERIOR AND INSULAR AFFAIRS, HOUSE OF REPRESENTATIVES
POSSIBLE EFFECTS OF INCREASED ROYALTY RATE FOR FEDERAL ONSHORE OIL AND GAS LEASES
DIGEST ------
Royalties generated from Federal onshore oil and gas' leases have been a significant source of revenues, totalling over $817 million in fiscal year 1981 alone. However, the Government's col- 'lection of these royalties has been sharply cri- ticized, resulting in the Secretary of the Interior creating the Commission on Fiscal Accountability of the Nation's Energy Resources to look into royalty management. Among the Commission's recommendations was setting a min- imum royalty of 16-2/3 percent, versus the current 12-l/2 percent. Legislation authoriz- ing this has been introduced as H.R. 5770.
GAO was asked to study oil and gas royalty rates as they apply to Federal and Indian lands. The study was to include
--the basis for the Commission‘s recommendation to increase the royalty rates,
--the amount of additional revenue which would result if the royalty rate were increased to 16-2/3 percent or 20 percent, and
--the reasonableness of royalty rates currently used in Federal and Indian oil and gas leases.
BASIS FOR THE FISCAL ACCOUNTABILITY COMMISSION'S RECOMMENDING A ROYALTY INCREASE
Although the Commission did not perform a formal study of existing royalty rates, GAO found that the following factors entered into its recommen- dation for a higher royalty rate:
--it saw no reason for the difference between onshore and offshore royalty rates:
--it believed that private sector royalty rates were rising: and
Tear Sheet GAO/EMD-82-124
SEPl’EMLtER 3,19SZ i

--it wanted a source of revenue to pay the costs of tighter royalty collection controls.
IMPACT OF HIGHER ROYALTY RATE ON REVENUES
GAO found that higher royalty rates will increase royalty receipts over the long run, but they will be partially offset by reductions in other rev- enue sources. A precise estimate is difficult to make.
The royalty on existing leases cannot be raised. With only new leases being subject to a higher royalty, the initial impact of an increase would be slight. But by the year 2000, as more and more of these new leases come into production, a lB-2/3 percent royalty could be generating annual revenues of from $300 mil- lion to $1.2 billion more than would be achieved under present royalty rates. A 20 percent roy- alty might generate from $530 million to $2.1 bil- lion annually,
However, there are uncertainties surrounding these estimates beyond the several assumptions GAO had to make in arriving at them:
--the above figures are influenced more by pro- jected oil and gas price increases than they are by the royalty rate increase:
--higher royalties would reduce tax collections, thereby partially offsetting the forecasted royalty receipts:
--a higher royalty rate may affect the profit- ability of some wells, which may result in some royalty reductions: and
--any increase in lessee costs always leaves open . the possibility of reduced exploration and development activity and hence reduced produc- tion and royalties.
REASONABLENESS OF RATES
GAO found that the predominant royalty on the private leases it examined was 12-l/2 percent, but there is evidence of a trend toward royalties higher than 12-l/2 percent. State leases tended to be higher than private leases, and some States have recently raised their rates. Most Indian
leases currently being issued are 16-2/3 percent or higher.
A conclusive comparison of royalties is diffi- cult, however. Ideally, the total amount paid by the lessees to lessors and the State and Federal Governments should be considered. For example, rental terms, severance and other taxes, filing fees, and negotiated or competi- tive bonuses --along with the royalty--all com- bine to represent the total cost to a lessee of acquiring, holding, and developing a lease, and are not always clearly separable.
CONCLUSIONS
Examination of royalty rates in selected areas in the private sector shows that 12-l/2 percent is still the predominant rate used, but State royalties tend to be somewhat higher: and, there are indications that royalty rates are rising. Indian leases generally carry a rate of 16-2/3 percent or higher.
A higher royalty rate would not generate signi- ficant income initially, but as newly issued leases begin to come into production, a 16-2/3 percent royalty could conceivably generate an additional billion dollars annually by the year 2000, and a 20 percent royalty could generate $2 billion.
However, oil and gas projections are of necessity tenuous, and the actual revenue impact can fur- ther be influenced by oil and gas price forecasts, and taxes. A higher royalty may also influence exploration and development activities, which in turn could affect royalty receipts. GAO found no conclusive arguments for or gainst a higher royalty, but did observe some evidence of a trend toward a higher rate. Ideally, such a decision should consider other related'factors such as State sharing provisions, lease provisions, and lease offering methods, and the total cost a lessee incurs in acquiring, holding, and developing a lease.


Contents
Page
i DIGEST
CHAPTER
1
2
4
APPENDIX
I
II
III
INTRODUCTION What are oil and gas royalties Objectives, scope and methodology
IMPACT OF ROYALTY RATE INCREASE ON REVENUES
Royalty provisions of existing Federal onshore oil and gas leases can not be increased
Higher rates could increase Federal royalty .revenues
Uncertain. effects of increasing royalty rates of leases issued in the future
Basis for the Fiscal Accountability Commission's recommending a royalty increase
FEDERAL AND PRIVATE OIL AND GAS ROYALTY RATES ARE COMPARABLE BUT LOWER THAN ROYALTY R.$TES.ON STATE AND INDIAN LEASES
Federal and Indian oil and gas royalty rates vary
Private sector and Federal royalty rates are similar
State royalty rates vary
CONCLUSIONS
Letter from Chairman Edward J. Markey, Subcommittee on Oversight and Investigations, House Committee on Interior and Insular Affairs
Assumptions and methodology used to estimate increased royalties from onshore oil and gas production on Federal leases subject to royalty rates of 16-2/3 and 20 percent
Forecasts used to derive oil and gas production and price estimates, 1982-2000
1 1 2
6
6
7
11
13
15
15
16 17
19
20
21
26

Page
APPENDIX
IV
V
VI
VII
Locations visited to review oil and gas leases for private lands
Past GAO reports dealing with onshore oil and gas leasing issues
Competitive and noncompetitive oil and gas leases issued
Royalty rates of private leases dated during the first 3 months of 1982
28
29
30
31

CHAPTER 1
INTRODUCTION
Historically, significant amounts of revenues have been avail- able to States, Indians, and the Federal Government from royalties collected from Federal and Indian oil and gas leases. In fiscal year 1981, oil and gas royalties generated from onshore Federal lands amounted to over $817 million and are expected to reach $2 billion by 1990.
Because of the significance of oil and gas royalty revenues, it is natur'al for them to be looked at closely. Good management principles call for action to be taken to insure that holders of Federal and Indian oil and gas leases pay at least the "going" roy- alty rate and that existing and future oil and gas royalty rates be evaluated. In January 1982, the Commission On Fiscal Accountability of the Nation's Energy Resources (Linowes Commission} recommended an increase in the royalty rate for onshore leases from 12-l/2 to 16-2/3 percent, and H.R. 5770 was introduced to that effect.
On March 9, 1982, the Chairman, Investigations,
Subcommittee on Oversight and House Committee on Interior and Insular Affairs,
requested GAO to study royalty rates applicable to oil and gas pro- duced on Federal and Indian lands. He specifically asked that we estimate increased revenues that might result from royalty rates of 16-2/3 and 20 percent, determine the basis for the Linowes Commission's recommending a royalty increase, and assess the reasonableness of royalty rates currently applied to Federal and Indian leases (see appendix I).
WHAT ARE OIL AND GAS ROYALTIES?
For the purposes of this report, an oil and gas royalty is the amount of money a lessee is obligated to pay the lessor for the oil and/or gas extracted. The royalty rate is expressed as a fraction or percentage of the volume or value of the oil and gas produced.
In its simplest form a royalty is a single or flat percentage of all production or value of the production. However, it is not unusual for the royalty to be more complicated. For example, some Federal oil and gas leases contain royalty provisions which
--change to higher percentages as the production from the lease increases,
--change to higher percentages as the production, on a well basis, increases, or
--differ for the product being produced.
It is also not unusual for State oil and gas leases to contain roy- alty rates which differ from a single or flat percentage. As a
1

result, the actual royalty rate of a given lease may not be knowr:, until after a lease is producing and the oil and gas are being scld,
Royalties generated by onshore Federal oil and gas leases are shared with States and counties by the Federal Government. The actual distribution of the royalties collected depends upon where the lease is located and how the land came to be owned by the Federal Government. However, most of the royalties being generated by onshore oil and gas leases are distributed in accordance with the provisions of 30 U.S.C. 191 which provides for
--SO percent of the royalties to be distributed to the State where the lease is located, l,/
--40 percent of the royalties to be distributed to the recla- mation fund created by the Reclamation Act, and
--lo percent of the royalties to remain in the general fund of the Treasury.
OBJECTIVES, SCOPE AND METHODOLOGY
This report focuses on royalty rates of noncompetitive Federal onshore oil and gas leases. 2/ It discusses complex issues and uncertainties associated with a royalty rate increase, including
--the applicability of any new rate to existing leases;
--the possible impacts a higher rate might have on Federal revenues and energy development; and
--the comparability of Federal royalties with those provided in State and private leases.
In conducting this review, we analyzed relevant data gathered from various private and public sources to calculate the revenue esti- mates; examined the basis for the Linowes Commission’s recommenda- tion; and assessed the reasonableness of the increase.
We interviewed and obtained information from Federal authori- ties in Washington, D.C., and at Bureau of Land Management, Bureau of Indian Affairs, and Minerals Management Service offices ins Denver, Colorado. We analyzed statistical information on Federal oil and gas leasing --onshore and offshore, competitive and non- competitive-- and examined the royalty provisions in the various
&/Alaska receives 90 percent of the royalties collected from Federal leases in that State. The remaining 10 percent is retained by the Federal Government.
2/ Offshore oil and gas royalties will be discussed in a forth- coming GAO report.

onshore lease instruments issued by the Government. We examined legislation, regulations, and Interior Department procedures perti- nent to setting and calculating onshore oil and gas royalties and we reviewed relevant Interior and Energy Department studies, correspondence, and analyses, including the January 21, 1982, Commission report to the Secretary of Interior which was discussed with Commission members.
We also interviewed and obtained information from the oil and gas industry, State and local governments, and private institu- tions. The proposed royalty increase was discussed with represent- atives from major and independent oil and gas companies and various industry associations. We contacted officials of oil and gas pro- ducing States and conducted field work in county offices to obtain information on the royalty provisions of State and private oil and gas leases. In addition, we reviewed public comments on the pro- posed royalty increase and identified current forecasts of oil and gas production and price levels done by various public and private institutions.
Our calculation of how much increased revenue could result each year through the year 2000 from raising the Federal onshore oil and gas royalty to 16-2/3 percent or 20 percent was based on our determination that the higher royalty will be applicable only to oil and gas production from new leases. We also did not take into account the possible revenue reductions stemming from the Secretary of the Interior's discretionary authority to reduce roy-' alties in the interest of conservation for such factors as low production rates (stripper wells) or difficult production condi- tions (e.g*, tight sands, deep wells). Lastly, we did not consider the effect on net Federal receipts, i.e., the impact of a higher royalty on income taxes, or the fact that royalty receipts are shared with State governments.
Since the amount of royalty due the Government is based on the value of production from a lease, we had to determine, for each year through the year 2000, the amount and price of oil and gas expected to be produced from new leases that would be subject to the increased royalty. Appendix II details the assumptions and procedures we used to determine the production value estimates needed to derive the projected increases in gross Federal onshore royalty revenues discussed in chapter 2. These estimates are based on current oil and gas production and price forecasts identified in appendix III. The estimates are in the form of "high-low" ranges to accommodate uncertainties inherent in the forecasts used. In developing the estimates, we assumed that,
--any impacts a higher rate might have will fall within the "high-low" ranges forecasted;
--the current ratio of newly discovered onshore oil and gas produced from competitive and noncompetitive Federal leases will not change: and
3
--statutory and regulatory reforms allowing the proposed higher royalty will be implemented in 1983.
Information pertaining to royalty rates and terms of oil and gas leases for private lands was obtained by visiting 22 counties located in seven States and reviewing copies of leases on file for public inspection. Locations in Alaska, Colorado, Montana, New Mexico, Tennessee, Texas, and Wyoming were visited (see appen- dix IV). To be included in our data base the private lease had to have been entered into during the period January 1 through March 31, 1982, and be on file at the time we visited the location. In a limited number of locations, data pertaining to the period January 1 through March 31, 1977, was also obtained, in an attempt to iden- tify any trends in royalty rates used.
Selection of the locations where we performed our review was not on a scientifically valid statistical basis since the locations of private oil and gas leases or the number of these leases is not compiled. However, an attempt was made to select locations which were geographically dispersed and where there was a potential for private lands being leased. In addition, we included States where the amount of federally owned land varied relative to the size of the State --small (Texas and Tennessee), and high (Alaska, Colorado, Montana, New Mexico, and Wyoming). In comparing oil and gas roy- alty rates of Federal, State, Indian, and private leases no attempt was made to adjust royalty rates to reflect other lease provisions which could be construed as increasing or decreasing the royalty rate. For example,
--Federal leases require an annual rental to be paid which is based on the acreage of the lease. Once production of oil and gas occurs, rentals cease and royalties are paid. Pri- vate leases usually contain clauses which effectively result in a similar practice. However, in some cases leases may require a rental to be paid even though a lease is producing. For comparability purposes, a lease requiring a rental in addition to a royalty could be construed to have a higher effective royalty rate.
--Federal leases usually require the lessee to pay a minimum royalty equal to a rental rate of one dollar per acre. In some cases, the minimum royalty could result in a higher royalty rate if it were expressed as a percentage. Oil and gas leases for privately owned land do not usually have this feature.
--Some private leases contain a clause which allows the lessor to use gas produced from the lease to provide heating and lighting of buildings on the leased property. This right is in addition to the royalty the lessee owes. Such a clause could be construed as resulting in a higher effective royalty rate.

Lease provisions such as those above do not have significance unless production occurs and the impact of such clauses, if considered as part of the royalty rate, can not be determined until production occurs.
Because of the time that would have been required to do soI no attempt was made to determine the circumstances or conditions for private leases which may have had an influence on the royalty rate. For example, lessors of private lands are often paid a bonus by the lessees for signing an oil and gas lease. The amount of the bonus can be influenced by many factors among which is the royalty rate. In other cases where the land being leased is not large, such as a one acre parcel, the royalty rate may be of little or no significance to the lessee because of the relative size of the lease when compared to other nearby lands the lessee has leased.
In preparing this report, we have also drawn extensively on several reports we have issued over the past several years address- ing the Interior Department’s management of onshore leasing (see append ix V) . Our previous work has generally focused on improve- ments needed to assure timely and efficient leasing of Federal oil and gas lands in a manner consistent with the public’s interest. In this regard we have pointed out the need to address the appro- priateness of the royalty rate disparities between onshore compet- itive and noncompetitive leases, the possible use of royalties for assuring a fair return on publicly owned resources, and the need for improving collections of oil and gas royalties due from exist- ing leases.
We made our review in accordance with our current “Standards for Audit of Governmental Organizations, Programs, Activities, and Functions. ”

CHAPTER 2
IMPACT OF ROYALTY RATE INCREASE ON REVENUES
Increasing the royalty rates from 12-l/2 to 16-2/3 percent or 20 percent has the potential to substantially increase revenues. Because the higher rates would be applied only to new leases, the initial effect would be slight. However, by the year 2000, as more and more of these leases come into production, a 16-2/3 percent rate could be generating an additional $300 million to $1.2 billion annually. A 20 percent rate might generate additional annual reve- nues of from $530 million to $2.1 billion by the year 2000.
The wide range of revenue estimates is a result of the wide range of production forecasts made throughout industry and Government. Their accuracy is also contingent upon several other factors, such as the reliability of future price estimates and the possible impact of a higher royalty on development and production. Care must also be taken in using these projections because of the necessary assumptions made in developing the methodology used to estimate future royalty revenues (see appendix II).
In essence, these projections provide a highly conditional meas- ure of the possible impact a royalty rate increase could have on gross Federal royalty revenues from onshore oil and gas operations. The estimates also do not reflect the impact of higher royalties on net Federal revenues, i.e., total Federal revenues adjusted for such things as the windfall profit tax, l/ lost income tax resulting from the operator's ability to deduct the higher royalty costs, and the requisite Federal sharing of 50 percent of the onshore royalty income with the producing States (except for Alaska where 90 per- cent of the royalties are turned over to the State).
ROYALTY PROVISIONS OF EXISTING FEDERAL ONSHORE OIL AND GAS LEASES CAN NOT BE INCREASED
The current standard royalty rate in non-competitive oil and gas leases is set by law at a flat 12-l/2 percent. The current royalty rates for onshore competitive leases, which by statute can not be less than 12-l/2 percent, are based on production and vary
l/The windfall profit tax is not in addition to the royalty collec- - tion --it is assessed on the royalty and subtracted from the oil royalties collected by the Minerals Management Service. We did not offset the tax when making our revenue projections because the complex calculation required by the Internal Revenue Service in computing the tax requires knowledge of a newly discovered produced oil's category which determines its excludability from the tax and is beyond the scope of this review.
6

from 12-l/2 percent to 25 percent for oil and from 12-l/2 percent to 16-2/3 percent for gas. (In the past, Federal onshore leases were issued with royalty rates that ranged from 5 percent to 32 percent.)
Higher royalties on noncompetitive leases cannot be charged without legislative change. Higher competitive royalties can be achieved by regulatory modification. But any change would apply only to those leases issued under a new statute or regulation. We found no legal authority that would allow the Government to change the, terms of existing leases in such a way as to charge a higher royalty on production from a previously issued lease. Unlike. Federal coal leases, existing oil and gas leases do not provide for renegotiation or readjustment of terms and conditions. Rentals, royalties, and other terms and conditions of Federal coal leases are subject to readjustment at the end of the lease's primary 20-year term, and at the end of each lo-year period thereafter if the lease is extended (30 U.S.C. 207(a)).
HIGHER RATES COULD INCREASE FEDERAL ROYALTY REVENUES
We estimated the amount of increased Federal royalty revenues that could result if current royalty rates were increased to 16-2/3 percent or 20 percent. The results of our analysis are detailed in Tables 2-1, 2-2, 2-3, and appendix II, and are discussed below.
16-2/3 percent royalty rate
At a royalty rate of 16-2/3 percent we estimate gross Federal royalty revenues for the period 1986 through 2000 could increase from $2.0 to $8.9 billion over the current rate for an average annual increase of from $133.9 to $594.8 million. Estimated annual increases for the period range from a low of $1.9 million in 1986, when only a small amount of production is subject to the higher royalty, to a high of almost $1.2 billion in 2000.
Oil production subject to the increased royalties is estimated to range from a low of 1.14 million barrels in 1986 to a high of 149.97 million barrels in 2000. Oil prices are estimated to range from a low of $30.78 per barrel in 1986 to a high of $109.90 per barrel in 2000.
Oil royalties from production subject to a 16-2/3 percent roy- alty rate are estimated to total from $4.0 to $20.8 billion, for an annual average of from $264.4 million to $1.4 billion. This re- flects an estimated increase for the period over current rates that could range from $991.5 million to $5.2 billion, for an average annual increase of from $66.1 to $346.4 million. Estimated annual increases for the period range from a low of $1.5 million in 1986 to a high of $686.7 million in 2000.
7

Year/Range
1986 low high
1987 low high
1988 low high
1989 ,;;w, low‘
lggo high
1991 low high
low lgg2 high
Q, 1993 low high
low lgg4 high 1995
low high low
lgg6 high low
I"' high low
lgg8 high low
lgg9 high low
*Ooo high
Total low high
(note b)
Royalty at current
12-4 percent
Table 2-l
Estimated Increased Royalty Revenues from Federal Onshore Oil and Gas Leases Issued After 1982 (note a)
$ 5.7 24.1 11.9 51.0 61.7
277.0 116.5 517.4 176.8 786.6 239.4
1,073.6 306.7
1,391.0 378.7
1,736.6 455.4
2,113.3 536.2
2,519.6 606.7
2,860.O 677.3
3.217.6 _ 747.5
3,290.g 817.9
3,397.6 888.5
3,509.3
$ 6.027-l 26;765.3
Royalty increased to
16-2/3 percent (millions
$ 7.6 32.1 15.9 68.0 82.3
369.3 155.3 689.9 235.7
1,048.g 319.2
1,431.5 409.0
1,854.6 504.9
2,315.5 607.2
2,817.g 715.0
3,359.4 809.0
3,813.3 903.1
4,290.l 996.7
4,387.7 1,090.5 4,530-l 1,184.7 4,679.0
$ 8,036.l 35,687.l
a/Royalty revenues shown apply only to oil and gas production subject for purposes of this report, would be implemented in 1983 (i.e., stipulated in leases issued after 1982).
b/Totals may not add due to rounding.
Source: Derived by GAO based on assumptions and methodology detailed in appendix II. See also tables 2-2 and 2-3.
Increase over current
royalty of dollars)
5 1.9
8:: 17.0 2-O .6 92.3 38.8
172.5 58.9
262.2 79.8
357.9 102.3 463.7 126.2 578.9 151.8 704.4 178.7 839.9 202.2 953.3 225.8
1.072-S 249.2
1,096.g 272.6
1.132.5 296.2
1,169.g
$2,009.0 8j921.8
Royalty Increase increased to over current
20 percent royalty
$ 9.1 38.5 19.1 81.6 98.7
443.2 186.4 827.8 282.9
1,258.6 383.1
1,717-g 490.8
2,225.6 605.9
2.778.6 728.8
3,381.3 858.0
4,031.3 970.8
4,576.0 1,083.7 5,148.2 1,196-O 5,265.2 1,308.7 5,436.l 1,421.6 5,614-g
$ 9,643.5 42,824.5 --
$ 3.4 14.4
307:: 37.0
166.2 69.9
310.4 106.1 472.0 143.6 644.2 184.1 834.6 227.2
1,042.O 273.4
1,268.0 321.7
1,511.7 364.0
1,716.0 406.4
1,930.6 448.5
1,974.5 490.7
2,038.5 533.1
2,105.6
$ 3,616.4 16,059.2
to a royalty increase which GAO assumes.
.^. .i

'Sable 2-2
Year/Range --
low 1986 high
low "8' high
low 1988 high
1989 lo&J
high fOW
*"' high low
lggl high low
W lgg2 high
1OW
lgg3 high low
1994 high 1OW
lgg5 high low
lgg6 high lot.3
lgg7 high low
lgg8 high 1OW
lgg9 high 10-d
*'O" high
10X? Totalhigh
(LtGte Cf
Oil (millions of
barrels) __.~
1.14 3.03 2.22 5.97 7.66
22.99 12.82 37.83 17.71 52.31 22.40 66.47 27.07 80.82 31.71 95.30 36.35
110.04 40.99
124.92 45.47
137.06 49.83
149.44 54.04
147.93 58.14
148.84 62.12
149 97 A
469.67 1,332.92 _. __
Price (S/BBL)
(note b)
$ 30.78 50.26 32.64 53.73 34.50 57.49 36.35 61.52 38.21 65.82 41.23 71.42 44.26 77.42 47.28 83.42 50.30 89.43 53.19 95.45 53.65 98.34 53.97
101.23 54.29
104.12 54.61
107.01 54.95
109 90 A-
N/A
Estimated Increased Royalty Revenues from Oil Production on Federal Onshore lkaaes Issued After 1982 (note a)
Value of Royalty at Royalty Increase production current increased to over current
,($ millions) 12-+ percent -" lb-2/3 percent royalty (royalties in millions of dollars)
s 35.1 152.3
72.5 320.8 264.3
1,321.7 466.0
2,327.j 676.1
3,443.0 923.6
4,747.3 1,198.l 6,257.l 1,499.2 7,950.9 1,828.4 9,840.g 2,180.3
11.923.6 2,439.5
13,478.5 2,689.3
15.127.8 2.933.8
15,402.S 3.175.0
15,927.4 3,413.s
16.481.7
$ 23,795.3 124.702.' ---
$ 4.4 19.0 9.1
40.1 33.0
165.2 58.3
290.9 84.6
430.4 115.4 593.4 149.8 782.1 187.4 993.8 228.5
1,230.l 272.5
1,490.5 304.9
1,684.8 336.2
1,891.0 366.7
1.925.3 396.9
1,990.g 426.7
2,060.Z
$ 2.974.4 15;587.2 --
S 5.8 25.4 12.1 53.5 44.0
220.3 77.7
387.9 112.8 573.8 153.9 791.2 199.7
1,042.8 249.9
1,325.l 304.7
1,640.l 363.4
1,987.3 406.6
2,246.4 448.2
2,521.3 489.0
2,567.l 529.2
2,654.6 568.9
2 747 0 -9;
$ 3,965.g 20.783.8
a/Royalty rexmnues shown apply only to oil production subject to a royalty increase which GAO assuans, - for purposes of this report, would be implemented in 1983 (i.e., stipulated in leases issued after 1982)
b/Oil prioes in 1981 dollars per barrel ($/BBL). N/A = not applicable.
f/Totals may not add due to rounding.
source : Derived by GAO based on assumptions ami methodology detailed in appendix II.
$ 1.5 $ 7.0 $ 2.6 6.3 30.5 11.4 3.0 14.5 5.4
13.4 64.2 24.1 11.0 52.9 19.8 55.1 264.3 99.1 19.4 93.2 35.0 97.0 465.5 174.5 28.2 135.3 50.8
143.5 688,6 258.2 38.5 184.7 69.3
197.8 949.5 356.0 49.9 239.6 89.9
260.7 1,251.4 449.3 62.5 299.9 112.4
331.3 1,590.2 596.3 76.2 365.9 137.3
410.0 1,968.Z 738.1 90.8 436.1 163.5
496.8 2,384.' 894.3 101.6 487.9 183.0 561.6 2,695.J 1,010.g 112.1 537.9. 201.7 630.3 3,025.6 1,134.6 122.2 586.8 220.0 641.8 3,080.5 1,155.2 132.3 635.0 238.1 663.6 3,185.5 1,194.b 142.2 682.7 256.0 686.7 3,296.3 1,236.l
s 991.5 $ 4,759.2 $1.784.8 5,195.g 24,940.5 9 352 7 f
Royalty Increase increased to over current
20 percent royalty

Year/Range
1986 fOW
high 1987 1OV
high 1988 low
high 1989 low
high 1990 low high 1991 1OW
high 1992 low
high 1993 low
high 1994 low
high
1995 1OW
high 1996 low
high 1997 low
high 1998 1OW
high 1999 low
high 2000 low high
Total low . high (note c)
Gas (billions of cubic feet)
2.61 $4.02 6.13 6.58 5.20 4.39
12.32 7.06 48.26 4.75
118.61 7.54 91.19 5.11
225.92 8.02 134.12 5.50 335.27 8.50 176.46 5.62 445.14 8.63 218.80 5.74 556.02 8.76 261.14 5.86 668.41 8.89 303.48 5.98 783.33 9.02 345.82 6.10 899.76 9.15 388.16 6.22
1,013.08 9.28 430.50 6.34
1,127.85 9.41 471.57 6.46
1,145.04 9.54 511.89 6.58
1,163.73 9.67 551.45 6.70
1,182.90 9.80
3,940.65 9,683.51
N/A -
Table 2-3
Estimated Increased Royalty Revenues from Gas Production on Federal Gnshore Leases Issued After 1982 (note a)
Value of production
($ millions)
S 10.5. 40.3 22.8 87.0
229.2 894.3 466.0
1.811.9 737.7
2,849,8 991.7
3,841.6 1,255.9 4,870.7 1,530.3 5,942.2 1.814.8 7,065.6 2.109.5 8,232.8 2,414.4 9,401.4 2,729.4
10,613.l 3,046.3
10.923.7 3,368.2
11,253.3 3,694.7
11,592.4
$ 1.3 5.0 2.9
10.9 28.7
111.8 58.2
226.5 92.2
356.2 124.0 480.2 157.0 608.8 191.3 742.8 226.9 883.2 263.7
1,029.l 301.8
1,175.2 341.2
1.326.6 380.8
1,365.5 421.0
1,406.7 461.8
1449 1 u
$24,421.4 $ 3,052.l 89.420.0 - 11,177.5 --- =
Royalty at Royalty current increased to
12-4 percent l&2/3 percent (royalties in millions of
$ 1.7 6.7 3.8
14.5 38.2
149.1 77.7
302.0 122.9 475.0 165.3 640.3 209.3 811.8 255.0 990.4 302.5
1,177.6 351.6
1,372.l 402.4
1,566.g 454.9
1,768.8 507.7
1,820.6 561.4
1,875.5 615.8
1,932-l
s 0.4 1.7 1.0 3.6 9.6
37.3 19.4 75.5 30.7
118.7 41.3
160.1 52.3
202.9 63.8
247.6 75.6
294.4 87.9
343.0 100.6 391.7 113.7 442.2 126.9 455.2 140.3 468.9 153.9 483.0
$ 4.070.2 $1,017.6 14.903.3 3,725.8
a/Royalty revanues shown apply only to gas production subject to a royalty increase which GAO assumes, - for purposes of this report, would be implemented in 1983 (i.e ., stipulated in leases issued after 1982)
b/Gas prices in 1981 dollars p=~r thousand cubic feet ($/MCF). N/A = not applicable.
c/Totals may not add due to rounding.
source : thrived by GAO based on assumptions ami nethaiologydetailed in appemIix II. . .
Increase over current
royalty dollars)
Royalty Increase increased to over current
20 percent royalty
s 2.1 8.1 4.6
17.4 45.8
178.9 93.2
362.4 147.5 570.0 198.3 768.3 251.2 974.1 306.1
1,188.4 363.0
1,413.l 421.9
1.646.6 482.9
1,880.3 545.9
2,122.6 609.3
2,184.7 673.6
2,250.7 738.9
2 318 5 u
$ 4,884.3 17.884.0
$ 0.8 3.0 1.7 6.5
17.2 67.1 34.9
135.9 55.3
213.7 74.4
288.1 94.2
365.3 114.8 445.7 136.1 529.9 158.2 617.5 181.1 705.1 204.7 796.0 228.5 319-3 252.6 844.0 277.1 869.4
$1,831.6 6,706.5

Gas production subject to the increased royalties is estimated to range from a low of 2.61 billion cubic feet in 1986 to a high of 1,182.90 billion cubic feet in 2000. Gas prices are estimated to range from a low of $4.02 per thousand cubic feet in 1986 to a high of $9.80 per thousand cubic feet in 2000.
Gas royalties from production subject to a 16-2/3 percent rate are estimated to total from $4.1 to $14.9 billion through the year 2000, an annual average of from $271.3 to $993.6 million. This re- flects an estimated increase for the period that could range from $1.0 to $3.7 billion, for an average increase of from $67.8 to $248.4 mill,ion. Estimated annual increases for the period range from a low of $437,000 in 1986 to a high of $483.0 million in 2000.
20 percent royalty rate
At a royalty rate of 20 percent, we estimate gross Federal royalty revenues for the period 1986 through 2000 could increase from $3.6 to $16.1 billion over the current rate, for an average annual increase of from $241.1 million to $1.1 billion. Estimated annual increases for the period range from a low of $3.4 million in 1986 to a high of about $2.1 billion in 2000.
At a 20 percent royalty rate, total oil royalties for the period are estimated to range from $4.8 to $24.9 billion, for an annual average of from $317.3 million to $1.7 billion. This re- flects an estimated increase for the period over current rates that could range from $1.8 to $9.4 billion, for an average annual increase of from $119.0 to $623.5 million. Estimated annual in- creases for the period range from a low of $2.6 million in 1986 to a high of $1.2 billion in 2000.
Total gas royalties at a 20 percent rate for the period are estimated to range from $4.9 to $17.9 billion, for an annual aver- age of from $325.6 million to $1.2 billion. This reflects an esti- mated increase for the period over current rates that could range from $1.8 to $6.7 billion, $122.1 to $447.1 million.
for an average annual increase of from Estimated annual increases for the period
range from a low of $786,000 in 1986 to a high of $869.4 million in 2000.
UNCERTAIN EFFECTS OF INCREASING ROYALTY RATES OF LEASES ISSUED * IN THE FUTURE
As discussed earlier, several assumptions and uncertainties can influence the validity of the revenue forecasts. The forecasts are expressed in the form of a "high-low" range to allow for the many assumptions on which they had to be based. They are
--the source and quantity of future oil and gas production (i.e., Federal and non-Federal lands, onshore and offshore);
11

--estimates of future oil and gas prices, which have influ- enced the increase in receipts even more than the royalty increase (in other wordsl a projection based on current prices would have shown considerably less revenues);
--the proportion of newly discovered oil and gas expected to be produced from new competitive and noncompetitive leases subject to the increased royalties; and
--the lead time from lease acquisition to production for com- petitive and noncompetitive leases.
In addition, higher onshore oil and gas royalty rates will impact on Federal revenues and may adversely affect energy explo- ration and development activities on Federal lands.
Further, public comments submitted to the Department of the Interior I/ and oil and gas industry representatives we interviewed expressed concern that increasing the onshore royalty rate to 16-2/3 percent or higher would
--adversely affect competition in such a way as to favor major oil and gas companies;
--decrease oil and gas production by accelerating well aban- donment and limiting the development of small or marginal fields;
--decrease levels of exploration especially in frontier areas and other areas where accessibility and resultant higher exploration and development costs are a problem;
--result in severe economic hardship for consumers in the form of higher prices and possible supply interruptions: and
--decrease the amount of Federal lands leased in the future.
However, no one provided any detailed analytical or quantitative data in support of their positions which could be used to assess the likelihood or magnitude of any adverse impacts that might result from increasing the royalty. The advantages and disadvan- tages of such an increase are still very uncertain, and the possi- bility that future onshore oil and gas production might be adversely
l-/On March 9, 1982, Interior published a Federal Register notice (Vol. 47, No. 46, p. 10091) soliciting public comments on the potential impacts of increasing the onshore royalty rate to 16-2/3 percent. The notice emphasized possible impacts on oil and gas exploration and development and on the leasing of Federal lands. Twenty-one responses were received by the April 8, 1982, close of the comment period. Two were received after that date-- one from an oil company and the other an industry association.
12

affected is a key consideration in making an informed judgment on increasing the royalty.
DOI’s evaluation of the proposed royalty increase
Interior is continuing its study of the impact of implement- ing the 16-2/3 percent standard minimum royalty rate for new or re- negotiated onshore leases recommended by the Linowes Commission. The study was initially requested by the Secretary of Interior on
L/
January 19# 1982, and its findings were submitted for his review in late May, We understand the study concluded that increasing the royalty rate is expected to increase gross Federal royalty receipts but that oil and gas production would decrease, and ‘net” Federal revenues might be adversely affected due to the tax deduct- ability of royalty payments, sharing of royalties with States, and foregone revenue resulting from lost production. The Secretary requested further study of the possible impacts prior to establish- ing an official position on the proposed royalty increase. The Secretary believes the royalty increase recommendation was not a part of the Linowes Commission’s charter 2/ but believes that it merits study. No date has yet been set for a final decision on raising of the royalty.
BASIS FOR THE FISCAL ACCOUNTABILITY COMMISSION’S RECOMMENDING A ROYALTY INCREASE
The Commission recommended the onshore royalty be increased to 16-2/3 percent because
--the basic royalty rate for oil and gas produced from Federal offshore leases is one-sixth or 16-2/3 percent and the Commission saw no reason for the disparity between onshore and offshore royalty rates;
--in addition, it found that royalty rates in the private sector had risen as the value of oil and gas increased.
The Commission Chairman told us another basic reason for the recommendation was to obtain additional revenues to pay for
&/The Commission on Fiscal Accountability of the Nation’s Energy Resources was chartered by the Secretary of Interior on July 8, 1981. It was tasked with investigating allegations of irregular- ities in royalty payments due the Federal Government, Indian tribes and States, and the allegations of oil theft from Federal and Indian lands. The Commission’s findings were formally trans- mitted to the Secretary of Interior on January 21, 1982, and con- tained a recommendation to increase the onshore royalty rate.
Z/Ibid.
13

inspections and procedures needed to insure proper and timely col- lection of royalties from Federal and Indian oil and gas lease holders. The Commission recommended establishing a self-sustaining fund for this purpose. A percentage of the royalties collected from all existing and future Federal and Indian leases (onshore and offshore) would provide the source of funds needed to establish and sustain the fund.
The Commission Chairman told us the reported disparity between Federal onshore royalty rates and the "going rates" for leases in the private sector was based on the informed judgments of him and other Commission members that most non-Federal leases had royalties ranging from 16-2/3 to 25 percent. The Commission did not perform a formal study of oil and gas lease royalty rates as the basis for its finding.

CHAPTER 3
FEDERAL AND PRIVATE OIL AND GAS ROYALTY
RATES ARE COMPARABLE BUT LOWER THAN ROYALTY
RATES ON STATE AND INDIAN LEASES
Federal oil and gas leases currently being granted under non- competitive procedures constitute about 97 percent of the Federal oil and gas. leases being issued. These leases contain a 12-l/2 per- cent royalty rate which is still the predominant royalty rate con- tained in most private oil and gas leases entered into by private landowners. On the other hand, oil and gas royalty rates contained in leases issued by States and Indian tribes using competitive proc- esses were generally higher. Both the State and private rates we examined suggest a trend toward a rate higher than 12-l/2 percent.
FEDERAL AND INDIAN OIL AND GAS ROYALTY RATES VARY
Leases issued by the Federal Government and Indian Tribes con- tain provisions for.the payment of royalties which vary by lease. Establishing the amount of royalty can often be difficult until production of oil and gas actually occurs.
Most Federal oil and gas leases issued are noncompetitive leases. For example, in fiscal year 1980 there were a total of 10,509 leases issued for Federal lands. Only 301 of the leases issued in that year were competitive. (See appendix VI.) By law (30 USC 226(c)), the royalty to be paid by the holder of a non- competitive Federal oil and gas lease is fixed at 12-l/2 percent. In the case of a competitive Federal oil and gas lease, the law (30 USC 226(b)(l)) requires a royalty of not less than 12-l/2 per- cent. Accordingly, noncompetitive Federal onshore oil and gas leases contain a provision for paying a 12-l/2 percent royalty on oil and gas produced or sold from the leased lands. Competitive oil and gas leases issued by the Federal Government have royalty rates based upon the average amount of oil and gas produced from a well per day. As production increases the royalty on oil increases from a minimum of 12-l/2 percent to a maximum of 25 percent. The gas royalty rate increases from a minimum of 12-l/2 percent to a 16-2/3 percent maximum when the average production per well exceeds five million cubic feet. The Minerals Management Service defines the royalty provisions of the competitive onshore leases as being step- scale royalty provisions.
Indian oil and gas leases are usually issued using competitive procedures by the Indians and are approved by the Secretary of the Interior or his authorized representative. According to the Acting Chief of the Bureau of Indian Affairs' Division of Energy and Mineral Resources, the minimum royalty rate used in Indian oil and gas leases is 16-2/3 percent with most being issued currently having even higher provisions. He estimated most Indian oil and gas leases
15

issued recently have a royalty rate of 20 percent which increases as production increases,
PRIVATE SECTOR AND FEDERAL -- ROYALTY RATES ARE SIMILAR --
Most oil and gas leases we reviewed, negotiated in the private sector during the first 3 months of 1982, contained a royalty rate of 12-l/2 percent.
A total of 645 oil and gas leases, negotiated during the first 3 months of 1982 on privately owned lands, were on file in county offices of six of the seven States where we performed our review. In the two offices in Alaska that we visited no private leases were on file which had been negotiated during the first 3 months of 1982. .l/ The private royalty rate cited most often on leases was 12-l/2 percent. This occurred in 422 of the 645 leases identified in the States visited. The remaining 223 leases, about one-third, contained rates between 14 and 30 percent. (See appendix VII).
The royalty rate cited most often for the same period in 1977 was also 12-l/2 percent. A total of 222 leases were identified for this period and the majority (193) of these also contained a roy- alty rate of 12-l/2 percent. The remaining 29 leases had royalties scattered between 14 and 25 percent.
Although the predominant royalty rate in 1977 and 1982, as shown abover was 12-l/2 percent, a comparison of private lease royalty rates in eight counties having leasing during the first 3 months of both 1977 and 1982 disclosed a trend towards higher royalty rates, However r only three of the counties had meaningful leasing activity during both periods. Results of the comparison for these counties show significant variations.
--Richland County, Montana, leases showed a definite trend to a higher royalty rate, In the 1977 3-month period reviewed, 102 (86 percent) of the 118 leases had a royalty rate of 12-l/2 percent. In the 1982 3-month period reviewed, only 10 (12 percent) of the 84 leases negotiated had a 12-l/2 per- cent royalty rate. The most common royalty rate in the 1982 period was 16-a/3 percent (31 of 84 leases had the 16-2/3 percent rate).
--Laramie County, Wyoming, leases showed a slight trend to a higher royalty rate* In the 1977 3-month period reviewed, 39 (80 percent) of the 49 leases reviewed had a 12-l/2 percent
L/In one office, PalmerF Alaska, we found that no private leases were filed during the last 12 years. However, during the period of October 1967 through December 1969, 79 oil and gas leases for private lands had been filed. All had a 12-l/2 percent royalty rate.
16

royalty. In the 1982 period 33 (73 percent) of the 45 leases had a 12-l/2 percent royalty.
--Huerfano County, Colorado, leases showed no trend to a higher royalty rats. All leases in the 1977 and 1982 3-month review period had 12-l/2 percent royalty rates.
STATE ROYALTY RATES VARY
Royalty rates used by the following States in their oil and gas leasing grograms ranged from 12-l/2 percent to as much as 50 percent. No single rate could be identified as being predominant.
Many States use competitive leasing to issue oil and gas leases. Royalty rates differ among States in several ways: some have fixed royalty rates and others have royalty rates which vary by product, amount of production, or location of the lease.
Alaska. Alaska is using competitive leasing to issue its oil and gas leases, although we were told noncompetitive leasing is also authorized. Several forms of competitive leasing can be used, including
--a fixed royalty rate of not less than 12-l/2 percent plus a” cash bonus bid;
--a fixed royalty rate of not less than 12-l/2 percent, and a fixed share of not less than 30 percent of the net profit derived from the lease , plus a cash bonus bid: and
--a fixed cash bonus, with the royalty rate being the bid variable, but not less than 12-l/2 percent.
According to a petroleum economist in the State Department of Natural Resources, royalty rates bid for leases have been as high as 50 percent. This occurred in 1981.
Arizona. Competitive leasing is used in proven areas, and non- competitive leasing in unknown geological areas. The royalty rate is 12-l/2 percent.
Arkansas, Colorado, and Kansas. 12-l/2 percent,
The royalty rate is a flat and all leases are competitively issued.
California. The royalty rate varies from 16-2/3 to 50 percent, in its all-competitive system.
Montana. The royalty varies based upon what the well is pro- ducing and how much it is producing. Gas has a flat rate of 12-l/2 percent. For oil, the royalty is 12-l/2 percent for the first 3,000 barrels, 17-l/2 percent for the next 3,000 barrels, and 25 percent for oil production over 6,000 barrels. Competitive leasing is used.
17

New Mexico. The royalty rate is based upon a State evaluation of where the lease is and will be 12-l/2 percent if the lease is to be issued for a 10 year term, 16-2/3 percent if for a 5 year term, All leases are competitively issued.
North and South Dakota. The royalty rate is a flat 16-2/3 per- cent. Leases are issued competitively.
Oklahoma. The royalty rate is a flat 18-3/4.percent. Leases are issued competitively.
Texas. The royalty rate, according to the Texas Land Commis- sion Office's Director of Energy, was increased from 20 percent to 25 percent about 2 years ago. Leases are issued competitively.
Utah. The royalty rate was increased to 16-2/3 percent on July 1, 1981. Utah issues leases both competitively and non- competitively.
.
Wyoming. The royalty rate effective March 1, 1982, for State oil and gas leases was changed from 12-l/2 percent to 16-2/3 per- cent. Wyoming issues leases both competitively and noncompetitively.
Tennessee and Nevada. These States have no leasing program.

CHAPTER 4
CONCLUSIONS
Because an increased royalty would be applicable only to newly issued oil and gas leases, the initial impact on revenues would be slight. But as more and more leases subject to the new rate come into production, the impact becomes greater. Based on production and price forecasts prepared by public and private sources, we estimate that by the year 2000 a 16-2/3 percent royalty could be generating additional royalty revenue of from $0.3 to $1.2 billion annually. A 20 percent royalty rate could add from $0.5 to $2.1 billion in Federal royalty receipts by that time.
The wide range of revenue estimates is reflective of the wide range of production forecasts. Their accuracy also depends on several other factors, such as the reliability of future price esti- mates and the impact of a higher royalty on production. The figures also do not take into account the net impact on Federal receipts. For example, the higher royalty would influence income tax payments, and a significant portion of the increased revenues is provided to the States.
In recommending an increase in the royalty rate, the Linowes Commission saw no reason for the onshore royalty rate to be lower than the offshore royalty, believed that royalties in the private sector had been rising, and saw the higher royalty as a means to finance improved royalty collection procedures. >Jo formal study was made to substantiate these beliefs.
We also found that 12-l/2 percent is still the predominant roy- alty used in the private sector, although it does seem to be rising, particularly in some geographic areas. State Government royalty rates tended to be higher. Indian leases generally carry a rate of 16-2/3 percent or higher.
We found no conclusive arguments either for or against a higher royalty, but did observe some evidence of a trend toward a higher rate. Such a decision ideally should consider the total cost to a lessee to acquire, hold, and develop Federal leases. This would include bonus bids, rentals, filing fees, and severance and other taxes, and should also take into account related factors such as State sharing provisions and lease provisions and lease offering methods.
19
,_,,” ‘. ,‘, ‘, ,,‘,,, ?.‘. ;“:,;’ : ,,
,1 1 .:,:
,,,

APPENDIX I NINETY-SEVEMH CONGRESS
MORRIS K. UOALL, AAIZ.. CHAIRMAN
NIMIEL LUJAN, JR.. N. MU. DON n. CLA”IEN. CAWF. DON YOUNG. ALASK* ROBEAT 1. LhGOMARSIuo. CLLIP. D*N HIRRmTT. UTAH RON MIRLENET. MONT.
APPENDIX I CHARLES CONKLIN
STAFF DIRECTOR
STANLEY SCOVILLE
ASSOCIATE STAFF OIRECTOR
COMMIl-l-EE ON INTERIOR AND INSULAR AFFAIRS AN0 COUNSEL
U.S. HOUSE OF REPRESENTATIVES LEE MC ECVAtH GENERAL COUNSEL
RIC”*Rcl m. CHENEI, WYO. --
C”&RLCS P#.S”*“AN. IR.. CNdF. WASHINGTON, D.C. 20515 TIMOTHY W. GLIODEN
D0”Gl.AJ I(. BP?RE”TER. NE&R. REPUEILICAN COUNSEL lm”ID 0 B. UARTIN. N.Y. LARRY tuw3. 1DAHO WlLLlAt.4 84. YENWN. H.C. “A?% BROWN, tOLO. DI”,D MlCHm?mL STATON. w. “A. OeNNY SMITH. OREO. J*hles Y. HANSEN, UT*”
March 9, 1982
Mr. Charles Bowsher Comptroller General U.S. General Accounting Office 441 G Street, N.W. Washington, D.C. 20548
Dear Mr. Bowsher:
Recently the Commission on Fiscal Accountability for the Nation's Energy Resources released a report recommending a general increase in royalty rates from 12 l/28 to 16 2/3% for oil and gas produced on federal and Indian lands. While there was little or no back- ground documentation for this recommendation, it is obviously a matter of Congressional interest. I am requesting therefore that you undertake a study of royalty rates as they apply to federal and Indian lands. Please include in your study (1) the estimated revenue increase that would result from royalty rates of 16 2/3% and 20%, (2) the basis, if any, for the Commission's recommendation, and (3) an analysis of the reasonableness of royalty rates currently applied to federal and Indian leases.
Questions concerning this request should be directed to the Staff Director of my Subcommittee, Mr. Robert Kerr, at 225-2196.
Sincerely,
Chairman Subcommittee on Oversight
and Investigations 818 House Annex #l Washington, D.C. 20515
20

APPENDIX II
ASSUMPTIONS AND METHODOLOGY USED TO
APPENDIX II
ESTIMATE INCRE,ASED ROYALTIES FROM ONSHORE
OIL AND GAS PRODUCTION ON FEDERAL LEASES
SUBJECT TO ROYALTY RATES OF 16-2/3 AND 20 PERCENT
Federal onshore oil and gas royalties are based on the value of oil and gas produced and the royalty rate(s) stipulated in the lease instrument. For purposes of this report, we estimated the amount of increased gross Federal royalty revenue that could result each year through the year 2000 if the current rate of 12-l/2 per- cent for competitive and noncompetitive leases was raised to 16-2/3 or 20 percent. To accomplish this we had to determine
--the amount of annual oil and gas production expected to be produced from Federal onshore oil and gas leases that would be subject to the increased royalty rate; and
--the value of annual oil and gas production subject to the new higher rate.
Estimated oil and gas production from Federal onshore leases
We based our projections of Federal onshore oil and gas pro- duction and its value on various forecasts contained in the studies identified in appendix III. Table 1 shows the range of high and low projections of total oil and gas production derived from the studies. Table 2 shows the basis used for estimating the split between onshore and offshore production based on recent historical experience and the projections of future oil and gas discovery.

Table 1
Estinmted Domestic Oil and Gas Production and Prices, 1982-2000 - _.-_ _ _- -.
Totai Oil (billions of barrels)
1982 low high
f983 low high
198% low high
1985 law high
1986 1C.W high
1967 low high
1988 10W high
1989 low high 1990 low high 199 I 1OW
high
1992 low high
Year/Range U.S.
1981 (note a) 3.72
1993 low high
1995 low high
1996 low high 1997 low
high 1998 1OW
high 1993 low
IiiRh
3.10 3.83 3.06 3.f9 3.03 3.74 2.84 3.73 2.78 3.72 2.73 3.72 2.70 3.74 2.65 3.81 2.60 3.85 2.58 3.90 2.57 3.95 2.56 3.99 2.56 4.06 2.56 4.10 2.47 4.18 2.40 4.22 2.32 4.27 2.26 6.34 2.19 4.30
PerClL?Iit
100
loo
100
100
100
100
100
100
100
100
100
100
100
100
100
100
100
100
100
100
Offshore
0.38 0.38 0.47 0.45 0.56 0.52 0.64 0.56 0.73 0.61 0.82 0.67 0.91 0.72 1.M) 0.77 1.11 0.82 1.22 0.88 1.33 0.87 1.34 0.87 1.36 0.87 1.38 0.87 1.39 0.84 1.42 0.82 1.43 0.79 1.45 0.77 1.48
0.74 1.46
Percent
10
12
15
17
20
22
24
27
29
32
34
34
34
34
34
34
34
34
34
34
Onshore
3.34 2.72 3:36 2.61 3.23 2.51 3.10 2.28 3.00 2.17 2.90 2.06 2;81 1.98 2.74 1.88 2.70 1.78 2.63 1.70 2.57 1.70 2.61 1.69 2.63 1.69 2.68 1.69 2.71 1.63 2.76 1.58 2.79 1.53 2.82 1.49 2.86 1.43 2.84
Percent --
90
88
. 85
83
80
78
76
73
71
68
66
66
66
66
66
66
66
66
66
66
Total
20.20 17.75 29.10 17.50 20.00 17.30 23.00 17.10 29.00 17.00 23.00 lb.90 25.20 16.85 20.80 15.80 2.l.00 16.80 2L.40 lb.80 21.80 16.80 22.00 16.80 22.30 15.80 22.80 16.80 23.10 16.80 23.70 16.80 29.00 li.30 24.50 lb.00 25.00 15.70 25.50
Natural Gas (trillion cubic feet)
Percent
100
100
100
100
100
100
100
100
100
100
100
100
100
100
100
100
100
100
100
lIti>
Offshore
5.52 4.79 5.43 4.73 5.40 4.67 5.40 4.62 5.40 4.59 5.40 4.56 5.45 4.55 5.62 4.54 5.67 4.54 5.76 4.70 6.10 4.70 6.16 4.70 6.24 4.70 6.38 1.70 6.47 4.70 6.64 4.70 6.72 4.56 6.86 4.48 7.00 4.40 7.14
a/1981 figures are actual.
b/Oil prices in dollars per barrel ($/BBL); gas prices in dollars pet thousand cubic feet ($/MCF). All are in 1981 do1 forecasts noted in appendix III.
Percent
27
27
27
27
27
27
27
27
27
27
28
28
28
28
28
28
28
28
28
26
Onshore
14.68 12.96 14.67 12.78 14.60 12.63 14.60 12.48 14.60 12.41 14.60 12.34 14.75 12.30 15.18 32.26 15.33 12.26 15.62 12.10 15.70 12.10 15.84 12.10 16.06 12.10 16.42 12.10 16.63 12.10 17.06 12.10 17.28 11.74 17.64 11.52 18.00 11.53 18.36
PeIXWlt
73
73
73
73
73
73
73
73
73
73
72
72
72
72
72
72
72
72
72
72
%Y Price (note b)
i3 Oil
(S/B=)
$ 31.77 30.40 38.81 30.52 39.95 32.23 43.41 28.93 46.85 30.78 50.26 32.64 53.73 34.50 57.49 36.85 61.52 38.21 65.82 41.23 71.42 44.26 77.42 67.28 83.43 50.30 89.43 53.19 95.45 53.65 98.34 53.97
101.23 54.29
104.12 54.61
107.01 54.95
109.90
.ars and are based on recent Federal r.overnment
Gas is (S/WF) 52 $2.06
2.03 Is 2.03 2.31 2.61 2.57 2.95 3.66 6.10 4.02 6.58 4.39 7.06 4.75 7.54 5.11 8.02 5.50 8.50 5.62 8.63 5.74 8.76 5.86 8.89' 5.98 9.02 6.10 9.15 6.22 9.28 6.34 9.41 6.46 9.54 6.58 9.67 6.70 9.80

APPENDIX II: APPENDIX XI
Table 2
Averaqe Annual Domestic Oil And Gas Production, 1975 - 1980
Natural Gas
Billions of Trill ions of barrels Percent cubic feet Percent
Onshore 2.75 86 15.32 76
Offshore 0.43 14 4.83 24
Total U.S. 3.18 100 B u _loo
Source: "Federal and Indian Lands Oil and Gas Production, Royalty Income, and Related Statistics," and "Outer Continental Shelf Statistics," Geological Survey, U.S. Department of the Interior, June 1981.
Projected Domestic Oil And Gas Discovery Rates (note a)
Oil Natural Gas
Billions of Trillions of barrels Percent cubic feet Percent
Onshore 54.60 66 426.80 72
Offshore 34 167.00 28 -
Total U.S. 82.60 100 593.80 100 = B
s,/ Mean estimates of undiscovered recoverable resources of crude oil and natural gas for the United States
Source: "Estimates of Undiscovered Recoverable Conventional Resources of Oil and Gas in the United States" Geological Survey Circular 860, U.'S. Department of the Interior, 1981.

APPENDIX II APPENDIX II
The above forecasted discovery rates show the current percent of domestic oil production from onshore leases is expected to decrease in the future while the proportionate split between onshore and offshore gas production remains relatively unchanged. We assumed for purposes of this report that the percent of domestic onshore oil production would decline steadily and uniformly from 90 percent in 1981 to the forecasted 66 percent by 1991 and then remain constant through the year 2000. For gas, we assumed onshore production would change only slightly, from 73 percent in 1981 to 72 percent by 1991 and then remain constant thereafter.
Table 3 shows the proportion of onshore oil and gas production expected to come from competitive and noncompetitive Federal leases and the amount of production estimated to come from new leases each year. We assumed the proportion of onshore production from Federal leases would remain constant and at the current levels of approxi- mately 5.5 percent and 7.0 percent of total onshore production for oil and gas respectively. The percentages of production from com- petitive leases are 19 percent for oil and 6 percent for gas, based on recent experience, and we assumed new leases would provide from 5 to 10 percent of oil and gas production each year. It is this production from new leases that will be subject to increased roy- alty rates.
The estimates of new production from competitive and non- competitive leases were used .to project the amounts of oil and gas produced each year that would be subject to the higher royalty. We assumed lead times of 3 and 5 years from lease issuance to pro- duction for competitive and noncompetitive leases respectively. We also assumed that 1983 would be the first year when new leases con- taining the increased royalty rates could be issued because of the need for requisite legislative and regulatory modification. There- fore, 1986 would be the first year production subject to the higher royalty might be expected from new competitive leases, and 1988 would be the first year of higher royalty production from non- competitive leases.
Value of production
Oil and gas price projections in 1981 dollars are also shown in table 1 and are based on the forecasts listed in appendix III. Together with the new production estimates, they provided the basis for calculating the “high-low” production values and increased roy- alty estimates detailed in tables 2-2 and 2-3 in chapter 2.
The production and price estimates and the resultant increased royalty projections discussed in chapter 2 were all expressed in the form of “high-low” ranges to accommodate the many uncertainties inherent in the forecasts used and the possible adverse impacts that could result from higher royalties. We assumed any adverse impacts would fall within the ranges projected.
24
“:, : ,/,“_,’ ,, : ,., .’ ,, ‘. ,, & :’
/_ ’

Table 3
Estimated Federal Onshore Oil and Gas Production, 1982-2000 3
Natural Gas (billions of cubic feet) z II.--
New Production Oil (millions of barrels)
New Production (note c) .__
Non- Non- (note c)
NQB-
Total Competitive Competitive (note a) - (note b) (note h)
Competitive Compet i t iv0 Competitive Competitive
907.0 54.4 k.6 1027.1 61.6 965.5 894.3 53.7 840.6
1022.0 61.3 960.7 884.0 53.0 831.0
1022.0 61.3 960.7 873.8 52.4 821.4
1022.0 61.3 960.7 868.7 52.1 816.6
1022.0 61.3 960.7 863.6 51.8 811.8
1032.2 61.9 970.1 861.0 51.7 809.3
1062.9 63.8 999.1 858.5 51.5 807.0
1073.1 64.4 1008.7 858.5 51.5 807.0
1093.5 65.6 1027.9 846.7 50.8 795.9
1098.7 65.9 1032.8 846.7 50.8 795.9
1108.8 66.5 1042.3 846.7 50.8 795.9
1123.9 67.4 1056.5 846.7 50.8 795.9
1149.1 69.0 1080.2 846.7 50.8 795.9
1164.2 69.9 1094.4 846.7 50.8 795.9
1194.5 71.7 1122.8 846.7 50.8 795.9
1209.6 72.6 1137.0 821.5 49.3 172.2
1234.8 74.1 1160.7 PO6.4 48.4 758.l-l
1360.0 75.6 llE4.4 791.3 47.5 7X3.3
1285.2 77.1 1208.1
Total Competitive Competitive (note a) (note b) (note b) -.___ -
149.4 28.4 184.5 35.1 143.4 27.2 177.6 33.7 138.0 26.2 170.3 32.4 125.6 23.9 164.9 31.3 119.3 22.7 159.6 30.3 113.5 21.6 154.7 29.4 108.7 20.7 150.6 28.6 _ 103.2 19.6 148.4 28.2 97.8 18.6
144.8 27.5 93.7 17.8
141.6 26.9 93.3 17.7
143.4 27.3 92.9 17.7
144.8 27.5 92.9 17.7
147.4 28.0 92.9 17.7
148.8 28.3 89.7 17.0
151.7 28.8 87.1 16.6
153.2 29.1 84.2 lh.0
155.0 29.5 22.0 15.6
157.5 29.9 73.5 15.1
156.1 'Q.7
121.0 1.42 149.4 3.51 116.2 1.36 143.9 3.37 111.8 1.31 137.9 3.24
Year/Range : Lo i 6.05
14.94 5.81
14.39 5.59
13.79 5.09
13.36
2.72 6.16 2.69 6.13 2.65 6.13 2.62 6.13 2.61 6.13 2.59 6.19 2.59 6.38 2.58 6.44 2.58 6.56 2.54 6.59 2.54 6.65 2.54 6.74 2.54 6.90 2.54 6.99 2.54 7.17 2.54 7.26 2.46
42.63 96.55 42.03 96.07 41.55 96.07 4X-U 96.Cf 4o.lw 96.07 40.59 97,631 40.47 99.91 40.35
loo.87 40.35
102.79 39.80
103 * 28 39.80
104.23
1iwF 39.80
108 _ GZ 39-w
109.44 39 -cc
112.28 39.m
113.70 38.Ci
116.07 37.90
113.44 -37.19
120..!?l l$+ rd 3
.I'
I -.
1982 1OW
high 1OW 1983 high low
I'84 high 1985 low
high 101.7 133.6
1.20 3.13
96.6 129.3 91.9
125.3 88.0
122.0 83.6
120.2 79.2
117.3 75.9
114.7 75.6
116.2 75.3
117.3 75.3
119.4 75.3
120.5 72.7
122.9 70.6
124.1 68.2
125.6 66.h
127.6 64 .J!
116.4
1.14 3.03 1.08 2.94 1.04 2.86 0.98 2.82 0.93
4.83 12.93 1986 ‘Ow high
1987 low high
1988 low high
4.60 12.53 4.40
12.20 4.18
12.02 3.96
11.73 3.80
11..47 3.78
11.62 3.76
11.73 3.76
11.94 3.76
12.05 3.63
12.29 3.53
12.41 3.41
12.56,
1989 low
high -7: low '. I N 1990
VI high 1OW
199' high
2.75 0.89 2.69 0.89 2.73 0.88 2.75 0.88 2.80 0.88 2.83 0.85 2.88 0.83 2.91 0.30 2.95 0.78 7.99 0.76 2.97
;, f
1992 low high
1993 lLJw high t994 iOW
high 1995 low
high 1996 low
high 1997 low
high f998 low
high I?99 10U
hig!l
2000 ,:;;r
7.41 2.42 ? 1.7 _. _-
12.76 7.56 2.37 7.71
3.22 12.64
a/Based on current percentages of total production from Federal lease, 5.5 percent for oil, 7.0 percent for gas.
b/Based on recent experience which shows competitive leases account for approximately 10 percent and 6 percent of oil and gas production resPcctivelY. -
c/Annual production from new leases (i.e., - leases issued after 1982). assumd to in fro< 5 to 10 percent of each year's total prduction.

APPENDIX III APPENDIX III
FORECASTS USED TO DERIVE OIL AND GAS
PRODUCTION AND PRICE ESTIMATES, 1982-2000
"United States Crude Oil Forecast," 1981 - 1990, Chemical Systems, Inc., April 1982.
"Onshore Oil And Gas Royalty Projections," Minerals Management Service, U.S. Department of the Interior, April 1982.
“U.S. Government Receipts from Minerals, Projections of Future Receipts, and Comparisons of U.S. Receipts With Those of Other Governments," Congressional Research Service, The Library of Congress, March 1982.
"1981 Annual Report to Congress, Volume 3, Energy Projections," DOE,'EIA-0173(81)13, Energy Information Administration, U.S. Department of Energy, February 1982.
"Revenue From Oil And Gas Leases In Outer Continental Shelf And Onshore Lands Under Federal Jurisdiction," Congressional Research Service, The Library of Congress, February 1982.
"The Gas Energy Supply Outlook: 1980-2000," American Gas Associa- tion, January 1982.
"Energy Projections to the Year 2000," DOE/PE-0029, U.S. Department of Energy, July 1981.
"U.S. Energy Strategies: Some Options for Eliminating Oil Imports by the Year 2000," MTP81W0002, The Mitre Corporation, April 1981.
"Actions Needed to Increase Federal Onshore Oil And Gas Exploration And Development," EMD-81-40, U.S. General Accounting Office, February 1981.
"The Energy Factbook - Data on Energy Resources, Reserves, Produc- tion, Consumption, Prices, Processing, and Industry Structure," Congressional Research Service, The Library of Congress, November 1980.
"Oil and Natural Gas from Alaska, Canada, and Mexico--Only Limited Help for U.S.," EMD-80-72, U.S. General Accounting Office, September 1980.
"Analysis of Current Trends in U.S. Petroleum And Natural Gas Produc- tion," EMD-80-24, U.S. General Accounting Office, December 1979.
"EIA Administrator's Annual Report, 1978," U.S. Department of Energy, July 1979.
"Energy 1979-2000," Tenneco, June 1979.
26
APPENDIX III APPENDIX III
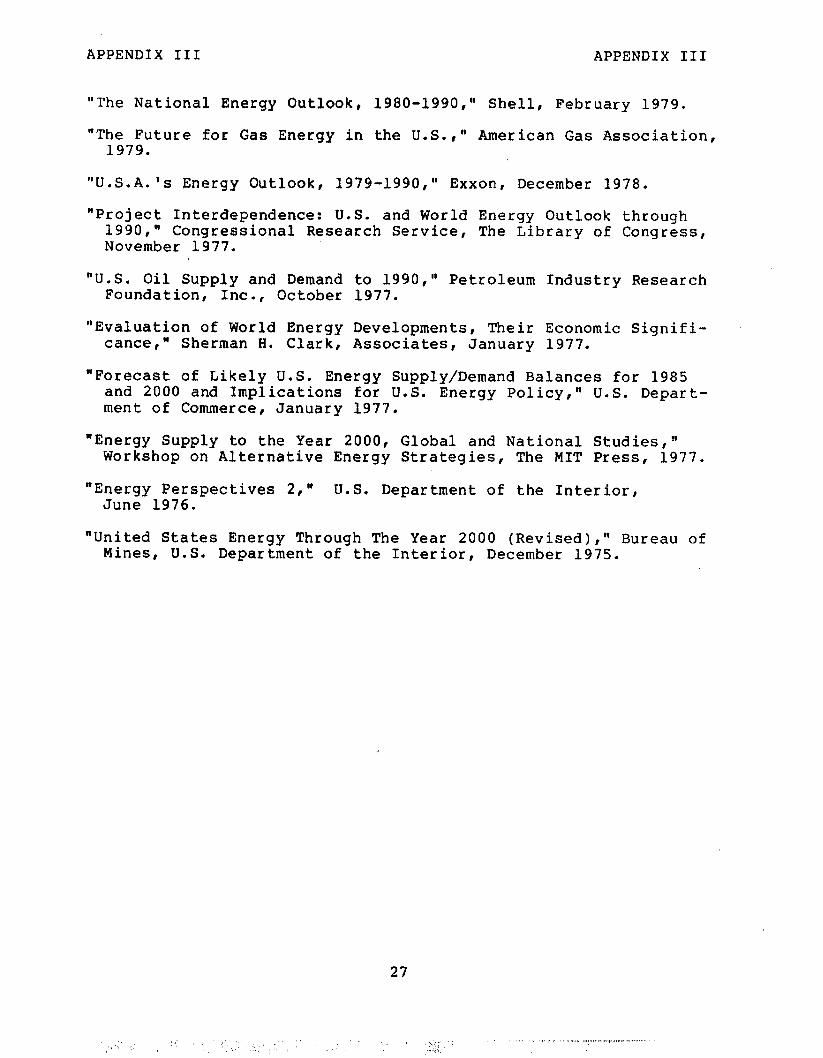
"The National Energy Outlook, 1980-1990," Shell, February 1979.
"The Future for Gas Energy in the U.S.," American Gas Association, 1979.
"U.S.A.'s Energy Outlook, 1979-1990," Exxon, December 1978.
'Project Interdependence: 1990,"
U.S. and World Energy Outlook through Congressional Research Service, The Library of Congress,
November 1977.
"U.S. Oil Supply and Demand to 1990," Petroleum Industry Research Foundation, Inc., October 1977.
"Evaluation of World Energy Developments, Their Economic Signifi- cance," Sherman H. Clark, Associates, January 1977.
"Forecast of Likely U.S. Energy Supply/Demand Balances for 1985 and 2000 and Implications for U.S. Energy Policy," U.S. Depart- ment of Commerce, January 1977.
'Energy Supply to the Year 2000, Global and National Studies," Workshop on Alternative Energy Strategies, The MIT Press, 1977.
"Energy Perspectives 2," U.S. Department of the Interior, June 1976.
"United States Energy Through The Year 2000 (Revised)," Bureau of Mines, U.S. Department of the Interior, December 1975.
27

APPENDIX IV APPENDIX IV
LOCATIONS VISITED TO REVIEW OIL,AND
GAS LEASES FOR PRIVATE LANDS
Alaska
Fairbanks - North Star Borough - Fairbanks, Alaska Matanuska - Susitna Borough - Palmer, Alaska
Colorado
Adams County - Brighton, Colorado Arapahoe County - Littleton, Colorado Fremont County - Canon City, Colorado Huerfano County - Walsenburg, Colorado
Montana
Custer County - Miles City, Montana Granite County - Philipsburg, Montana Missoula County - Missoula, Montana Richland County - Sidney, Montana
New Mexico
Colfax County - Raton, New Mexico Rio Arriba County - Tierra Amarilla, New Mexico San Juan County - Aztec, New Mexico Union County - Clayton, New Mexico
Tennessee
Cumberland County - Crossville, Tennessee Overton County - Livingston, Tennessee Putman County - Cookeville, Tennessee
Texas
Wise County - Decatur, Texas Montague County - Montague, Texas
Wyoming
Laramie County - Cheyenne, Wyoming Sweetwater County - Green River, Wyoming Uinta County - Evanston, Wyoming
28

APPENDIX V APPENDIX V
1.
2.
3.
4.
5.
6.
7.
8.
9.
PAST GAO REPORTS
DEALING WITH ONSHORE OIL AND GAS LEASING ISSUES
Letter report to several Congressmen on effects of increasing filing fees for noncompetitive onshore oil and gas leases, END-82-67, March 19, 1982
"Accelerated Onshore Oil and Gas Leasing May Not Occur As Quickly As Anticipated," EMD-82-34, February 8, 1982.
"Oil and Gas Royalty Collections--Longstanding Problems Costing Millions," AFMD-82-6, October 29, 1981.
"Possible Ways to Streamline Existing Federal Energy Mineral Leasing Rules," END-81-44, January 21, 1981.
"Actions Needed To Increase Federal Onshore Oil and Gas Exploration And Development," EMD-81-40, February 11, 1981.
"Changes In Public Land Management Required To Achieve Congressional Expectations," CED-80-82, July 16, 1980.
"Impact Of Making The Onshore Oil And Gas Leasing System More Competitive," EMD-80-80, March 14, 1980.
"Onshore Oil and Gas Leasing --Who Wins The Lottery?" EMD-79-41, April 13, 1979.
"Oil and Gas Royalty Collections --Serious Financial Management Problems Need Congressional Attention," FGMSD-79-24, April 13, 1979.

APPENDIX VI APPENDIX Vf
Oil and Gas Leases
Total issued Total acreage
leases
Competitive Leases:
--Number Issued
COMPETITIVE AND NONCOMPETITIVE
OTL AND GAS LEASES ISSUED
1977 1978
10,714 10,624
l.12,847,419 12,619,897
334 Percent of total
leases 3.12%
--Acreage 80,529 Percent of total .68%
leases
Noncompetitive leases:
--Number issued 10,380 Percent of total
leases 96.88%
--Acreage 11,766,890 Percent of
total leases 99.32%
11,758
13,947,955
1980
10,509
11,256,574
299 '312 301
2.81% 2.65% 2.86%
76,438 62,447 71,623 .61% .45% .64%
10,325 11,446 10,208
97.19% 97.35% 97.14%
12,543,459 13,885,508 11,184,951
99.39% 99.55% 99.36%
Source: BLM Public Land Statistics.
30

f’
N!)~~~~~ x "571 I APPENDIX VII
YaW te %
42:: 4.28 5.0 5.625 5.667 6.5 6.667 7.0 7.5 7.75 7.97 8.0 8.75 0.0 1.87 2.5
"0::
otal
ROYALTY RATES OF PRIVATE LEASES
DATED DURING FIRST 3 MONTHS
OF 1982
State
008991 31
Alaska Colorado Montana
. 116
1"
2'
0' 0 2
0" 0 2
11 1 0 0
11 -o- 3 3 0 0 1
32 0 7 5 0 1
17 3 0 0 4 0
87 38 Z C
New Mexico Tennessee Texas Wyoming Total
46 38 422 0 0 6 0 0 5 0 7 20
11 0 13 0 0 9 0 0 1 8 6 48 0 0 2 0 10 17 0 0 5 6 0 6 0 0 3
22 4 62 5 0 9 0 0 1 1 0 1 1 0 14 0 0 1
100 65 Z S 645


