emergency food security assessment - wfp remote access
TRANSCRIPT

Part IVAnalysing EFSA data
Contents of Part IV
1 Introduction 1462 Essential concepts and methods 1482.1 Vulnerable groups, including livelihood groups 1482.2 Triangulation and convergence of evidence 150
3 Conducting a situation analysis 1523.1 Step 1: Synthesize contextual information 1533.2 Step 2: Estimate the numbers of food-insecure and malnourished 1533.2.1 Households facing major health risks 1553.2.2 Estimate the number of households that are food-insecure 1553.3 Step 3: Determine the characteristics of the households and
individuals facing food insecurity and malnutrition 1563.3.1 Using quantitative data 1573.3.2 Using qualitative data 1593.4 Step 4: Identify the reasons for food insecurity and malnutrition
and for risks to livelihoods 1603.5 Step 5: Determine whether food insecurity and malnutrition
are chronic or transitory 1623.6 Step 6: Estimate the severity of food insecurity and malnutrition 1643.6.1 Indicators of risks to lives and livelihoods 1643.6.1.1 Mortality and nutrition indicators 1643.6.1.2 Food security and coping strategy indicators 165
3.6.2 Using convergence of evidence from a series of indicators 1653.6.3 Using the food consumption or food access gap 168
4 Conducting a forecast analysis 1704.1 Identification of future opportunities and shocks 1704.2 Developing scenarios 1754.2.1 Procedures 1764.2.2 Contingency planning 1794.3 Identification of population groups affected under
the most likely scenario 1804.3.1 Population groups currently at risk 1804.3.2 Additional population groups expected to become at risk 1814.3.3 Combining current and predicted population groups
facing risk to food and nutrition security 1834.4 Estimation of the impact of shocks and opportunities
on livelihoods 1854.4.1 Conducting a food gap analysis 1874.5 Estimation of the numbers of people who will be affected
by shocks and opportunities 1914.5.1 Final estimate of numbers at risk 192
144 Emergency Food Security Assessment Handbook / second edition

5 Conducting a response analysis 1935.1 Factors related to risks to lives and livelihoods 1945.2 Entry points for interventions 1965.3 Other stakeholders’ interventions, and remaining gaps 1975.4 Response options 1995.4.1 Identification of response options 2005.4.2 SWOT analysis 2035.4.3 Ranking and prioritization of response options 2065.4.4 Targeting 207
6 Formulating recommendations for interventions and follow-up 209
145Part IV / Contents
PARTIV

146 Emergency Food Security Assessment Handbook / second edition
chapter 1
Introduction
The EFSA analytical process adopts a dynamic approach to interpret food andnutrition security by examining the current situation, as well as the past and the future:• Analysis of the current situation determines whether or not food security andnutrition are compromised now.
• Analysis of the past establishes trends: is the situation improving, deterioratingor remaining constant?
• Scenarios are developed for forecasting the direction and magnitude of futuretrends.
Throughout this analysis, the risks faced by the population are balanced againstthe population’s capacities – coping and resilience – and vulnerabilities.
To analyse the population’s food security and nutrition situation, communities aredisaggregated into groups that share similar livelihoods and are likely to be affectedby shocks in similar ways. These groups are considered individually; their specificlivelihood assets and strategies, the shocks to which they are exposed, and theircapacities and vulnerabilities are analysed in relation to the overall context. Otherrelevant issues, such as gender, HIV/AIDS and displacement, are also considered.
The EFSA analytical process is divided into two key stages, which are summarizedin Table 4.1.
Stage Objectives
Situationanalysis
• Describe the food security and nutrition status of the population• Identify the population’s coping strategies• Determine whether food insecurity and malnutrition are chronic or transitory
Forecastand responseanalysis
• Forecast the evolution of the situation, using scenarios – projections of howthe situation is likely to develop
• Determine the need, or otherwise, for external intervention• Determine the types of intervention that are appropriate, and theircharacteristics: level, duration, target groups, etc.
• Determine the capacities of the various stakeholders to provide assistance,and identify the remaining gaps
Table 4.1: Stages of EFSA analysis

The following sections explain these stages. It should be noted that analysis isiterative. Steps are often repeated as more information becomes available andunderstanding improves. The order presented here is generally the order in whichthe steps are taken. In a real assessment, numerous feedback loops exist, asinformation is refined and new questions are raised.
147Part IV / chapter 1: Introduction
PARTIV

148 Emergency Food Security Assessment Handbook / second edition
chapter 2
Essential conceptsand methods
This section explains some of the concepts that are essential to EFSA analysis,building on the guidance given in Parts II and III.
2.1 Vulnerable groups, including livelihood groups
In an EFSA, it is useful to distinguish population groups according to thecharacteristics that make them vulnerable. A household’s level of vulnerability reflectsthe extent to which it can cope with shocks affecting nutrition and food security.
During the assessment, the identification of vulnerable groups assists:• the sampling and identification of which groups to assess (see Part III), such aspeople displaced during a conflict;
• the identification of issues that affect vulnerability; for example, if adaptation ofthe Food and Nutrition Security Conceptual Framework (see Part I) indicatesthat vulnerability may be related to livestock ownership, groups would bedistinguished according to the size of their herds.
During the situation and response analyses, identification of the characteristicsthat affect vulnerability is used to:1.Estimate the impacts of a shock on different segments of the population;2.Target assistance, if provided; identification of the observable characteristics ofvulnerable groups is essential to targeting.
The characteristics thatmake a group vulnerable depend on the nature of the crisis. Forexample, in a conflict, the primary indicator of vulnerability might be displacement.Households would therefore be categorized as IDP or resident, andmost data analysiswould be based on these two groups. In other situations, gender, education level or thepresence of a chronic disease such as HIV/AIDS may be used to categorize groups.
In EFSAs, vulnerable population groups are usually defined according to livelihoods,particularly when the shock has an economic impact and its overall impact differsaccording to households’ livelihood assets and strategies. A livelihood group is

defined as: A group of people who share similar basic means of livelihood and lifestyles – the same main subsistence activities, main income activities and social andcultural practices – and face similar risks to food and nutrition insecurity.
Livelihood groups can be defined in various ways. When possible, pre-crisisdefinitions of livelihoods should be used,52 as this facilitates comparison. However,this may not be feasible, either because livelihood groups have not been previouslydefined, or because pre-crisis definitions are no longer relevant, such as whenlarge-scale displacement or other social change has occurred.
If pre-crisis definitions cannot be used, livelihood groups are defined according toprimary productive activity. This helps to ensure that the groups distinguishedare relevant to the local context. Which activities are defined as “primary productiveactivities” depends on the area and the ways in which local people describethemselves. Wherever possible, people from the affected area should be involvedin defining livelihood groups, through focus group or key informant interviews.
Examples of primary productive activities include:• subsistence farming;• cash crop farming;• pastoralism;• fishing;• petty trade;• daily labour.
Note that these categories do not denote the only productive activities undertakenby the households. For example, although subsistence farmers are likely to producea substantial proportion of the food they eat, they will probably supplement thisthrough other activities, such as selling cash crops or engaging in daily labour.
Once the livelihood groups have been defined, details of each group’s livelihoodstrategies are identified. For example, subsistence farmers may gain 60 percent oftheir food from own production, 20 percent from selling produce, 10 percent fromhandicrafts, and 10 percent from casual labour.
The number of livelihood groups defined depends on the complexity of theeconomic environment and the extent to which the crisis effects differ amonggroups, as illustrated in the following examples:• If locusts have destroyed crops, livelihood groups involved with crop productionand sales should be defined, such as the farmers who produced the damagedcrops, crop traders, labourers who are normally employed during the harvest,and people who purchase the crop in local markets.
149Part IV / chapter 2: Essential concepts and methods
PARTIV
_____________52. For example, the baseline information provided by WFP CFSVAs usually includes a description oflivelihood groups.

2.2 Triangulation and convergence of evidence
Triangulation is the process through which information from different sources iscompared to determine whether or not evidence converges.
• The outbreak of widespread conflict affects all sectors of the economy, but theimpacts are likely to vary according to livelihood group. Numerous livelihood groupsshould therefore be identified, and the impact of the crisis on each analysed.
When defining population groups, livelihoods can be combined with othercharacteristics. For example, if refugees are identified as a group at risk, they couldbe subdivided into livelihood groups: those whose livelihoods are based on dailylabour, those depending on food aid, etc.
Having established who is vulnerable to food insecurity, it is necessary tounderstand why they are vulnerable. This means examining the factors that affectfood security and nutrition, and the risks that food insecurity poses to thelivelihoods of affected households. It involves:• identifying the characteristics of food-insecure households and malnourishedindividuals;
• identifying the factors that contribute to food insecurity, malnourishment, copingmechanisms and specific vulnerabilities;
• determining the extent to which food security andmalnutrition problems are directlyrelated to the current crisis, or are persistent: are they chronic or transitory?
150 Emergency Food Security Assessment Handbook / second edition
A state of food insecurity may be chronic or transitory, depending on its evolution overtime:• Chronic food insecurity is a long-term or persistent inability to meet minimum foodrequirements. As a rule of thumb, food insecurity lasting for at least six months ayear can be considered chronic.
• Transitory food insecurity is a short-term or temporary inability to meet minimumfood requirements, indicating a capacity to recover. As a rule of thumb, limited periodsof food insecurity related to sporadic crises can be considered transitory.
These definitions do not presuppose the severity of the food insecurity; for example,transitory food insecurity may be short-lived but very severe. People who are chronicallyfood-insecure are likely to be particularly vulnerable to transitory food insecurity. Repeatedperiods of transitory food insecurity may lead to a situation of chronic food insecurity ifpeople do not have time to recover fully from one crisis before the next one arrives.
(See Section 3.5 and Technical Guidance Sheet No. 5 Distinguishing between Chronicand Transitory Food Insecurity in EFSAs, WFP Emergency Needs Assessment Service,December 2007.)
Box 4.1: Chronic and transitory food insecurity
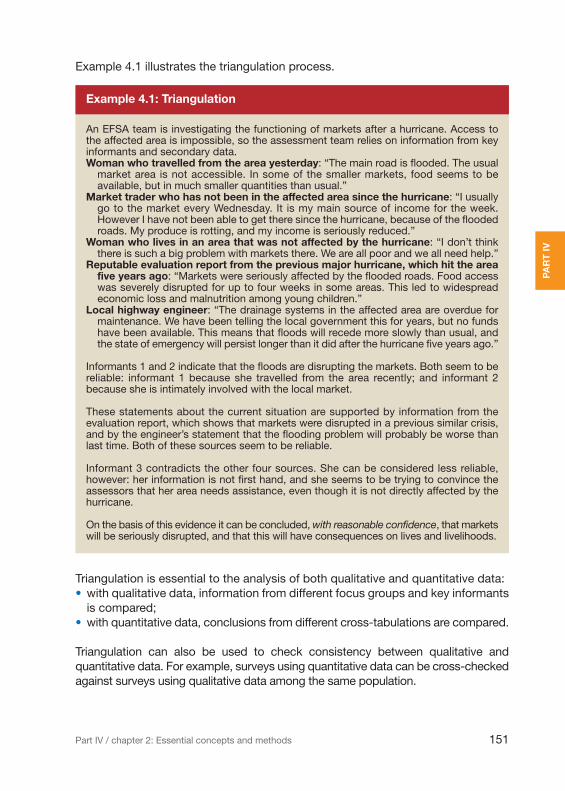
Example 4.1 illustrates the triangulation process.
151Part IV / chapter 2: Essential concepts and methods
PARTIV
An EFSA team is investigating the functioning of markets after a hurricane. Access tothe affected area is impossible, so the assessment team relies on information from keyinformants and secondary data.Woman who travelled from the area yesterday: “The main road is flooded. The usualmarket area is not accessible. In some of the smaller markets, food seems to beavailable, but in much smaller quantities than usual.”
Market trader who has not been in the affected area since the hurricane: “I usuallygo to the market every Wednesday. It is my main source of income for the week.However I have not been able to get there since the hurricane, because of the floodedroads. My produce is rotting, and my income is seriously reduced.”
Woman who lives in an area that was not affected by the hurricane: “I don’t thinkthere is such a big problem with markets there. We are all poor and we all need help.”
Reputable evaluation report from the previous major hurricane, which hit the areafive years ago: “Markets were seriously affected by the flooded roads. Food accesswas severely disrupted for up to four weeks in some areas. This led to widespreadeconomic loss and malnutrition among young children.”
Local highway engineer: “The drainage systems in the affected area are overdue formaintenance. We have been telling the local government this for years, but no fundshave been available. This means that floods will recede more slowly than usual, andthe state of emergency will persist longer than it did after the hurricane five years ago.”
Informants 1 and 2 indicate that the floods are disrupting the markets. Both seem to bereliable: informant 1 because she travelled from the area recently; and informant 2because she is intimately involved with the local market.
These statements about the current situation are supported by information from theevaluation report, which shows that markets were disrupted in a previous similar crisis,and by the engineer’s statement that the flooding problem will probably be worse thanlast time. Both of these sources seem to be reliable.
Informant 3 contradicts the other four sources. She can be considered less reliable,however: her information is not first hand, and she seems to be trying to convince theassessors that her area needs assistance, even though it is not directly affected by thehurricane.
On the basis of this evidence it can be concluded,with reasonable confidence, that marketswill be seriously disrupted, and that this will have consequences on lives and livelihoods.
Example 4.1: Triangulation
Triangulation is essential to the analysis of both qualitative and quantitative data:• with qualitative data, information from different focus groups and key informantsis compared;
• with quantitative data, conclusions from different cross-tabulations are compared.
Triangulation can also be used to check consistency between qualitative andquantitative data. For example, surveys using quantitative data can be cross-checkedagainst surveys using qualitative data among the same population.
152 Emergency Food Security Assessment Handbook / second edition
chapter 3
Conductinga situation analysis
Situation analysis focuses on the current food security and nutrition status of thepopulation at the time of the assessment. Ultimately, an EFSA situation analysisshould result in answers to the following core questions:1.How many people are food-insecure?2.Which population groups are at risk?3.Who are the people at risk?4.Why are they at risk?5.How severe is the situation?
A situation analysis should answer these questions by considering the followingfactors:• The status of food security and nutrition, and the factors that affect them –availability, access, utilization, health and care – among different communities,groups and individuals.
• The severity of food insecurity and nutrition problems among differentcommunities, groups and individuals.
• The type of coping strategies currently used to withstand the crisis.• The affect(s) of the shock on livelihoods.• The number of people affected, and their locations.
The severity of a food security or nutrition crisis depends on the extent to whichhealth and/or livelihoods are threatened. It is difficult to measure severity, orpotential severity, at the start of a crisis. It may be easier to measure it later, oncethe crisis has unfolded, for example, through nutrition surveys. By then, however,it may be too late to avert suffering and death. To avoid waiting until mortality andmalnutrition have reached unacceptable levels, severity can be estimated usingproxy indicators, as described in Part II, Section 5.3.
This section describes critical steps in conducting a situation analysis, each ofwhich is intended to answer the core questions. In an EFSA, the steps of situationanalysis are often carried out concurrently, and may be repeated several times asunderstanding of the situation improves. The steps for conducting a situationanalysis are:
Step 1: Synthesize contextual information to gain a broad understanding of thenature of the crisis.
Step 2: Use quantitative and qualitative data to estimate the numbersof households and individuals that are food-insecure and malnourished.
Step 3: Determine the characteristics of the households and individuals facingfood insecurity and malnutrition, and define their livelihood or otherrelevant characteristics.
Step 4: Identify the reasons why people are food-insecure and malnourished andwhy their livelihoods are at risk.
Step 5: Determine whether food insecurity and malnutrition are chronic ortransitory.
Step 6: Estimate the severity of food insecurity and malnutrition.
3.1 Step 1: Synthesize contextual information to gain a broadunderstanding of the nature of the crisis
A sound knowledge of the context is essential if the factors causing malnutritionand food insecurity and the linkages among these are to be understood. Contextualinformation is gathered from both secondary and primary sources (see Part II).
Contextual information is used continually to inform the analysis, particularly duringStep 5. Part II provides useful information for this. The analysis includes foodavailability from crop production and market supplies, and access to key services,particularly health and education.
Contextual information is constantly updated throughout the assessment.Assessors should always look for people who can enhance the assessment team’sunderstanding of the situation.
3.2 Step 2: Use quantitative and qualitative data to estimate thenumbers of households and individuals that are food-insecureand malnourished
The population groups that are likely to be facing food insecurity can be identified:• Select key indicators that measure food insecurity and coping strategies(see Part II).
• Define thresholds that indicate the degree of severity for each indicator orcombination of indicators (see Part II).
• Determine the numbers of individuals and households that are at risk accordingto each of the chosen indicators and thresholds.
• Estimate the numbers of individuals and households that are likely to be sufferingfrom food insecurity, as a proportion of the population sample.
153Part IV / chapter 3: Conducting a situation analysis
PARTIV

• Estimate the total number of people in the population whose food security is atrisk by multiplying the proportion of the sample that is at risk by the totalpopulation size.
It is often difficult to obtain accurate and up-to-date data on the total populationsize in crisis-affected countries. Technical Guidance Sheets53 Nos. 7, 10 and 11,provide guidance on methods for estimating population size when data areunavailable, unreliable or contested.
In some emergencies, it is impossible to obtain a random sample. In such cases,purposive sampling may be the best option available.
Example 4.2 illustrates this process.
154 Emergency Food Security Assessment Handbook / second edition
_____________53. Technical Guidance Sheet No. 7 Area Method to Estimate Population Size and Demographics inEmergency Food Security Assessments, A. Henderson, WFP Emergency Needs Assessment Service,September 2007; Technical Guidance Sheet No. 10 Using the Delphi Method to Estimate Population Sizeand Demographics in Emergency Food Security Assessments, A. Henderson, WFP Food Security AnalysisService, January 2008; Technical Guidance Sheet No. 11 T-Square Method to Estimate Population Size andDemographics in Emergency Food Security Assessments, A. Henderson, WFP Food Security AnalysisService, December 2008.
For an EFSA in a conflict-affected region, access to some parts of the region isimpossible. Large-scale displacement has occurred.
A household survey is undertaken, based on a purposive sample of three villages whereboth IDPs and residents live:• Residents and IDPs are consulted about social, economic, cultural and other variablesin the conflict-affected region during normal times.
• IDPs are consulted about their areas of origin, and when they travelled from theseareas. The most up-to-date information about these areas and their similarities withthose in which the survey is taking place are collected.
It is necessary to judge the extent to which the sample is representative of the widerpopulation. If discussions with residents and IDPs indicate that the situation in otherareas is broadly similar to that in the villages sampled, the conclusions of the assessmentcan be extended to the wider population with caution.
In the assessment report, the process of extrapolation should be explained in detail, andthe limits to its statistical validity stated clearly.
A more thorough assessment will be carried out as soon as access is possible.
Example 4.2: Extrapolation of conclusions when no random sample is available
3.2.1 Households facing major health risks
Nutrition data can be used to identify individuals and households that may befacing major health risks. When collecting nutrition data, statistical software istypically used to calculate the proportions of malnourished individuals. Theseproportions are extrapolated to the whole population of interest, if the sample isrepresentative.
Households that have poor food consumption at the time of the assessment andare expected to remain in that situation for the next month or more are likely toface major health risks, particularly among vulnerable members with addednutrition needs, such as young children, the sick and the elderly. Pregnant women’sexpected newborns are also likely to face major health risks.
Households that are using certain coping strategies and are expected to continueusing these in the next month or more could also face health risks. The copingstrategies concerned are context-specific, and include sustained skipping of meals,dropping of health treatment to save money for food, consumption of contaminatedwater for drinking and food preparation, and consumption of wild resources that areinappropriate for consumption.
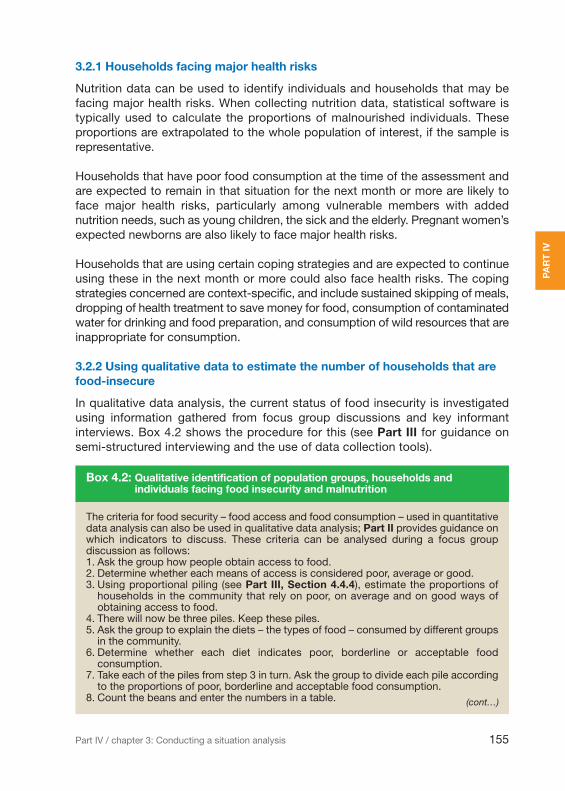
3.2.2 Using qualitative data to estimate the number of households that arefood-insecure
In qualitative data analysis, the current status of food insecurity is investigatedusing information gathered from focus group discussions and key informantinterviews. Box 4.2 shows the procedure for this (see Part III for guidance onsemi-structured interviewing and the use of data collection tools).
155Part IV / chapter 3: Conducting a situation analysis
PARTIV
The criteria for food security – food access and food consumption – used in quantitativedata analysis can also be used in qualitative data analysis; Part II provides guidance onwhich indicators to discuss. These criteria can be analysed during a focus groupdiscussion as follows:1. Ask the group how people obtain access to food.2. Determine whether each means of access is considered poor, average or good.3. Using proportional piling (see Part III, Section 4.4.4), estimate the proportions ofhouseholds in the community that rely on poor, on average and on good ways ofobtaining access to food.
4. There will now be three piles. Keep these piles.5. Ask the group to explain the diets – the types of food – consumed by different groupsin the community.
6. Determine whether each diet indicates poor, borderline or acceptable foodconsumption.
7. Take each of the piles from step 3 in turn. Ask the group to divide each pile accordingto the proportions of poor, borderline and acceptable food consumption.
8. Count the beans and enter the numbers in a table.
Box 4.2: Qualitative identification of population groups, households andindividuals facing food insecurity and malnutrition
(cont…)
The qualitative approach can be applied to investigating other types of risk tolivelihoods that were not anticipated when the assessment was planned. This is amajor strength of the qualitative approach. Informants are asked to explain risksin their own terms and to identify the individuals and groups that are vulnerable tothese risks. Numbers of people at risk are estimated as described in Box 4.2.
3.3 Step 3: Determine the characteristics of the households andindividuals facing food insecurity and malnutrition, and definetheir livelihood or other relevant characteristics
Step 2 defined the numbers of individuals and households who are food-insecure.In Step 3, profiles of these people are developed. The aim of this step is to:• categorize the livelihoods of the people who are food- and nutrition-insecure;• define easily recognizable characteristics that can be used to identify at-riskpeople – IDPs, women-headed households, pastoralists, etc. – for targeting,should an intervention be necessary.
Profiling is done by:• cross-tabulating, or matching in the case of qualitative data, the food-insecurepeople with their livelihood characteristics, at the individual, household,community and national levels;
• defining population groups that can be used for targeting, such as livelihoodgroups.
156 Emergency Food Security Assessment Handbook / second edition
Coping strategies are investigated in a similar way to that proposed for analysingquantitative data, adapted as follows:1. List the coping strategies that people use, and the severity related to each, asexplained in Part II, Section 7.3.4.
2. For each group, check whether its members are using damaging coping strategies.This may result in re-categorization of some groups. For example, people who arefound to use highly damaging coping strategies may be re-categorized as severelyfood-insecure.
Having determined the proportion of people at risk in the community, the number canbe estimated using population figures for the community. These may come from acensus, a village/town/district register, estimation by community members, or any othersource that is appropriate to the context.
It is advisable to harmonize, as much as possible, the ways in which differentcommunities describe food consumption and access, to facilitate comparison amongcommunities.
In an assessment, similar exercises are undertaken in different communities. The resultsare triangulated to determine the level of confidence with which they can be treatedand the extent to which generalizations can be made about the wider area andpopulation.
(cont…)

When nutrition status data are available, it is useful to cross-tabulate or comparethese with the information collected during the nutrition and food securitycomponents of the assessment. This provides information about the characteristicsof the households where malnutrition exists, and the possible causes ofmalnutrition. The way in which cross-tabulations and comparisons are madedepends on the data collection approach. Table 4.2 provides guidance on thisaspect of analysis.
157Part IV / chapter 3: Conducting a situation analysis
PARTIV
Methodology for collectingnutrition information
Cross-tabulations and comparisons
Anthropometric data collectedsimultaneously with food security,health and care information:Same householdsSame geographical areaSame time
Direct cross-tabulation/comparisonof malnutrition with:• Household food security status• Food access and consumption indicators• The health and public health environment• Care information
Anthropometric data collected inparallel with food security, healthand care information:Different householdsSame geographical areaSame time
Comparison between the geographical concentrationof malnutrition and geographical information on:• Household food security status• The health and public health environment• Care information
Only household food security,health and care informationavailable:Anthropometric data not collectedand not available from other surveys
Only hypotheses of the nutrition situationcan be made, based on:• Household food security status• Food consumption patterns, preferably at theindividual level
• The public health environment• Care information
Table 4.2: Characteristics of households where malnutrition exists
3.3.1 Using quantitative data to create profiles of households andindividuals facing food insecurity and malnutrition
With quantitative data, each food- and nutrition-insecure individual and householdis cross-tabulated against a range of livelihood characteristics, such as:
• key livelihood characteristics, which should be included in every assessment;• context-specific livelihood characteristics, which depend on the communitiesand areas being assessed and the nature of the crisis.
The following key livelihood characteristics should always be considered:• Locations of individuals and households: name of area, village, town, etc.• Residential status of households: resident, IDP, refugee, returnee, hostingdisplaced people, etc.
• Sex, age and health status of individuals whose nutrition status is measured.• Sex, age and education level of heads of households.

• Size and age composition of households, including dependency ratio54 orproportion of dependants,55 where appropriate.
• Sources of food for individuals and households.• Sources of income for individuals and households.• Markets: physical access to markets in distance and time, proportions/amountsof food and other items purchased at markets.
• Coping strategies used by individuals and households.• Health and disability status of household members, with details of diseases,chronic sickness and disability.
• Health care access: physical access to health services, constraints to healthcare access.
• Water access: quantity and quality of households’ water sources, distance(s) tothem.
• Sanitation facilities: types and extent of usage by household members.• Housing: type and quality, protection from heat, cold, rain, wind, etc.• Assets: types, numbers and values (when/if possible).
Other livelihood characteristics and their relevance to risks of food insecurity arecontext-specific. These are identified through:• contextual analysis of the specific community and the factors that affect it;• analysis of the changes affecting the community as a result of the current crisis.
Context-specific characteristics are identified on the basis of the backgroundinformation gathered in Step 1 (see Section 3.1).
Cross-tabulations are used to develop a series of profiles of individuals andhouseholds at risk. Other statistical techniques such as regression analysis canalso be used.
Having profiled the food- and nutrition-insecure individuals and households, thenext step is to define easily identifiable at-risk groups. These may be livelihoodgroups or other relevant groups (see Section 2.1). If possible, groups should bedefined in the same ways as they were before the crisis, to facilitate comparison.If groups were not defined before the crisis or if the definitions of groups are nolonger relevant, livelihood groups must be defined on the basis of the survey data.
158 Emergency Food Security Assessment Handbook / second edition
_____________54. The household dependency ratio is the number of individuals aged under 15 or over 64 years, dividedby the number of individuals aged 15 to 64 years, expressed as a percentage. Age thresholds may haveto be adapted to the norms in the country concerned.55. The proportion of dependants is the number of dependent household members divided by the totalnumber of household members, expressed as a percentage. Definition of a dependant is context-specific,and may include people who are under a certain age, over a certain age, chronically sick, or disabled.
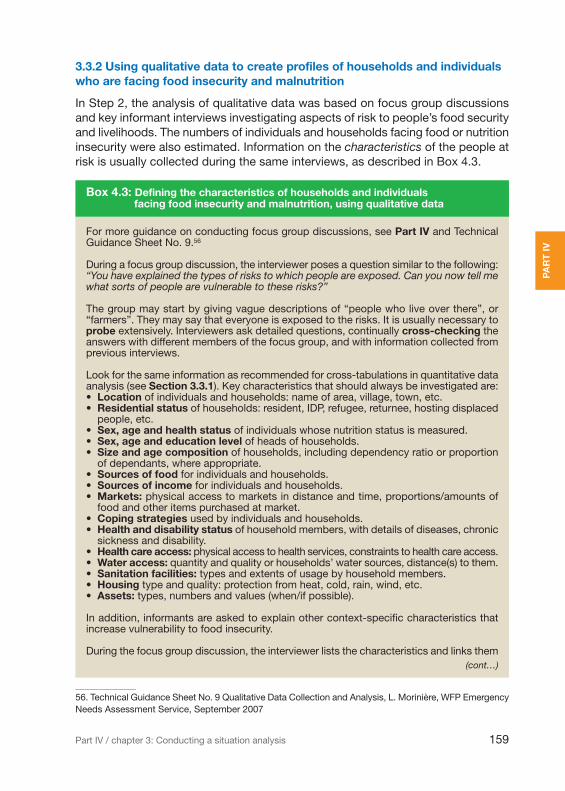
3.3.2 Using qualitative data to create profiles of households and individualswho are facing food insecurity and malnutrition
In Step 2, the analysis of qualitative data was based on focus group discussionsand key informant interviews investigating aspects of risk to people’s food securityand livelihoods. The numbers of individuals and households facing food or nutritioninsecurity were also estimated. Information on the characteristics of the people atrisk is usually collected during the same interviews, as described in Box 4.3.
159Part IV / chapter 3: Conducting a situation analysis
PARTIV
_____________56. Technical Guidance Sheet No. 9 Qualitative Data Collection and Analysis, L. Morinière, WFP EmergencyNeeds Assessment Service, September 2007
For more guidance on conducting focus group discussions, see Part IV and TechnicalGuidance Sheet No. 9.56
During a focus group discussion, the interviewer poses a question similar to the following:“You have explained the types of risks to which people are exposed. Can you now tell mewhat sorts of people are vulnerable to these risks?”
The group may start by giving vague descriptions of “people who live over there”, or“farmers”. They may say that everyone is exposed to the risks. It is usually necessary toprobe extensively. Interviewers ask detailed questions, continually cross-checking theanswers with different members of the focus group, and with information collected fromprevious interviews.
Look for the same information as recommended for cross-tabulations in quantitative dataanalysis (see Section 3.3.1). Key characteristics that should always be investigated are:• Location of individuals and households: name of area, village, town, etc.• Residential status of households: resident, IDP, refugee, returnee, hosting displacedpeople, etc.
• Sex, age and health status of individuals whose nutrition status is measured.• Sex, age and education level of heads of households.• Size and age composition of households, including dependency ratio or proportionof dependants, where appropriate.
• Sources of food for individuals and households.• Sources of income for individuals and households.• Markets: physical access to markets in distance and time, proportions/amounts offood and other items purchased at market.
• Coping strategies used by individuals and households.• Health and disability status of household members, with details of diseases, chronicsickness and disability.
• Health care access: physical access to health services, constraints to health care access.• Water access: quantity and quality or households’ water sources, distance(s) to them.• Sanitation facilities: types and extents of usage by household members.• Housing type and quality: protection from heat, cold, rain, wind, etc.• Assets: types, numbers and values (when/if possible).
In addition, informants are asked to explain other context-specific characteristics thatincrease vulnerability to food insecurity.
During the focus group discussion, the interviewer lists the characteristics and links them
Box 4.3: Defining the characteristics of households and individualsfacing food insecurity and malnutrition, using qualitative data
(cont…)

3.4 Step 4: Identify the reasons why people are food-insecureand malnourished and why their livelihoods are at risk
This step is the same for both quantitative and qualitative data analysis, althoughstatistical analysis can be applied to quantitative data to help determine risk factors.
Knowledge of the context (Step 1) is combined with the characteristics of thepeople facing food insecurity and malnutrition (Step 3) to draw conclusions aboutthe reasons why people are at risk:• The characteristics of each group are compared with the nature of the riskaffecting the group and the characteristics of the people who are not at risk.
• Judgement and a thorough knowledge of the context are used to drawconclusions about which characteristics are associated with risk.
Example 4.3 illustrates this process.
160 Emergency Food Security Assessment Handbook / second edition
to the specific risks identified in Step 2. At the end of the discussion, she/he reads outthe list and the linkages to ensure that he/she has understood correctly.Information from different discussions and interviews must be compared andtriangulated. If there is solid convergence of evidence, it can be concluded that thesecharacteristics contribute to food insecurity. If evidence does not converge, the analystsmust look for reasons why. The following are some possible explanations:• Informants from different groups are talking about different at-risk populations.• Informants have different perceptions of risk.• Some interviews and discussions were conducted more thoroughly than others.• Information has been misinterpreted.
Wherever possible, inconsistencies should be identified during the interview or discussion(see guidelines on interview technique inPart III). This facilitates on-the-spot revision of data.
Groups that are at risk are then profiled on the basis of the characteristics described bythe informants (see Section 2.1 for ways of defining groups).
A crisis is characterized by:• high rates of malnutrition, leading to health risks among under-5 children in group X;• no obvious problem with food security: food consumption, food access and copingstrategies all indicate that households are not food-insecure or facing risk tolivelihoods.
Households in group X have the following characteristics:1. Livelihoods are based on agriculture, growing crops for own consumption and sale.2. Most household heads are male, aged between 25 and 60 years.3. Education levels are low, particularly among women.4. Health access is good; there is a well-stocked and well-staffed clinic close by.5. Market access and functioning are good, and prices are normal for the season.6. Water quality and quantity are poor; water is collected from a well with a declining yield.
Example 4.3: Identifying the reasons why people are at risk
(…cont)

The factors associated with risk are more effectively determined whenconsultations are held among members of the assessment team, representativesof the affected communities and technical experts. If shortage of time makes itimpossible to convene this ideal group, a group of assessment team and countryoffice representatives can undertake the analysis.
Table 4.3 gives some examples of people who may face risks to health andlivelihoods, and possible reasons why they are at risk.
161Part IV / chapter 3: Conducting a situation analysis
PARTIV
Each of these characteristics is compared with the nature of the risks:1. The type of livelihood does not seem to be a risk-causing factor, as food security issatisfactory.
2. There is no obvious causal link between malnutrition and the sex of the household head.3. The low education level among women may lead to poor care, food preparation andwater handling practices.
4. Households appear to have good access to curative health care.5. Effective markets indicate that farmers should be able to sell their produce and buyessential items.
6. Poor water supplies could lead to disease and malnutrition among young children.
On the basis of this analysis, it would appear that the main risk-related characteristicsamong group X are:• low levels of female education;• poor water supplies.
Once these hypotheses are made, further evidence is sought to corroborate or refute them.If random sampling and quantitative data are used, the primary factors associated withmalnutrition can be ascertained through regression analysis. Triangulation with informationfrom other sources – key informants, health data, etc. – can strengthen this analysis.
Individuals or group at risk Possible reasons for vulnerability
Children under 5living in area X
• Mothers spend many hours a day collecting fuel and water, so are unable todedicate sufficient time to preparing food and feeding their young children
School-aged children Long-term livelihoods are compromised because:• children are taken out of school to work;• children who attend school are malnourished, and therefore unable to learn well
Nomadic livelihood group:households’ main productiveactivity is raising animals for thesale of animal products
• Drought causes deaths and poor health among animals, making ownerseager to sell; livestock prices decrease, and nomads also have fewer dairyproducts to sell
• Low livestock prices and reduced sales of products reduce income; food accessdeclines and animals are sold beyond the regenerative capacity of the herd
Petty traders livelihood group:households’ main productiveactivity is the trade of smallquantities of food and othercommodities
• Insecurity makes roads unsafe, reducing the movement of goods and people;income from trade disappears
Internally displaced people • Loss of livelihood assets and strategies leads to loss of income and food
Table 4.3: Examples of individuals and households who may face risks to healthand livelihoods, and possible reasons why

Causality is often two-way, and feedback loops frequently exist. The followingare examples:• Food insecurity might cause malnutrition, because household members areunable to obtain and consume sufficient quantities or diversity of foodstuffs.
• Malnutrition might cause food insecurity, because productive householdmembers are weakened, become unable to work and, hence, are unable to earnenough money with which to obtain food.
Analysts should be careful not to confuse associationwith causality, as illustratedin Example 4.4.
162 Emergency Food Security Assessment Handbook / second edition
An agricultural area is affected by floods just before the harvest. Most of the staple cropsare lost. Soon after this event, abnormally high levels of acute malnutrition are foundamong children in the area.
It might be assumed that flood damage to crops has resulted in low food availability and,hence, malnutrition. However, closer analysis reveals that food availability is satisfactorybecause markets are functioning well. The households with malnourished children arethose that depend on daily labour – in normal times they rely on harvesting work to earnmoney for food purchases. They are unable to work because of crop destruction. Theprimary cause of the problem is therefore low food access among certain livelihoodgroups, and not low food availability due to harvest failure.
Example 4.4: Association and causality
The choice of appropriate cross-tabulations depends on the context, thehypotheses made when adapting the Food and Nutrition Security ConceptualFramework, and the distribution of the variables in the sample.
3.5 Step 5: Determine whether food insecurity and malnutritionare chronic or transitory
The distinctions between chronic and transitory food insecurity were explained inSection 2.1. It is important that an EFSA distinguish between chronic and transitoryfood insecurity as they are likely to require different types of response, in terms ofboth the design and the duration of interventions. Interventions aimed at addressingchronic food insecurity typically last for several years and focus on the underlyingand basic causes of food and livelihood insecurity. Responses to transitory foodinsecurity may focus on the immediate causes of food insecurity and last severalmonths. In some instances, however, it may be important for short-terminterventions also to address underlying causes of food insecurity in order toprevent repeated transitory food insecurity that may lead to chronic food insecurity.
To determine whether food insecurity and malnutrition are chronic or transitory,

information about the situation before the crisis must be collected. The followingquestions should be addressed:• Did food insecurity and/or malnutrition exist before the current crisis?• If so, what were the nature, underlying causes, extent and severity of the foodinsecurity and/or malnutrition? How different were these from the currentsituation?
• Which groups were affected, and how different were they from the groups thatare currently facing food insecurity and/or malnutrition?
To answer these questions, it is necessary to analyse:• pre-crisis data;• crop production, market and price data for the previous three to five years;• data on all relevant issues – such as malnutrition rates (including stunting),disease prevalence, livelihoods, poverty, food production and market features –for the equivalent period in other years, to account for seasonal factors.
If the pre-crisis situation is not documented, it must be compiled retrospectively.57
This is best done using qualitative data from focus group discussions, keyinformant interviews and secondary data review (see Box 4.4), possiblycomplemented with retrospective questions included in a formal householdquestionnaire.
163Part IV / chapter 3: Conducting a situation analysis
PARTIV
The characteristics of the food- and nutrition-insecure population were defined in Step 3.In this step, the focus group discusses the pre-crisis situation. Interviewers may ask thefollowing questions:• Who was affected by food insecurity before the crisis? Locally adapted terminologyand concepts should be used to define food insecurity. What coping strategies wereused, and by whom? Where possible, groups of individuals and households aredefined according to the same criteria used in Step 4.
• If pre-crisis food- and nutrition-insecure groups were similar to those at risk during thecurrent crisis, have the proportions and/or numbers of people facing food insecurityand malnutrition increased?
If pre-crisis food- and nutrition-insecure groups were different from those that arecurrently food- and nutrition-insecure, what are the reasons for this?
Box 4.4: Compilation of pre-crisis information using a focus group discussion
_____________57. It is important to anticipate the need for these data and to review secondary data early on during the EFSA.
Information about the nature of the risks (Steps 2 and 4) can also provideindications about whether food insecurity and malnutrition are chronic or transitory.For example:• Stunting is a sign of long-term malnutrition, and therefore indicates a chronicproblem that could be caused by persistent food insecurity and/or a poor healthenvironment.

Wasting is a sign of short-term malnutrition, and therefore might indicate atransitory problem of food insecurity and/or infectious disease; wasting can also bedue to recurrent, possibly seasonal, problems.
Distinctions between chronic and transitory food insecurity are also linked to thetype of factors associated with malnutrition and livelihood insecurity. Thesevariables can be either structural or dynamic:• Structural variables relate to the underlying contextual factors that affectindividuals and communities in the area in which they live. These variables do notchange quickly, and can influence livelihood outcomes. Such factors can include:local climate, soil type, local governance system, public infrastructure – roads,drainage, etc., land tenure, and inter-ethnic relations.
• Dynamic variables relate to features that can change quickly. They tend to beindicators of transitory problems, which may exacerbate existing chronicproblems. Examples include: infectious disease, displacement, change of marketfunctioning, fluctuation in labour demand, ownership of assets, level ofindebtedness, labour migration patterns, and size of harvest.
Further guidance on chronic and transitory issues is provided in Technical GuidanceSheet No. 5.58
3.6 Step 6: Estimate the severity of food insecurity andmalnutrition
Severity at the population level can be estimated in three ways:1.Through the prevalence of food insecurity and borderline food insecurity, andanalysis of food access gaps.
2.According to the numbers of individuals and households found to have healthand livelihoods at risk, based on nutrition, mortality and food security indicatorinformation (Step 2, see Section 3.2).
3.Through convergence of evidence, using multiple indicators.
Where possible, these methods should be combined.
3.6.1 Indicators of risks to lives and livelihoods
3.6.1.1 Mortality and nutrition indicators
There are standard thresholds for mortality and nutrition indicators (see Part II).The analysis results can be collated in a template, as illustrated in Table 4.4.
164 Emergency Food Security Assessment Handbook / second edition
_____________58. Technical Guidance Sheet No. 5 Distinguishing between Chronic and Transitory Food Insecurity inEFSAs, WFP Emergency Needs Assessment Service, November 2007.

3.6.1.2 Food security and coping strategy indicators
There are no universal standards for food security and coping strategy indicators;the severity of the situation is estimated according to the proportion of thepopulation with an FCS below a certain threshold. However, WFP uses thresholdsof FCS ≤ 21 for “poor food consumption” and FCS ≤ 35 for “borderline foodconsumption” (see Part II, Section 7.3.1).
There are also no universal benchmarks for the CSI. However, in a specific context,some coping strategies used by households show that they endanger livelihoods(selling productive assets, for instance) or even lives (working in conditions orplaces where physical safety is not guaranteed, for instance).
3.6.2 Using convergence of evidence from a series of indicators
Comparison of a variety of different indicators is an effective way of determining theseverity of a crisis. If numerous indicators lead to the same conclusion, andevidence converges (see Section 2.2), it is probable that their conclusion aboutseverity is correct.
The Integrated Food Security Phase Classification (IPC) system is a way ofcompiling indicators systematically and consistently. The IPC approach issummarized in Box 4.5.
IPC indicates when, in a certain area, there are households whose livelihoods areat risk of damage or loss – the “acute food and livelihoods crisis” phase. When thelives of households are at risk, the crisis is in the “humanitarian emergency” and“famine/humanitarian catastrophe” phases.
165Part IV / chapter 3: Conducting a situation analysis
PARTIV
Indicator Rate (%) Severity at the population level(based on standard thresholds)
Crude mortality rate
Under-5 mortality rate
Prevalence of wasting -global acute malnutrition -in under-5 children
Prevalence of stunting -global chronic malnutrition -in under-5 children
Prevalence of low BMIin non-pregnant,non-lactating women
Table 4.4: Interpretation of the population-level severity of mortality andnutrition status indicators

Table 4.5 gives the indicators and thresholds used in the IPC approach. These canalso be used during EFSA analysis to estimate severity. Convergence of evidencefrom a number of indicators enhances the confidence with which conclusions canbe stated.
166 Emergency Food Security Assessment Handbook / second edition
IPC was developed for Somalia by the Somalia Food Security Analysis Unit, and is nowbeing implemented in other countries. It is not an assessment methodology, but a wayof collating information from the assessments of several organizations to produceconclusions that are rigorous, transparent and comparable. The results of an EFSA couldbe included in IPC, along with the assessment results of other agencies such as Save theChildren, UNICEF, CARE and government bodies. The end result of IPC is a phaseclassification of the crisis in question, according to one of five phases:1. generally food-secure;2. moderately/borderline food-insecure;3. acute food and livelihood crisis;4. humanitarian emergency;5. famine/humanitarian catastrophe.
Classification of the crisis is based on indicators and thresholds. Where possible,internationally recognized standards are used, such as for nutrition data. Where theindicator is context-specific, judgements are made using standard guidance (seereferences at the end of this box).
The following indicators are used for classification: crude mortality rate; acutemalnutrition; disease; stunting; food access/availability; dietary diversity; water accessand availability; destitution/displacement; hazards; civil security; coping strategies;livelihood assets; and structural issues.
In addition to the classification of phases, IPC also provides:• a strategic response framework, with guidance on the priority types of intervention ineach phase;
• early-warning levels: watch, moderate risk, high risk;• colour-coded maps showing the relative levels of food security across a country orarea and including information about immediate hazards, key underlying causes,estimated populations, criteria for social targeting, the usual phase prior to the currentone, projected trends, and the confidence level of the analysis.
IPC is a useful way of bringing together the various actors involved in food securityanalysis and combining their conclusions into a standard framework that can beinterpreted easily and compared among different crises, and over time in a single crisis.IPC is not an assessment methodology, so it is not an alternative to the WFP EFSA; asexplained, EFSA results should be a component of IPC.
For a detailed explanation of using IPC, see:• Integrated Food Security Phase Classification: Technical Manual Version 1.1, IPCGlobal Partners, FAO, 2008.
• Integrated Food Security Phase Classification (IPC) User Guide. Draft-in-progress forfeedback. FAO, July 2008.
Additional information is available on www.ipcinfo.org
Box 4.5: The IPC approach

167Part IV / chapter 3: Conducting a situation analysis
PARTIV
Phase Classification Indicators and thresholds
1A GenerallyFood Secure
Crude Mortality Rate < 0.5 / 10,000 / dayAcute Malnutrition <3 % (w/h <-2 z-scores)Stunting <20% (h/age <-2 z-scores)Food Access / Availability usually adequate (> 2,100 kcal ppp day), stableDietary Diversity consistent quality and quantity of diversityWater Access / Avail. usually adequate (> 15 litres ppp day), stableHazards moderate to low probability and vulnerabilityCivil Security prevailing and structural peaceLivelihood Assets generally sustainable utilization (of 6 capitals)
1B GenerallyFood Secure
2 Moderately /BorderlineFood Insecure
Crude Mortality Rate <0.5 / 10,000 / day; U5MR<1 / 10,000 / dayAcute Malnutrition >3% but <10 % (w/h <-2 z-score), usual range, stableStunting >20% (h/age <-2 z-scores)Food Access / Availability borderline adequate (2,100 kcal ppp day); unstableDietary Diversity chronic dietary diversity deficitWater Access / Avail. borderline adequate (15 litres ppp day); unstableHazards recurrent, with high livelihood vulnerabilityCivil Security unstable; disruptive tensionCoping ‘insurance strategies’Livelihood Assets stressed and unsustainable utilization (of 6 capitals)Structural pronounced underlying hindrances to food security
3 AcuteFood andLivelihoodCrisis
Crude Mortality Rate 0.5-1 / 10,000 / day, U5MR 1-2 / 10,000 / dayAcute Malnutrition 10-15 % (w/h <-2 z-score), > than usual, increasingDisease epidemic; increasingFood Access / Availability lack of entitlement; 2,100 kcal ppp day via asset strippingDietary Diversity acute dietary diversity deficitWater Access / Avail. 7.5-15 litres ppp day, accessed via asset strippingDestitution / Displacement emerging; diffuseCivil Security limited spread, low intensity conflictCoping ‘crisis strategies’; CSI > than reference; increasingLivelihood Assets accelerated and critical depletion or loss of access
4 HumanitarianEmergency
Crude Mortality Rate 1-2 / 10,000 / day, >2x reference rate, increasing;U5MR > 2 / 10,000 / day
Acute Malnutrition >15 % (w/h <-2 z-score), > than usual, increasingDisease pandemicFood Access / Availability severe entitlement gap;
unable to meet 2,100 kcal ppp dayDietary Diversity regularly 3 or fewer main food groups consumedWater Access / Avail. < 7.5 litres ppp day (human usage only)Destitution / Displacement concentrated; increasingCivil Security widespread, high intensity conflictCoping ‘distress strategies’; CSI significantly > than referenceLivelihood Assets near complete & irreversible depletion or loss of access
5 Famine /HumanitarianCatastrophe
Crude Mortality Rate > 2/10,000 / day (example: 6,000 / 1,000,000 / 30 days)Acute Malnutrition > 30 % (w/h <-2 z-score)Disease pandemicFood Access / Availability extreme entitlement gap; much below 2,100 kcal ppp dayWater Access / Avail. < 4 litres ppp day (human usage only)Destitution / Displacement large scale, concentratedCivil Security widespread, high intensity conflictLivelihood Assets effectively complete loss; collapse
Table 4.5: Key reference indicators and thresholds used in the IPC approach

EFSA results can also be represented on maps, as in IPC (see Box 4.5).
The IPC process requires extensive consultation with partners and the use ofstandard templates. In a rapid EFSA, consultation may be limited by timeconstraints, especially if some partners are unfamiliar with the approach. Moreover,some of the indicators listed in Table 4.5 may not be available.
3.6.3 Using the food consumption or food access gap
The severity of food insecurity can be confirmed by two additional indicators:• the food consumption gap;• the food access gap.
Further guidance on calculating food gaps is provided in Section 4.4.1. When usingeither of these indicators, the season must be taken into account. In many areas,household food consumption varies during the course of a normal year, and atemporary food consumption gap may not be cause for alarm.
The food consumption gap gives a direct indication of the severity of foodinsecurity at the aggregate population level (see Box 4.6).
168 Emergency Food Security Assessment Handbook / second edition
The gap between aggregate food consumption required to meet nutrition needs andactual aggregate food consumption is estimated, by comparing households’ food intakewith the intake and thresholds established from reference nutrition requirements.The difference between the reference threshold and the households’ score indicates theseverity of the gap. This approach can be used to estimate the number of householdscalled food-insecure because of a deficient diet.However, food intake data are hardly ever available.
Box 4.6: Estimation and use of the food consumption gap
The food access gap (see Box 4.7) can be estimated by comparing householdfood expenditure with the cost of a minimum food basket, taking into considerationthe proportion of food that is not purchased, such as food coming from ownproduction. The food access gap can be a useful indicator in livelihood groups thatpurchase most of their food.

There are no standard references against which to judge the severity of the foodconsumption or food access gap. The following rule of thumb can be used:• If more than 10 percent of the population is facing a severe food gap, there is acritical crisis.
• If more than 30 percent of the population is facing a moderate food gap, there isa severe crisis.
169Part IV / chapter 3: Conducting a situation analysis
PARTIV
Average current expenditure on food for a given livelihood group is estimated through aquestionnaire survey or focus group interviews. The quantity and monetary value of foodproduced and consumed by households are also estimated, and compared with the costof a minimum local food basket, estimated through a market survey.
This approach can give an indication of major food access shortfalls. People oftenunder-report their food expenditure, so it can be difficult to obtain accurate figures inless extreme circumstances, such as when there is a relatively small food accessshortfall.
Box 4.7: Estimation and use of the food access gap

170 Emergency Food Security Assessment Handbook / second edition
chapter 4
Conductinga forecast analysis
This section explains the following steps for forecasting and scenario development:• Identify opportunities and shocks that are likely to affect the area in the future.• Combine an analysis of shocks and opportunities with their influence onhousehold food security to develop scenarios that describe how the situationmight develop in the future.
• Identify the most likely scenario and the groups whose food security will be at riskunder this scenario.
Forecasting is, by nature, uncertain. Uncertainty can be reduced by using the bestinformation available and rigorous analytical procedures. There is always anelement of judgement, however. Analysts must decide what they consider themost likely outcome, based on the available information. The forecast should thenbe qualified by the reliability of the information on which it is based. A forecastincludes assumptions, which must be clearly documented in the assessmentreport, along with the process through which conclusions were developed. At aminimum, a forecast analysis should result in the following outputs:• a forecast of the future opportunities and shocks that are likely to affect the foodsecurity and nutrition situation;
• scenarios that forecast the evolution of the food security and nutrition situationin the absence of assistance; and
• identification of the groups that will be most at risk in the most likely scenario.
4.1 Identification of future opportunities and shocks
In order to develop reasonably accurate forecasts, it is necessary to identify therange of opportunities and shocks that may affect the future nutrition status andfood security of a particular population.

The importance of assessing the current risks to food security during the situationanalysis was discussed in Section 3. In forecasting, each of the factors related tofood security is reviewed, to determine whether the same situation is likely topersist in the future. Additional events – opportunities or shocks – that are notcurrently present should also be identified during a forecast analysis.
The analysis is informed by the following:• The nature of a potential shock: Is it a one-off event, such as an earthquake,or a long-term and complex process, such as conflict or environmentaldegradation?
• The opinions of experts and key informants: For example, meteorologists andenvironmental experts might provide input on trends related to the naturalenvironment; local NGO and social workers might provide input on social trends;economists might help with market predictions; and political analysts mightprovide input on the evolution of a conflict.
A procedure for predicting future opportunities and shocks is explained in Box 4.9
171Part IV / chapter 4: Conducting a forecast analysis
PARTIV
In EFSA analysis, opportunities are events that ameliorate or improve an adversesituation. They can be:• natural opportunities, such as resumption of rain after a dry season;• human-induced opportunities, such as the next harvest, peace accords, opening ofpreviously closed borders, and improvement of market infrastructure.
Opportunities can arise through a combination of natural and human-inducedoccurrences. For example, a peace agreement means that roads will be opened andmarkets may become better integrated. Good rains contribute to an improved harvest.These two opportunities will combine to enable farmers to sell larger quantities ofproduce at good prices in the coming months.
In an EFSA, shocks are events with a negative impact on nutrition status and/or foodsecurity. They may be:• natural shocks, such as earthquakes, drought or floods;• human-induced shocks, such as conflict or economic recession.
Natural and human-induced shocks are not always easy to differentiate. For example:• floods can be caused by seasonal climatic fluctuation, exacerbated by deforestation;• conflict can be caused by political tension, exacerbated by drought.
Opportunities and shocks do not necessarily occur at distinct times; some evolvegradually. For example:• an improvement of physical infrastructure and services takes effect slowly;• the impact of a drought increases slowly.
When analysing opportunities and shocks, both sudden-onset and evolutionary variantsshould be considered.
Box 4.8: Opportunities and shocks

Some shocks, such as tsunamis, earthquakes and volcanic eruptions, areextremely difficult to predict. Certain parts of the world are far more susceptible tothis type of shock than others. In these areas, contingency plans should bedeveloped to ensure preparedness in case of shock (see Section 4.2). Historicaltrends of shocks can allow greater confidence in forecasting future shocks.
EFSAs generally take place in areas that are already facing a crisis or in which acrisis is predicted. The approach explained in Box 4.9 is therefore appropriate formost EFSAs.
The following information should be noted for each opportunity or shock:• Recurrent/persistent or occasional: This defines the nature of the shock oropportunity and provides important insight into its likely evolution. Persistent shocksare continuous or recurrent, such as long-term drought. Occasional shocks areone-off, such as earthquakes. An equivalent approach is applied to opportunities.
• Probability of occurrence: Some shocks and opportunities can be predictedwith more confidence than others. For example, the arrival of the rainy seasoncan be predicted with reasonable confidence – it occurs at more or less the sametime every year – although the amount of rain that falls may vary greatly fromyear to year. The return of refugees following a conflict may be less easy topredict as it depends on numerous factors, all of which are uncertain, such as thesigning of a peace accord, the availability of transport, and refugees’ perceptionof the security situation.
• Expected time of occurrence: The timing of some opportunities and shocks,such as a harvest or a hunger gap, can be predicted reasonably accurately.Others, such as earthquakes, are much more difficult to predict.
• Scale of the severity of a shock or the benefit of an opportunity: some shocksare more severe than others, and some opportunities bring greater benefits than
172 Emergency Food Security Assessment Handbook / second edition
1. Start with the existing situation.What are the features of the current crisis and arethey likely to persist into the future? For example, households’ food consumption isfound to be poor because recurrent droughts have reduced agricultural production andlimited the opportunities for daily labour. This problem will probably persist for theforeseeable future.
2. Consider various time periods, such as three, six and twelve months. What newshocks and opportunities are likely to arise? The following are examples.The harvest is due in one month. Farmers usually sell 80 percent of their production totraders, who sell it overseas. However, neighbouring countries have closed their bordersfor the export of agricultural produce. It is probable that when the harvest comes, farmerswill be forced to sell their produce at reduced prices, thus curtailing their income. Ashock to local livelihoods can be predicted.The harvest is due in one month, and it looks as though it will be very good. Markets arerecovering, and there is high demand for local produce. This should represent a goodopportunity for farmers, who can expect their income to rise within the next month.
Box 4.9: Predicting opportunities and shocks

others. For example, a pest attack on crops affecting a small proportion of farmsis less severe than a flood that destroys large swathes of farmland; acomprehensive peace agreement conveys more benefits than a temporary dropin food prices due to a one-off localized food distribution.
Table 4.6 gives examples of how shocks and opportunities may be recorded for aforecast analysis. This template should be adapted to reflect the context of theshocks and opportunities that are likely to occur in a particular region.
173Part IV / chapter 4: Conducting a forecast analysis
PARTIV
Expected event Recurrent /persistent oroccasional
Probability ofoccurrence1 = low5 = highor ongoing
Expected timeof occurrence
Scale ofseverity orbenefit
Shocks
Earthquake Occasional 1 Any time High severity
Drought Recurrent Ongoing Ongoing Medium severity
Attack byarmed groups
Occasional 3 Any time High severity
Opportunities
Harvest Recurrent 4 7 months from now High benefit
Establishmentof ruralhealth service
Occasional 3 1 month from now Medium benefit
Peace accord Occasional 2 Unknown High benefit
Table 4.6: Documentation of opportunities and shocks, with examples
Examples of different types of shock and their effects on food security are given inTable 4.7. Shocks affect people in different ways, depending on their individual orgroup characteristics. The following are examples of this:• During periods of insecurity, women may be at greater risk than men because theyhave towalk long distances to collectwater, fuelwood, etc. and are targets for violence.
• When people are displaced, women’s coping strategies may have more severeconsequences on their lives and livelihoods than men’s.
• Children are more vulnerable to diseases than adults, such as when watersupplies are contaminated during floods.
• Certain ethnic groups may be targeted during conflict. Other groups may bedenied access to areas where they farm or carry out other livelihood activities.
It is therefore essential to undertake a disaggregated analysis of the potentialimpact of shocks. Populations should be disaggregated according to:• sex – always;• age – always;

• livelihood group, particularly for slow-onset shocks and conflict;• health status, particularly regarding chronic diseases such as HIV/AIDS andacute infections in young children – always;
• ethnic or social group, such as IDPs, refugees and host families – only if relevantto the specific emergency;
• other, locally relevant criteria, for example, by location, such as coastal ormountain, when it implies different exposures to risk.
174 Emergency Food Security Assessment Handbook / second edition
Shock Potential direct effects on food security
Main immediate effects Food availability and access Food consumption
• Drought• Crop pest,such aslocust invasion,crop disease
• Loss of harvest• Loss of food stocks
• Decreased staple food availability• Decreased staple food access fromown production, for sale andconsumption
• Decreased food access frompurchase, due to increased marketfood prices, decreased sales
• Decreased amountsof food consumed,due to decreasedavailability and/orincreased prices
• Lower quality of dietby choice (coping)and/or availability
• Flood• Tsunami• Hurricane,cyclone
• Loss of harvest• Loss of food stocks• Loss of economicinfrastructure:workplaces, roads, etc.
• Loss of assets
• Decreased staple food availability• Decreased staple food access fromown production
• Decreased food access frompurchase, due to increased marketfood prices, loss of income,decreased sales
• Decreased employment opportunities
• Earthquake • Loss of food stock• Loss of assets• Loss of animals
• Decreased staple and animal foodaccess from own stocks
• Decreased food access frompurchase, due to loss of income
• Decreased food availability
• Animal disease• Livestockthefts andlooting
• Loss of animal products• Loss of animals
• Decreased animal food access• Decreased food access frompurchase, due to loss of income,decreased sales
• Market foodprice rise
• Economiccollapse
• Deterioration of termsof trade for livestockor labour
• Loss of purchasingpower
• Decreased food access frompurchase, due to loss of income
• Forceddisplacement
• Conflict
• Loss of harvest• Loss of animals• Loss of assets
• Decreased staple food and animalproduct availability
• Decreased food access frompurchase, due to increased marketfood prices, loss of income,decreased sales of own production
Epidemics,such as choleraHIV / AIDS
• Disease • Decreased food access frompurchase, due to increased healthexpenditures, decreased incomeearnings because of loss of physicalcapacity and extra time required tocare for the sick
• Decreased amountsof food consumed,due to loss ofappetite, lack oftime to care forvulnerableindividuals
• Loss of nutrients
Table 4.7: Shocks and their potential impacts on food security

4.2 Developing scenarios
In forecast analysis, assessors develop possible future scenarios. A scenario is “adescription of situations that could occur; it is a set of informed assumptions abouta situation”.59 Scenarios indicate alternative ways in which the situation mightevolve, based on: (i) current food insecurity; (ii) assumptions about possiblefuture shocks and opportunities, taking into account the type of emergency andits volatility; and (iii) people’s resilience and vulnerability. Themost likely scenariois chosen as the basis for predicting the coming three, six and/or twelve months;the period depends on the purpose of the EFSA and the data that have beencollected. This process is explained in detail in following sections. A simplifiedexample is given in Example 4.5.
175Part IV / chapter 4: Conducting a forecast analysis
PARTIV
_____________59. Contingency Planning and Humanitarian Action, a Review of Practice, R. Choularton, OverseasDevelopment Institute (ODI) Network Paper No. 59, March 2007.
Note: This is a simplified example using the hypothetical situation of a rural area affectedby conflict and recurrent drought.
Step 1: Identify future shocks and opportunities that could affect the food securityand nutrition situation.• The harvest is expected in one month: rains have been good, although the area plantedhas been 20 percent smaller than usual. The harvest is expected to be averagecompared with long-term trends, but much better than the average for the last ten years.
• Increased conflict is expected in area X because of its strategic importance: troopsfrom both sides are massing in this area; and populations are moving from area X tothe border, which is currently closed.
• Other parts of the country seem to be relatively stable.
Step 2: Develop scenarios to anticipate the evolution of the food security andnutrition situation in the absence of assistance.One or more scenarios is/are developed, depending on the volatility of the situation. Ingeneral, the most likely scenario is used for planning, but in some cases a worst-casescenario could be used for additional contingency planning. In this example, the mostlikely scenario might be as follows:• In most parts of the country, food availability will improve because of the relativelygood harvest. Food access will improve because of enhanced labour and tradeopportunities. Food utilization is unlikely to change significantly because long-termhealth issues have not been addressed: access to health care and water quality.
• In area X, all food security factors are likely to deteriorate. Nutrition problems areprobable, especially in IDP settlements.
Step 3: Identify the population groups affected by the most likely scenario, and theimpact of the shocks and opportunities on their livelihoods.• In general, vulnerability is decreasing because of improved harvests and reducedconflict.
• In area X, vulnerability is expected to increase because of the fighting. IDPs movingfrom area X are extremely vulnerable during their move and when established inmakeshift camps on the border.
Example 4.5: Scenario development

4.2.1 Procedures
One or more scenarios can be developed, depending on the level of uncertaintythat surrounds future events. If the future can be predicted with a high level ofconfidence, one scenario might be sufficient. If the crisis is complex and has thepotential to evolve in several different ways, it might be necessary to develop morethan one scenario and to judge which is the most likely. In certain cases, shocksare almost impossible to predict accurately, so contingency plans are developed(see Section 4.2.2).
Wherever possible, scenarios should be developed through consultation; the extentto which this is possible depends on the time available and the degree ofcollaboration among stakeholders. It is critical that EFSA team members work withlocal key informants and counterparts from partner agencies to decide the mostlikely evolution of future events. The likelihood of a given scenario is based on thecollective judgement of the group; there is no standard way of determininglikelihood.
The period covered by a scenario depends on the following:• The type of emergency: For example, a rapid-onset emergency that is limitedin geographical scope, such as a flood, may necessitate a scenario covering thecoming three months, which might be updated later. A slow-onset, persistentemergency, such as a drought, may demand a scenario covering a year or more.
• The type of operation that WFP is planning: For example, an EMOPmay covera period of six to twelve months, while a PRRO may last for three years.
Scenarios are developed by considering all the potential opportunities and shocksidentified in Section 4.1 and making assumptions about their combined influenceon food security in the near future. For example, the harvest is imminent, which isa good opportunity for food-insecure households. Fighting is currently intensifying,however, and soldiers frequently loot or destroy crops. This is likely to continue atleast until the onset of the rainy season in five months’ time, and the shock causedby the fighting is expected to obliterate the potential opportunity of the harvest.
To develop realistic scenarios that are not too complex, it is necessary to identifythe dominant opportunities and shocks that will have the greatest influence onhow the food and nutrition security situation evolves in the coming months. In theexample in the previous paragraph, the fighting is the dominant event, because itseffects overcome those of the coming harvest. Identifying the dominant shocksaves time; the fighting is expected to obliterate the benefits of the harvest, sothere is no point in engaging in in-depth analysis of the harvests’ benefits for thepopulation.
176 Emergency Food Security Assessment Handbook / second edition

The following are some examples of dominant opportunities and shocks:• Large-scale droughts and floods are natural shocks that are not affected by otherevents, at least in the short term.
• Major armed violence is likely to override most other events.• Government policies that are directly related to food and nutrition security mayrepresent supportive opportunities or harmful shocks.
Dominant opportunities and shocks steer the development of scenarios.Secondary opportunities and shocksmight be: (i) caused by the dominant event,as a cascade effect; (ii) unrelated to the dominant event but enhancing ormitigatingits effects, as a synergistic effect; or (iii) subsumed by the dominant event. Thefollowing are simplified examples of these three possibilities:• Cascade effect: Armed violence is the dominant shock leading to large-scaledisplacement; displaced people move to town, where they live in overcrowdedslums, resulting in the spread of disease and increased severe malnutrition assecondary shocks.
• Synergistic effect: A drought is the dominant shock, which is exacerbated bythe introduction of government policy that constrains the movement of foodamong districts in a country as a secondary shock.
• Subsumed effect: An earthquake is the dominant shock causing mass loss of lifeand destruction of infrastructure. This subsumes the effects of a localized pestinfestation as a secondary shock. It may not be worth analysing the effects of thepest infestation because the earthquake and its effects dominate the scenario.
The existence of a dominant shock does not mean that secondary shocks shouldnot be analysed. Many scenarios are characterized by a variety of different shocksinteracting to produce a composite shock, as in the following examples:• Low rainfall leads to a poor harvest; conflict results in reduced mobility, loss ofaccess to fields, and looting of crops; and deterioration of roads leads toincreased market transaction costs. These shocks combine to cause anescalation of grain prices, with each factor exacerbating the negative impacts ofthe others.
• Low rainfall and deterioration of roads put upwards pressure on the grain pricebecause of poor harvests and high market transaction costs. However, resolutionof conflict mitigates these negative effects to some extent. The three factors areanalysed together to determine the net impact on the population.
The population groups that might be affected in a scenario are identified broadly,based on their main livelihood characteristics, particularly their sources of food andincome, and their geographical location, as in Example 4.6. More detailedcharacteristics and numbers of affected people are estimated after the most likelyscenario has been identified (see Sections 4.3, 4.4 and 4.5).
Example 4.6 illustrates how different types of shock interact.
177Part IV / chapter 4: Conducting a forecast analysis
PARTIV

178 Emergency Food Security Assessment Handbook / second edition
A rural, primarily agricultural area has been affected by drought for the last three seasons.The population is poorer than the national average, and people’s purchasing power hasdeclined since the drought began. This year’s rains have been good. Large-scale seeddistributions have allowed farmers to plant the same area as they plant in a normal year:• A good harvest is expected in one month.• Physical access to the area is poor because of bad roads, which are sometimes unusableduring the rainy season. Poor physical access and low profit margins make the areaunattractive to traders. A road construction programme started a year ago, and shouldbe completed within the next six months. This will allow year-round access to the area.
• The area has been beset by low-level insurgency against the government for the lastten years. Since the recent collapse of peace negotiations, the conflict has escalatedseverely in district X, which has experienced many casualties and widespread looting.
1. Identification of opportunities and shocksOpportunities and shocks are first identified in isolation, and the probability of eachoccurring is judged and assigned a value of 1 to 5, with 5 representing a certainty.
OpportunitiesGood harvest in one month – probability: 4.Improved road in six months – probability: 4.
ShocksEscalation of conflict, with high loss of life and looting – probability: 3.
2. Combination of shocks and opportunitiesThe positive effects of both the harvest and the road improvement have a high probabilityof occurring if these events are considered in isolation. However, escalation of the conflict,although slightly less likely to occur, would probably outweigh the benefits of the harvestand road construction. With a probability of 3, conflict escalation has to be taken seriously.
3. Development of the scenarioConflict escalation is judged to be the dominant event, which overrides the others in itseffect on lives and livelihoods. In this scenario, it is assumed that conflict escalation willoccur. The interaction between the dominant shock and the two secondaryopportunities is then considered:*• The harvest is one month away. Although it is expected to be good, its positive impactwill be reduced by: (i) an expected loss of 20 percent of the crop to looting in district X;(ii) disruption of markets by conflict, making it more difficult for farmers in the area tosell produce; and (iii) a forecast displacement of 30 percent of the population of district Xbecause of the fighting.
• Road construction is due to finish within six months. Given the escalating security threats,it is likely that the contractor will halt construction pending resolution of the problems.
• Markets are unlikely to pick up as previously hoped, because of the continued badphysical access with no road, the poor security, incurring risks to lives and hightransaction costs, and the low purchasing power of the population.
Based on this, the probable scenario is as follows:• Conflict escalates, particularly in district X, where it leads to displacement of 30 percentof the population. Food availability declines, owing to loss of harvested crops, andfood stocks throughout the area are stretched further by the presence of IDPs fromdistrict X. Markets do not provide an effective response.
* Percentages in this example are arbitrary and provided for the sake of illustration. The information on which theseestimates are based could come from key informants, focus groups and/or household surveys.
Example 4.6: Formulating a scenario in a relatively straightforward situation

Consideration of dominant and secondary opportunities and shocks and theirrelative probabilities helps to determine whether the situation is likely to improve,deteriorate or stay the same. The situation in Example 4.6 is likely to deterioratedrastically. Sometimes the outcome is less obvious, as shown in Example 4.7.
179Part IV / chapter 4: Conducting a forecast analysis
PARTIV
The situation is the same as in Example 4.6, but the probability is different.
OpportunitiesGood harvest in one month – probability: 4.Improved road in six months – probability: 4.
ShocksEscalation of conflict, with high loss of life and looting – probability: 1.
In this case, the outcome is less clear than in Example 4.6. The probability of severeescalation is low but still significant; given the implications of such an escalation, it wouldbe unwise to discount this possibility altogether. Conflict does not constitute the mostlikely scenario, however, which could instead be postulated as follows:• The harvest is good, leading to a significant improvement in food availability. Prices inthe market decrease, improving food access. Some traders are prepared to traversethe poor roads to buy produce from the area, which now has a food surplus. Over thenext six months, trade increases greatly, owing to completion of the road andintegration of the area’s markets into the national market system. In areas whereconflict continues, there are looting and small-scale, temporary displacement.
In this type of situation, two or more scenarios might be developed:• Most likely scenario: This describes the situation most likely to occur, given thelikelihood of each of the opportunities and shocks and the interactions among them.
• Worst-case scenario: When an alternative, worse scenario is less likely to occur, butstill has a possibility of occurring – in this example, conflict – it should also beconsidered for contingency planning and preparedness (as in Example 4.6).
The situation should be monitored constantly to identify promptly any deterioration thatmight lead to the worst-case scenario.
Example 4.7: Formulating a scenario in a relatively unclear situation
4.2.2 Contingency planning
It is advisable to base recommendations for response planning (see Chapter 5) onthe most likely scenario, but to make contingency plans according to the worst-case scenario.
The reliability of the information used to develop the scenarios should also be takeninto account. If confidence in the information is low, such as in a rapid EFSA carriedout in a short time without full access, it is advisable to prepare two or threescenarios, select the most likely, and include the worst-case for contingencyplanning. If information is known to be accurate and can be treated with a highlevel of confidence, a single planning scenario can suffice.
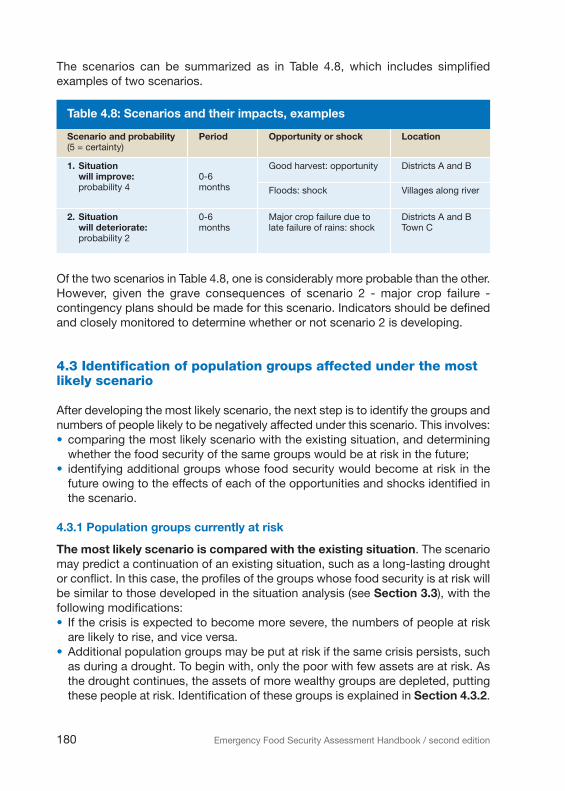
The scenarios can be summarized as in Table 4.8, which includes simplifiedexamples of two scenarios.
180 Emergency Food Security Assessment Handbook / second edition
Scenario and probability(5 = certainty)
Period Opportunity or shock Location
1. Situationwill improve:probability 4
0-6months
Good harvest: opportunity Districts A and B
Floods: shock Villages along river
2. Situationwill deteriorate:probability 2
0-6months
Major crop failure due tolate failure of rains: shock
Districts A and BTown C
Table 4.8: Scenarios and their impacts, examples
Of the two scenarios in Table 4.8, one is considerably more probable than the other.However, given the grave consequences of scenario 2 - major crop failure -contingency plans should be made for this scenario. Indicators should be definedand closely monitored to determine whether or not scenario 2 is developing.
4.3 Identification of population groups affected under the mostlikely scenario
After developing the most likely scenario, the next step is to identify the groups andnumbers of people likely to be negatively affected under this scenario. This involves:• comparing the most likely scenario with the existing situation, and determiningwhether the food security of the same groups would be at risk in the future;
• identifying additional groups whose food security would become at risk in thefuture owing to the effects of each of the opportunities and shocks identified inthe scenario.
4.3.1 Population groups currently at risk
The most likely scenario is compared with the existing situation. The scenariomay predict a continuation of an existing situation, such as a long-lasting droughtor conflict. In this case, the profiles of the groups whose food security is at risk willbe similar to those developed in the situation analysis (see Section 3.3), with thefollowing modifications:• If the crisis is expected to become more severe, the numbers of people at riskare likely to rise, and vice versa.
• Additional population groups may be put at risk if the same crisis persists, suchas during a drought. To begin with, only the poor with few assets are at risk. Asthe drought continues, the assets of more wealthy groups are depleted, puttingthese people at risk. Identification of these groups is explained in Section 4.3.2.

4.3.2 Additional population groups expected to become at risk
Themain characteristics of additional groups likely to be affected by each of theopportunities and shocks in the scenario are identified. The following are examples:• If armed attacks are expected to target particular ethnic groups, those ethnicgroups are likely to be the most affected.
• If it is predicted that the market system will be disrupted, such as through borderclosures, the people whose livelihoods are based on the market, such asproducers and traders, and those whose food access is based on purchase atthe market will be affected.
• If particular rivers are expected to flood, the people living nearby will be affectedfirst, followed by those who depend on the rivers for their food and income.
Having determined the main characteristics of the groups that will be at risk in thefuture, detailed profiles are compiled using information about the populationgathered from primary and secondary sources:• With quantitative data, group profiles are developed through cross-tabulation ofthe primary livelihood characteristics – IDP, farmer, etc. – of populations whosefood security is at risk, as identified during the situation analysis (see Section 3.3).
• With qualitative data, information collected during focus group discussions isanalysed to identify the groups that are likely to be affected in the future. Theirprofiles are developed in the same way as in the situation analysis.
Example 4.8 illustrates this procedure.
181Part IV / chapter 4: Conducting a forecast analysis
PARTIV
In a particular area, much of the food in the markets comes from neighbouring countries.
Note: This is a simplified example for illustration purposes. In a real situation the analysis willbe more complex, although the principles remain the same.
Under the most likely scenario, it is predicted that border closures will halt food imports for atleast six months. This will result in the doubling of staple food prices. This shock is expectedto have the following effects on the population:• People who depend primarily on market purchases for their food will be adversely affected.• Local farmers who are able to sell their produce during this period will benefit from the raisedprices.
If the EFSA data are quantitative, households that are primarily dependent on market purchasefor their food are identified by looking at the share of household food that comes from thissource. These households are then cross-tabulated against other key characteristics, such asgender, age and displacement status. The profiles developed are used for subsequent targetingand monitoring.
If the data are qualitative, the livelihood profiles developed during focus group discussions areused to identify the groups that are particularly dependent on market purchases.
The same procedure is used to identify the groups that will benefit from the shock: in this case,the farmers who are able to sell their produce.
Example 4.8: Forecasting the effects of opportunities and shocks on population groups
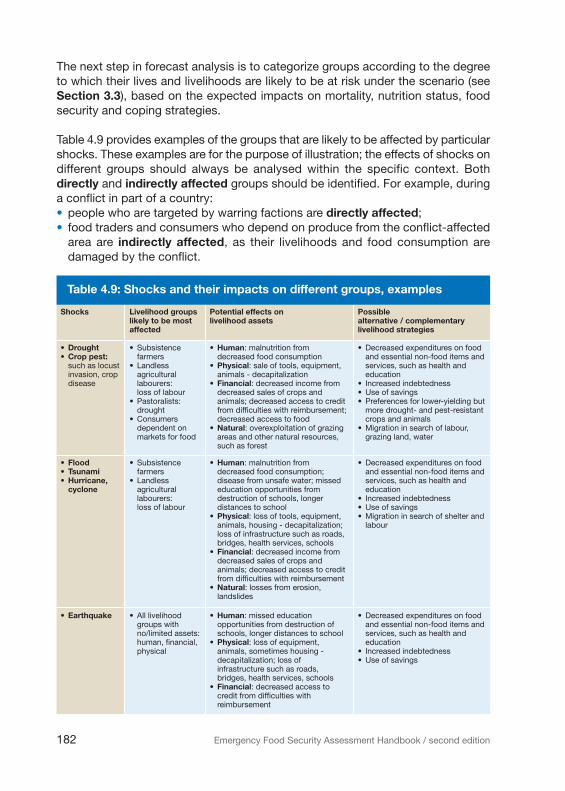
The next step in forecast analysis is to categorize groups according to the degreeto which their lives and livelihoods are likely to be at risk under the scenario (seeSection 3.3), based on the expected impacts on mortality, nutrition status, foodsecurity and coping strategies.
Table 4.9 provides examples of the groups that are likely to be affected by particularshocks. These examples are for the purpose of illustration; the effects of shocks ondifferent groups should always be analysed within the specific context. Bothdirectly and indirectly affected groups should be identified. For example, duringa conflict in part of a country:• people who are targeted by warring factions are directly affected;• food traders and consumers who depend on produce from the conflict-affectedarea are indirectly affected, as their livelihoods and food consumption aredamaged by the conflict.
182 Emergency Food Security Assessment Handbook / second edition
Shocks Livelihood groupslikely to be mostaffected
Potential effects onlivelihood assets
Possiblealternative / complementarylivelihood strategies
• Drought• Crop pest:such as locustinvasion, cropdisease
• Subsistencefarmers
• Landlessagriculturallabourers:loss of labour
• Pastoralists:drought
• Consumersdependent onmarkets for food
• Human: malnutrition fromdecreased food consumption
• Physical: sale of tools, equipment,animals - decapitalization
• Financial: decreased income fromdecreased sales of crops andanimals; decreased access to creditfrom difficulties with reimbursement;decreased access to food
• Natural: overexploitation of grazingareas and other natural resources,such as forest
• Decreased expenditures on foodand essential non-food items andservices, such as health andeducation
• Increased indebtedness• Use of savings• Preferences for lower-yielding butmore drought- and pest-resistantcrops and animals
• Migration in search of labour,grazing land, water
• Flood• Tsunami• Hurricane,cyclone
• Subsistencefarmers
• Landlessagriculturallabourers:loss of labour
• Human: malnutrition fromdecreased food consumption;disease from unsafe water; missededucation opportunities fromdestruction of schools, longerdistances to school
• Physical: loss of tools, equipment,animals, housing - decapitalization;loss of infrastructure such as roads,bridges, health services, schools
• Financial: decreased income fromdecreased sales of crops andanimals; decreased access to creditfrom difficulties with reimbursement
• Natural: losses from erosion,landslides
• Decreased expenditures on foodand essential non-food items andservices, such as health andeducation
• Increased indebtedness• Use of savings• Migration in search of shelter andlabour
• Earthquake • All livelihoodgroups withno/limited assets:human, financial,physical
• Human: missed educationopportunities from destruction ofschools, longer distances to school
• Physical: loss of equipment,animals, sometimes housing -decapitalization; loss ofinfrastructure such as roads,bridges, health services, schools
• Financial: decreased access tocredit from difficulties withreimbursement
• Decreased expenditures on foodand essential non-food items andservices, such as health andeducation
• Increased indebtedness• Use of savings
Table 4.9: Shocks and their impacts on different groups, examples

4.3.3 Combining current and predicted population groups facing risk to foodand nutrition security
As defined in Sections 4.3.1 and 4.3.2, groups that will be at risk under the futurescenario(s) include:• groups whose food security is currently at risk and will remain so;• groups whose food security is not currently at risk, but will become so in thefuture.
Population groups that will remain at risk and groups that will become at risk areadded together to provide the total of groups whose food and nutrition security isexpected to be at risk in the future. Groups that are currently at risk but whosesituation is expected to improve to the point at which they are no longer at risk arenot included on the list.
183Part IV / chapter 4: Conducting a forecast analysis
PARTIV
Shocks Livelihood groupslikely to be mostaffected
Potential effects onlivelihood assets
Possiblealternative / complementarylivelihood strategies
• Animaldisease
• Livestocktheft andlooting
• Pastoralists• Smallagropastoralists
• Human: malnutrition fromdecreased animal food consumption
• Physical: loss of animals• Financial: decreased income fromdecreased sales of animals and theirproducts; decreased savings;decreased access to credit fromdifficulties with reimbursement
• Decreased expenditures on foodand essential non-food items andservices, such as health andeducation
• Decreased cultivation from lossof draught power or increasedcultivation
• Migration in search of security
• Rise inmarket foodprices
• Economiccollapse
• Casual workers• Landlessagriculturallabourers
• Pastoralists
• Human: malnutrition fromdecreased food consumption
• Financial: decreased value of cashsavings; decreased access to creditfrom difficulties with reimbursement
• Decreased expenditures on foodand essential non-food items andservices, such as health andeducation
• Sale of assets - decapitalization• Increased indebtedness• Use of savings• Migration in search of labour
• Epidemic,such ascholera
• HIV / AIDS
• All livelihoodgroups withno/limited assets:human, financial,physical
• Human: malnutrition, disease,mortality
• Social: disruption of community,kinship and other social networks -solidarity stretched
• Financial: decreased access tocredit from difficulties withreimbursement
• Decreased expenditures on foodand essential non-food items andservices, such as education
• Sale of assets - decapitalization• Switch to lower-earning andlower-yielding crops that are lesslabour-intensive, because of poorphysical capacity, time needed tocare for sick individuals
• Increased indebtedness• Use of savings• Sending children to relatives
• Forceddisplacement
• Conflict
• All livelihoodgroups,particularly thosewith weak socialassets/solidaritynetworks
• Human: malnutrition, missededucation opportunities
• Social: disruption of community,kinship and other social networksfrom dispersion of members;creation of war economies
• Physical: loss of tools, equipment,animals, housing
• Financial: decreased income fromdecreased sales of crops andanimals; loss of savings from theft
• Natural: overexploitation
• Decreased expenditures on foodand essential non-food items andservices, such as health andeducation
• Migration in search of securityand labour
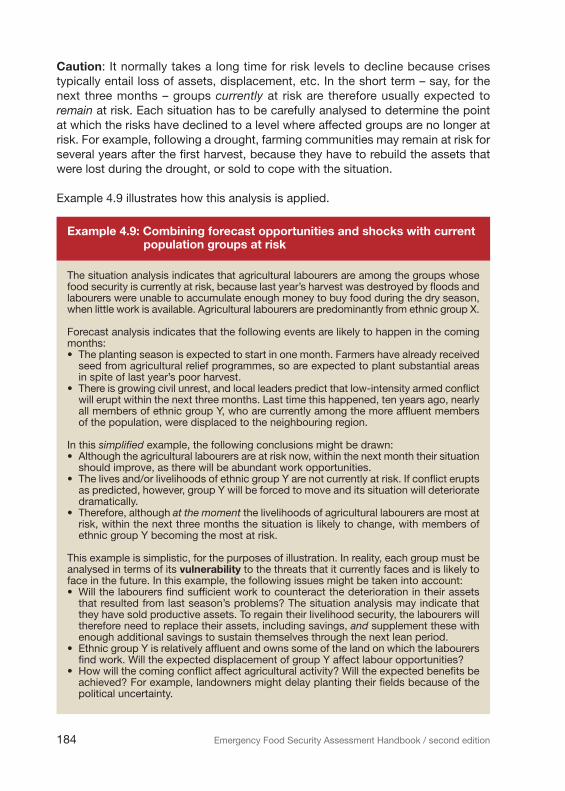
Caution: It normally takes a long time for risk levels to decline because crisestypically entail loss of assets, displacement, etc. In the short term – say, for thenext three months – groups currently at risk are therefore usually expected toremain at risk. Each situation has to be carefully analysed to determine the pointat which the risks have declined to a level where affected groups are no longer atrisk. For example, following a drought, farming communities may remain at risk forseveral years after the first harvest, because they have to rebuild the assets thatwere lost during the drought, or sold to cope with the situation.
Example 4.9 illustrates how this analysis is applied.
184 Emergency Food Security Assessment Handbook / second edition
The situation analysis indicates that agricultural labourers are among the groups whosefood security is currently at risk, because last year’s harvest was destroyed by floods andlabourers were unable to accumulate enough money to buy food during the dry season,when little work is available. Agricultural labourers are predominantly from ethnic group X.
Forecast analysis indicates that the following events are likely to happen in the comingmonths:• The planting season is expected to start in one month. Farmers have already receivedseed from agricultural relief programmes, so are expected to plant substantial areasin spite of last year’s poor harvest.
• There is growing civil unrest, and local leaders predict that low-intensity armed conflictwill erupt within the next three months. Last time this happened, ten years ago, nearlyall members of ethnic group Y, who are currently among the more affluent membersof the population, were displaced to the neighbouring region.
In this simplified example, the following conclusions might be drawn:• Although the agricultural labourers are at risk now, within the next month their situationshould improve, as there will be abundant work opportunities.
• The lives and/or livelihoods of ethnic group Y are not currently at risk. If conflict eruptsas predicted, however, group Y will be forced to move and its situation will deterioratedramatically.
• Therefore, although at the moment the livelihoods of agricultural labourers are most atrisk, within the next three months the situation is likely to change, with members ofethnic group Y becoming the most at risk.
This example is simplistic, for the purposes of illustration. In reality, each group must beanalysed in terms of its vulnerability to the threats that it currently faces and is likely toface in the future. In this example, the following issues might be taken into account:• Will the labourers find sufficient work to counteract the deterioration in their assetsthat resulted from last season’s problems? The situation analysis may indicate thatthey have sold productive assets. To regain their livelihood security, the labourers willtherefore need to replace their assets, including savings, and supplement these withenough additional savings to sustain themselves through the next lean period.
• Ethnic group Y is relatively affluent and owns some of the land on which the labourersfind work. Will the expected displacement of group Y affect labour opportunities?
• How will the coming conflict affect agricultural activity? Will the expected benefits beachieved? For example, landowners might delay planting their fields because of thepolitical uncertainty.
Example 4.9: Combining forecast opportunities and shocks with currentpopulation groups at risk
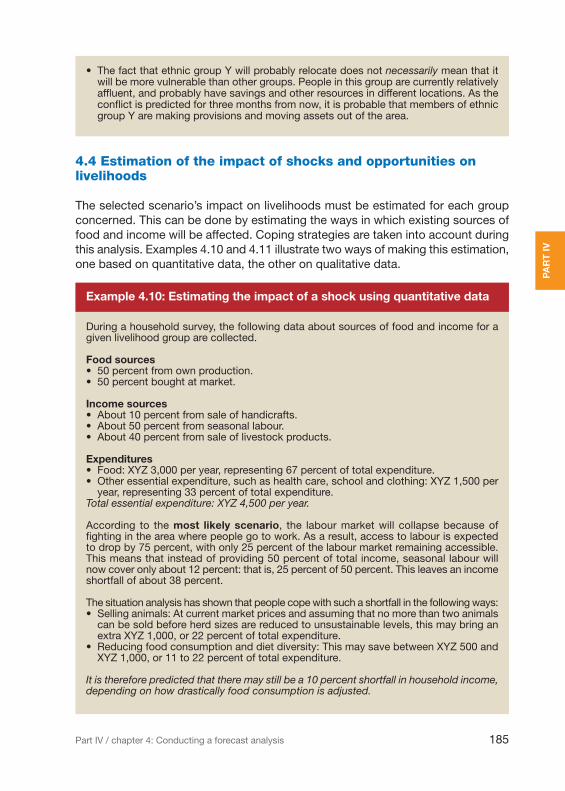
4.4 Estimation of the impact of shocks and opportunities onlivelihoods
The selected scenario’s impact on livelihoods must be estimated for each groupconcerned. This can be done by estimating the ways in which existing sources offood and income will be affected. Coping strategies are taken into account duringthis analysis. Examples 4.10 and 4.11 illustrate two ways of making this estimation,one based on quantitative data, the other on qualitative data.
185Part IV / chapter 4: Conducting a forecast analysis
PARTIV
During a household survey, the following data about sources of food and income for agiven livelihood group are collected.
Food sources• 50 percent from own production.• 50 percent bought at market.
Income sources• About 10 percent from sale of handicrafts.• About 50 percent from seasonal labour.• About 40 percent from sale of livestock products.
Expenditures• Food: XYZ 3,000 per year, representing 67 percent of total expenditure.• Other essential expenditure, such as health care, school and clothing: XYZ 1,500 peryear, representing 33 percent of total expenditure.
Total essential expenditure: XYZ 4,500 per year.
According to the most likely scenario, the labour market will collapse because offighting in the area where people go to work. As a result, access to labour is expectedto drop by 75 percent, with only 25 percent of the labour market remaining accessible.This means that instead of providing 50 percent of total income, seasonal labour willnow cover only about 12 percent: that is, 25 percent of 50 percent. This leaves an incomeshortfall of about 38 percent.
The situation analysis has shown that people copewith such a shortfall in the followingways:• Selling animals: At current market prices and assuming that no more than two animalscan be sold before herd sizes are reduced to unsustainable levels, this may bring anextra XYZ 1,000, or 22 percent of total expenditure.
• Reducing food consumption and diet diversity: This may save between XYZ 500 andXYZ 1,000, or 11 to 22 percent of total expenditure.
It is therefore predicted that there may still be a 10 percent shortfall in household income,depending on how drastically food consumption is adjusted.
Example 4.10: Estimating the impact of a shock using quantitative data
• The fact that ethnic group Y will probably relocate does not necessarily mean that itwill be more vulnerable than other groups. People in this group are currently relativelyaffluent, and probably have savings and other resources in different locations. As theconflict is predicted for three months from now, it is probable that members of ethnicgroup Y are making provisions and moving assets out of the area.

186 Emergency Food Security Assessment Handbook / second edition
Poor rainfall leads to the prediction that the harvest will be 50 percent less than normal:a shock. A major road construction project is about to start in the area: an opportunity.The combined impact of the shock and the opportunity is estimated for farminghouseholds.
The following details of farmers’ livelihoods in a normal year are identified during focusgroup discussions:• Farming households eat 50 percent of their produce and sell the rest.• Own produce covers consumption needs for seven months a year.• For the remaining five months, farming households buy food using the money fromtheir food sales, which is estimated to cover about three months of food needs; andundertake casual labour on other people’s farms and construction projects, which isestimated to cover about two months of food needs.
• In a normal year, these strategies enable farming households to cover all their food andnon-food needs, while retaining savings equivalent to 10 percent of their annualexpenditure.
The impact of the predicted 50 percent reduction in the harvest is estimated as follows:• It is assumed that households will continue to eat 50 percent of their produce and sellthe rest – this can be checked in the focus group discussions. Own produce willtherefore now account for 3.5 months of food instead of seven. Because of the poorharvest, food prices in the market are relatively high. Food sales will now enable thehousehold to buy approximately half the usual amount of food, that is 1.5 months offood needs.
• Own produce, both consumption and sales, is therefore expected to coverapproximately five months of food needs instead of the usual ten months.
• Because of the poor harvest, households are unable to find any seasonal labour onother people’s farms.
• Road construction will provide employment for at least one member of each farminghousehold for some portion of the coming year. It is estimated that this will provideapproximately four months of food needs per household.
• Households will experience a food shortfall and will mobilize some of their savingsfrom previous years, estimated at 1.5 months of food needs.
Combining all of these figures, the extent to which farming households might beexpected to cover their food needs in the coming year is estimated as follows:
Own consumption: 3.5 months+
Sale of own produce: 1.5 months+
Construction work: 4 months+
Savings: 1.5 months=
10.5 months
It is therefore predicted that farming households will experience a food gap of1.5 months in the coming year.
Example 4.11: Estimating the impact of a shock using qualitative data

4.4.1 Conducting a food gap analysis
Calculating the food gap is an essential step in estimating the food needs of theaffected population in an emergency. The food gap has three distinct elements:- the food availability gap, which is the shortfall between a region’s aggregate foodneeds and its aggregate food availability;
- the food access gap, which is the shortfall at the household level; and- the food consumption gap, which is the shortfall between nutrition needs andactual food consumption.
Estimating the food gap is a relatively straightforward process. In simple terms, thefood access gap is the difference between the level of household food stores, oraccess to food, and the actual amount of food needed to ensure adequate nutritionand health for every household member. By quantifying this difference, an EFSAcan arrive at reasonably accurate estimates of emergency food needs.
For a population affected by a shock, the food access gap – or food need – is equalto the aggregate food deficits of vulnerable households who are unable to meettheir own minimum requirements without endangering their health, their access toessential non-food items such as income and education, and their own or thecommunity’s resource base.
Every EFSA should estimate the expected food access gap resulting from anemergency, but the specific methodology for doing so differs according to the typeof EFSA being undertaken. In an initial assessment, there is not usually enoughtime to gather in-depth food access information on distinct livelihood groups. Asa result, estimates of the food gap developed during initial assessments typicallyrely on general information obtained from group discussions and key informantinterviews. A rapid assessment should be able to outline how the food gap differsamong distinct livelihood groups, but may have limited ability to gather detailedquantitative information at the household level. An in-depth assessment shouldfocus on obtaining detailed, household-level information and should calculate foodgaps with relative precision.
Table 4.10 outlines the general process for determining the food gap.
187Part IV / chapter 4: Conducting a forecast analysis
PARTIV

Wherever possible, the recommended method for calculating the food gap followsfive basic steps.
Step 1: Determine baseline consumption and income levelsTo estimate the food gap, an EFSAmust derive baseline consumption and income levelsthat reflect a normal year – one in which emergency food aid is not required. Assessorsshould ensure the accuracy of baseline information by triangulating householdinformation with other data sources, such as district-level agricultural production data.
Step 2: Convert basic food requirements to cereal equivalentsA commonmeasure is needed so that consumption, income and expenditure data canbe combined, and food gaps or food aid needs calculated. Themost commonmeasureis the cereal equivalent. As cereals account for the bulk of energy needs for food-insecurehouseholds and of food assistance provided to these households, it is convenient to usethemas themeasure. Incomeand expenditures are converted to cereal equivalents usingthe local market values of cereals, or their substitutes, collected during the assessmentfrom secondary sources, key informant interviews or market visits.
188 Emergency Food Security Assessment Handbook / second edition
Process Sources / methods
→ Identify distinct vulnerable groups within thepopulation of concern
→ Describe the ways in which each vulnerablegroup currently obtains access to food andmeets its non-food needs; how members ofeach group use the food and other resourcesavailable to them; and how access and usevary within and across groups, according tothe wealth or status of households
→ Examine the general availability of food andother resources in the locality, and use thefindings of the forecast analysis (Section 4)to predict how changes in context –e.g. market access, climatic conditions,sources of conflict – are likely to affectpeople’s access to and use of food, theirnutrition status or their indebtedness
→ For each livelihood group, estimate thedifference between food needs and theamount of food that individuals expect to beable to provide for themselves
The difference represents the food gap:the level of food assistance recommended bythe EFSA should be sufficient to fill this gap
- Key informants- Informal discussions with different groups:gender-based, livelihood groups,community-based organizations, etc.
- Focus group discussions- Proportional piling and seasonal calendarswith groups of participants representing thedifferent livelihood groups
- Observation (transect walks)- Household visits and/or household surveys
- Key informants: local authorities, traders, etc.- Food aid distribution data- Monitoring reports- Nutrition surveys and surveillance data- Market surveys/analysis- FEWS information- VAM analyses
- Household surveys that enable analysis ofhousehold income and expenditure
- Quantitative and qualitative data that provideempirical information on the nutritionoutcomes of household resource use
Table 4.10: General process for determining the food gap

Typically, a minimum consumption requirement of 2,100 kcals/person/day is usedas a basis for calculating the food gap.60 If this minimum requirement is derivedfrom cereals only – which is unlikely, even during emergencies – each person willrequire approximately 18 kg of cereals per month. If the 2,100 kcal comes fromcereals only, it can be assumed that the diet is not diverse enough and that thereare potential problems with nutrition quality.
Step 3: Convert non-cereal foods into cereal equivalentsIn many situations, the predominant portion of beneficiaries’ food intake comes fromnon-cereals, for example from root or tuber crops such as cassava or potatoes. AnEFSA must determine the extent to which cereals such as wheat or rice cansubstitute the deficit of the non-cereal staples. To determine the nutrition deficits ofthese areas, the non-cereal foods can be converted into nutritional cereal units. Usingthe example in step 2, the theoretical cereal deficit is 18 kg per person per month.
It should be noted that when a cereal substitutes a non-cereal diet staple,beneficiaries will often trade or sell the cereal food aid, frequently at unfavourableterms of trade. If the EFSA finds this response, it may be possible to account forthese poor exchanges and terms of trade by supplying additional cereal to make upthe trade deficit, or by introducing ways of using cereals in locally preferred dishes.
If the substitute cereal is likely to be consumed by beneficiaries, the nutritionalcereal equivalent applies. If it is traded, the economic equivalent applies.
Step 4: Develop an income/expenditure balance sheetThe most common approach to calculating the food gap uses a balance sheet ofhousehold income and expenditures. This is because many households rely onpurchasing food for at least part of their dietary needs, and the assessment needsto determine the degree to which households normally fulfil their food requirementsfrom such transfers. Using an income/expenditure balance sheet enables directcomparison of households’ available incomes with their expenditures. It alsoprovides insight into the degree of food insecurity (if any) and determines thehousehold deficits that will be taken into account when calculating food aid needs.
Food produced by a household for consumption is considered to be both a sourceof income and an expenditure. In both cases, it is estimated in terms of quantity,for example, weight. Other sources of cash income, such as wage labour andremittances, must initially be estimated in terms of their actual market values.Again, each must be converted into a cereal equivalent so that all income sourcesand expenditures can be compared. This should be done using the current marketprice of the cereal as the conversion rate.
189Part IV / chapter 4: Conducting a forecast analysis
PARTIV
_____________60. A general food ration of 2,100 kcal/person/day is based on the mean per capita energy requirementfor the “normal” population distribution of a developing country. This estimate is designed to include theneeds of vulnerable sub-groups: infants, young children, pregnant and lactating women, the elderly.

In Example 4.12, a number of household income sources are converted into cerealequivalents, and the total income of the household is estimated for the current year.In this particular year, food produced for home consumption was 400 kg; if thiswere a drought scenario, this value would likely be significantly lower than thenormal or average income value of food production.
190 Emergency Food Security Assessment Handbook / second edition
Example 4.12: Household income and expenditure balance sheet
Income
Average household income Cash value / Cereal price = Cereal equivalent
Food produced for home consumptionCash crop salesLivestock salesOff-farm cash incomeRemittance incomeSavings
$70$150$35$18$18
0.350.350.350.350.35
400 kg200 kg300 kg100 kg50 kg50 kg
Total income capacity 1100 kg
Expenditures
Household expenditures Cash value / Cereal price = Cereal equivalent
Cereal seedsCereal storage lossesSchool feesMedical expensesClothingFuel
n/an/a$18$35$18$53
0.350.350.350.35
100 kg50 kg50 kg100 kg50 kg50 kg
Total expenditures 1,500 kg
Balance
Total household requirementsTotal expenditure capacityTotal needs: requirements minus capacity
1500 kg1100 kg400 kg
The balance sheet in Example 4.12 shows a household that has expenditures ofapproximately 1,500 kg cereal equivalent for the current year, but the capacity toprovide only 1,100 kg of cereal equivalent based on all estimated income sources.It will therefore fall short of meeting its minimum food needs by approximately 400 kg.In this example, an estimated 400 kg of food aid (in cereal equivalent) is needed toalleviate the household’s food deficit.
Step 5: Calculate aggregate food needs for different socio-economic groupsIt is recommended that an EFSA calculate balance sheets for householdswithin differentlivelihood groups orwealth categories, depending on the homogeneity of the populationbeing considered. This is because different groups living in the same geographical area,such as the same food economy zone or agro-ecological zone, typically have differentincomes and expenditures, and hence have different food deficits. Overall, regional or

national deficits are the weighted sum of the deficits of the different groups that havebeen defined and for which balance sheets have been developed. Example 4.13illustrates an aggregate food gap estimate for various livelihood groups.
191Part IV / chapter 4: Conducting a forecast analysis
PARTIV
Example 4.13: Aggregate food gap estimate
Livelihood group Yearly householddeficit (kg)
Number ofhouseholds
Total food needs(mt of cerealequivalents)
Coastal fishersHighland coffee farmersHighland subsistence farmersTotal
200150400
400060001000020000
80090040005700
The use of different livelihood or other groups will help to target food aid, but onlymakes sense if the differences among groups are reflected in the actual distributionof food aid. It must be operationally and politically feasible to allocate different foodaid rations to specific sub-groups living in the same area. For each group, thenumber of months that food aid will be needed should also be estimated, andfactored into the overall estimate of the food gap. This requires consideration ofhow different groups will be able to recover from whatever shock created theemergency, and how future income and expenditures will be affected.
4.5 Estimation of the numbers of people who will be affected byshocks and opportunities
The groups whose food security is likely to be at risk in the future were identifiedin Section 4.3. During the situation analysis of an EFSA, the numbers of peopleexpected to be at risk in the future must be estimated. How this is done dependson whether the data used are quantitative or qualitative. This section providesguidance on estimating the affected population; for guidance on ways of estimatingthe total population size, see the desk review on estimating population size inemergencies and Technical Guidance Sheets Nos. 7, 10 and 11.61
_____________61. Desk Review, Estimating Population Size in Emergencies, A. Henderson, WFP Emergency NeedsAssessment Service, December 2006; Technical Guidance Sheet No. 7 Area Method to EstimatePopulation Size and Demographics in Emergency Food Security Assessments, A. Henderson, WFPEmergency Needs Assessment Service, September 2007; Technical Guidance Sheet No. 10 Using theDelphi Method to Estimate Population Size and Demographics in Emergency Food Security Assessments,A. Henderson, WFP Emergency Needs Assessment Service, January 2008; Technical Guidance Sheet No.11 T-Square Method to Estimate Population Size and Demographics in Emergency Food SecurityAssessments, A. Henderson, WFP Food Security Analysis Service, December 2008.

The number of people expected to be at risk in the future is estimated as follows:
Number of people currently at risk and whose situationis not expected to improve in the short term
+Number of additional people who will become at risk
-Number of people currently at risk but whose situation is expected
to improve to the extent that they are no longer at risk
When subtracting populations no longer at risk, the caution in Section 4.3.3 mustbe taken into account. It may be possible to divide the coming year into periods of,say, three months, and identify the populations at risk in each period. The feasibilityof such an approach depends on the situation, however. For example:• in a slow-onset emergency, numbers are unlikely to vary greatly within a short period;• in a rapid-onset emergency, such as localized flooding, the population at riskmay decline substantially over the course of a few weeks or months.
Note that this approach increases the analytical, administrative and logisticsworkload substantially, as beneficiary numbers may vary from month to month.The added value of this level of fine-tuning and the implications for targeting shouldbe carefully considered (see Section 4.3.3), as should the practical constraints.
4.5.1 Final estimate of numbers at risk
The information that relates shocks and opportunities to population groups is addedto the information collected in Table 4.8 (in Section 4.2), as shown in Table 4.11.
192 Emergency Food Security Assessment Handbook / second edition
Scenario andprobability(5 = certainty)
Period Opportunityor shock
Affectedgroups
Numberof affectedpeople(current + forecast)
Locationof affectedgroups
1. Situation willimprove:probability 4
0-6 months Good harvest:opportunity
Farmers 20 000 District A
Agriculturallabourers
5 000 Districts A and B
Grain traders 1 000 Town C
Flood: shock Farmers 2 000 Villagesalong river
2. Situation willdeteriorate:probability 2
0-6 months Major crop failuredue to late failureof rains: shock
Farmers 20 000 District A
Agriculturallabourers
5 000 Districts A and B
Grain traders 2 000 Town C
Table 4.11: Overview of groups affected under different scenarios, examples

chapter 5
Conductinga response analysis
In response analysis, the conclusions from the situation and forecast analyses arecombined to identify possible interventions that can help to save lives and securelivelihoods. The outputs of response analysis include:• identification of the factors related to risk;• identification of the broad sectors and types of intervention required – the entrypoints;
• review of the intervention plans and capacities of government and other actors,and identification of gaps in these;
• identification of a range of response options to fill the gaps, and the strengths,weaknesses, opportunities and threats (SWOT) associated with each;
• selection of the most appropriate response option(s);• recommendations for interventions, including targeting criteria, timing, scale andduration.
As already noted, response analysis is usually based on the most likely scenario(see Section 4.2). However, if there is a worst-case scenario that is less probablethan the most likely scenario but nonetheless has a reasonable probability ofoccurring, a contingency plan should also bemade for this scenario (see Example 4.7in Section 4.2).
Interventions may be aimed at saving lives, protecting livelihoods or a combination ofboth. They may be focused on addressing the current situation, preventing futuredeterioration of the situation, or both. For timing and resource allocation purposes,response recommendations are prioritized according to the following urgency of needs:• First priority: current risks to lives.• Second priority: current risks to livelihoods, and risks to lives in the near future.• Third priority: risks to lives and livelihoods in the more distant future.
If the current situation and/or forecasts indicate that an intervention is needed, thenext step is to identify response options (see Section 5.4). The process is as follows:• Ongoing interventions, future plans and the capacities of other stakeholders –government, United Nations agencies, NGOs and civil society – are examinedand compared with the assessed needs. Gaps are identified.
193Part IV / chapter 5: Conducting a response analysis
PARTIV
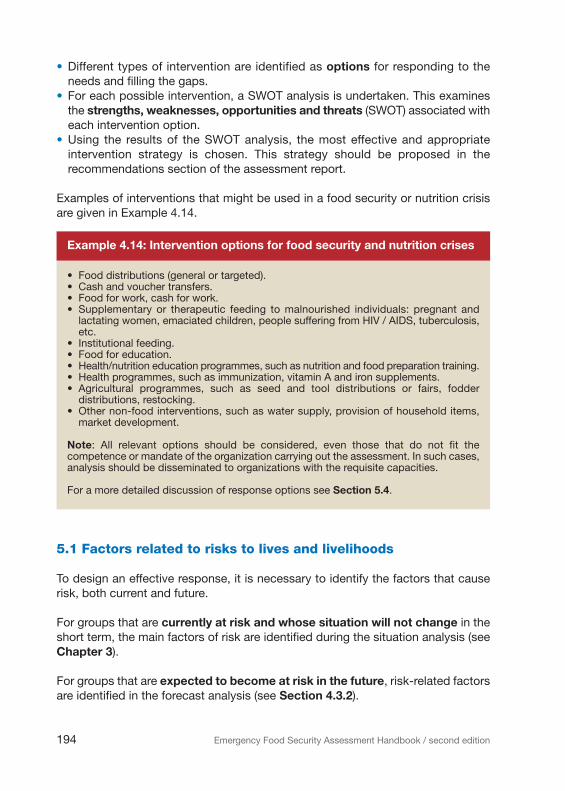
• Different types of intervention are identified as options for responding to theneeds and filling the gaps.
• For each possible intervention, a SWOT analysis is undertaken. This examinesthe strengths, weaknesses, opportunities and threats (SWOT) associated witheach intervention option.
• Using the results of the SWOT analysis, the most effective and appropriateintervention strategy is chosen. This strategy should be proposed in therecommendations section of the assessment report.
Examples of interventions that might be used in a food security or nutrition crisisare given in Example 4.14.
194 Emergency Food Security Assessment Handbook / second edition
• Food distributions (general or targeted).• Cash and voucher transfers.• Food for work, cash for work.• Supplementary or therapeutic feeding to malnourished individuals: pregnant andlactating women, emaciated children, people suffering from HIV / AIDS, tuberculosis,etc.
• Institutional feeding.• Food for education.• Health/nutrition education programmes, such as nutrition and food preparation training.• Health programmes, such as immunization, vitamin A and iron supplements.• Agricultural programmes, such as seed and tool distributions or fairs, fodderdistributions, restocking.
• Other non-food interventions, such as water supply, provision of household items,market development.
Note: All relevant options should be considered, even those that do not fit thecompetence or mandate of the organization carrying out the assessment. In such cases,analysis should be disseminated to organizations with the requisite capacities.
For a more detailed discussion of response options see Section 5.4.
Example 4.14: Intervention options for food security and nutrition crises
5.1 Factors related to risks to lives and livelihoods
To design an effective response, it is necessary to identify the factors that causerisk, both current and future.
For groups that are currently at risk and whose situation will not change in theshort term, the main factors of risk are identified during the situation analysis (seeChapter 3).
For groups that are expected to become at risk in the future, risk-related factorsare identified in the forecast analysis (see Section 4.3.2).

The factors that are directly related to risk should be defined as specifically aspossible and should relate directly to the situation and forecast analyses.Factors that contribute to risk are categorized as immediate, underlying or basic,using the Food and Nutrition Security Conceptual Framework as a guide (see Part I).This categorization is useful when determining the types of intervention that areappropriate to the level of urgency:• Immediate factors have a direct impact on lives and livelihoods. If dietary intakeor health status is at a critical level, immediate action may be needed to save lives.
• Underlying factorsmay have an indirect impact on lives, but a direct impact onlivelihoods. If they are not addressed, there is a danger that the situation willdeteriorate, possibly leading to risks to lives in the future.
• Basic factors are long-term, structural issues. These are not normally addressedby EFSA response options, but if serious structural problems are identified, theyshould be recorded in the EFSA report, and relevant stakeholders such asgovernment should be notified.
Factors that decrease risk should also be noted. These include the capacities ofthe affected groups and the opportunities identified in Section 4.1.
For each at-risk group, summarize the factors that increase and decrease risk,together with the associated livelihood characteristics, institutions and processes.An example is given in Table 4.12, which can also be used as a template.
195Part IV / chapter 5: Conducting a response analysis
PARTIV
Group with lives at risknow or in the future
Factors exacerbatingor alleviating risk
Associated livelihoodassets and strategies
Associated institutionsand processes
Severely wastedchildren under 5
Factors increasing risk
Food utilization:- lack of breastfeeding- high prevalence ofdiarrhoea
- poor quality ofcomplementary feeding
- poor quality of water
- Mothers’ limitedknowledge about feedingand hygiene practices
- Low staffing in healthcentres
Food access:- lack of income topurchase diversefoodstuffs
- Lack of agricultural land- Women’s multipleresponsibilities: incomegeneration, caring forchildren, cooking, etc.
- Low access to education
- Environmentaldegradation of farmland
- Few employment optionsavailable
- Poor terms of tradebetween wage rates andfood prices
Factors decreasing risk
Food availability:- imminent abundance ofnutritious wild plants withonset of rains
- Consumption of wildplants is part of usuallivelihood strategy
Food accessibility:- economy graduallydiversifying
- Households graduallydiversifying livelihoodstrategies to adapt tochanging economicenvironment
- Government loans to smallbusinesses
Table 4.12: Factors associated with risk for various groups, with examples
(cont…)

5.2 Entry points for interventions
Entry points are the sectors and broad types of intervention that can be used first toaddress the needs identified during the analysis phase of the EFSA. They also providea basis for analysing interventions managed by other organizations (see Section 5.3).
The following are possible entry points for the examples given in Table 4.12:
Severely wasted children under 5:• Water sector: Improvement of water quality and quantity through emergencydelivery, treatment and storage systems.
• Health services: Deployment of additional health staff and equipment;establishment of complementary feeding programmes.
• Care practices: Dissemination of information regarding the benefits of hygieneand breastfeeding.
Food-insecure households:• Health services: Establishment of preventive and curative health services.• Vocational training: Training in activities that enable households to diversify theirincome sources.
• Credit: Provision of loans to help people buy productive assets, both agriculturaland non-agricultural.
196 Emergency Food Security Assessment Handbook / second edition
Group with lives at risknow or in the future
Factors exacerbatingor alleviating risk
Associated livelihoodassets and strategies
Associated institutionsand processes
Householdswith low levelsof food security
Factors increasing risk
Food availability:- low production in areadue to failed rains
- few food imports
- Limited livelihoodstrategies: only farming
- Poor roads increasetransportation costs anddiscourage traders frommoving food into the area
- High import tariffs reduceamount of food broughtinto the country
Food accessibility:- lack of own production- lack of income to buy foodat raised prices
- Lack of able-bodiedworkers due to highdisease prevalence
- Lack of alternative skillsto diversify income
- Poor preventive andcurative health services
- Poor education reducesknowledge of healthissues and limits income-related skills
Factors decreasing risk
Food availability:- arrival of rains- improvement of physicaland market infrastructure
- Diversification of theeconomy
- Reduction of tariffs andother taxes that constrainthe movement of food
- Improvement of physicalinfrastructure
Food accessibility:- opportunities for incomediversification
- Training in income-generating activities
- Access to credit
- Introduction of vocationaltraining programmes
- Introduction of creditprogrammes for smallbusinesses
(…cont)

These programmes are more effective if they are supported by such governmentinterventions as:• Policy changes, reduction of taxes or changes in regulations that constrain thefree movement of food.
• Investment in services, particularly health and education.
5.3 Other stakeholders’ interventions, and remaining gaps
Before a response can be planned, the existing and planned activities ofgovernment and other agencies must be taken into account, to prevent duplication,identify gaps and ensure they are covered, and avoid incompatible programmeresponses, such as one agency undertaking food for work while another carriesout free food distribution in the same area.
Relevant agencies are identified through stakeholder analysis, and consulted. Thesubsequent selection of agencies to collaborate on interventions is then based onthe entry points, as described in Section 5.2. For example, for the emergencydescribed in Table 4.12, entry points were identified in water, health services andcare practices. Organizations working in these sectors should be approached forpotential partnership activities. Box 4.10 lists some agencies that may bestakeholders in interventions resulting from an EFSA response analysis.
197Part IV / chapter 5: Conducting a response analysis
PARTIV
• Government – national, regional and local• Non-State authorities, such as in situations of civil conflict• WFP• OCHA• FAO• UNICEF• UNHCR• International Committee of the Red Cross (ICRC)• International Federation of Red Cross and Red Crescent Societies (IFRC)• National Red Cross or Red Crescent societies• International NGOs• National NGOs• Donors
Box 4.10: Typical stakeholders in food security response programmes
The capacity of governments and agencies to fulfil their plans is assessed, as istheir flexibility for changing plans if necessary. Whenever possible, details of theplanned activities are discussed with the agency concerned, including the followingissues:• Financial resources: Does the agency have the necessary money, or is it waitingfor funds?

• Material resources: Does the agency have the necessary goods and equipment,such as food for distribution, vehicles, etc.?
• Human resources: Have all the necessary personnel been deployed?• Logistics: How will the operation function?
Detailed discussion of these and other topics with the government department oragency concerned should clarify the feasibility of its plans and can also form thebasis for strong operational partnerships.
It can be difficult to estimate government capacity because of decentralization andthe involvement of several departments. Indicators reflecting the macroeconomicsituation and the government institutions and budgets allocated to disasterpreparedness and response can be used for this purpose. For detailed advice, seeTechnical Guidance Sheet No. 13.62
Information on different stakeholders’ responses may be presented in a tablesimilar to Table 4.13.
198 Emergency Food Security Assessment Handbook / second edition
_____________62. Technical Guidance Sheet No. 13 Analysing National Capacity to Respond to Food Security Crises,WFP Food Security Analysis Service, September 2008.
Actor Type ofintervention
Type and numberof beneficiaries
Place ofintervention
Duration ofintervention(start to finish)
Ministry ofSocial Affairs
Subsidized food To be determined - Area B- Area D
One-off fooddelivery in …
WFP General food aiddistributionsof full rations
Vulnerablehouseholds:- with less than 1 ha- female-headed- the poorestaccording to leaders
Total: ~ 50 000 people
- Area A- Area B- Area C- Area D
From … to …
Supplementaryfeeding:• rations forchildren
• take-home fullrations forhouseholds
Moderatelymalnourished childrenTotal:~ 3 500 children;~ 500 households
- Area B- Area D
From … to …
Religiousinstitution
Targeted foodaid distributions:~ 3/4 ration
Vulnerablehouseholds identifiedby community
- Area B- Area C- Area D
… … … … …
Table 4.13: Ongoing and planned response interventions, with examples

The planned and ongoing activities of other agencies are compared with what isrequired to address the factors related to risks to lives and livelihoods identified inSections 5.1 and 5.2. Information can be summarized in a table similar to Table 4.14.
199Part IV / chapter 5: Conducting a response analysis
PARTIV
_____________63. The following guidance is not a project planning guide. This section presents generic response optionsand explains the circumstances under which each is appropriate. It also provides an example of the levelof detail expected in an EFSA report. Operational planning requires a comprehensive approach that isbeyond the scope of this handbook.
Group at risk nowand in the future
Ongoinginterventions
Plannedinterventions
All needs covered?If not, what are thegaps?
At-risk group A
What is being provided? What will be provided?
To whom/how many? To whom/how many?
By whom? By whom?
Since when/until when? When/for how long?
Where? Where?
At-risk group B
What is being provided? What will be provided?
To whom/how many? To whom/how many?
By whom? By whom?
Since when/until when? When/for how long?
Where? Where?
Table 4.14: Summary of interventions and gaps for groups at risk
If all the risk factors identified in Section 5.1 are being addressed adequatelyby other agencies, there is no need to intervene at this stage. The situationshould be monitored to ensure that any unmet needs arising in the future areidentified promptly. This should be a key recommendation of the EFSA report.
If Table 4.14 indicates that some needs are not being addressed by other agencies,an additional or complementary response is necessary, as described in thefollowing section.
5.4 Response options63
In the EFSA report, response options are examined for the groups requiringassistance (see Section 5.1) that is not being provided by government or otheragencies (see Section 5.3). Response options should be directly linked to the riskfactors and groups identified in the situation and forecast analyses, taking intoaccount the affected groups’ capacities and other agencies’ responses. As muchas possible, the affected people should participate in planning the response,including women, the elderly and disabled people.
The procedure for identifying response options is as follows:1. Identify the number of people requiring food assistance.2.Facilitate a workshop for identifying programme options with programme andother key WFP and non-WFP actors.64
3.Use a matrix or SWOT analysis to identify all possible modalities and activities.
5.4.1 Identification of response options
There are many ways of addressing a food security or malnutrition problem. Themost appropriate response is highly context-specific and depends on:• the type of emergency, rapid or slow-onset, and the stage of the emergency atthe time of response, early or mid-cycle;
• the pre-emergency situation - the status of infrastructure and services, level ofeducation, etc.;
• the habits, priorities and culture of the affected population;• the degree of access to the affected area;• the quality of infrastructure;• food availability and market conditions in the affected area;• the resources available - financial, human, logistics, etc.;• the range of feasible partnerships, such as with government, United Nationsagencies and NGOs;
• the political and economic environment; and• the security situation.
Each response must be planned according to the particular circumstances andmust be explicitly linked to the needs and gaps identified in the analysis.
The first level of screening response options is to categorize the interventionsrequired according to the type of risk factor that they address: food availability,access and/or utilization. A second level of screening defines the level at whicheach intervention can take place, based on whether it addresses an immediate,underlying or basic factor of risk (see the Food and Nutrition Security ConceptualFramework in Part I).
The following are sectors and broad types of intervention that address foodavailability, access and utilization factors:• Food availability: Interventions to support agricultural production, both cropsand livestock, the movement of food between deficit and surplus areas, fooddistributions, etc.
• Food access: Interventions to support income generation, such as public worksand food/cash for work, income transfers, such as cash/voucher distributions,
200 Emergency Food Security Assessment Handbook / second edition
_____________64. Collaboration within programmes is essential for defining response options: programme andassessment staff must work together from the onset of the assessment, when information requirementsare defined, to the analysis. During the workshop, entry points are identified, and their feasibility, etc.evaluated by the WFP units that will be required to implement interventions.

food transfers, such as food distributions and school feeding, marketinterventions to support or reduce food prices, etc.
• Food utilization: Interventions to improve health care, water, sanitation, shelter,nutrition knowledge and care practices, child-care services, etc.
• Malnutrition: Interventions to improve food consumption – therapeutic andsupplementary feeding programmes, school feeding, food distribution.
Additional examples of response options for addressing malnutrition and foodinsecurity problems are given in Table 4.15. Some interventions can cover morethan one food security issue. For example, food distributions might ease problemsof both food availability and food access. Responses in Table 4.15 are categorizedaccording to their most common application. More detailed guidance on thecircumstances under which each option might be applied, and the advantages anddisadvantages of each, is given in Annexes 4 and 5.
201Part IV / chapter 5: Conducting a response analysis
PARTIV
Response Description
Responses to food availability problems
Free food distribution Free rations to households in need – general distribution to allhouseholds in area or targeted distribution to households inspecific groups
Marketassistance programmes
Selected food commodities made available to traders andretailers to sell at controlled prices
Market support Reduction of logistics bottlenecks, such as through roadrepair, or provision of credit to traders
Food for work Food ration as payment for work – can be used as method forself-targeting, with only those who really need the food beingwilling to work for it.Is also a response to food access problems
Food for training Food as an incentive to individuals from food-insecurehouseholds to undertake training in skills that will help themimprove their own food security.Is also a response to food access problems
Responses to food access problems
Neighbourhood andhome-based care programmes
Food given to orphans and vulnerable children, such as insituations of high HIV/AIDS prevalence
School feeding Provision of nutritionally balanced and fortified meals tochildren at school, and of take-home rations to compensateparents for sending their children to school
Food to othersocial service institutions
Food provided to social institutions, such as orphanages,homes for the elderly or disabled, hospitals and health centres
Cash transfer programmes Cash distributed to households in need – general distributionto all households in area or targeted distribution tohouseholds in specific groups
Table 4.15: Food and non-food responses in terms of factors of risk
(cont…)

Wherever possible, interventions that build on existing programmes should beselected, to speed up the implementation process and make use of establishedcapacities and experience. Some interventions will be outside the mandate of WFP.If the EFSA indicates that such interventions constitute the most effectiveresponse, this should be stated in the EFSA report, to be shared with agenciesthat have the relevant competence and capacity. Response options should alsobe discussed with partner organizations.
Figure 4.1 shows a decision tree for determining the most appropriate type ofresponse options. This decision tree can be used as a guide for drawing oncontextual and empirical knowledge to solve issues such as constraints to marketsupplies, physical access and market linkages. The decision tree does not explicitly
202 Emergency Food Security Assessment Handbook / second edition
Cash for work Cash as payment for work – can be used as method forself-targeting, with only those who really need the moneybeing willing to work for it
Food vouchers Distribution of vouchers that can be exchanged for food andother essential items
Non-food transfers Provision of non-food items, such as soap and blankets, orservices, such as water, schooling and health care
Non-food support tolivelihood activities
Provision of productive inputs and services to maintain,rebuild or restore capital assets for food-insecure buteconomically active people
Exchange with produce Food given to households in return for produce that they arenot able to sell at reasonable prices, such as livestock
Responses to food utilization problems
Food preparation materials Provision of cooking equipment, fuel, water, etc.
Nutrition, education,health, water and sanitationinterventions
Improvement of feeding and care practices through, forexample, prevention of nutrient loss during food preparationand prevention and treatment of diarrhoea and other diseasesthat affect nutrient absorption and utilization
Responses to malnutrition
Therapeutic feeding Medical and nutritional treatment to save the lives of severelymalnourished individuals
Supplementary feeding Distribution of food to supplement the energy and nutrientsavailable from the basic diet of individuals who have specialnutrition needs or are malnourished
Public health measures Measures to improve sanitation, water supply, health careservices, etc.
Food fortification Provision of food fortified with nutrients, particularly vitaminsand minerals, when the diet is deficient in these respects
Nutrient supplementation Distribution of nutrient supplements, such as vitamin Acapsules, when the diet is deficient in these respects
(…cont)

include gender, but gender should be considered a critical factor throughout theentire assessment, analysis and response planning process.
203Part IV / chapter 5: Conducting a response analysis
PARTIV
Figure 4.1: Decision tree for response options
Entry point
Are there current oranticipated food shortagesat household level?(based on their foodconsumption and access)
Is food available in the localmarkets or nearby markets?
Is there current oranticipated malnutrition atindividual level?(based on their nutritionalstatus )
Advocate for responses inhealth, water, sanitation, care,cooking means, nutritioneducation (based on non-foodcauses of malnutrition)
Consider supplementaryfeeding if global acutemalnutrition is moderate
Consider therapeuticfeeding if severe acutemalnutrition is high
No nutritionalinterventionrequired
Will constraints to marketsupplies be removed in atimely manner (such as withroad repairs, transport, storage,credit to traders, better security)?
Advocate for responsesto repair infrastructure,assist with transportation,storage, traders’ creditand improve security
Advocatefor responses toimprovephysical access,(such as roadrepairs, transport,better security)
Advocate for responsesto support livelihoods,such as production ofcrops, livestock,employment, social safetynets, skills, education,households’ credit
Consider food based response Consider mix cash/food based response
Foodprocurementin nearby localmarkets NOTrecommended
Considerfoodprocurementin nearbylocal markets
Will traders be able to bring inadditional supplies in a timelymanner if households’ demandincreases(based on markets integration)?
Can householdsphysically accessmarkets (based on roads,transportation,distance, security)?
5.4.2 SWOT analysis
Having identified a series of response options, each must be analysed in terms ofits strengths and weaknesses, and the opportunities and threats that it presents.This is known as SWOT analysis. A SWOT analysis should be undertaken for eachof the recommended response options.

In a SWOT analysis strengths and weaknesses reflect the appropriateness andfeasibility of the response option. The following criteria should be taken intoaccount when assessing the appropriateness of a response option. The responseshould:• address the factors that have been identified as contributing to risk;• reflect the needs and priorities of the affected population, disaggregatedaccording to sex, age, etc.;
• be compatible with local society and customs; and• be compatible with the interventions of the government or other agencies.
The response should not:• lead to dependency on aid for any sector of the population;• have a negative impact on the local social, environmental or economic situation– for example, a large food distribution might discourage agricultural production;
• divert people from other important tasks, such as productive activities, caring,collection of water and fuel;
• expose the population or agency staff to security risks; or• stigmatize people – for example, by targeting people with HIV/AIDS or fromcertain ethnic groups.
The following criteria should be taken into account when assessing the feasibilityof a response option:• Targeting criteria should be realistic, given the social and cultural factors and thetime available.
• It should be possible to undertake the response with the resources available.Human resources, including expertise, financial and material resources should allbe considered.
• The response must be implemented in a timely manner, given the urgency of thesituation.
In a SWOT analysis opportunities and threats reflect the external factors that mayaffect the response. These are context-specific. The following are some examples:
Opportunities• The introduction of new government policy that facilitates market functioning.• The end of the wet season and the improvement of transportation.• The signing of peace agreements.• The harvest.
Threats• Government policies that limit the scope of trade or aid programmes.• Reduction of donor interest in the country.• Deterioration of security.• Lack of key programme resources such as fuel.
204 Emergency Food Security Assessment Handbook / second edition
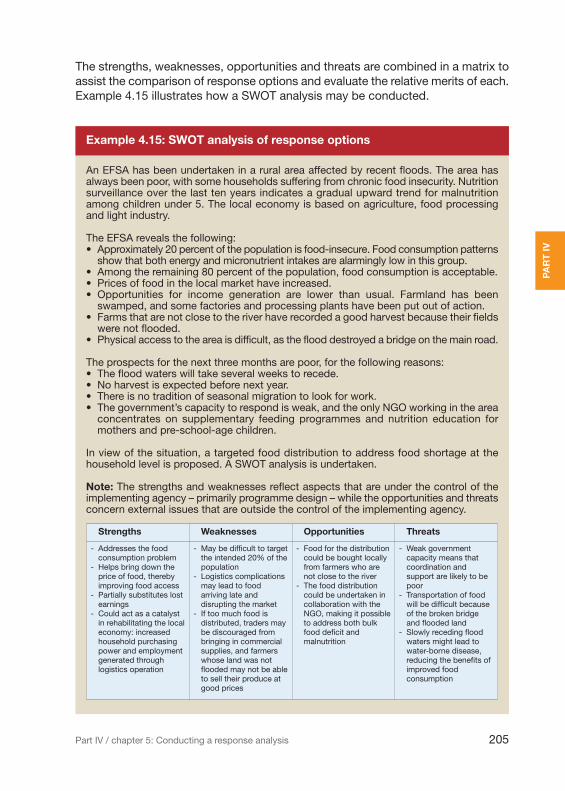
The strengths, weaknesses, opportunities and threats are combined in a matrix toassist the comparison of response options and evaluate the relative merits of each.Example 4.15 illustrates how a SWOT analysis may be conducted.
205Part IV / chapter 5: Conducting a response analysis
PARTIV
An EFSA has been undertaken in a rural area affected by recent floods. The area hasalways been poor, with some households suffering from chronic food insecurity. Nutritionsurveillance over the last ten years indicates a gradual upward trend for malnutritionamong children under 5. The local economy is based on agriculture, food processingand light industry.
The EFSA reveals the following:• Approximately 20 percent of the population is food-insecure. Food consumption patternsshow that both energy and micronutrient intakes are alarmingly low in this group.
• Among the remaining 80 percent of the population, food consumption is acceptable.• Prices of food in the local market have increased.• Opportunities for income generation are lower than usual. Farmland has beenswamped, and some factories and processing plants have been put out of action.
• Farms that are not close to the river have recorded a good harvest because their fieldswere not flooded.
• Physical access to the area is difficult, as the flood destroyed a bridge on the main road.
The prospects for the next three months are poor, for the following reasons:• The flood waters will take several weeks to recede.• No harvest is expected before next year.• There is no tradition of seasonal migration to look for work.• The government’s capacity to respond is weak, and the only NGO working in the areaconcentrates on supplementary feeding programmes and nutrition education formothers and pre-school-age children.
In view of the situation, a targeted food distribution to address food shortage at thehousehold level is proposed. A SWOT analysis is undertaken.
Note: The strengths and weaknesses reflect aspects that are under the control of theimplementing agency – primarily programme design – while the opportunities and threatsconcern external issues that are outside the control of the implementing agency.
Example 4.15: SWOT analysis of response options
Strengths Weaknesses Opportunities Threats
- Addresses the foodconsumption problem
- Helps bring down theprice of food, therebyimproving food access
- Partially substitutes lostearnings
- Could act as a catalystin rehabilitating the localeconomy: increasedhousehold purchasingpower and employmentgenerated throughlogistics operation
- May be difficult to targetthe intended 20% of thepopulation
- Logistics complicationsmay lead to foodarriving late anddisrupting the market
- If too much food isdistributed, traders maybe discouraged frombringing in commercialsupplies, and farmerswhose land was notflooded may not be ableto sell their produce atgood prices
- Food for the distributioncould be bought locallyfrom farmers who arenot close to the river
- The food distributioncould be undertaken incollaboration with theNGO, making it possibleto address both bulkfood deficit andmalnutrition
- Weak governmentcapacity means thatcoordination andsupport are likely to bepoor
- Transportation of foodwill be difficult becauseof the broken bridgeand flooded land
- Slowly receding floodwaters might lead towater-borne disease,reducing the benefits ofimproved foodconsumption

In Example 4.15, it is evident that a food distribution could bring substantialbenefits, but that these depend on a number of conditions, especially the following:• An effective targeting system must be established.• The amount of food needed and the duration of the distribution must be analysedrealistically.
• The feasibility of the operation must be assured and logistics constraints takeninto account. Late distribution might be worse than no distribution at all: it wouldnot provide assistance when needed, and by the time the food arrives, thesituation may have improved to the extent that food will disrupt the local market.
• Complementary health care activities should be implemented to reduce theincidence of water-borne disease and to maximize the benefits of the fooddistribution on food consumption.
This type of SWOT analysis is undertaken for each of the response optionsidentified in Section 5.4.1. Options that do not comply with the appropriatenessand feasibility criteria outlined in this Section 5.4.2 are discarded. The remainingresponse options are ranked, as described in Section 5.4.3.
The “do-no-harm” principle is essential in the SWOT analysis of response options(see Box 4.11), particularly in conflict situations, where a specific conflict analysisis required. See Methods and Tools for Conflict Analysis65 for more details.
206 Emergency Food Security Assessment Handbook / second edition
_____________65. Methods and Tools for Conflict Analysis, WFP Transition Unit, August 2007.
A badly planned response may be worse than no response at all if it harms the localpopulation. Examples of harmful responses include:• distribution of items that attract looters and put recipients in danger;• food distributions that disrupt local markets to the extent that the livelihoods of farmersand traders are put at risk;
• distributions that necessitate long and dangerous journeys for recipients, for example,to collect distributed items.
Any proposed intervention should be analysed for its potential negative effects, as wellas its benefits.
Box 4.11: Conflict analysis and the do-no-harm principle
5.4.3 Ranking and prioritization of response options
The ranking of response options requires good judgement and a sound knowledgeof the context. In general, the interventions that most fully comply with the criteriaoutlined in Section 5.4.2 are the best options.
Different response options can be combined in one programme, eithersimultaneously or sequentially. For example:

• a general food distribution can be combined with the provision of supplementaryrations for pregnant and lactating women and malnourished children;
• a cash-for-work scheme can be combined with market support interventions andfood for work implemented at different periods of the year.
The same intervention might also assist more than one target group. The targetgroups (see Section 5.4.4) are linked to the proposed interventions in a table similarto Table 4.16.
207Part IV / chapter 5: Conducting a response analysis
PARTIV
Affected (target) group Examples of interventions
Under-5 children whose lives are at risk:severely wasted
• Therapeutic feeding to children• Supplementary feeding to mothers• Emergency provision of clean water• Targeted distribution of cooking materials
Households whose livelihoods are at risk:experiencing severe depletion of productiveassets by distress sales, and of human assetsby rapidly deteriorating food access
• Targeted general food distribution to affectedhouseholds
• Provision of seeds and tools• Provision of fortified on-site school feeding
Table 4.16: Targeted interventions, examples
The EFSA report does not need to include all the details of the forecast andresponse analyses, but the logic of each recommended intervention should beclearly explained. It is also important to explain why other proposed responses arenot recommended. The recommended interventions should be linked explicitly to:• the groups whose lives and livelihoods are at risk, and the factors of risk identifiedduring the situation and forecast analyses;
• the context – markets, agro-ecology, social circumstances, etc.;• the security and access situation;• operational constraints – time, human resources, funding, etc.
5.4.4 Targeting
The EFSA report should provide recommendations about whether or not targetingis appropriate and, if so, the form that it should take. Targeting of assistance isbased on the groups defined as being at risk in the situation and forecast analyses.
Targeting may be applied at different levels:• Geographical targeting: All people living in a specific area receive assistance.• Household targeting: All households fulfilling certain criteria receive assistance,based on the profiles of groups whose lives and livelihoods are at risk, such asIDP households or female-headed households.
• Individual targeting: Within households, individuals whose lives are at riskreceive assistance, such as malnourished children or pregnant and lactatingwomen.

• Institutional targeting: Schools, hospitals and other institutions receive supportto improve food access and promote household and individual assetdevelopment and retention.
Whatever the approach to targeting, practical criteria must be applied to identifythe people who qualify for assistance. Targeting criteria must be:• easily understood and accepted by programme staff and the affectedcommunities, otherwise the targeting is unlikely to be successful;
• observable and measurable, so that they can be monitored objectively, otherwisethere will probably be lengthy debates about who is eligible for assistance andwho is not;
• specific to the target groups: attributes that are also possessed by people outsidethe target group are not useful as criteria.
In some cases, targeting may not be appropriate because either everybody in thearea needs assistance, or the costs and complications of targeting outweigh thebenefits. Examples of the second possibility include:• situations in which it is very difficult to define targeting criteria that are sufficientlyobservable and measurable, when the cost of targeting in terms of staff time maybe greater than the cost saving achieved by limiting assistance to certain groups;
• communities in which the principle of targeting is not accepted, because theculture places a strong value on equality and people do not accept that somemembers of the community should receive assistance while others do not.
The following are approaches that can help address these issues:• Community targeting: Community representatives decide who will receiveassistance. This works well if the representatives are genuinely acting on theentire community’s behalf. If they are not, there is a danger of substantialinclusion and exclusion errors.66
• Self-targeting: Some types of intervention, such as food for work, are based onthe principle that the target groups select themselves. The theory is that onlythose who really need the assistance will undertake the work required to receiveit. However, such projects are often implemented in areas with highunemployment, where the work implemented cannot absorb all the people willingto work. In such cases, other targeting approaches need to be used to selectworkers.
• Blanket assistance: If the situation is very severe, such as after a tsunami, andthe period of assistance provision is short, it may be cost-effective and sociallybeneficial simply to provide assistance to everyone.
208 Emergency Food Security Assessment Handbook / second edition
_____________66. A guidance note on community-based food aid targeting in complex emergencies is being preparedby WFP’s Policy, Planning and Strategy Division (Humanitarian Policy and Transitions). It will be availablein mid-2009.

chapter 6
Formulatingrecommendations forinterventions and follow-up
In the EFSA report (see Part V), the conclusions of the situation, forecast andresponse analyses are summarized in the recommendations section. The followingdetailed operational information is required for the selected response option(s):• the type(s) of intervention recommended;• the level of assistance: quantities of resources to be provided and frequency ofprovision;
• the target group(s) and institution(s), including descriptions and numbers ofbeneficiaries;
• the priority geographical areas;• the duration of the interventions, including start and finish dates and exit strategy;• the mechanisms for coordination with other agencies and the government.
The EFSA report may also include recommendations for interventions that WFPwill not implement, such as those focusing on protection, agriculture, health, water,sanitation, shelter, education, and capacity-building and training. For this type ofrecommendation, the level of detail in the EFSA report depends on the compositionof the assessment team. If the team includes specialist partner agencies, detailedrecommendations may be feasible. If not, the EFSA report should include broadrecommendations to be shared with agencies that have the relevant expertise.Although EFSAs are likely to result in recommendations for intervention carried outby WFP and/or partner agencies, they must remain open to the possibility of notintervening in circumstances where activities may be unsafe, detrimental to theaffected community, or otherwise ineffective in addressing identified issues.
The EFSA report should also include recommendations for follow-up assessmentand monitoring:• If the situation is changing quickly, such as during the first days after a forceddisplacement, regular follow-up assessments will be needed. During a slow-onsetemergency, a rapid assessment may be undertaken to ascertain whether or notthe situation warrants an emergency intervention. If so, it is likely that an in-depthEFSA will be recommended. The EFSA report should provide specificrecommendations concerning the timing and focus of follow-up assessments.
• Situation monitoring should be undertaken periodically after an EFSA. This will
209Part IV / chapter 6: Formulating recommendations for interventions and follow-up
PARTIV
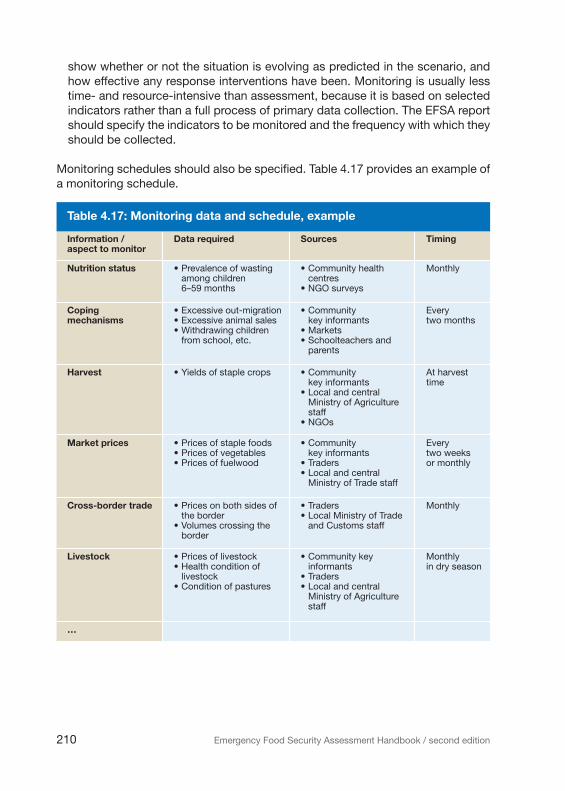
show whether or not the situation is evolving as predicted in the scenario, andhow effective any response interventions have been. Monitoring is usually lesstime- and resource-intensive than assessment, because it is based on selectedindicators rather than a full process of primary data collection. The EFSA reportshould specify the indicators to be monitored and the frequency with which theyshould be collected.
Monitoring schedules should also be specified. Table 4.17 provides an example ofa monitoring schedule.
210 Emergency Food Security Assessment Handbook / second edition
Information /aspect to monitor
Data required Sources Timing
Nutrition status • Prevalence of wastingamong children6–59 months
• Community healthcentres
• NGO surveys
Monthly
Copingmechanisms
• Excessive out-migration• Excessive animal sales• Withdrawing childrenfrom school, etc.
• Communitykey informants
• Markets• Schoolteachers andparents
Everytwo months
Harvest • Yields of staple crops • Communitykey informants
• Local and centralMinistry of Agriculturestaff
• NGOs
At harvesttime
Market prices • Prices of staple foods• Prices of vegetables• Prices of fuelwood
• Communitykey informants
• Traders• Local and centralMinistry of Trade staff
Everytwo weeksor monthly
Cross-border trade • Prices on both sides ofthe border
• Volumes crossing theborder
• Traders• Local Ministry of Tradeand Customs staff
Monthly
Livestock • Prices of livestock• Health condition oflivestock
• Condition of pastures
• Community keyinformants
• Traders• Local and centralMinistry of Agriculturestaff
Monthlyin dry season
…
Table 4.17: Monitoring data and schedule, example