wfp country program evaluation - wfp remote access secure
TRANSCRIPT

Office of Evaluation
Evaluation of WFP Country Programme 10418.0
Ghana
(2006-2010)
Full Report
April 2010
OEDE/2010/008
Prepared by:
Dr Leslie Casely-Hayford Team Leader and Education Specialist
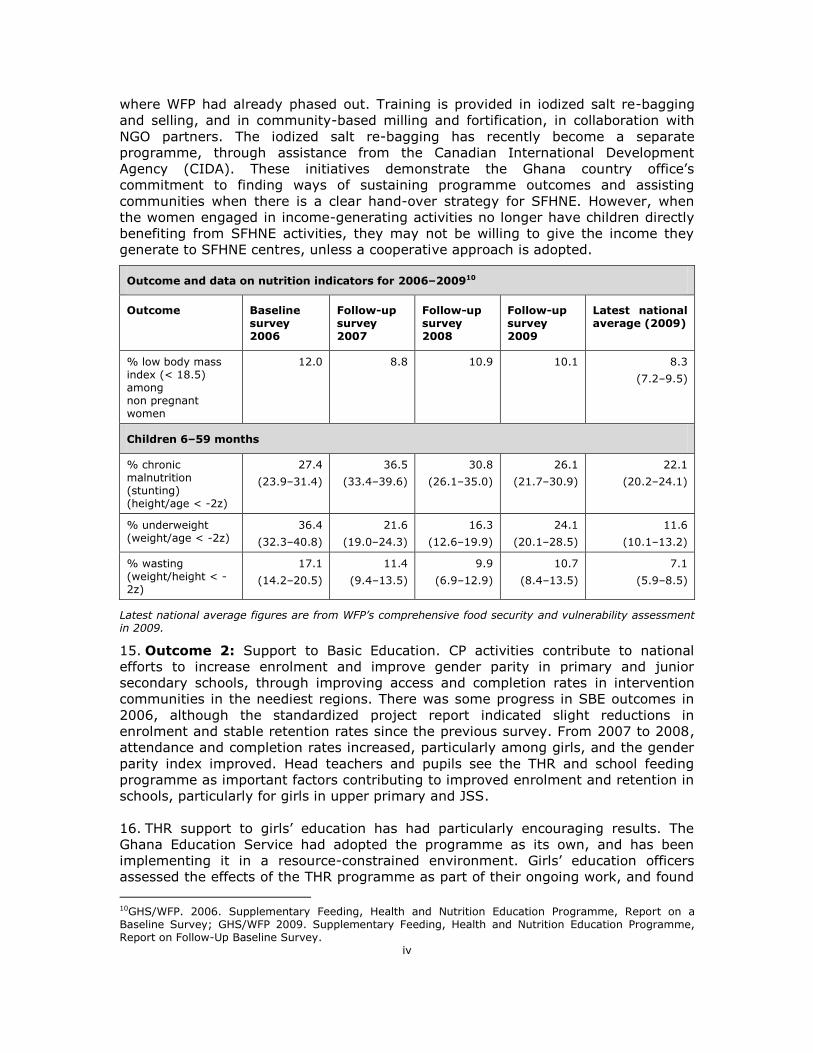
Tamsin Walters Nutritionist
Michael Johnny Agriculture Economist
Commissioned by the Office of Evaluation of the World Food Programme

Acknowledgements The Evaluation team was supported by the following people during the research
process: Ms Rama Brew Butler, Mr. Daniel Zoblah, Mr Chonia, Mr Roland Akabzaa
and Mr Mark Van Der Hoorn. The Evaluation Team would also like to thank OEDE, Ms
Sally Burrows for providing invaluable support at all stages in the process. The
Evaluation Team would like to thank the current and previous Country Directors Mr.
Ismail Omer and Ms Trudy Bower for taking time to share their valuable insights
concerning the Country Programme design and implementation process. We are also
indebted to several people in the Ghana office including Mr. Francis Sarpong-
Kumankuma, Ms Sibi Lawson-Marriott, Mr Ahmed Saeed and Ms. Gyamila Abdul-
Razak.
Disclaimer The opinions expressed are those of the Evaluation Team, and do not necessarily
reflect those of the World Food Programme (WFP). Responsibility for the opinions
expressed in this report rests solely with the authors. Publication of this document
does not imply endorsement by WFP of the opinions expressed.
The designations employed and the presentation of material in the maps do not
imply the expression of any opinion whatsoever on the part of WFP concerning the
legal or constitutional status of any country, territory or sea area, or concerning the
delimitation of frontiers.
Evaluation Management Evaluation Manager Sally Burrows
Director, Office of Evaluation Caroline Heider

Table of Contents
Executive Summary ............................................................................................. i
1. Introduction ................................................................................................... 1
1A Evaluation Objectives and Design ....................................................................... 1
1B The Country Context ......................................................................................... 2
2. Overview and Strategy of the Operation ........................................................ 5
2A Overview of the Operation ................................................................................. 5
2B Strategy of the Operation .................................................................................. 8
3. Results ......................................................................................................... 12
3A Beneficiaries and Assistance Provided ............................................................... 12
3B Attaining Objectives ........................................................................................ 21
3C Contributing to Change in the Country .............................................................. 37
4. Factors Explaining Results ........................................................................... 38
4A External Factors ............................................................................................. 38
4B Factors within WFP‘s Control ............................................................................ 41
5. Overall Assessment and Recommendations ................................................. 43
5A Overall Assessment......................................................................................... 43
5B Recommendations .......................................................................................... 48
Annex 1Terms of reference ................................................................................... 53
Annex 2 Evaluative methodology ........................................................................... 63
Annex 3 Bibliography and documents reviewed by the evaluation team...................... 67
Annex 4 List of persons met and places visited ....................................................... 71
Annex 5 Methodology and evaluative results matrix ................................................. 77
Annex 6 Key data collection tools included in the field guide ..................................... 81
Annex 7 District selection matrix ........................................................................... 82
Annex 8 WFP Ghana CP education results matrix 2006–2010 .................................... 83
Annex 9 Results matrix for nutrition and health....................................................... 87
Annex 10 Comparison of Ghana‘s nutrition indicators 1998-2009 .............................. 93
Annex 11 Site selection and findings from the field .................................................. 94
Annex 12 Coverage of key public health intervention ............................................... 96
Annex 15 Scale of WFP interventions across districts in three northern regions ......... 110
Annex 16 Main WFP CP partners and collaborators ................................................ 112
Annex 17 WFP Ghana food basket for CP (2006-2009) and new basket (2010) ......... 113
Annex 18 Planned, actual and funding levels of CP (2006-2010) ............................. 114
Annex 19 Food delivery and pipeline breakages across activity 1 and 2 .................... 115
Acronyms ....................................................................................................... 116

List of Figures
Figure 1 Trends in national nutrition indicators 1998- 2009 ...................................... 22
Figure 2 Primary gender parity index for national and the three northern regions.. ...... 30
Figure 3 Primary percentage change in enrolment for the three northern regions ....... .97
Figure 4 Primary gross enrolment percentage change for northern regions ................. 98
Figure 5 JHS percentage change in enrolment for the three northern regions .............. 98
Figure 6 Primary completion rate for the three northern regions an national ............... 99
Figure 7 JHS completion rate for the three northern regions an national ..................... 99
Figure 8 Gender specific Primary completion rate-three northern regions an national . 100
Figure 9 JHS completion rate for boys and girls in the northern region ..................... 100
List of Tables
Table 1 Percentage actual vs. planned beneficiaries reached under activity 1, SFHNE,
2006-2008 ......................................................................................................... 13
Table 2 Percentage of SFHNE actual vs. planned commodities delivered, 2006-2008 ... 13
Table 3 2008 SPR output data on beneficiaries ........................................................ 15
Table 4 Performance indicators for support to basic education (2006-2008)................ 17
Table 5 Food commodity prices for various WFP interventions ................................... 17
Table 6 Programme comparison of costs to implement school meal per child .............. 18
Table 7 Percentage change in real retail prices of selected good crops ....................... 21
Table 8 Outcome data on nutritional indicators for activity 1 SFHNE, 2006-2009 ......... 22
Table 9 Infant and under-five mortality rates, Ghana 1998-2008 .............................. 23
Table 10 Uptake by mothers of key infant feeding practices (target 100%) ................ 24
Table 11 Education performance indicators for the three northern regions .................. 28
Table 12 CP assessment in relation to key evaluative indicators ................................ 43

Operational Fact Sheet
Title of the Operation Country Programme Ghana (2006-2011)
Number of the Operation 10418.0
Approval Date 18 November 2005
Objectives
Overall goal: to contribute to Government efforts to assist hungry poor households to meet their education, health and nutrition needs on a sustainable basis. Intended outcomes: reduced malnutrition among at-risk pregnant and lactating women and children under five; improved attendance and completion rates among schoolchildren in
primary grades P1 to P6 and girls in junior secondary school grade JSS1 to JSS3;
improved national capacity to implement and scale up supplementary feeding and on-site school feeding programmes;
Increased demand for domestic farm poduce in response to newly created school feeding market requirements.
Strategy: transfer technical competence and create institutional mechanisms at national, regional, and district levels to enable WFP to phase out of external food aid within five years: Y1 & Y2 expanding and replicating models; Y3-5 phase out with assistance to government to scale up.
Operation specs Start
Date
End
Date Beneficiaries Metric tons US$
Approved design 1.01.06 31.12.10 152,000 35,169
16.2
million
At the time of the evaluation 1.01.06 31.12.10 170,000 30,977
Core Activities ‘Basic Components’ (meant to be mutually reinforcing)
Beneficiaries Metric tons US%
School Feeding (Comp.2) on-site in primary THR for girls`
X
92,000
(average p.a.)
18,288 (23,507 in
Programme Document. 61-
67%)
11,252,140
Supplementary Feeding & Health & Nutrition Education (Comp .1)
X 60,000
(average p.a.) 11,662 (39%) 4,946,754
Technical assistance & CB: food security, logistics/food procurement, public health & nutrition, education & early childhood dev;
X
Main Partners Please see Annex 16 for a listing of the main partners involved in the CP


i
Executive Summary
Introduction
1. The WFP Country Programme (CP) 104180 Ghana (2006–2010) is in its last year
of operation, and the country office has begun preparation of its WFP country
strategy. A mid-term evaluation planned for 2008 was postponed owing to national
elections. The main objective of this evaluation is to ―provide an evidence-based
independent assessment of performance of the CP so that WFP and other programme
partners can adjust course as necessary for the remainder of the CP term and to
inform future programme design.‖1 It covers CP activities from 1 January 2006 to
August 2009; information from 2005 was used for comparison. The Emergency
Operation (EMOP) conducted during the same period is not included in the
evaluation, except where it directly affected CP performance.
2. The evaluation used a mixed-methods and results-based management approach to
assess the CP‘s: i) relevance and appropriateness to the needs of the Government
and people; ii) effectiveness in achieving objectives; iii) implementation efficiency;
iv) sustainability; and – to a lesser extent – v) impact. The evaluation method
comprised extensive document review and secondary data analysis against key CP
indicators, followed by interviews with 115 stakeholders at the national, district and
sub regional office levels, including staff of WFP, United Nations and government
partners, and private sector and civil society stakeholders; and field work in 12
communities in 3 districts across the 3 northern regions where the CP is operational.
Further information on the method is available in annexes to the main report.
3. Development in Ghana presents a mixed picture of advances and setbacks.
Between 2008 and 2009 the country‘s ranking in the United Nations Development
Programme (UNDP) human development index dropped from 142 to 152 out of
182 countries. On the other hand, the country is set to become the first African
country to reach Millennium Development Goal (MDG) 1 of halving its poverty and
hunger rates before 2015. The latest Ghana Living Standards Survey (2006) showed
significant declines in the percentage of the population living in poverty nationally.
Economic growth has been strong, with Gross Domestic Product (GDP) growth rising
from 5.9 percent in 2005 to 7.2 percent in 2008. The elections in 2008 resulted in a
peaceful, democratic transfer of political power. Ghana has relatively low levels of
hunger compared with other countries with emerging transition economies, and
relatively good world governance indicators. Food production increased by 88
percent between 1990 and 2006.
4. However, Ghana is also a low-income, food deficit country2 with large rural–urban
and interregional disparities. In the three northern regions – Northern, Upper East
and Upper West – and some coastal areas, there is persistent food insecurity, less
access to basic services and growing incidence of environmental stress. Under-five
stunting, infant mortality and maternal mortality rates are all considerably higher
than the national averages. Maternal mortality rates appear to be increasing.3 These
regions now account for half of Ghana‘s population living under the poverty line and
have been disproportionately affected by increasing food prices;4 58 percent of
1From the evaluation terms of reference 2FAO Country Profiles, May 2009 3Government of Ghana. Multiple Indicator Cluster Survey 2006. 4Biederlack, L. and Rivers, J. 2009. Comprehensive Food Security and Vulnerability Analysis, Ghana. WFP.

ii
Ghanaian food crop farmers are food insecure, with the highest densities of such
farmers living in the northern regions.
5. Although the World Bank views Ghana‘s fiscal policy as ―pro-growth and pro-poor‖,
the current macroeconomic situation is described as ―delicate‖.5 The global financial
crisis has resulted in lower export values, a fall in commodity prices, less and more
expensive foreign capital, lower remittances and fewer tourists. This has caused
declines in income growth, job losses and budgetary pressures, leading to reduced
government spending on social protection systems.5 In addition, Ghana has been
host to refugees from other countries in the region.
Overview of the Programme Strategy
6. WFP‘s mission in Ghana is ―to help the Government to expand and replicate
successful models of food-based programming for raising demand for and supply of
basic education, with gender parity, and health and nutrition services for children
under-five years and pregnant and lactating mothers at risk of malnutrition‖.6 The
expected outcomes of the CP were:
(i) reduced levels of malnutrition among at-risk pregnant and lactating women
and children under five;
(ii) improved attendance and completion rates among schoolchildren in basic
education;
(iii) improved national capacity to implement and scale up supplementary feeding
and on-site school feeding; and
(iv) increased demand for domestic farm produce, in response to newly created
school feeding market requirements.
7. These were to be achieved through two main activity components: i)
Supplementary Feeding, Health and Nutrition Education (SFHNE); and ii) Support for
Basic Education (SBE). The SFHNE component was to provide fortified blended food
to children and mothers, strengthen capacity in nutrition programming at the
regional, district and sub district levels, and enhance health and nutrition education
at the community level. The two main activities under SBE were on-site school meals
in primary schools, from primary (P)1 to P6, and take-home Rations (THRs) for girls,
from P4 to junior secondary school 3 (JSS3). In collaboration with the United Nations
Children‘s Fund (UNICEF), the THRs targeted 19 of the 36 most deprived districts in
northern Ghana and those with the worst gender parity index.
8. The CP aimed to demonstrate best practice in school feeding and nutrition
programming to the Government. A progressive and ambitious hand-over strategy
was put in place for activity 1 (SFHNE), and a strategy of scale-up followed by
phase-out was designed for activity 2 (SBE).7 Sustainability activities – such as
income-generating programmes for women‘s groups to sustain some of the nutrition
programming – are relevant, but require a high level of WFP facilitation with Non-
Governmental Organization (NGO) collaborators and civil society organizations to
ensure their success. The CP aimed at a life-cycle approach in which children under
5Brinkman, H.-J., Bauer, J.-M., and Mahama, A. 2009, Assessing the Impacts of the Global Economic and Financial Crisis on Vulnerable Households in Ghana. WFP. 6WFP. 2005. Project Document Country Programme–Ghana 10418.0 (2006–2010), para. 17 (WFP/EB.2/2005/7-A/3). 7CP project document, paragraph 40.
iii
five and children in primary/junior secondary education would benefit from a cross-
targeting approach where activities 1 and 2 were carried out simultaneously.
Results
9. Outreach: WFP‘s Ghana CP is wide in geographic spread, but its scale and
intensity have not been sufficient to bring about significant change in the districts
where both activities 1 and 2 are carried out. The evaluation team had difficulty
capturing outcome results owing to the small scale of the interventions in comparison
with the need. On average, girls have received THRs at 17 percent of primary
schools and 25 percent of JSSs. In the vast majority of districts, between 6 and 30
percent of primary schools are covered by the THR programme. In most districts,
fewer than 10 percent of primary schools are covered by the school feeding
programme, led by either WFP or the Ghana School Feeding Programme (GSFP). A
previous study suggested that WFP should focus on a few districts where rapid
expansion could take place, to provide demonstration models.
10. Attaining objectives: WFP has striven to deliver SFHNE and SBE activities in
accordance with the CP project document and has adequately met, and often
exceeded, its beneficiary output targets. However, rations have been reduced, in
both quantity and quality, throughout the CP‘s duration. This is partly a result of
underestimating the number of women beneficiaries attending the child nutrition
centres on food distribution days. Other reasons are given in the section on Overall
Assessment and Recommendations.
11. Outcome 1: SFHNE. Between 2006 and 2009, there were reductions in
underweight and wasting among children aged 6 to 59 months in project locations
(Table 1). SFHNE certainly contributed to these improvements, along with enhanced
Ghana Health Service (GHS) community services in some locations, and inputs from
the WFP EMOPs implemented concurrently and from other donor interventions.
However, although WFP has been present in some communities for ten years, there
has been little impact on stunting.
12. Mothers‘ awareness and application of good infant feeding practices were strong
in programme communities visited, and it is evident that SFHNE has contributed to
better provision of nutrition education, and to enhanced engagement/outreach of
GHS community health nurses in some remote rural areas of northern Ghana. On the
other hand, little effect was found on weight gain of pregnant or lactating women in
programme communities over the CP period.
13. The strategy for progressive hand-over to GHS8 and WFP‘s eventual phase-out
from beneficiary communities9 has not been sustained during the CP. Before the CP
began, 69 communities from the previous CP were phased out, but very few have
been phased out or handed over since, and some communities that had been
identified for phase-out or hand-over were still receiving WFP food assistance during
the evaluation.
14. However, a significant achievement in 2009 and 2010 was the support to income
generating activities for women‘s groups to sustain SFHNE centres in 42 communities
8The strategy envisioned the gradual hand-over of supplementary feeding days. 9CP, paragraph 32.
iv
where WFP had already phased out. Training is provided in iodized salt re-bagging
and selling, and in community-based milling and fortification, in collaboration with
NGO partners. The iodized salt re-bagging has recently become a separate
programme, through assistance from the Canadian International Development
Agency (CIDA). These initiatives demonstrate the Ghana country office‘s
commitment to finding ways of sustaining programme outcomes and assisting
communities when there is a clear hand-over strategy for SFHNE. However, when
the women engaged in income-generating activities no longer have children directly
benefiting from SFHNE activities, they may not be willing to give the income they
generate to SFHNE centres, unless a cooperative approach is adopted.
Outcome and data on nutrition indicators for 2006–200910
Outcome Baseline survey 2006
Follow-up survey 2007
Follow-up survey 2008
Follow-up survey 2009
Latest national average (2009)
% low body mass index (< 18.5) among non pregnant women
12.0 8.8 10.9 10.1 8.3
(7.2–9.5)
Children 6–59 months
% chronic malnutrition (stunting) (height/age < -2z)
27.4
(23.9–31.4)
36.5
(33.4–39.6)
30.8
(26.1–35.0)
26.1
(21.7–30.9)
22.1
(20.2–24.1)
% underweight (weight/age < -2z)
36.4
(32.3–40.8)
21.6
(19.0–24.3)
16.3
(12.6–19.9)
24.1
(20.1–28.5)
11.6
(10.1–13.2)
% wasting (weight/height < -2z)
17.1
(14.2–20.5)
11.4
(9.4–13.5)
9.9
(6.9–12.9)
10.7
(8.4–13.5)
7.1
(5.9–8.5)
Latest national average figures are from WFP‟s comprehensive food security and vulnerability assessment in 2009.
15. Outcome 2: Support to Basic Education. CP activities contribute to national
efforts to increase enrolment and improve gender parity in primary and junior
secondary schools, through improving access and completion rates in intervention
communities in the neediest regions. There was some progress in SBE outcomes in
2006, although the standardized project report indicated slight reductions in
enrolment and stable retention rates since the previous survey. From 2007 to 2008,
attendance and completion rates increased, particularly among girls, and the gender
parity index improved. Head teachers and pupils see the THR and school feeding
programme as important factors contributing to improved enrolment and retention in
schools, particularly for girls in upper primary and JSS.
16. THR support to girls‘ education has had particularly encouraging results. The
Ghana Education Service had adopted the programme as its own, and has been
implementing it in a resource-constrained environment. Girls‘ education officers
assessed the effects of the THR programme as part of their ongoing work, and found
10GHS/WFP. 2006. Supplementary Feeding, Health and Nutrition Education Programme, Report on a Baseline Survey; GHS/WFP 2009. Supplementary Feeding, Health and Nutrition Education Programme, Report on Follow-Up Baseline Survey.
v
that it was having positive effects on girls‘ attendance, retention and completion
rates. Interviews with community members, district officials, teachers and girls
across several THR and non-THR schools suggest that the 40,000 girls supported by
the WFP CP were pioneers in their communities, as the first girls to reach JSS. THRs
have acted as an incentive for girls to remain in school. Community leaders and
parents have stopped practices of early marriage, employment of girls on farms, and
the sending of girls to income-generating activities in the cities, so that girls can stay
in school and collect the ration. The evaluation team found that THRs for girls was
the programme intervention with the most promise as a best practice model for
scale-up by the Government of Ghana. Compared with school feeding, THRs were
also more efficient and manageable in under-resourced schools.
17. Concerning school feeding, studies have found that teachers in Ghana have very
limited contact time with children, sometimes less than 2.5 hours per day, and that
learning environments are fragile.11 School observations and interviews with head
teachers revealed that school feeding was reducing this contact time further by an
average of one hour. This suggests that learning outcomes may be increased only in
schools where the school feeding programme is well managed and closely supervised
by the head teacher; this is a challenge, particularly in rural northern schools, which
are often understaffed.
18. The relationship between WFP and GSFP was challenging at the beginning of the
CP, and limited some programme learning from on-site school feeding during the
first few years of the CP. Working relationships with GSFP have improved over the
last two years, and the number of joint feeding schools increased from 79 in 2007 to
104 in 2009, although there are still operational challenges to this partnership at the
district level, including cost-efficiency issues.12 In December 2009, WFP and other
partners helped GSFP to define a road map for school feeding. WFP technical support
– focused on Purchase for Progress (P4P) and a stronger social safety net and carried
out as part of the World Bank partnership for school feeding – has also positioned
GSFP to become a more influential partner in the next CP.
19. Outcome 3: Improved national capacity. In 2006, WFP engaged in intensive
training of trainers in growth monitoring and the operation of nutrition centres for
community volunteers and health staff. Since then, the GHS has maintained a
minimal level of refresher training in growth monitoring and beneficiary
management. Observation at central, district and community warehouses suggests
that the country office‘s monitoring of and training in food storage and quality control
are inadequate to ensure effective programming. Under SBE, some senior national-
level officials, particularly in the GSFP and the Ministry of Local Government and
Rural Development, have been exposed to more effective targeting approaches and
options for implementing cost-effective and home-grown approaches to school
feeding. In addition, the early warning and food security system has become an
important tool for monitoring food security in Ghana, with increasing engagement
with the Ministry of Food and Agriculture.
11Fewer than 20 percent of children who reach P6 are able to read and write, according to government assessments of learning outcomes (Ministry of Education. 2009. Education Sector Performance Review Report. Accra.), and only 18 percent of children in lower primary school are literate in their mother tongue/Ghanaian language. 12Recent school feeding scale-up efforts by WFP, in collaboration with GSFP, resulted in districts allocating WFP support to different schools from those supported by GSFP.
vi
20. Improvements to national capacity have been limited, mainly owing to the
Government‘s low uptake of WFP best practice models in SFHNE and school feeding.
At the start of the CP, there was support for a gradual hand-over of WFP nutrition
activities, but the Government has not taken over the provision of food for SFHNE.
Although the GHS is honouring its commitments for transporting WFP food – albeit
inefficiently – it told the evaluation team that, owing to budgetary constraints, it
does not prioritize SFHNE, and does not consider increased future support justifiable,
particularly given the cost of transporting food for SFHNE.
21. Outcome 4: Increased demand for domestic farm produce. The tonnage and
monetary value of food procured locally by WFP increased steadily from 5,315 mt
valued at US$1.8 million in 2006, to 5,434 mt valued at US$1.9 million in 2007, and
to 10,828 mt valued at US$7 million in 2008. In 2007, 68 percent of food and in
2008, 77 percent of food was procured locally. This food is grown in Ghana, but not
necessarily in the region of CP operation, and is often procured by local traders. At
its peak in 2008, more than 2,000 farmers were reported to be benefiting. The
growth in locally procured food increased WFP‘s visibility as a contributor to local
farmers‘ capacity development and incomes. However, rising food prices and
farmers‘ limited production capacity dramatically restricted the quantities WFP
purchased locally in 2009. Local procurement of fortified commodities was delayed
by problems with quality control. With the start-up of P4P and the increasing focus
on home-grown school feeding, local procurement remains a major policy issue for
WFP to address, particularly in times of high food prices.
22. Based on extensive research and consultation, WFP has developed an overall
sustainability strategy to support the Government‘s home-grown school feeding
concept.13 Links have been established with farmers‘ groups and agro-processors of
blended foods to develop local markets, stimulate local food production and increase
incomes for local farmers. At the community level, local farmers are not yet fully
aware of the opportunities offered by the GSFP, and only a small percentage sell
their produce to GSFP caterers. Interviews revealed that farmers and the GSFP are
ready and able to support the local procurement of food for school feeding
programmes, but more efficient modalities have still to be worked out, particularly at
the district and regional levels, and greater engagement is needed with farmer-based
associations/networks and the Ministry of Food and Agriculture block farming
programme.
Factors Explaining the Results
23. The CP‘s performance is the result of a combination of factors, some external and
some within WFP‘s control. The drought and flooding that occurred in northern
Ghana led to more staff time at the national and sub-office levels being devoted to
the emergency from 2007 to October 2009, drawing them away from CP work; WFP
did not have enough programme staff to address CP demands while simultaneously
working on the EMOP. Although staff numbers increased in October 2008, according
to staff interviews, they did not shift their orientation from emergency programming
back to the CP until 2009.
24. The government shortfall in meeting its commitments to the CP was the main
external factor affecting CP implementation. Changes of senior government staff
13Gariba, S. 2007. Sustainability Strategy for WFP Ghana. Ghana country office, Accra; Van de Hoorn, M. 2009. The Story Behind the Sustainability Study. Ghana country office, Accra.
vii
after initial CP design led to reduced support for SFHNE coordinators and limited
monitoring. There was also a shift in health and nutrition policy towards more
preventive approaches through health promotion and nutrition education. Several
major stakeholders suggested that WFP‘s supplementary feeding approach would be
more effective and appropriate for targeting children with acute malnutrition rather
than chronic malnutrition.
25. The outputs and outcomes of the CP have been undermined by the programme‘s
broad geographic reach and the inadequate commitment and capacity from
government counterparts and district authorities to ensure district budgeting for
timely food transport and distribution. This has led to interrupted supply chains at
every stage of SFHNE and SBE programming, including delays in transporting food to
programme sites.
26. Early on, the CP was only 70 percent funded, which limited inputs. The second
half of the CP has been affected by high food prices, which brought to light tension
between WFP‘s imperative for cost-effective food procurement and the need to
procure locally for home-grown school feeding. There has also been limited impetus
within WFP at Headquarters, regional bureau and country office levels for hand-over
to the Government. The differing interpretations and varied levels of understanding
and commitment of the staff within the WFP country office have been one of the
most important constraints. To be successful, the CP requires sustained effort to
support staff in obtaining new skills and adopting approaches needed for the hand-
over and sustainability strategies. Issues requiring more attention include facilitation
of the hand-over strategy with the GHS; more focused support to the income-
generating groups identified for hand-over of SFHNE; more civil society engagement
in supporting community income-generating activities; support to district offices to
ensure budgeting of their yearly cycles of food assistance support; and closer
monitoring of capacity development and skills transfer at the national level, related
to outcomes 3 and 4.
Overall Assessment and Recommendations
27. Most of the CP‘s planned outputs have been delivered, but their translation into
planned outcomes and the overall development objective has been limited. This is
largely because of insufficient government commitment, a lack of sustained work
toward handing over, and limited time dedicated to the CP by country office staff
from 2007 onwards, owing to the emergency operation to respond to floods and high
food prices. Overall, the Ghana CP has partially fulfilled its objectives.
28. The CP was relevant to Ghana‘s needs at the time of its design, and its overall
response is appropriate, but ambitious. The CP remains relevant in the current
context of Ghana.
29. Positive outcomes related to sustainability have been achieved in SBE,
particularly the THR programme, despite very limited financial support. There have
also been encouraging results related to procuring food locally, making SBE more
home-grown and boosting local food production, related to outcome 4. The Ghana
School Feeding Programme acknowledges WFP‘s important role in supporting better
monitoring and in influencing the targeting and content of the GSFP‘s school feeding,
in such areas as menu preparation and the introduction of corn-soya blend.
viii
30. WFP‘s SBE is well aligned and in synergy with the Government‘s Poverty
Reduction Strategy, the Ministry of Finance‘s focus on social safety nets, and the
Ministry of Education‘s goals of achieving MDGs 2 and 3. There have been
improvements in gender equity in primary school enrolment and attendance, and
increases in the number of girls transitioning to JSS. The THR programme for girls
offers a best practice model for scale up. The Ministry of Education recognizes WFP‘s
contribution to increasing enrolment at the regional level, but this has not been
enough to ensure that the Government and the ministry provide the necessary
inputs for transporting WFP food in a timely and efficient fashion to ensure the
smooth roll-out of the programme. Challenges also remain for schools‘ efficient
management of school feeding to ensure higher learning outcomes.
31. Overall, the effectiveness of SFHNE was moderate. While the model is achieving
success in reducing wasting, it is not effectively reducing chronic
malnutrition/stunting. The evaluation team questions whether blanket feeding of
children was the most efficient approach for achieving the CP outcomes. As the
Government moves towards a more preventive approach, WFP should consider other
food assistance approaches in order to support a more effective and appropriate
response to malnutrition, both chronic and acute.
32. The efficiency of CP implementation has been low, mainly owing to limited WFP
staff time and the lack of government ownership and capacity needed to drive the
ambitious CP vision and strategies forward. There have been numerous pipeline and
distribution breaks, leading to smaller rations and the delivery of poor-quality food
for SFHNE at the community level, and to breaks in the supply of school meals in
some schools.14 Greater cost-efficiency in serving the joint GSFP/WFP food-assisted
schools in the three northern regions is also needed.15 Limited district budgets and
delayed government contributions to food delivery16 may also explain the low level of
efficiency.
Summary of Recommendations17
33. Recommendation 1: WFP should continue to implement a CP in Ghana, with a
phase out strategy based on the country‘s ability to meet institutional readiness
criteria and school feeding quality standards. The new CP should be tied to
triggers/monitoring milestones to be met by the Government. All WFP programming
in Ghana should aim to provide a best-practice model for cost-effective social safety
net programming that can be scaled up and replicated, particularly in relation to
more efficient and targeted school feeding, and THR programming for girls.
34. Recommendation 1a: WFP Headquarters and the country office must hold high-
level talks with the Government about WFP‘s future direction and contributions, in
light of WFP‘s new Strategic Plan and school feeding policy, which focuses on
institutional capacity development. The repositioning of WFP as a social safety net
partner will require senior policy discussions over the coming months, with the
14Confirmed in interviews with WFP staff and other major regional stakeholders, and validated by visits to the regional store house. 15The WFP/Boston Group analysis of the costs of food assistance in joint WFP/GSFP schools suggests that joint delivery of school feeding is less efficient, as GSFP pays extra to supplement the food provided by WFP. 16These were mentioned by WFP staff and Government counterparts as major factors limiting programme implementation. 17Full recommendations are given in the main report.

ix
Ministry of Finance, the National Development Planning Commission, the Offices of
the President and Vice President and key ministries. This will enable WFP to devise a
new strategy, reposition and ensure the creation of an enabling environment in
which it has a well defined role in providing effective models for social development
and food assistance programming in Ghana.
35. Recommendation 2: District targeting should be implemented more effectively.
WFP should rank districts based on poverty and hunger criteria, and should focus
future programmes on a few districts within the three northern regions that have the
highest levels of undernourishment and food insecurity, according to new
Vulnerability Analysis and Mapping (VAM), and are the most prone to drought. This
will increase potential outcomes, help demonstrate decentralized models of efficiency
at a decentralized level, enhance transport management and make monitoring
easier.
36. Recommendation 3: Support to Basic Education, particularly the THR for girls,
should remain a flagship programme for Ghana, and will require far higher visibility
in current social protection policy forums involving the Ministry of Finance, multi-
donor budgetary support partners and the social protection sector group. Future THR
programming in the CP should ensure at least 70 to 90 percent coverage of upper
primary and junior secondary schools, using a cohort approach covering all children
in a given school year, but concentrating the programme in fewer districts, selected
according to gender parity index scores and high numbers of girls not in school. A
multi-sectoral approach should be adopted for THRs, in which the Ministry of
Education leads, and collaborates with other ministries, including the Ministry of
Employment and Social Welfare as the lead on social protection.
37. Recommendation 4: WFP-led school feeding should promote a cost-effective
model based on home-grown school feeding. The model should help government and
development partners consider more efficient approaches to school feeding,
particularly given the fragile learning environments in northern Ghana. More locally
accepted and cheaper school meals than are currently provided by the GSFP should
be tested. The WFP model should demonstrate best practices in: i) achieving higher
learning outcomes; ii) ensuring linkages to farmers‘ groups; and iii) strengthening
community and district ownership and domestic farm production in the WFP target
districts collaborating with the P4P programme.
38. Recommendation 4a: Critical to the school feeding programme is the need to
define carefully the roles of head teachers and the Ghana Education Service in
ensuring proper management of school feeding to satisfy quality standards and
maximize learning outcomes.
39. Recommendation 4b: In schools that are unable to cope with the
management-intensive programme of delivering a hot meal every day, a simple,
more cost-effective and time-conscious approach to school feeding should be
introduced, such as one based on locally produced fortified biscuits. This should be
piloted, monitored and evaluated in selected rural and urban areas where WFP is
likely to be working on school feeding with the Ministry of Education through the
Ghana Education Service and the Ministry of Local Government and Rural
Development.

x
40. Recommendation 5: The country office should engage in intensive consultation
with the Ministry of Health at the national and regional levels and with other partners
such as UNICEF, to restructure and develop new WFP nutrition intervention models
for tackling mild/moderate malnutrition that complement the Government‘s new
preventive health and nutrition approach. In the next CP, WFP should also consider
whether it can support the Government in reducing acute malnutrition using food
assistance in community health outreach approaches, such as community-based
health planning and service centres and existing government nutrition centres.
41. Recommendation 5a: The current SFHNE programme should define a clear
hand-over and phase-out plan, based on the current master list of communities and
after consultation with the Government.
42. Recommendation 6: WFP should ensure adequate staffing, monitoring and
support from its programme officers to attain in full the goals of future CPs that use
developmental and sustainability approaches. The country office should establish
staff plans to ensure that at least 30 percent of staff time is devoted to the CP, even
in times of emergency. Policy consultation between WFP senior staff and government
counterparts should be more in depth, with a wider range of government
departments/ministries and more regular, so that WFP activities remain well
coordinated, aligned and consistent with government development plans.
43. Recommendation 7: The country office should forge new partnerships with civil
society agencies and others working at the district/community level to support and
broaden government connections with communities in target districts, promote
accountability and service delivery, and realize sustainability strategies. These
partnerships should be monitored every three months, particularly at sub-regional
levels.
44. Recommendation 8: As part of the new CP, the district planning and
coordination units under district assemblies should receive better orientation to their
roles and responsibilities for monitoring health, nutrition and education programming
in the districts. Funds should be made available for joint monitoring with the
planning and budgeting officers of each district assembly and for strengthening the
social subcommittees that oversee social development interventions. This would help
ensure long-term ownership of the programme at the district level and would
improve oversight of food assistance programming to minimize leakages.
45. Recommendation 9: In consultation with the regional bureau and
Headquarters, the country office should improve the monitoring and control of the
CP‘s timeliness and quality, particularly regarding the work of government
counterparts, quality/efficiency assurance of the supply chain and storage facilities,
and appropriate activity outcomes. This may require more WFP involvement in
transporting food with the Government, to ensure that inefficiencies are reduced.

1
1. Introduction
1A Evaluation Objectives and Design
1. The WFP CP (2006-2010) is in the last year of operation and the WFP Country
Office has begun preparation of a new WFP Ghana Country Strategy. A mid-term
evaluation planned for 2008 was postponed due to national elections. The main
objective of the evaluation is to: “Provide evidence based independent assessment of
performance of the CP so that WFP and other programme partners can adjust course
as necessary for the remainder of the CP term and to inform future programme
design” (see Terms of Reference, attached at Annex 1.
2. The scope of the evaluation covers the WFP Ghana CP activities which started from
January 1st, 2006 to August 2009. Information from the 2005 base year has also
been used in some cases to compare the situation before WFP CP interventions
began and the degrees of change within the period. The evaluation does not
specifically review the two EMOP activities which were carried out during the life of
the CP but does take these into account in relation to CP operational performance,
efficiency and achievements.
3. The Evaluation used a mixed method and Results Based Management (RBM)
approach to assess the CP‘s relevance and appropriateness to the needs of the
Government and people, its effectiveness (degree o achievement of objectives), the
efficiency of implementation, the degree of sustainability and to a lesser extent the
programme impact. A summary of the methodology and details of tools used and
sites visited are available in Annex 2 of this report. Details of the documents
reviewed, people met, the evaluation matrix, key data collection tools, and district
selection for site visits are included in Annexes 3 to 9.
4. The first phase comprised an extensive document review and secondary data
analysis against key CP indicators; this was followed by interviews with over 115 key
national, district and sub regional office stakeholders, WFP staff, UN and government
officials, private sector and civil society stakeholders; two weeks of field work in 12
communities in 3 districts across the three northern regions where the CP was
operational; district level consultations involved WFP‘s government partners in the
local government, health, education and agriculture departments and development
partners at the district and regional levels. Methods included interviews with
implementing staff, observation and participatory assessment methods involving
women and children as primary beneficiaries. Triangulation and validation methods
included visits to WFP warehouses, in-depth consultations with WFP regional
monitors, WFP sub office staff and government implementers. The typology of sites
selected for field visits is contained in Annex 11 and profile of communities visited at
Annex 14.
5. The evaluation explored the intended/planned strategies contained in the CP, the
actual outputs and outcomes and the factors which led to differences between the
two. The evaluation approach involved the use of qualitative and quantitative data
analysis, and triangulation methods to compare findings from different stakeholders.
The Evaluation team maintained an independent approach but closely engaged with
WFP country staff and government counterparts in assessing the outputs, outcomes
and performance of the CP. Four stakeholder briefings and debriefing were conducted
over the evaluation period with the CP staff at national and sub office levels; these
consultations included selected UN, Government and civil society collaborators. The
2
evaluation team included an educationalist, nutritionist and agro economist along
with five research assistants.
1B The Country Context
6. Ghana provides a mixed picture of development, reaching a level of achievement
and then receding due to a variety of external and internal factors including lack of
institutional capacity to manage and sustain increasingly complex development
interventions. Ghana ranks 152 out of 182 countries based on UNDP‘s (2009) Human
Development Index, but this is lower than the previous year‘s ranking of 142.
Nationally, net primary enrolment increased from 59.1 per cent in 2005 to 83.4 per
cent in 200818 with gender parity being almost achieved in 2005/06 and then
declining from 2006 to 200819. Malnutrition is still high in Ghana with under five
stunting at 22 per cent in 2008 nationally20 (see further below). On the other hand,
Ghana is set to become the first African state to reach the MDG 1 of halving poverty
and hunger before the target year of 2015. The estimated number of undernourished
people in Ghana has dropped steadily from 5.4 million in 1990-92 to 3.0 million in
1995-97 to 1.9 million in 2003-05.21
7. The latest Ghana Living Standards Survey (2006) indicates significant declines in
the percentage of the population living in poverty from 39.5 per cent in 1998 to 28.5
per cent - population 23.5 million in 200722. Economic growth was strong with GDP
growth rising from 5.9 per cent in 2005 to an estimated 7.2 per cent in 200823. The
elections in 2008 resulted in a peaceful, democratic transfer of political power
bringing international recognition to Ghana as a maturing democracy in Africa.
Ghana is classed as a ‗strong performer‘ on the World Bank‘s provisional Country
Policy and Institutional Assessment index24.
8. Yet, although food production increased by 88 per cent between 1990 and 2006,
Ghana is also a low-income food deficit country25 with large rural-urban and inter-
regional disparities in relation to poverty, food insecurity and access to basic services
as well as recent signs of deepening poverty among food crop farmers and slum
dwellers26. In the three northern regions (Northern, Upper East and Upper West) and
some coastal areas, there is persistent food insecurity and less progress towards the
MDG‘s on all fronts. There is also evidence of growing disparities and inequity across
the country in relation to regional and gender poverty. Gross primary enrolment is
35 per cent lower than in the Greater Accra region with girls‘ enrolment behind
boys‘27. Poverty rates, under five stunting, infant mortality and maternal mortality
are all considerably higher in the northern regions than the national average.
Maternal mortality rates appear to be increasing28. The three northern regions now
18World Bank Country Brief, Ghana 19Ratio of female to male primary enrolment at 98 per cent in 2005/06 and falling to 96 per cent from 2006 to 2008/09. Source World Bank data on MDG‘s http://ddp-ext.worldbank.org/ext/ddpreports 20UNICEF, Global Database on Child Malnutrition, updated June 2008 21FAO Media Centre (2009) ―Supporting Ghana‘s Fight Against Hunger.‖ 22UNICEF: Ghana at a glance, July 2009 http://www.unicef.org/infobycountry/ghana.html 23Idem 24World Bank Country Brief, Ghana 25FAO Country Profiles, May 2009 http://www.fao.org/countryprofiles/lifdc.asp 26Brinkman, H-J., Bauer, J-m, & Mahama, A., May 2009, Assessing the Impacts of the Global Economic and Financial Crisis on Vulnerable Households in Ghana, WFP 27UNDAF for Ghana 2006-10 28Government of Ghana Multiple Indicator Cluster Survey (2006), quoted in Biederlack, L. & J.Rivers, 2009, Comprehensive Food Security & Vulnerability Analysis, Ghana, WFP, Rome

3
account for half of Ghana‘s population living under the poverty line29. The northern
regions have been disproportionately affected by increasing food prices30 and
confront growing incidence of environmental stress.31
9. Recent WFP analysis of the institutional capacity of countries to transition out of
food assistance, placed Ghana in the category of countries with emerging/transitional
economies not yet sustaining the economic development growth needed to finance
robust social policies and with chronic hunger still widespread among the population.
This may change as Ghana translates its nascent oil revenues into support for strong
social development programming. Ghana has relatively low levels of hunger
compared to other countries in the category and relatively good World Governance
Indicators32.
10. While fiscal policy in Ghana is viewed by the World Bank as ‗pro-growth and pro-
poor‘, at 7.9 per cent of total public expenditure (2008), health expenditure is well
below the amount needed to meet the MDG‘s33. By comparison, education
expenditure is 13.3 per cent of total public expenditure with over 95 per cent of this
expenditure financing teachers‘ salaries34. Agriculture is the main occupation of 60
per cent of the workforce and accounts for 40 per cent of GDP. Smallholder
subsistence farms account for 80 per cent of total agricultural output. Although the
agricultural sector registered an average of 6.2 per cent growth in 2009 (compared
with 4.4 per cent in 2002)35, its performance is negatively impacted by inefficient
farming practices based on using rudimentary hand tools, dependence on rain-fed
agriculture, and poor marketing outlets for farm produce. Approximately 58 per cent
of Ghanaian food crop farmers are food insecure with the highest densities of such
farmers living in the northern regions36.
11. The current macro economic situation is described as ―delicate‖37. Reducing the
quality and quantity of food consumption has been identified as a common strategy
to cope with continued high food prices (along with return migration)38. The global
financial crisis has also resulted in lower export values, a fall in commodity prices,
less and more expensive foreign capital, lower remittances and fewer tourists. This
has caused declines in income growth, job losses and budgetary pressures which
have led to reduced government spending on social protection systems‖39. In
addition, Ghana has been host to refugees from other countries in the region, such
as Togo, Liberia and Cote d‘Ivoire
29UNICEF, Ghana at a Glance, July 2009 http://www.unicef.org/infobycountry/ghana.html 30Biederlack, L. & J.Rivers op.cit. 31The Participatory Poverty and Vulnerability Assessment (PPVA, 2009) suggests that factors driving poverty in the northern regions including increasing discordant climate change with extremes of drought, flooding and windstorms resulting in single annual harvest of subsistence crops instead of at least two harvests and farming seasons per year in the past. 32Reference + Draft under peer review. 33United Nations Country Team, 2005, UN Development Assistance Framework (UNDAF) for Ghana 2006-2010 34Very little of the non salary component of the budget is left for purchasing inputs for educational investment. 35Government of Ghana, Budget 2010 Report (www.MOFEP.gov.gh/budget.cfm). 36WFP Country Programme – Ghana (2006-2010) 37Brinkman, H-J., Bauer, J-m, & Mahama, A., May 2009, Assessing the Impacts of the Global Economic and Financial Crisis on Vulnerable Households in Ghana, WFP 38Idem 39WFP (2009) Assessing the impact of the Global Economic and Financial Crisis on Vulnerable Households in Ghana.
4
12. Rice, maize and wheat are the largest food items imported. The country imports
66 per cent of its maize and 100 per cent of wheat commodities. By December 2008,
real maize prices were 72 per cent higher than two years earlier and 144 per cent
higher than 9 years previously. The real price of cassava, on the other hand, has
remained relatively stable40. (See annex 18 for the percentage change in real retail
prices of various food crops).
13. Brinkman el al. (2009) has also established that households spend on average 52
per cent of their income on food. The share is higher for poorer households
particularly amongst the urban poor who spend approximately 67 per cent of their
income on food. Moreover, 75 per cent of households reported that expenditures had
increased over the previous 12 months. Of these, 83 per cent singled out food as the
most significant household expenditure item41. The Comprehensive Food Security
and Vulnerability Analysis (CFSVA) of May 2009 highlights the fact that persistent
food insecurity is concentrated in the poorest regions of the country, which are the
three northern regions. These are also the areas most prone to adverse weather
conditions such as floods and droughts and have been disproportionately affected by
recent soaring food prices.
14. Despite this complex contextual analysis of achievements and setbacks, key
donors in Ghana have progressively phased out of ―food assistance‖. Ghana was
dropped from United States Agency for International Development‘s (USAID) Food
for Peace programme in March 2006 based on a global ranking and prioritisation of
countries in receipt of food for development using malnutrition and poverty indices.
Ghana is no longer is eligible for food assistance support from USAID.
15. The Government of Ghana‘s current Growth and Poverty Reduction Strategy II
2006-2009 aims to accelerate agriculture-based economic growth and poverty
reduction with greater emphasis on supporting the private sector. Agricultural growth
in Ghana has grown more rapidly than the non agriculture sectors in recent years
expanding by an average annual rate of 5.5 per cent compared to 5.2 per cent for
the economy as a whole42.
16. At the time of the WFP CP (2006-2010) design and the United Nations
Development Assistance Framework (UNDAF) 2006-2010, the Ghana Poverty
Reduction Strategy II was in place, which also contained a pillar on human
development and basic services and gave greater emphasis to capacity development
of the public sector. Thirteen UN agencies including the WFP, signed the UNDAF
2006-2010 (which was extended to 2011 with renewal in 2012). Official development
assistance to Ghana totalled US$1200 million in 2006, supplementing the
Government‘s own investment by 30 per cent of GDP.43 The Multi Donor Budgetary
Support (MDBS) framework for monitoring government performance in relation to
Growth and Poverty Reduction Strategy (GPRS) also suggests several areas in which
WFP objectives have contributed to the overall performance of country goals
including the achievement of the gender parity index, reducing malnourishment and
improving social protection. The Food and Agriculture Sector Development Policy
(FASDEP II, August 2007), and an Agriculture Sector Plan 2009 – 2015 integrates
40Cudjoe, G, Breisinger, C & Diao, X (2008) ―Local impacts of a global crisis: food price increases and poverty impacts in Ghana‖, IFPRI Discussion Paper No. 842. 41Cudjoe, G et al (2008), op cit ; and Brinkman.H et al. (2009) ‗Assessing the Impacts of the Global Economic and Financial Crisis on Vulnerable Households in Ghana‘. 42Ministry of Food and Agriculture, Ghana (2008): http//www.mofa.gov.gh/CAADP; also see Economic Research Service/USDA (2005), Food security assessment-2005. 43World Bank/IDA, 2007, Country Assistance Strategy for Ghana FY 08-11

5
issues of food security and food assistance into its frameworks and objectives. The
education sector policies placed little emphasis on food assistance with no mention of
food assistance as a strategy for improving girls‘ education and enrolment in the
Ghana Education Strategic Plan (2003-2015). As part of the New Education Strategic
Plan (2010-2020), School feeding is mentioned as a strategy for improving access at
Basic Education level. The Health Sector Programme of Work 2002-2006 also did not
mention WFP contributions in the nutrition and health sector.
17. The overall country context depicts a situation in which despite significant
reductions in poverty and hunger within the population, there continues to be
regional poverty pockets and social inequalities which characterise Ghana‘s
development profile. These areas continue to experience high rates of food insecurity
despite increased food production. Coping strategies and family food security
planning appear not to have made major impacts in these areas despite high levels
of food assistance programming targeted to these areas. Food assistance appears to
be building dependency in some communities and eroding traditional coping
mechanisms in others. Ghana also provides a context in which numerous
development interventions have been tested, piloted and scaled up within the
education and health sectors.
2. Overview and Strategy of the Operation
2A Overview of the Operation
18. The Ghana CP Document (2006-2010), outlines WFP‘s commitment to
contributing to three of the UNDAF‘s six strategic areas of cooperation: education,
health and sustainable livelihoods. These are linked to the GPRS II and WFP‘s
Strategic Plan and policies44. At the time of programme design, the Government of
Ghana was on track to meet the MDG1 goal of halving the number of people living in
poverty. Since the beginning of the programme Ghana is one of the few countries
worldwide to halve the number of people living under the poverty line and suffering
from hunger45.
19. The appropriateness and relevance of the WFP CP is underscored by the United
Nations Development Assistance Framework (UNDAF) for Ghana, 2006-201046. Six
inter-related areas of cooperation emerged as critical for the UN system‘s support to
Ghana between 2006 and 2010. These were access to health; improving enrolment
and gender equity in basic education; increasing productive capacities; strengthening
the national response to HIV/AIDS; improving data management systems; and
increasing the effectiveness of governance systems in Ghana. In supporting these
outcomes, the UN system was guided by the human rights approach, which meant
putting emphasis on the most deprived districts and vulnerable groups in order to
reduce regional disparities and bridge social gaps in basic social services in Ghana.
20. WFP‘s ‗mission in Ghana‘ is ―to help the Government to expand and replicate
successful models of food-based programmes for raising demand for and supply of
basic education, with gender parity, and health and nutrition services for children
44The GPRS II has three main pillars: private sector competitiveness; human development and basic services; good governance and civic responsibility. 45FAO, 2009, The State of Food Insecurity in the World. 46The UNDAF was based on the challenges identified in the Ghana 2004 Common Country Assessment (CCA) and lessons learnt from the previous CCA/UNDAF process. It supported national priorities as set out in the Ghana Poverty Reduction Strategy II (GPRS II).

6
under five years and pregnant and lactating mothers at risk of malnutrition‖47. The
four major expected outcomes of the CP are:
Outcome 1: Reduced levels of malnutrition among at-risk pregnant and
lactating women and children under five;
Outcome 2: Improved attendance and completion rates among school
children in basic education;
Outcome 3: Improved national capacity to implement and scale up
supplementary feeding and on-site school-feeding;
Outcome 4: Increased demand for domestic farm produce in response to
newly created school feeding market requirements.48
21. The CP Project Document clearly states the WFP intention to progressively hand
over and phase out external food aid in Ghana within five years, but this is not listed
as an ‗intended outcome‘ in the Logical Results Framework. Using food and non-food
resources, the two core component activities in the CP are:
Component 1: SFHNE (39 per cent of total resourcing);
Component 2: Support for basic education (61 per cent of total).
Component 1: SFHNE
22. The main activities involved in Component 1 were to: provide fortified blended
food to children and mothers, strengthen the capacity in nutrition programming at
regional, district and sub-district levels and enhance health and nutrition education
at the community level. The Ghana Health Service (GHS), WFP, UNICEF with
technical support from the Food and Agriculture Organization of the United Nations
(FAO) and World Health Organization (WHO) were intended to carry out
complementary activities boosting outreach services and/or community health
compounds. NGOs were to play an important role providing technical support and
training; UNICEF was to support Community Health and Nutrition Centre (CHNC)
infrastructure, training in Growth Monitoring and HIV/AIDS, provide nutrition
education materials and advocacy for nutrition issues.
23. The Ghana Health Service (GHS) has responsibility for oversight and monitoring
of the activity which is implemented by community volunteers, supported in some
cases by Community Health Nurses (CHNs). CHNs provide health and nutrition
education to mothers on a monthly basis as part of their routine activities but linked
closely with the CHNCs in WFP sites and supplemented by nutrition attendants in
some cases.
Component 2: Support to Basic Education
24. This was intended to enhance national efforts to increase enrolment, access and
completion rates and improve gender parity in primary and JSS levels particularly in
northern Ghana. The component was also intended to provide government with a
model for implementation of a national on site school feeding programme as part of
a pilot series of countries to introduce home grown school feeding. The two key
activities were: on site school feeding in primary schools for boys and girls in P1 to
P6 and secondly, take home rations for girls in P4 to JSS 3. The take home rations
47WFP, 2005, Project Document Country Programme – Ghana 10418.0 (2006-2010) para.17, WFP/EB.2/2005/7-A/3 48Ghana has now been scheduled to become a pilot country for the WFP ‗Purchase for Progress‘ programme (P4P) from 2010

7
were targeted to continue in 19 of the 36 most deprived districts in northern Ghana
and those with the worst Gender Parity Index (GPI)49.
25. In 2005, the Government of Ghana started its Ghana School Feeding Programme
(GSFP) along the lines of the home grown school feeding concept and different from
the other school feeding programmes. The WFP and the GSFP entered an agreement
in May 2007 of the CP to provide technical support nationally and provide food
commodities which would support the programme in the three northern regions of
Ghana. Initially, WFP was to provide food to the GSFP schools in the three northern
regions three days a week and GSFP was to provide food two days a week. As a
gradual take over in early 2008 by GSFP, the WFP assistance reduced to two days in
a week and that of GSFP increased to 3 days a week. The GSFP approach was to
focus on linking school feeding implementation directly to farmers producing food in
the localities/areas where School feeding was active. The immediate objectives of the
GSFP were to reduce hunger and malnutrition, increase school enrolment,
attendance and retention, thereby advancing overall literacy achievement; and boost
domestic food production. The GSFP was an initiative of the Comprehensive Africa
Agricultural Development Programme (CAADP) Pillar 3 which seeks to enhance food
security and reduce hunger in line with the UN Millennium Development Goals
(MDGs) on hunger, poverty and malnutrition. The basic concept of the programme is
to provide children in primary schools and kindergartens with one hot, nutritious
meal, prepared from locally grown foodstuffs on every school going day.50 The school
feeding concept thus addresses the dual objectives of 1) increasing school
enrolment, attendance and retention thereby advancing overall literacy achievement
and 2) boosting domestic food production and, hence incomes of smallholder
farmers. The underlying premise of the programme is that school feeding, using
locally produced foods, can become an engine for economic development and
poverty alleviation.
26. Activities related to Outcome 3 (improving national capacity for supplementary
feeding and on-site school feeding) and Outcome 4 (increasing demand for domestic
farm produce) were not specified as separate components. They were mentioned
under the ‗Implementation Strategy‘ in the CP Project Document. Planned activities
included: technical missions by experienced professionals to work with relevant
Ministries; training for staff of partner institutions, and staff-exchange programmes.
In Standard Project Reports (SPR‘s), they were reported as part of Components 1
(SFHNE) and 2 (SBE).
27. Initial focus of the CP was on expanding WFP‘s main activities in the Upper West,
Upper East and Northern regions, with further expansion to Ashanti and Western
regions envisaged and then gradual phase out of CP programming in years four and
five.
28. Table 1a in annex 1 (the evaluation Terms of Reference) provides a clear
overview of all the key WFP ongoing operations in Ghana between 2005 and 2010.
During the life of the CP there were two operations (EMOP and Protracted Relief and
Recovery Operation [PRRO]). The EMOP (2007-2009) was funded at close to
16,683,150 million US$ (excluding the ISC). The numbers of planned beneficiaries
were smaller in the CP than the initial EMOP (2007 to 2009)51. The PRRO (106730)
from 2006 to 2009 was funded to about US$2,572,318 million (excluding ISC);
49WFP had identified some of these districts in order to work with UNICEF on helping attain GPI particularly in the northern region of Ghana. 50Ghana School Feeding Programme, District Operation Manual 51
The original EMOP budget was for usUS$17.9 out of which 4.5 was technical assistance to Government.

8
another PRRO (2010 to 2011) was being planned during the CP evaluation period.
The proposed PRRO activities (January 2010 to December 2011) is of much larger
scale with funding up to approximately US$22 million.
29. The total CP funding envelope was envisaged at US$16.2 million but with a
budget revision 2009, it was increased to US$23,865,080 million (excluding indirect
support cost/ISC)52. Funding during the first few years of the CP (2006/07 to
2007/08) reached 65-70 per cent of the expected amount while the last three years
of the CP was fully funded in late 2008 (2008 to 2010) through grants from the
Canadian International Development Agency (CIDA) and others (e.g. Unilever, GTZ,
German Quality improvement grant, Swedish Trust Fund) (see annex 18 for planned,
actual and funded CP expenditures 2006-2010).
30. The CP also envisaged a large number of collaborating partners at community,
district and national level including several civil society partnerships. The stakeholder
map and list of interviewees in annex 4 provides an overview of the main
stakeholders included in the CP design and interviewed as part of the field mission in
southern and northern Ghana. Annex 16 provides the listing of the intended
collaborating partners for the CP. The evaluation team was able to differentiate
between actors and collaborators who were intended to have a direct role in the
programme and those that were actually involved in the implementation of the CP
including several UN agencies, district assemblies and civil society partners who
would build the capacity of districts/ communities to finance their food assistance
activities.
2B Strategy of the Operation
31. The CP employed an ambitious strategy which aimed to demonstrate best
practice to Government in school feeding, and nutrition programming. A progressive
handover strategy was put in Activity 1 and a scaling up and then phasing out
strategy was put in place for activity 2 (Support to Basic Education). Sustainability
activities, such as income generating programmes for women‘s groups in order to
pay for some of the nutrition programming, were relevant strategies but demanded a
high level of WFP facilitation with NGO collaborators and civil society organizations
(CSOs) to ensure their success. At the same time the CP was scaling up girls‘
education programming in order to eventually phase out in the final two years. It
aimed at a ―life cycle approach‖ which would assist children under five and children
in primary/junior secondary education. ―During the first two years of the CP, WFP will
support the Government and communities in replicating successful models of
component 1, supplementary feeding, and sustain component 2, girls‟ education,
while preparing WFP‟s phasing out of external food aid in the final three years. Under
component 1, sustainability strategies will be developed with communities, district
assemblies and partners to enable them to appropriate the component by the end of
the CP (CP para 40)”.
32. The goal of the Ghana CP (2006-2010) was to support the government in its
assistance to poor households to meet their education, health and nutrition needs on
a sustainable basis (CP project document). The CP directly addresses the WFP core
programme goal for 2006-2009 as stated in the WFP Strategic Plan (2005).53 The
52There was another budget revision after CP evaluation. 53
Save lives in crisis situations; protect livelihoods in crisis situations and enhance resilience to shocks;
support the improved nutrition and health status of children, mothers and other vulnerable people; support access to education and reduce gender disparity in access to education and skills training; and

9
SFHNE activity was consistent with the Ghana Poverty Reduction Strategy Priority 3,
which focused on human development and the provision of basic services. The
SFHNE and SBE activity conforms to WFP‘s Enabling Development Policy priorities 1
and 2 and WFP Strategic Priorities 3, 4 and 5 of the Strategic Priority 2005-2009.
The CP document is also consistent with the new SP (2008-2013) Strategic
Objectives 4 (Reduce chronic hunger and under nutrition) and has been a pioneer of
Strategic Objective 5 (Strengthen the capacities of countries to reduce hunger,
including hand-over strategies and local purchase).
33. In addition to the provision of basic services, the Ghana CP aimed to strengthen
the government‘s technical capacity to replicate, sustain and expand successful
models of good practice in nutrition, social protection and school feeding on a
national scale, through the transfer of technical expertise and the creation of
institutional mechanisms to guarantee sustainability. An important part of the
implementation strategy was to establish long-term linkages between activities and
local agro-processors to enhance the development of local food markets, increase
demand for agricultural products, stimulate local food production and increase rural
farmers‘ incomes particularly for women. Best practice models were also envisaged
through the collaboration with the Ghana School Feeding programme and the
Community Based Health and Nutrition Centres which were to provide models to the
Ghana Health Service.
34. Both the VAM 2000/01 and 2004 confirmed that food-deficit and the most
vulnerable districts to food insecurity were concentrated in the Upper West, Upper
East and Northern regions. Combined with nutritional data from the Ghana
Demographic Health Survey (see below), this supported WFP‘s decision to remain
focused on the 3 Northern regions. There was an intention that the two CP activities
(SFHNE and SBE) would be mutually reinforcing and combine their support to target
populations to enable them to discontinue food assistance in the shortest time
possible through geographic concentration. The strategy of the operation was also
designed to implement a life-cycle approach in nutrition and education targeting
pregnant and lactating women, children under five, and school children between 6
and 14. Activities focused in areas where the WFP programming would be
complemented by activities of other UN organizations, NGOs, Community-Based
organizations (CBOs) and bilateral donors.
35. The SFHNE activity in CP 10418.0 (2006-2010) followed on from an existing
activity in the prior CP that supported 24 000 children and 14 400 pregnant and
lactating women in 17 out of 24 districts in the 3 Northern Regions of Ghana. The
RBM Impact Evaluation of the activity in 200454 noted that low coverage of the
activity (about 6 per cent of pregnant and lactating women and 5 per cent of children
under five years were reached) had resulted in negligible impact on malnutrition
rates at district and regional level and recommended a rapid expansion of the
programme in the most deprived districts. It further recommended that exit
strategies be included in the implementation strategy with eligibility for full food
support limited to 3 years with communities gradually taking over thereafter. The
report identified a need to strengthen capacity building and to establish linkages of
strengthen the capacities of countries and regions to establish and manage food –assistance and hunger reduction programmes. 54RBM Impact Evaluation of the Ghana Health Service ― Supplementary Feeding, Health and Nutrition Education Programme‖ in the three northern regions supported by the WFP Asamoa Tutu, P. Sarpong Kumankuma, F. Van der Veen A. and Woodring, S. (2004).

10
women‘s groups with Income Generating Activities (IGAs), community farms and
gardens from the start.
36. The new CP 10418.0 took on board these recommendations with a strategy to
consolidate gains made during the previous CP, scale-up and then phase-out of
external food support, with a gradual hand over to government and communities
themselves55.
37. A number of impacts were reported from the previous CP that provided a strong
case for continuation of the activity into the new CP. These included improved food
availability in the household; freeing up mothers‘ time to work on farms or IGA and
improving their income while young children were in CHNCs; improved community
unity (working together, making group decisions); enhancing women‘s role in the
community; improved availability of pre-schools and regular health services;
increased women‘s IGA groups; and mothers reported improved hygiene, reductions
in child morbidity and improved nutritional status of their children. However,
challenges were also reported, including sustainability (lack of success of
IGA/community projects) under the CP and limited ability to phase-in and phase-out
communities, as well as selection of communities that may not favour the most
needy or those without other services/means (e.g. overlap with Catholic Relief
Services [CRS] programmes).
38. In 2007 a district Multi Indicator Cluster Survey (MICS) study conducted by
UNICEF and the Government, confirmed elevated rates of malnutrition in both the
Upper East and Northern Region in comparison with the National levels, though rates
in Upper West were more consistent with the national picture. See annex 10 for more
details of the malnourishment trends over the life of the CP (2006 to 2009). The
Food Aid Review of Ghana (2004) stated that although child nutrition figures—
especially those for chronic malnutrition—are very high on a national level and higher
even for some northern regions, they should not be seen primarily as an outcome of
food supply problems inadequate child care, lack of micro nutrients, improper diet as
well as diseases are the main factors for malnutrition.
39. The midterm evaluation of the WFP Girls‘ Education Programme (2004) also
confirmed that the Take home ration programme was having positive impact on the
attendance, enrolment and retention levels among primary school and junior
secondary school children.56 The study found that the programme should be scaled
up and continued with higher degrees of government support over the coming years.
The programme was redesigned to follow a cohort approach of supporting 40,000
girls who would eventually graduate from the primary school level and enter the JSS
level over the life of the CP. A phasing out of primary schools and phasing in of more
JSS schools was therefore the strategy embedded in the CP.
40. The strategy to phase out of external food assistance in Ghana was based on
building community capacity, supported by district assemblies‘ capacity to manage
and maintain CHNCs, and support the Government‘s capacity to implement and scale
up supplementary feeding, Take Home Ration (THR) and school feeding. The
Supplementary Feeding Programme was planned to be handed over progressively to
55Although the phase-out strategy embedded in the Country Program was to phase-out of the Country Program, WFP was expected to remain in Ghana as a centre for other humanitarian and relief efforts in the region. The plan to support the government to continue addressing the needs of the population through capacity-building and other types of activities would also remain in place. 56The (2004) WFP Girls‘ Education Self Evaluation found that the Gender Parity Index was not a strong measure for phasing out of a district due to the fact that the GPI did not capture the numbers of out of schools girls and boys and only measured parity with the school system.
11
the Ghana Health Service (GHS) as of 2008. Unfortunately, less emphasis was placed
in the CP on ensuring that the take home ration programme approach to attaining
gender parity and improving retention, completion rates along with other educational
outcomes for girls was supported by the Ministry of Education.
Consistency with government policies/objectives:
41. The SFHNE activity was consistent with Ghana‘s GPRS II, which aims to reduce
deaths of children under five from 110 to 95 out of 1000; reduce deaths of children
under-1 from 56 to 50 out of 1000 and reduce deaths of women during childbirth
from 200 to 160 out of 100 000. The Support to Basic Education component of the
programme was also in line with the Ministry of Educations‘ Education Strategic Plan
(2005-2015) along with the new ESP (2010 to 2020) and 2015. The Take Home
Ration (THR) component of the programme was mentioned in several Ministry of
Education annual performance reports57 as a key strategy for improving girls‘
enrolment, retention and transition in deprived areas of the country. The THR
programme was one of the largest donor supported programmes for girls‘ education
programming within Ghana‘s education sector.
42. WFP‘s CP was also consistent with the objectives of the Imagine Ghana Free of
Malnutrition strategy, the goal of which was to maximize healthy lives of Ghanaians
through influencing knowledge, attitudes and practices of a large segment of the
population toward healthy food habits and by promoting consumption of nutritious
locally produced and affordable foods. Its objectives and activities included:
promotion of exclusive breastfeeding for first 6 months of life; appropriate
complementary feeding practices for children 6 months to 2 years; improve
nutritional status of children under five through supplementary feeding programmes
in the 4 most deprived regions; improve the nutritional status of children in Basic
School in the 4 most deprived regions; prevent and control micronutrient
deficiencies; improve the nutritional status of pregnant women; prevent and manage
children with Protein Energy Malnutrition. WFP is noted as a key partner in the
document and Work plan and its SFHNE activity was clearly consistent with the
government approach of the time.
43. The Food and Agriculture Sector Development Policy (FASDEP) of the Ministry of
Food and Agriculture also seeks to address issues affecting small farmer operations,
and adequate food and security country wide. Although the (FASDEP) document does
not address school feeding specifically although the strategies proposed could
improve household food security and help achieve the objectives of the home grown
school feeding approaches and WFP school feeding programme with Ministry of
Education. The Ministry of Food and Agriculture is also seen as an essential partner
to WFP‘s collaboration with the Ghana School feeding programme and with respect to
the achievement of outcome 4 in the CP. The FASDEP strategies proposed included:
designing and implementing special programmes to target resource poor operators in
the agriculture sector; enhancing production diversification of vulnerable groups;
ensuring access to nutrition and health information; ensuring more effective
utilization of production; stabilizing prices through buffer stocks and other measures;
promoting processing, preservation and utilization of crops, livestock and fish
products; strengthening early warning systems and putting in place emergency
preparedness and disaster management schemes; designing mitigation measures
against HIV/AIDS; and promoting the establishment of storage facilities, including
community level facilities. These strategies aimed at ensuring adequate food access
57Ministry of Education: Annual Education Sector Performance Reports (2006, 2007, 2008)

12
and produce at all times at competitive prices, and availability nationwide. Overall
the CP design was very relevant and appropriate to the Ghanaian development and
hunger context at the time.
3. Results
44. The next section is divided into two main parts related to the two major CP
activities: supplementary feeding and support to basic education. The section begins
by analyzing the main outputs achieved to date, and then the outcomes and eventual
impacts of the programme.
3A Beneficiaries and Assistance Provided
45. Overall many of the outputs were achieved related to the supplementary health
and nutrition feeding programme and the support to Basic Education under the
2006-2010 CP. Fewer outputs were realized in relation to the need to support
capacity building of Government to take over supplementary feeding which has
implications for the long term sustainability and the positioning of WFP as a capacity
building partner with Government.
Outputs for Activity 1: SFHNE
46. SFHNE (Activity 1) targets 60,000 beneficiaries annually across 221 selected
communities in the three northern regions. Intended beneficiaries include:
10,000 women in the 2nd trimester of pregnancy and the first 6 months after
delivery and 14,000 children aged 6-24 months were to receive a
micronutrient-rich take home supplement of a fortified blended food, iodized
salt and oil from CHNCs on a monthly basis for seven months during the lean
season;
In day-care/pre-school centres 36,000 children aged 2-5 should receive one
micronutrient-rich cooked mid-morning meal for 260 days a year (Monday to
Friday).
The programme was implemented on a ‗blanket‘ basis such that all eligible members
of the community are included regardless of nutritional status.
47. One hundred and thirty-eight new communities joined the programme at the
start of the CP in 2006, while sixty five ―self sustaining‖ communities were phased
out of the programme58. These communities were selected by District authorities,
using eligibility criteria outlined by WFP and community profiles based on pro-poor
mapping. WFP then verified the sites through visits. With the limited quantity and
quality of data available at that time the targeting process appears relatively
thorough and appropriate, although inevitably lends itself to a measure of political
influence at the district level. Although all sites that had been in the programme
since before 2000 were due to be phased out prior to the start of the CP, the
evaluation found communities that had been benefitting from the programme for 10
and 15 years and some communities intended for phase out at the beginning of the
CP were still receiving support. Therefore it appears that the phase out targeting for
the CP was not followed through and there was a failure to implement the phase out
strategy from the start of the CP partly due to limited monitoring, and lack of uptake
58Significant mapping exercises were conducted to assess the readiness of communities to phase out and their capacity to continue supporting their own Nutrition centres: see Van de Hoorn (2009) ―The Story behind the Sustainability Strategy: an analysis of past and current development linkages for sustainable phase out of WFP‘s activities in Ghana: WFP Ghana.‖
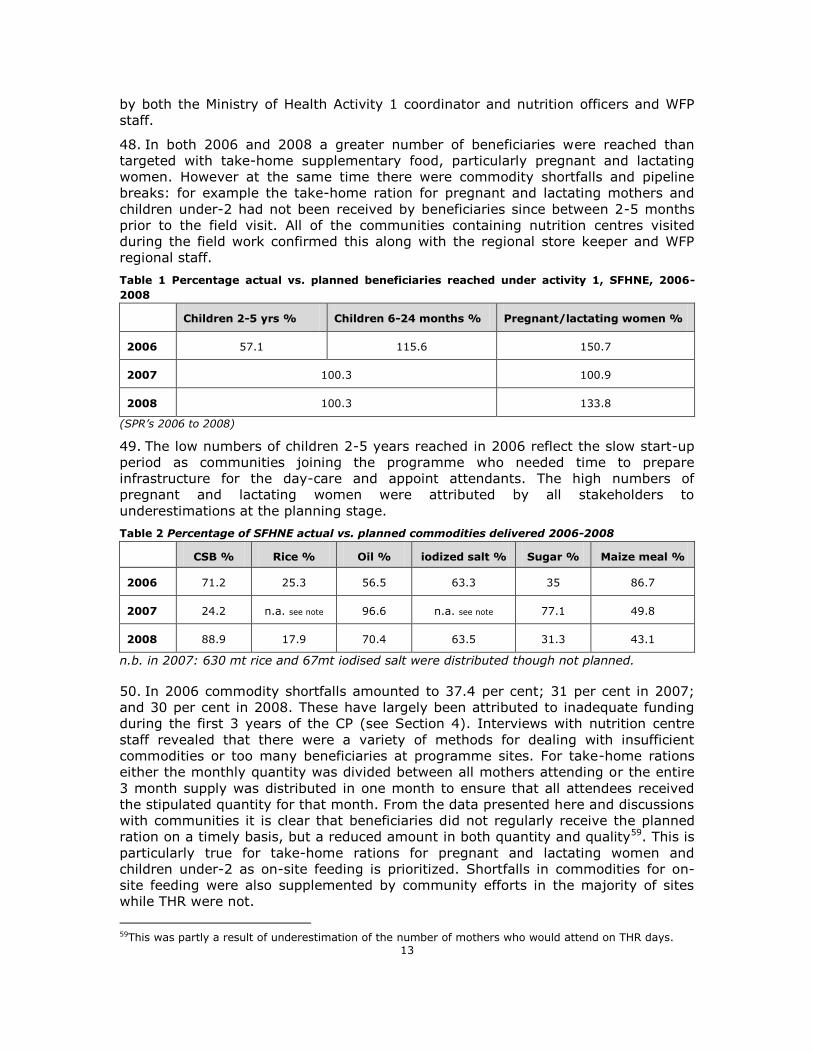
13
by both the Ministry of Health Activity 1 coordinator and nutrition officers and WFP
staff.
48. In both 2006 and 2008 a greater number of beneficiaries were reached than
targeted with take-home supplementary food, particularly pregnant and lactating
women. However at the same time there were commodity shortfalls and pipeline
breaks: for example the take-home ration for pregnant and lactating mothers and
children under-2 had not been received by beneficiaries since between 2-5 months
prior to the field visit. All of the communities containing nutrition centres visited
during the field work confirmed this along with the regional store keeper and WFP
regional staff.
Table 1 Percentage actual vs. planned beneficiaries reached under activity 1, SFHNE, 2006-
2008
Children 2-5 yrs % Children 6-24 months % Pregnant/lactating women %
2006 57.1 115.6 150.7
2007 100.3 100.9
2008 100.3 133.8
(SPR‟s 2006 to 2008)
49. The low numbers of children 2-5 years reached in 2006 reflect the slow start-up
period as communities joining the programme who needed time to prepare
infrastructure for the day-care and appoint attendants. The high numbers of
pregnant and lactating women were attributed by all stakeholders to
underestimations at the planning stage.
Table 2 Percentage of SFHNE actual vs. planned commodities delivered 2006-2008
CSB % Rice % Oil % iodized salt % Sugar % Maize meal %
2006 71.2 25.3 56.5 63.3 35 86.7
2007 24.2 n.a. see note 96.6 n.a. see note 77.1 49.8
2008 88.9 17.9 70.4 63.5 31.3 43.1
n.b. in 2007: 630 mt rice and 67mt iodised salt were distributed though not planned.
50. In 2006 commodity shortfalls amounted to 37.4 per cent; 31 per cent in 2007;
and 30 per cent in 2008. These have largely been attributed to inadequate funding
during the first 3 years of the CP (see Section 4). Interviews with nutrition centre
staff revealed that there were a variety of methods for dealing with insufficient
commodities or too many beneficiaries at programme sites. For take-home rations
either the monthly quantity was divided between all mothers attending or the entire
3 month supply was distributed in one month to ensure that all attendees received
the stipulated quantity for that month. From the data presented here and discussions
with communities it is clear that beneficiaries did not regularly receive the planned
ration on a timely basis, but a reduced amount in both quantity and quality59. This is
particularly true for take-home rations for pregnant and lactating women and
children under-2 as on-site feeding is prioritized. Shortfalls in commodities for on-
site feeding were also supplemented by community efforts in the majority of sites
while THR were not.
59This was partly a result of underestimation of the number of mothers who would attend on THR days.

14
51. Additionally all sites visited stated that take-home rations for pregnant and
lactating women and children 6-24 months were distributed monthly throughout the
year (subject to pipeline flows) and not only during the lean season, which is a
deviation from the CP design and cannot be adequately met by available supplies.
Children aged 2-5 years in CHNCs were provided with 2 cooked meals daily in all
sites visited, a breakfast porridge and a rice or Corn-Soya Blend (CSB) based lunch,
although the intention of the supplement was to provide 1 meal. The shortfall of CSB
in 2007 is of major concern as this commodity provides the micronutrients and
protein necessary to supplement the quality of the diet of the beneficiaries.
52. In all the sites visited in Kassena Nankana, Upper East region, CSB was found to
be infested with weevils. There have been complaints from district officers and
community members about the poor quality of food provided by WFP Ghana.
Observations at the nutrition centres confirmed these complaints from children, their
siblings, community members/teachers and district officials. Some of the children
could not eat the corn soya blend particularly when water and sugar were added.
Discussions with key community and district stakeholders revealed that there are
obstacles at all stages of the supply chain which resulted in inefficient storage and
delivery of commodities. These relate both to financial constraints as well as to GHS
and District Assembly (DA) commitment and capacity to manage the supply chain
effectively and are explored further under Outcome 3 in section 3B. The findings
above reveal that intended rations are being reduced, both in quantity and quality,
due to a combination of factors, explored in Section 4.
Support to Basic Education (SBE) Activity 2 outputs
53. SBE was aimed at ―improving attendance and completion rates among children in
kindergarten and primary school, and girls at Junior High School (JHS)‖ (WFP/SPR
2007). Outputs under activity 2 (SBE) included take-home food rations for girls and
school feeding to encourage retention and completion especially among girls across
the three northern regions of Ghana. Girls achieving 85 per cent attendance at upper
primary and JHS in 308 schools were targeted in 2005 of the CP.
54. According to WFP SPR report for 2006, there was a shortfall overall of the total
target number of beneficiaries for support in basic education including THR and
school feeding beneficiaries of 18.8 per cent). However, the number of girls receiving
take-home ration exceeded the target (100.6 per cent) for the planned activity. WFP
also moved its assistance from the lower grade levels (P1 to P3) to higher grades,
increasing the number of schools covered to 804 schools and adding 26,000 new
beneficiaries60. The failure to meet targeted beneficiaries overall was attributed to
delays with procurement from local producers and delay‘s in signing the
Memorandum of Understanding with the Ghana School Feeding Programme (GSFP).
55. The targeted number of THR supported schooled were planned for 770 of which
WFP was able to reach over 804 schools under the programme in 2006. Number of
farmers groups supported through local procurement was planned at 607 groups
WFP was able to reach 800 farmers groups in its local procurement programme in
2006.
56. In 2007 and 2008 WFP exceeded the total targeted number of beneficiaries by
15.4 per cent and 38.8 per cent respectively. This was achieved through enhanced
60The move to phase out of the lower grades of P1 to P3 was part of the phase out strategy to ensure that a cohort of girls at upper primary levels was supported at the most vulnerable age grades in achieving completion and transition rates to JSS levels of education.

15
collaboration with the GSFP in 2006/07 which led to the launching of school feeding
in 79 schools in Northern Ghana enabling WFP to feed more children in kindergarten
and primary level than planned. There was also an increase in the targeted number
of children receiving take-home ration as a result of increased enrolment stimulated
by the GSFP and other factors such as the capitation grant programme which was
given to all schools. There was also increasing emphasis by other development
actors on improving gender parity particularly through NGO programmes in the
north. The number of schools involved in the THR programme in 2007 remained at
804 schools. The number of farmers groups supported through local procurement
rose dramatically to 2,087 groups exceeding the target figure of 1,500.
57. The total actual beneficiaries covered by WFP support to basic education (THR,
and School feeding) increased between 2006 and 2008 from 42,232 to 249,848
beneficiaries61. WFP covered more beneficiaries than planned in 2007 and 2008. The
strategy of gradually phasing out of the Take Home Ration (THR) meant that as the
cohort of girls moved to higher levels of education in the target schools new girls
already enrolled at the lower grade levels would not be added to the THR
programme.
58. Price increases in 2007 and 2008 resulted in a reduction in the quantity of food
procured locally by WFP Ghana as budgetary provision had been made before the
price increases occurred. Thus in 2007 the quantity of food ration was reduced due
to growing numbers of beneficiaries coupled with dwindling quantities of WFP food
available. The severity of the challenge was apparent in 2008 when WFP was only
able to support the take-home ration activity for two out of the three academic
terms. It also affected school feeding operations in which only 41,324 children were
reached instead of the planned 50,000 children representing a shortfall of 17.4 per
cent. Table 3 below outlines the main performance indicators for support to Basic
Education from 2006-2008.
Table 3 2008 SPR output data on beneficiaries
59. Interviews with children across several JSS schools indicated that they were not
aware of the amount of Take Home Ration which was to be given. The students
interviewed described the quantities of maize and oil per student which were far
61Adults are included in the beneficiary number based on the fact that the THR programme supports household supplementary feeding of 2 adults and 2 extra children in the household. The figures for under five are children in the school feeding program at KG level. The figures for children between 5 and 18 include beneficiaries in the THR and the school feeding programme.
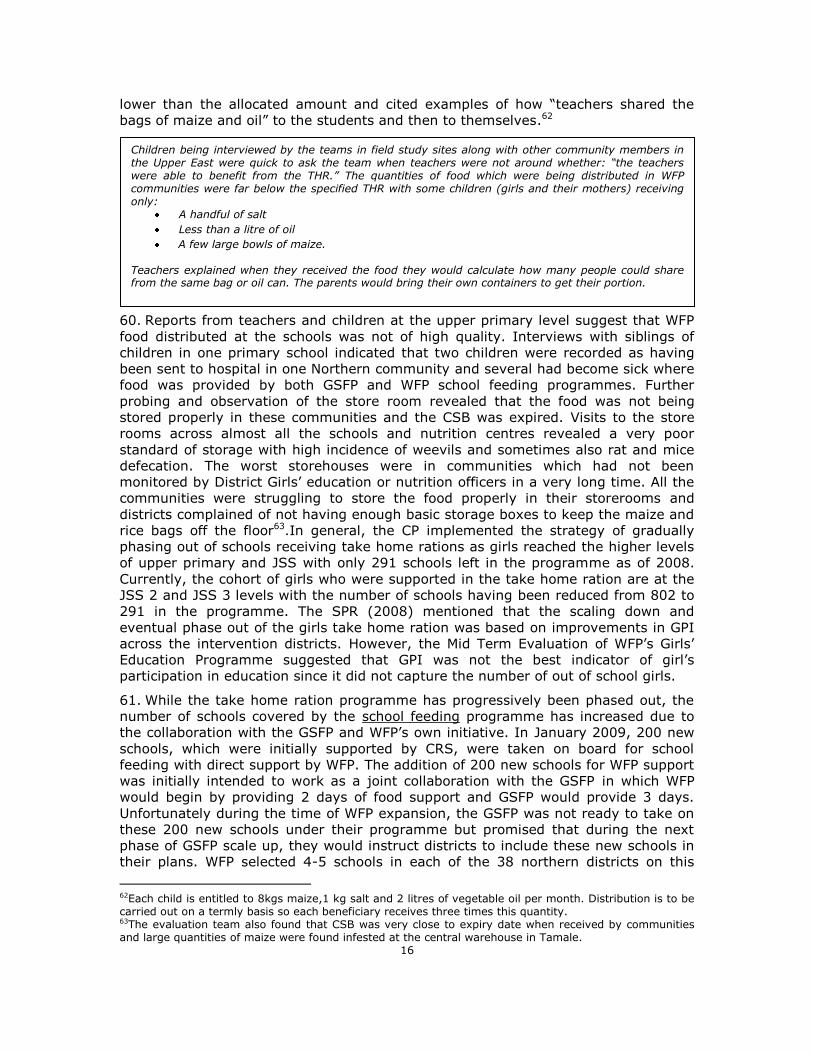
16
lower than the allocated amount and cited examples of how ―teachers shared the
bags of maize and oil‖ to the students and then to themselves.62
60. Reports from teachers and children at the upper primary level suggest that WFP
food distributed at the schools was not of high quality. Interviews with siblings of
children in one primary school indicated that two children were recorded as having
been sent to hospital in one Northern community and several had become sick where
food was provided by both GSFP and WFP school feeding programmes. Further
probing and observation of the store room revealed that the food was not being
stored properly in these communities and the CSB was expired. Visits to the store
rooms across almost all the schools and nutrition centres revealed a very poor
standard of storage with high incidence of weevils and sometimes also rat and mice
defecation. The worst storehouses were in communities which had not been
monitored by District Girls‘ education or nutrition officers in a very long time. All the
communities were struggling to store the food properly in their storerooms and
districts complained of not having enough basic storage boxes to keep the maize and
rice bags off the floor63.In general, the CP implemented the strategy of gradually
phasing out of schools receiving take home rations as girls reached the higher levels
of upper primary and JSS with only 291 schools left in the programme as of 2008.
Currently, the cohort of girls who were supported in the take home ration are at the
JSS 2 and JSS 3 levels with the number of schools having been reduced from 802 to
291 in the programme. The SPR (2008) mentioned that the scaling down and
eventual phase out of the girls take home ration was based on improvements in GPI
across the intervention districts. However, the Mid Term Evaluation of WFP‘s Girls‘
Education Programme suggested that GPI was not the best indicator of girl‘s
participation in education since it did not capture the number of out of school girls.
61. While the take home ration programme has progressively been phased out, the
number of schools covered by the school feeding programme has increased due to
the collaboration with the GSFP and WFP‘s own initiative. In January 2009, 200 new
schools, which were initially supported by CRS, were taken on board for school
feeding with direct support by WFP. The addition of 200 new schools for WFP support
was initially intended to work as a joint collaboration with the GSFP in which WFP
would begin by providing 2 days of food support and GSFP would provide 3 days.
Unfortunately during the time of WFP expansion, the GSFP was not ready to take on
these 200 new schools under their programme but promised that during the next
phase of GSFP scale up, they would instruct districts to include these new schools in
their plans. WFP selected 4-5 schools in each of the 38 northern districts on this
62Each child is entitled to 8kgs maize,1 kg salt and 2 litres of vegetable oil per month. Distribution is to be carried out on a termly basis so each beneficiary receives three times this quantity. 63The evaluation team also found that CSB was very close to expiry date when received by communities and large quantities of maize were found infested at the central warehouse in Tamale.
Children being interviewed by the teams in field study sites along with other community members in the Upper East were quick to ask the team when teachers were not around whether: “the teachers were able to benefit from the THR.” The quantities of food which were being distributed in WFP communities were far below the specified THR with some children (girls and their mothers) receiving only:
A handful of salt
Less than a litre of oil
A few large bowls of maize.
Teachers explained when they received the food they would calculate how many people could share from the same bag or oil can. The parents would bring their own containers to get their portion.
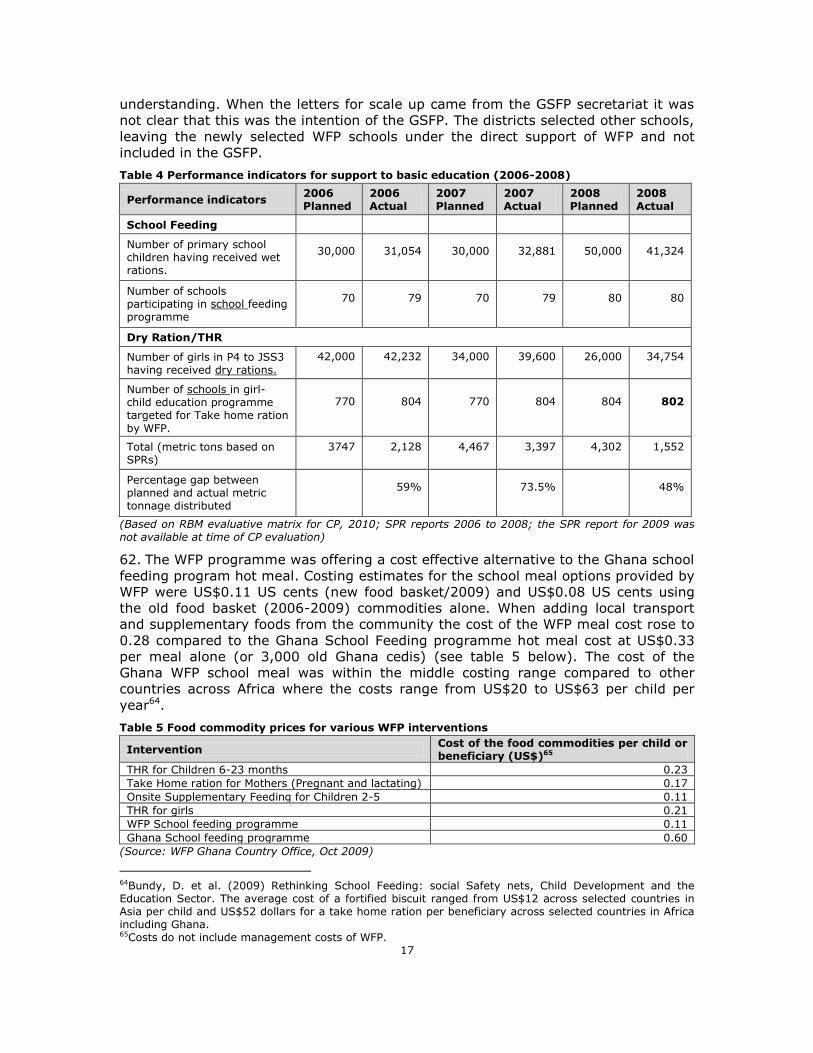
17
understanding. When the letters for scale up came from the GSFP secretariat it was
not clear that this was the intention of the GSFP. The districts selected other schools,
leaving the newly selected WFP schools under the direct support of WFP and not
included in the GSFP.
Table 4 Performance indicators for support to basic education (2006-2008)
Performance indicators 2006 Planned
2006 Actual
2007 Planned
2007 Actual
2008 Planned
2008 Actual
School Feeding
Number of primary school children having received wet rations.
30,000 31,054 30,000 32,881 50,000 41,324
Number of schools participating in school feeding programme
70 79 70 79 80 80
Dry Ration/THR
Number of girls in P4 to JSS3 having received dry rations.
42,000 42,232 34,000 39,600 26,000 34,754
Number of schools in girl-child education programme targeted for Take home ration
by WFP.
770 804 770 804 804 802
Total (metric tons based on SPRs)
3747 2,128 4,467 3,397 4,302 1,552
Percentage gap between planned and actual metric tonnage distributed
59% 73.5% 48%
(Based on RBM evaluative matrix for CP, 2010; SPR reports 2006 to 2008; the SPR report for 2009 was not available at time of CP evaluation)
62. The WFP programme was offering a cost effective alternative to the Ghana school
feeding program hot meal. Costing estimates for the school meal options provided by
WFP were US$0.11 US cents (new food basket/2009) and US$0.08 US cents using
the old food basket (2006-2009) commodities alone. When adding local transport
and supplementary foods from the community the cost of the WFP meal cost rose to
0.28 compared to the Ghana School Feeding programme hot meal cost at US$0.33
per meal alone (or 3,000 old Ghana cedis) (see table 5 below). The cost of the
Ghana WFP school meal was within the middle costing range compared to other
countries across Africa where the costs range from US$20 to US$63 per child per
year64.
Table 5 Food commodity prices for various WFP interventions
Intervention Cost of the food commodities per child or beneficiary (US$)65
THR for Children 6-23 months 0.23
Take Home ration for Mothers (Pregnant and lactating) 0.17
Onsite Supplementary Feeding for Children 2-5 0.11
THR for girls 0.21
WFP School feeding programme 0.11
Ghana School feeding programme 0.60
(Source: WFP Ghana Country Office, Oct 2009)
64Bundy, D. et al. (2009) Rethinking School Feeding: social Safety nets, Child Development and the Education Sector. The average cost of a fortified biscuit ranged from US$12 across selected countries in Asia per child and US$52 dollars for a take home ration per beneficiary across selected countries in Africa including Ghana. 65Costs do not include management costs of WFP.

18
63. Food commodity prices for the supply of various WFP interventions including
school feeding and THR were estimated by the WFP Ghana office in 2009.
64. Table 6 compares the costs of feeding per child across CRS, Ghana School
Feeding Programme and WFP schools. WFP conducted technical studies to
demonstrate locally grown foods which could be used for a ―local menu‖ with options
ranging from US$20 to US$57 per child depending on the menu.66 Studies by the
Berkley Group and more recently by the Boston Consulting Group corroborate these
findings and add the other costs associates with providing one hot meal for children
and found that costs per child were significantly cheaper if using the WFP school
meal plan. The Berkeley group found that if the government had used the WFP
basket they would have saved 22 per cent of the overall cost of feeding from 2007 to
2010.67
Table 6 Programme comparison of costs to implement school meal per child CRS GSFP WFP
Food procurement (per child per
lunch)
Raw Materials Cost (food) 0.15 0.29 0.08
Supplemental Food - - 0.21
International Shipping (to Ghana) 0.038 - -
Port warehouse cost - - -
Domestic transportation 0.027 - Included in raw material cost
Local warehouse cost - nm -
Local transportation - nm -
Subtotal 0.22 0.29 0.28
Ongoing cost (per child per lunch)
Liquid soap - - -
Fuel - 0.018 -
School cook salary - 0.013 -
Subtotal - 0.031 -
Total lunch cost per child 0.22 0.33 0.28
Outputs related to outcome 3 (improved national capacity):
65. Intended outputs for improved national capacity for SFHNE included building the
capacity of Government to eventually take over the nutrition centres and
supplementary feeding programs. Performance indicators included the extent of local
contributions to the activities. Overall, SPR‘s and other reports gave very little
information related to Outcome 3. However, the evaluation team found the following.
66. In 2006, 49 GHS staff were trained in a Training of Trainers workshop on growth
monitoring and 378 community members (volunteers), centre attendants and health
workers were trained in growth monitoring and promotion by UNICEF and WFP. GHS
has managed to continue regular trainings of nutrition attendants in operation of
centres, preparation of CSB, hygiene and weighing of children, with the majority of
attendants having received training within the last year. WFP has continued to
provide training and technical support to GHS staff on an ad hoc basis throughout
66See ―Models for Designing Implementing and Targeting School feeding programs in Ghana‖ by Massing, Asumoa and Haruna (2006) 67―Financial and Monitoring Assessment of the Ghana School Feeding Program (June 2007) by Anita Liu, John Bruno and Leland Hedges (UC Berkeley School of Business).

19
the programme, particularly on monitoring and reporting. There were also annual
training for storekeepers, as well as joint quarterly stocktaking exercises at all
project districts. There is also an annual follow-up baseline conducted by Ghana
Health Service. However, Government counterparts and WFP staff working closely
with communities in the 3 northern regions stated that they were insufficiently
consulted during the programme design and start up phase which resulted in lack of
ownership and commitment of counterparts at District and community level related
to CP activities.
67. Target communities‘ involvement in the contribution of food for activity 1 was
mixed depending on the capacity and level of community organization. There was a
high level of community involvement in providing volunteer staff at nutrition centres,
cooks and attendants to assist at these centres. Community cooks were also
provided in WFP led school feeding programmes and sometimes in communities
where the Ghana school feeding programme was operating. Communities who had
been trained by CRS in operating school feeding appeared stronger in providing
support to the SFHNE and SBE activities; this is particularly due to the high degree of
training that community food committees and head teachers received over the life of
the CRS project. Very little training was identified across the WFP communities/
schools visited and in interviews with school management committees and nutrition
centre committee members operating the activity 2 and activity 1 programmes. At
district level a training of trainers‘ workshop was carried out for teachers, and cooks
on hygiene, food storage and record keeping, as well as CSB handling and
preparation. WFP training appeared to target mainly the same key district level
stakeholders in warehouse management, reporting and more recently the new food
basket.
68. The Activity 2 coordinators for the Support to Basic Education programme
appeared to have carried out adequate monitoring and support for the Take Home
Ration in areas where the Girls‘ Education Officers saw the programme could make a
substantive difference to girls‘ enrolment and retention rates. These same officers
have begun supporting the WFP/ MINISTRY OF EDUCATION School feeding
programme. The SFHNE coordinators were much less resourced and supported by
the Government to ensure the effective monitoring of WFP activity 1 work compared
to the SBE (activity 2) coordinator. WFP also helped to support the development of
manuals for CSB usage and training, the production of a school feeding activity guide
and facilitated an exposure trip for government to Chile in order to explore models of
HGSF. Despite this technical support, the Ghana central government support was
insufficient to ensure that the CP was adequately coordinated and managed by the
activity coordinators in both programmes so that the WFP CP achieved its goals and
strategies (e.g. proper phase out in some communities).
69. The District Assemblies visited during the field study provided infrastructural
support at the start of the nutrition programme and have budgeted for transport
from the regional warehouse in Tamale to the District but are constantly facing
constraints with timely funding from central government. This has contributed to the
lapse in transporting food to the districts from the central warehouse and sometimes
pipeline breakages in the distribution of activity 1 and activity 2 food supplies.
Movement of the food from the district assembly to the communities is carried out by
GHS staff on their routine visits or by communities themselves. Movement of food
from the regional warehouse to the communities for activity 2 depends on
contractors hired by the Ghana Education Service (central level). This relies on
effective communication and travel preparations in order to move the food on a

20
timely basis, both of which are frequently tenuous. See section 5A on efficiency and
effectiveness on a detailed discussion on the lapses and pipeline breakages.
Outputs related to outcome 4 (increased demand for domestic farm
produce):
70. The performance indicators for Outcome 4 in the CP logical framework are the
tonnage of food procured locally by WFP and by contracted suppliers and also
produce sales by local farmers‘ groups to the local procurement initiative. The CP
Results matrix for 2006-2010 indicates that the tonnage and monetary value of food
commodities procured locally by WFP increased steadily from 5,315.0 mt (valued at
US$1,784,543) in 2006, to 5,433.73 mt (valued at UD$1,919,984) in 2007, and
10,828.0mt (valued at US$7,093,493) in 2008. Data from the Standard Project
Reports (SPR) corroborates this trend: in 2007 and 2008, 68 and 77 percent,
respectively, of the food for the project was procured locally68.
71. This gave increased visibility to WFP as a contributor to the capacity building and
income of local farmers. SPR‘s also state that local procurement also enhanced
working relationships with the relevant government agencies and private sector
particularly. According to the Public Relations office in WFP Ghana ―it improved and
enhanced WFP‘s image in Ghana.‖ However, rising food commodity prices and limited
capacity of the farmers for production restricted the quantities purchased. Local
suppliers purchased maize, vegetable oil and soybeans from 2,082 farmers and five
out-growers, which had the added benefit of increasing their income. Small tenders
of 50mt each were floated to support individual farmers and farmers‘ groups. Local
procurement of fortified commodities was delayed as a result of problems in quality
control. WFP provided suppliers with technical assistance to address this situation but
more could have been done such as broadening the base of potential suppliers and
providing more training on fortification and quality control.
72. Percentage of food procured by contracted processors from small farmers‟
associations: Over the 2006-2008 period, the number of farmers/farmers‘ groups
reported to be supported through local purchase increased from 800 in 2006, to
2,087 in 2007, but decreased substantially to 279 in 2008. These figures are based
on information provided by the WFP Ghana Procurement Officer responsible for local
procurement; he explained that often local traders provide estimates of the number
of farmers groups they have worked with in order to procure the food locally. WFP
has not been able to verify these figures, nor at what price the farmers receive from
the traders.
73. The reason for the decrease in estimated numbers of farmers groups reached in
2008/09 is partly a result of less food being purchased locally due to high food prices
in Ghana (see table 7 below). Maize, oil and corn soya blend could no longer be
purchased at competitive prices within Ghana, due to rises of 3 times the
international price which resulted in WFP turning back to international procurement.
Available data based on field visits from the evaluation team reveal that the
percentage of food procured by caterers, school management committees and
contracted processors from small farmers‘ associations in GSFP/WFP schools in
northern Ghana is about five per cent in urban areas but can rise to about 50 per
cent in rural localities. Local farmers supply mainly vegetables and condiments that
cover only a small percentage of the food requirements of WFP schools (five per
cent).
68This is food grown in Ghana but not necessarily in the same region where the program is focussed, often procured by local traders.
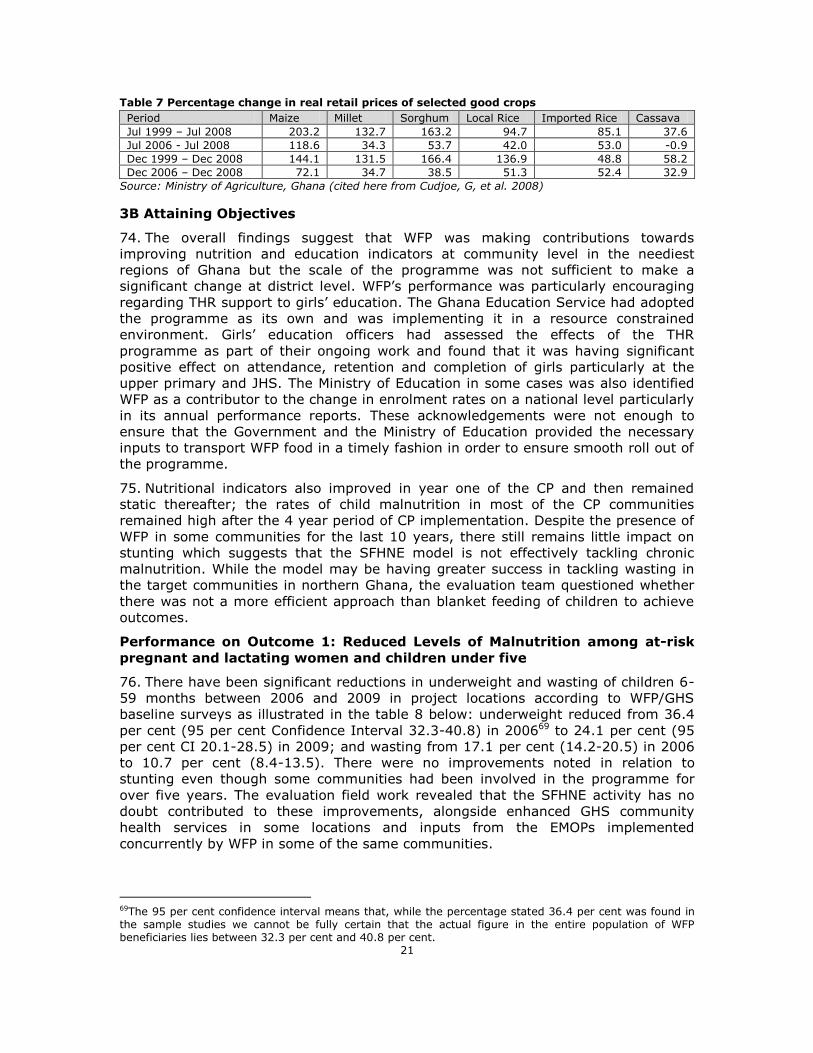
21
Table 7 Percentage change in real retail prices of selected good crops
Period Maize Millet Sorghum Local Rice Imported Rice Cassava
Jul 1999 – Jul 2008 203.2 132.7 163.2 94.7 85.1 37.6
Jul 2006 - Jul 2008 118.6 34.3 53.7 42.0 53.0 -0.9
Dec 1999 – Dec 2008 144.1 131.5 166.4 136.9 48.8 58.2
Dec 2006 – Dec 2008 72.1 34.7 38.5 51.3 52.4 32.9
Source: Ministry of Agriculture, Ghana (cited here from Cudjoe, G, et al. 2008)
3B Attaining Objectives
74. The overall findings suggest that WFP was making contributions towards
improving nutrition and education indicators at community level in the neediest
regions of Ghana but the scale of the programme was not sufficient to make a
significant change at district level. WFP‘s performance was particularly encouraging
regarding THR support to girls‘ education. The Ghana Education Service had adopted
the programme as its own and was implementing it in a resource constrained
environment. Girls‘ education officers had assessed the effects of the THR
programme as part of their ongoing work and found that it was having significant
positive effect on attendance, retention and completion of girls particularly at the
upper primary and JHS. The Ministry of Education in some cases was also identified
WFP as a contributor to the change in enrolment rates on a national level particularly
in its annual performance reports. These acknowledgements were not enough to
ensure that the Government and the Ministry of Education provided the necessary
inputs to transport WFP food in a timely fashion in order to ensure smooth roll out of
the programme.
75. Nutritional indicators also improved in year one of the CP and then remained
static thereafter; the rates of child malnutrition in most of the CP communities
remained high after the 4 year period of CP implementation. Despite the presence of
WFP in some communities for the last 10 years, there still remains little impact on
stunting which suggests that the SFHNE model is not effectively tackling chronic
malnutrition. While the model may be having greater success in tackling wasting in
the target communities in northern Ghana, the evaluation team questioned whether
there was not a more efficient approach than blanket feeding of children to achieve
outcomes.
Performance on Outcome 1: Reduced Levels of Malnutrition among at-risk
pregnant and lactating women and children under five
76. There have been significant reductions in underweight and wasting of children 6-
59 months between 2006 and 2009 in project locations according to WFP/GHS
baseline surveys as illustrated in the table 8 below: underweight reduced from 36.4
per cent (95 per cent Confidence Interval 32.3-40.8) in 200669 to 24.1 per cent (95
per cent CI 20.1-28.5) in 2009; and wasting from 17.1 per cent (14.2-20.5) in 2006
to 10.7 per cent (8.4-13.5). There were no improvements noted in relation to
stunting even though some communities had been involved in the programme for
over five years. The evaluation field work revealed that the SFHNE activity has no
doubt contributed to these improvements, alongside enhanced GHS community
health services in some locations and inputs from the EMOPs implemented
concurrently by WFP in some of the same communities.
69The 95 per cent confidence interval means that, while the percentage stated 36.4 per cent was found in the sample studies we cannot be fully certain that the actual figure in the entire population of WFP beneficiaries lies between 32.3 per cent and 40.8 per cent.

22
Table 8 Outcome data on nutritional indicators for activity 1 SFHNE, 2006-2009
Outcome Baseline survey 2006
Follow up survey 2007
Follow up survey 2008
Follow up survey 2009
Latest National Average (2009)
% low Body Mass Index among non-pregnant women (<18.5)
12.0 8.8 10.9 10.1 8.3%
(7.2-9.5)
Children 6-59 months
% chronic malnutrition (stunting) (height/age <-2z),
27.4
(23.9-31.4)
36.5
(33.4-39.6)
30.8
(26.1-35.0)
26.1
(21.7-30.9)
22.1%
(20.2-24.1)
% underweight (weight/age <-2z),
36.4
(32.3-40.8)
21.6
(19.0-24.3)
16.3
(12.6-19.9)
24.1
(20.1-28.5)
11.6%
(10.1-13.2)
% wasting (weight/height <-2z),
17.1
(14.2-20.5)
11.4
(9.4-13.5)
9.9
(6.9-12.9)
10.7
(8.4-13.5)
7.1%
(5.9-8.5)
(Sources: Latest national average figures are from WFP‟s CFSVA 2009)
77. A decrease in underweight is consistent with the national trend in Ghana, while a
decrease in levels of acute malnutrition (wasting) is exceptionally good in relation to
national trends. Nevertheless, the overall rates continue to remain above the
national averages for Ghana, although confidence intervals for stunting and wasting
overlap with those for the national data found in the CFSVA and may not be
statistically significantly higher. The criteria used by WHO and WFP to define a
serious situation are 10 per cent for wasting, 30 per cent for stunting and 20 per
cent for underweight, revealing that while improvements have been made some
challenges remain to bring, particularly the chronic situation, firmly under control70.
78. Over the time period of the CP, mortality rates for both children under five and
infants appear to have reduced at the national level, though these have not been
measured in programme communities and are not a CP indicator they do give us a
sense of the nutrition context. While an improvement in rates in the health and
nutrition of infants could reflect advances in maternal and child health care and
improved quality of living, the Ghana Demographic and Health Survey (GDHS) 2008
urges caution in interpretation of the data since under-reporting of infant and child
deaths is common and it is therefore a difficult indicator to measure using mothers‘
recall as is employed for Demographic and Health Survey (DHS) reports.
79. No significant differences have been seen in malnutrition rates by gender. In all
years malnutrition rates were highest in the 12-23 month age group, with stunting at
34.3 per cent in this group in 2009, which falls into WFP‘s category of a ‗serious
situation‘ (>30 per cent). This suggests limitations of the activity to address health
and nutrition of this vulnerable group and prevent stunting. The inadequacies in the
outputs of the take-home ration, as discussed above, have no doubt played a
significant role. Table 9 above also reveals little impact on women‘s Body Mass Index
(BMI) between 2006 and 2009 in the programme communities. Weight gain of
pregnant women was not captured by the baseline and follow up studies but data
from quarterly reporting reveals little change in percentage of women gaining more
70References: WFP/CDC (2005) A Manual: measuring interpreting malnutrition and mortality. WHO (2000) The Management of Malnutrition in Major Emergencies.
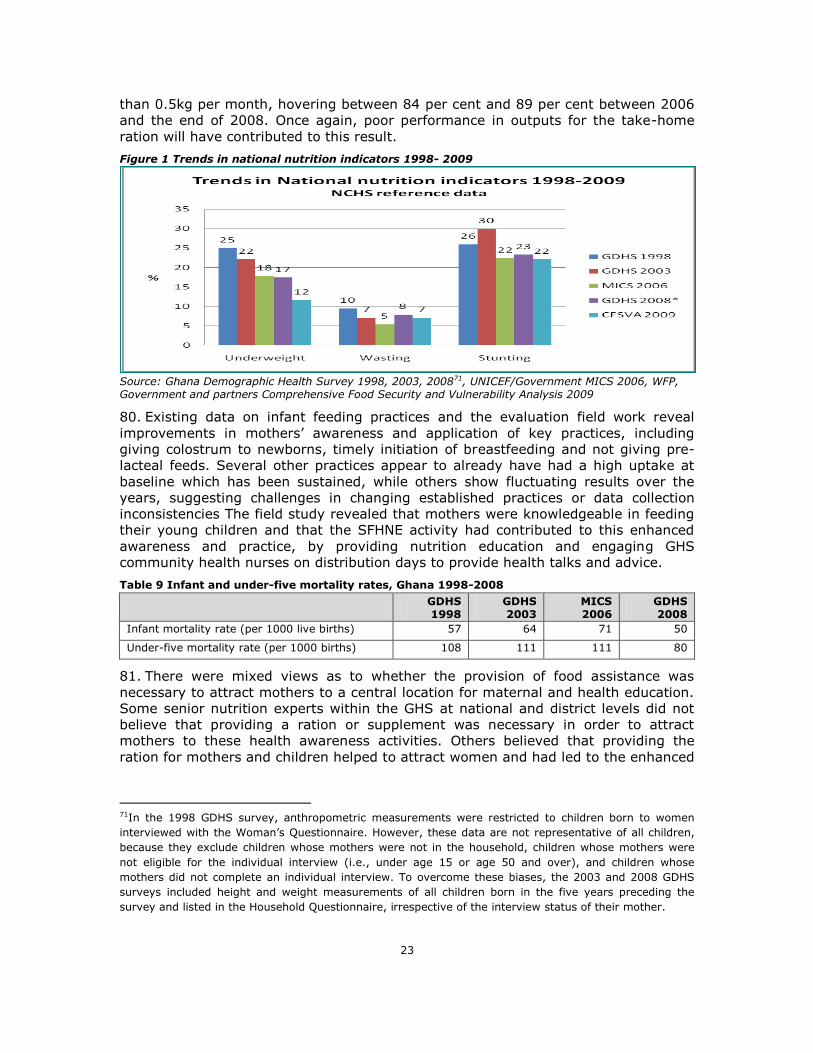
23
than 0.5kg per month, hovering between 84 per cent and 89 per cent between 2006
and the end of 2008. Once again, poor performance in outputs for the take-home
ration will have contributed to this result.
Figure 1 Trends in national nutrition indicators 1998- 2009
Source: Ghana Demographic Health Survey 1998, 2003, 200871, UNICEF/Government MICS 2006, WFP, Government and partners Comprehensive Food Security and Vulnerability Analysis 2009
80. Existing data on infant feeding practices and the evaluation field work reveal
improvements in mothers‘ awareness and application of key practices, including
giving colostrum to newborns, timely initiation of breastfeeding and not giving pre-
lacteal feeds. Several other practices appear to already have had a high uptake at
baseline which has been sustained, while others show fluctuating results over the
years, suggesting challenges in changing established practices or data collection
inconsistencies The field study revealed that mothers were knowledgeable in feeding
their young children and that the SFHNE activity had contributed to this enhanced
awareness and practice, by providing nutrition education and engaging GHS
community health nurses on distribution days to provide health talks and advice.
Table 9 Infant and under-five mortality rates, Ghana 1998-2008
GDHS 1998
GDHS 2003
MICS 2006
GDHS 2008
Infant mortality rate (per 1000 live births) 57 64 71 50
Under-five mortality rate (per 1000 births) 108 111 111 80
81. There were mixed views as to whether the provision of food assistance was
necessary to attract mothers to a central location for maternal and health education.
Some senior nutrition experts within the GHS at national and district levels did not
believe that providing a ration or supplement was necessary in order to attract
mothers to these health awareness activities. Others believed that providing the
ration for mothers and children helped to attract women and had led to the enhanced
71In the 1998 GDHS survey, anthropometric measurements were restricted to children born to women
interviewed with the Woman‘s Questionnaire. However, these data are not representative of all children,
because they exclude children whose mothers were not in the household, children whose mothers were
not eligible for the individual interview (i.e., under age 15 or age 50 and over), and children whose
mothers did not complete an individual interview. To overcome these biases, the 2003 and 2008 GDHS
surveys included height and weight measurements of all children born in the five years preceding the
survey and listed in the Household Questionnaire, irrespective of the interview status of their mother.

24
understanding of health education so they now attend whether or not there is food
distributed.
Table 10 Uptake by mothers of key infant feeding practices (target 100%)
Indicator Description/Definition Baseline
2006 2007
n (%) 2008
n (%) 2009
n (%)
Initiation of
Breastfeeding
Proportion of children 0-<12 months
who were breastfed within the first
hour of birth
150
(23%)
138
(15.1%)
304
(80.9%)
244
(78.7%)
Exclusive Breastfeeding
rate
Proportion of infants less than 6
months who were fed breast milk
only in the preceding 24 hours
849
(78.9%)
222
(36.8%)
28
(53.8%)
children
<4
months
116
(83.5%)
Continued
Breastfeeding rate (2
years)
Proportion of children aged 20-23
months who are still breastfeeding
1019
(96.5%)
of
mothers
breastfee
ding for 2
years or
more
863
(94.1%) of
mothers
breastfeedi
ng for 2
years or
more
19
(65.5%)
49
(98.0%)
Timely Complementary
Feeding Rate
Proportion of infants aged 6-9
months who received breast milk
and solid foods in the preceding 24
hours
70
(89.7%)
84
(98.8%)
Giving colostrums to
newborns
802
(74.7%)
793
(86.4%)
650
(96.1%)
757
(85.2%) Not giving pre-lacteals
to child before initiating
breastfeeding
909
(85.5%)
840
(91.6%)
692
(96.1%)
856
(97.6%)
Giving food (including
breast milk) to children
with diarrhoea
1002
(93.2%)
862
(94%)
673
(93.7%)
845
(94.5%)
Adapted from Supplementary Feeding, Health and Nutrition Education Programme Report on Follow Up Baseline Survey – 2009, WFP/GHS, Nov 2009
82. The data on positive public health indicators reveals significant improvement in
mothers‘ uptake of key public health interventions such as the use of Insecticide
Treated Bed Nets (ITNs), and immunization of children against measles and TB,
suggesting improved attendance for primary health care and/or improved outreach
of community health services. In some sites the distribution of supplementary food
to beneficiaries was contingent upon children visiting the CHN for vaccination;
however this practice was not consistent across all programme sites. It is therefore
likely that the SFHNE activity contributed to enhanced uptake of immunizations and
access to primary health care, although it is important to note that complementary
activities were conducted by GHS and UNICEF over the time period to enhance
immunization coverage, including outreach campaigns. (See annex 12) for coverage
of key public health interventions from 2006 to 2009).
83. At community level, the day-care for children 2-5 years was prioritized and
valued more highly than take-home ration for pregnant and lactating women and
children under-2. The most frequently cited benefits of the programme were the
provision of childcare so that mothers could engage more fully in economic activities
in the knowledge that their child would be cared for and fed. The enhanced
nutritional and health status of their children was also noted by the community, as
well as the value of preparing children for primary school. The food provided at the
day-care was replacing rather than supplementing the child‘s diet in the post-harvest
season, though it may ensure a supplementary meal during the lean period.

25
84. The plan to ―progressively hand over‖ to the Government and eventual phase out
of WFP from beneficiary communities from 2008 has not yet been realized partly due
to the fact that the WFP country office has not been able to implement the Income
Generating Activities and sustainability strategy in these communities.72 No
communities have been phased out of the activity 1 since a few months before the
CP began in 2006. There was very limited WFP staff time devoted to ensure that
there was take up by local government authorities such as the Ministry of Health, DA
and the engagement of NGOs and donors to support IGAs for community
sustainability. More work was also needed to ensure the envisioned NGO
partnerships were supported to facilitate community self help efforts and women‘s
group IGA‘s. However, there are some successes from the 2006 phase-outs where
strong community organization and commitment has ensured continuation of the
day-care feeding activity through community food contributions, combined with the
establishment of an IGA, such as milling, supported initially by input from WFP and
NGO technical expertise, or a well-established farmers group. This suggests that
phase-out of more communities is viable provided there is enhanced input from WFP
and partners with in-depth consultations and community identification to prepare for
phase out.
85. One significant achievement in 2009 was the support for 42 communities which
benefited from the milling, fortification and salt iodization and re-bagging activities.
These initiatives demonstrated a commitment by the Ghana CO towards finding ways
of sustaining programme outcomes in the communities where WFP is active and
show signs of assisting communities when there is a clear hand over strategy for
SFHNE. The findings from the evaluation suggest that where women engaged in the
IGPs, but no longer have children directly benefiting from the SFHNE activities, they
may not support these activities with their profits made over the long term in order
to sustain the nutrition centre activities unless a cooperative approach is adopted.
86. The majority of communities visited stated that they could support the day-care
centres at harvest time through community contributions, but would struggle to do
so during the lean season. Evidence of community food contributions was seen in
storage facilities in several sites. However, there was no community commitment to
continue supporting pregnant, lactating women or children under-2 with take-home
rations. Therefore a sustainability strategy that is appropriate to meet the needs of
this group requires further consideration, particularly with regards to the
continuation of health and nutrition education for new mothers.
Performance on Outcome 2: Improved attendance and completion rates
among school children in basic education (Activity 2)
87. There was little progress made in relation to SBE outcomes in 2006; although
this was the beginning of the CP under review, similar activities were running in the
previous CP. The SPR indicated a slight reduction in enrolment and stable retention
rate between the previous follow up and latest follow up surveys based on the SPR
2006. However, from 2007 to 2008 the SPRs reported there was an increase in
attendance and completion rates particularly among girls, and improvement in the
gender parity index. Evidence from the SPRs shows that head teachers and pupils
see the WFP programme as an important factor contributing to improved enrolment
72In 2008 WFP was supposed to meet 80 per cent of the food requirements (equivalent to 3 days per week) while communities provide 20 per cent. In 2009, WFP was to meet 60 per cent of food requirements while communities provide 40 per cent. In 2010 the communities are to provide 80 per cent while WFP complements with 20 per cent. Between 2008 and 2009, WFP CO has made conscious effort to scale up IGAs.

26
and retention in the school. They also believe the school feeding programme is
improving learning outcomes by making pupils more active in classes (SPR reports).
Interviews/observations across the 12 evaluative communities and interviews with
district education officers, teachers and community and girls/boys themselves reveal
that attendance and retention was much higher for girls in Take home ration schools
and for children in schools which were operating school feeding (this is corroborated
by the SNV study on school feeding). Interviews with teachers and community
members suggest that girls were for the first time transitioning from primary and
junior secondary in some rural communities due to the Take home ration which
proved to be a significant incentive for parents who would normally be responsible
for marrying girls off early73 or encouraging them to engage in income generating
activities in the urban areas.
88. Data from Ministry of Education EMIS indicated an improvement in enrolment
and completion rates in primary and JHSs across the three Northern regions from
2006/07 to 2009/10. While there is an improvement in GPI at JHS level, there was a
slight decline in GPI at primary level in the three northern regions from 2006/07 to
2008/09. The decline in GPI at primary school is a major concern among donors and
government stakeholders particularly given the degree of support towards closing
the gap (e.g. capitation grants, girls‘ education funding etc). This decline may be a
partial result of WFP gradually pulling out of Girls Incentive Rations at the lower
primary and upper primary level during the last six years although we are unable to
be conclusive (see annex 21).74
89. The Education Performance Report 2008 (Ministry of Education) found that in the
years immediately following the implementation of the Ghana School Feeding
Programme (GSFP), enrolment at feeding schools increased by 16 per cent compared
to schools without GSFP (an enrolment change of 1.31 per cent). The same study
found that attendance increased by 15 per cent more in the treatment schools than
the control schools (differences of .84 per cent) and performance in math scores
increased by 4 per cent more than in the control schools although the performance in
English was better in the control schools. The regression analysis suggested that ―if
school feeding is implemented at a school of approximately 260 pupils, enrolment
would increase by about 3 pupils.‖ These differences were not found to be
statistically significant indicating that the difference could be due to external factors
or to random chance rather than the impact of the GSFP (Ministry of Education,
2008)75.
90. The education data from the Ministry of Education also reveals that the three
northern regions are improving in relation to national education indicators including
gross enrolment, completion rates and gender parity index. However, for the national
and MDGs targets to be met, special interventions such as the WFP take home ration
will likely be needed to ensure that gender equity gains are sustained among the
next generation of girls and in order to close the current 10 per cent gaps in access,
completion and gender equality in basic education across the three northern regions
particularly the Northern region. Interviews with girls at the school level at primary
and JSS confirmed that they are determined to complete JSS since they now realize
the importance of schooling, some even spoke of how they had stopped going to
urban areas to sell in order to come back and complete their education once they
73Ghana Demographic Health Survey (2005) Research suggests that girls are often married as early as 14-16 years of age particularly in the northern region. 74The previous CP had supported girls take home rations for the full cycle of primary school. 75Ministry of Education (2008) Education Performance Report
27
were in the THR programme. What remains unknown is the degree to which the next
generation of girls currently in lower primary will sustain the determination and
parental support needed for girls to achieve Junior Secondary School level in these
deprived rural communities of northern Ghana.76
91. District level analysis shows a mixed picture across ‗high intervention‘ and ‗low
intervention‘ districts which had received WFP support for the THR programme77.
Both high and low intervention districts experienced enrolment growth at primary
and JHS levels which was very positive. Trend analysis comparing high and low
intervention districts in the Upper East indicated that low intervention districts (less
than 10 per cent coverage of WFP THR programme) had a better enrolment growth
than high intervention districts (with more than 30 per cent intervention schools)
which might be explained by the numerous and diverse interventions which were
being implemented in districts in northern Ghana78. On the average high intervention
districts in the Upper East such as Builsa and Talensi had a positive enrolment
growth of 3 per cent over the CP period while low intervention districts in the same
region: Bongo and Bawku had an enrolment growth of 4.2 per cent (see annex 13 for
details).
92. District trend analysis in general showed that were was overall improvement in
the Net Enrolment Rate (NER) particularly for girls at primary levels across all the
districts whether high and low intervention and despite the WFP THR‘s gradual phase
out at the primary level. For instance, Bumpurugu Yunyoo (Northern Region) with 40
per cent THR coverage girls‘ NER increased from 69.3 per cent to 99.6 per cent over
2005/06 to 2008/09 period. However, at the JHS level were THR was even more
needed, NER is on the decline in most of the districts (both high and low). In
northern region for instance, Bunpurugu Yunyoo with 50 per cent THR coverage at
the JHS level had it girls‘ NER fell from 30.8 per cent in 2005/06 to 27.4 per cent in
2008/09.
93. District trend analysis also indicates that the districts with low level intervention
at primary levels had a better NER growth rate than high interventions districts. This
high performance of low intervention districts is probably due to other donor support
districts were receiving from state and non state actors. It also may be due to the
limited scale of the WFP SBE interventions (see Section 3C). On the average high
intervention districts (Builsa and Talensi)79 in the Upper East had increasing primary
net enrolment rates from 67.8 per cent (2005) to 74 per cent (2008) registering an
annual growth rate of 2.95 per cent. In low intervention districts in the Upper East,
the average NER was 75.9 per cent rising to 86.8 per cent representing an annual
growth rate of 4.57 per cent (a separate district data annex is available on request).
76An impact study which traces schools /families which were phased out of the THR at primary level two to three years from now will help us to determine the sustained impact of the Girls Take Home Ration programme on the attitudes and behaviour of families and girls who had schools in the program. 77High intervention districts were considered those where the THR had covered over 20-30 per cent of primary schools in the district and over 50 per cent of the schools at the JSS level in the district. Low intervention districts were those with less than 20 per cent coverage of schools at the primary and JSS level. 78It may also be caused by the limited coverage of WFP interventions in any one district. 79Builsa and Talensi Nabdam had relatively high interventions with over 30 schools involved in the THR programme compared to Bawku East and Bongo with less than 10 per cent of Schools involved in the THR programme.

28
Table 11 Education performance indicators for the three northern regions
Performance indicators 2006 2007 2008
Gross enrolment ratio in basic education
(Primary)
National 90.8 95.0 94.9
North 87.4 92.1 93.5
UE 92.1 96.9 94.1
UW 90.5 98.1 100.0
All WFP assisted schools80
N/A Not recorded Not recorded
Net enrolment (primary) WFP assisted project area
64.60 67.80 76.40
GPI in basic education
(Primary)
National 0.96 0.96 0.96
North 0.89 0.88 0.87
UE 1.02 1.00 1.00
UW 1.06 1.05 1.04
All WFP THR schools81 .84 0.85 0.83
Attendance rates
(primary)
National N/A N/A N/A
All WFP THR schools (girls)
Not recorded 76.00 88.00
Boys Not recorded 75.00 90.00
Completion rates in basic education
(Primary)
National 80.4 85.5 88.7
North 71.7 79.4 85.9
UE 70.7 78.9 85.1
UW 70.6 78.8 87.9
All WFP assisted schools
Not recorded Not recorded Not recorded
Completion rate for Girls enrolled in WFP schools at primary level
64.6 67.8 76.4
Gross enrolment ratio in basic education (JHS)
National 74.8 78.8 80.6
North 59.0 66.4 67.4
UE 57.7 63.1 67.8
UW 65.2 72.7 77.9
GPI in basic education (JHS)
National 0.91 0.92 0.92
North 0.8 0.80 0.82
UE 1.06 1.11 1.09
UW 1.04 1.06 1.08
Completion rates in basic education (JHS)
National 62.8 67.7 88.7
North 46.8 55.4 85.9
UE 45.3 51.8 85.1
UW 49.9 55.7 87.9
(Source: 2006, 2007 and 2008 Ministry of Education EMIS data)
Other key regional education data on change in enrolment, gender parity and gender
specific completion rates are available in Annex 13.
94. Completion rates for girls over the three year period (2006/07-2008/09)
improved moving from 64.6 per cent completion at primary to 76.3 per cent
following the general trend in the population of girls in northern Ghana (see table 11
above) and based on the SPR reports. Data from the Ministry of Education‘s Ghana
Education Service (GES) indicates that retention and transition rates from P6 to JSS1
were not as positive across many of the districts in the three northern regions.
80Source: SPR 2008 81Source: SPR 2008

29
Findings from district trend analysis on retention indicate that retention is lower at
primary levels compared to the JHS for girls in northern Ghana indicating that once
girls transition to the higher levels of JHS 1 to JHS 3 they are determined to
complete basic education. This was substantiated in many of our interviews with Girls
benefiting from the THR at JHS levels. While average retention rate was 59.6 per
cent at the primary, at JH it was as high as 85 per cent. This may be as result of the
phasing out of the THR ration at the primary level and also based on other factors to
do with the larger number of girls at the primary level compared to the JHS level.
With respect to the comparison of districts with higher and lower levels of
intervention there did not seem to be any direct correlation between the level of
intervention and the retention rates.
95. School level analysis also presented a mixed picture of results when comparing
enrolment rates between WFP THR schools and non THR schools compared across
similar rural contexts within the same districts. However, analysis of the quantitative
interview data among teachers, parents and children themselves gives a much
clearer and consistent picture. They suggest that across the communities visited with
THR operating at primary level, there were significant increases in enrolment,
retention and transition. Over 32 focus group interviews were conducted with boys
and girls separately at upper primary level and with teachers, which concluded that
the THR programme had made a significant difference to girls‘ retention and
transition to JSS levels of education. The statistical analysis may be difficult to use
based on the fact that there are several other donor supported programmes working
within the district settings and it is difficult to ensure that these are not having varied
impact on the schools or district. Another factor was that many of the districts
included in the trend analysis were experiencing differential impact from flooding and
drought which would have impacted on the outcomes at district and community
levels.
Gender Parity Index
96. Despite the improvement in enrolment and retention rates, there was a slight
decline in the GPI at primary level for the three northern regions and national from
2005/06 to 2008/09. Northern region experienced a slight fall in GPI below parity
while the Upper East and Upper West region had GPI moving towards gender parity
over the same period.
97. There has not been much improvement in the GPI at the JSS level over the last
three year in the three northern regions. For instance, Northern, Upper East and
Upper West moved slowly with 2 per cent, 3 per cent and 2 per cent shifts toward
parity at the JHS respectively. (See fig. 5 and 6). The JHS level also saw a decline in
the GPI, while national and northern GPI drifted away from reaching equality of boys
and girls in class; the Upper East and Upper West moved towards parity over the
four years (see annex 13 for details). Interviews with head teachers and teachers in
schools which had THR at the upper primary and JSS levels indicated that without
the THR there would not be as many girls attending school and transitioning to JSS
since traditionally girls were often used in the home to take care of younger children,
help their mothers and eventually be married at a relatively young age. Schools
where there was take home ration had significantly more girls attending the JSS
(Janjori Kukuo, Savelugu District) compared to schools which did not have the THR
(e.g. Kpalung, Savelugu District)
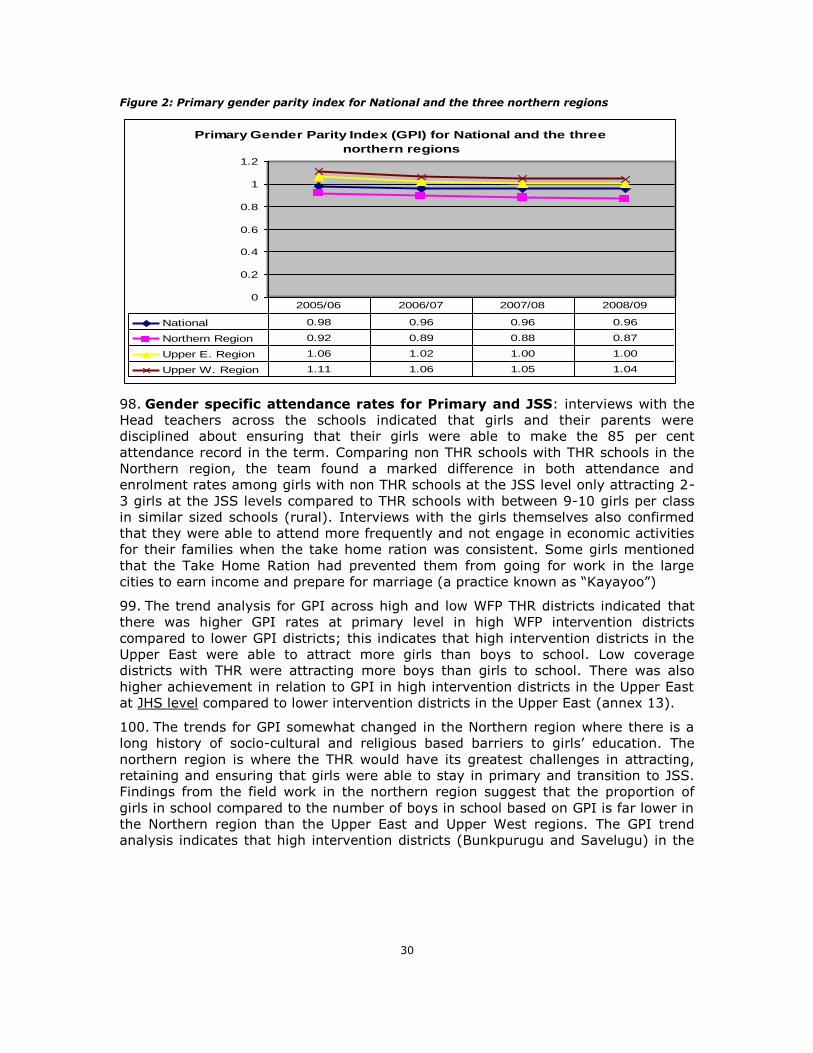
30
Figure 2: Primary gender parity index for National and the three northern regions
98. Gender specific attendance rates for Primary and JSS: interviews with the
Head teachers across the schools indicated that girls and their parents were
disciplined about ensuring that their girls were able to make the 85 per cent
attendance record in the term. Comparing non THR schools with THR schools in the
Northern region, the team found a marked difference in both attendance and
enrolment rates among girls with non THR schools at the JSS level only attracting 2-
3 girls at the JSS levels compared to THR schools with between 9-10 girls per class
in similar sized schools (rural). Interviews with the girls themselves also confirmed
that they were able to attend more frequently and not engage in economic activities
for their families when the take home ration was consistent. Some girls mentioned
that the Take Home Ration had prevented them from going for work in the large
cities to earn income and prepare for marriage (a practice known as ―Kayayoo‖)
99. The trend analysis for GPI across high and low WFP THR districts indicated that
there was higher GPI rates at primary level in high WFP intervention districts
compared to lower GPI districts; this indicates that high intervention districts in the
Upper East were able to attract more girls than boys to school. Low coverage
districts with THR were attracting more boys than girls to school. There was also
higher achievement in relation to GPI in high intervention districts in the Upper East
at JHS level compared to lower intervention districts in the Upper East (annex 13).
100. The trends for GPI somewhat changed in the Northern region where there is a
long history of socio-cultural and religious based barriers to girls‘ education. The
northern region is where the THR would have its greatest challenges in attracting,
retaining and ensuring that girls were able to stay in primary and transition to JSS.
Findings from the field work in the northern region suggest that the proportion of
girls in school compared to the number of boys in school based on GPI is far lower in
the Northern region than the Upper East and Upper West regions. The GPI trend
analysis indicates that high intervention districts (Bunkpurugu and Savelugu) in the
Primary Gender Parity Index (GPI) for National and the three
northern regions
0
0.2
0.4
0.6
0.8
1
1.2
National 0.98 0.96 0.96 0.96
Northern Region 0.92 0.89 0.88 0.87
Upper E. Region 1.06 1.02 1.00 1.00
Upper W. Region 1.11 1.06 1.05 1.04
2005/06 2006/07 2007/08 2008/09
31
northern region have a slightly higher GPI than low intervention Districts (East
Mamprusie and Tolon) at the primary level82.
101. One of the most important indicators for WFP to monitor will be the sustained
change in girls enrolment based on the fact that the THR programme has ended at
Primary level and is in its last year at JSS during CP (2010). Interviews with key
stakeholders at the field level suggested that there would be need to sustain the
programme in order that the gains made in terms of girls‘ enrolment, retention and
transition, over the last few years are sustained. Factors such as the pull out of the
THR programme may not have immediate impact on the enrolment rates of girls but
awareness creation campaigns and girls‘ education officer visits to THR schools which
were phased out at primary level will be needed to monitor the situation and
encourage girls to stay in school.
102. Secondary data reveals a slight reduction in enrolment among girls in THR
schools compared to non take home ration schools in the same district in the
Northern Region since the ration has been phased out. Interviews with girls and
teachers at the upper primary level suggest that there is not a significant difference
in girls enrolment since the THR was phased out; parents continue to be aware of the
importance of sending their girl children to school and have in some cases for the
first time experienced girls in their community, transitioning to Junior Secondary
school due to the THR programme. Significant drops in girls‘ enrolment and retention
will have to be closely monitored by GES staff in order to see the impact of phase out
in the primary and JSS schools over the coming years. (See annex 13 for information
on gender specific completion trends across the regions)
103. Teachers perceptions of children’s ability to concentrate and learn in
schools as a result of school feeding. Teachers spoke of how school feeding had a
positive impact on children‘s learning in the classroom, often prolonging their
attendance on school days since the younger children who would go back to eat in
their homes at break time would often not return; there were also reports that when
the school feeding programme was well timed/planned the children would stay in
school until the full school day was over (from morning to afternoon) and then return
home to eat.
104. Some teachers also reported that when the younger children eat during the
school day they find it difficult to concentrate after they have finished the school
meal particularly, if the meal is taken at the mid break (10:30 am). This had created
a situation where some head teachers had changed the timing of the school feeding
programme to coincide with the closure of school (about 12:30pm) so that children
could eat their meal and leave from school at 1:30 pm83.
105. An unintended outcome of school feeding in some schools was that: where the
primary school was involved in school feeding and the JSS was in close proximity but
not benefiting from school feeding, the programme had a disruptive effect on JSS
student concentration84. Another factor which had a negative impact on learning
outcomes among children was the exponential increase in numbers of children when
82Caution must also be had with these results given the numerous and widespread interventions by other development partners in the districts which will also influence the movement of GPI across any set of districts. 83Official times for school closure is at 1:30 pm but some head teachers used the last hour of class time to conduct feeding so it did not interrupt the school day at the mid day point. This was not in line with the GSFP operational rules but was adopted due to the needs of the head teachers. 84The team was not able to assess the number of schools which might be affected by this but many schools in northern Ghana have attached JSS‘s with varying degrees of proximity to the Primary.
32
children from a neighbouring school not receiving GSFP would lose their children to a
neighbouring school with GSFP/WFP support; the higher enrolment rates would
create challenges in providing basic school furniture and increased class sizes
towards 60-80 children in a class (UE schools visited) put additional stress on the
teachers; these same schools did not have adequate teaching staff and furniture.
106. This evaluation exercise concluded that where head teachers were in full control
of the management of school feeding, it was having a more positive effect on the
learning and concentration levels of children. Where there was less control by head
teachers over the timing and implementation of school feeding, it had a disruptive
effect on children‘s concentration, learning and contact time with teachers. Several
schools were observed during the field visits where head teachers and teachers were
not able to take control of the school feeding process, with matrons controlling the
timing of school feeding and distribution of food which was disrupting valuable class
time and contact time of teachers; Head teachers spoke of how at least 30-40
minutes of class time was used to complete the process of school feeding either at
the mid break (10:30 am) or at the end of the school day (12:30).
107. The change in the food basket and delayed supply of key commodities (micro
nutrients at the central warehouse has delayed supply of food for school feeding by
over one term (Sept to December, 2009). GES is responsible for the delivery of
school feeding to 200 schools in northern Ghana while the district assemblies
through the GSFP with partial support by WFP are responsible for food delivery to
104 schools across the three northern regions (see annex 19 for details on the
pipeline breakages across activity 1 and 2). The additional schools currently operated
by WFP alone may not achieve collaborative status with GSFP, based on findings
from the current investment and cost efficiency models developed by WFP /Boston
Consulting Group. Other factors appear to be that the DA‘s want to spread the
resourcing for school feeding to several schools by ensuring that WFP remains
separate from the GSFP selection when new quotas are given to districts to select
schools.
108. To sum up, the take home ration has made a significant contribution to the
improvement of girls‘ education in general in some of the most deprived education
districts in the country. The provision of a take home ration has shown significant
results in relation to improving the gender parity index (GPI), the gross and net
enrolment rates across the 18 intervention districts along with completion rates.
Positive differences were observed in high intervention districts and in schools where
the Take home ration was operational. Delayed marriage and delayed income
generating activities by girls, including migration to urban centres, were significant
breakthroughs of the THR along with the counselling /awareness creation work by
the Girls Education Office.
109. The strategy to support a cohort of approx. 40,000 girls through to the JSS 3
level of education may have made a significant impact on retention and completion
at upper primary and particularly at the JSS level where the intervention coverage
reached over 30 per cent of schools in a district. Research in Ghana suggests that
breakthroughs at the JSS level particularly within deprived and culturally traditional
areas pose a major challenge to government and development partners. Data from
WFP evaluation exercise suggest that there were significant outcomes at the upper
primary and JSS in helping more girls reach these levels and transition to higher
levels of education. Interviews with the Regional and district education officers
33
suggest that several girls85 who were part of the THR programme are now awaiting
sponsorship from WFP and GES which will enable them to continue to SSS level. The
usage of a take-home ration as a potential strategy for attracting, retaining and
changing the attitudes of parents towards their girl child‘s education was apparent
during interviews at the community/school level among parents and with girls
themselves. Changes in traditional patterns of behaviour such as early marriage, as
well as reproductive health patterns and migration should all be explored as part of
future impact research.
110. Much more work is needed to ensure that the THR is piloted at primary level
across a larger proportion of schools (at least 50-70 per cent) within a smaller
number of districts in order to observe potential impacts of THR at the district level
where key policy changes are dependent in Ghana. Also there is need to have
baseline studies at a school level comparing THR with Non THR control schools with
approximately the same student size and school resourcing (number of teachers
etc)/ location over the next CP.
Findings Related to Outcome 3: improved national capacity to implement
and scale up SFHNE and on-site school feeding
111. The two main indicators for measuring the performance on Outcome 3 were: (i)
the extent of national, regional and district/ community budgetary allocations to the
SFHNE and SBE programmes compared to WFP contribution; and (ii) the share of
VAM identified vulnerable communities with Government supported SFHNE and SBE
programmes.
112. There is currently no specific budgetary allocations for the SFHNE activity at the
national, regional or district/community levels; however district assemblies provide
infrastructural support such as setting up kitchens, logistics such as transporting
food items, providing cooking utensils and firewood. DA‘s are also responsible for
transport and haulage of food items from the main warehouse at regional level to the
district and community level: the district assembly transports food from the
warehouse to the district and the Ghana Health Service (GHS) transports from the
district assembly to the communities and centres. Field investigations by the
evaluation team revealed that the District Assemblies in some cases budget into their
normal common fund disbursements, the provision for food assistance activities
including nutrition centres, Ghana School Feeding and other school feeding support
particularly in relation to haulage.
113. The VAM process has not identified vulnerable communities to date, but has
focused on assisting the WFP office identify needy sub district areas at the District
level. It has therefore not been used by DA‘s or other government counterparts in
targeting beyond the district. However, recent enhancements to the VAM capacity
within WFP mean that there will be a much stronger role for VAM in future planning.
Findings from the field trip and interviews at all levels of Government indicate that
WFP has made some progress in supporting government to integrate an early
warning food security system with relevant stakeholders such as the Ministry of Food
and Agriculture but it is still being largely led by the WFP and UNICEF.
85Over 100 girls in the Savelugu District, Northern Region; and 100‘s of girls across most of the THR districts need sponsorship to achieve higher levels of education. This is where WFP could have collaborated closer with the Cambridge Foundation for Girls Education (CAMFED) or the World University Service of Canada (WUSC) to explore strategies which could help these girls attain SSS level and higher levels of education.

34
114. The WFP models for supplementary feeding and on site school feeding
programmes have had limited uptake. There was no evidence from the field work to
suggest that the Ministry of Health was using the nutrition centre model as a viable
model for tackling moderate malnutrition and that the activity would be supported or
sustained by national or district budgets if WFP was to phase out support. On the
contrary, shifts in the Ministry‘s own policy have been towards increasing nutrition
and health education among mothers and prevention of malnutrition using CHN visits
and the CHNC, bringing community health services closer to the communities.
Although some WFP supplementary feeding centres were used as outreach points for
public health nurses, the majority of child nutrition centres were turning into
preschools and conducting less health education for mothers and infants; referrals
were being made to nearby health posts.
115. WFP and the GSFP embarked on a strategy to feed 100,000 school children
early in the CP and to share the responsibility to deliver school feeding in 79 schools
which were selected for the initial phase of the collaboration; the number of
GSFP/WFP schools has risen to 104 (as of December 2009) across the northern
region. There has not been significant uptake by the Government in relation to
school feeding models introduced to date by the WFP particularly as a result of the
limited WFP staff capacity, disagreement on the food basket and training exercises.
Intensive work has been done to share information concerning Corn soy blend and
introduce more nutrition based approaches into the current GSFP.
116. There is little documented evidence of a new approach being taken within the
WFP country office to hand over, facilitate and empower government to take the lead
in the implementation of the food assistance programmes of WFP. Very little training
was going on within the CP between 2007 and 2008 when the EMOP was in full
swing. Several opportunities were created to ensure that WFP was assisting
government take up their responsibility for school feeding and supplementary
feeding but the approach taken during the CP did not result in a shift in WFP staff
thinking nor the Ghana Government thinking. Three major areas which appear to be
weak were: lack of programme staff to support policy dialogue, participation in
strategic donor and government/sector meetings and finally ensuring that activity
coordinators were able to lobby for national and district support before the budget
hearings took place. In the case of activity 1, the location of the coordinator in
northern Ghana has severely limited their ability to both access the necessary
resources for monitoring and ensuring the timely delivery of food supplies.
117. Agreements and budgets were signed by the Ministry of Finance and Economic
Planning in the CP Action Plan (CPAP) document for hand-over of the supplementary
feeding programme. However, in 2007, with the departure of WFP‘s key champions,
the DG of the GHS and the activity 1 coordinator, commitment to the handing over
of the Supplementary Feeding Programme lost its key support within the Ministry
which was compounded by constraints in government budget and delays in releases.
The Government has not taken up provision of food for SFHNE activity and appears
to have little intention to budget for future food commodities due to the high cost of
the programme in comparison to other effective health interventions and the limited
number of beneficiaries on a National scale. Currently the GHS is including transport
of WFP food commodities to Tamale for the SFHNE activity in its budget but has
made it clear that it does not see this as the most appropriate use of health funding
nor a priority. Despite large scale attempts and policy dialogue particularly during the
initial stages of the CP, there has been limited national willingness to implement and
scale up the CHNC programme and enable WFP to phase out and hand over. Two

35
main consequences of the inability of the WFP to ensure that there is regular supply
of food particularly in the seasons when hunger is most prevalent have meant that:
The food is not reaching the community levels or the target beneficiary
groups at the right time and this could have a negative impact on the health of
children and the mothers who are expecting this support.
Irregular and variable supply of food has also increased the chances that
communities cannot check or ensure that they are receiving the correct amount.
Findings related to Outcome 4: increased demand for domestic farm
produce
118. The underlying premise of the GSFP programme and WFP was that school
feeding, using locally produced food could enable schools to become engines for
economic development and poverty alleviation through increasing the demand for
domestic farm produce. Available literature and field visits indicate that farmers are
interested in selling their produce to schools but many smallholder farmers currently
lack the production capacity to do so and are not aware of the school feeding market
for their produce. Thus, although the schools (as market) provide an incentive to
increase production, farmers and other stakeholders throughout the value chain are
confronted with a range of challenges that have to be addressed urgently (CFSVA,
2009). Some of these challenges include: limited credit facilitates, lack of
modernization, insecure land tenure, social degradation etc – which go beyond WFP‘s
mandate.
119. Project records indicate that WFP put in place a sustainability strategy based on
extensive research and consultation in support of the Ghana government‘s home
grown school feeding concept86. Links were established with farmers‘ groups and
agro-processors of blended foods to develop local markets, to stimulate local food
production and increase incomes for local farmers. Efforts were made to improve the
income-generation capacity of women through training in iodized salt re-bagging as
well as in selling, milling and fortification entrepreneurship in collaboration with NGO
partners87. WFP is also supporting the government with capacity-building initiatives
to enable it to conduct the Ghana School Feeding Programme (GSFP) on its own.
Local food producers and 60 women‘s groups88 with the potential for engaging in
income-generating activities were selected for possible links with partners in food
production.
120. A study on sustainable strategies for food assistance programmes was carried
out. A small number of community-based milling activities (6-10) conducted by
women‘s groups continue to receive support, and agro-processors and small and
medium enterprises producing iodized salt were given assistance in marketing under
the CP. Through the home-grown school feeding partnership, SNV, UNICEF and WFP
worked together to produce an inventory of capacity shortfalls and identify the
training needed to enable districts to manage the GSFP. One of the main
achievements of the CP was the introduction of iodized salt on a national scale and
the usage of micro nutrients with small and medium food processors but this has not
been directly tied to the SFHNE phase out.
86Gariba, S. (2007) Sustainability Strategy for WFP Ghana. Mark Van de Hoorn (2009) ― The Story Behind the Sustainability Study‖; WFP Accra, Ghana 87The iodized salt re-bagging initiative grew out of the Country Program strategy which was designed to support women‘s groups sustain their nutrition centres. It has more recently become a separate program on its own through the assistance of CIDA. 88These were women‘s groups in the 60 communities which were due to be phased out of the activity 1 program at the early stage of the CP in 2006.

36
121. Despite pressures by the Government to extend WFP programme beyond the
northern region, the WFP CP achieved a positive review by donors in the recent
school feeding partner conference when detailed analytical work revealed that the
northern regions did not receive the needed support from GSFP and that the GSFP
was not targeted towards the neediest children in the country. WFP CP was targeted
in towards the three northern regions but more work could have been done to ensure
that targeting within these regions assisted government develop better mechanisms
to ensuring district level targeting using participatory methods or Food Security
Monitoring System information. This would have required a more rigorous monitoring
system by WFP‘s own country office staff including the development of a master
listing of all communities/ schools within the districts.
122. The evaluation team found that although there was involvement of the
Education Directorates in the selection process of GSFP schools the final decisions
remained with the District Chief Executive and key district officers. This often
resulted in selection based on attempting to balance political constituency demands
which could override the initial selection carried out by the technical departments
such as education. Research by the Boston Group and WFP suggest that there has
not been effective school selection in order to maximize targeting and poverty
criteria laid out by the GSFP. This has resulted in over 50 per cent of GSFP schools
across the country falling into the ―non poor‖ quintiles and rendering the programme
less effective as a social safety mechanism89. Key concerns related to proper
targeting of the GSFP were raised at this conference but remain unresolved
particularly due to the Government‘s view that there is a need to remain in the same
schools.
123. The Ghana School feeding programme has attempted to guide districts in their
selection of beneficiaries using a well thought out beneficiary selection criteria but
this has not been fully upheld. WFP has maintained the need to focus on the three
northern regions which have the highest poverty and food security challenges but
more detailed targeting within the regions and districts also remains a challenge.
WFP and GSFP have both provided districts with selection criteria but interviews with
key district officials reveal that other influences related to ensuring equity across
constituencies influenced the final selection of beneficiary communities/schools.
124. What has become apparent from reports and interacting with WFP staff is that
the food insecurity criteria were not used to target the districts, but the regions, in
the country. The evaluation produced its own master list with the assistance of WFP
Ghana, in order to select schools for field work and found that data was not available
in time series to suggest the length of time WFP interventions had been in a
particular community and that targeting was also not going beyond the district
levels; this had significant implications when the EMOP activities started in some
districts where the evaluation team found overlap between CP and EMOP activities in
some communities. This had a direct bearing on the Country offices ability to predict
and track the number of beneficiaries particularly at the community levels. More
work is needed to map out communities, identify and ensure that there is minimized
overlap and better coordination in relation to PRRO and EMOP activities in CP
communities in future.
89Presentation by the Boston Group on Targeting and supported by evidence by the World Bank, at the Stakeholder Conference on Ghana School Feeding, December 2009.
37
3C Contributing to Change in the Country
125. The transformation of CHNCs into pre-schools, many now with GES support
through provision of trained nursery attendants and educational materials, has
contributed to the government‘s objective of establishing pre-schools in each village
in Ghana and may have promoted the uptake of education by enhancing primary
school (P1) enrolment, though there is only anecdotal evidence to support this at
present. Focus group discussions with communities noted improvements in women‘s
income-generating and productive farming capacities as a result of being able to
leave young children in the day-care/pre-school. This merits further study to quantify
impacts on household income and women‘s status in the community. This may have
a range of additional unintended effects on the household and approach to child care
within communities, both positive and negative, which should be fully researched
and understood.
126. However, the WFP‘s SFHNE activities were too thinly spread in scope to
contribute to significant change at a district level or regional level. While originally
well aligned with government health policies, the SFHNE did not keep abreast of
subsequent development in national policy thinking particularly in relation to
community health approaches to nutrition programming.
127. The CP has contributed to and helped maintain focus on national strategies in
relation to attain Gender parity goals in education particularly in regions where there
was a history of low GPI. WFP also made some contribution at the national level to
helping government better target and develop selection modalities for social safety
net programmes such as the LEAP programme90.
128. Annex 15 shows the percentage of total schools covered by WFP assistance
across the 3 northern regions and 38 districts where WFP is active. On average 17.2
per cent of primary schools were covered with the THR for girls. On average 25 per
cent of JHS were covered at a district level. The vast majority of districts were
having between 6-30 per cent of their schools being covered by the THR programme.
However, the scale of the school feeding programme is still relatively small compared
to the number of primary schools in northern regions (200 schools covered by
WFP/GES, 104 schools covered by GSFP and WFP over the 6,000 schools across the
three northern regions); this was expanded in early 2009 to an additional 200
schools. In many districts less than 10 per cent of primary schools are being reached
by the school feeding programme per district. The additional financial support
provided to the programme by WFP is also not significant (less than five per cent of
overall budget of all GSFP country wide and not only for the deprived northern
regions- target area for WFP.) although the government does depend on WFP to
supplement its own resources.
129. It was difficult to assess what percentage of these schools met the targeting
criteria for food assistance. However, based on interviews with several key
stakeholders at the district level, targeting criteria were not rigorously upheld in the
GSFP selection due to the political priorities and need to ensure that ―all
constituencies‖ were selected. This was corroborated by findings from the
WFP/Boston Group and World Bank which suggest that over 50 per cent of GSFP
schools are located in non-poor communities. The recent workshop on school feeding
highlighted the sensitivity around the targeting issue which will remain an ongoing
negotiation point for donors which support school feeding in Ghana.
90A Social Safety Net programme providing income subsidies to families who are considered the most vulnerable.

38
130. The intention of the CP was that the two main activities (SFHNE and SBE) would
be mutually reinforcing and combine their support to target populations to enable
them to discontinue food aid in the shortest time possible through geographic
concentration to implement the life-cycle approach to nutrition programming,
targeting pregnant and lactating women, children under five, and school children
between 6 and 14. However, this proved difficult in practice in places where school
selection criteria did not correlate with that for nutrition programming and school
feeding was not available in the community. Activities further aimed to focus in areas
where they would be complemented by activities of other UN organizations, NGOs,
CBOs and bilateral donors. In other programmes, this has often worked well and has
included NGO support to pre-school infrastructure and equipment, technical support
for IGAs or farming, UNICEF training of GHS staff in growth monitoring and support
to treatment of severe acute malnutrition.
4. Factors Explaining Results
131. This section will explore the factors explaining the results and performance of
the CP and the underlying reasons to date as to why progress was made in relation
to some but not all outcome indicators. Although the two sections are separated
there were several external factors which had a direct bearing on internal factors
explaining the results and vice versa.
4A External Factors
132. The floods in northern Ghana in 2007 and 2008 restricted achievement of many
of the CP objectives as they impacted negatively on food security of vulnerable
households and entire communities in CP programme areas. While malnutrition rates
reduced significantly in both underweight and wasting of children 6-59 months in
programme locations, the evaluation team found that this was realized by 2007,
within a year of implementation of the SFHNE activity. It has been maintained,
though not improved in 2008-09. Further improvements in 2008 and 2009 might
have been attained if these disasters had not occurred. This is also the case for key
education indicators which have begun to show a sharp drop in terms of net
enrolment rates in the northern regions of the country. GPI has also either remained
stagnant or reduced on a regional basis, meaning fewer girls over the years under
review.
133. The CP has suffered from insufficient funding from 2006 to 2008/09 and has
subsequently endured pipeline breaks resulting in reduced quantities of food being
delivered to beneficiaries (see annex 19). Government has failed to honour the
commitments made in the CPAP in regard to scaling up support to the CP and with
eventual hand-over by WFP at the end of 2010. The government defaulted prior to
2008 on its budget increases in support of the programme. The CPAP agreement was
signed by the Ministry of Finance and it appears it did not have any buy in by the
District Assemblies who were expected to make the budgetary arrangements. This
underlies the importance of WFP and its Government counterparts ensuring
involvement and ownership at the district and community level for programmes it
wishes to eventually handover and not to rely on internal consistency of government.
134. In addition to this, there have been staff changes and policy developments
within both GHS and local government over the duration of the CP which have moved
away from any commitment to importing and transporting food and from viewing
food support as appropriate to preventative health and nutrition programming. There
were also signs of lack of ownership within the Ministry of Education in relation to

39
haulage of food from the capital to the regional warehouses and out to the districts.
This has resulted in significant delays and difficulties.
135. Government shortfalls in honouring commitments made at the start of the CP
constituted a major external factor in the smooth implementation of the CP. Changes
of senior Government staff after initial CP design led to very little support for SFHNE
coordinators, limited the monitoring and support at district and regional levels. A
shift in health and nutrition policy thinking towards more preventive approaches
through health promotion and nutrition education, with the use of nutrition food
supplements limited to curative approaches. This placed WFP‘s approach at odds with
the Ministry of Health thinking since WFP was providing supplementary feeding with
the aim of preventative malnutrition whereas the Government preferred food
supplements to be directed to the treatment of malnutrition.
136. The take-home ration strategy for girls‘ education was successfully implemented
apart from a pipeline break in the last two terms. There was also satisfactory
monitoring by the GES Girls‘ Education officers particularly in districts with highly
motivated officers who recognized the potential impact of the programme. There was
a relatively strong commitment by the GES at regional and district levels towards the
THR particularly in regions where high gender disparities remain e.g. Northern
region. Less support by senior GES officials was experienced in the Upper West
where there are still high rates of boys out of school or dropping out91. There was
limited advocacy and learning being shared between senior officials within the
Ministry of Education, GES and the Ministry of Finance which might be relevant to
ongoing safety net programming.
137. The Ministry of Health and GHS have enhanced their approach to community
health services over the programme period and there was evidence during the field
study of new CHPS compounds and improved access by communities to health care.
UNICEF has also been active in support of government and, particularly in Upper
West region, in activities to promote health and prevent malnutrition. Underweight of
children 6-59 months has reduced in Ghana at a national level and mortality rates of
infants and children under five appear to have reduced as well. It is likely that
enhancements in health and nutrition have been taking place in the country as a
result of a variety of initiatives and factors external to WFP‘s programme that may
have boosted the outcomes.
138. There are several reasons why the SBE programming may not have fully
achieved its planned targets/results including socio-cultural, economic and poverty
related which may explain the improvements and then decline in GPI at JSS and
primary levels. The decline in GPI at primary level at regional levels may be a result
of the shift of some donor programmes away from primary levels (e.g. CRS and WFP
support from lower primary to upper primary levels and the eventual phase out of
the cohort of girls at the primary level who were moving to JSS) but this is difficult to
ascertain with the available data and given there was no baseline system of
monitoring the direct cause for the decline in GPI at primary levels. A study
commissioned by the SNV with UNICEF and WFP support called ―A look at girl‘s
education strategies in Ghana‖ found that the lack of development partner synergy
and collaboration within districts and regions has contributed to the poor
achievement rates of development partner programme impact92.
91Based on Enrolment data and interviews with Senior District Education Officers. 92Casely-Hayford et.al (2009) A Look at Girls‘ Education Strategies in Ghana: their impact and effectiveness‖ Accra: SNV.
40
139. The data analysis and interviews also suggest that there was very little
collaboration on the part of other UN agencies to ensure that all played their part in
the achievement of CP objectives. Although there were memorandums of
understanding signed between UNICEF and WFP, the lack of reporting suggests that
they were unable to fully achieve an adequate level of synergy at regional and
district level to ensure that the targeted schools received a ―minimum package‖ at
the same time that they received food incentives for girls. There were some efforts
made in the THR programme for UNICEF to provide bicycles to girls benefiting from
the THR by WFP in order to facilitate school attendance at the JHS level. WFP also
made efforts to target its work particularly in areas where UNCIEF was working to
achieve higher rates of gender parity.
140. Another change during the CP was that, although Ghana is the only country to
have achieved MDG 1 of halving the proportion of people who suffer from hunger,
the Ghana government appears to have become more cognizant of the importance of
food assistance programming since 2008, due to the emphasis on social safety
net/protection programming. This new focus on identification of the most effective
social safety nets has come about through vulnerability analysis which suggests a
shorter time frame for the growing season and increases in the hunger season in
northern Ghana. Ghana has embarked over the last three years on several
nationwide social protection programmes in health (e.g. National Health insurance
scheme), education (capitation grants) and even social welfare (the LEAP
programme) all of which have identified elements of the work that WFP has been
doing. School feeding has become increasingly visible and considered needed by the
Government of Ghana over the past three years. This is evidenced by the significant
investment by the Ghana and Dutch Governments towards school feeding93 which
has been sustained through a change in Government.
141. High prices of food in Ghana negatively impacted on the intention of making
Ghana a model for local procurement and may affect home grown school feeding
models. Interviews with farmers and available literature94 indicates that farmers are
interested in selling their produce to schools but many smallholder farmers currently
lack the capacity to do so. Thus, although the schools (as market) provide an
incentive to increase production, farmers and other stakeholders throughout the
value chain are confronted with a myriad of challenges that have to be addressed
urgently. These include: limited access to credit facilities; lack of modernization,
inefficient farming practices, and poor access to agricultural inputs; inefficient food
processing technologies which result in substantial crop (especially grain) losses; and
insecure land tenure arrangements which many believe are a disincentive for
investment in agriculture.
142. In addition, farmers have limited awareness about home grown school feeding
and, caterers prefer to buy from traditional market traders where they have credit
facilities. Farmer based groups are unable to offer credit to the caterers in order to
link to GSFP market, District directorates of MoFA are not officially aware of the
plans, objectives and strategies of the GSFP and no budgetary provision has been
made for their contribution to the programme. There is also hardly, any collaboration
existing between government institutions in the implementation of the GSFP (e.g.
93The Ghana school feeding program (GSFP) is reaching close to 800,000 beneficiaries and intends to reach their target of reaching 1,400,000 by 2010. Only 10 per cent of the program is financed by external donors including the WFP and Dutch Government. 94See USDA Foreign Agricultural Service (2009), Assessment of Local Production for School Feeding in Ghana. Report prepared for the Bill and Melinda Gates Foundation, 1-12 June.

41
Ministry of Education, Health and Agriculture) partially due to the politicization of the
programme95 at all levels.
4B Factors within WFP’s Control
143. The CP was only 70 per cent funded at the initial stages. and by the time full
funding was achieved, it was too late to retrieve the situation. There was also limited
focus and thrust within WFP (at HQ, RB and within the CO) for a hand over to
Government. The varied interpretation, interest and ownership by several staff within
the WFP Country Office was one of the most important constraints, which limited the
strategies being fully executed. To be successful, the CP would have required a
sustained effort to maintain the vision, direction and thrust and to support staff in
adopting new skills and approaches implicit in the exit and sustainability strategies.
These included: support to income generating groups directly linked to the SFHNE
activity as drivers of community level sustainability; support to district offices to
ensure that they budgeted in their yearly cycle food assistance support;, and finally,
at national level, the degree to which capacity-building and skills transfer was taking
place during the CP (Outcomes 3 and 4).
144. WFP did not allocate sufficient senior staff time to ensure that WFP could fully
engage and position itself in the shifting aid policy context. One or two senior staff
were not sufficient to ensure effective policy dialogue given the amount of change
occurring in the policy context and the need for emergency programming in the
north. Opportunities were missed for WFP to show case some of their programmes
particularly in relation to cost effective social safety net programmes and to ensure
WFP programming and its related initiatives were adequately taken into
consideration by key Ministries particularly given the new multi donor budgetary
support architecture, and sector wide programme initiatives. There was an increasing
number of new development partner and government meetings within the
agriculture, health and education sectors due to the Multi Donor Budget Support
process, health and education sector strategy development.
145. Limited WFP staff time was the most significant factor to explain the low level of
results related to outcome 3 (improved national capacity). Senior and junior WFP
programme staff all acknowledged that the EMOP activities had engulfed the WFP
Ghana staff time since 2007 and there was little focus on the CP. Interviews with key
programme/monitoring staff in the northern regions reveal that they spent over 90
per cent of their time on EMOP 1 and 2 activities since 2007 to Oct 2009 despite the
addition of new staff in 2008. This had a tremendous impact on the necessary follow
up, supervision and support with government staff/counterparts implementing the
phase out and sustainability strategies across the regions.
146. The challenges with the supply chain at every stage of moving the WFP food
commodities for Activity 1 and 2 have no doubt impacted severely on attainment of
objectives and resulted in an ineffective supplement to the diets of pregnant and
lactating women and children under-2‘s. These challenges have been ongoing and
are elaborated in quarterly reporting for the programme, but to date little has been
done to address them. Most likely this was due to lack of staff time to oversee the
work and conduct adequate monitoring checks on Government delivery of food
items. It may also be due to the prolonged nature of Government provision of Local
Handling Transport, Storage and Handling. WFP has a responsibility to ensure that
food is delivered in a timely manner, reaches intended beneficiaries and is safe to eat
at the end–point. However, WFP has had insufficient staff capacity to adequately
95Based on interviews across all the regions and districts in the evaluation study.

42
monitor the CP, while the programme has a broad geographical reach. Since the
supply chain challenges largely stem from lack of commitment and capacity within
GHS as well as at District Authority level, it would appear that the design of the
supply chain within the CP has little chance of success.
147. Main delays in school feeding and SBE were due to the inability of the Country
office/Government to ensure that the full variety of food commodities were available
at the warehouse in time to alert districts to haul the food. The SBE activity has also
not been transported out to the communities and districts in a timely fashion since
this is centrally controlled and the transport is paid for by the GES /Ministry of
Education.
148. The evaluation team observed that there are a considerable number of
development partners operating in the three Northern Regions where WFP activities
are being implemented. However, the degree of functional relationships--- synergies
among them and between them and WFP is very weak, even though most of them
tend to have a common goal of improving the food security and nutritional status of
vulnerable populations especially women and children. For the implementation of the
various measures proposed by the CP, the WFP needed to establish effective and
operational linkages amongst government and other development partners (bilateral,
multilateral, NGOs and CBOs) working in the food production/income generating
activities with a view to enhancing the potential benefits that could be gained from
their collective programming. Towards this end, a study of the different
governmental, multilateral, bilateral, International and Local NGOs operating in WFP
programme communities was undertaken in 2004 96. Very few of the intended
partnerships with NGO‘s were fully operationalised in relation to the sustainability
and hand over of nutrition centres and also in relation to increasing UN synergy in
specific districts of Ghana particularly in relation to improving Girls‘ education
outcomes. Interviews and field work in northern Ghana suggest that very few of the
civil society partnerships were fully operationalised during the CP implementation.
149. The omission of the sustainability strategy from the CP log frame has meant
that WFP was not able to direct CP resources towards it. All activities to promote
IGAs within women‘s groups and enhance community capacity to sustain the activity
and/or its impacts have had to be resourced through solicited extra-budgetary
funding. This has resulted in an ad hoc approach to helping communities sustain
their activities, often on a very small scale which is insufficient to meet the need. The
sustainability strategy, in particular relied on partnerships with NGOs to provide
technical expertise to IGAs as well as working closely with government departments,
including the Ministries of Food and Agriculture, Health /GHS, to explore ways to
enhance and sustain programme impacts. WFP volunteers played an important role
in supporting the sustainability strategies but there was no long-term institutional
approach with key Government Ministries, Departments and Agencies. While
coordination appears to be extremely weak between government departments in
Ghana, WFP could have played a stronger role in bringing NGO‘s and departments
together to address issues more holistically.
150. Overlap with the EMOP at community level may have also boosted the apparent
effectiveness of the CP, particularly in relation to improvements in malnutrition rates.
The evaluation team found overlap between CP and EMOP communities, particularly
in the Upper East region. This will require further investigation with comparison of
overlap with non overlap community sites to assess the impact more systematically.
96Study of CBOs and NGOs in Northern Ghana.
43
5. Overall Assessment and Recommendations
5A Overall Assessment
151. Overall, the Ghana CP partially fulfilled its objectives97. The CP was relevant
to needs at the time of designed and appropriate in its response, although very
ambitious. It still remains relevant to the current context of social development and
hunger in Ghana. Most of the outputs were achieved but there were significant
limitations to translating this into sustained outcomes and the overall development
objective, largely due to the lack of government commitment after a change of key
government staff who had been involved in CP design and also limited time and
ownership within WFP Country office from 2007 onwards. Other external factors
which limited the CP performance included: the emergency mode of programming
focus due to the flooding in 2007 and 2009, and rise in food prices. The orientation
of WFP staff towards emergency programming was particularly noticeable in the
supplementary feeding health and nutrition activity (SFHNE) (Outcome 1) and the
degree to which WFP was able to put in place measures to ensure sustainability
(Outcome 3) and national capacity building.
152. More positive outcomes were seen within Support to Basic Education, where the
regional and national girls‘ education unit within the Ministry of Education had taken
on the programme as their own and were ensuring some degree of monitoring
despite very limited financial support from the national government levels. There
were also positive sustainaiblity activities towards ensuring local food procurement of
the SBE to make it more home gown and boosting local food production to link local
food production to improve food security across the CP areas and ensure higher
levels of food security at household level.
Table 12 CP assessment in relation to key evaluative indicators
Activity Relevance Effectiveness Efficiency Sustainability Impact
Activity 1 Medium Low Low Low Low
Activity 2 High Medium Low Low Medium
Overall CP Medium Low- medium Low Low Low
(High: meaning that the CP was able to reach a high attainment rating reaching many of the targets and outcome benchmarks,
medium/average rating meant it met outputs/targets only partially; and low rating meant that it was not able to achieve the targets.)
153. GSFP did acknowledge the role that the WFP played in supporting better
monitoring, targeting and content of their school feeding programme (e.g. menu
preparation, introduction of CSB etc). The relationship of WFP with the GSFP was
challenging at the beginning of the CP and limited some of the education outcomes
and programme learning from on-site school feeding during the first few years of the
CP. However, recently, WFP has helped GSFP define a road map for school feeding
and is better positioned to become a more influential partner in the next CP due to
the analytical and technical support it is carrying out as part of the WB partnership
for school feeding, with the P4P and a social safety net focus. The working
relationships have gradually improved over the last two years of the CP and the
number of joint feeding schools has increased from 79 in 2007 to 104 in 2009 but
97The Ghana Country programme received the next to highest rating for fulfilment of objectives based on the Office of Evaluations ranking of full, partial, and limited rating criteria.

44
there have remained some challenges to this partnership operationally playing out at
the district levels98. Table 12 summarises the assessment of the Ghana CP.
Relevance and appropriateness
154. The overall rating for relevance and appropriateness of the CP was medium.
While there are still serious malnutrition problems to be addressed in Northern
Ghana, the SFHNE approach of using food to attract mothers to health and nutrition
education is no longer in line with new government policy thinking on preventive
strategies. Although SFHNE met with support at the start of the CP it now appears
out of step with the GHS approach to community health and nutrition interventions.99
155. On the other hand, the WFP support to children 2-5 years as an educational
activity that freed up mothers‘ time while providing a replacement meal was highly
relevant to community needs and may even be sustained by communities due to the
high priority women place on this service. Providing supplementary food to pregnant
and lactating women and children 6-59 months alongside nutrition and health
education in the three northern regions was an appropriate strategy at the start of
the programme but other strategies were needed to ensure that high levels of
chronic malnutrition combined with food insecurity in selected communities of the 3
northern regions were addressed. The strategy attempted to sustain gains made
under previous WFP programmes but due to poor implementation of other CP
strategies such as sustainable livelihood activities alongside SFHNE and the provision
of food. The Phase-out was and remains relevant and is consistent with the evolving
policy environment. In communities that have received food support for 5-10 years,
WFP risks creating dependency if it does not encourage and assist those communities
to stand on their own.
156. WFP‘s SBE reached a high degree of alignment with Government of Ghana
priorities aimed at achieving MDG 2 and 3. The THR programme for girls is still very
relevant to the current strategic goals of the Ministry of Education in attempting to
reach gender parity in education (MDG 3). The school feeding programme is also
very relevant to the current government /internationally driven targets in education,
social and child development and is a relevant to safety net approaches if properly
targeted to needy households.
157. While high food prices have had a negative impact on food security in Ghana,
new oil revenues will give the Government of Ghana the opportunity to invest in
effective social safety nets. There is and has been untapped potential to re-align the
WFP CP with the new social policy framework currently being developed in Ghana.
Effectiveness
158. Overall effectiveness of the CP was varied and therefore rated medium. The
expected outcome for SFHNE (Activity 1) was to: reduce levels of malnutrition
among at risk pregnant and lactating women and children under five. Underweight
and wasting did reduce across the intervention regions and in beneficiary
communities among children aged 6-59 months. According to community and health
98Recent collaboration in attempts by WFP to scale up school feeding in collaboration with GSFP resulted in the districts allocating the WFP to different schools than the GSFP making it difficult to collaborate in the new 200 WFP schools. 99GHS is scaling up its preventative approach through expansion of the Community-Based Health Planning and Services) CHPS programme, bringing community health services and preventative education closer to the community, with a focus on health promotion and outreach. UNICEF is providing ongoing support to preventative activities in nutrition through mother-to-mother groups and the recent piloting of Positive Deviance (PD) Hearth (a peer education activity) in the Upper West.
45
workers, there was also an improvement in nutrition practices among mothers which
has long term positive implications for the prevention of malnutrition. However,
stunting rates have not decreased in the beneficiary communities and remain at a
‗serious‘ level in 2009 with some communities having implemented the programme
for between 4 and 10 years. As a nutritional intervention, the food support is failing
to protect the most vulnerable children, the under-2‘s from chronic malnutrition.
There has also been no significant effect on nutritional status of lactating mothers or
weight gain of pregnant women. These outcomes were recorded through baseline
and follow-up assessments by WFP. The evaluation team was not able to make a
conclusive assessment of the WFP programme at a district level.
159. The expected outcome of SBE (Activity 2) was: to improve attendance and
completion rates among school children in basic education. High rates of attendance
were recorded across most of the schools visited and significant increases in
completion rates among girls across the three northern regions (see section 3A).
According to field interviews, the THR was creating impact at the school/community
level and wider coverage would likely translate into significant change at the district
levels. Although GPI is now high in many of the northern regions there is still a large
number of out of school girls who are not reflected in the GPI indicator. Also, the GPI
of those in school has stagnated.
160. The School feeding programme was an effective approach in improving
enrolment rates, and attendance rates although it is too early to tell whether
completion rates were also improving as a result of the programme. However, most
schools visited were having trouble coping with increased numbers of children and
managing the school feeding programme due to a variety of reasons including lack of
oversight and clear role definition for the head teacher in the SF programme. Poor
management of the school feeding programme at the school level was interrupting
critical contact time with teachers which could translate into a negative impact on the
potential learning outcomes for children. The THR programme was more effective in
schools where school management was weak because it has more limited
management needs.100
161. Both SFHNE and SBE were reaching a very limited number of communities and
schools across the three northern regions. Targeting and selection for SFHNE was
weak and several communities could have been phased out much earlier. The
Support to Basic Education was too diffuse to be able to be effective at district level
(with WFP and GSFP together covering only five per cent of all schools in the 3
northern regions and often less than 10 per cent of schools in particular districts).
Low levels of success in focusing both activities in the same communities (as
originally planned in the ‗life-cycle approach‘) weakened the potential for wider
impact.
162. Outcome 3 was to improve national capacity to implement and scale up
supplementary feeding and on site school feeding. There was very limited
achievement regarding supplementary feeding largely because the Ministry of Health
no longer prioritised the SFHNE activity nor considers it possible to justify increased
future support particularly in relation to the cost of food transportation for SFHNE.
Lack of government support to the SFHNE coordinator particularly over the last two
years and lack of implementation of the hand over/phase out strategy were key
factors in under-performance. There was some improved capacity at the National
100Teachers only have to get involved at the end of each term and school contact time is not interrupted to distribute the food ration.

46
level to implement school feeding particularly in relation to exposing senior officials
and GSFP programme officers to the options available to implement cost effective
and ―home grown‖ approaches to school feeding. Approaches to more effective
targeting were also introduced through the WFP/GSFP collaboration.
163. Outcome 4 was to increase the demand for domestic farm produce in response
to newly created school feeding market requirements. This outcome was partially
attained at the national level due to the increased emphasis on local procurement
and the efforts made by WFP Ghana to reach out to organized farmers through their
supply networks. But it was severely set back by high food prices from 2008. It was
not achieved at regional and district levels. WFP Ghana staff have also encouraged
GSFP to define more clearly their approaches to reach local farmers. Unfortunately
there is still no real clarity in how this will be done, although the current efforts by
P4P and other donors in the country will likely have some influence on this process
over the coming years.
Efficiency
164. A low rating was given to the efficiency of the programme due to the high
number of pipeline breaks in both main activities of the programme, the poor quality
of the food delivered (e.g. within one month to expiry date for CSB) and the poor
storage of the food at central, and community levels101. There were serious
constraints to timely and effective movement of food throughout the supply chain.102
Combined with dilution of the ration for pregnant and lactating women and children
under-2, which in turn is reducing the effectiveness of food supplements to those
groups. Besides reduced effectiveness, it has also resulted in sub-standard and
potentially harmful food to beneficiaries.
165. There were positive findings in relation of WFP‘s cost efficiency in relation to
other programmes such as the Ghana School Feeding programme costs in schools
where they separately support school feeding. Where there is a collaborative
approach between GSFP and WFP (e.g. 2 days and 3 days), more needs to be done
in relation to ensuring cost efficiency. Findings from the latest Boston group analysis
on costs suggest that the supplementary support provided by GSFP to the schools
which are receiving this collaborative approach offsets the cost efficiency since costs
are higher for GSFP to collaborate with WFP than compared to schools where there is
no collaboration.
166. The efficiency of CP implementation was also low due to the limited staff time,
staff focus and lack of Government ownership needed to drive the ambitious CP
vision and strategies. Other external factors may also explain the low level of
implementation efficiency such as lack of government capacity and untimely
government contributions towards the delivery of food were mentioned by staff,
government counterparts and key stakeholders as factors limiting programme
implementation.
167. Long waiting periods before food is distributed from the central warehouse and
poor storage conditions at the community level have contributed to reduced quality
particularly of maize and Corn Soya Blend (see annex 19 for details). The irregular
food supply to schools has also caused some confusion and hardship with children
101These observations were confirmed in interviews with staff and other key stakeholders and validated at visits to the regional store house. 102The government takes the title of the food commodities once it arrives at the port for Activity 1 and at Tamale for the Home Grown School Feeding Programme. It is also the responsibility of the government to deliver the food commodities to the intended beneficiaries in all project sites.

47
arriving at school expecting to eat and then not having any school lunch. Some
children also do not eat before coming to school.
168. The majority of national and local government representatives consulted
consider that importing foodstuffs is not the most efficient way to implement the
SFHNE activity and that WFP should further explore options for local purchase – a
strategy already being implemented under school feeding.
Sustainability and connectedness
169. The overall sustainability rating for SFHNE and SBE, was low due to the low
level of ownership and visible commitment by Government in honouring its
agreements with WFP. Interviews with key Government officials suggest that the
Ghana government was not committed to the programme and was in a ―recipient‖
mode of operation—interested to receive the donor support but unwilling to put their
own funding into implementing the programme at national and district levels in a
timely manner partially due to budgetary constraints and prioritisation issues.
170. An extensive long-term sustainability strategy was included by WFP Ghana in
the CP design to enhance local linkages with women‘s groups and local producers in
order to support nutrition activities across the communities operating nutrition
centres. The strategy of the CP to consolidate gains made during the previous CP and
phase out of food support to communities that had been assisted for 3 years or more
was appropriate and has been successful in a few communities (Banu, Vamboi) that
were phased out at the start of this CP. However, to ensure sustainability of the
interventions in the long-term and enable a strategic phase-out of all current sites,
communities need to be assisted with IGAs or enhanced agricultural production and
storage capacities. So far the support to these activities has been minimal, largely
due to funding constraints and lack of facilitation time by WFP staff and/or potential
implementing partners.
171. Activities that were crucial to the overall sustainability strategy were not
embedded in the results framework of the CP and therefore not subject to
monitoring, resourcing or prioritized for staff time. Findings from the interviews at
community level suggest that, where a community is united, pro-active and
prioritizes support to a nutrition centre (day-care for 2-5 year olds) success is
achievable by providing supplementary food to children 2-5 years of age and
maintaining the outcomes of the activity, however a focus on a specific women‘s
group to do so proved less successful as it presupposes that a small group of women
who may or may not directly benefit from the nutrition centre will be willing to
support a community activity.
172. Sustainability of the SFHNE activity and its potential impacts for the pregnant
and lactating mothers and the under-2s is not assured. Health and nutrition
education in the programme remains dependent on food distribution to attract
mothers to a central location and external inputs by CHNs. While WFP‘s interventions
to prevent malnutrition are appreciated by all stakeholders, the strategy is regarded
as inappropriate by senior GHS officials to the current preventive approach, of low
priority and cost-inefficient (particularly given the costs and necessity of importing
and hauling food to northern Ghana).
173. While WFP worked closely with both UNICEF and GHS in the development and
start-up of the CP, nutrition coordination in Ghana appears to be relatively poor. WFP
has had inadequate capacity/staff time to engage proactively at the policy level and
is notably absent from initiatives such as the new Community Management of Acute

48
Malnutrition (CMAM) policy and National Nutrition Policy currently in development by
Ministry of Health with support from UNICEF and WHO respectively. As such WFP
risks becoming side-lined from high-level decision-making and its programmes have
fallen out the of line with current thinking and developments. If the CMAM strategy
includes treatment of moderate acute malnutrition, WFP will need to consider its role
and its current approach.
174. There are currently three school feeding programmes running across the
three northern regions of Ghana (GSFP schools, GSFP/WFP collaborative schools, and
WFP supported schools). The GSFP is focusing on capacity building at the district
level to ensure sustainability. Previous programming in the three northern regions
has been focused on getting more community involvement into the SF programme in
order to ensure sustainability. The potential success of the latter approach was
apparent in communities who had worked with CRS to design sustainability
strategies through local community committees and were on the road to self-
sustaining school feeding. When WFP took over supplying these communities,
customized support was needed to complete the hand-over, but was not provided.
175. The WFP school feeding programme will depend on the success of Government
in securing funds for the next year. Unfortunately there is little discussion of the
Take home ration being supported by the Ministry of Education, partly as a result of
very limited consultation on this possibility during the CP. Interviews with senior
Ministry of Finance Officials suggest that there is much more room for WFP to bring
visibility to the THR as a best practice for poverty reduction particularly given its
mention in the new National Development Plan as a strategy to address MDG2.
Without much more research and advocacy for showcasing the gains made by the
THR in northern Ghana, it is likely that the programme will not be sustained by the
Government. Longitudinal studies to assess the value of THR as a safety net activity,
comparing THR schools and non take-home ration schools will be needed in the
coming years, as was done in the SFHNE activity103. Institutional capacity for
sustaining the programme is in place through the girls‘ education directorate within
the GES.
5B Recommendations
176. Recommendation 1: WFP should continue to implement a CP with the
aim of eventual phase out in Ghana based on the ability of the country to
meet institutional readiness criteria and school feeding quality standards.
Government commitments to a new CP should be tied to WFP triggers and
milestones which the Government should meet on a timely basis. All WFP
programming in Ghana should aim to provide a social safety net model to the Ghana
Government which can be scaled up and replicated in order to provide best practice,
and introduce wider piloted options for social safety net programming. This is
particularly important in the areas of promoting more efficient and targeted
approaches to school feeding and the THR programme for girls. Much more work is
needed to ensure Government ownership and commitment towards the WFP Ghana
programme is achieved in order to ensure that the quality of the programme and
reputation of the WFP as an organization is upheld. The new CP should be designed
in a strategic manner, engaging with a wider group of partners outside the
government, ministries, department and agencies (MDA‘s), placing emphasis on
district partnerships and ensuring bottom up accountability to improve quality and
103In February 2010, a film crew from DFID video-taped the take home ration activity as one of the success stories for poverty reduction.
49
sustainability of food assistance programming over the long run. WFP headquarters,
regional and the Ghana country office should ensure that food assistance
programming in Ghana has clear plans and resourcing in relation to sustainability
activities, phase out and exit strategy implementation in order to avoid dependency
among communities, districts and Government.
177. Recommendation 2: District targeting should be the key to the new CP.
District Targeting should be better implemented and assist CO focus on a few
districts in the next CP; the CO should avoid spreading to too many districts reducing
the potential outcomes and synergy between programmes. WFP should conduct a
ranking exercise, based on poverty and hunger criteria, and focus future programme
on a few districts within the three northern regions with the highest levels of
undernourishment and high rates of food insecurity (using new VAM) and prone to
disaster and drought. A final selection criterion should be that districts have
demonstrated a high level of commitment and capacity to learn from development
practice, are interested in improving the management of school feeding and take
over nutrition centre programming (based on past performance, a scoping study and
regional consultation with key stakeholders). Remaining districts within the current
programme should be phased out. Community selection and targeting should not be
solely left to the discretion of the districts and government counterparts but
structured consultations should ensure that inputs by WFP are used in order to avoid
―derailing of criteria‖ in light of the politicization of development programmeming
across all regions of Ghana. WFP should look at its staffing and resourcing levels to
determine the number of focus districts in which it can realistically achieve results,
Focus of all WFP Ghana programmes should be concentrated in these districts in
order to attain higher impact of the programme before moving to other districts.
178. Recommendation 3: The Girls’ Education Take Home Ration programme
should remain a flag ship programme for Ghana which will require much better
visibility of the programme in current social protection and poverty forums with the
Ministry of Finance, multi donor budgetary support advocates and the social
protection sector group which contains all the key development partners in the
country. A more multi sectoral approach to THR in which the Ministry of Education
would lead but collaborate with other key ministries including the Ministry of
Employment and Social Welfare, the lead on social protection issues in Ghana. Future
CP programming of the THR should also focus on ensuring that at least 70-90 per
cent coverage is attained in upper primary and JSS using a cohort approach but
concentrating the programme in fewer districts and reaching greater scale within the
district. This is particularly important given the number of other interventions in
districts which make it imperative to collaborate and reach a level of synergy for
outcomes to be attained. ―Tackling Education Needs Inclusively‖ is a good example of
a programme operating in some of the same districts as WFP where stronger synergy
and collaboration could lead to improved outcomes.
179. Recommendation 4: WFP led school feeding should promote a cost
effective model based on home-grown school feeding. The school feeding
model which WFP tests in its own schools should assist government and development
partners consider more cost efficient approaches to school feeding particularly given
the fragile learning environments of northern Ghana where time on task is very
limited. Fortified school biscuits made in Ghana should be tested alongside other
more locally accepted and cheaper school meals than are currently being provided by
GSFP. The WFP model should demonstrate best practice particularly in achieving
higher learning outcomes, ensuring linkages to farmers groups, community and

50
district ownership and domestic farm production in the WFP target districts
collaborating with the P4P programme. WFP will likely implement school feeding with
the Ministry of Education and districts in 200 schools across the 36 districts in
northern Ghana, while GSFP focuses on other districts to increase the scale of
assistance. The Ministry of Education/WFP should concentrate this model in a fewer
number of selected districts where there is need for school feeding (highest incidence
of poverty, highest food insecurity and with agricultural potential to demonstrate the
model). Scaling up models for development will require better working relationships
between WFP, Ghana School Feeding and the Ministry of Food and Agriculture and
possibly partnering with IFAD. WFP should collaborate with IFAD and other relevant
agencies to support pilot initiatives to use more appropriate storage facilitates,
inventory credit and block farming initiatives linked to local school feeding
programmes with GSFP and Ministry of Food and Agriculture in collaboration. To
facilitate this process, the construction of dams for irrigation is proposed as a matter
of urgency in food deficit districts of northern Ghana. This can be undertaken with
the use of WFP food resources such as food-for-work in collaboration with MOFA.
180. Recommendation 4a: Critical to the school feeding programme in Ghana is
the need to carefully define the role of the head teacher and Ghana Education
Service in ensuring the proper management of school feeding to ensure quality
standards and maximize learning outcomes in fragile learning environments. This
would also involve intensive training and orientation of: (a) head teachers in schools
which are managing school feeding (to avoid leaving school feeding in the hands of
the ―cooks and matrons‖) and (b) the school management committees which are
already responsible for full oversight of the schools and avoid creating dual
management bodies at community levels (e.g. School Implementation committees).
181. Recommendation 4b: In districts and schools which are unable to cope with
the management intensive programme of delivering one hot meal to children on a
daily basis, a simple more cost effective and time conscious approach to
school feeding should be introduced (e.g. locally produced fortified
biscuits). This should be piloted, monitored and evaluated in selected rural and
urban areas where WFP is likely to be working with the Ministry of Education through
the GES on school feeding.
182. Recommendation 5: WFP Country Office should engage in intense consultation
with the Ministry of Health national and regional levels and other partners such as
UNICEF to completely re-structure and develop new WFP nutrition
intervention models for tackling mild/moderate malnutrition that are
complementary to the preventive health and new nutrition approaches. The future
model should be consistent with CMAM strategy development, the draft national
nutrition policy and be well integrated with CHPS. Food support to nutrition activities
should be seasonal and time-bound to reduce dependency and enhance community
ownership (although this was intended in the CP for take-home rations, it does not
appear to have happened on the ground). Seasonal food support should be
implemented hand in hand with activities to enhance community lean season coping
strategies and support for food storage, enhanced production, dams for dry season
gardening, milling/IGAs, thus enabling WFP to gradually phase-out of those
communities. WFP should also consider in the next CP whether it can support
initiatives by the Government in tackling chronic malnutrition through using food
assistance in relation to community health outreach approaches (e.g. CHPS centres
and existing Government nutrition centres)

51
183. Recommendation 5a: Concurrently, the SFHNE programme should clearly
define a phase out plan, based on the current master list of communities, and
after consultation/stock taking exercise with the Government of Ghana. The phase
out plan should be developed alongside high level consultations on the new role
definition for WFP Ghana programming in the health/nutrition sector where the team
feels it necessary to continue some presence.
184. Recommendation 6: The next CP should ensure adequate staffing,
monitoring and support by WFP programme officers in order to fully attain the
goals of future CPs which use developmental and sustainability approaches. The
Country Office should put in place staff plans to ensure that at least 30 per cent of
staff time is devoted to the CP even in times of emergency. Adequate WFP staff must
be made available, well oriented in capacity building approaches, and competent to
liaise with key senior level officials to ensure that ongoing policy dialogue and
strategic lobbying for support of the programme is achieved. This would include the
commitment by central government to provide resources to Government
counterparts to enable them to fully oversee the activities in the next CP. In
Countries like Ghana where a phase out strategy is in place and the transition from
WFP assistance is mapped out, a larger participative transition process involving all
WFP staff is necessary to ensure a collective and shared vision of the CP is sustained
from one Country Director to the next.
185. Stronger and more widespread policy dialogue and consultation across
WFP senior staff and Government counterparts is needed to ensure that new
WFP initiatives and programmes are well coordinated and consistent with evolving
government and regional thinking. The capacity to evaluate and show case best
practice within WFP Ghana‘s CP will be vital particularly given the new aid
architecture in Ghana. Most pressing is the need for WFP to conduct high level
consultative meetings with key health, education and agriculture government
partners, UN agencies and other development partners to review the key findings of
the evaluation and begin strategizing on future WFP programming over the next five
years (as detailed above). Platforms such as the multi donor support ―sector groups‖
including education, social protection/development, health and agriculture could yield
results in broadening WFP‘s support base in Ghana particularly related to the donor
community.
186. Recommendation 7: WFP Country Office should forge new strategic
partnerships with agencies working on the ground in order to support and
strengthen government linkages within target districts, promote accountability and
services to communities for sustainability. Strategic partnerships should be
developed with at least three civil society organizations (e.g. NGOs) and another
government department (Department for Community Development) working in each
of the three northern regions in order to support capacity building, training of school
management committees, involvement in the sustainability of school feeding
programmes, community participation and nutrition programming. These
partnerships should be better monitored on a quarterly basis in order to achieve the
expected results particularly at the sub regional levels. Partnerships with civil society
agencies could also assist in the monitoring and phase out strategies for school
feeding and nutrition programming and assist communities become more aware of
their basic rights in relation to these programmes. This bottom up accountability
would assist WFP and other Government agencies ensure the timeliness and quality
of programming particularly in relation to increasing district assembly ownership and
oversight.

52
187. Recommendation 8: As part of the new CP, the District Planning and
Coordination unit (DPCU) under the District Assembly must be oriented to
the roles and responsibilities for monitoring the health, nutritional and education
programming in the district. Some funds should be made available for joint
monitoring with the DA planner and budgeting officers. This would help to ensure
long term ownership of the programme and higher oversight responsibilities to health
and education limiting and possibly ensuring fewer leakages.
188. Recommendation 9: WFP monitoring, timely flow and quality control
should be improved, particularly in relation to the work of Government
counterparts, the quality/efficiency assurance of the supply chain, and storage
facilities, as well as appropriate activity outcomes. The country office with
Government activity coordinators should develop urgently: monitoring plans using
the CP results and embedded into the ongoing baseline and follow up monitoring
work for key activity areas. An initial starting point must consider the compilation
and/or validation of the master list of all communities which have been working with
WFP over the last ten years since the first CP. Monitoring and evaluation methods
which better target and ensure a well formulated phase out strategy are needed in
the next CP.
189. Recommendation 9a: In consultation with the Regional Bureau, the
WFP Country Office must decide whether to take back greater control in the
short term of food delivery and/or purchase locally to reduce transport and
storage inefficiencies currently under the responsibility of the Ministries of
Health and Education.104. WFP is at a critical stage in having to decide whether it
will continue to operate its programme under conditions which it cannot ensure that
the Government will deliver safe and quality food to children and women in the most
deprived areas of the country. Given the current pipeline problems, the WFP country
and sub area office should systematically increase random and unexpected quality
control checks at the community, district and regional levels to ensure that the
distribution and quality of food meets the standard expected by WFP. Support and
computerization of the warehouse maintenance, management and organization is
urgently needed particularly at the central warehouse in Tamale. Clear agreements
should be developed with District Assemblies in order to ensure that pick up of food
is carried out on a timely basis.
190. The role of WFP in Ghana is changing based on the country context and the
demand for more efficient and effective approaches to social safety net
programming. In-depth consultation is needed across the relevant sector ministries
and with the Government of Ghana at the highest levels to better determine
partnerships within this new aid environment where sector budget support and the
Accra Agenda for Aid Effectiveness are influencing government thinking on
development cooperation. The identification of selected numbers of interventions
where best practice has been realized in this CP, appears to be the way forward for
WFP Ghana, focused on the THR for girls and the school feeding programme. WFP
may also be able to demonstrate efficient models of food for work programming
given the new government focus on reaching the most vulnerable groups affected by
loss of livelihood, climate change and emergency events in northern Ghana.
104Although this appears to be a reversal of current WFP thinking on government ownership—and capacity building, the evaluation team concluded that the SFHNE and SBE programs had received limited government support particularly at the national levels despite policy pronouncements and signed agreements.
53
Annexes
Annex 1Terms of reference 1. Background
1.A. Country Context
1. Ghana ranks 142 out of 179 on the UNDP‘s Human Development Index (2008,
updated). It is one of only two countries in sub-Saharan West Africa ranked as
‗medium human development‘. The latest Ghana Living Standards Survey (2006)
indicates significant declines in the percentage of the population living in poverty
from 39.5 per cent in 1998 to 28.5 per cent - population 23.5 million in 2007105.
Nationally, net primary enrolment increased from 59.1 per cent in 2005 to 83.4 per
cent in 2008106 with gender parity almost achieved in 2007107. Under five stunting is
at 22 per cent in 2008 nationally108. Economic growth has been strong with GDP
growth rising from 5.9 per cent in 2005 to an estimated 7.2 per cent in 2008109. The
elections in 2008 resulted in a peaceful, democratic transfer of political power. Ghana
is classed as a ‗strong performer‘ on the World Bank‘s provisional Country Policy and
Institutional Assessment index110.
2. On the other hand, Ghana is also a low-income food deficit country111. There are
large rural-urban and inter-regional disparities in levels of poverty, food insecurity
and access to basic services as well as recent signs of deepening poverty among food
crop farmers and slum dwellers112. In the three northern regions (Northern, Upper
East and Upper West) and some coastal areas, there is persistent food insecurity and
less progress towards the MDG‘s on all fronts. Gross primary enrolment is 35 per
cent lower than in the Greater Accra region with girls‘ enrolment behind boys‘113; and
poverty rates, under five stunting, infant mortality and maternal mortality are all
considerably higher in the northern regions than the national average. Maternal
mortality rates appear to be increasing114. These regions now account for half of
Ghana‘s population living under the poverty line115. They are also the areas most
prone to adverse weather conditions and have been disproportionately affected by
increasing food prices116.
3. While fiscal policy is classed by the World Bank as ‗pro-growth and pro-poor‘, at
7.9 per cent of total public expenditure (2008), health expenditure is well below the
105UNICEF: Ghana at a glance, July 2009 http://www.unicef.org/infobycountry/ghana.html 106World Bank Country Brief, Ghana 107Ratio of female to male primary enrolment at 99 per cent in 2007.Source World Bank data on MDG‘s http://ddp-ext.worldbank.org/ext/ddpreports 108UNICEF, Global Database on Child Malnutrition, updated June 2008 109Idem 110World Bank Country Brief, Ghana 111FAO Country Profiles, May 2009 http://www.fao.org/countryprofiles/lifdc.asp 112Brinkman, H-J., Bauer, J-m, & Mahama, A., May 2009, Assessing the Impacts of the Global Economic and Financial Crisis on Vulnerable Households in Ghana, WFP 113UNDAF for Ghana 2006-10 114Government of Ghana Multiple Indicator Cluster Survey (2006), quoted in Biederlack, L. & J.Rivers, 2009, Comprehensive Food Security & Vulnerability Analysis, Ghana, WFP, Rome 115UNICEF, Ghana at a Glance, July 2009 http://www.unicef.org/infobycountry/ghana.html 116Biederlack, L. & J.Rivers op.cit.

54
amount needed to meet the MDG‘s117. By comparison, education expenditure is 13.3
per cent of same.
4. The current macro economic situation is described as ―delicate‖118. Reducing the
quality and quantity of food consumption has been identified as a common strategy
to cope with continuing high food prices (along with return migration)119. In 2008,
WFP noted price increases ranging from 71 percent to 114 percent for all the major
commodities, with significant increases for pulses and cereals in the food-deficit
northern regions120. In addition, Ghana has been host to refugees from other
countries in the region, such as Togo, Liberia and Cote d‘Ivoire.
Government of Ghana national priorities:
5. The Government of Ghana‘s current Growth and Poverty Reduction Strategy II
2006-2009 aims to accelerate agriculture-based economic growth and poverty
reduction with greater emphasis on supporting the private sector. It has three
pillars:
- private sector competitiveness
- human development and basic services
- good governance and civic responsibility
6. At the time of design of the WFP CP and the UN Development Assistance
Framework (UNDAF) 2006-2010, the fore-running Ghana Poverty Reduction Strategy
was in place, which also contained a pillar on human development and basic services
and gave greater emphasis to development of public sector capacity. There is also a
Food and Agriculture Sector Development Policy (FASDEP II, August 2007), an
Agriculture Sector Plan 2009 - 2015, a Ghana Education Strategic Plan (2003-2015),
including capitation grants to enable free compulsory universal primary education,
and a Health Sector Programme of Work 2002-2006. Both were specifically taken
into account in the UNDAF. Thirteen UN agencies signed the UNDAF 2006-2010
(likely to be extended to 2011 with renewal in 2012), including WFP. Official
development assistance to Ghana totalled US$1200 million in 2006, supplementing
the Government‘s own investment of 30 per cent of GDP121. (These and other
documents which will be made available to the Evaluation Team by OEDE are listed
at Annex 1).
1.B. WFP Operations
7. In the CP (2006-2010), WFP committed to contributing to three of the UNDAF‘s
six strategic areas of cooperation, namely: education, health and sustainable
livelihoods (very small contribution). These were expressly linked to the GPRS II and
WFP‘s Strategic Plan and policies. At the time of programme design, Government of
Ghana was on track to meet the MDG1 goal of halving the number of people living in
poverty.
117United Nations Country Team, 2005, UN Development Assistance Framework (UNDAF) for Ghana 2006-2010 118Brinkman, H-J., Bauer, J-m, & Mahama, A., May 2009, Assessing the Impacts of the Global Economic and Financial Crisis on Vulnerable Households in Ghana, WFP 119Idem 120WFP Standard Project Report 2008; original source unknown 121World Bank/IDA, 2007, Country Assistance Strategy for Ghana FY08-11

55
8. WFP‘s ‗mission in Ghana‘ therefore is described as ―to help the Government to
expand and replicate throughout the country successful models of food-based
programmes for raising demand for and supply of basic education, with gender
parity, and health and nutrition services for children under five years and pregnant
and lactating mothers at risk of malnutrition‖122.
9. The intended outcomes are:
Reduced level of malnutrition among at-risk pregnant and lactating women
and children under five;
Improved attendance and completion rates among school children in basic
education;
Improved national capacity to implement and scale up supplementary feeding
and on-site school-feeding;
Increased demand for domestic farm produce in response to newly created
school feeding market requirements.123
The Project Document states a clear intention to phase out external food aid within
five years, but this is not listed in the ‗intended outcomes‘ nor in the Logical
Framework.
10. Using both food and non-food resources, the two core activities are:
supplementary feeding and health and nutrition education (39 per cent of total);
school feeding for basic education (61 per cent of total).
Initial focus is on the Upper West, Upper East and Northern regions, with expansion
to Ashanti and Western regions envisaged.
11. Since the start of the CP, other programmes have also begun as shown in Table
1. Further information is included in the Fact Sheet (Annex 2).
1.C. Stakeholders
12. The Project Document envisaged a large number of implementing and
collaborating partners from community and district level to national level. The
Stakeholder Map at Annex 3 gives an overview. The evaluation will need to
differentiate clearly between those that were intended/planned to have a direct
role in the programme and those that actually do. Within the latter group, it will
differentiate between the different degrees of interest in fact.
122WFP, 2005, Project Document Country Programme – Ghana 10418.0 (2006-2010) para.17, WFP/EB.2/2005/7-A/3 123Ghana has now been scheduled to become a pilot country for the WFP ‗Purchase for Progress‘ programme (P4P) from 2010

56
Table 1 All WFP ongoing operations in Ghana
Operation From To
Total Operation
Budget US$ (millions)
Total No. of Benfs
(planned p.a.)
Commodities mt
EMOP 10710.0 Food Assistance to Flood-Affected Populations in Northern Ghana
Nov 07 Sept-09 18.68 215,000 21,726
PRRO 10673.0 Assistance to
Most Vulnerable Refugee
Caseloads in Ghana in
support of Repatriation,
Resettlement and Self-
Reliance
Aug-07 Sept-09 2.75 14,200 4,135
Planned PRRO Assistance to
Food-Insecure Households in
Ghana vulnerable to
droughts/floods and High
Food Prices:
Oct-.09 Sept-11 32.0
176,000 to
261,000
(max)
46,068
CP 10418.0
Jan-06 Dec-10 25.5* 152,000
(average) 35,169
Source: WFP website, July 2009, Standard Project Reports & information from WFP Ghana Country Office * over five years; 68 per cent resourced as at June 2009.
2. Reason for the Evaluation 2.A Evaluation Rationale
13. The project document planned mid-term and final evaluations of this
programme. With the elections being held in 2008, the ‗mid-term‘ evaluation was
postponed. However, the Country Office confirms that an evaluation during the
programme would be useful because of changes in the political, economic and food
security context since programme design.
14. Secondly, the last OEDE-managed evaluation of WFP‘s work in Ghana was in
2001 (Mid-Term Evaluation of the CP 1998-2002). This operation also meets the
criteria to ensure a representative sample of WFP operations is evaluated each year
(per WFP Evaluation Policy, 2008).
15. The main users of the evaluation will be the Country Office and implementing
partners, at all levels. In addition, the evaluation should be a useful resource
(amongst others) to preparation of WFP‘s Country Strategy during 2010. The findings
will also be aggregated with those of other operations evaluations for information on
corporate performance.
2.B Evaluation Objective
16. All evaluations pursue the dual objectives of accountability and learning. While
these two objectives are in principle mutually reinforcing, the balance of emphasis
between them varies from evaluation to evaluation. In this case, presentation of a

57
summary report of the evaluation to the Executive Board will contribute to
accountability, but the primary objective is learning from experience. The evaluation
objective is to provide an evidence-based, independent assessment of performance
of the CP so far so that WFP and programme partners can adjust course as necessary
for the remainder of the Programme term and to inform any future programme
design.
2.C Scope
17. The evaluation will cover CP 10418 from its start (1 Jan 06) until end August
2009. It will include all activities (planned and actual) in the three northern regions.
The Evaluation Team will also need to consider information from the programme
design phase (e.g. assessments, correspondence between WFP and Government of
Ghana, electronic discussion prior to the Programme Review Committee).
Information from even earlier years may also be relevant to understanding the
context and underlying factors behind performance.
2.D Evaluation Questions/Content
18. The Evaluation Report template from the OEDE Evaluation Quality Assurance
System (EQAS) presents all the issues to be systematically addressed by the
evaluation
3. Evaluation Method
3.A. Evaluation Assessment
19. The Logical Framework in the Project Document differentiates between national
level goals, the UNDAF intended outcomes and CP outcomes, but does not explicitly
link them. Nor does it make explicit the chain to WFP strategic objectives, although
this is mentioned in the Project Document text and has since been developed in the
Standard Project Reports. Outcome and output indicators are provided. It should
therefore be possible for the evaluation team to construct a logical framework.
20. The evaluation will use Standard Project Reports and other data compiled by the
Country Office up to the latest monitoring cycle, as listed in the Log Frame of the
Project Document124. The Country Office also has annual baseline reports on nutrition
indicators. The list of sources for verification of indicators of the UNDAF outcomes is
contained in the UNDAF itself and will be used, where relevant. Other secondary
information sources may be used as necessary and available. Examples include: the
CFSVA 2009 and Impact Assessment of the Effect of the Global Financial Crisis, 2009
(see Annex 1). The reliability of base data will be assessed as part of the preparatory
phase.
3.B. Evaluation Approach
21. Programme theory and mixed methods. The evaluation will take a
programme theory approach and logical framework. In view of the issues mentioned
in Section 3.A above, the team may need to reconstruct the Log Frame and verify
with the CO. The evaluation will use mixed methods, combining quantitative and
124Among these, data for Country Programme outcome indicator (2.e) on teacher‘s perception of children‘s ability to concentrate was not collected (Standard Project Report 2008).

58
qualitative data. It will draw on the existing body of documented data as far as
possible and triangulate this with information to be collected in the field. The
methods used will include:
- extensive review of documents and data: as a first step in the preparatory
phase, the team will analyse as much of the relevant secondary data (qualitative and
quantitative) as can be gathered in advance. This will include information specific to
the outcome and output indicators and information concerning the risks and
assumptions in the Log Frame – i.e. the context. The results of the document review
– though not conclusive - will be presented in the Pre-Mission Report. This will enable
the team to identify where there are information gaps in the process of answering
the evaluation questions (Annex 4). From that the team will identify the lines of
enquiry to be pursued during the field work phase, the verifiable indicators to
respond to the gaps and the method that will be used to obtain the data.
- in-country semi-structured interviews and focus groups: on the basis of the
document review and consultation with the Country Office, the evaluation team will
prioritize the internal and external stakeholders to be interviewed, either individually
or in focus groups (depending on numbers in the category and availability). This
should Endeavour to ensure that a wide cross-section of stakeholders is able to
participate so that a diversity of views is heard and gathered – including from
stakeholders who were intended to have a significant role in implementation, but
have not in fact had one (see Section 1.C above). Methods used for gathering views
of WFP programme staff will be designed to maximize opportunities for participation.
- Observation during field visits
22. The evaluation team will develop selection criteria for stratified sampling of sites
to visit to ensure as representative a selection as possible of WFP activity and
recognising the difference between intended and actual stakeholders. These criteria
will be presented in the Pre-Mission Report. The evaluation will also seek data to
provide some comparison of performance in districts covered by the Programme with
districts not covered and the national average.
23. Individual interviews will be semi-structured. Participatory focus groups with past
and present beneficiaries as well as non-beneficiaries will be held in the field to
gather their views on the extent to which the Programme is achieving its objectives
and addresses their needs. For Activity (ii) ‗school meals‘, parents of beneficiaries
will be consulted.
3.C. Phases and Deliverables
24. Design phase. This period is dedicated to consulting stakeholders, identifying
the consultants, and preparing the TOR, the evaluation budget, and the job
descriptions for each evaluation team member. Consultation with stakeholders
(mainly the Country Office) on the TOR is intended to arrive at a common
understanding on the objective and scope of the evaluation and the approach to be
followed. In line with EQAS, the quality of the TOR will be checked by the Director of
the Office of Evaluation before final approval.
25. Preparatory phase. The first step of the evaluation process is a desk review of
documents. This will be captured in a pre-mission report under the responsibility of
the Team Leader and according to an EQAS template (see Annex 4). The purpose of

59
the Pre-Mission Report is to: (i) present the preliminary findings of the desk review
and identify information gaps; and (ii) present the approach/methodology that the
evaluation will use to fill the information gaps during the field mission. This phase
also includes briefing of the evaluation team by the Evaluation Manager (in Rome or
Ghana).
26. Evaluation field mission. Field work will be undertaken in country, both in the
capital and the operation areas. It consists of three main steps:
Briefing: the mission will start with a meeting with the Country Office to
discuss the Pre-Mission Report and to brief other core stakeholders (from
Government, UN and NGOs);
Data collection: as proposed in the methodology section above and refined
in the Pre-Mission Report. At least half the mission should be spent in the
field;
Debriefing: at the end of the field mission the evaluation team will present a
summary of key findings and preliminary conclusions in an Aide-Memoire to
the Country Office. Key stakeholders from Headquarters and the Regional
Bureau will be invited to participate by teleconference.;
Reporting phase. The findings are brought together in a succinct evaluation
report, using an EQAS template (see Section 2D above). It will respond to the
objectives and questions of the evaluation and conclude on the five standard
evaluation criteria.
Workshop: the Team Leader will present the main findings and conclusions
as well as draft recommendations in a workshop with key stakeholders from
the WFP Country Office and implementing partners. The purpose would be for
participants to give feedback on the findings and conclusions and elaborate
further the recommendations to ensure that they are realistic and actionable
in the remainder of the Operation‘s term. Key stakeholders from
Headquarters and the Regional Bureau may participate at their own expense.
The quality of the material to be presented will be checked by OEDE prior to
the workshop. The evaluation report will be finalised after the workshop.
Again, the quality will be checked by OEDE prior to it being shared with
stakeholders for comments.
27. Management response phase. Under the coordination of the Performance and
Accountability Management Division and subject to clearance by the Executive
Director, those responsible for management of the CP provide a written response to
the evaluation recommendations. This will be presented as a separate document to
the WFP Executive Board at the same time as the evaluation report.
28. Presentation/dissemination phase. The summary report and the
management response will be presented at the WFP Executive Board at the same
time as any new project. Lessons learnt from the evaluation will be shared with
colleagues as appropriate.
29. Templates for the various outputs are at Annex 4.
3.E. Evaluation Quality Assurance System
30. WFP has developed an Evaluation Quality Assurance System (EQAS) based on
the UNEG norms and standards and good practice of the international evaluation

60
community (ALNAP and DAC). It sets out process maps with in-built steps for quality
assurance and templates for evaluation products. It also includes checklists for
feedback on quality for each of the evaluation products including the TOR. All these
tools are available with OEDE. EQAS will be systematically applied during the course
of this evaluation and relevant documents provided to the evaluation team.
31. The evaluation team will ensure a systematic check on the accuracy, consistency
and validity of data and information it collects.
Table 2 Phases, Milestones and Deliverables for the Evaluation
Phase Timing Expected Outputs
1. Design Phase July-September 2009 Terms of Reference Team recruited
2. Preparatory Phase Desk review & preparation of field visits
15 October to 6 November 2009
Pre-Mission Report
3. Evaluation mission 16 November to7 December 2009
Initial briefing of core stakeholders 18 November
Field interviews and data collection 16 November to7 December 2009
Debriefing at Country Office 7 December Aide-Memoire of preliminary findings
4. Reporting Phase 8 December 2009 to 5 March 2010
Draft report 25 January 2010 Draft Report for OEDE quality clearance
Stakeholders workshop in Ghana 10 February 2010 (TBC) Presentation of team findings, conclusions and draft recommendations
Further elaboration of recommendations.
Completing report 9-12 February Evaluation Report (Final Draft)
Other stakeholder comments 15-28 February Comments Matrix
Finalising report By 5 March 2010 Evaluation Report (final)
5. Management Response March 2010 Management response
6. Presentation/ dissemination Executive Board
June 2010 Presentation of Evaluation Report & Management Response
Follow-up action 3.F. Budget
32. The evaluation costs will be covered by OEDE‘s PSA budget for operations
evaluations. A sum of US$100,000 has been budgeted.

61
4. Organisation of the Evaluation
4.A. Stakeholders in the Evaluation
33. The Country Office is responsible for:
Providing the evaluation manager and the evaluation team with all
information necessary to undertake the evaluation, or access to it;
Being available to the evaluation team to discuss the programme.
34. Logistical support to the mission while in Ghana, including providing transport
and arranging meetings in Accra and field visits and translation as necessary.
35. WFP stakeholders in the Regional Bureau and Headquarters will also be key
informants to the evaluation, consulted and kept informed as appropriate to their
respective field of expertise and/or role in the CP, whether technical or other
(including the Performance and Accountability Management Division, OEDAM).
36. Stakeholders external to the evaluation will be involved in the ways described in
the last column of the Stakeholder Map at Annex 3 and Section 3.B Methodology
(above).
4.B. Evaluation Team
37. The evaluation team will comprise the team leader and two other team
members, all externally recruited. Together, the team will combine complementary
expertise in food security, economics, child and maternal health and nutrition,
gender and institutional capacity building for large-scale feeding programmes and of
small-scale farmers‘ groups for community-based supply of semi-processed
foodstuffs. Together they will have a good working knowledge of Ghana and the
West Africa region as well as of WFP and of wider development programmes. The
team leader will have extensive evaluation skills and experience as well as leadership
skills. The team leader and at least one team member will have international
experience and are likely to be internationally recruited.
38. The Team Leader is responsible for consolidating team inputs and for timely
submission of the various evaluation reports. Team members report to the Team
Leader. Full job descriptions for each team member are at Annex 5 (in
development).
4.C. OEDE
39. The evaluation will be managed by Sally Burrows, Senior Evaluation Officer,
OEDE. She is responsible for managing the evaluation process and reports to the
Director, OEDE. The Evaluation Manager‘s tasks include:
Preparation of terms of reference;
Selection and recruitment of evaluation team;
Budget preparation and management;
Evaluation team briefing;
Preparation of field mission together with the CO focal point;
Quality assurance;
Consultation with major stakeholders on evaluation outputs/reports;
62
Dissemination of reports;
Main interlocutor between the evaluation team and WFP.
4.D. Communication
40. All evaluation documents will be written in English. Communication methods and
milestones are listed under Section 3. The evaluation report will be publicly available.
The results will be incorporated into OEDE‘s new lessons sharing system, once it is
established (to come on stream in 2009) to ensure that lessons will be accessible to
users in and outside WFP.
63
Annex 2 Evaluative methodology The WFP Ghana CP Evaluation used a mixed method and RBM approach to measure
the performance (outputs and outcomes, degree of achievement), relevance and
appropriateness, efficiency, effectiveness, sustainability and to a lesser extent the
impact. The evaluation team explored the intended and planned strategies contained
in the CP, the shifts in these strategies, the factors which led to these shifts and the
actual outcomes that were realized. A strong synergy was created between methods
including secondary source data analysis, documentary review and interviews with
key stakeholders, along with field observation and beneficiary assessment methods.
The Evaluation maintained an independent approach and at the same time facilitated
workshops with staff at the national and sub national level to interact and reflect on
the CP achievements, challenges and way forward.
Emphasis was placed on investigating the WFP‘s CP relevance and appropriateness to
the needs of the people and within the current Ghana Government policy context;
the efficiency of CP implementation and the targeting strategies; the effectiveness of
the CP in relation to reaching vulnerable groups, meeting WFP‘s corporate objectives
and the degree of sustainability and connectedness of the CP in relation to the
outcomes. Much less emphasis was placed on the impact, particularly given that the
CP has at least one more year to complete its cycle before impacts can be properly
measured.
The evaluative logic model was based on a results based approach and a results
matrix with key indicators for all levels of the results hierarchy. The WFP logic model
was clearly articulated within the CP action plan in which targets and indicators were
used to measure the performance of the CP and its potential outputs, outcomes and
eventually impact. The preliminary work was carried out by WFP OEDE and the WFP
Ghana offices in order to prepare the data related to outputs which helped in the
efficient analysis of output indicators in the logic model. A small research team
began work on collecting information related to the key output and outcomes
indicators for the CP in early October. (See Annex 8 and 9 for the logic model).
The Evaluation Team extended the performance assessment in relation to the CP
results matrix beyond national and regional level to ensure that more data is
gathered on a district basis to gain a more complete picture of the outcomes to date.
The district level analysis was intended to review trends across the four year period
(2005-2009) particularly in food insecure and WFP high intervention districts in the
North, and compare these to WFP lower intervention districts.
Data Collection Strategy: A rigorous review of this baseline data has been carried
out by the international consulting team along with the in-country Ghana research
team. Output to outcome data was relatively easy to collect related to some key
indicators in education but more challenging in the nutrition sector. A review of
secondary data was extensive thanks to the support from OEDE and the Country
Office who together prepared an extensive list of Ghana documentation (see Annex 2
for full bibliography) and made all the documents available to the Team early in the
evaluation exercise.
Secondary Data Trend Analysis: While the International Team was in the field,
there was ongoing analysis from secondary data of trends relation to education and
nutrition outcomes, based on the key indicators in the CP results matrix. These
64
include enrolment, Gender Parity Index (GPI), and transition to JSS and SSS. Both
Government and WFP sources were used, including the Education Monitoring and
Information systems (EMIS), MICS and DHS data. District level data was already
collected from the MICS study and was reviewed by the nutritionist in order to see
the degree to which it can be used to track malnourishment trends in the evaluative
districts.
The Team used an evaluative methodology which involved a high degree of
interaction with Country Office staff, key stakeholders, district and community
implementers and beneficiaries in a spirit of appreciative enquiry to facilitate the
collective analysis of the achievements to date. One stakeholder workshop was held
with the staff at WFP, key government counterparts and other key collaborators such
as UN agencies and other development partners. In-depth interviews were carried
out with key WFP staff and collaborators. A full day of meetings at the regional level
in Tamale was also organized beginning with the regional WFP staff including WFP
regional monitors with the government counterparts and the selected WFP
collaborators (key NGOs and UN agencies).
District level interviews included: interviews with key district health and nutrition
staff, district education staff and the district assembly members involved in the GSFP
and the WFP school feeding and Activity 1 interventions. The WFP Ghana office
prepared district level stakeholders to participate in these focal group meetings the
first day of the field work in each district (see Annex 7 for itinerary and list of people
met). Community level field work included four types of interviews where possible:
focal group interviews with chiefs and/or opinion leaders (community assembly man,
prominent elders including the women‘s leader; this served as an entry point). In
communities where there are school feeding activities by the WFP and or the GSFP,
the team conducted a focal group interview with the Head teacher and teachers and
boys and girls at upper primary school children (separately). Observation of the food,
food stuff and storage in the school was conducted as well as interaction with the
school feeding cooks and matron.
In communities where there was a nutrition and health centre operational on the
day: the Team held focal group discussions with the health assistants, pre-school,
nutrition centre attendants and other staff, and used observation tools to record the
status of the health centre. Most importantly a focal group discussion with the
women attending the nutrition and health centre was also conducted. Finally, in
communities where a farming group exit, a focal discussion was organized with the
women‘s and men‘s farmers groups.
Sampling Method for Site Visits
A master list of all the WFP Ghana intervention communities on a district basis was
developed and used to assist the Team conduct final field site selection. The districts
were selected based on a review of the VAM, food security mapping and WFP
international maps developed during the 2006 CP. These maps helped to assist the
Team select the preliminary districts which were used for both education/nutrition
trend analysis and the field visits. The criteria used for district selection included the
following:
Food security status based on the VAM (2004) and the Comprehensive Food
Security and Vulnerability Assessment (2009);
High and low intervention levels of WFP Activity 1 and Activity 2;

65
Length of time WFP was present in a district;
Presence or absence of WFP supported/facilitated farmers‘ groups (key to the
CP sustainability strategy);
Targeted UN districts for synergy between WFP and other UN agencies (e.g.
reducing GPI in northern Ghana with UNICEF, WHO and FAO). See Annex 7
for details of districts selected.
The criteria used to select communities included sites which were ―active or non
active‖ WFP intervention communities in order to see the degree of sustainability
once WFP phased out. The degree of intervention was also taken into consideration
by analyzing whether WFP communities had one, two or three activities (e.g. CHNC,
Take Home Ration (THR) and School Feeding) present and whether these activities
were scaled up and whether the intended synergy between Activity 1 and Activity 2
components was achieved. The Team is also allowed for some degree of flexibility in
site selection once at the district level in order to see Activity 1 activities in situ such
as the health and nutrition meetings with mothers. We will also attempt to select
communities which have benefited and phased out of take home rations and have
JHSs in order to see the transition impact from primary to JHS. Community selection
was based on the following typologies which emerged from the review of the data:
Type 1 Communities: Best sustainability case potential: usually phased out
communities, existence of nutrition centres and education activities but children have
moved to the JHS level and no longer in primary school; existence of farmers‘ groups
which were linked by WFP to NGOs for support125.
Type 2 Communities: Active WFP intervention communities having all the three
activities (nutrition/health activities (CHNC), THR and School Feeding implemented
by WFP through the Ghana Education Service126). Have been active for the last 3 to 4
years or more. This will be selected in the field at district level in order to ensure that
nutritional activities and school feeding can be observed on that day. The selected
community may be compared to non WFP sites in the area.
Type 3 Communities: Active Ghana School Feeding Communities with collaboration
by WFP (3 days per week) and have been active with the GSFP for at least the last 2-
3 years127. May not have other WFP activities or be low in intervention.
Type 4 Communities: Communities that are located in the same areas but do not
have any WFP or GSFP activities. Here we will be looking out for unforeseen
outcomes of WFP programme interventions in neighbouring communities (e.g. school
children moving from their communities to join WFP assisted schools etc). We will
also be looking for indigenous approaches to food security and livelihood strategies.
The final selection of districts was based on their ability to provide a rich context to
explore the issues of CP performance, effectiveness and sustainability. All 3 priority
districts for field work were involved in the WFP programme interventions over the
last ten years (current and previous CPs). The selected districts had a high level of
125Some of these communities may not have fully phased out based on interviews with Country Office staff but have been in the WFP support since the first country programme (over 10 years supported). 126There are about 200 of these School Feeding programme schools implemented directly by the GES with WFP support. Ideally selected communities would have had other activities such as the THR or nutrition programming for over four years. 127There were 79 GSFP schools supported through GOG and WFP collaboration since 2006 when the CP began.
66
WFP intervention in comparison to other districts around them. They were also
considered priority districts for achieving Gender Parity and decreasing levels of
malnourishment128. Two of the three districts selected for the evaluation were target
districts for UNICEF and WFP collaboration (i.e. Savelugu and Kassena Nankana).
Finally, several of the initial 60 women‘s groups which were supported to achieve
income generation activities to support WFP initiated nutrition and education
activities were also found in these districts and Type 1 Communities have been
selected based on this. Finally, 2 of the 3 districts have continued to experience
severe/high rates of food insecurity (Sissala East and Kassena Nankana).
128Kassena Nankana has been selected for the Tackling Malnourishment Campaign with UNICEF.
67
Annex 3 Bibliography and documents reviewed by the
evaluation team WFP project documents and reports
WFP, Project Document CP-Ghana (2001-2005).
WFP, 2005. Project Document CP-Ghana 10418.0 (2006-2010), WFP/EB.2/2005/7-
A/3.
WFP and the Government of Ghana. ―CP action plan (2006-2010) for the Programme
of Cooperation between the Government of Ghana and the WFP‖
Standard Project Report. 2008.
Standard Project Report. 2007.
Standard Project Report. 2006.
Standard Project Report. 2005.
Resourcing Update. 2009.
WFP. 2006. Operational Brief on CP.
WFP and the Government of Ghana. 2009. ―Comprehensive Food Security and
Vulnerability Analysis‖ (CFSVA). Supplementary Feeding, Health and Nutrition
Education (Activity 1) Quarterly Reports 2006-2009.
WFP Support to Basic Education 2006-2009.(activity 2) quarterly reports.
Assessments and surveys
Brinkman, H-J., Bauer, J-m, & Mahama, A. 2009. ―Assessing the Impacts of the
Global Economic and Financial Crisis on Vulnerable Households in Ghana”, WFP.
Biederlack, L. and J.Rivers. 2009. ―Comprehensive Food Security and Vulnerability
Analysis, Ghana”, WFP, Rome.
Djurhuus, Kara. 2006. Operationalizing Development Linkages in Food
Production/Income Generating Activities in WFP Assisted Communities in Northern
Ghana, WFP.
Economic Research Service/USDA. 2005. Making Strides in Achieving Food
Security: “The Cases of Ghana, Peru and Vietnam, Food Security Assessment‖, GFA-
17.
Government of Ghana. 2006. Multiple “Indicator Cluster Survey”
Kolbjornsen, N. and E.Heines. 2007. Mother and Child Health: A Review of the
Ghana “Supplementary Feeding And Health And Nutrition Education” Activity in the
CP.
Kolbjornsen, N. and E.Heines. 2007. Mother and Child Health: A Consolidated
Report of the Mother and Child Health Fact Finding Missions conducted in Ethiopia,
Cuba, Sri Lanka and Ghana.
SEND, Ghana. 2009. Challenges of Institutional Collaboration: An Assessment of the
State of Complementary Services in the Ghana School Feeding g Programme, Policy
Brief No.2.
WFP, 2008. Final report on the Iodine Initiative 2006-2008 – implemented in
collaboration with the Micronutrient Initiative, Canada.
Asamoa-Tutu, P. 2008. Comparative study of the impact of HIRD and
complementary feeding programme on child nutritional and health status, WFP.
GHS/WFP. 2006. Supplementary Feeding, Health and Nutrition Education
Programme, Report on a Baseline Survey.
GHS/WFP. 2007. Supplementary Feeding, Health and Nutrition Education
Programme, Report on Follow Up Baseline Survey.
GHS/WFP. 2008. Supplementary Feeding, Health and Nutrition Education
Programme, Report on Follow Up Baseline Survey.
68
GHS/WFP. 2009. ―Supplementary Feeding, Health and Nutrition Education
Programme”, Report on Follow Up Baseline Survey.
Ghana Statistical Service and UNICEF. 2009. ―Ghana High Impact Rapid Delivery”
(HIRD).
Supplementary Survey (District MICS). 2007. “Monitoring the situation of children
and women, Upper West Region”.
Ghana Statistical Service and UNICEF. 2009. ―Ghana High Impact Rapid Delivery”
(HIRD).
Supplementary Survey (District MICS). 2007. “Monitoring the situation of children
and women, Upper East Region”.
Ghana Statistical Service and UNICEF. 2009. ―Ghana High Impact Rapid Delivery”
(HIRD).
Supplementary Survey (District MICS). 2007. “Monitoring the situation of children
and women, Northern Region”.
Documents Related to Programme design phase:
CP appraisal mission report. 2004. (H)
WFP/Hannusch, D. 2004. Food Aid Review, Ghana: Past Experiences and Future
Options and VAM Study (H)
Gariba Development Associates. 2006. Food and Nutrition Assistance In Ghana:
From Food Aid to Sustainable, Locally-grown Food and Nutrition Assistance, Final
Draft Strategy.
RBM Impact Assessment of the SFHNE Programme in 2004 (H).
Self-Evaluation of support to Girls Education in previous CP, 2004 (H).
WFP PPT presentation on ‗From Food Aid to Food Assistance‘ in Ghana.
National plans and policies (context)
Republic of Ghana. 2006. ―Growth and Poverty Reduction Strategy II” 2006-2009
(H).
Republic of Ghana, Ministry of Food and Agriculture. 2008. Agricultural Growth,
Poverty Reduction and Food Security: ―Past performance and prospective outcomes‖,
http://www.mofa.gov.gh/CAADAP%20 Brochure 2.htm1.
World Bank, Republic of Ghana. 2006. Joint IDA-IMF Staff Advisory “Note of the
Growth and Poverty Reduction Strategy”
Centre for Economic Policy Analysis and Institute for Policy Alternatives. 2008.
Sustainable Development Initiative for Northern Ghana – “Strategy and Workplan
2009-2025”, (1st draft), commissioned by Republic of Ghana Health Sector
Programme of Work 2002-2006.
Republic of Ghana. Ministry of Education. 2003. ―Ghana Education Strategic Plan
2003-2015 Vols.1 and 2” (H).
Republic of Ghana, Ministry of Food and Agriculture. 2007. ―Food and Agriculture
Sector Development Policy (FASDEP) II” (H)
Agriculture Sector Plan 2009-2015.
GHS. 2007. ―National Infant and Young Child Feeding For Ghana Strategy Document”
GHS. 2005. Community-based Health Planning and Services (CHPS), “The
Operational Policy”, GHS Policy Document No.20.
GHS. 2004. Imagine Ghana Free of Malnutrition, “A concept paper for addressing
malnutrition in Ghana as a developmental problem using health as an entry point”.
GHS DGSI. Document No.2.
69
UN and other donor assistance strategies
United Nations Country Team, 2005, UN Development Assistance Framework
(UNDAF) for Ghana 2001-2005.
United Nations Country Team, 2005, UN Development Assistance Framework
(UNDAF) for Ghana 2006-2010.
World Bank/IDA. 2007. Country Assistance Strategy for Ghana FY08-11 Joint
Assistance Strategy (for reference as necessary).
WFP Corporate Policies and Guidelines
WFP. 2009. Strategic Results framework.
WFP. Strategic Plan 2008-2011
http://www.wfp.org/content/wfp-strategic-plan-2008-2011
WFP. 2006-2009. Strategic Plan
WFP. 2008. Consolidated Framework of Policies (for reference, as necessary)
WFP. 2001. Food and Nutrition Handbook
Signed Policy Decision on Nutrition Improvement Strategy Sept.09
New Directions
Bundy, D., C.Burbano, et al. 2009. Rethinking School Feeding: “Social Safety nets,
Child Development, and the Education Sector” World Bank Group Directions in
Development Series, Human Development ISBN 978-0-8213-7874-5.
Online: http://docustore.wfp.org/stellent/groups/public/documents/newsroom/wfp204667.pdf
Espejo, F., Burbano, C., & Galliano E. 2009. Home-Grown School Feeding: “A
Framework to Link School Feeding with Local Agricultural Production”. WFP.
Online: http://documents.wfp.org/stellent/groups/public/documents/newsroom/wfp204709.pdf
FAO Media Centre. 2009. ―Supporting Ghana‟s fight against hunger‖. http://www.fao.org/news/story/0/item/12270/icode/en/ WFP. 2009. ―WFP School Feeding Policy” WFP/EB.2/2009/4-A.
Online: http://one.wfp.org/eb/docs/2009/wfp208224~1.pdf
WFP. Ability and Readiness of Nations to Reduce Hunger: ―Analysing economic
capacity and governance structures for hunger reduction‖, by Getachew Diriba,
Coordinator, Cooperation and Partnership Programme. (Preliminary Draft Nov 2009).
WFP, Ghana 2009. “Investing in Small Scale Farmers to Meet the Education and
Nutrition Needs of Food Insecure Children in Ghana”, proposal submitted to the Bill
and Melinda Gates Foundation.
USDA Foreign Agricultural Service, 2009, Comprehensive Assessment Report:
“Assessment of Local Production for School Feeding in Ghana, Kenya, Mali and
Rwanda”. Report prepared for the Bill and Melinda Gates Foundation.
USDA Foreign Agricultural Service. 2009. ―Assessment of Local Production for School
Feeding in Ghana”. Report prepared for the Bill and Melinda Gates Foundation 1-12
June.
WFP. 2009. ―Experiences in Partnership between WFP and the Government of Ghana
for Capacity Development, Cooperation and Partnership Programme” (OMXC).
Ghana Country Analysis
Adams, R, Cuecuecha, A & Page, J. 2008. ―The Impact of Remittances on Poverty
and Inequality in Ghana‖, World Bank Policy Research Working Paper No.4732.
Centre for Economic Policy Analysis (CEPA) and Institute for Policy Analysis (IPA),
August 2009, “Sustainable Development Initiative for Northern Ghana – Strategy and
Work Plan” (2009-2025).
Cudjoe,G, Breisinger, C and Diao, X. 2008. Local Impacts of a Global Crisis: ―Food
price increases and poverty impacts in Ghana”, IFPRI Discussion Paper No. 842.
70
Government of Ghana: Ghana School Feeding Programme Partners Conference
Proceedings and Presentations (December 16-17th, 2009).
Government of Ghana, Ministry of Food and Agriculture (2007), ―Agriculture in
Ghana: Facts and Figures”.
Government of Ghana, 2007, Ghana School Feeding Programme: ―District Operations
Manual‖.
Government of Ghana (Ministry of Food and Agriculture), 2007, “Food and
Agriculture Sector Development Policy” (FASDEP) II.
SEND, Ghana, 2009, ―Challenges of Institutional Collaboration: An Assessment of the
State of Complementary Services in the Ghana School Feeding Programme”, Policy
Brief No.2.
WFP, 2008, “Lessons from working with smallholders in Ghana: Strengthening
smallholders‟ capacity to connect to WFPs maize supply chain”.
Bower-Pirinis, T. 2008. Handover Notes for period 1 January 2003 - 13 June 2008.
Country Director/Ghana.
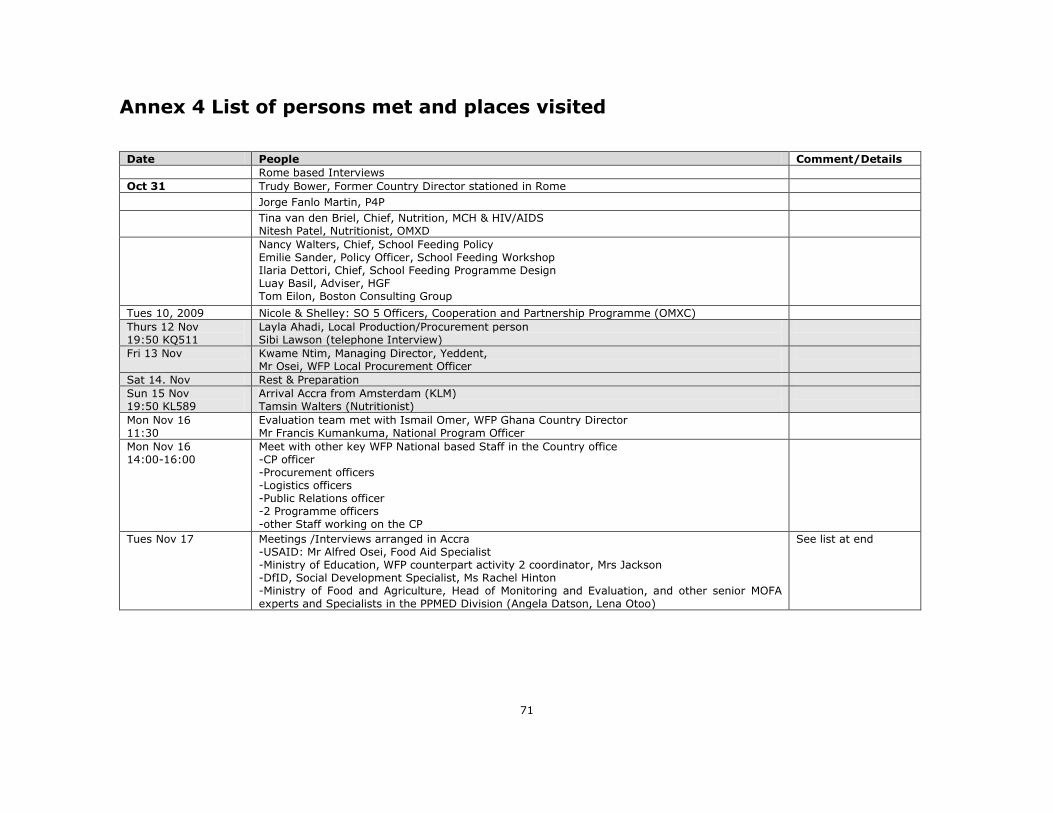
71
Annex 4 List of persons met and places visited
Date People Comment/Details
Rome based Interviews
Oct 31 Trudy Bower, Former Country Director stationed in Rome
Jorge Fanlo Martin, P4P
Tina van den Briel, Chief, Nutrition, MCH & HIV/AIDS Nitesh Patel, Nutritionist, OMXD
Nancy Walters, Chief, School Feeding Policy Emilie Sander, Policy Officer, School Feeding Workshop Ilaria Dettori, Chief, School Feeding Programme Design Luay Basil, Adviser, HGF Tom Eilon, Boston Consulting Group
Tues 10, 2009 Nicole & Shelley: SO 5 Officers, Cooperation and Partnership Programme (OMXC)
Thurs 12 Nov 19:50 KQ511
Layla Ahadi, Local Production/Procurement person Sibi Lawson (telephone Interview)
Fri 13 Nov Kwame Ntim, Managing Director, Yeddent, Mr Osei, WFP Local Procurement Officer
Sat 14. Nov Rest & Preparation
Sun 15 Nov 19:50 KL589
Arrival Accra from Amsterdam (KLM) Tamsin Walters (Nutritionist)
Mon Nov 16 11:30
Evaluation team met with Ismail Omer, WFP Ghana Country Director Mr Francis Kumankuma, National Program Officer
Mon Nov 16 14:00-16:00
Meet with other key WFP National based Staff in the Country office -CP officer -Procurement officers -Logistics officers -Public Relations officer -2 Programme officers -other Staff working on the CP
Tues Nov 17 Meetings /Interviews arranged in Accra -USAID: Mr Alfred Osei, Food Aid Specialist -Ministry of Education, WFP counterpart activity 2 coordinator, Mrs Jackson -DfID, Social Development Specialist, Ms Rachel Hinton -Ministry of Food and Agriculture, Head of Monitoring and Evaluation, and other senior MOFA experts and Specialists in the PPMED Division (Angela Datson, Lena Otoo)
See list at end

72
Wed Nov 18 UNICEF: Julianna Lindsey, Chief of Advocacy, Communications, Monitoring & Analysis, Maina Muthee Catholic Relief Services, Country Director Ghana (Vewonyi Adjavon) Technoserve: (Country Director) ) Nick Railston-Brown Ministry of Finance and Economic Planning (Head of UN Systems Unit and Donor Relations—Mr Augustus Kwasi Adu. Ministry of Local Government and Rural Development (Principal Planning Officer /Oversight to the GSFP)—Levina Owusu
Thurs Nov 19 Stakeholder meeting with key people identified by WFP country office (most of the key UN agencies in attendance including UNICEF, UNDP, FAO) Ministry officials from Ministry of Health, Ministry of Education, Ministry of Local Government and Rural development.
2nd Interview with WFP Country Director (Mr Ismail Omar) Interview with CP officer Francis Kumankuma
Preparation for the field by the team -finalization of the instrumentation and field work plan, logistics etc
Fri Nov 20 Ministry of Health, Ghana Health Service: Director General (Dr Elias Sory) Ministry of Health, GHS, Director/head of Nutrition Division (Mr Armah) Former National Activity Coordinator (Mrs Patricia Asamoah Tutu) Ghana School Feeding Programme, Acting Director of GSFP (Mr Kwame Nuako) UNICEF Nutritionist
Sat Nov.21 Travel to Tamale Evaluation Team: Leslie Casely-Hayford, Tamsin Walters, Michael Johnny, Rama Brew-Butler, Roland Akabzaa and Mark
In-depth interview with key WFP staff in Tamale office (Jamela and Margaret). In-depth interview with Key Government staff Activity 1 coordinator (Moses Timbilla)
Sun. Nov 22 Rest and site visit preparation Team Meeting to take final review of the itinerary, field guide.
Mon Nov 23 8:30 to 12:00
TAMALE: Half day workshop with Tamale-based WFP staff including field monitors Head of WFP sub office (Mr Ahmed) 2 Sub office based Programme Officer (Djamela and Margaret) 5 field monitors and regional monitors VAM officer Logistics Officers Procurement officers
Mon Nov 23 12:00 to 2:00
TAMALE: 2 hr meeting with regional Government of Ghana counterparts Ministry of Education Girls Education Regional Office Ghana School Feeding Regional Coordinator Ministry of Health, Activity 1 Coordinator (Moses) Regional Officer, Ministry of Food and Agriculture representative
Mon. Nov 23 14:00-16:00
TAMALE: Focal Group Meeting with Tamale-based WFP key stakeholders/ collaborators UNICEF, IFAD, New Energy, Catholic Relief Services, Opportunities International

73
Tues Nov 24
Upper East Team 1 and team 2: visit Kassena Nankana (District Office), Focal Group Discussion with heads of departments involved with the WFP implementation: Ministries of Food and Agriculture and Health, District Coordinating Director/ District Chief Executive, Budgeting officer, District Planning Officer. Meeting with the Regional Girls Education Officers (Director and staff responsible for WFP monitoring) In-depth Interviews with the following People
District Director of Education and key staff working on WFP/GSFP programming District Health /Nutrition Officers District Assembly: District Coordinating Director, School feeding focal person (GSFP) District Agriculture officers working on food security issues; Visit JSS schools /Interview teachers which have benefited from THR intakes.
Wed Nov 25 Upper East: Kassena Nankana : community 1 (Doba Community) Community Entry with the key community opinion leaders (Chief and Elders); Observation at the school/nutrition centre Interview in-depth with the Nutrition Centre attendants Interviews with Head teacher and teachers (Doba Primary and JSS) Focal group with Girl children (JSS 2 and 3) Focal group with nutrition centre female beneficiaries Focal group with parents/farmers groups (school management committee members at
Doba JSS) Farmers group at Chief‘s palace Nutrition Management Committee members Mothers group
Team 1 and Team 2 work together to harmonize understanding of the field guide and field work to ensure consistency.
Thurs Nov 26 Kassena Nankana: Community 2 (Kongwania Community) Nutrition Centre interview with attendants and observation note; Women‘s group meetings Observation at the school/nutrition centre Interviews with Head teacher and teachers at primary school Focal group with children (P5/P6)
Team 1 Leslie Casely-Hayford Rama Brew Butler Michael Johnny
Gayingo Primary School Students / head teacher (short visit to school which was nearby and lost children to the GSFP in the next village)
Thurs Nov 26 Kassena Nankana: Community 3 (Nyangania Community) Community Entry with the key community opinion leaders (Chief, elders, school
management committee members and several men in community attended); Observation at the school/nutrition centre Interviews with Head teacher and teachers Focal group with children (boys and girls separately interviewed in focal group (P5/P6) Focal group with nutrition centre female beneficiaries/ women‘s group and nutrition
management committee members Audit and interview with nutrition centre attendants; Community Health centre nurse Focal group with parents/farmers groups
Team 2 Tamsin Walters Rolland Akabzaa Mark

74
Fri Nov 27 Kassena Nankana: Community 4 (Kayoro Wuru Community Community Health Nurse interview and observation Community Entry with the key community opinion leaders (chief and elders); Women‘s group Interview with nutrition centre volunteer Focal group with parents/farmers groups
Team 2
Channa Community Women‘s group leaders (including the salt iodized rebagging group)
Fri Nov 27 Kassena Nankana: Community 5 (Nayagania Community) Community health nurse weigh in Mothers focal group interview; Observation at the WFP pre school/nutrition centre Interviews with teacher/nutrition attendant and women‘s leaders Focal group of girls at JHS 3 Focal group of girls at JHS2/3 Interview with head teacher and teacher
Team 1
Sat Nov 28 Full team reflection meeting on key findings to date and report writing on field visits; In-depth interview with WFP field monitor for the Upper East
Sun Nov 29 Team 1 travels to the Upper West Team 2 travels to the Northern Region
Mark flies back to Accra early Monday am.
Mon Nov 30 Upper West: Sissala East District
District entry and interviews District Director of Education and key staff working on WFP/GSFP programming District Health /Nutrition Officers District Assembly: District Coordinating Director, School feeding focal person (GSFP) District Agriculture officers working on food security issues; Visit JSS schools /Interview teachers which have benefited from THR intakes.
Team 1
Leslie, Michael and Rama
Mon Nov30 Northern Region : Savelugu District District Director of Education and key staff working on WFP/GSFP programming District Health /Nutrition Officers District Assembly: District Coordinating Director, School feeding focal person (GSFP) District Agriculture officers working on food security issues; Visit JSS schools /Interview teachers which have benefited from THR intakes.
Team 2: Tamsin and Rolland
Tues Dec 1 Sissala East District Community 6 Community Entry with the key community opinion leaders; Observation at the school/nutrition centre Interviews with Head teacher and teachers Focal group with children Interview with nutrition attendants Interview with nutrition centre management committee Focal group with nutrition centre female beneficiaries
Focal group with parents/farmers groups
Team 1

75
Tues Dec 1 Northern Region Team: Savelugu District community 7 Community Entry with the key community opinion leaders; Observation at the school/nutrition centre Interviews with Head teacher and teachers Focal group with children Interview with nutrition attendants Interview with nutrition centre management committee Focal group with nutrition centre female beneficiaries Focal group with parents/farmers groups
Team 2
Wed Dec 2 Northern Region Team: Savelugu District community 8 Community Entry with the key community opinion leaders; Observation at the school/nutrition centre Interviews with Head teacher and teachers Interview with nutrition attendants Interview with nutrition centre management committee Focal group with children Focal group with nutrition centre female beneficiaries Focal group with parents/farmers groups
Wed Dec 2 Sissala East Team: Community 9 Community Entry with the key community opinion leaders; Observation at the school/nutrition centre Interviews with Head teacher and teachers Interview with nutrition attendants Interview with nutrition centre management committee Focal group with children Focal group with nutrition centre female beneficiaries Focal group with parents/farmers groups
Thur Dec 3 Northern Region Team: Savelugu District community 10 Community Entry with the key community opinion leaders; Observation at the school/nutrition centre Interviews with Head teacher and teachers Focal group with children Interview with nutrition attendants Interview with nutrition centre management committee Focal group with nutrition centre female beneficiaries Focal group with parents/farmers groups
Thurs Dec 3 Sissala East District Team: Community 11 Community Entry with the key community opinion leaders; Observation at the school/nutrition centre Interviews with Head teacher and teachers Focal group with children Interview with nutrition attendants Interview with nutrition centre management committee Focal group with nutrition centre female beneficiaries Focal group with parents/farmers groups
Fri Dec 4 Upper West team travels to Tamale (8-10 hours)

76
Fri Dec 4 Northern Team finalises interviews with Activity 2 Coordinator, Ghana School Feeding programme Coordinator, CCFC Visit to the Ministry of Education and Ministry of Health Regional Warehouse Final Debriefing session with selected members of the WFP regional Tamale Sub office (5 staff including the Director)
Sat 5 Dec
Travel Tamale-Accra Leslie Casely-Hayford, Tamsin Walters, Michael Johnny, Rama Brew-Butler, (+ Roland Akabzaa) 10:30 to 4:00 Pm Final team reflection meeting with all the researchers; Departure Tamsin Walters (KLM) 22.00 KL 590
Sun 6 Dec 13.10
Departure Michael Johnny (Kenya Airways (1:00 PM)
Dec 15 Debrief Country Office

77
Annex 5 Methodology and evaluative results matrix
Results hierarchy Performance indicators Main Questions and Sources of Information.
Goal at National Level
Reduce poverty levels (GPRS)
Percentage of population below poverty line (US$1 per day) declines by 50% by 2010.
Annual economic growth averages 8% by 2010.
Ghana Living Standards Survey
UNDAF Outcomes
1.1 By 2010, the proportion of people, particularly those living in the most deprived districts, whose right to health is fulfilled, is increased.
1.i Malnutrition levels among pregnant and lactating women.
1.ii Malnutrition levels among children under five.
Already Analysed See the Results Matrix by Evaluative Researchers.
2.1 100% gross enrolment ratio and gender equity in enrolment, retention and completion achieved in basic education by 2010 in the most deprived districts.
2.i Gross enrolment ratio in basic education.
2.ii GPI in basic education.
2.iii Completion rates in basic education.
EMIS data sets (already collected currently being analysed across selected WFP districts)
3.1 Increased productive capacity for sustainable livelihoods, especially in the most deprived districts by 2010.
3.i Percentage increase in district assembly budgets for school feeding and day care and pre-schools.
Attempted during preliminary field visits;
More follow up needed in the three selected districts.
District Budget tool developed by team.
Results hierarchy Performance indicators Main Questions and Sources of Information.

78
CP Outcomes
1. Reduced level of malnutrition among at-risk pregnant and lactating women and children under five.
1.a Percentage of pregnant women gaining up to 12.5 kg during pregnancy.
1.b Percentage of lactating women with body mass index <18.5.
1.c Percentage of children under five who are underweight.
1.d Pregnant and lactating women‘s awareness and application of good nutritional practices.
MICS and Demographic Health Data set (collected at national level hoping to conduct district level analysis in the coming weeks).
2. Improved attendance and completion rates among schoolchildren in grades P1 to P6 and girls in JSS1 to JSS3.
2.a Annual percentage change in absolute enrolment.
2.b GPI for absolute enrolment in WFP target schools.
2.c Gender-specific attendance rate for PS and JSS.
2.d Gender-specific completion rate and GPI for PS and JSS.
2.e Teachers‘ perception of children‘s ability to concentrate and learn in school as a result of school feeding.
Collected on national and district level; ongoing district level analysis; need to add districts with low intervention levels of WFP activity.
Interview with head teacher and teachers, focal groups with children at upper primary and JSS.
3. Improved national capacity to implement and scale up supplementary feeding and on-site school feeding programmes.
3.a National, regional and district/community budgetary allocations to SFHNE and SBE programmes against WFP contribution.
3.b Share of VAM-identified vulnerable communities with government supported SFHNE and SBE programmes.
District Budget tool to be used when interviewing the District Assembly and budget officers; along with GSFP at regional levels;
Interviews with WFP staff; ongoing. Could select a few districts for analysis.
4. Increased demand for domestic farm produce in response to newly created school feeding market requirements.
4.a Tonnage and monetary value of food commodities procured locally by WFP.
4.b Number of farmers/farmers‘ groups supported through local purchase.
4.c Percentage of food procured by contracted processors from small farmers‘ associations.
4.d Farm household revenues from produce sales to the local food-procurement initiative.
Interviews with procurement people and WFP staff
Focal group interview with farmer groups at the community level;
Interviews with District level budget officers/GSFP;

79
CP Outputs
1.1. Participation of target population in food-supported nutrition intervention.
1.2. Staff and community capacity built and strengthened.
1.1.a Number pregnant and lactating women receiving dry rations.
1.1.b Number of children receiving wet rations.
1.1.c Micronutrient-fortified food distributed (mt).
1.1.d Number of health centres in programme.
1.1.e Number of women enrolled in health centres.
1.1.f Number of children enrolled in health centres and pre-schools.
1.1.g Number of health and nutrition education sessions offered per health centre per month.
1.1.h Number of women participating in health and nutrition education sessions.
1.1.i Number of pre-schools transformed into kindergartens under GES per year.
1.1.j Number of children enrolled in day care centres and pre-schools.
1.2.a Number of GHS staff trained in growth monitoring and HIV/AIDS prevention.
1.2.b Number of community members and centre attendants trained and qualified in growth monitoring, record keeping etc.
Mainly captured with SPRs and data from WFP already in the results matrix work;
Validation exercise at district and community levels (with nutrition evaluative tools)
District level interviews with key Ministry of Health staff; interview with Activity 1 coordinator;
Community level interviews with CHNC attendances
2.1. Food provided to schoolchildren.
2.2. Food provided to families as incentive to send girls to school.
2.3. Staff and community capacity built and strengthened
2.1.a Number of primary schoolchildren having received wet rations.
2.1.b Food distributed for wet rations (mt).
2.1.c Number of schools participating in school feeding programme.
2.2.a Number of girls in P4 to JSS3 having received dry rations.
2.2.b Food distributed for dry rations (mt).
2.2.c Number of schools in girl-child education programme targeted by WFP.
2.3.a Number of GES staff trained in monitoring and HIV/AIDS prevention.
2.3.b Number of PTA/SMC members and head teachers trained in school feeding management and record keeping etc.
Mainly captured using SPRs and EMIS data from the Ministry of Education already in the results matrix work;
Validation exercise at district and community levels (with education evaluative tools)
Interviews with the WFP staff GSFP personnel at national and district levels;
Interviews with GES staff and community PTA‘s and SMC members;
80
3.1. Beneficiaries participating through district assembly members in planning, implementing, monitoring and evaluating programme activities.
3.1.a Target communities‘ involvement in DC/PS; quantity and value of local contributions.
3.1.b Target communities‘ involvement in school feeding; quantity and value of local contributions to canteens.
3.1.c District assembly members and district coordinating directors trained with capacity for food procurement, management and distribution.
3.1.d Number of feeding days covered by government/community contributions for supplementary feeding.
Levels of Community participation the various activities:
Interviews with the Management of the nutrition centres and school feeding programmes (SMC's)
Interviews with opinion leaders and women‘s groups in the community;
Interviews with district assembly staff; particularly DCD and budget officers
4.1. Increased demand for farm produce through local procurement.
4.1.a Food commodities procured locally by WFP (mt).
4.1.b Farm produce procured locally by contracted WFP suppliers (mt).
4.1.c Total produce sales by targeted farmers‘ groups to the local food procurement initiative.
Interviews with WFP procurement officers,
Interview with private sector intermediaries and NGO‘s (e.g. Technoserve, Yedent etc)
Focal groups with Farmers in WFP and GSFP communities;

81
Other Technical Annexes
Annex 6 Key data collection tools included in the field guide
Research
Instruments/Tools
Purpose
Accra Based Interview schedule to raise issues n the interview; stakeholder map in the
TOR.
Community based Elders /Key opinion leader interview guide
Focal Interview schedule School Management Committee in charge of school feeding programme and
THR
Focal Interview schedule Community Health and Nutrition Centre Management committees;
School based
Interview schedule Focal group Discussion with Head teacher and teachers
Focal group discussion
schedule
Focal Group Discussion with Upper Primary school kids (6 girls and 6 boys
separately)
Observation tool Observation audit at school feeding
Nutrition Centre
Observation and Audit
instrument
Observation of health and nutrition discussions with the Ministry of Health
staff and women
Observation of children being fed;
Observation of the distribution of THR;
Interview schedule Interview with the health and nutrition /preschool attendants working at the
centre.
Focal group guide Focal group discussion with the women attending the Community health and
nutrition centre
Community based
Focal Group interview with the women or men‘s farming or income
generating group in the community
District based
instruments
Interview guide Interviews with the District Coordinating Director, budget officer and GSFP
officer
Interview guide Interview with head teacher and teachers at Junior Secondary Schools in the
District who have received intake from primary schools and who have
received THRs over the last two to three years. Interview with girls at JSS
level.
Interview with the Health and Nutrition Officers at District Level
Interview with the WFP field monitor
Ministry of Food and Agriculture Staff at the District level involved in food
security and feeding programmes
Matrons in change of aspects of Ghana School Feeding programme
implementation.
Interview guide Focal Group Discussions with Key people at the District Education Office
(District Director of Education, Girl Education Officer, School Feeding person
etc)
Regional Level Ghana School Feeding Programme Officers (Interview in Tamale and Upper
East)
Follow up meeting with key NGO and UN agency organizations expected to
work with WFP on CP implementation.
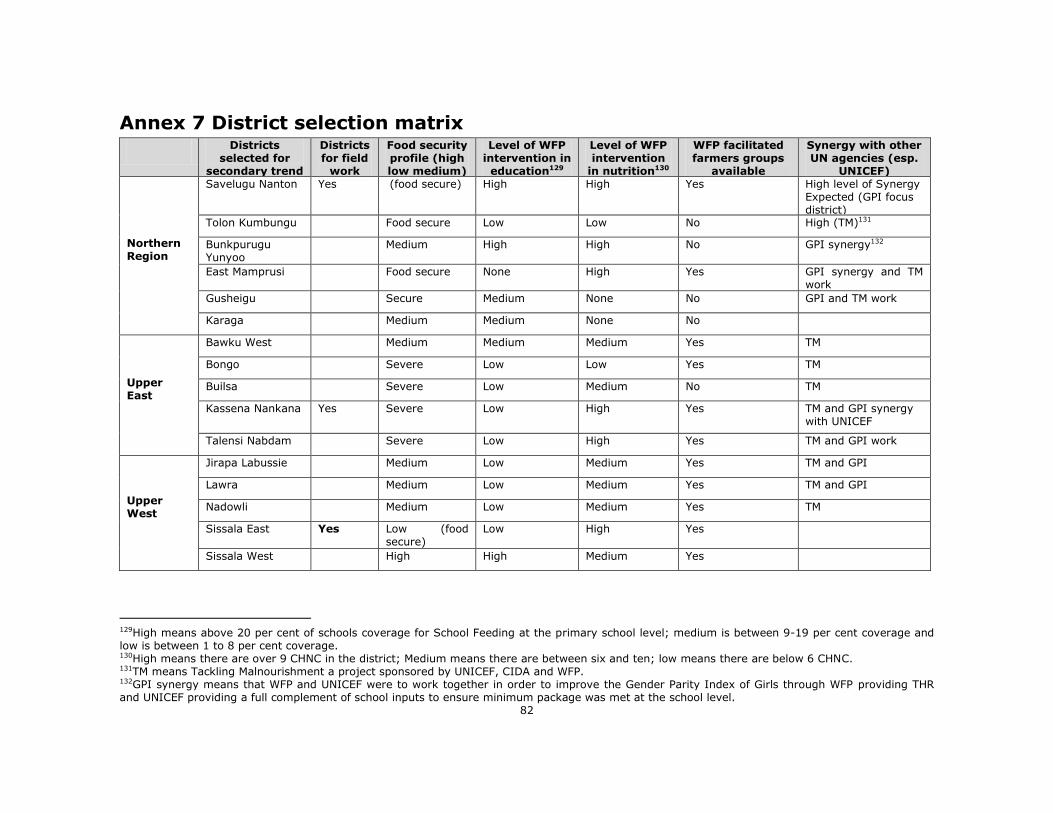
82
Annex 7 District selection matrix Districts
selected for secondary trend
analysis
Districts for field
work
Food security profile (high low medium)
Level of WFP intervention in
education129
Level of WFP intervention
in nutrition130
WFP facilitated farmers groups
available
Synergy with other UN agencies (esp.
UNICEF)
Northern Region
Savelugu Nanton Yes (food secure) High High Yes High level of Synergy Expected (GPI focus district)
Tolon Kumbungu Food secure Low Low No High (TM)131
Bunkpurugu Yunyoo
Medium High High No GPI synergy132
East Mamprusi Food secure None High Yes GPI synergy and TM work
Gusheigu Secure Medium None No GPI and TM work
Karaga Medium Medium None No
Upper East
Bawku West Medium Medium Medium Yes TM
Bongo Severe Low Low Yes TM
Builsa Severe Low Medium No TM
Kassena Nankana Yes Severe Low High Yes TM and GPI synergy with UNICEF
Talensi Nabdam Severe Low High Yes TM and GPI work
Upper West
Jirapa Labussie Medium Low Medium Yes TM and GPI
Lawra Medium Low Medium Yes TM and GPI
Nadowli Medium Low Medium Yes TM
Sissala East Yes Low (food secure)
Low High Yes
Sissala West High High Medium Yes
129High means above 20 per cent of schools coverage for School Feeding at the primary school level; medium is between 9-19 per cent coverage and low is between 1 to 8 per cent coverage. 130High means there are over 9 CHNC in the district; Medium means there are between six and ten; low means there are below 6 CHNC. 131TM means Tackling Malnourishment a project sponsored by UNICEF, CIDA and WFP. 132GPI synergy means that WFP and UNICEF were to work together in order to improve the Gender Parity Index of Girls through WFP providing THR and UNICEF providing a full complement of school inputs to ensure minimum package was met at the school level.

83
Annex 8 WFP Ghana CP education results matrix 2006–2010 Results hierarchy
Performance indicators 2006 2007 2008 Remarks
Goal at National Level Reduce poverty levels (GPRS)
Percentage of population below poverty line (US$1 per day) declines by 50% by 2010. Annual economic growth averages 8% by 2010.
2.1 100% gross enrolment ratio and gender equity in enrolment, retention and completion achieved in basic education by 2010 in the most deprived districts. (Primary)
2.i Gross enrolment ratio in basic education (Primary)
National 90.8 95.0 94.9
North 87.4 92.1 93.5
UE 92.1 96.9 94.1
UW 90.5 98.1 100.0
2.ii GPI in basic education. (Primary)
National 0.96 0.96 0.96
North 0.89 0.88 0.87
UE 1.02 1.00 1.00
UW 1.06 1.05 1.04
2.iii Completion rates in basic education. (Primary)
National 80.4 85.5 88.7
North 71.7 79.4 85.9
UE 70.7 78.9 85.1
UW 70.6 78.8 87.9
2.1 100% gross enrolment ratio and gender equity in enrolment, retention and completion
achieved in basic education by 2010 in the most deprived districts. (JHS)
2.i Gross enrolment ratio in basic education (JHS)
National 74.8 78.8 80.6
North 59.0 66.4 67.4
UE 57.7 63.1 67.8
UW 65.2 72.7 77.9
2.ii GPI in basic education. (JHS) National 0.91 0.92 0.92
North 0.8 0.80 0.82
UE 1.06 1.11 1.09
UW 1.04 1.06 1.08
2.iii Completion rates in basic education. (JHS)
National 62.8 67.7 88.7
North 46.8 55.4 85.9
UE 45.3 51.8 85.1
UW 49.9 55.7 87.9
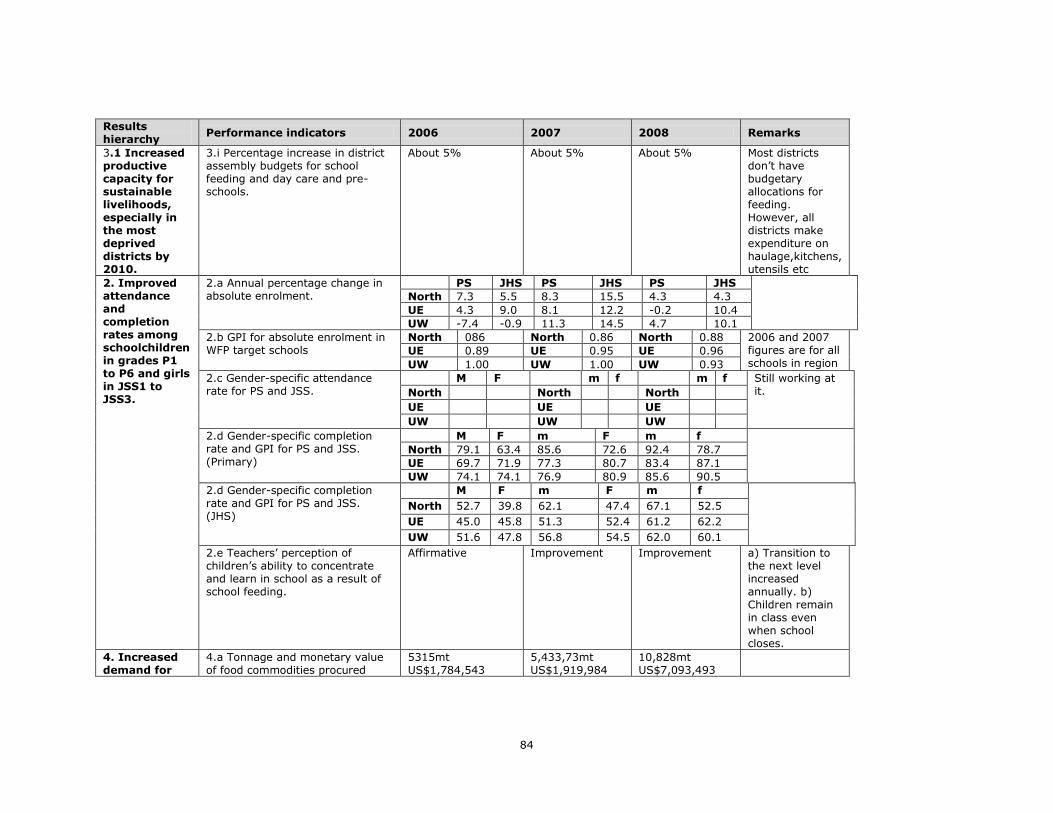
84
Results hierarchy
Performance indicators 2006 2007 2008 Remarks
3.1 Increased productive capacity for sustainable livelihoods, especially in the most deprived districts by 2010.
3.i Percentage increase in district assembly budgets for school feeding and day care and pre-schools.
About 5% About 5% About 5% Most districts don‘t have budgetary allocations for feeding. However, all districts make expenditure on haulage,kitchens, utensils etc
2. Improved attendance and completion rates among schoolchildren in grades P1 to P6 and girls in JSS1 to JSS3.
2.a Annual percentage change in absolute enrolment.
PS JHS PS JHS PS JHS
North 7.3 5.5 8.3 15.5 4.3 4.3
UE 4.3 9.0 8.1 12.2 -0.2 10.4
UW -7.4 -0.9 11.3 14.5 4.7 10.1
2.b GPI for absolute enrolment in WFP target schools
North 086 North 0.86 North 0.88 2006 and 2007 figures are for all schools in region
UE 0.89 UE 0.95 UE 0.96
UW 1.00 UW 1.00 UW 0.93
2.c Gender-specific attendance rate for PS and JSS.
M F m f m f Still working at it. North North North
UE UE UE
UW UW UW
2.d Gender-specific completion rate and GPI for PS and JSS. (Primary)
M F m F m f
North 79.1 63.4 85.6 72.6 92.4 78.7
UE 69.7 71.9 77.3 80.7 83.4 87.1
UW 74.1 74.1 76.9 80.9 85.6 90.5
2.d Gender-specific completion rate and GPI for PS and JSS. (JHS)
M F m F m f
North 52.7 39.8 62.1 47.4 67.1 52.5
UE 45.0 45.8 51.3 52.4 61.2 62.2
UW 51.6 47.8 56.8 54.5 62.0 60.1
2.e Teachers‘ perception of children‘s ability to concentrate and learn in school as a result of school feeding.
Affirmative Improvement Improvement a) Transition to the next level increased annually. b) Children remain in class even when school closes.
4. Increased demand for
4.a Tonnage and monetary value of food commodities procured
5315mt US$1,784,543
5,433,73mt US$1,919,984
10,828mt US$7,093,493
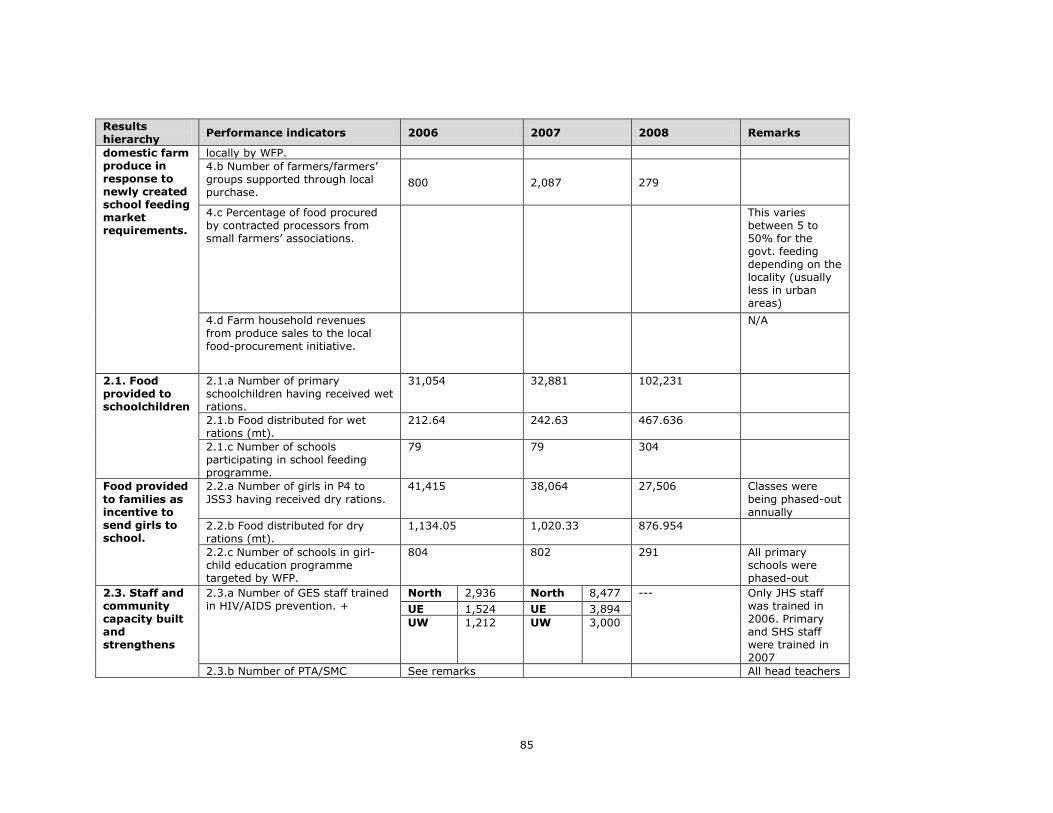
85
Results hierarchy
Performance indicators 2006 2007 2008 Remarks
domestic farm produce in response to newly created school feeding market requirements.
locally by WFP.
4.b Number of farmers/farmers‘ groups supported through local purchase.
800 2,087 279
4.c Percentage of food procured by contracted processors from small farmers‘ associations.
This varies between 5 to 50% for the govt. feeding depending on the locality (usually less in urban areas)
4.d Farm household revenues from produce sales to the local food-procurement initiative.
N/A
2.1. Food provided to schoolchildren
2.1.a Number of primary schoolchildren having received wet rations.
31,054 32,881 102,231
2.1.b Food distributed for wet rations (mt).
212.64 242.63 467.636
2.1.c Number of schools participating in school feeding programme.
79 79 304
Food provided
to families as incentive to send girls to school.
2.2.a Number of girls in P4 to
JSS3 having received dry rations.
41,415 38,064 27,506 Classes were
being phased-out annually
2.2.b Food distributed for dry rations (mt).
1,134.05 1,020.33 876.954
2.2.c Number of schools in girl-child education programme targeted by WFP.
804 802 291 All primary schools were phased-out
2.3. Staff and community capacity built and strengthens
2.3.a Number of GES staff trained in HIV/AIDS prevention. +
North 2,936 North 8,477 --- Only JHS staff was trained in 2006. Primary and SHS staff were trained in 2007
UE 1,524 UE 3,894
UW 1,212 UW 3,000
2.3.b Number of PTA/SMC See remarks All head teachers
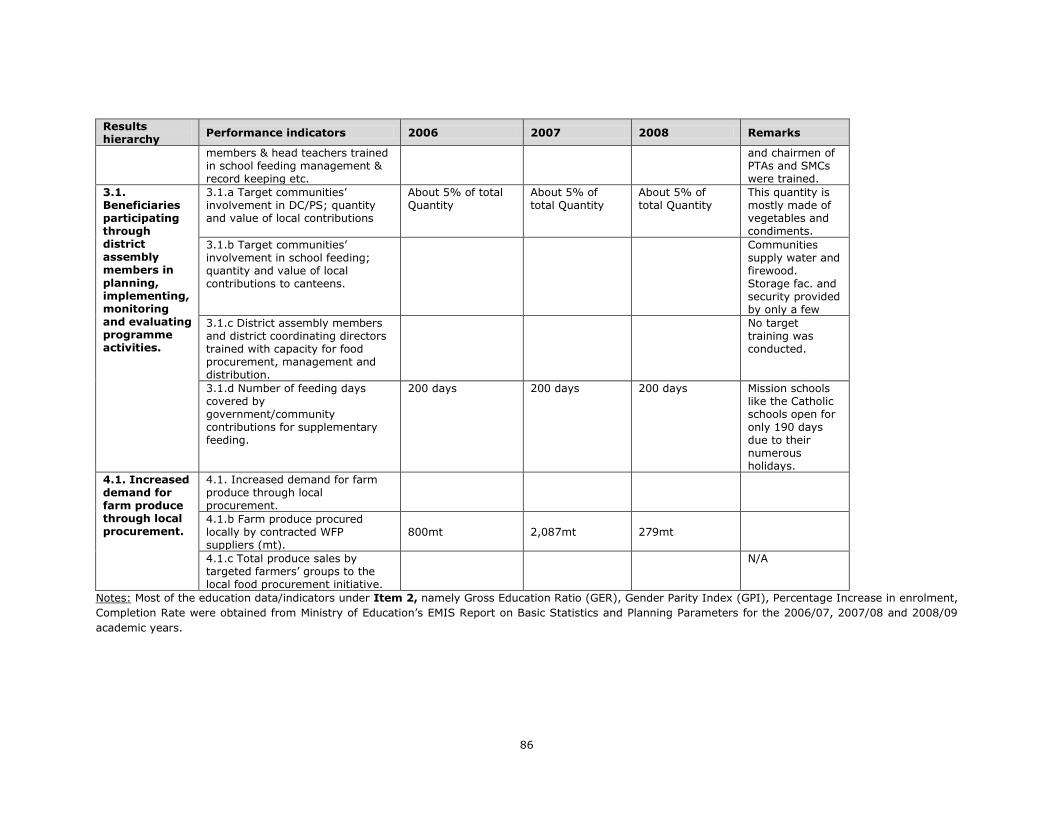
86
Results hierarchy
Performance indicators 2006 2007 2008 Remarks
members & head teachers trained in school feeding management & record keeping etc.
and chairmen of PTAs and SMCs were trained.
3.1. Beneficiaries participating through district assembly members in
planning, implementing, monitoring and evaluating programme activities.
3.1.a Target communities‘ involvement in DC/PS; quantity and value of local contributions
About 5% of total Quantity
About 5% of total Quantity
About 5% of total Quantity
This quantity is mostly made of vegetables and condiments.
3.1.b Target communities‘ involvement in school feeding; quantity and value of local contributions to canteens.
Communities supply water and firewood. Storage fac. and security provided by only a few
3.1.c District assembly members and district coordinating directors trained with capacity for food procurement, management and distribution.
No target training was conducted.
3.1.d Number of feeding days covered by government/community contributions for supplementary feeding.
200 days 200 days 200 days Mission schools like the Catholic schools open for only 190 days due to their numerous holidays.
4.1. Increased demand for farm produce through local procurement.
4.1. Increased demand for farm produce through local procurement.
4.1.b Farm produce procured locally by contracted WFP suppliers (mt).
800mt 2,087mt 279mt
4.1.c Total produce sales by targeted farmers‘ groups to the local food procurement initiative.
N/A
Notes: Most of the education data/indicators under Item 2, namely Gross Education Ratio (GER), Gender Parity Index (GPI), Percentage Increase in enrolment,
Completion Rate were obtained from Ministry of Education‘s EMIS Report on Basic Statistics and Planning Parameters for the 2006/07, 2007/08 and 2008/09
academic years.
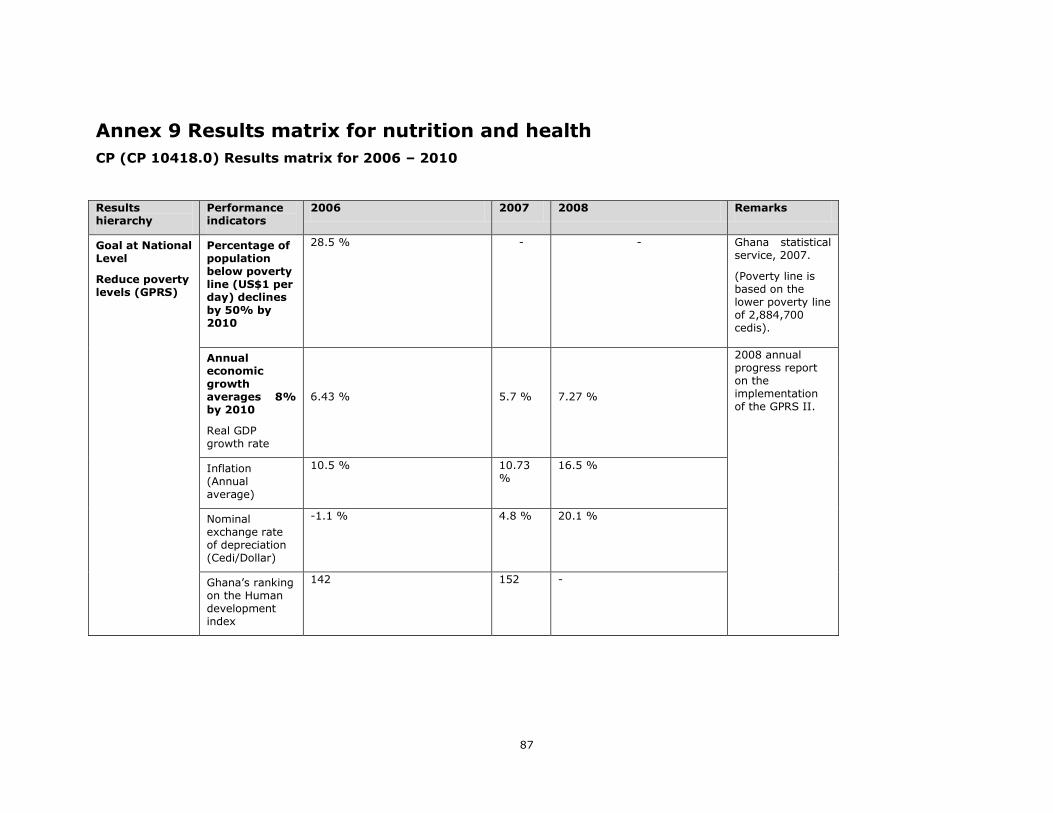
87
Annex 9 Results matrix for nutrition and health
CP (CP 10418.0) Results matrix for 2006 – 2010
Results hierarchy
Performance indicators
2006 2007 2008 Remarks
Goal at National Level
Reduce poverty levels (GPRS)
Percentage of population below poverty line (US$1 per day) declines by 50% by 2010
28.5 % - - Ghana statistical service, 2007.
(Poverty line is based on the lower poverty line of 2,884,700 cedis).
Annual economic growth averages 8% by 2010
Real GDP growth rate
6.43 %
5.7 %
7.27 %
2008 annual progress report on the implementation of the GPRS II.
Inflation (Annual average)
10.5 % 10.73 %
16.5 %
Nominal exchange rate of depreciation (Cedi/Dollar)
-1.1 % 4.8 % 20.1 %
Ghana‘s ranking on the Human development index
142 152 -

88
UNDAF Outcomes
1.1 By 2010, the proportion of people, particularly those living in the most deprived districts, whose right to health is fulfilled, is increased
1.i Malnutrition levels among pregnant and lactating women.
(BMI<18.5)
N/A GDHS ‗03, ‗08.
Ghana (National statistics)
9 % 8.6 %
Upper East 23.1 % 14.8 %
Upper West 11.3 % 9.8 %
Northern region 12.8 % 11.7%
1.ii Malnutrition levels among children under five
Ghana
(national statistics)
UE
%
UW
%
NR
%
N/A Ghana
(national statistics)
UE % UW%
NR%
GDHS ‗08. MICS ‗06.
Wasting 5 % 11.6 7.7 7.1 8.5 % 10.8 13.9 12.9
Underweight 18 % 29.1 19.1 26.8 13.9 % 27.0 13.1 21.8
Stunted 22 % 19.1 22.5 30.5 28 % 36.0 24.6 32.4
CP Outcomes
1. Reduced level of malnutrition among at-risk pregnant and lactating women and children under five
1.a Percentage of pregnant women gaining up to 12.5 kg during pregnancy
84.2 %
86.1 % 84 % 2006, 2007 SFHNEP (Activity 1) PIR for 4th quarter. 2008 GHS CP (Activity 1) PIR for 2nd quarter.
(Measure is of pregnant women gaining more than 0.5 kg during
Upper East Region
63 % 78 % 83 %
Upper West Region
93 % 90% 81 %

89
Northern Region 92 % 89 % 90 % pregnancy)
1.b Percentage of lactating women with body mass index <18.5
12 %
9 % 11 % SPR 06, 07, 08
Upper East Region
15 % 15 % 14 %
Upper West Region
9 % 6 % 9 %
Northern Region 14 % 13 % 4 %
1.c Percentage of children under five who are underweight
36 % 22 % 16 % SPR 06, 07, 08
Male Female Male Female Male Female
Upper East 18 % 21 % 3 % 2 % 14 % 14 %
Upper West 11 % 13 % 3 % 2 % 8 % 9 %
Northern Region 20 % 18 % 6 % 4 % 26 % 24 %
1.d Pregnant and lactating women‘s awareness and application of good nutritional practices.
Pending Field Work Pending Pending
3. Improved national capacity to implement and scale up supplementary feeding and on-
National, regional and district/community budgetary allocations to SFHNE and SBE programmes
Pending Pending Pending

90
site school feeding programmes
against WFP contribution.
3.b Share of VAM-identified vulnerable communities with government supported SFHNE and SBE programs.
The 2004 VAM identified vulnerable districts as opposed to vulnerable communities. The districts subsequently selected communities.
2004 VAM report
Districts Number of communities
Highest vulnerability to food insecurity
Jirapa 9
Lawra 8
Nadowli 6
Sissala 16
Wa 19
Highest vulnerability to maternal malnutrition
Bongo 5
Bolgatanga 9
Bawku East 8
CP Outputs
1.1. Participation of target population in food-supported nutrition intervention
1.1.a Number pregnant and lactating women receiving dry rations.
(Target = 10, 000)
15,070 10,086 13,384 SPR 06, 07, 08
1.1.b Number of children receiving wet rations. (6-23 months =
14, 000) (2-5 yrs = 36, 000)
28,568 50,162 50,152 SPR 06, 07, 08
1.1.c Micronutrient-fortified food distributed (mt).
1,823 1,024 1,481 SPR 06, 07, 08
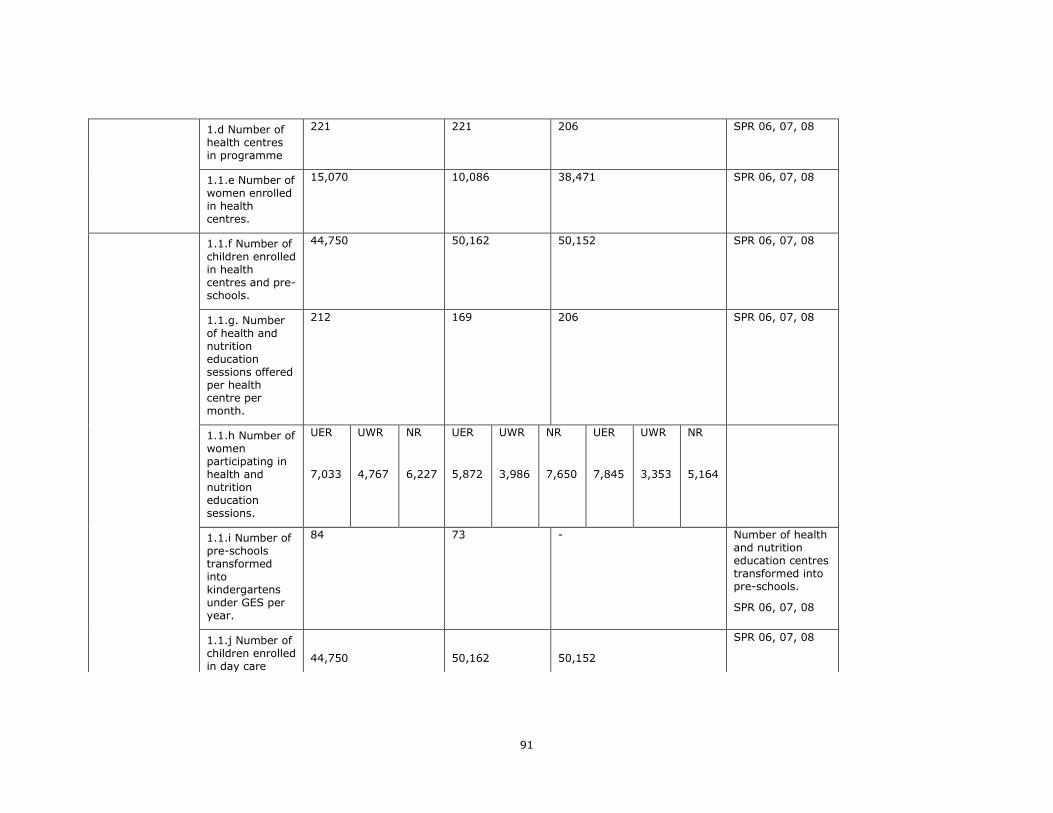
91
1.d Number of health centres in programme
221 221 206 SPR 06, 07, 08
1.1.e Number of women enrolled in health centres.
15,070 10,086 38,471 SPR 06, 07, 08
1.1.f Number of children enrolled in health centres and pre-schools.
44,750 50,162 50,152 SPR 06, 07, 08
1.1.g. Number of health and nutrition education sessions offered per health centre per month.
212 169 206 SPR 06, 07, 08
1.1.h Number of women participating in health and nutrition education sessions.
UER
7,033
UWR
4,767
NR
6,227
UER
5,872
UWR
3,986
NR
7,650
UER
7,845
UWR
3,353
NR
5,164
1.1.i Number of pre-schools transformed into kindergartens under GES per year.
84
73
-
Number of health and nutrition education centres transformed into pre-schools.
SPR 06, 07, 08
1.1.j Number of children enrolled in day care
44,750
50,162
50,152
SPR 06, 07, 08

92
centres and pre-schools.
1.2. Staff and community capacity built and strengthened
1.2.a. Number of GHS staff trained in growth monitoring and HIV/AIDS prevention.
49 - - Trainer of trainer‘s workshop on growth promotion report 2006. (Training was in growth monitoring & promotion only)
1.2.b Number of
community members and centre attendants trained and qualified in growth monitoring, record keeping etc.
378 - - Collaborative
training of health workers, centre attendants and volunteers by UNICEF and WFP on growth monitoring and promotion.
3.1. Beneficiaries participating through district assembly members in planning, implementing, monitoring and evaluating programme activities.
3.1.d Number of feeding days covered by government/ community contributions for supplementary feeding.
0 0 0

93
Annex 10 Comparison of Ghana’s nutrition indicators 1998-2009 Comparison of nutritional indicators, Ghana 1998-2009
Children 6-59 months (%)
GDHS 1998 GDHS 2003 MICS 2006 GDHS 2008* CFSVA 2009
Underweight 24.9 22.1 17.8 17.4 11.6
Wasting 9.5 7.1 5.4 7.9 7.1
Stunting 25.9 29.9 22.4 23.3 22.1
*using NCHS data from annex C7 for appropriate comparison with previous years
Comparison of nutritional indicators, 3 Northern regions, District MICS 2007 Children 6-59 months (%)
Upper East Upper West Northern Region
Underweight 24.6 18.6 29.3
Wasting 8.1 6.0 8.8
Stunting 23.4 18.9 31.1
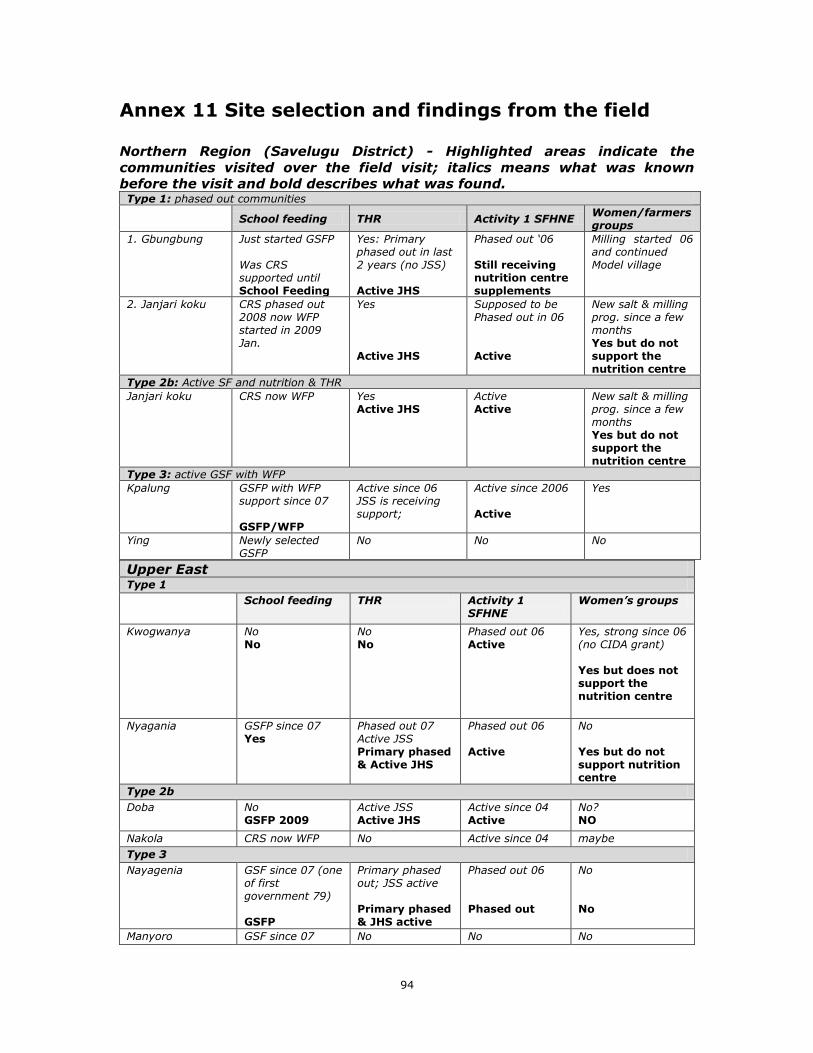
94
Annex 11 Site selection and findings from the field Northern Region (Savelugu District) - Highlighted areas indicate the
communities visited over the field visit; italics means what was known
before the visit and bold describes what was found. Type 1: phased out communities
School feeding THR Activity 1 SFHNE
Women/farmers groups
1. Gbungbung Just started GSFP Was CRS supported until School Feeding
Yes: Primary phased out in last 2 years (no JSS) Active JHS
Phased out „06 Still receiving nutrition centre supplements
Milling started 06 and continued Model village
2. Janjari koku CRS phased out 2008 now WFP started in 2009 Jan.
Yes Active JHS
Supposed to be Phased out in 06 Active
New salt & milling prog. since a few months Yes but do not support the nutrition centre
Type 2b: Active SF and nutrition & THR
Janjari koku CRS now WFP Yes Active JHS
Active Active
New salt & milling prog. since a few months Yes but do not support the nutrition centre
Type 3: active GSF with WFP
Kpalung GSFP with WFP support since 07 GSFP/WFP
Active since 06 JSS is receiving support;
Active since 2006 Active
Yes
Ying Newly selected GSFP
No No No
Upper East
Type 1
School feeding THR Activity 1 SFHNE
Women’s groups
Kwogwanya No No
No No
Phased out 06 Active
Yes, strong since 06 (no CIDA grant) Yes but does not support the nutrition centre
Nyagania GSFP since 07 Yes
Phased out 07 Active JSS Primary phased & Active JHS
Phased out 06 Active
No Yes but do not support nutrition centre
Type 2b
Doba No GSFP 2009
Active JSS Active JHS
Active since 04 Active
No? NO
Nakola CRS now WFP No Active since 04 maybe
Type 3
Nayagenia GSF since 07 (one of first government 79) GSFP
Primary phased out; JSS active Primary phased & JHS active
Phased out 06 Phased out
No No
Manyoro GSF since 07 No No No

95
Upper West Type 1
School feeding THR Activity 1 SFHNE
Women/farmers groups
Vamboi No No
No No
Phased out 06 Phased out
Farmer group (IGA for nutrition centres) One farmers group but does not support the nutrition centre
Bichemboi No No
Primary phased out; JSS ongoing JHS ongoing
Phased out 06 Active
No No
Pieng GSF since 2009 GSP since 2009
No No
Phased out 06
No No
Banu No No Phased out 06?
Yes
Type 2b
Sakelo GSF since few months,
previously CRS Only WFP school feeding
No
No
Active since 06
Active
No?
No
Bichemboi No No
Primary phased out; JSS ongoing JHS ongoing
Phased out 06 Active
No No
Type 3
Pieng GSF since 09 GSFP/WFP
No No
Started in 2003 and Phased out 06
No NO
Basisan GSF (2 day/3 day WFP) GSFP/WFP feeding
No No
Phased out 06 Active
No N0
Note: italics described the situation based on the documentation before going to the field; bolded means
the situation the research team actually met on the ground.
Notes:
All CRS schools taken over by WFP have been with WFP for just since Jan 2009
Type 4 is the control community where no intervention by WFP has occurred. Go to the nearest community that fits the description/neighbouring community. If nearby a WFP intervention community, ask whether they go to the school with school feeding.
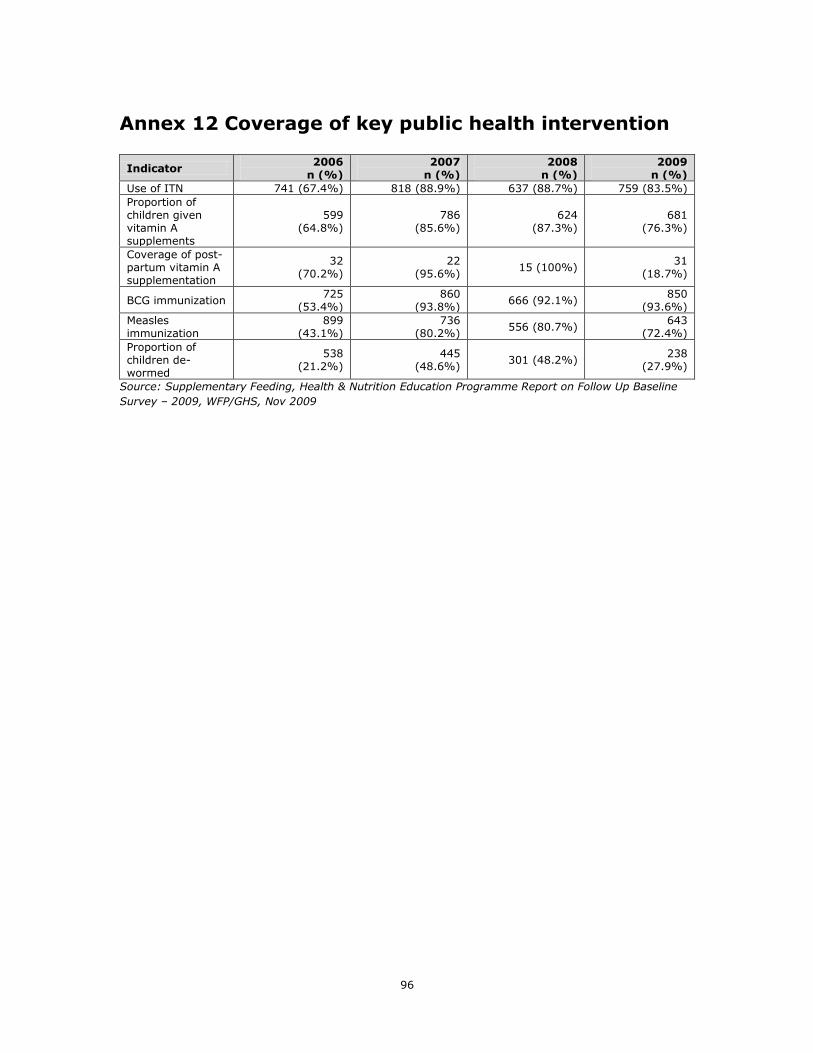
96
Annex 12 Coverage of key public health intervention
Indicator 2006
n (%) 2007
n (%) 2008
n (%) 2009
n (%)
Use of ITN 741 (67.4%) 818 (88.9%) 637 (88.7%) 759 (83.5%)
Proportion of children given vitamin A supplements
599 (64.8%)
786 (85.6%)
624 (87.3%)
681 (76.3%)
Coverage of post-partum vitamin A supplementation
32 (70.2%)
22 (95.6%)
15 (100%) 31
(18.7%)
BCG immunization 725
(53.4%) 860
(93.8%) 666 (92.1%)
850 (93.6%)
Measles immunization
899 (43.1%)
736 (80.2%)
556 (80.7%) 643
(72.4%)
Proportion of children de-wormed
538 (21.2%)
445 (48.6%)
301 (48.2%) 238
(27.9%)
Source: Supplementary Feeding, Health & Nutrition Education Programme Report on Follow Up Baseline
Survey – 2009, WFP/GHS, Nov 2009
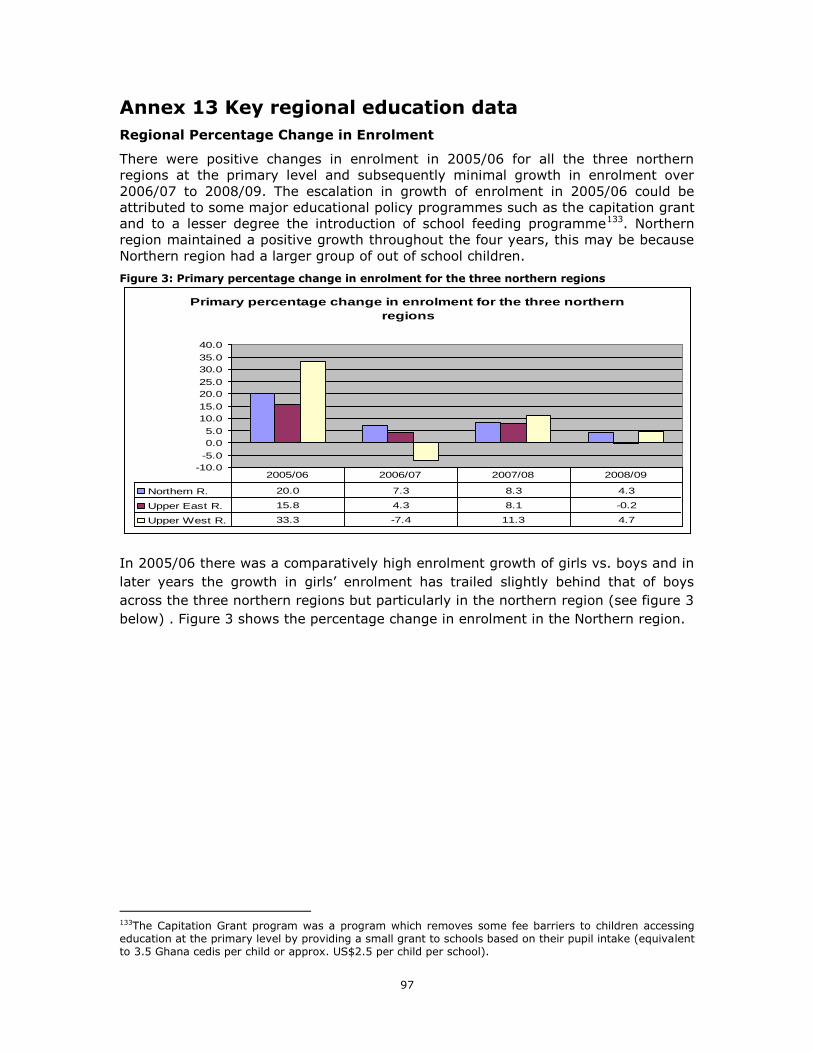
97
Annex 13 Key regional education data
Regional Percentage Change in Enrolment
There were positive changes in enrolment in 2005/06 for all the three northern
regions at the primary level and subsequently minimal growth in enrolment over
2006/07 to 2008/09. The escalation in growth of enrolment in 2005/06 could be
attributed to some major educational policy programmes such as the capitation grant
and to a lesser degree the introduction of school feeding programme133. Northern
region maintained a positive growth throughout the four years, this may be because
Northern region had a larger group of out of school children.
Figure 3: Primary percentage change in enrolment for the three northern regions
In 2005/06 there was a comparatively high enrolment growth of girls vs. boys and in
later years the growth in girls‘ enrolment has trailed slightly behind that of boys
across the three northern regions but particularly in the northern region (see figure 3
below) . Figure 3 shows the percentage change in enrolment in the Northern region.
133The Capitation Grant program was a program which removes some fee barriers to children accessing education at the primary level by providing a small grant to schools based on their pupil intake (equivalent to 3.5 Ghana cedis per child or approx. US$2.5 per child per school).
Primary percentage change in enrolment for the three northern
regions
-10.0
-5.0
0.0
5.0
10.0
15.0
20.0
25.0
30.0
35.0
40.0
Northern R. 20.0 7.3 8.3 4.3
Upper East R. 15.8 4.3 8.1 -0.2
Upper West R. 33.3 -7.4 11.3 4.7
2005/06 2006/07 2007/08 2008/09
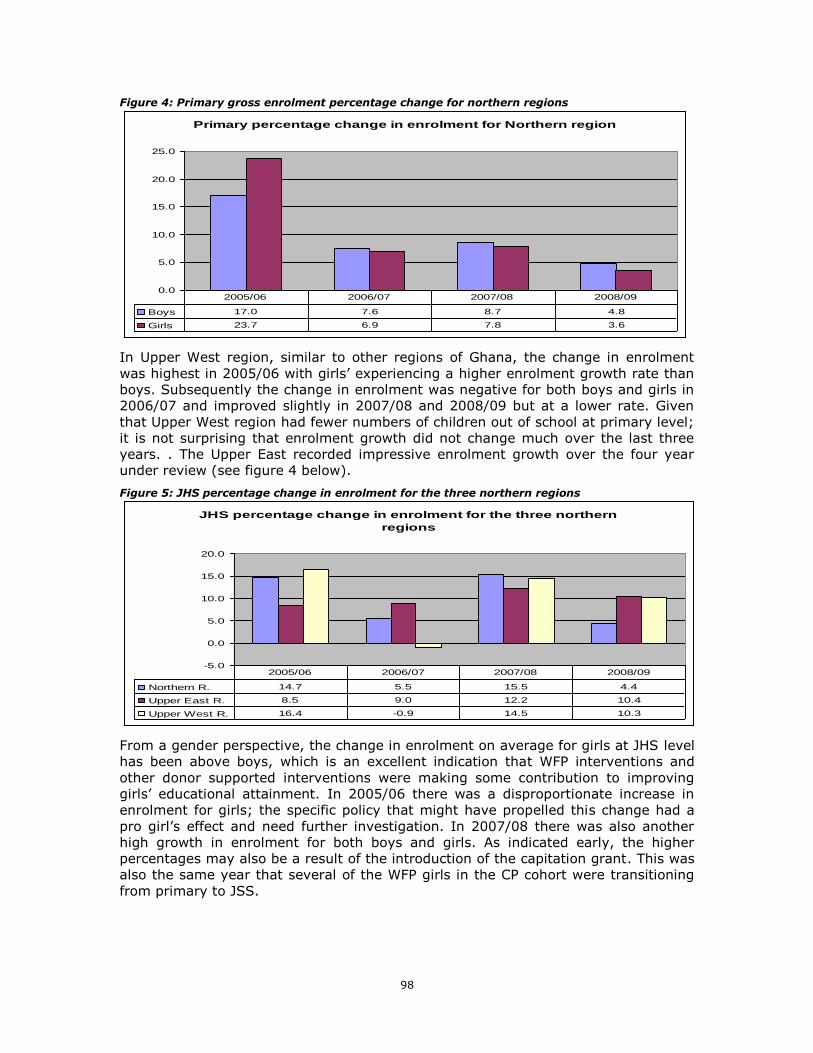
98
Figure 4: Primary gross enrolment percentage change for northern regions
In Upper West region, similar to other regions of Ghana, the change in enrolment
was highest in 2005/06 with girls‘ experiencing a higher enrolment growth rate than
boys. Subsequently the change in enrolment was negative for both boys and girls in
2006/07 and improved slightly in 2007/08 and 2008/09 but at a lower rate. Given
that Upper West region had fewer numbers of children out of school at primary level;
it is not surprising that enrolment growth did not change much over the last three
years. . The Upper East recorded impressive enrolment growth over the four year
under review (see figure 4 below).
Figure 5: JHS percentage change in enrolment for the three northern regions
From a gender perspective, the change in enrolment on average for girls at JHS level
has been above boys, which is an excellent indication that WFP interventions and
other donor supported interventions were making some contribution to improving
girls‘ educational attainment. In 2005/06 there was a disproportionate increase in
enrolment for girls; the specific policy that might have propelled this change had a
pro girl‘s effect and need further investigation. In 2007/08 there was also another
high growth in enrolment for both boys and girls. As indicated early, the higher
percentages may also be a result of the introduction of the capitation grant. This was
also the same year that several of the WFP girls in the CP cohort were transitioning
from primary to JSS.
Primary percentage change in enrolment for Northern region
0.0
5.0
10.0
15.0
20.0
25.0
Boys 17.0 7.6 8.7 4.8
Girls 23.7 6.9 7.8 3.6
2005/06 2006/07 2007/08 2008/09
JHS percentage change in enrolment for the three northern
regions
-5.0
0.0
5.0
10.0
15.0
20.0
Northern R. 14.7 5.5 15.5 4.4
Upper East R. 8.5 9.0 12.2 10.4
Upper West R. 16.4 -0.9 14.5 10.3
2005/06 2006/07 2007/08 2008/09

99
Gender Specific Completion rate
The completion rates at primary level across the three northern regions are all below
the national average but improved between 2006 to 2009. There have been
significant increases in the completion rate over the last three year period across the
three northern regions with convergence in relation to national completion rates in
2008. (See figure 6 below).
Figure 6: Primary completion rate for the three northern regions and national
At JHS level, completion rates sharply increased between 2007 and 2008 for the
three northern regions and nation as a whole. Overall there have been tremendous
improvements in the JHS completion rate in the three northern regions; with each
region beginning with completion rates below 50 per cent in 2006 and attaining
completion rates above 80 per cent in 2008. No doubt that the WFP Take home
ration programme did and will continue to support these positive improvements in
completion rates among girls at JSS since the vast majority of the 40,000 girls have
stayed in the JSS system and very few have dropped out since the beginning of the
programme in 2006.
Figure 7: JHS completion rate for the three northern regions and national
The completion rates across the three northern regions is below the national
completion rate although there have been some slight improvements over the period
with the gap in completion being narrowed. The Northern region have comparatively
lower numbers of girls completing primary school compared to boys compared to the
other three northern regions (see figure 8).
Primary completion rate for the three northern region and
national
0
20
40
60
80
100
National 80.4 85.5 88.7
Northern Region 71 79.4 85.9
Upper E. Region 70.7 78.9 85.1
Upper W. Region 70.6 78.8 87.9
2006 2007 2008
JHS completion rate for the three northern region and national
0
20
40
60
80
100
National 62.8 67.7 88.7
Northern Region 46.8 55.4 85.9
Upper E. Region 45.3 51.8 85.1
Upper W. Region 49.9 55.7 87.9
2006 2007 2008
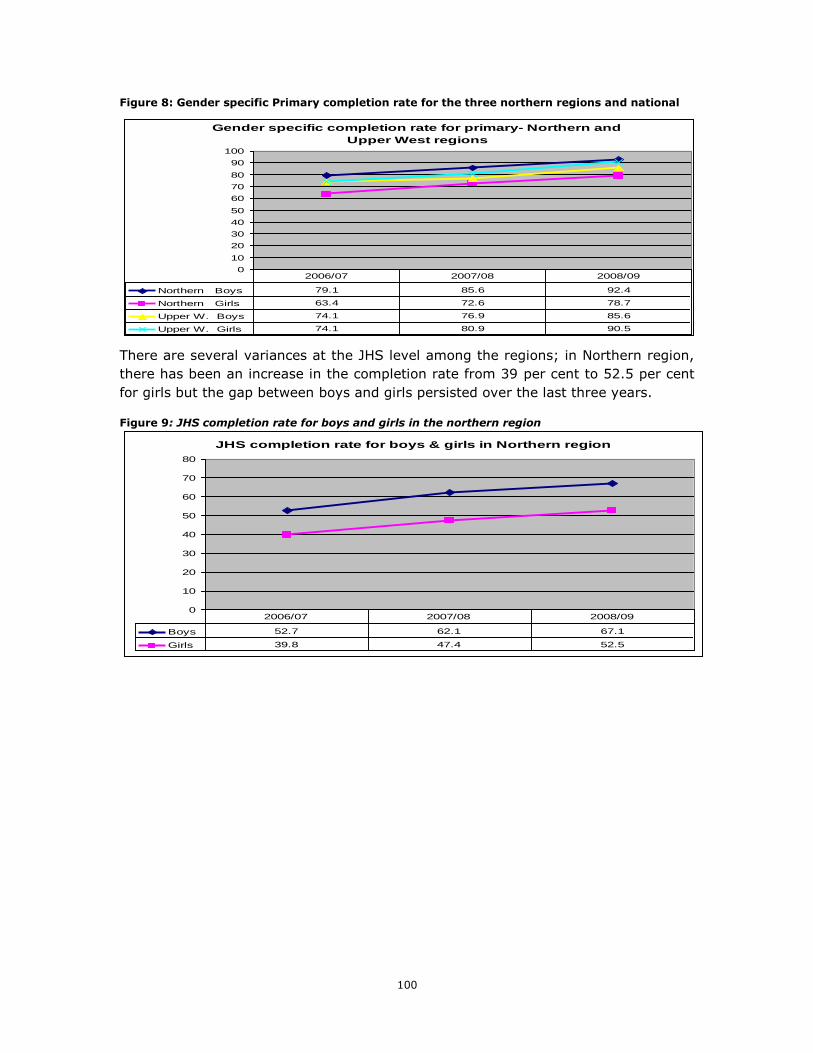
100
Figure 8: Gender specific Primary completion rate for the three northern regions and national
There are several variances at the JHS level among the regions; in Northern region,
there has been an increase in the completion rate from 39 per cent to 52.5 per cent
for girls but the gap between boys and girls persisted over the last three years.
Figure 9: JHS completion rate for boys and girls in the northern region
Gender specific completion rate for primary- Northern and
Upper West regions
0
10
20
30
40
50
60
70
80
90
100
Northern Boys 79.1 85.6 92.4
Northern Girls 63.4 72.6 78.7
Upper W. Boys 74.1 76.9 85.6
Upper W. Girls 74.1 80.9 90.5
2006/07 2007/08 2008/09
JHS completion rate for boys & girls in Northern region
0
10
20
30
40
50
60
70
80
Boys 52.7 62.1 67.1
Girls 39.8 47.4 52.5
2006/07 2007/08 2008/09

101
Gender Parity Index.
Figure 14a
Figure 14b
JHS Gender Parity Index (GPI) for National and the three
northern regions
0.00
0.20
0.40
0.60
0.80
1.00
1.20
1.40
National 1.00 0.91 0.92 0.92
Northern Region 0.94 0.80 0.80 0.82
Upper E. Region 1.11 1.06 1.11 1.09
Upper W. Region 1.16 1.04 1.06 1.08
2005/06 2006/07 2007/08 2008/09
Primary percentage of change in enrolment for Upper West
region
-10.0
-5.0
0.0
5.0
10.0
15.0
20.0
25.0
30.0
35.0
40.0
Boys 31.9 -7.0 12.0 4.9
Girls 34.8 -7.8 10.5 4.4
2005/06 2006/07 2007/08 2008/09
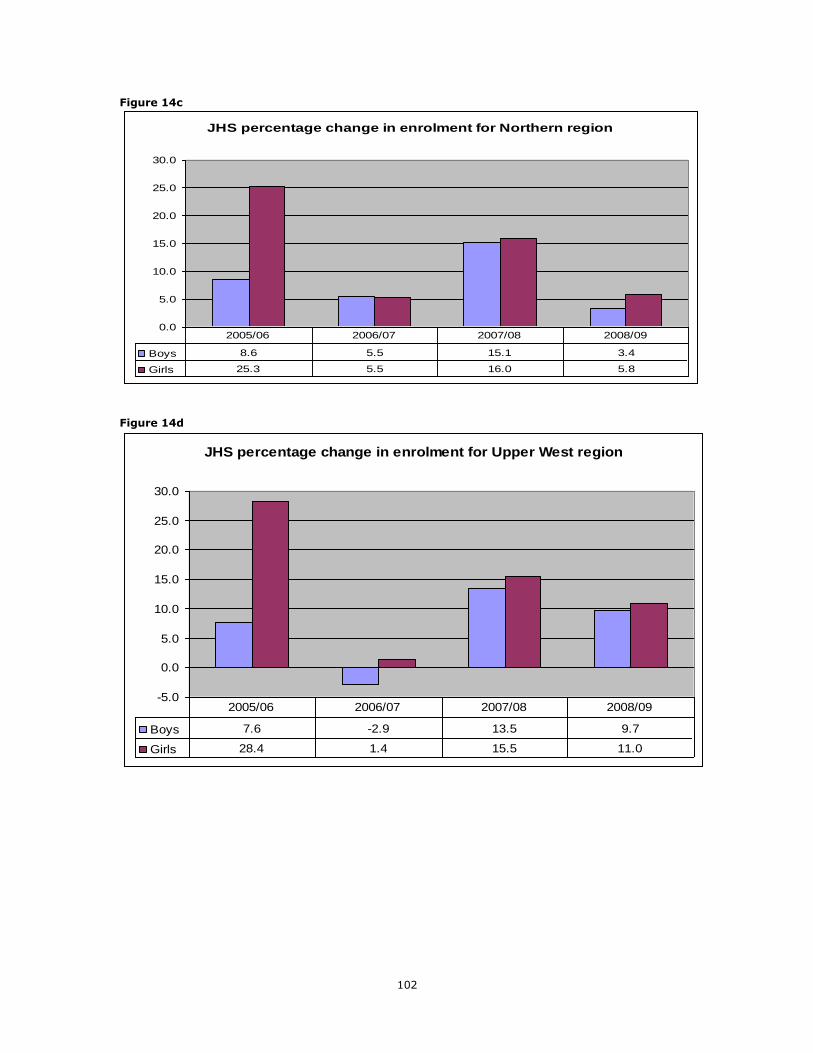
102
Figure 14c
Figure 14d
JHS percentage change in enrolment for Northern region
0.0
5.0
10.0
15.0
20.0
25.0
30.0
Boys 8.6 5.5 15.1 3.4
Girls 25.3 5.5 16.0 5.8
2005/06 2006/07 2007/08 2008/09
JHS percentage change in enrolment for Upper West region
-5.0
0.0
5.0
10.0
15.0
20.0
25.0
30.0
Boys 7.6 -2.9 13.5 9.7
Girls 28.4 1.4 15.5 11.0
2005/06 2006/07 2007/08 2008/09
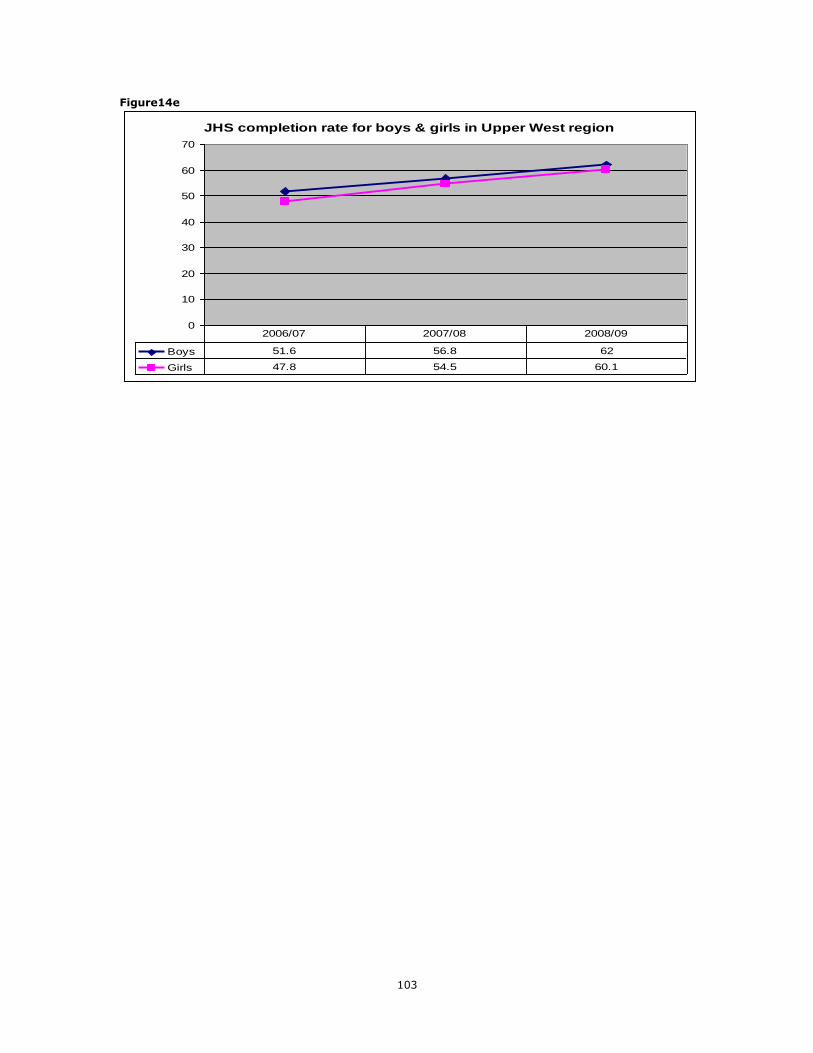
103
Figure14e
JHS completion rate for boys & girls in Upper West region
0
10
20
30
40
50
60
70
Boys 51.6 56.8 62
Girls 47.8 54.5 60.1
2006/07 2007/08 2008/09

104
Annex 14 Profile of communities visited
Northern Region
a. Gbungbung
Gbungbung is located in Savelugu district of the Northern region and is
predominantly Muslim. The community obtains its water from boreholes; however
some of the boreholes often dry up in dry season particularly in March. The dam is
used as an alternative source of water in such instances. Gbungbung is a subsistence
farming community but most families are unable to feed themselves during the lean
season which lasts approximately six months, between the months of March and
August. WFP activities in Gbungbung comprise of take home ration (2000), nutrition
centre (2005) and school feeding (2009). The district assembly, women‘s groups and
community members have demonstrated a considerable level of commitment
towards WFP activities and a desire to improve their lives. Their contributions come
in the form of financial, material and physical labour support.
There are also several other NGOs in Gbungbung with varying roles and
contributions. These NGOs include World vision, New Energy, Opportunities
International, UNICEF and RAINS. Prior to WFP interventions, the desire for
education was considerably low particularly amongst the females. An appreciable
number of girls were married off at early ages while others migrated to the south to
engage in Kayayo. According to community members, this is no longer the case in
the community. Fertility rates were also high but have been on the decline owing to
the health education talks on family planning they have been receiving. Another
contributing factor to the low fertility rates is the fact that girls are no longer married
off at early ages and men are marrying fewer women because the girls have to go to
school.
b. Janjori koku
Janjori koku like Gbungbung is also a subsistence farming community located in
Savelugu district of the Northern region. The lean season lasts approximately six
months, between the months of March and August and communities cope by
reducing the number of meals eaten in a day from three to two (breakfast and
dinner).
WFP is assisting Janjori koku by providing THR (for school girls, pregnant and
lactating mothers, and children between 24 and 59 months), nutrition centre, and
empowering women‘s groups to contribute towards WFP activities. Although there
are contributions being made by community members and district assembly towards
WFP activities, the women‘s groups are yet to make a contribution. There seem to be
been considerable dependence on external aid in the community. WFP interventions
is said to have increased enrolment in schools, created the awareness for the
importance of education particularly that of the female child, and educated mothers
on health issues.
There is a CHPS centre in Janjori koku that serves 10 other communities and has
been in operation for the past 20 years. Activities at the CHPS centre include
delivery, OPD, family planning, child welfare, health education sessions, outreach
clinics, weighing and distribution of plumpy nut to malnourished children. Major
105
health issues within the community are malaria and diarrhoea. There were previous
collaborations between the nutrition centre and the CHPS centre attendants but this
is no longer working due to changes in the CHPS centre staff amongst other issues.
There is an onsite school feeding programme that has been recently initiated for the
primary school. Children from the nutrition centres often benefit from the school
feeding programme, as a result the nutrition centre is in a cost sharing arrangement
(particularly for haulage) with the school feeding committee. NGOs and institutions
with activities in Janjori koku include World vision, UNICEF and the Ghana Health
Service (GHS).
c. Kpalung
Kpalung is another community within Savelugu district in the northern region. The
community members are predominantly farmers and practice subsistence farming. At
the primary, there are more girls than boys but at the JHS level there the boys are
more than the girls. There are also significant declines in the total number of children
as one progress up the education ladder. In spite of the number of girls in school,
very few girls make it to Senior Secondary School (SHS) compared to the boys. The
primary school was a beneficiary of Catholic Relief Services (CRS) school feeding,
which phased out. WFP recently took up the school feeding programme in
collaboration with the Government of Ghana and has only been active for a few
months. The community is also has an active WFP nutrition centre.
There are some NGOs operating in Kpalung; this includes World vision that provided
biscuits, calypso and uniforms; and UNICEF who gave sheep to children to support
their schooling. Each child was supposed to rear the sheep and give the kid to
another child (ruminant project).
Upper East
a. Doba
The community of Doba is a small community, south of Navrongo central in the
Upper East region. Both the primary school and the JHS received external support;
the Primary school benefits from Ghana school feeding programme and JHS receives
the take home ration from WFP. According to interviews with pupils, teachers and
community members, the THR serves as a safety net for the girls‘ in the household;
the ration reduces household food security in the lean season. It became evident to
the team that the THR encourages the girls‘ to enrol in school and attend the classes
regularly. The girls are highly motivated and when interviewed wanted to become
teachers, doctors, judges, bank manageress, etc.
Doba has an active nutrition centre that is supported by WFP and GHS. It has about
25 children between the ages of two and five years and the management committee
monitors the centre regularly. Height measurement and weighing is done at the
centre and health education is conducted in collaboration with the nurse from the
CHPS centre.
b. Nyangania
The community use to have a health clinic, but due to heavy rains the structure
collapsed and the nurse is forced to work from a small temporary structure. Some of
the challenges confronting eth farmers in the community include climate extremes
such droughts and floods as well as the availability of fertilizer and seeds. During the

106
dry/lean season, many of the community members travels to the urban centres
(Tamale or Kumasi) to work while the grandparents take care of the children.
The school visited accommodates approximately 300 pupils including children from
four neighbouring communities. The main challenges facing pupils include trekking
long distance to school and doing farmer/household work (taking care of animals,
fetching water from the household, working in farmers, etc). Due to these
responsibilities and the long distances, the students arrive between 30 and 60
minutes late to school. The school does not have school feeding but the primary
school used to have a take home ration, which was phased out in January 2008. For
the school and the community this has negatively impacted on enrolment and
attendance in the school. This due to high food insecurity, parents were motivated to
take their girls to school to benefit from the THR but after THR phase out, some
parents withdrew their girls from school to work on the farm. That notwithstanding
quite a number of girls (and parents) are enlightened and committed to graduate
from the school without THR. The classrooms are also not as crowded as they used
to be and this, the teachers noted is easier to control and enhances learning.
However, there is an active nutrition centre which is home to about 30 children and
supported by an active management committee, responsible for supervision of the
food rations and structure maintenance.
c. Kayoro
Kayoro was perceived by the evaluation team as an active and prosperous
community. Supported by the nurse, the health status of the members is satisfactory
and though the nutrition centre collapsed two years ago, the chief is building a new
compound. The community has five active women groups, engaged in farming, shea
butter oil extraction, trading and animal rearing. One of such groups was selected by
WFP in March 2009 to receive 35 goats. This income generating activity was
supposed to feed into the nutrition centre to sustain it after WFP phased out its
supplementary feeding. However, since the nutrition is building is collapse, the
women group is waiting for the community to rebuild the centre; meanwhile they are
using the profit for petty trading. Once the new compound is active, the women
indicated they will to contribute food and water to sustain the centre.
The community has two primary schools and one JHS, which had the THR until last
year. They said during the intervention enrolment, especially for girls increased
significantly. One of the primary schools had Ghana School Feeding Programme
(GSFP) but is faced with some problems. The community used to have an active
nutrition centre, which was put up by the community with the WFP and GHS support
in 2004. The centre ran successfully for about two years, after which WFP phased out
and the community sustained the initiative with small contributions like groundnuts,
spices and firewood. Unfortunately, the structure collapsed in 2007 and since then
community has not been able to rebuild the structure. Hence, the nutrition centre is
no longer active. WFP used to distribute rations to the clinic under the EMOP
programme, but this has been phased out as well. The nurse at the CHPS centre
indicated that a result of UNICEF intervention (plump nuts), that malnutrition is low,
children are immunized.
107
Upper West region
Bitchemboi
Bitchemboi is a farming community in the Sissila East district. The main crops
cultivated include maize, beans, soya beans, rice, millet and yam. The community
has a nutrition centre, primary and JHS. There is no school feeding at the primary
school but the JHS girls benefit the Take Home Ration (THR). According to records at
the school and interviews with teachers and pupils, the enrolment is high but the
school has issues of low retention for boys. The boys‘ enrolment is usually high at
lower primary but decreases as they move to higher grades; they are withdrawn to
take care of cattle, bullocks and do farm work. Thus there are more girls than boys
at the primary schools. The school performance is also very impressive; the school
ranked 6th out of the 27 schools in the district in the last Basic Education Certificate
Examination (BECE). There is strong community participation and support for the
running of the school. The community has built six rooms to accommodate the
teachers and is contributing food to support volunteer teachers in the school.
The community has an active nutrition centre sponsored by WFP. The children at the
Nutrition Centre transit to class one in the primary school in the community. They
also have a new CHIPS compound which is yet to be operational. They explained that
over the years there has been improvement in their health because the Ghana
Health Service Outreach teams have been immunizing their children and educating
their women on health issues. They added that diseases like measles, polio, etc
which used to kill their children are virtually nonexistent. Also, antenatal, postnatal
and the feeding at the nutrition centre contribute immensely to making their children
and women healthy.
b. Pieng
Pieng is a farming community. They grow maize, bean, cassava, yam, and rear
sheep, goats, cattle and birds. Pieng is located along the road and is nearer to the
district capital, Tumu. It is more of a peri-urban than a rural community. The primary
school which is a CRS phased-out school and is currently a beneficiary of the Ghana
School feeding Programme (GSF)/WFP schooling feeding. The GSFP feeds children at
the school three days while WFP feeds two days. There is pipeline break school
feeding due to the non availability of WFP food since July, 2009 and the community
is contributing food to supplement the GSFP. Enrolment is high and the gender parity
gap between boys and girls is low, however, the school performance is poor. In the
last BECE, only 6 out of 16 pupils got placement at SHS. There is a nutrition centre
which has been turned into a pre-school. The pre-school has a nice building which
according to community members was provided by the Action Aid.
c. Sakalo
Sakalo is a farming community; they cultivate maize, beans, sorghum, yam and
millet. They produce a lot of food but suffer food insecurity in the lean season, where
households cannot afford three meals a day. The community has benefited from
support from the Ministry of Food and Agriculture in cotton farming; Wenco for Block
Farming; and Action Aid provided grinding mill for the women. According to
community members, there is no potable water and people and animals compete for
the same source of water. They lack dams for dry season farming and for the
animals.
108
The community has a primary and JHS as well as a nutrition centre which doubles as
a kindergarten. The primary school has WFP feeding; it‘s one of the CRS phased-out
schools. However, since the third term of last academic year, they have not received
food from WFP but they have been feeding the children from community
contributions. After CRS phased out, they developed a plan to sustain the feeding
programme. The plan included a school farm and food contributions from the
community during harvesting season. They have implemented the plan according to
the school authorities and the School Management Committee (SMC). Enrolment,
retention and completion are good but they have some problems with boys‘
attendance. The boys are often tasked to take care of bullocks. This was apparent in
observations at the school where bullocks are tied to the trees around the school
compound; the teacher explained that the boys who choose to go to school must find
a way of combining the two tasks of schooling and taking care of the animals.
Despite this, there are few children out of school according to the head teacher.
With regards to health, they have an active nutrition centre where children are fed
and mothers receive health education. It also serves as centre for antenatal and
postnatal health care. There is a CHIPS compound in the next village, Sakai, where
the women go for primary health care.
d.Vamboi
Vamboi is also a farming community far from the district capital Tumu. It has a
primary and JHS. The schools have neither school feeding nor THR. However, there
was a WFP nutrition centre but it was phased out in late 2005. The centre was not
functioning at the time of our visit but the team was told that the nutrition centre
attendant passed away and they have just appointed another person to take over.
According to community members, they have set up a committee to collect food from
community members to continue feeding the children at the nutrition centres. The
community also has a farmer‘s group known as “Nimagdomge” (Unity fosters
progress). The aim of the group is to work together to bring progress to each other
and the community as a whole.
e. Basisan
Basisan is a farming community located along the Tumu-Navrongo road, near to the
Kasena Nakana District in the Upper East but far from the district capital Tumu. The
community has a Primary and JHS. The primary has Ghana school feeding
programme/WFP school feeding. There is evidence of community involvement since
they have built four-room accommodation for the teachers. The community with the
head teacher were said to have been managing the feeding programme before a
matron was posted to school this term. The community also hinted they contribute
food to supplement the GSFP whenever there is pipeline breakage in food supply. We
observed that the school was feeding both primary and JHS. The school has poor and
inadequate infrastructure. The JHS one is using one of the classrooms of the nutrition
centres. In the observation and interviews, it was realized that there is a high
incidence of teacher indiscipline in the school such as teacher absenteeism and
lateness. At the time of our visit (around 9:45 am), out of ten teachers in the school,
there was only one teacher in the school and he was resting at the teacher quarter.
The food was also served without regarding the school time table for breaks; as early
as about 9:45 am, some children were already served. Despite this, enrolment for
both boys and girls was good. The school feeding attracts not only indigenous people
but also nomadic Fulani children who conventionally are not encouraged to go to
109
school. Observations at the Nutrition Centre, suggest that the children were fed with
only CSB. Some of the CSB was spoilt and contained weevils. The nutrition centre
cooks had to sieve the CSB before using it.
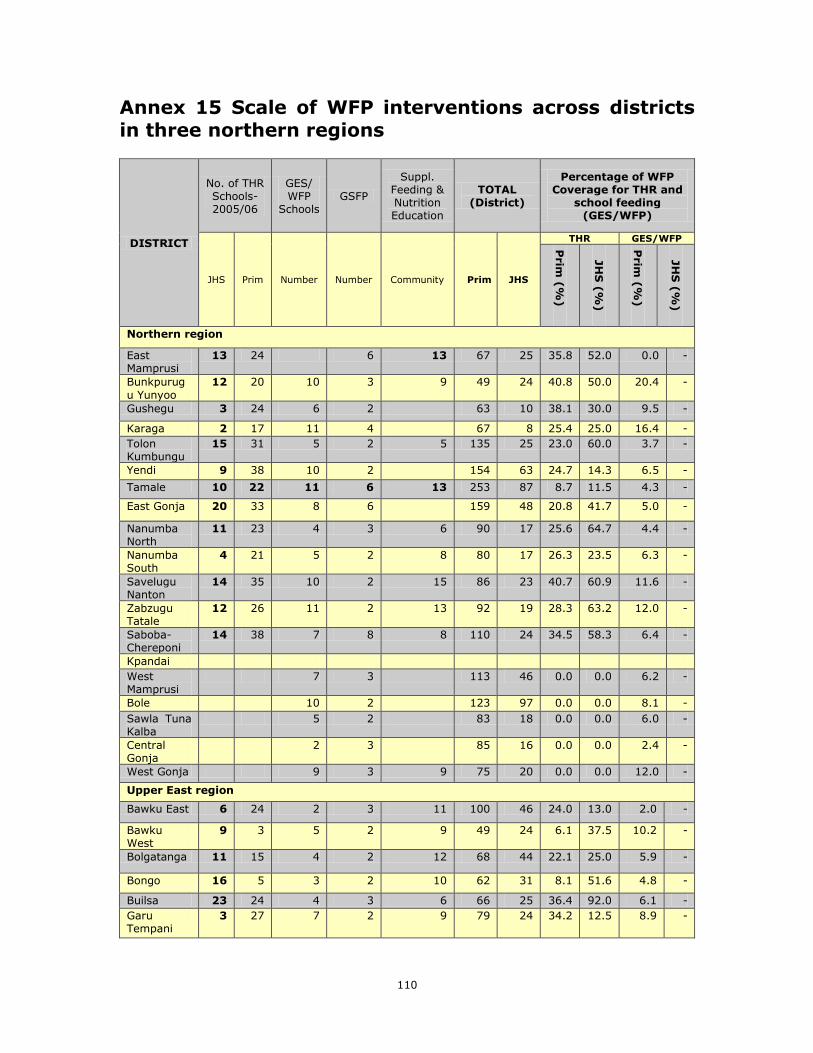
110
Annex 15 Scale of WFP interventions across districts
in three northern regions
DISTRICT
No. of THR Schools- 2005/06
GES/ WFP
Schools GSFP
Suppl. Feeding & Nutrition Education
TOTAL (District)
Percentage of WFP Coverage for THR and
school feeding (GES/WFP)
JHS Prim Number Number Community Prim JHS
THR GES/WFP
Prim
(%
)
JH
S (
%)
Prim
(%
)
JH
S (
%)
Northern region
East Mamprusi
13 24 6 13 67 25 35.8 52.0 0.0 -
Bunkpurug
u Yunyoo
12 20 10 3 9 49 24 40.8 50.0 20.4 -
Gushegu 3 24 6 2 63 10 38.1 30.0 9.5 -
Karaga 2 17 11 4 67 8 25.4 25.0 16.4 -
Tolon Kumbungu
15 31 5 2 5 135 25 23.0 60.0 3.7 -
Yendi 9 38 10 2 154 63 24.7 14.3 6.5 -
Tamale 10 22 11 6 13 253 87 8.7 11.5 4.3 -
East Gonja 20 33 8 6 159 48 20.8 41.7 5.0 -
Nanumba North
11 23 4 3 6 90 17 25.6 64.7 4.4 -
Nanumba South
4 21 5 2 8 80 17 26.3 23.5 6.3 -
Savelugu Nanton
14 35 10 2 15 86 23 40.7 60.9 11.6 -
Zabzugu Tatale
12 26 11 2 13 92 19 28.3 63.2 12.0 -
Saboba-Chereponi
14 38 7 8 8 110 24 34.5 58.3 6.4 -
Kpandai
West Mamprusi
7 3 113 46 0.0 0.0 6.2 -
Bole 10 2 123 97 0.0 0.0 8.1 -
Sawla Tuna Kalba
5 2 83 18 0.0 0.0 6.0 -
Central Gonja
2 3 85 16 0.0 0.0 2.4 -
West Gonja 9 3 9 75 20 0.0 0.0 12.0 -
Upper East region
Bawku East 6 24 2 3 11 100 46 24.0 13.0 2.0 -
Bawku West
9 3 5 2 9 49 24 6.1 37.5 10.2 -
Bolgatanga 11 15 4 2 12 68 44 22.1 25.0 5.9 -
Bongo 16 5 3 2 10 62 31 8.1 51.6 4.8 -
Builsa 23 24 4 3 6 66 25 36.4 92.0 6.1 -
Garu Tempani
3 27 7 2 9 79 24 34.2 12.5 8.9 -

111
Talensi Nabdam
21 7 3 2 18 62 32 11.3 65.6 4.8 -
Kassena Nankana
13 11 6 4 20 101 51 10.9 25.5 5.9 -
Upper West region
Nadowli 16 21 5 2 9 78 40 26.9 40.0 6.4 -
Sissala West
11 6 4 3 5 41 24 14.6 45.8 9.8 -
Sissala East 9 6 3 3 15 45 35 13.3 25.7 6.7 -
Lawra 14 9 5 2 11 58 45 15.5 31.1 8.6 -
Wa West 5 2 5 67 41 0.0 0.0 7.5 -
Wa Municipal
4 2 9 63 26 0.0 0.0 6.3 -
Jirapa Lambussie
4 7 13 92 47 0.0 0.0 4.3 -
Wa East 5 2 9 58 42 0.0 0.0 8.6 -
TOTAL 291 510 200 104 2973 1164 17.2 25.0 6.7% -
Kpandai is a newly created district carved from East Gonja so its 3 schools have
been added to those of the mother district to compute the per cent for WFP; Newly
created districts Kassena Nankana is divided into two along with a few others which
have been divided making a total of 36 total number of districts.
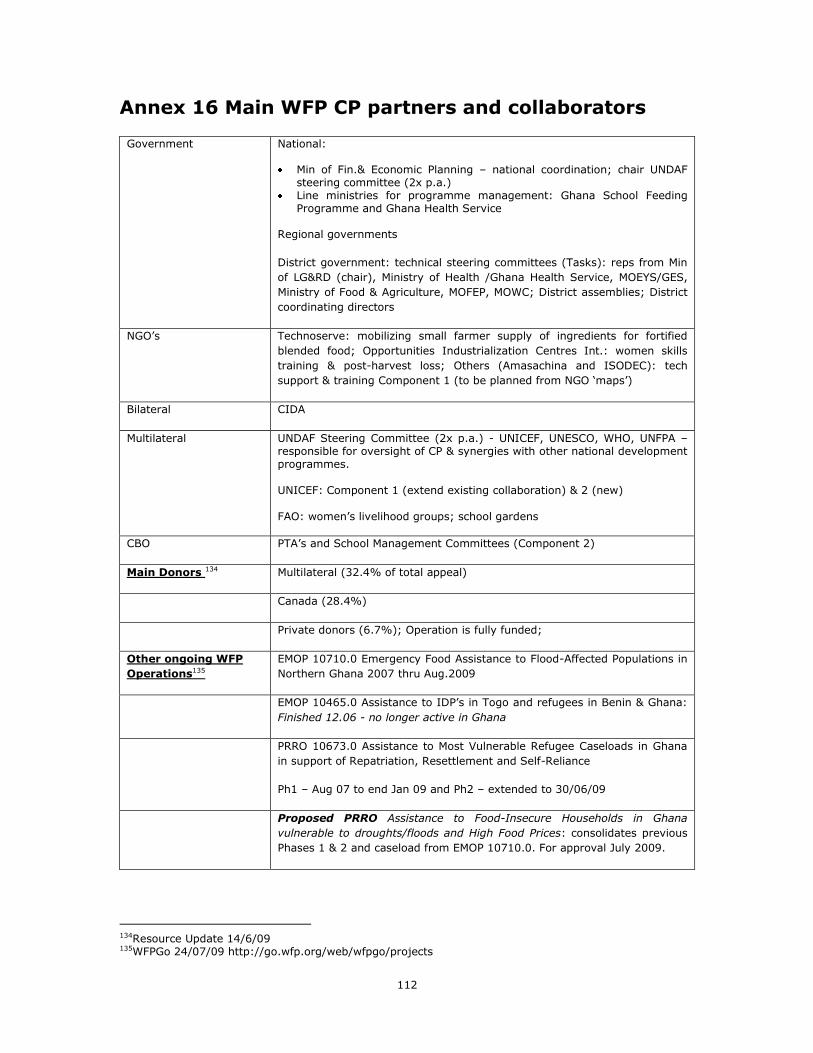
112
Annex 16 Main WFP CP partners and collaborators Government National:
Min of Fin.& Economic Planning – national coordination; chair UNDAF
steering committee (2x p.a.) Line ministries for programme management: Ghana School Feeding
Programme and Ghana Health Service
Regional governments
District government: technical steering committees (Tasks): reps from Min
of LG&RD (chair), Ministry of Health /Ghana Health Service, MOEYS/GES,
Ministry of Food & Agriculture, MOFEP, MOWC; District assemblies; District
coordinating directors
NGO‘s Technoserve: mobilizing small farmer supply of ingredients for fortified
blended food; Opportunities Industrialization Centres Int.: women skills
training & post-harvest loss; Others (Amasachina and ISODEC): tech
support & training Component 1 (to be planned from NGO ‗maps‘)
Bilateral CIDA
Multilateral UNDAF Steering Committee (2x p.a.) - UNICEF, UNESCO, WHO, UNFPA – responsible for oversight of CP & synergies with other national development programmes.
UNICEF: Component 1 (extend existing collaboration) & 2 (new)
FAO: women‘s livelihood groups; school gardens
CBO PTA‘s and School Management Committees (Component 2)
Main Donors 134 Multilateral (32.4% of total appeal)
Canada (28.4%)
Private donors (6.7%); Operation is fully funded;
Other ongoing WFP
Operations135
EMOP 10710.0 Emergency Food Assistance to Flood-Affected Populations in
Northern Ghana 2007 thru Aug.2009
EMOP 10465.0 Assistance to IDP‘s in Togo and refugees in Benin & Ghana:
Finished 12.06 - no longer active in Ghana
PRRO 10673.0 Assistance to Most Vulnerable Refugee Caseloads in Ghana
in support of Repatriation, Resettlement and Self-Reliance
Ph1 – Aug 07 to end Jan 09 and Ph2 – extended to 30/06/09
Proposed PRRO Assistance to Food-Insecure Households in Ghana
vulnerable to droughts/floods and High Food Prices: consolidates previous
Phases 1 & 2 and caseload from EMOP 10710.0. For approval July 2009.
134Resource Update 14/6/09 135WFPGo 24/07/09 http://go.wfp.org/web/wfpgo/projects

113
Annex 17 WFP Ghana food basket for CP (2006-2009)
and new basket (2010)
Food Basket (mt)136 New Food Basket 2010 (mt)137
Rice: 2,190 Rice: 2,190
Maize: 9,360 Maize: 9,360
CSB: 14,587 CSB:
Maize meal: 2,270 Maize meal: 2,270
Vegetable oil: 4,005 Vegetable oil: 4,005
Salt: 1,637 Salt: 1,637
Sugar: 1,121 Sugar: 1,121
Beans
Total: 35,169 Total: 35,169
136Food basket was changed reducing the amount of CSB and increasing the rice and bean commodities in October, 2009; Source: WFP Operational Brief on CP 10418.0 137Food basket was changed reducing the amount of CSB and increasing the rice and bean commodities in October, 2009; Source: WFP Operational Brief on CP 10418.0
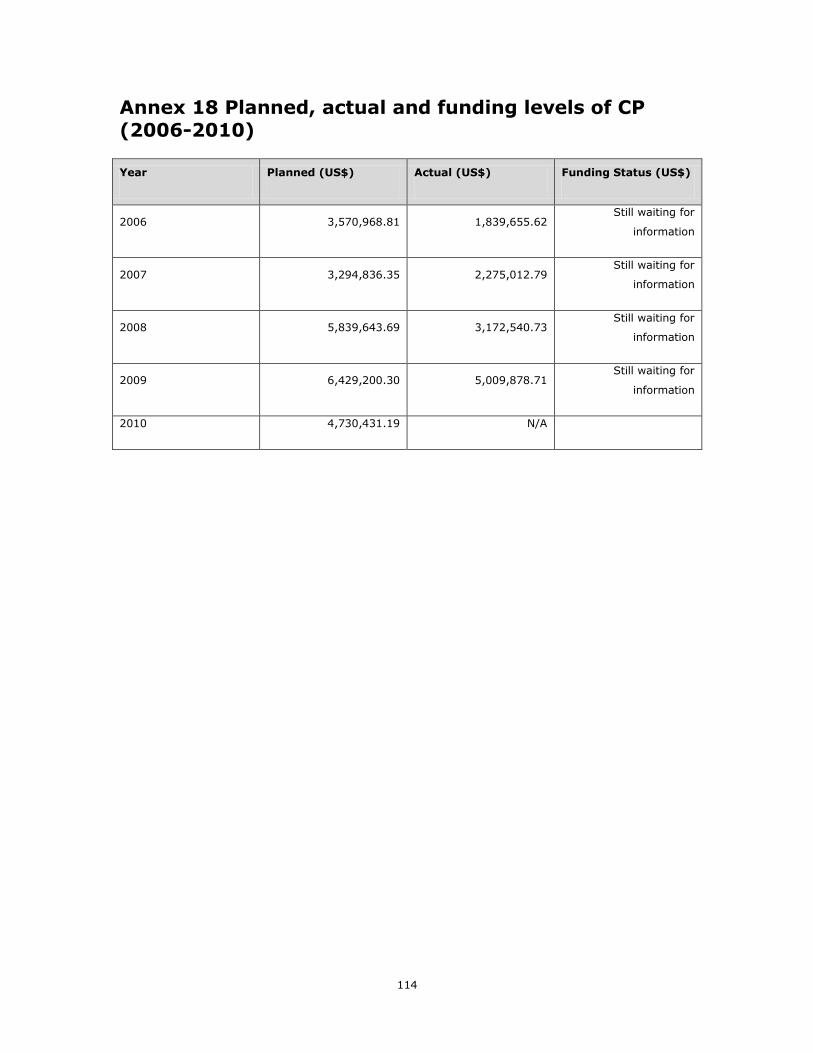
114
Annex 18 Planned, actual and funding levels of CP
(2006-2010)
Year Planned (US$) Actual (US$) Funding Status (US$)
2006 3,570,968.81 1,839,655.62 Still waiting for
information
2007 3,294,836.35 2,275,012.79 Still waiting for
information
2008 5,839,643.69 3,172,540.73 Still waiting for
information
2009 6,429,200.30 5,009,878.71 Still waiting for
information
2010 4,730,431.19 N/A
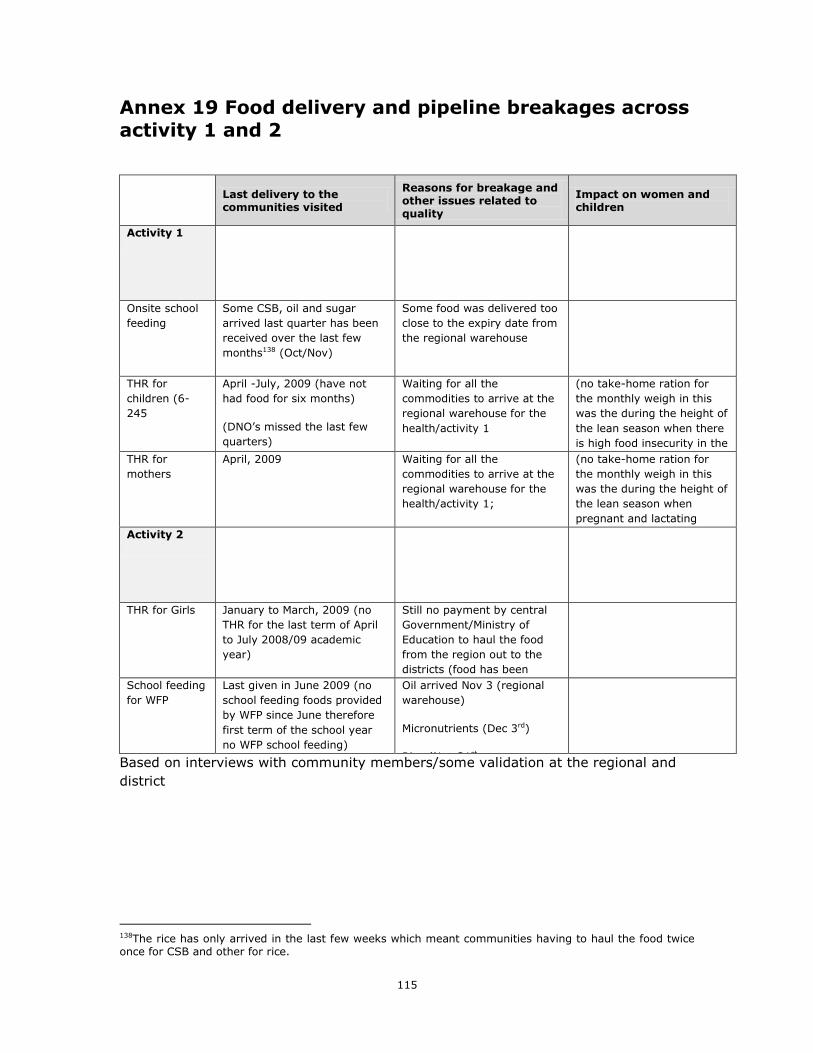
115
Annex 19 Food delivery and pipeline breakages across
activity 1 and 2
Last delivery to the communities visited
Reasons for breakage and other issues related to quality
Impact on women and children
Activity 1
Onsite school
feeding
Some CSB, oil and sugar
arrived last quarter has been
received over the last few
months138 (Oct/Nov)
Some food was delivered too
close to the expiry date from
the regional warehouse
THR for
children (6-
245
April -July, 2009 (have not
had food for six months)
(DNO‘s missed the last few
quarters)
Waiting for all the
commodities to arrive at the
regional warehouse for the
health/activity 1
(no take-home ration for
the monthly weigh in this
was the during the height of
the lean season when there
is high food insecurity in the
household, little food and
children each only two
meals per day)
THR for
mothers
April, 2009 Waiting for all the
commodities to arrive at the
regional warehouse for the
health/activity 1;
CSB in the warehouse has
only two more months before
expiry… will be too close to
this date in order to
effectively use at the
community level.
(no take-home ration for
the monthly weigh in this
was the during the height of
the lean season when
pregnant and lactating
mothers are most in need) Activity 2
THR for Girls January to March, 2009 (no
THR for the last term of April
to July 2008/09 academic
year)
Still no payment by central
Government/Ministry of
Education to haul the food
from the region out to the
districts (food has been
waiting and there are a high
level of weevil infestation in
the maize to be distributed)
School feeding
for WFP
Last given in June 2009 (no
school feeding foods provided
by WFP since June therefore
first term of the school year
no WFP school feeding)
Oil arrived Nov 3 (regional
warehouse)
Micronutrients (Dec 3rd)
Rice (Nov 21st
Beans (14th Sept)
Based on interviews with community members/some validation at the regional and
district
138The rice has only arrived in the last few weeks which meant communities having to haul the food twice once for CSB and other for rice.

116
Acronyms BMI Body Mass Index
CAADP Comprehensive Africa Agriculture Development Programme
CBO Community-Based organization
CFSVA Comprehensive Food Security and Vulnerability Analysis
CHN Community Health Nurse
CHNC Community Health and Nutrition Centre
CHPS Community-based Health Planning & Services
CMAM Community Management of Acute Malnutrition
CP Country Programme
CPAP Country Programme Action Plan
CRS Catholic Relief Services
CSB Corn-Soya Blend
DA District Assembly
DC/PS Day Care/ Pre-School
DHS Demographic and Health Survey
DNO District Nutrition Officer
EMOP Emergency Operation
FAO Food and Agriculture Organization of the United Nations
FASDEP Food and Agriculture Sector Development Policy
GDHS Ghana Demographic and Health Survey
GDP Gross Domestic Product
GES Ghana Education Service
GHS Ghana Health Service
GPI Gender Parity Index
GPRS Growth and Poverty Reduction Strategy
GSFP Ghana School Feeding Programme
IGA Income-Generating Activity
ITN Insecticide Treated Net
JHS Junior High School
MDG Millennium Development Goal
MICS Multiple Indicator Cluster Survey
NGO Non-Governmental Organization
OEDE Office of the Evaluation (OE as from January 2010)
OIC Opportunities International
PRRO Protracted Relief and Recovery Operation
PTA Parent-Teacher Association
RBM Results-Based Management
SBE Support for Basic Education
SFHNE Supplementary Feeding, Health and Nutrition Education
SHS Senior Secondary School
SMC School Management Committee
117
SPR Standard Project Report
THR Take Home Ration
UNDAF United Nations Development Assistance Framework
UNDP United Nations Development Programme
UNESCO United Nations Educational, Scientific and Cultural Organization
UNFPA United Nations Population Fund
UNICEF United Nations Children‘s Fund
USAID United States Agency for International Development
VAM Vulnerability Analysis and Mapping
WFP World Food Programme
WHO World Health Organization
World Food Programme
Office of Evaluation
Via Cesare Giulio Viola, 68/70
00148 Rome, Italy
Tel +39 0665131
http://www.wfp.org/evaluation
Rom
e A
pril 2
010, re
f: OE/2
010/0
08