emissions from coal fired power generation - … · emissions from coal fired power generation...
TRANSCRIPT

© OECD/IEA 2010
Emissions from coal fired power
Generation
Osamu Ito Energy Technology Policy Division
International Energy Agency
Workshop on
IEA High Efficiency, Low Emissions Coal Technology Roadmap
Date: 29 November 2011
Location: New Delhi

© OECD/IEA 2010
Prim
ary
Ene
rgy D
em
and
(Index 2
000year
(Mto
e)=
100)
Source: IEA Statistics
Demand for coal has been growing faster than any other
energy sources.
Increase in Primary Energy Demand, 2000-2009

© OECD/IEA 2010 Source: Platts
Cap
acit
y(M
W)
Large amount of sub-critical plants are still being operated. It is possible to increase
global average efficiency by adopting currently available Ultra super-critical, in
particular, in China, US and India.
Note: In case no year added, capacities are summation to 2010
Sub-critical
Super-critical
Ultra super-critical
Share of boilers in major countries for each steam condition

© OECD/IEA 2010
2009 Coal &Peat Oil Natural
gas Nuclear Hydro
Biofuels
&waste
Other
Renewables
Total
(TWh)
India 617 26 111 19 107 2 18 899
World 8119 1027 4301 2697 3252 288 370 20054
Share of electricity generation in India by resources (2009)
(IEA statistics)
India 899TWh(Total)
Electricity generation in India

© OECD/IEA 2010
Pla
nt
cap
acit
y in
Ind
ia(M
W)
Year
SUB- Critical
Super- Critical
Breakdown of coal-fired plant capacity in India:
A large amount of new capacity has been added over the decade.
Will this capacity increase continue to 2020 or after 2020?
How much share of super-critical will be occupied after 2020?
?
Source: Platts

© OECD/IEA 2010
9.8Gton CO2 in 2010
Co
al g
ene
rati
on
(TW
h)
(Reduced electricity by energy saving in ETP2010; 6049TWh)
1) Closing old coal plants
2) Replacing coal plants by Gas, Renewables Rest amount (9000TWh) is expected to reduce by substituting to gas and renewables .
In order to reduce CO2 emissions, two actions will be employed. One is an action
by the measure of policy & regulation. The other action is the development of
technologies.
Policy, Regulation
Technologies
Coal generation in BLUE Map scenario
3) Iimproving efficiency and deploying CCS
Source: IEA data

© OECD/IEA 2010
Flue gas
Turbine
Mill Boiler
De-NOx EP De-SO2
Generator Condenser
Steam Water
Coal
CO2 Storage Pollutants to be reduced
•SO2, NOx, PM
CO2
CO2 Capture
(2) Reducing non-GHG emissions
(3) Reducing CO2 emissions
(1) Reducing fuel consumption
EP: Electrostatic Precipitator
N2, H2O
PM: Particulate matter
For coal generation, reducing non-GHG pollutant emissions (SO2, NOx, PM) is
significantly important. In HELE roadmap, following three points will be focused on.
Technologies for clean coal generation

© OECD/IEA 2010
Max
SH
Tem
p.
Year
Supercritical 881g CO2/kWh
Source: VBG, IEA Clean Coal Centre
Ultra-supercritical
CCS technology
379g Coal/kWh
743g CO2/kWh 320g Coal/kWh
669g CO2/kWh 288g Coal/kWh
<100g CO2/kWh 330g- 370g Coal/kWh*
Advanced-USC(700°C), Integrated coal gasification
*Efficiency loss 7 to 12 points (base; A-USC w/o CCS)
CO2 emissions Fuel consumption
USC plants have been operated in Europe and Japan. Recently, most advanced plants in
China have reached the same steam condition. Further R&D effort to commercialize
higher efficiency plant like A-USC, IGCC is important.
Coal-fired plant status: past and future

© OECD/IEA 2010
TEPCO Hitachinaka No.1, Japan
(Boiler; Babcock-Hitachi )
(600°C/600°C 25MPa 1000MW)
(Operation; 2003/12-)
Basic design for
E.ON 50plus Project, Germany
(Boiler; Hitachi Power Europe)
(700°C/720°C 35MPa 500MW)
High efficient coal-fires power plants
USC(600°C) A-USC(700°C)
USC plants: Commercially available.
A-USC plants: R&D is intensively going on EU,Japan and US.

© OECD/IEA 2010
SCR: Selective Catalytic Reduction Wet-FGD :Wet-Flue Gas Desulfurization EP: Electrostatic Precipitator
Flue gas
Mill
Boiler
De-NOx EP De-SOx Coal
Stack
NOx
(mg/m3N) < 500-1000 < 50-100
SO2
(mg/m3N) < 20 < 20
< 20,000 < 5-10
<5000
< 30-50 < 5-10
< 50-100
PM
(mg/m3N)
Current best available technology(BAT) g/kWh base
< 0.16-0.42
< 0.06-0.08
< 0.016-0.042
Emissions of NOx, SO2 and PM far lower than regulated in most areas are possible,
using standard systems. For NOx minimization, flue gas treatment systems are used
and low-NOx combustion technology in boiler also helps to reduce NOx formation . PM
are removed by electrostatic precipitators or fabric filters, and SO2 is controlled by
scrubbing with limestone slurry in a flue gas desulphurisation.
I<- Existing flue gas treatment system ->I
Low emission technology for non-GHG pollutants

© OECD/IEA 2010
NO
x(g
/kW
h)
Figure: Trend of average NOx emission from thermal power plants
Year
<- 0.16-0.42
g/kWh(BAT)
Reducing NOx and SO2 has been major technical change over the decades and in
some OECD countries like Japan and Germany, air pollutant has been drastically
reduced by employing the flue gas treatment system. A certain policy action and
regulation is needed to deploy currently available technologies.
Source: Federation of Electric Power Companies,INFOBASE2010
NOx emissions from coal generation; regional status
BAT :Best Available Technology

© OECD/IEA 2010
Figure: Trend of average SO2 emission from thermal power plants
Year
Reducing NOx and SO2 have been major technical change over the decades and in
some OECD countries like Japan and Germany, air pollutant has been drastically
reduced by employing the flue gas treatment system. A certain policy action and
regulation is needed to deploy currently available technologies.
Source: Federation of Electric Power Companies,INFOBASE2010
SO2 emissions from coal generation; regional status
SO2
(g/k
Wh
)
g/kWh(BAT)
<- 0.06-0.08
BAT :Best Available Technology

© OECD/IEA 2010
Key messages
Role of coal in energy
•In the near term, coal will be dominant in electricity generation.
Future perspectives
•To achieve Blue Map scenario, both technology development and
strong policy actions are indispensable.
•USC for new installation and retrofit will be largely deployed and RD&D
of higher efficiency plants ( A-USC, IGCC) will be intensively promoted.
•Policies enacted to lead to closing of old existing plants. Replacing coal
plants by gas and renewables to be promoted.
Power generation
•High efficient technology (A-USC, IGCC) can contribute to reduce CO2
up to 670g/kWh. For further CO2 abatement, CCS is the only measure.
•In clean coal technology, reduction of non-GHG pollutant emissions
(SO2, NOx, PM) is indispensable and deployment of best available flue
gas treatment technologies should be intensively promoted.

© OECD/IEA 2010
Supplements

© OECD/IEA 2010
Ele
ctri
city
gen
era
tio
n (
TWh
)
Source: IEA Statistics
Key point: Although non-fossil electricity generations increased contributed to CO2 reduction, growth of generation from fossil fuel continues over the decade.
Global Electricity generation by resources in the world, 2000-2009

© OECD/IEA 2010
Year
Tota
l in
stal
led
cap
acit
y(M
W)
Source: Platts database
A large amount of new capacity is due to be added over the decade in China & India.
Trend of installed capacity in coal generation

© OECD/IEA 2010
Existing plants built before 2000
Plants built after 2000 (including plans)
1596 GW
1070 GW
Tota
l cap
acit
y
Source: Platts
Newly install power stations, in the absence of policies to encourage their early
retirement, will continue to operate and emit large quantities of CO2 until 2050.
Thus, even if no coal plants are built after 2015, total emissions from all coal-fired
plants would be almost equivalent to 2000 level. Without no CCS, total CO2
emission from these plants would definitely exceed the level of BLUE Map target.
Note: Plants life time is assumed 50 years
Equals to 67% of the total capacity in 2010
Year
Figure D.x: Projection of carbon lock in from coal generation
Case of carbon Lock in

© OECD/IEA 2010
Source: IEA Power Generation from Coal
Key point: Removing moisture from lignite is an important technology to improve efficiency in lignite power plant.
Removing moisture from lignite is an important to improve efficiency in lignite power
plant. Lignite drying can increase efficiency and reduce CO2 emissions substantially if
the technology used employs low grade heat and recovers as much energy from the
drying as possible.
Approximate influence of coal moisture on plant efficiency
© OECD/IEA 2010
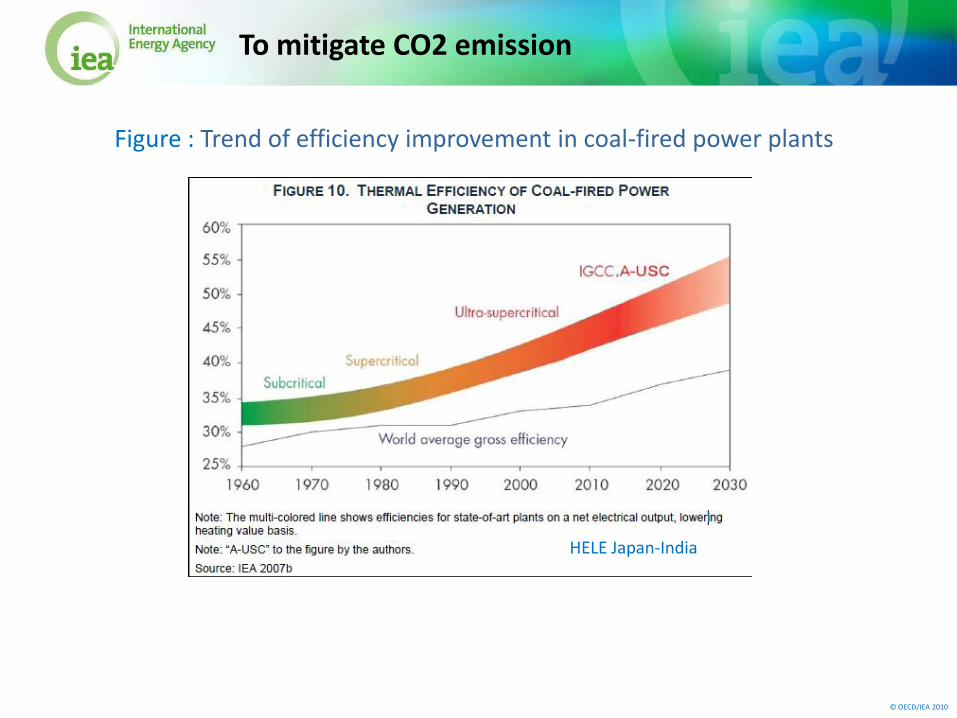
HELE Japan-India
To mitigate CO2 emission
Figure : Trend of efficiency improvement in coal-fired power plants