non-greenhouse gas emissions from coal-fired … gas... · non-greenhouse gas emissions from...
TRANSCRIPT
Non-greenhouse gas emissionsfrom coal-fired power plants inChina
Andrew Minchener
CCC/196 ISBN 978-92-9029-516-7
April 2012
copyright © IEA Clean Coal Centre
Abstract
Within the Twelfth Five-Year Plan, the Chinese Government has made addressing air quality problemsa key environmental priority, with an intention to accelerate the development of systems, institutionsand a technical knowledge base for sustained improvement. A major focus is on the coal power sectorfor which standards have been introduced that require the installation of modern, very high efficiencySO2, NOx and particulates emissions control systems. Nine key regions, which are facing verysignificant air quality challenges, are the three major economic zones around the cities of Beijing,Shanghai (Yangtze River Delta) and Guangzhou (Pearl River Delta), together with six areas aroundthe cities of Shenyang, Changsha, Wuhan, Chengdu Chongqing, the Shandong peninsula, and thecoastal area west of the Taiwan strait. These regions comprise the population and economic centres ofthe country, accounting for 64% of national GDP, 43% of total energy use, and 39% of the population.In these locations, all existing and new coal-fired power plants will have to achieve particulate, SO2and NOx emissions limits of 20, 50 and 100 mg/m3 respectively, with new plants expected to meet thestandards from 1 January 2012 and existing plants by 1 July 2014. At the same time, there will be anincreasing emphasis on limiting any new coal-fired power plants in these regions. For the rest of thecountry, the standards are not quite so strict and the SO2 limits for existing plants are less severe thanfor new plants. The new pollutant that will be regulated on coal-fired power plants is mercury and itscompounds, for which the limit has been set at a level that represents a core control. This means thatproviding the power plant operator meets the new particulate, SO2 and NOx standards then themercury standard should be met without the need to introduce an additional capture device, althoughthe emissions level will have to be measured on a regular basis. From a global perspective, this majorChinese environmental initiative will lead to a fundamental shift in the market for power plant airpollution control systems and services, which will mean that, in due course, there will be some majorChinese suppliers that are well positioned to exploit international sales opportunities.
Acronyms and abbreviations
2 IEA CLEAN COAL CENTRE
BACT best achievable control technologyBAT best available technologyBREF BAT reference documentCAAA Clean Air Act AmendmentsCAIR Clean Air Interstate RuleCAMR Clean Air Mercury RuleCCS carbon capture and storageCEM continuous emissions monitoringCFB circulating fluidised bedCFBC circulating fluidised bed combustorCHP combined heat and powerCO carbon monoxideCO2 carbon dioxideDEFRA Department of the Environment, Food and Rural AffairsEC European CommissionELV emission limit valueEPB Environment Protection BureauESP electrostatic precipitatorEU European UnionFBC fluidised bed combustionFGD flue gas desulphurisationFYP Five-Year PlanGDP gross domestic productGHG greenhouse gasGTCC gas turbine combined cycleGWe gigawatt electricHg mercuryIEA International Energy AgencyIED Industrial Emissions DirectiveIGCC integrated gasification combined cycleIPPC Integrated Pollution Prevention and ControlIT information technologyLAER lowest achievable emission rateLCPD Large Combustion Plant DirectiveLHV lower heating valueLNB low NOx burnerMACT maximum achievable control technologyMEP Ministry of Environmental ProtectionMOST Ministry of Science and TechnologyNAAQS National Ambient Air Quality StandardsNDRC National Development and Reform CommissionNEA National Energy AdministrationNERP National Emission Reduction PlanNO2 nitrogen dioxideNOx nitrogen oxidesNSPS New Source Performance StandardsO2 oxygenO3 ozoneOECD Organisation for Economic Cooperation and DevelopmentPb lead
PC pulverised coalPM2.5 particulates with a mean diameter of 2.5 micronsPM10 particulates with a mean diameter of 10 micronsRMB ReminbiS sulphurSC supercriticalSCR selective catalytic reductionSEI strategic emerging industrySIP State Implementation PlanSNCR selective non-catalytic reductionSO2 sulphur dioxideSOE State Owned EnterpriseTEC total emission controlTSP total suspended particulatesUNECE United Nations Economic Commission for EuropeUS United StatesUSA United States of AmericaUSC ultra-supercriticalUS EPA United States Environmental Protection AgencyVOC volatile organic compoundWHO World Health Organisation
Unitsg/kWh gramme per kilowatt hourGt gigatonnegce/kWh gramme coal equivalent per kilowatt hourkPa kilopascalm3 cubic metremg/m3 milligramme per cubic metremg/MJ milligramme per megajouleMJ/kg megajoules per kilogrammeMt million tonnesMWe megawatt electricMWth megawatt thermalt/h tonne per hour
Currency converterAll costs quoted in this report are given in the units used in the original references. These are eitherthe Reminbi (RMB), China's currency, which has been used in various Chinese estimates ofequipment costs, or US dollars (US$), which have been used where such estimates have beenattributed to, say, an international technology supplier. These data can be several years old. Thecurrent exchange rate as of 1 November 2011 is 6.36 RMB: 1 US$. However, caution must be usedas while the RMB: US$ exchange rate was traditionally constant, it has changed significantly sincethe onset of the global financial crisis.
3Non-greenhouse gas emissions from coal-fired power plants in China
Acronyms and abbreviations
Contents
Acronyms and abbreviations . . . . . . . . . . . . . . . . . . . . . . . . . . . . . . . . . . . . . . . . . . . . . . . . 2
Contents. . . . . . . . . . . . . . . . . . . . . . . . . . . . . . . . . . . . . . . . . . . . . . . . . . . . . . . . . . . . . . . . 4
1 Introduction . . . . . . . . . . . . . . . . . . . . . . . . . . . . . . . . . . . . . . . . . . . . . . . . . . . . . . . . . 7
2 Government strategies and policies for non-GHG emissions control in the coal-fired power sector . . . . . . . . . . . . . . . . . . . . . 8
2.1 Background . . . . . . . . . . . . . . . . . . . . . . . . . . . . . . . . . . . . . . . . . . . . . . . . . . . . . . 82.2 Strategic target and objectives . . . . . . . . . . . . . . . . . . . . . . . . . . . . . . . . . . . . . . . 92.3 Historical review of the Eleventh Five-YearPlan . . . . . . . . . . . . . . . . . . . . . . . . 102.4 Overview of the Twelfth Five-Year Plan . . . . . . . . . . . . . . . . . . . . . . . . . . . . . . 112.5 Environmental regulations and standards . . . . . . . . . . . . . . . . . . . . . . . . . . . . . . 13
2.5.1 Coal-fired power plant emission limits to the end of 2011 . . . . . . . . . . 132.5.2 Coal-fired power plant emission limits from the start of 2012 . . . . . . . 142.5.3 Ambient Air Quality Standards & Air Quality Index . . . . . . . . . . . . . . 162.5.4 The Regional Air Quality Management Rule . . . . . . . . . . . . . . . . . . . . . 16
2.6 Implications for the coal power generation sector . . . . . . . . . . . . . . . . . . . . . . . 172.6.1 Improved energy efficiency initiatives . . . . . . . . . . . . . . . . . . . . . . . . . . 172.6.2 Improved environmental performance . . . . . . . . . . . . . . . . . . . . . . . . . . 17
2.7 Future requirements . . . . . . . . . . . . . . . . . . . . . . . . . . . . . . . . . . . . . . . . . . . . . . 18
3 Overview of coal -fired power generation in China . . . . . . . . . . . . . . . . . . . . . . . . . . 193.1 Recent historical overview . . . . . . . . . . . . . . . . . . . . . . . . . . . . . . . . . . . . . . . . . 193.2 Current and future coal power capacity . . . . . . . . . . . . . . . . . . . . . . . . . . . . . . . 203.3 Possible technology options . . . . . . . . . . . . . . . . . . . . . . . . . . . . . . . . . . . . . . . . 21
4 Current and likely future emissions of non-GHG emissions from coal-fired power plants in China . . . . . . . . . . . . . . . . . . . 22
4.1 Historical review of particulate emissions . . . . . . . . . . . . . . . . . . . . . . . . . . . . . 224.2 Historical review of SO2 emissions . . . . . . . . . . . . . . . . . . . . . . . . . . . . . . . . . . 224.3 Historical review of NOx emissions . . . . . . . . . . . . . . . . . . . . . . . . . . . . . . . . . 234.4 Mercury emission issues. . . . . . . . . . . . . . . . . . . . . . . . . . . . . . . . . . . . . . . . . . . 244.5 Projections of future non-GHG emissions . . . . . . . . . . . . . . . . . . . . . . . . . . . . . 24
5 Monitoring, verification and control. . . . . . . . . . . . . . . . . . . . . . . . . . . . . . . . . . . . . . 265.1 Resourcing issues . . . . . . . . . . . . . . . . . . . . . . . . . . . . . . . . . . . . . . . . . . . . . . . . 265.2 Operating approach of the MEP . . . . . . . . . . . . . . . . . . . . . . . . . . . . . . . . . . . . . 265.3 Interactions at provincial and enterprise levels . . . . . . . . . . . . . . . . . . . . . . . . . 275.4 Controlling and monitoring emissions from the coal-fired power sector . . . . . 275.5 Implications of non-compliance . . . . . . . . . . . . . . . . . . . . . . . . . . . . . . . . . . . . . 28
6 Market opportunities to 2020 . . . . . . . . . . . . . . . . . . . . . . . . . . . . . . . . . . . . . . . . . . . 296.1 Particulates/fly ash removal and utilisation . . . . . . . . . . . . . . . . . . . . . . . . . . . . 29
6.1.1 ESP and bag filters . . . . . . . . . . . . . . . . . . . . . . . . . . . . . . . . . . . . . . . . . 296.1.2 Particulates/fly ash utilisation . . . . . . . . . . . . . . . . . . . . . . . . . . . . . . . . . 30
6.2 FGD . . . . . . . . . . . . . . . . . . . . . . . . . . . . . . . . . . . . . . . . . . . . . . . . . . . . . . . . . . 306.2.1 Likely opportunities . . . . . . . . . . . . . . . . . . . . . . . . . . . . . . . . . . . . . . . . 316.2.2 Likely technology suppliers . . . . . . . . . . . . . . . . . . . . . . . . . . . . . . . . . . 31
4 IEA CLEAN COAL CENTRE
6.3 NOx control . . . . . . . . . . . . . . . . . . . . . . . . . . . . . . . . . . . . . . . . . . . . . . . . . . . . 336.3.1 Likely opportunities . . . . . . . . . . . . . . . . . . . . . . . . . . . . . . . . . . . . . . . . 346.3.2 Likely technology suppliers . . . . . . . . . . . . . . . . . . . . . . . . . . . . . . . . . . 34
6.4 Monitoring and verification equipment . . . . . . . . . . . . . . . . . . . . . . . . . . . . . . . 356.4.1 Likely opportunities and market value . . . . . . . . . . . . . . . . . . . . . . . . . . 356.4.2 Likely equipment suppliers. . . . . . . . . . . . . . . . . . . . . . . . . . . . . . . . . . . 35
6.5 Global considerations . . . . . . . . . . . . . . . . . . . . . . . . . . . . . . . . . . . . . . . . . . . . . 35
7 Comparison with the EU and the USA. . . . . . . . . . . . . . . . . . . . . . . . . . . . . . . . . . . . 377.1 EU legislation and standards. . . . . . . . . . . . . . . . . . . . . . . . . . . . . . . . . . . . . . . . 37
7.1.1 Integrated Pollution Prevention and Control . . . . . . . . . . . . . . . . . . . . . 377.1.2 Large Combustion Plant Directive . . . . . . . . . . . . . . . . . . . . . . . . . . . . . 387.1.3 Industrial Emissions Directive . . . . . . . . . . . . . . . . . . . . . . . . . . . . . . . . 38
7.2 USA legislation and standards . . . . . . . . . . . . . . . . . . . . . . . . . . . . . . . . . . . . . . 407.2.1 CAAA, NAAQS and NSPS . . . . . . . . . . . . . . . . . . . . . . . . . . . . . . . . . . 417.2.2 CAIR and CAMR (now vacated) . . . . . . . . . . . . . . . . . . . . . . . . . . . . . . 427.2.3 The new Air Toxics Rule . . . . . . . . . . . . . . . . . . . . . . . . . . . . . . . . . . . . 427.2.4 Regional legislation. . . . . . . . . . . . . . . . . . . . . . . . . . . . . . . . . . . . . . . . . 42
7.3 Implications. . . . . . . . . . . . . . . . . . . . . . . . . . . . . . . . . . . . . . . . . . . . . . . . . . . . . 43
8 Conclusions . . . . . . . . . . . . . . . . . . . . . . . . . . . . . . . . . . . . . . . . . . . . . . . . . . . . . . . . 448.1 Rationale and guiding principles . . . . . . . . . . . . . . . . . . . . . . . . . . . . . . . . . . . . 448.2 Implementation within the Twelfth Five-Year Plan . . . . . . . . . . . . . . . . . . . . . . 458.3 Final thoughts . . . . . . . . . . . . . . . . . . . . . . . . . . . . . . . . . . . . . . . . . . . . . . . . . . . 46
9 References . . . . . . . . . . . . . . . . . . . . . . . . . . . . . . . . . . . . . . . . . . . . . . . . . . . . . . . . . 48
Acknowledgements
The contributions that were made through meetings and discussions with various individuals andorganisations in China are listed below, and are acknowledged with grateful thanks:
Professor Yue Guangxi – Tsinghua University, Department of Thermal EngineeringProfessor He Kebin – Tsinghua University, Department of Environmental ScienceProfessor Jiang Kejun – Energy Research InstituteProfessor Tang Fei – China Power Engineering Research Consulting Company
The baseline information on EU and USA emissions limits that was used in Chapter 8 was providedby Dr Lesley Sloss, and drawn from reports that she has prepared for the IEA Clean Coal Centre.
5Non-greenhouse gas emissions from coal-fired power plants in China
Contents

6 IEA CLEAN COAL CENTRE
1 Introduction
7Non-greenhouse gas emissions from coal-fired power plants in China
This study has been undertaken to provide input for the International Energy Agency (IEA)programme to develop a High Efficiency, Low Emissions Coal Technology Roadmap, which will bean important addition to the series of technology roadmaps that the organisation has been publishingsince 2009. This roadmap focuses on coal use in power generation worldwide with an emphasis on thepotential role of coal-fired power generation in reducing global energy-related CO2 emissionssubstantially below current levels. At the same time, it is important that the non-greenhouse gas(non-GHG) emissions are also considered in terms of the overall environmental impact.
This report provides a review of the non-GHG emissions from coal-fired power plants in China, thecountry that will dominate coal use on a global basis for the foreseeable future. It first summarisesChinese Government policies and regulations for improving air quality throughout China, with a focuson the steps being taken to make significant energy and environmental improvements in the coalpower sector. The emissions standards for SO2, NOx and fine particulates have been significantlytightened with effect from 1 January 2012 and there are plans to address other pollutants of concernby 2015. Information is also provided on the changes to the associated ambient air quality regulationsthat are being introduced and how these will have an impact on the likelihood of further coal-firedpower plants being established in certain regions.
A summary of the current capacity of coal-fired power plants in China, the expected growth of suchcapacity, the likely technology mix and the associated size of the units through to 2020, as defined inthe various national plans, together with a broad estimate of subsequent future changes is presented.This is followed by a detailed review of past and current non-GHG emissions from such coal powerplant. Information is also included on the main techniques used to control non-GHG emissions withinthe Chinese coal-fired sector and the scope for improvements in the light of new, more demanding,legislation. On this basis, the projected future emissions of these pollutants from coal-fired plant inChina are then considered.
The other important requirement is to ensure effective implementation such that power plants meet thelegislated emission standards, and comment is made on the previous procedures used by the StateGovernment to ensure compliance and how these have evolved to provide the current system formonitoring, verification and control.
The likely market opportunities arising in China are considered and, as far as reliable information isavailable publicly, the capital and operational costs for the introduction of either new or upgradedemissions control equipment are reviewed. Comment is also provided on the changing trends intechnology suppliers since, initially, equipment was sourced from international companies but now itis increasingly being supplied from within China.
The approach being adopted in China is further considered within the global context, with particularcomparison being made to the current and likely future situation within Europe and the USA, both ofwhich are significant coal users but have differing emissions legislation.

2 Government strategies and policies for non-GHGemissions control in the coal-fired power sector
8 IEA CLEAN COAL CENTRE
There are various government bodies that have key roles for environmental policy issues within theenergy sector (Minchener, 2011). The National Development and Reform Commission (NDRC) isresponsible for overall policy/long-term planning and overall management in all the industrial sectors,which includes the development plans within the National Five -Year Plans (NDRC, 2011a). Inaddition, there is the National Energy Administration (NEA), which has specific responsibilities forthe energy sectors (NDRC, 2011b). This was established in 2008, as part of a move to strengthen thecentralised management of major energy issues, within the NDRC framework of ensuring thesustainable and steady development of the national economy. The remit of the Ministry ofEnvironmental Protection (MEP) includes the prevention and control of environmental pollution, andthe safeguard of public health and environmental safety. Within the context of coal-fired powergeneration, the Ministry establishes environmental standards and emissions limits (MEP, 2009a).
In January 2010, in recognition that energy sector management was spread between various agencies,the National Energy Commission was established with the remit to co-ordinate national energydevelopment strategy, address significant issues concerning energy security and energy development,and co-ordinate major programmes of domestic energy development and global co-operation. TheCommission is led by the Chinese premier with senior representation from all the other energy relatedcommissions and ministries (People’s Daily Online, 2010a; China Greentech Initiative, 2011). Thatsaid, it should be noted that the NEA was previously given this role in 2008 and this change inapproach reflects the difficulty in establishing a coherent and unified energy and environment policy.
The State Council is both the senior administration and executive body within China. It comprises thepremier, vice-premiers, state councillors, ministers in charge of ministries and commissions, theauditor-general and the secretary-general (People’s Daily Online, 2011).
2.1 Background
China operates on the basis of a five-year planning cycle, as defined by the Five-Year Plan (FYP) forNational Economic and Social Development. This sets out the intended way forward for the nationand provides guidelines, policy frameworks, and targets for policy-makers at all levels of government(APCO, 2010). Each plan provides top down overall objectives and goals related to economic growthand industrial planning in key sectors and regions, while more recently also covering social issues.Although the timescale is nominally five years, many policies and directives flow through from oneplan to the next.
The process begins with State Government guidelines and supporting policies together with targetedpolicy initiatives, which are prepared by various national commissions and ministries. These thenform the framework against which provincial and local organisations provide detailed work plans forachieving the designated targets. Alongside the introduction of various policies and directives, theGovernment introduces specific regulations to enforce the achievement of the targets. There is also anongoing process of review and revision over the five-year lifetime of the plan, not least becauseeffective implementation at the provincial and local levels can be difficult (APCO, 2010).
In the context of balancing growth with environmental consequences, China has achieved rapideconomic development, particularly since the mid-1990s, at an average level of 7–8% of grossdomestic product (GDP) each year. This growth, which has been underpinned by significant increasesin coal use especially for power generation, has caused severe air pollution problems, especially inurban areas (Minchener, 2004). There are severe acid rain problems across large regions of Southern

China, which have arisen from a combination of industrial emissions of acid gases and particulatesdue to coal combustion. At the same time, in cities throughout the country, the air pollution levels arehigh, with 90% of those assessed failing to meet WHO health-based standards (RAP, 2011).
These air pollution problems are responsible both for damage to crops and for various healthproblems, leading to hundreds of thousands of deaths a year in China. A major study (World Bank,2007; MEP, 2008) between the State Environmental Protection Administration, now part of the MEP,and the World Bank reported that:� the annual combined health and non-health cost of outdoor air and water pollution for China’s
economy is some $US100 billion a year;� air pollution, especially in large cities, is leading to higher incidences of lung diseases, including
cancer, respiratory system problems and therefore higher levels of work and school absenteeism;� water pollution is also causing growing levels of cancer and diarrhoea particularly in young
children; � water pollution is further exacerbating China’s severe water scarcity problems, raising the overall
cost of water scarcity to about 1% of GDP.
Recently, the MEP has stated that China is facing very serious challenges in environmental protection,with more than half of China’s cities affected by acid rain, about 40% of major rivers too polluted forthe water to be used except for industrial purposes and landscaping, and with about 16% of the totalunfit for agricultural irrigation (China Daily, 2011a,d). At the same time, less than 4% of the 471 citiesmonitored achieved top ratings for air cleanliness, and there was a continued loss of biodiversityaround the country. Besides the air and water pollution in cities, heavy metal pollution was also a bigconcern, with fourteen major incidents in 2010.
Following these various assessments of the pollution challenges, the Chinese Government has madeaddressing such problems a key environmental priority, with an intention to accelerate thedevelopment of systems, institutions and a technical knowledge base for sustained air qualityimprovement. This is being supported with significant investments to meet the enormous nationalneeds for cleaner energy, air and water (Global Impact Consulting, 2011).
2.2 Strategic target and objectives
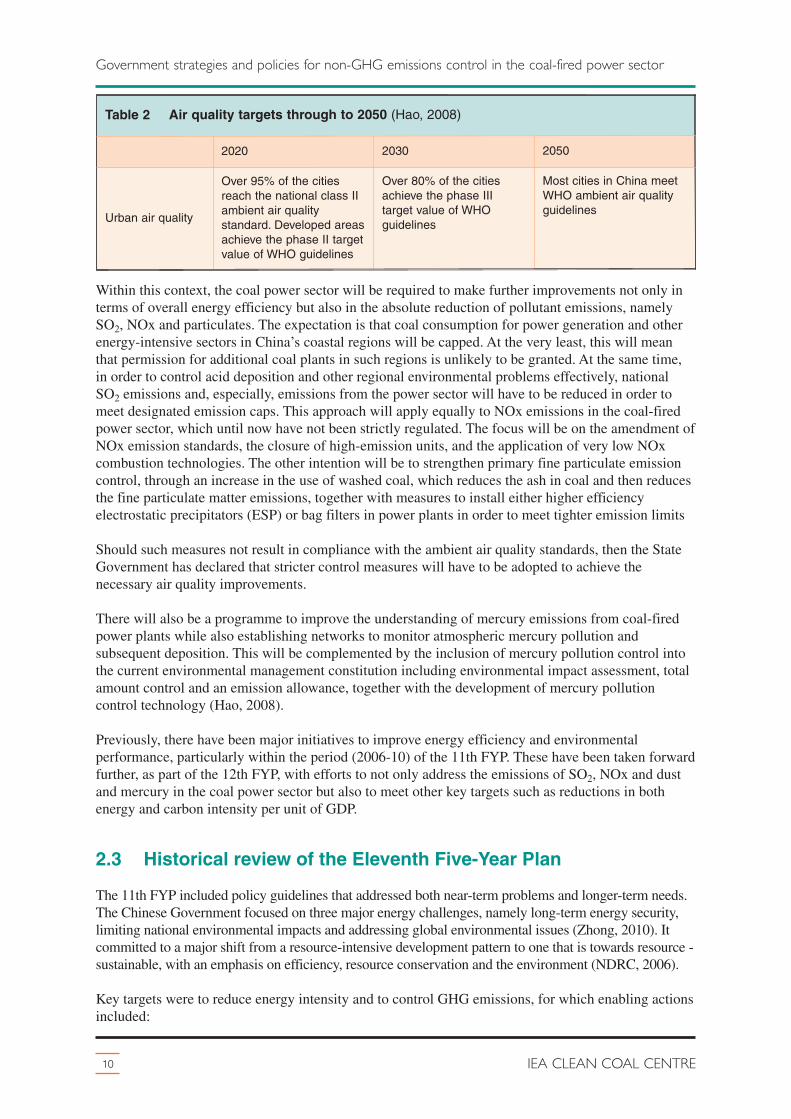
The national strategic target for atmospheric environmental protection, through to 2050, is to protectpublic health and ensure ecological safety, with the intention that all regions of the country shall meetthe national ambient air quality standard by achieving the World Health Organisation (WHO) ambientair quality guideline values (see Table 1).
In overall terms, based on 2005 levels, this will require that ambient SO2 emissions should be reducedby 60%, NOx by 40%, PM10 by 50% and VOC by 40% (Hao, 2008). It is intended that a phased, ifrather qualitative, approach will be adopted, as set out in Table 2.
9Non-greenhouse gas emissions from coal-fired power plants in China
Government strategies and policies for non-GHG emissions control in the coal-fired power sector
Table 1 WHO ambient air quality guideline values, µg/m3 (Hao, 2008)
PM2.5 PM10 O3 NO2 SO2
Annualaverage
24-houraverage
8-houraverage
Annualaverage
Hourlyaverage
Hourlyaverage
10-minuteaverage
Phase I 70 150 125
Phase II 50 100 150 50
Phase III 30 75 40 200
Guide value 10 50 100 20 500
Within this context, the coal power sector will be required to make further improvements not only interms of overall energy efficiency but also in the absolute reduction of pollutant emissions, namelySO2, NOx and particulates. The expectation is that coal consumption for power generation and otherenergy-intensive sectors in China’s coastal regions will be capped. At the very least, this will meanthat permission for additional coal plants in such regions is unlikely to be granted. At the same time,in order to control acid deposition and other regional environmental problems effectively, nationalSO2 emissions and, especially, emissions from the power sector will have to be reduced in order tomeet designated emission caps. This approach will apply equally to NOx emissions in the coal-firedpower sector, which until now have not been strictly regulated. The focus will be on the amendment ofNOx emission standards, the closure of high-emission units, and the application of very low NOxcombustion technologies. The other intention will be to strengthen primary fine particulate emissioncontrol, through an increase in the use of washed coal, which reduces the ash in coal and then reducesthe fine particulate matter emissions, together with measures to install either higher efficiencyelectrostatic precipitators (ESP) or bag filters in power plants in order to meet tighter emission limits
Should such measures not result in compliance with the ambient air quality standards, then the StateGovernment has declared that stricter control measures will have to be adopted to achieve thenecessary air quality improvements.
There will also be a programme to improve the understanding of mercury emissions from coal-firedpower plants while also establishing networks to monitor atmospheric mercury pollution andsubsequent deposition. This will be complemented by the inclusion of mercury pollution control intothe current environmental management constitution including environmental impact assessment, totalamount control and an emission allowance, together with the development of mercury pollutioncontrol technology (Hao, 2008).
Previously, there have been major initiatives to improve energy efficiency and environmentalperformance, particularly within the period (2006-10) of the 11th FYP. These have been taken forwardfurther, as part of the 12th FYP, with efforts to not only address the emissions of SO2, NOx and dustand mercury in the coal power sector but also to meet other key targets such as reductions in bothenergy and carbon intensity per unit of GDP.
2.3 Historical review of the Eleventh Five-Year Plan
The 11th FYP included policy guidelines that addressed both near-term problems and longer-term needs.The Chinese Government focused on three major energy challenges, namely long-term energy security,limiting national environmental impacts and addressing global environmental issues (Zhong, 2010). Itcommitted to a major shift from a resource-intensive development pattern to one that is towards resource -sustainable, with an emphasis on efficiency, resource conservation and the environment (NDRC, 2006).
Key targets were to reduce energy intensity and to control GHG emissions, for which enabling actionsincluded:
10 IEA CLEAN COAL CENTRE
Government strategies and policies for non-GHG emissions control in the coal-fired power sector
Table 2 Air quality targets through to 2050 (Hao, 2008)
2020 2030 2050
Urban air quality
Over 95% of the citiesreach the national class IIambient air qualitystandard. Developed areasachieve the phase II targetvalue of WHO guidelines
Over 80% of the citiesachieve the phase IIItarget value of WHOguidelines
Most cities in China meetWHO ambient air qualityguidelines
� the establishment by the State Council of a National Leading Group to address climate change,energy conservation and pollutant discharge reduction;
� the launch of the ‘Middle and Long Term Programme of Renewable Energy Development’;� the introduction of the ‘General Work Plan’, with appropriate public action, for energy
conservation and pollutant discharge reduction;� energy intensity (ie energy consumption per unit of GDP) to be cut by 20% from 2005 levels
over the five-year lifetime of the plan;� a 10% reduction of major pollutants (SO2 and total suspended particulates) discharge to be
achieved compared to 2005 levels over the same timescale.
The latter two actions were particularly significant, with the NDRC deciding how these two targetswould be achieved between individual provinces and within the various industrial sectors(NDRC, 2006).
Considerable emphasis was put on the improvement of coal-fired power plant efficiency through theintroduction of advanced high efficiency units and the closure of some 72 GWe of small, inefficientpower plants (Minchener, 2010), together with the closure of small and obsolete steel and cementproduction units (NDRC, 2007a,b). For major pollutant discharge reductions, this was addressedthrough the introduction of improved ESP for fine particulate emissions control, together with thevery extensive provision of flue gas desulphurisation (FGD) for SO2 control on most existingoperating and on all new coal-fired power plants (Minchener, 2010).
2.4 Overview of the Twelfth Five-Year Plan
The guidelines for the 12th FYP represent a continuation of broad policy direction and its key themesare rebalancing the economy, addressing social inequality and protecting the environment (ChinaDaily, 2011a,b). From an economic perspective, a notional GDP annual growth rate target of 7% isassumed, with a greater emphasis on consumption-led inclusive growth rather than investments andexports (GCCSI, 2011).
For the first time, the plan gives a high profile to climate change and environmental issues as well asto energy (The Climate Group, 2011). The need to meet China’s increasing energy demand, whilesimultaneously reducing pollution and ensuring a stable, reliable and clean energy supply, has becomean ongoing priority of the government, which is also supported by a significant investmentcommitment.
During the 11th FYP, the government allocated RMB200 billion (US$31 billion) for energy efficiencyand environmental protection measures, which is understood to have created a large knock-on effectby generating an additional RMB2 trillion in economic activity. For the 12th FYP period, it isunderstood that China’s investment in the environmental protection industry will exceedRMB3 trillion, with the industry growing by 15–20%/y. Within this framework, the intention is todevelop seven strategic emerging industries (SEI), which include energy conservation andenvironmental protection, new energy, together with biotechnology, high-end equipmentmanufacturing, clean-energy vehicles, new materials, and next-generation IT. The State Governmentwill pilot the development of these industries by establishing industrial standards and supporting theentry of the main products into the international market (Global Times, 2010). This will includefacilitating co-ordinated development together with support for international distribution. It isunderstood that the government expects to increase the SEI contribution to GDP from approximately5% in 2010 to 8% by 2015 and to 15% by 2020 (APCO, 2010).
Several important energy and environment targets have been set for the period to 2015 (China Daily,2011b,c; RAP, 2011) with:� energy consumption per unit of GDP to be cut by 16% from 2010 levels;
11Non-greenhouse gas emissions from coal-fired power plants in China
Government strategies and policies for non-GHG emissions control in the coal-fired power sector
� carbon dioxide (CO2) emissions per unit of GDP to be cut by 17% from 2010 levels;� non-fossil fuel use to account for 11.4% of primary energy consumption, with a target of 15% for2020;
� SO2 emissions and chemical oxygen demand (a measure of water quality) both to be cut by 8%from 2010 levels;
� NOx and ammoniac nitrogen emissions both to be cut by 10% from 2010 levels; � heavy metals pollution (mercury, lead, chromium, cadmium, and arsenic) to be reduced by either15% compared to 2007 levels for priority regions or to 2007 levels for other regions;
� water consumption per unit of value-added industrial output to be cut by 30%; � research and development expenditure to account for 2.2% of GDP, with an emphasis on scientificand technological innovation leading to Chinese intellectual property rights.
It is also expected that the NDRC will introduce new environmental taxes covering SO2 andwastewater in the near future, with the possibility of subsequently including CO2 (China Daily, 2010).Other new market mechanisms such as tiered energy pricing and pilot carbon emissions tradingprogrammes will also be explored, with selected provinces and specific sectors being the focus of theinitial experiments in cap-and-trade (China-US Focus, 2011).
With regard to both the energy and environment targets, the overall savings requirements amongst theprovinces and the sectors where the savings will be made (iron & steel, non-ferrous metals, cement,petrochemicals and power) will be allocated in a predominantly top-down process, as was undertakenduring the 11th FYP period (Chinadialogue, 2011a; China FAQs, 2011). Thus the intended 16%
12 IEA CLEAN COAL CENTRE
Government strategies and policies for non-GHG emissions control in the coal-fired power sector
Qinghai
Tibet
Xinjiang
Heilongjiang
Jilin
Liaoning
Hebei
Beijing
Anhui
Henan
Shanghai
JiangxiFujian
Hubei
Hunan
Guizhou
GuangxiYunnan
Sichuan
ShaanxiGansu
Inner Mongolia
Jiangsu
Hainan
Shandong
Zhejiang
Guangdong
Ningxia Shanxi
0 400km
Chongqing
TAIWAN
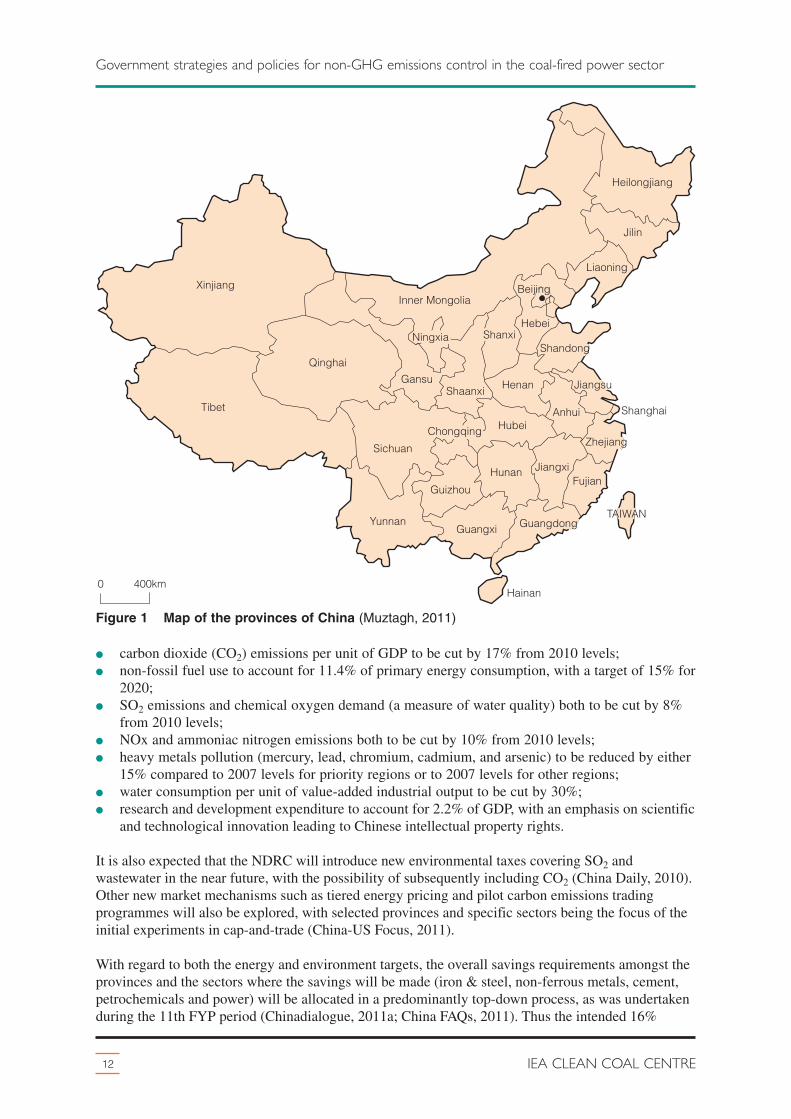
Figure 1 Map of the provinces of China (Muztagh, 2011)
overall cut in energy intensity (energy consumed per unit of GDP) is the national target. At theprovincial level, there are some variations, depending on local circumstances, especially the level ofdevelopment. Figure 1 provides geographical information on the provinces. The eastern and centralprovinces have been allocated targets in the range 16–18%. In contrast, the western provinces,Qinghai, Xinjiang and Tibet, which are relatively undeveloped and have large ethnic minoritypopulations, have been given energy-intensity targets of 10%, while Ningxia and Gansu, also in thewest, have been given targets of 15%.
Similarly, the environmental targets will be allocated to provinces, based roughly on comparativeemission volumes and levels of economic development. The key priority regions where accelerated airquality management is intended (see below) will be expected to achieve 13–15% reductions in SO2and 14–17% reductions in NOx emissions. In contrast, the central regions will have 5% targets bothfor SO2 and NOx emissions while the western regions will have reduction targets of between 0% and5% for both pollutants. Performance against these will be reviewed at the mid-point of the Plan andcan be adjusted by the NDRC and the MEP, depending on progress to date and the scope forimprovement.
2.5 Environmental regulations and standards
During the period of the 12th FYP, the Chinese Government is taking steps to tighten emissions fromthe power, steel, non-ferrous metals, petroleum, chemical and cement sectors, as part of the overallintention of achieving more stringent air quality standards. The initial focus is on power plants, forwhich a new emission standard has been developed following an extensive analysis of industrialemissions, air quality issues, regional variations in industrial activity and environmental problems(MEP, 2009b).
This new standard, which came into effect at the start of January 2012, is applicable to any coal-firedboilers (other than some types of stoker-fired boilers almost all of which have now been closed as partof the energy efficiency initiative) with unit steam rating greater than 65 t/h, pulverised coal boilers ofany capacity, oil- and gas-fired boilers with capacities greater than 65 t/h, all gas turbine combinedcycle (GTCC) power plants, as well as all boilers with capacities greater than 65 t/h that fire wastecoal, biomass, oil shale, petcoke and other such materials. The permitted emission levels for GTCCpower plants will also be applicable to the gas turbine island of an IGCC power plant. However, thenew standard is not applicable to power plants that fire municipal wastes and/or hazardous wastes.The new standard also sets out the requirements for sampling and monitoring pollutants.
For coal-fired power plants, the NDRC target for 2020 is to reduce absolute emissions of SO2, NOxand particulates from coal-fired power plants to the levels achieved in 2000. To put that in context,coal-fired power capacity in 2000 was 235 GWe and by the end of 2010 had reached 687 GWe, analmost three-fold increase in ten years.
2.5.1 Coal-fired power plant emission limits to the end of 2011
The coal-fired power plant emission standards, as given in the Emission Standard of Air Pollutants forThermal Power Plants [GB13223-2003], were implemented from 1 January 2004 (Wang and Zeng,2008), as shown in Table 3.
These 2004 standards were within World Bank guidelines and at that time equivalent to the OECDaverage. There were variations in the emissions limits depending on the age of the plant, the locationand the types of coal being burnt, together with a further tightening of the emissions limits for somecategories with effect from the start of 2010. For big international cities and scenic areas such asBeijing, Shanghai, Guangzhou, Hangzhou and Guilin, the local Environmental Protection
13Non-greenhouse gas emissions from coal-fired power plants in China
Government strategies and policies for non-GHG emissions control in the coal-fired power sector
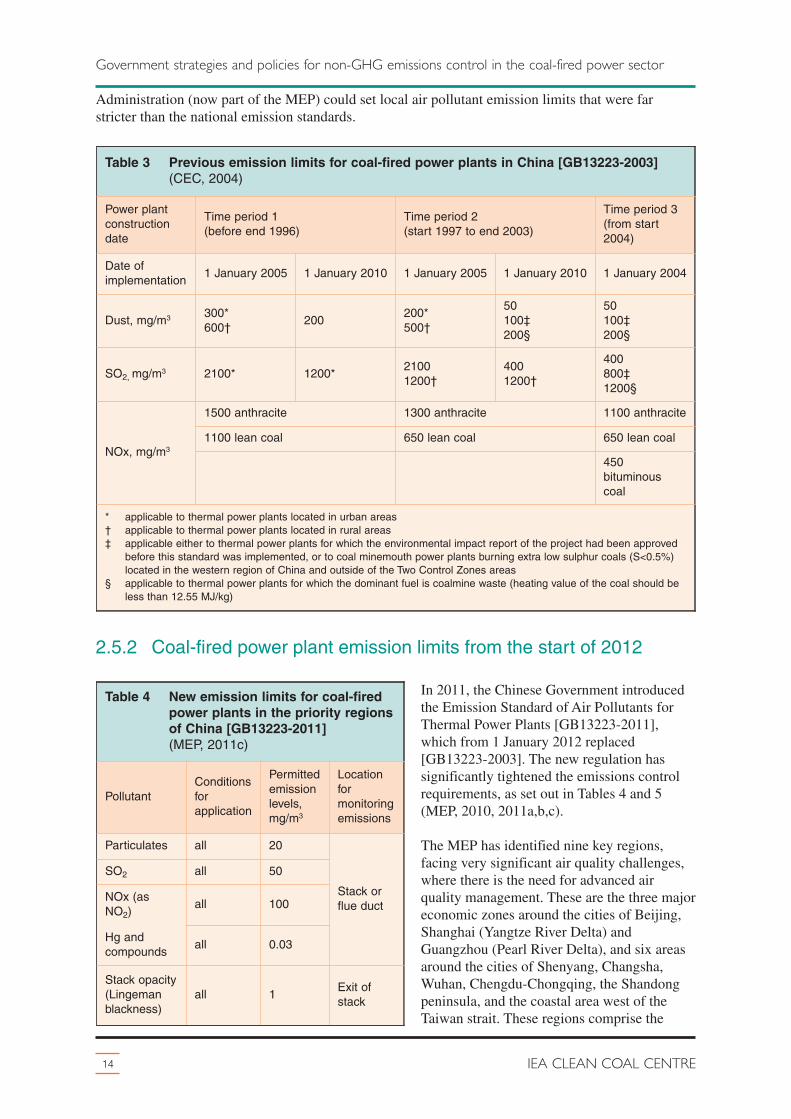
Administration (now part of the MEP) could set local air pollutant emission limits that were farstricter than the national emission standards.
2.5.2 Coal-fired power plant emission limits from the start of 2012
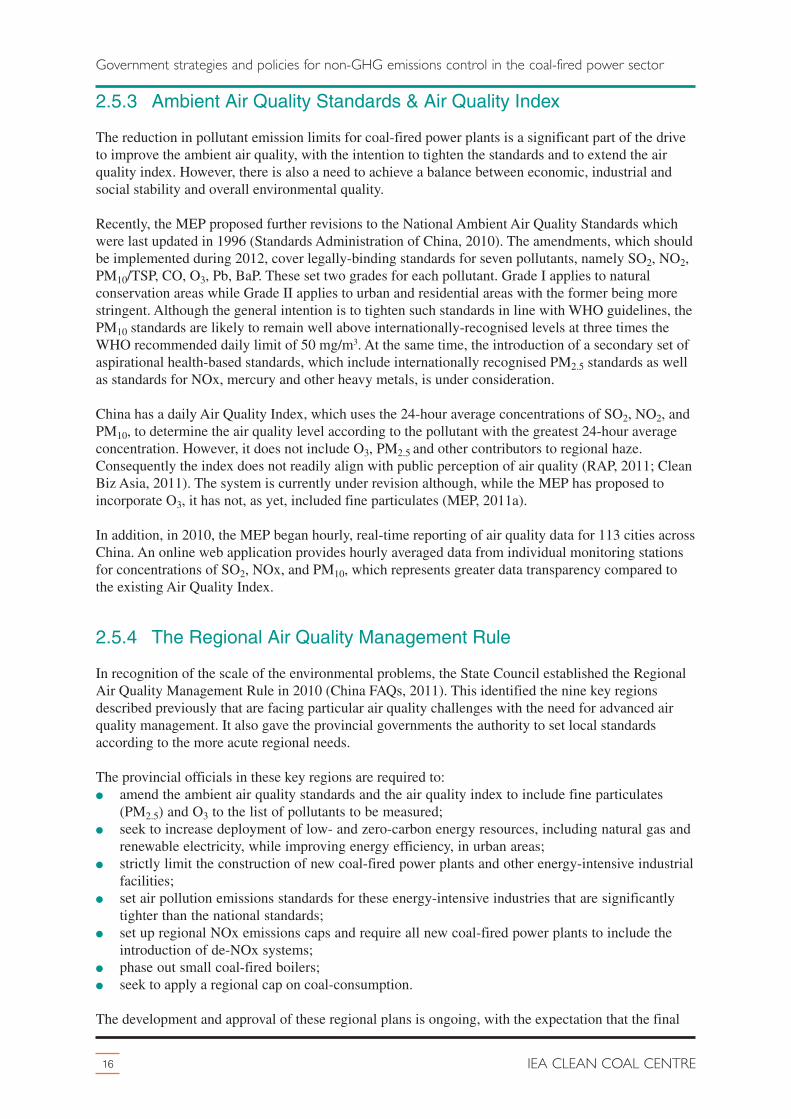
In 2011, the Chinese Government introducedthe Emission Standard of Air Pollutants forThermal Power Plants [GB13223-2011],which from 1 January 2012 replaced[GB13223-2003]. The new regulation hassignificantly tightened the emissions controlrequirements, as set out in Tables 4 and 5(MEP, 2010, 2011a,b,c).
The MEP has identified nine key regions,facing very significant air quality challenges,where there is the need for advanced airquality management. These are the three majoreconomic zones around the cities of Beijing,Shanghai (Yangtze River Delta) andGuangzhou (Pearl River Delta), and six areasaround the cities of Shenyang, Changsha,Wuhan, Chengdu-Chongqing, the Shandongpeninsula, and the coastal area west of theTaiwan strait. These regions comprise the
14 IEA CLEAN COAL CENTRE
Government strategies and policies for non-GHG emissions control in the coal-fired power sector
Table 3 Previous emission limits for coal-fired power plants in China [GB13223-2003](CEC, 2004)
Power plantconstructiondate
Time period 1(before end 1996)
Time period 2(start 1997 to end 2003)
Time period 3(from start2004)
Date ofimplementation
1 January 2005 1 January 2010 1 January 2005 1 January 2010 1 January 2004
Dust, mg/m3 300*600†
200200*500†
50100‡200§
50100‡200§
SO2, mg/m3 2100* 1200*21001200†
4001200†
400800‡1200§
NOx, mg/m3
1500 anthracite 1300 anthracite 1100 anthracite
1100 lean coal 650 lean coal 650 lean coal
450bituminouscoal
* applicable to thermal power plants located in urban areas† applicable to thermal power plants located in rural areas‡ applicable either to thermal power plants for which the environmental impact report of the project had been approved
before this standard was implemented, or to coal minemouth power plants burning extra low sulphur coals (S<0.5%)located in the western region of China and outside of the Two Control Zones areas
§ applicable to thermal power plants for which the dominant fuel is coalmine waste (heating value of the coal should beless than 12.55 MJ/kg)
Table 4 New emission limits for coal-firedpower plants in the priority regionsof China [GB13223-2011](MEP, 2011c)
PollutantConditionsforapplication
Permittedemissionlevels,mg/m3
Locationformonitoringemissions
Particulates all 20
Stack orflue duct
SO2 all 50
NOx (asNO2)
all 100
Hg andcompounds
all 0.03
Stack opacity(Lingemanblackness)
all 1Exit ofstack

population and economic centres of thecountry, responsible for 64% of nationalGDP, 43% of total energy use, andrepresenting 39% of the population. Table 4shows that the new emissions limits for dust,SO2 and NOx are very strict in these regions,with no allowance made for whether the plantis either new or already in operation. Inaddition, as is discussed in the nextsubsection, as part of the overall drive toimprove air quality, the provincialgovernments will be able to stipulate localstandards to regulate additional pollutants notcovered by the new Standard and they canalso stipulate more stringent standards forpollutants covered by the new Standard. Asnoted previously, there will also be anincreasing emphasis on limiting any newcoal-fired power plants in these regions.
For the rest of the country, the standards arenot quite so strict as for the priority regionsand the SO2/NOx limits for existing plantsare less severe than for new plants, as shownin Table 5. In addition, in several provinceswhich are not so developed and which aredependent on the use of local higher sulphurcoal, the SO2 limits are further relaxed. On anational basis, but excluding the nine priorityregions, there is also a pragmatic acceptancethat certain types of existing power plants andthose burning very low volatile content coalswill not be able to achieve the NOx levels
expected elsewhere. Consequently, these levels have been relaxed; however, this will not apply to newplants and so there will most likely be a future shift in power plant design.
All new plants (those that receive their environmental impact approval after the end of December2011) will need to achieve the new standards from start of operation. Existing plants, and thoseapproved before the end of December 2011, will have until the start of July 2014 to comply.
The new pollutant that will be regulated on coal-fired power plants is mercury and its compounds, forwhich the limit has been set at a level that represents a core control. This means that providing thepower plant operator improves the particulate, SO2 and NOx removal systems such that the newstandards are achieved, then the mercury standard should be met without the need to introduce anadditional capture device (He, 2011). This limit is in line with that agreed by the UNECE, which hasalso noted that a coal-fired power plant fitted with either an ESP or fabric filter, FGD and SCR shouldactually be able to meet an emissions limit value of 0.003 mg/m3 (Weem, 2011). The emissions levelwill have to be measured on a regular basis and the chosen technique is based on that used in theUSA, namely on a molecular absorption basis. Currently, the five major power generating companiesare undertaking demonstration projects to determine if this approach is technically and scientificallyviable. Subject to these demonstrations being successful, mercury monitoring on all coal-fired powerplants will need to begin from the start of January 2015.
15Non-greenhouse gas emissions from coal-fired power plants in China
Government strategies and policies for non-GHG emissions control in the coal-fired power sector
Table 5 New emission limits for coal-firedpower plants in the remainder ofChina [GB13223-2011] (MEP, 2011c)
PollutantConditionsforapplication
Permittedemissionlevels,mg/m3
Locationformonitoringemissions
Particulates all 30
Stack orflue duct
SO2
new unit100200*
existingunit
200400*
NOx (asNO2)
all100200†
Hg andcompounds
all 0.03
StackOpacity(Lingemanblackness)
all 1Exit ofstack
* Applicable to thermal power boilers located in GuangxiZhuang autonomous region, Sichuan province, Guizhouprovince and Chongqing municipality
† Applicable to thermal power boilers that employ the‘W-shape’ furnace, existing CFBC boilers, and thermalpower boilers that came online or were granted approvalfor the environmental impact reports before31 December 2011
2.5.3 Ambient Air Quality Standards & Air Quality Index
The reduction in pollutant emission limits for coal-fired power plants is a significant part of the driveto improve the ambient air quality, with the intention to tighten the standards and to extend the airquality index. However, there is also a need to achieve a balance between economic, industrial andsocial stability and overall environmental quality.
Recently, the MEP proposed further revisions to the National Ambient Air Quality Standards whichwere last updated in 1996 (Standards Administration of China, 2010). The amendments, which shouldbe implemented during 2012, cover legally-binding standards for seven pollutants, namely SO2, NO2,PM10/TSP, CO, O3, Pb, BaP. These set two grades for each pollutant. Grade I applies to naturalconservation areas while Grade II applies to urban and residential areas with the former being morestringent. Although the general intention is to tighten such standards in line with WHO guidelines, thePM10 standards are likely to remain well above internationally-recognised levels at three times theWHO recommended daily limit of 50 mg/m3. At the same time, the introduction of a secondary set ofaspirational health-based standards, which include internationally recognised PM2.5 standards as wellas standards for NOx, mercury and other heavy metals, is under consideration.
China has a daily Air Quality Index, which uses the 24-hour average concentrations of SO2, NO2, andPM10, to determine the air quality level according to the pollutant with the greatest 24-hour averageconcentration. However, it does not include O3, PM2.5 and other contributors to regional haze.Consequently the index does not readily align with public perception of air quality (RAP, 2011; CleanBiz Asia, 2011). The system is currently under revision although, while the MEP has proposed toincorporate O3, it has not, as yet, included fine particulates (MEP, 2011a).
In addition, in 2010, the MEP began hourly, real-time reporting of air quality data for 113 cities acrossChina. An online web application provides hourly averaged data from individual monitoring stationsfor concentrations of SO2, NOx, and PM10, which represents greater data transparency compared tothe existing Air Quality Index.
2.5.4 The Regional Air Quality Management Rule
In recognition of the scale of the environmental problems, the State Council established the RegionalAir Quality Management Rule in 2010 (China FAQs, 2011). This identified the nine key regionsdescribed previously that are facing particular air quality challenges with the need for advanced airquality management. It also gave the provincial governments the authority to set local standardsaccording to the more acute regional needs.
The provincial officials in these key regions are required to:� amend the ambient air quality standards and the air quality index to include fine particulates
(PM2.5) and O3 to the list of pollutants to be measured; � seek to increase deployment of low- and zero-carbon energy resources, including natural gas and
renewable electricity, while improving energy efficiency, in urban areas; � strictly limit the construction of new coal-fired power plants and other energy-intensive industrial
facilities; � set air pollution emissions standards for these energy-intensive industries that are significantly
tighter than the national standards; � set up regional NOx emissions caps and require all new coal-fired power plants to include the
introduction of de-NOx systems; � phase out small coal-fired boilers;� seek to apply a regional cap on coal-consumption.
The development and approval of these regional plans is ongoing, with the expectation that the final
16 IEA CLEAN COAL CENTRE
Government strategies and policies for non-GHG emissions control in the coal-fired power sector

versions will be agreed by the MEP and approved by the State Council by early 2012. In its currentform, the planning scheme is a top-down approach, without the means for joint planning betweenneighbouring provinces and municipalities. Any preparation and implementation of plans that cutacross jurisdictional lines will be done by the MEP. The plans will have a lifetime of five years andthere will be an annual progress assessment, with the career prospects of the officials tied to theirsuccessful implementation.
In addition, in 2010, under this rule, the State Council also targeted 113 major cities. Should thesecities not meet China’s National Grade II ambient air quality standards, they will be required tosubmit air quality remediation plans to the MEP. However, the exact procedures and planningguidance for the cities have yet to be finalised.
2.6 Implications for the coal power generation sector
In the near to medium term, the Chinese Government is dependent on coal use to drive economicgrowth while it aims to improve general standards of living. As such, it is seeking to maintain abalance between establishing regulations to enable cleaner production and use of energy whilemaintaining the affordability and ready availability of coal (China Greentech Initiative, 2011). Withinthe context of the 12th FYP and the new environmental standards for the power sector, the drivers areto improve efficiency of coal use while significantly reducing pollutant emissions.
2.6.1 Improved energy efficiency initiatives
Over the 11th FYP period, the average thermal efficiency of China’s coal fleet improved from370 gce/kWh to 335 gce/kWh. The target for 2020 is 320 gce/kWh (Mao, 2011). The intention withinthe 12th FYP is to build 270 GWe of coal-based capacity, which will all be either 600, 660 or1000 MWe high efficiency supercritical and ultra-supercritical units, except for CHP schemes wherethe power plants will be smaller in scale with lower grade steam conditions. The Government willcontinue with the closure of outdated power plant capacity, with a target of some further 50 GWe byend 2015. The focus will be on the remaining 100 GWe of inefficient small/medium capacity (about12% of total capacity), mostly in the range 100–200 MWe (Yue, 2011).
It is understood that the Government is considering capping total energy use at 4.1–4.2 Gt coalequivalent although how this might be achieved in practice has not been made clear (KPMG, 2011). Interms of overall coal use, which was 3.2 Gt in 2010, there have been public statements from officialssuggesting that the Government will set an upper annual limit on total raw coal use within theduration of the 12th FYP at 3.6 to 3.8 Gt for the period 2011-15 (China Daily, 2010; China.org, 2011;Sxcoal, 2010a). If this is correct and it requires a cutback in currently projected coal use then it isassumed that this will be through the closure of either more of the inefficient small/medium powerplant capacity or units from the non-power industrial sectors.
2.6.2 Improved environmental performance
The revised, significantly tighter pollutant emissions standards for coal-fired power plants, coveringdust, SO2, and NOx emissions, will require major changes to the current control technologies.
For fine particulates (dust), the ESP collection efficiency will need to be improved and, if that is notenough, there will be a need for a combination ESP plus part bag filter. For coals that have difficultash characteristics there will be a need to introduce full bag filter systems. This will require a majorretrofit activity for most existing coal-fired power plants together with the immediate introduction ofthese more effective systems on any new coal-fired power plants.
17Non-greenhouse gas emissions from coal-fired power plants in China
Government strategies and policies for non-GHG emissions control in the coal-fired power sector
Since 2003, all new coal-fired power plants have been equipped with low NOx burners and, in somecases, air staging in order to meet the emissions standards introduced at the start of 2004 (Wang andZeng, 2008). However, there will now be a need to introduce additional NOx reduction systems. To anextent, this need has been expected for some while, since, for the last five years, the designs of all newcoal-fired plants have had to include space for the subsequent installation of SCR/SNCR equipment(Minchener, 2010; istockAnalyst, 2011a).
According to China’s 2007 pollution survey (MEP, 2008), the power sector is the largest source ofNOx emissions, accounting for over 40% of total emissions, with the transport and industrial sectorsaccounting for 30% and 25% respectively. The MEP has set out the policy framework for NOxreduction actions at fossil fuel fired power plants to be undertaken during the 12th FYP (BusinessWire, 2010). The Notice of Fossil-Fired Power Plant NOx Emission Prevention and Treatment Policyapplies nationwide to all coal-fired power plants and cogeneration units that are 200 MWe or larger,except in the designated priority regions where it applies to all units regardless of size.
In principle, the first option technologies to be installed are Low NOx Combustion Technologies (suchas low NOx burners and over-fire air systems), which are the technologies that have been introducedpreviously. However, if this approach should not prove adequate, flue gas de-NOx technology shouldbe installed, such as elective catalytic reduction (SCR), selective non-catalytic reduction (SNCR), andSNCR-SCR systems. For the SCR and SNCR options, the policy recommends that SCR should beinstalled on units of 600 MWe capacity or greater. For units of less than 600 MWe capacity, thepreferred technologies are SCR and SNCR-SCR. For systems which require ammonia as a reducingagent for SCR, SNCR-SCR and SNCR, there are special policy guidelines depending on the unitlocation. For all units within the priority regions, the preferred reducing agent is urea.
To reduce the energy penalty disincentive for the generating companies, it is expected that a pricepremium for operating NOx control systems will be introduced, as is done currently fordesulphurisation. This is likely to be set at 0.015 RMB/kWh (0.0023 US$/kWh).
2.7 Future requirements
There is expected to be pressure to further tighten the ‘National Ambient Air Quality Standards’,especially for PM10. It is also likely that the intention to introduce internationally recognised PM2.5
standards, as well as standards for NOx, mercury and other heavy metals, will be approved. If this isthe case, the provincial governments will be given authority to set local standards according to thesereferences. There is also scope to improve the daily Air Quality Index, to include PM2.5 and othercontributors to regional haze.
Consequently, while the new standards for the coal power sector represent a very significanttightening of the emissions limits, there is an expectation that further changes could be applied priorto 2020. At present, there are no limits on PM2.5 and should this be introduced, there would need to bea rethink of the approach in the coal power sector to controlling dust emissions, with a need to retrofiteither full bag filter systems or electro-bag filters (ESP plus part bag filter) on almost all plants (He,2011). At the same time, it needs to be recognised that SO2 and NOx are precursors to PM2.5 and so,in principle, emission limits for these pollutants could be tightened yet further.
It is also possible that the mercury emissions limit could be changed such that specific control systemswould need to be introduced. However, measurements of mercury will not be introduced until 2015,and there would need to be a period of time during which such measurements are taken and the resultsanalysed. Consequently, if it was decided that any tightening of such standards should be necessary, itwould be unlikely to take place until close to 2020,
18 IEA CLEAN COAL CENTRE
Government strategies and policies for non-GHG emissions control in the coal-fired power sector
3 Overview of coal -fired power generation in China
19Non-greenhouse gas emissions from coal-fired power plants in China
This chapter provides information on the current coal-fired power plant capacity in China, theexpected growth of such capacity, the likely technology mix and the associated size of the units,together with a broad estimate of future changes beyond 2020.
3.1 Recent historical overview
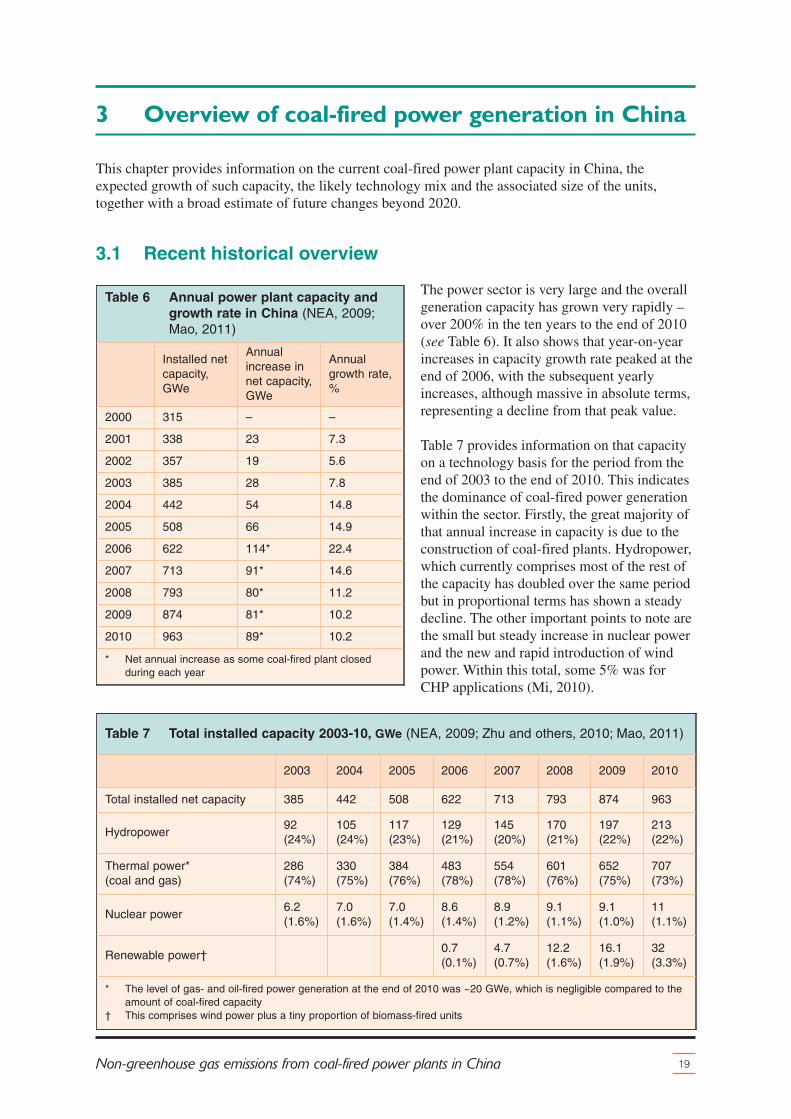
The power sector is very large and the overallgeneration capacity has grown very rapidly –over 200% in the ten years to the end of 2010(see Table 6). It also shows that year-on-yearincreases in capacity growth rate peaked at theend of 2006, with the subsequent yearlyincreases, although massive in absolute terms,representing a decline from that peak value.
Table 7 provides information on that capacityon a technology basis for the period from theend of 2003 to the end of 2010. This indicatesthe dominance of coal-fired power generationwithin the sector. Firstly, the great majority ofthat annual increase in capacity is due to theconstruction of coal-fired plants. Hydropower,which currently comprises most of the rest ofthe capacity has doubled over the same periodbut in proportional terms has shown a steadydecline. The other important points to note arethe small but steady increase in nuclear powerand the new and rapid introduction of windpower. Within this total, some 5% was forCHP applications (Mi, 2010).
Table 6 Annual power plant capacity andgrowth rate in China (NEA, 2009;Mao, 2011)
Installed netcapacity,GWe
Annualincrease innet capacity,GWe
Annualgrowth rate,%
2000 315 – –
2001 338 23 7.3
2002 357 19 5.6
2003 385 28 7.8
2004 442 54 14.8
2005 508 66 14.9
2006 622 114* 22.4
2007 713 91* 14.6
2008 793 80* 11.2
2009 874 81* 10.2
2010 963 89* 10.2
* Net annual increase as some coal-fired plant closedduring each year
Table 7 Total installed capacity 2003-10, GWe (NEA, 2009; Zhu and others, 2010; Mao, 2011)
2003 2004 2005 2006 2007 2008 2009 2010
Total installed net capacity 385 442 508 622 713 793 874 963
Hydropower92(24%)
105(24%)
117(23%)
129(21%)
145(20%)
170(21%)
197(22%)
213(22%)
Thermal power* (coal and gas)
286(74%)
330(75%)
384(76%)
483(78%)
554(78%)
601(76%)
652(75%)
707(73%)
Nuclear power 6.2(1.6%)
7.0(1.6%)
7.0(1.4%)
8.6(1.4%)
8.9(1.2%)
9.1(1.1%)
9.1(1.0%)
11(1.1%)
Renewable power†0.7(0.1%)
4.7(0.7%)
12.2(1.6%)
16.1(1.9%)
32(3.3%)
* The level of gas- and oil-fired power generation at the end of 2010 was ~20 GWe, which is negligible compared to theamount of coal-fired capacity
† This comprises wind power plus a tiny proportion of biomass-fired units
20 IEA CLEAN COAL CENTRE
Overview of coal -fired power generation in China
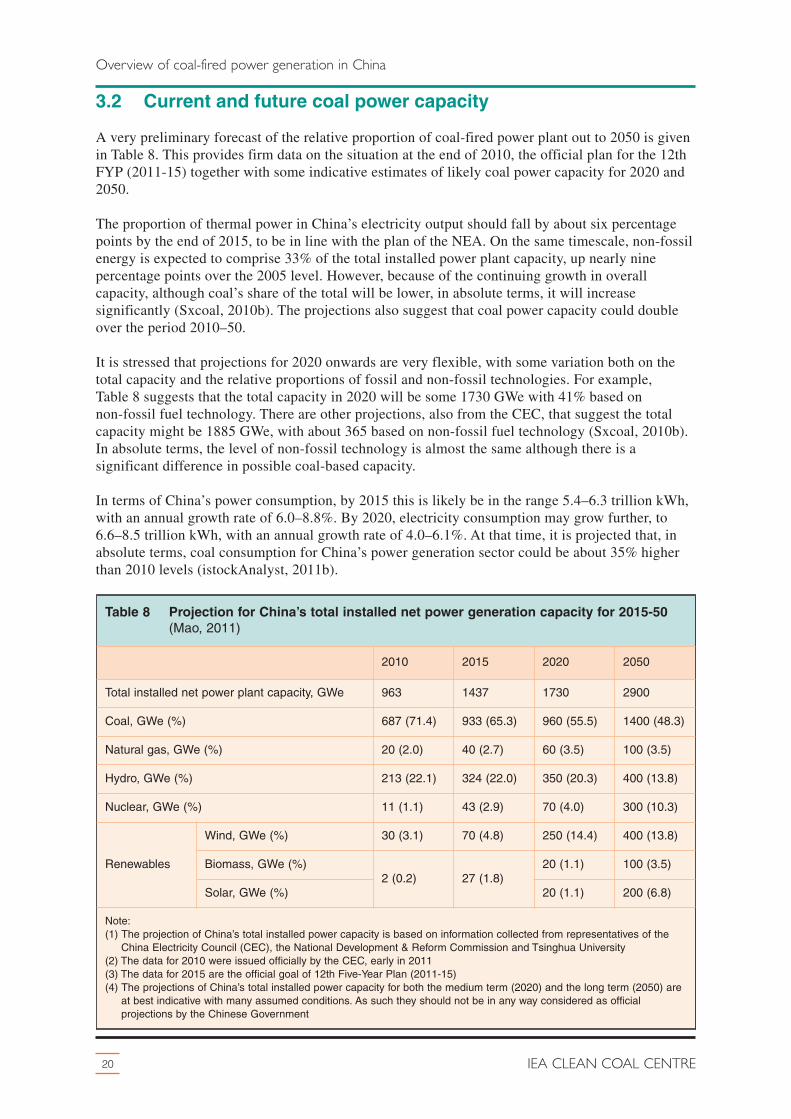
3.2 Current and future coal power capacity
A very preliminary forecast of the relative proportion of coal-fired power plant out to 2050 is givenin Table 8. This provides firm data on the situation at the end of 2010, the official plan for the 12thFYP (2011-15) together with some indicative estimates of likely coal power capacity for 2020 and2050.
The proportion of thermal power in China’s electricity output should fall by about six percentagepoints by the end of 2015, to be in line with the plan of the NEA. On the same timescale, non-fossilenergy is expected to comprise 33% of the total installed power plant capacity, up nearly ninepercentage points over the 2005 level. However, because of the continuing growth in overallcapacity, although coal’s share of the total will be lower, in absolute terms, it will increasesignificantly (Sxcoal, 2010b). The projections also suggest that coal power capacity could doubleover the period 2010–50.
It is stressed that projections for 2020 onwards are very flexible, with some variation both on thetotal capacity and the relative proportions of fossil and non-fossil technologies. For example,Table 8 suggests that the total capacity in 2020 will be some 1730 GWe with 41% based onnon-fossil fuel technology. There are other projections, also from the CEC, that suggest the totalcapacity might be 1885 GWe, with about 365 based on non-fossil fuel technology (Sxcoal, 2010b).In absolute terms, the level of non-fossil technology is almost the same although there is asignificant difference in possible coal-based capacity.
In terms of China’s power consumption, by 2015 this is likely be in the range 5.4–6.3 trillion kWh,with an annual growth rate of 6.0–8.8%. By 2020, electricity consumption may grow further, to6.6–8.5 trillion kWh, with an annual growth rate of 4.0–6.1%. At that time, it is projected that, inabsolute terms, coal consumption for China’s power generation sector could be about 35% higherthan 2010 levels (istockAnalyst, 2011b).
Table 8 Projection for China’s total installed net power generation capacity for 2015-50(Mao, 2011)
2010 2015 2020 2050
Total installed net power plant capacity, GWe 963 1437 1730 2900
Coal, GWe (%) 687 (71.4) 933 (65.3) 960 (55.5) 1400 (48.3)
Natural gas, GWe (%) 20 (2.0) 40 (2.7) 60 (3.5) 100 (3.5)
Hydro, GWe (%) 213 (22.1) 324 (22.0) 350 (20.3) 400 (13.8)
Nuclear, GWe (%) 11 (1.1) 43 (2.9) 70 (4.0) 300 (10.3)
Renewables
Wind, GWe (%) 30 (3.1) 70 (4.8) 250 (14.4) 400 (13.8)
Biomass, GWe (%) 2 (0.2) 27 (1.8)
20 (1.1) 100 (3.5)
Solar, GWe (%) 20 (1.1) 200 (6.8)
Note: (1) The projection of China’s total installed power capacity is based on information collected from representatives of the
China Electricity Council (CEC), the National Development & Reform Commission and Tsinghua University(2) The data for 2010 were issued officially by the CEC, early in 2011(3) The data for 2015 are the official goal of 12th Five-Year Plan (2011-15)(4) The projections of China’s total installed power capacity for both the medium term (2020) and the long term (2050) are
at best indicative with many assumed conditions. As such they should not be in any way considered as officialprojections by the Chinese Government
3.3 Possible technology options
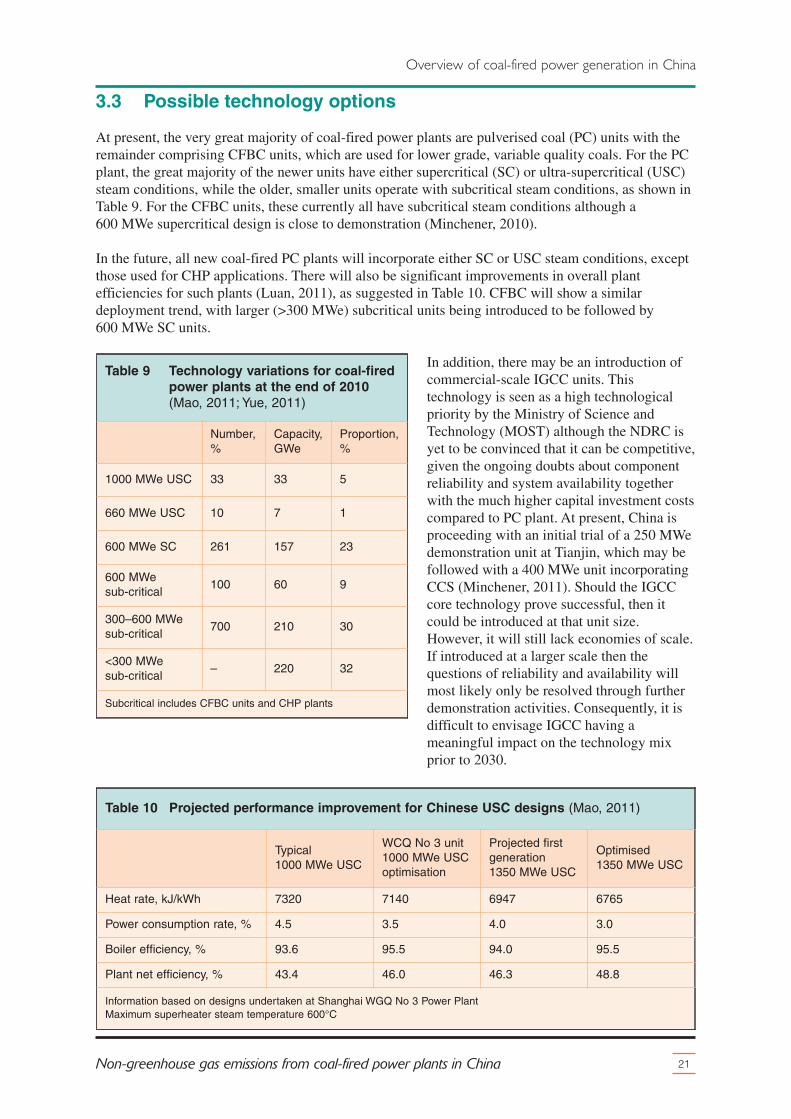
At present, the very great majority of coal-fired power plants are pulverised coal (PC) units with theremainder comprising CFBC units, which are used for lower grade, variable quality coals. For the PCplant, the great majority of the newer units have either supercritical (SC) or ultra-supercritical (USC)steam conditions, while the older, smaller units operate with subcritical steam conditions, as shown inTable 9. For the CFBC units, these currently all have subcritical steam conditions although a600 MWe supercritical design is close to demonstration (Minchener, 2010).
In the future, all new coal-fired PC plants will incorporate either SC or USC steam conditions, exceptthose used for CHP applications. There will also be significant improvements in overall plantefficiencies for such plants (Luan, 2011), as suggested in Table 10. CFBC will show a similardeployment trend, with larger (>300 MWe) subcritical units being introduced to be followed by600 MWe SC units.
In addition, there may be an introduction ofcommercial-scale IGCC units. Thistechnology is seen as a high technologicalpriority by the Ministry of Science andTechnology (MOST) although the NDRC isyet to be convinced that it can be competitive,given the ongoing doubts about componentreliability and system availability togetherwith the much higher capital investment costscompared to PC plant. At present, China isproceeding with an initial trial of a 250 MWedemonstration unit at Tianjin, which may befollowed with a 400 MWe unit incorporatingCCS (Minchener, 2011). Should the IGCCcore technology prove successful, then itcould be introduced at that unit size.However, it will still lack economies of scale.If introduced at a larger scale then thequestions of reliability and availability willmost likely only be resolved through furtherdemonstration activities. Consequently, it isdifficult to envisage IGCC having ameaningful impact on the technology mixprior to 2030.
21Non-greenhouse gas emissions from coal-fired power plants in China
Overview of coal -fired power generation in China
Table 9 Technology variations for coal-firedpower plants at the end of 2010(Mao, 2011; Yue, 2011)
Number,%
Capacity,GWe
Proportion,%
1000 MWe USC 33 33 5
660 MWe USC 10 7 1
600 MWe SC 261 157 23
600 MWesub-critical
100 60 9
300–600 MWesub-critical
700 210 30
<300 MWesub-critical
– 220 32
Subcritical includes CFBC units and CHP plants
Table 10 Projected performance improvement for Chinese USC designs (Mao, 2011)
Typical1000 MWe USC
WCQ No 3 unit1000 MWe USCoptimisation
Projected firstgeneration1350 MWe USC
Optimised1350 MWe USC
Heat rate, kJ/kWh 7320 7140 6947 6765
Power consumption rate, % 4.5 3.5 4.0 3.0
Boiler efficiency, % 93.6 95.5 94.0 95.5
Plant net efficiency, % 43.4 46.0 46.3 48.8
Information based on designs undertaken at Shanghai WGQ No 3 Power PlantMaximum superheater steam temperature 600°C
4 Current and likely future emissions of non-GHGemissions from coal-fired power plants in China
22 IEA CLEAN COAL CENTRE
On the basis of the information provided in the previous two chapters, the emissions of conventional(non-GHG) pollutants from coal-fired plant in China are presented against a background of the coalpower generation technologies in use today. This is followed by projections for how these emissionsmight change over time, given the MEP targets and the likely future use of coal in the power sector.
It is stressed that, while there is consistency in the historical trends of pollutant emissions, there areconsiderable variations in the absolute levels depending on the source material. Consequently, whilethe data presented have been drawn from official government sources and while every effort has beenmade to confirm the validity of the information presented, there may be errors. Any interpretation ofthe data should be made with caution.
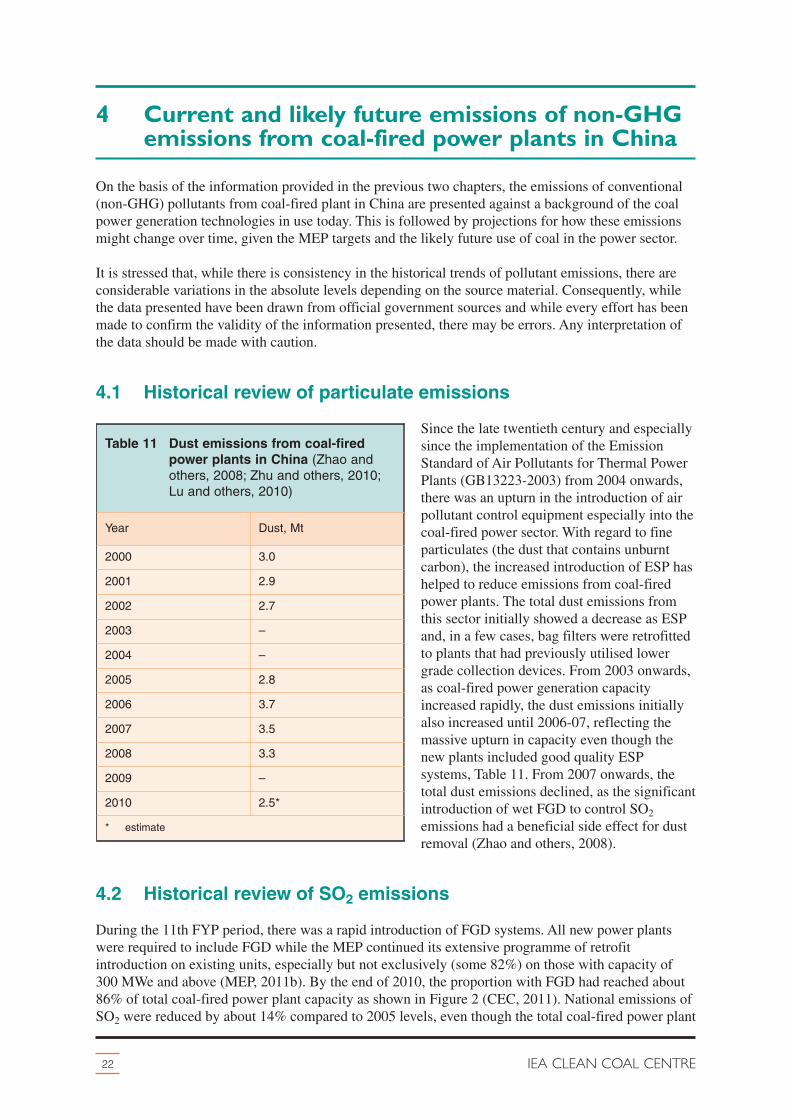
4.1 Historical review of particulate emissions
Since the late twentieth century and especiallysince the implementation of the EmissionStandard of Air Pollutants for Thermal PowerPlants (GB13223-2003) from 2004 onwards,there was an upturn in the introduction of airpollutant control equipment especially into thecoal-fired power sector. With regard to fineparticulates (the dust that contains unburntcarbon), the increased introduction of ESP hashelped to reduce emissions from coal-firedpower plants. The total dust emissions fromthis sector initially showed a decrease as ESPand, in a few cases, bag filters were retrofittedto plants that had previously utilised lowergrade collection devices. From 2003 onwards,as coal-fired power generation capacityincreased rapidly, the dust emissions initiallyalso increased until 2006-07, reflecting themassive upturn in capacity even though thenew plants included good quality ESPsystems, Table 11. From 2007 onwards, thetotal dust emissions declined, as the significantintroduction of wet FGD to control SO2emissions had a beneficial side effect for dustremoval (Zhao and others, 2008).
4.2 Historical review of SO2 emissions
During the 11th FYP period, there was a rapid introduction of FGD systems. All new power plantswere required to include FGD while the MEP continued its extensive programme of retrofitintroduction on existing units, especially but not exclusively (some 82%) on those with capacity of300 MWe and above (MEP, 2011b). By the end of 2010, the proportion with FGD had reached about86% of total coal-fired power plant capacity as shown in Figure 2 (CEC, 2011). National emissions ofSO2 were reduced by about 14% compared to 2005 levels, even though the total coal-fired power plant
Table 11 Dust emissions from coal-firedpower plants in China (Zhao andothers, 2008; Zhu and others, 2010;Lu and others, 2010)
Year Dust, Mt
2000 3.0
2001 2.9
2002 2.7
2003 –
2004 –
2005 2.8
2006 3.7
2007 3.5
2008 3.3
2009 –
2010 2.5*
* estimate

capacity had increased from 384 GWe to687 GWe over the same time period(Minchener, 2011; China Daily, 2011c).
FGD has been installed on all new coal-firedpower plant since about 2006, whichincreasingly has comprised the larger(�600 MWe) units. Much of the FGDinstalled on the smaller units represents thecompletion of retrofit applications on unitsselected by the MEP, often for local reasonssuch as use of high sulphur coal at a smallplant that cannot be closed for very specificstrategic reasons.
Table 12 shows that the total SO2 emissionsincreased from 20.0 Mt in 2000 to 25.7Mt in2006, close to a 30% increase during fiveyears with a very large proportion of thisarising from the increase in coal-fired powergeneration. However, despite an even greaterincrease in coal-fired power generation insubsequent years, from 2007 onwards the totalemissions of SO2 began to fall, which wasprimarily a result of the significant andcontinued introduction of FGD (ChinaBusiness News, 2009; Lu and Streets, 2011).That said, there is a clear suggestion that therehas been a subsequent upturn in coal powerSO2 emissions, which could reflect the sheerimpact of yet more plants being operated,despite the increasing installation of FGD.
4.3 Historical review of NOxemissions
For NOx emission control, based on theprevious emission limit (see Table 3 onpage 14), the use of low NOx combustiontechnologies has ensured that the standard canbe met. China has access to OECD burnertypes based on technology transfer agreementsand to others based on Chinese developments.The Chinese designs are cheaper while the
OECD designs are more efficient. Both have significant market niches as both offer a cost effectivemeans to meet the environmental drivers. However, now that the limit is to be tightened to 200 mg/m3
or below, catalytic de-NOx systems are having to be introduced.
The installed capacity of such systems at the end of 2010 was 58 GWe, up from 30 GWe at the end of2008, with some further 100 GWe of systems at the planning and/or construction stage (Zhu andothers, 2009, 2010). In line with the guidance provided by the MEP, the technology adopted mostwidely (97.4%) is SCR with the remainder being SNCR. The equipment has been installed mainly inBeijing, Shanghai and in the eastern provinces, namely Fujian, Zhejiang, Guangdong and Jiangsu.
23Non-greenhouse gas emissions from coal-fired power plants in China
Current and likely future emissions of non-GHG emissions from coal power plants in China
600
500
400
300
200
0
Ther
mal
gen
erat
ing
cap
acity
, GW
700
800
100
Thermal generating capacity
FGD equipped thermal generating capacity
201020092008200720062005
Figure 2 Relative proportion of coal powerplant with FGD installed (CEC, 2011)
Table 12 SO2 emissions in China (MEP,2009a; Lu and others 2009, 2010;China Daily, 2011a)
Totalemissions ofSO2, Mt
Emissions from thermalpower plants
SO2, MtProportionof total, %
2000 20.0 6.5 32.5
2001 19.5 6.5 33.3
2002 19.3 6.7 34.7
2003 21.6 8.3 38.4
2004 22.5 9.3 41.3
2005 25.5 11.1 43.5
2006 25.7 11.6 45.1
2007 24.7 10.9 44.1
2008 23.2 9.3* 40.1*
2009 22.1
2010 22.9 10.0* 43.7*
* estimate

As yet, NOx hasn’t been included in the list of environment statistics for China, due to the lack ofcomprehensive standards for data collection. There have been some estimates undertaken, based onmeasurements at power plants, comprehensive analysis on coal consumption, consideration of sizeand types of thermal power plants, as given in Table 13. This shows that NOx emissions from the coal
power sector have increased significantly withthe increased installation of new power plantsand that the impact of low NOx burners hasnot been sufficient to halt this rising trend.
4.4 Mercury emission issues
A major source of mercury emissions to theatmosphere is from the combustion of coal(Kuang and others, 2008). It is very difficult toobtain consistent measurements of suchemissions from coal-fired power plant andother industrial sources, which makesdetermination of the mercury concentrations inthe various off-takes from such plantsproblematical. That said, it is known that ESP,wet FGD and de-NOx control systems allcontribute to removing mercury in solid form.Consequently, on a qualitative basis, totalmercury emissions should have been reducedsignificantly as the extensive introduction ofemissions control systems has been applied inChina. From 2015, all operators will be
required to undertake measurements of mercury emissions from the stack of coal-fired power plantsand it is hoped that at that time a much better, practical assessment of this pollutant can be obtained.
4.5 Projections of future non-GHG emissions
Future emissions of non-GHG emissions from coal-fired power plants will depend on many factors,including:� emissions limits for each pollutant that will be applied by the MEP;� future power demand;� the mix of fossil and non-fossil fuel technologies in the total power plant capacity, and how that
mix will be utilised; � type of coal power plant available for operation, with differing levels of efficiency and pollutant
emissions, and the likely operational load in each case; � impact of changes in coal preparation procedures (for example coal washing to lower ash and
sulphur contents);� speed at which the power generation companies will uprate their pollutant control systems in
order to meet the new national standards; � impact of other legislation that can alter the performance of coal plant, such as a need for CCS.
With this number of variables, it is difficult to make meaningful predictions of future emission trends.Even so, in 2009, as part of the consultation process prior to the introduction of the new standards, theMEP made some broad estimates for 2020 of the impact of the new emissions standards on non-GHGemissions (MEP, 2009b). In taking into account the likely power plant mix, there is some uncertaintyas to exactly how much and when the new coal-fired power capacity will be introduced. The assumed2010 baseline levels for the three key pollutants are not in line with the actual power plant data, due to
24 IEA CLEAN COAL CENTRE
Current and likely future emissions of non-GHG emissions from coal power plants in China
Table 13 Estimated NOx emissions fromcoal-fired power plants (Zhao andothers, 2008; Zhu and others 2009,2010; 21 Tradenet, 2011a,b)
Year Estimated NOx emissions, Mt
2000 4.7
2001 –
2002 5.4
2003 6.0
2004 6.5
2005 7.0
2006 8.5
2007 8.4
2008 8.4
2009 –
2010 9.7
there being an unexpected surge in FGD introduction while some power plants have fitted SCRde-NOx systems earlier than was legally required in anticipation of the new standards being applied.Also the implementation of the new emissions standards did not apply until January 2012 with afurther two and a half years being allowed for compliance on existing plants while the MEP hadassumed that implementation would commence at the start of 2010. Nevertheless, these projections doat least provide an insight into how the non-GHG emissions might change over the period to 2020.
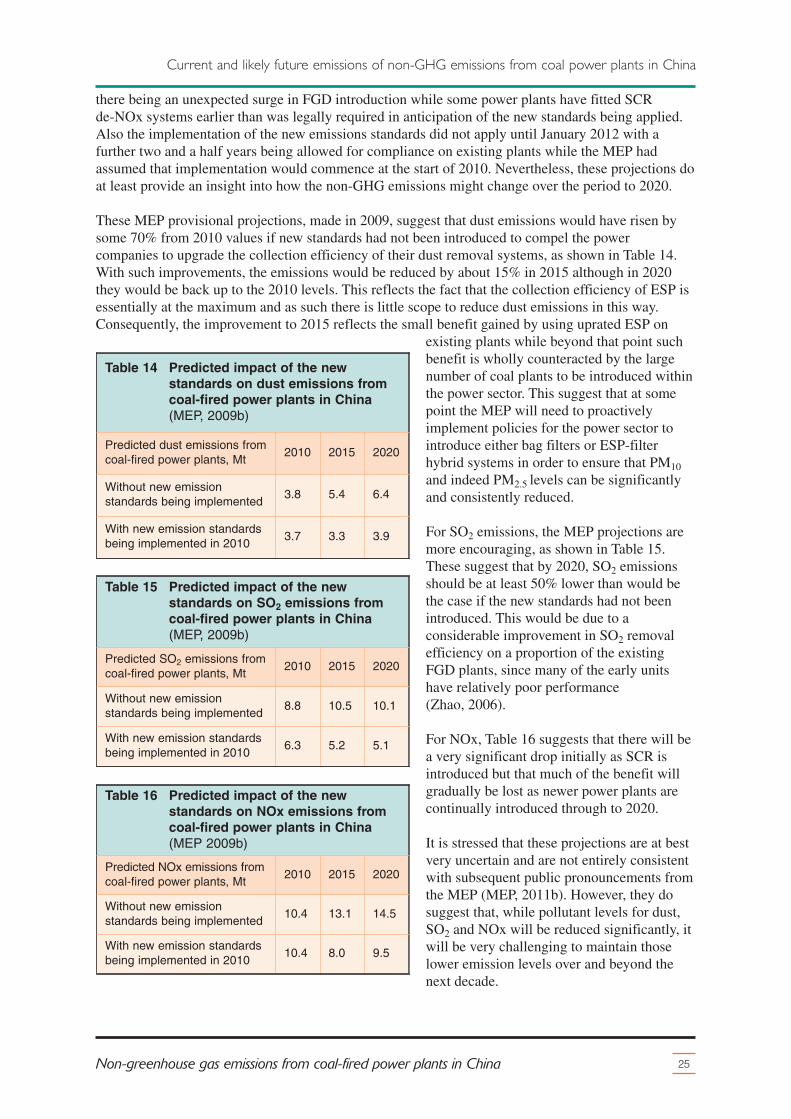
These MEP provisional projections, made in 2009, suggest that dust emissions would have risen bysome 70% from 2010 values if new standards had not been introduced to compel the powercompanies to upgrade the collection efficiency of their dust removal systems, as shown in Table 14.With such improvements, the emissions would be reduced by about 15% in 2015 although in 2020they would be back up to the 2010 levels. This reflects the fact that the collection efficiency of ESP isessentially at the maximum and as such there is little scope to reduce dust emissions in this way.Consequently, the improvement to 2015 reflects the small benefit gained by using uprated ESP on
existing plants while beyond that point suchbenefit is wholly counteracted by the largenumber of coal plants to be introduced withinthe power sector. This suggest that at somepoint the MEP will need to proactivelyimplement policies for the power sector tointroduce either bag filters or ESP-filterhybrid systems in order to ensure that PM10
and indeed PM2.5 levels can be significantlyand consistently reduced.
For SO2 emissions, the MEP projections aremore encouraging, as shown in Table 15.These suggest that by 2020, SO2 emissionsshould be at least 50% lower than would bethe case if the new standards had not beenintroduced. This would be due to aconsiderable improvement in SO2 removalefficiency on a proportion of the existingFGD plants, since many of the early unitshave relatively poor performance(Zhao, 2006).
For NOx, Table 16 suggests that there will bea very significant drop initially as SCR isintroduced but that much of the benefit willgradually be lost as newer power plants arecontinually introduced through to 2020.
It is stressed that these projections are at bestvery uncertain and are not entirely consistentwith subsequent public pronouncements fromthe MEP (MEP, 2011b). However, they dosuggest that, while pollutant levels for dust,SO2 and NOx will be reduced significantly, itwill be very challenging to maintain thoselower emission levels over and beyond thenext decade.
25Non-greenhouse gas emissions from coal-fired power plants in China
Current and likely future emissions of non-GHG emissions from coal power plants in China
Table 14 Predicted impact of the newstandards on dust emissions fromcoal-fired power plants in China(MEP, 2009b)
Predicted dust emissions fromcoal-fired power plants, Mt
2010 2015 2020
Without new emissionstandards being implemented
3.8 5.4 6.4
With new emission standardsbeing implemented in 2010
3.7 3.3 3.9
Table 15 Predicted impact of the newstandards on SO2 emissions fromcoal-fired power plants in China(MEP, 2009b)
Predicted SO2 emissions fromcoal-fired power plants, Mt
2010 2015 2020
Without new emissionstandards being implemented
8.8 10.5 10.1
With new emission standardsbeing implemented in 2010
6.3 5.2 5.1
Table 16 Predicted impact of the newstandards on NOx emissions fromcoal-fired power plants in China(MEP 2009b)
Predicted NOx emissions fromcoal-fired power plants, Mt
2010 2015 2020
Without new emissionstandards being implemented
10.4 13.1 14.5
With new emission standardsbeing implemented in 2010
10.4 8.0 9.5
5 Monitoring, verification and control
26 IEA CLEAN COAL CENTRE
It is evident that during the 11th FYP period China made significant progress in reducing fineparticulate and SO2 emissions, particularly from the coal-fired power sector while at the same timereducing energy intensity with the implementation of some very significant initiatives. However, therewere many issues with standards and regulations not being implemented, which necessitated the MEPand others to establish new organisational approaches to address such problems. For the 12th FYPperiod, the MEP is taking the various initiatives further, to ensure effective monitoring andverification, such that acceptable implementation and compliance can be achieved within the coalpower and other energy-intensive sectors.
5.1 Resourcing issues
The MEP does not yet have adequate staff in place and lacks a significant technical capacity,especially at the local levels. Consequently, it has drafted in technical experts for advice andassistance from the National Environmental Protection Institute, and other national centres ofexcellence such as Tsinghua University, Beijing University, Chinese Academy of EnvironmentalPlanning, and the Chinese Research Academy of Environmental Science. Such organisationsundertake scientific data collection and evaluation, technology assessment, development of emissionsinventories, provision of environmental impact assessments, and the recommendation of changes toindustrial emissions standards and regulations. They are also working with the provincial and regionalauthorities in developing air quality plans in line with the MEP guidance (MEP, 2010).
5.2 Operating approach of the MEP
With regard to meeting the specific 12th FYP national targets for water and air (SO2 and NOx)pollution, this will be administered by the Total Emission Control (TEC) Department of the MEP,which will issue specific subsector control measures. The key to effective implementation will be toensure that the provincial and local targets within the various subsectors are met. This is theresponsibility of the Environmental Supervision Bureau of the MEP, for which the State Governmenthas established regional offices to provide administrative and enforcement support. Currently there aresix Regional Environmental Supervision Centres, which cover East, South, North, Northwest,Southwest and Northeast China (RAP, 2011). These centres have eight key functions (MEP, 2010) to:� supervise implementation of local regulations and standards; � investigate major pollution and ecological destruction cases; � serve as an information node between governmental levels; � handle major environmental disputes across provinces and basins; � participate in supervision on major environmental emergency responses; � undertake or participate in law enforcement supervision; � supervise major pollution sources and MEP project approval for pollution abatement; � supervise law enforcement in nature reserves.
These regional offices are critical to the MEP achieving its targets since the local and provincialEnvironmental Protection Bureaus (EPB), which are the primary entities responsible forimplementation, are under the authority of the provincial governments. As such, the EPB have stronglinks to local enterprises, which may compromise enforcement (He, 2011). Indeed the MEPDepartment of Total Pollution Control relied heavily on the regional offices for monitoring andevaluating incremental progress towards the achievement of China’s 11th FYP SO2 reduction target(RAP, 2011).
5.3 Interactions at provincial and enterprise levels
The 12th FYP includes provision for a continuation of the previous approach to monitoring andverification. Thus career advancement for provincial officials and leaders of state-owned enterpriseswill be dependent, in part, on them meeting their binding environmental and energy targets. Thepollutant emissions and water environmental targets will need to be met while also ensuring carbonintensity is reduced, which will be challenging. At the same time, a priority will be the development ofthe seven SEI, many of which will help China to achieve its energy and environmental targets. Therewill be government incentives to initiate and expand both production and energy efficiency initiatives.Although there will be closures of excess manufacturing capacity and curbs on energy-intensiveindustrial growth, there will be investment in higher efficiency power plant and technologicalimprovements to other industrial processes that should deliver cost-effective economic andenvironmental benefits within many provinces.
5.4 Controlling and monitoring emissions from the coal-firedpower sector
Prior to 2006, the government had limited success in controlling SO2 emissions, in part due to anevolving approach to control and accountability within the coal power sector. For example, thegovernment offered an enhanced electricity purchase price to those plants that installed FGD.However, this incentive did not fully offset increased operational costs nor did it offset the capitalinvestment. This led to major problems with some power companies not generally operating theseunits, except when inspections from the MEP were due, and so not meeting emissions standardsalthough they were receiving an enhanced power price (Yale Environment 360, 2010).
During the 11th FYP period, with the [GB13223-2003] standards in place, this control was fine tunedto provide a viable way forward. It included the application of a pollution levy that made itworthwhile to apply FGD (Chen and Xu, 2010), together with the introduction of ContinuousEmissions Monitoring Systems (CEMS) and the compulsory transfer of such data to the MEP’sregional bureau to allow supervision and auditing (Chen, 2008). These CEM systems provide data onreal-time SO2 emissions so that the MEP can check that the FGD is operating correctly (Li and others,2010). In addition, a national registry has been created, which lists those plants that have certifiedFGD equipment in place. These control approaches were complemented with an enhanced pricingmechanism for electricity from FGD-equipped power plants, together with financial assistance by thegovernment in the form of interest-free loan payments for FGD financing. The MEP and NDRC alsonegotiated agreements with the major power companies and provincial leaders that identified theirrespective emission targets, obligations for controlling emissions, and the consequences for failure toachieve the targets. Thus by 2007:� the pollution levy, which applied to total SO2 emissions while still requiring the power plant owner
to meet the emissions limits, reached 1.26 RMB/kg (0.198 US$/kg). This is higher than theestimated average cost of controlling SO2 emissions from coal-fired power plants (MEP, 2008);
� the price premium of 0.015 RMB/kWh (0.0023 US$/kWh) was introduced for power plants thatoperated FGD for 90% or more of total electricity generated. At the same time, penalties wereintroduced of 0.015 RMB/kWh (0.0023 US$/kWh) for plants operating FGD between 80% and90% of total generation, and 0.075 RMB/kWh (0.0117 US$/kWh) for plants operating FGD lessthan 80% of the time (Xu, 2011).
In 2007, the MEP and NDRC also introduced a franchising mechanism for desulphurisation, whichallowed the power plants to subcontract the installation, operation, and management of the FGDsystem to specialist companies in exchange for either all or a portion of the price premium (Li andothers, 2011).
This co-ordinated approach was quite successful for SO2 control, as described in Chapter 4.
27Non-greenhouse gas emissions from coal-fired power plants in China
Monitoring, verification and control
For the 12th FYP period, the MEP’s regional independent inspection centres are now linked to thegreat majority of power plants that have had CEMs installed to monitor their SO2/NOx emissions. Inaddition, these bureaux have access to satellite data that will indicate any significant changes inpollutant levels on a 10 km2 grid basis. This allows them to check the effectiveness of China’s SO2emission control measures, by pinpointing large changes in SO2 emissions from major point sourcessuch as power plants and other energy-intensive industries (Li and others, 2010). With improvedtechnical capacity being established, this combination of CEM and remote monitoring is expected tobe extended to NOx emissions on coal-fired power plant.
In order to implement these reforms, the Chinese Government received loans from the AsianDevelopment Bank together with expert assistance from the US Environmental Protection Agency(US EPA), including advice on SO2 controls, installing and maintaining equipment, and trainingpersonnel in monitoring and managing data (Yale Environment 360, 2010).
5.5 Implications of non-compliance
For the 11th FYP period, it is not clear whether the MEP applied severe penalties for non-compliancewith meeting the standards and regulations. For example, it is known that in 2010, the MEP finedeight power plants for fraudulent FGD operational reports and, although the level of fines is not publicinformation, it is understood that this is not thought to be a significant deterrent (He, 2011).
However, there is now a strong culture of monitoring, verification and compliance being established.The regional centres have the right to undertake their own monitoring activities at any plant wherethey suspect any failure to control the emissions. The Department of Total Emissions Control now hasthe legal right to close the power plant if it cannot meet the new standards and ultimately it canprevent any applications by that operator to receive environmental impact approval for new plantapplications. This is seen as a very serious deterrent, especially since any default of the approvalsprocess would provide an opportunity for an alternative company to take over the planning option.
28 IEA CLEAN COAL CENTRE
Monitoring, verification and control
6 Market opportunities to 2020
29Non-greenhouse gas emissions from coal-fired power plants in China
The new thermal power plant emission regulations and standards will further create a rapidly growingand large market demand in China for improved pollutant control devices on coal-fired units, both forretrofit and new applications. This includes particulates, SO2, and NOx emissions control, mercurymonitoring devices, plus continuous emissions monitoring systems for supervision and verification.From the start of January 2012, when the new standards came in to force, the generating companieswill have 30 months to complete the upgrading process while all new plants will require the advancedsystems from the start of operations. Although mercury monitoring is expected to be required from thestart of 2015, this will require only the installation of equipment plus training in its operation.Consequently, this is not considered further in this chapter, not least since the Chinese stakeholdersare focusing on the more pressing needs to address the more comprehensive emissions control andmonitoring requirements.
At the start of 2011, the coal-fired power plant capacity was some 687 GWe (21 Tradenet, 2011a),which ranges from small (100–200 MWe), old and inefficient units with limited environmentalcontrols to very large (1000 MWe), modern units with full emission control systems for the removalof particulates, SO2, and NOx. Discounting the 50 GWe of small capacity intended for closure duringthe period of the 12th FYP, some 94% of the remainder will require their ESP systems to be upgraded,some 80% will require the FGD system to be upgraded while 92% will need SCR/SNCR to beinstalled (istockAnalyst, 2011a).
For the long term, should CO2 capture be introduced, there will be a need at that time to consider howbest to integrate the capture process with the existing emission control devices. If the capture processshould be based on amine post-combustion scrubbing, then the need to achieve the currently definedvery low SO2 and NOx levels in order to limit amine degradation should be achievable without furtherupgrading.
There have been numerous provisional capital and operational cost estimates from industry and theMEP, covering both the necessary upgrades to existing plants and the need to ensure all new plants arecompliant with the new standards. Some of these estimates are quoted and referenced in thesubsequent sections. However, at this stage, there are no definitive estimates, in part due to the sheerscale of what is required and the lack of any firm assessments of the impact this will have on theglobal market in terms of supply of equipment, materials and services. Consequently, all suchinformation in this chapter must be treated with extreme caution.
6.1 Particulates/fly ash removal and utilisation
The removal of particulates from coal-fired power plants is an area where China already has somemarket dominance. Equally, due to the sheer scale of operations, China also has the greatest challengeboth in terms of fly ash utilisation and disposal.
6.1.1 ESP and bag filters
In China, most ESP are either three-stage or four-stage systems with particulate collection efficienciesof 99.2% and 99.5% respectively. The use of a five-stage system would give a collection efficiency ofabout 99.7% but the reliability is not assured. It has been suggested that, for existing power plants, thecoal power sector will introduce a part bag filter arrangement to top up the collection efficiency of theexisting systems to 99.9–99.95%, which has the benefit of improving the collection of particles of lessthan ten microns in size (for example PM2.5). For new plants, the use of a full bag filter arrangement is
being considered although this is likely to be an expensive option compared to the alternatives. In anycase, where the coal ash characteristics make effective ESP operation difficult, there will also be aneed to also install bag filters (Feng, 2010). Certainly, the MEP would like to see bag filters becomethe norm for fine particulates removal. However, it may well need either additional persuasion ordirect command to ensure that the power companies take that step.
China has a very strong domestic ESP production capability and the expectation is that it can handlethe necessary improvements, including the possible use of supplementary or full bag filters, using itsown technologies and domestic production systems. There should also be scope to maintain andexpand its export opportunities.
The major domestic suppliers of ESP, which between them contribute over half of the gross outputvalue of this sector in China, include the Zhejiang Feida Environmental Protection Technology CoLtd, Fujian Longking Co Ltd, Shanghai and Mining Machinery Manufacturing Factory, China TianjieGroup Co Ltd, and the Lanzhou Electric Power Building And Repairing Factory (PollutionEngineering, 2010). With regard to bag filters, some 80% of the suppliers are small domesticenterprises. The major suppliers for power plants are the Jiangsu Xinzhong Environmental ProtectionCo Ltd, Zhejiang Feida Environmental Protection Technology Co Ltd, Fujian Longking Co Ltd, andthe Wuhan Kaidi Electric Power Environmental Co Ltd. Some of these larger Chinese companies areco-operating with international companies and many of the international suppliers of filter media andbags have invested in manufacturing facilities in China for export applications (Pollution Engineering,2010).
6.1.2 Particulates/fly ash utilisation
In China, combustion of one tonne of coal produces about 0.3 tonnes of particulates/fly ash, most ofwhich is captured in the ESP and/or bag filters. The annual collection rate reached 380 Mt in 2010,making it China’s single largest source of industrial solid residue. While there are standards in placecovering the choice of storage location and of measures to be taken to prevent wind dispersal, leakageand run-off, these are not rigorously enforced to limit air, water, and soil pollution (Reuters, 2010).
At the same time, safe and effective utilisation of the ash would be the preferred way forward and thedrive is to determine cost effective means of utilisation for added value applications. Development ofthe potential market for recycling was encouraged in 2008 with the introduction of a new CircularEconomy Law. However, this potential has not been adequately realised due to inconsistent standardsand utilisation requirements, lack of strong government incentives, and limited encouragement forinternational companies to become involved.
Currently recycling of fly ash is focused on its use for building applications, road construction andagricultural uses, with as much as possible of the ESP particulates directed to cement manufacturingplants. Government statistics suggest that the proportion used is up to 67%, although such numbershave not been verified. Work is under way to develop processes for achieving better added valuethrough the extraction of metals from the ash. There are several emerging technologies for theextraction of alumina, cenospheres and carbon from recovered fly ash. One demonstration project inInner Mongolia aims to extract up to 600,000 tonnes of alumina, which can then be used to producealuminium (Northeastern University, 2010). Should such processes prove financially viable, which isquestionable under the current conditions, this should encourage a more comprehensive approach tofly ash use.
6.2 FGD
At the end of 2010, about 86% of the coal-fired plants available for operation included SO2 removal
30 IEA CLEAN COAL CENTRE
Market opportunities through to 2020
systems (MEP, 2011b). The overwhelming majority of systems installed to date are the wet limestone-gypsum FGD process (Wang, 2010), accounting for some 90% of that capacity, the remainder mostlycomprising seawater desulphurisation (3%) for those coastal plants where the coal sulphur content isless than 1%, dry FGD for use on units smaller than 200 MWe (2%) where the coal sulphur content isless than 1%, ammonia desulphurisation (2%), and a CFB scrubber system (1%). The new emissionlimits will require SO2 removal levels up to 95–97% and so, apart from for plants in coastal locationsand those where very low sulphur coal use (for example at plants that use imported coal) can beguaranteed, wet limestone FGD will be the favoured system both for new and retrofit units. Becauseof the water availability concerns in Northern China, measures will have to be taken to minimise waterusage through recycling.
6.2.1 Likely opportunities
With the continuing introduction of new coal-fired plants through to 2020, all will have to includeFGD. There will also need to be FGD fitted on any remaining existing plants that are not scheduled tobe closed. At the same time, some 80% of existing FGD units will need to be upgraded in order tomeet the new SO2 emissions control requirements (Market Research, 2010). This suggests that therewill be a need for FGD to be installed on some 275–380 GWe new plants, retrofitted on about 70 GWeof existing plants plus upgraded on approximately 470 GWe of existing plants. In the latter case, thiswill not only be to meet the tighter emissions limits but also to improve the quality and reliability ofearly installations where the equipment does not meet current standards (Wang, 2010).
For completeness, it should be noted that while the current focus of opportunities is in the coal-firedpower sector, in 2010 this was widened by the government with their declared intention to limitemissions from other large, energy-intensive coal processes together with metal processing andmanufacturing systems (China Greentech Initiative, 2011).
On the basis of past experience, Chinese equipment and service suppliers are likely to capture thegreat majority of sales opportunities. At the same time over half of the market will be controlled bystate-owned enterprises (SOE), namely the big five power companies and other major energy groupssuch as the Shenhua Corporation (Minchener, 2010). These SOE have subsidiary companies in thesemarkets and so can determine who will supply the various products to their particular power plants.
Chinese production costs are lower than international suppliers, in part because of the lower domesticmanufacturing costs base. Since 2000, capital costs for adding FGD in China have fallen from800–1200 RMB/kW (126–189 US$/kW) to 200–250 RMB/kW (31–39 US$/kW) (Yue, 2011). Thisreflects the benefits of economy of scale, with some 550 GWe of power plant capacity fitted withFGD in that time period. The other major factor that has contributed to this fall in costs is that mostChinese designs now use more synthetics and less metal alloys than European or USA alternatives.The use of fibre reinforced plastics for large-scale piping and containment vessels is preferred becauseit is lower cost and more readily available than high alloy stainless steels, which must be imported(Reinforced Plastics, 2009, 2010).
The other point to note is that these average costs will have been distorted to some extent since someChinese services companies have won contracts by bidding below true cost, with attempts to thensupply inferior and inadequate quality products. Subsequently, this results in higher retrofitcomponent costs due to system failures and lack of reliability.
6.2.2 Likely technology suppliers
The introduction of FGD to China has mirrored that of introducing advanced coal-fired plants(Minchener, 2010). Thus the NDRC supported the introduction of international technologies, the
31Non-greenhouse gas emissions from coal-fired power plants in China
Market opportunities through to 2020
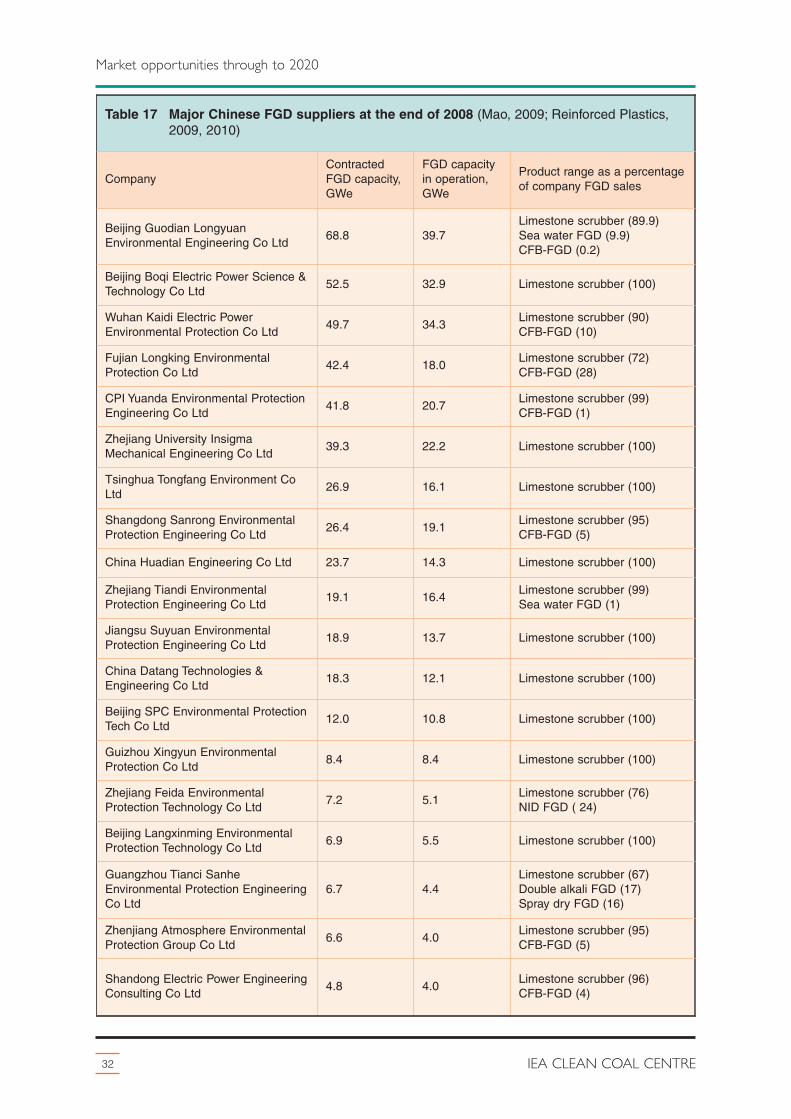
32 IEA CLEAN COAL CENTRE
Market opportunities through to 2020
Table 17 Major Chinese FGD suppliers at the end of 2008 (Mao, 2009; Reinforced Plastics,2009, 2010)
CompanyContractedFGD capacity,GWe
FGD capacityin operation,GWe
Product range as a percentageof company FGD sales
Beijing Guodian LongyuanEnvironmental Engineering Co Ltd
68.8 39.7Limestone scrubber (89.9)Sea water FGD (9.9) CFB-FGD (0.2)
Beijing Boqi Electric Power Science &Technology Co Ltd
52.5 32.9 Limestone scrubber (100)
Wuhan Kaidi Electric PowerEnvironmental Protection Co Ltd
49.7 34.3Limestone scrubber (90)CFB-FGD (10)
Fujian Longking EnvironmentalProtection Co Ltd
42.4 18.0Limestone scrubber (72)CFB-FGD (28)
CPI Yuanda Environmental ProtectionEngineering Co Ltd
41.8 20.7Limestone scrubber (99)CFB-FGD (1)
Zhejiang University InsigmaMechanical Engineering Co Ltd
39.3 22.2 Limestone scrubber (100)
Tsinghua Tongfang Environment CoLtd
26.9 16.1 Limestone scrubber (100)
Shangdong Sanrong EnvironmentalProtection Engineering Co Ltd
26.4 19.1Limestone scrubber (95)CFB-FGD (5)
China Huadian Engineering Co Ltd 23.7 14.3 Limestone scrubber (100)
Zhejiang Tiandi EnvironmentalProtection Engineering Co Ltd
19.1 16.4Limestone scrubber (99)Sea water FGD (1)
Jiangsu Suyuan EnvironmentalProtection Engineering Co Ltd
18.9 13.7 Limestone scrubber (100)
China Datang Technologies &Engineering Co Ltd
18.3 12.1 Limestone scrubber (100)
Beijing SPC Environmental ProtectionTech Co Ltd
12.0 10.8 Limestone scrubber (100)
Guizhou Xingyun EnvironmentalProtection Co Ltd
8.4 8.4 Limestone scrubber (100)
Zhejiang Feida EnvironmentalProtection Technology Co Ltd
7.2 5.1Limestone scrubber (76)NID FGD ( 24)
Beijing Langxinming EnvironmentalProtection Technology Co Ltd
6.9 5.5 Limestone scrubber (100)
Guangzhou Tianci SanheEnvironmental Protection EngineeringCo Ltd
6.7 4.4Limestone scrubber (67)Double alkali FGD (17)Spray dry FGD (16)
Zhenjiang Atmosphere EnvironmentalProtection Group Co Ltd
6.6 4.0Limestone scrubber (95)CFB-FGD (5)
Shandong Electric Power EngineeringConsulting Co Ltd
4.8 4.0Limestone scrubber (96)CFB-FGD (4)
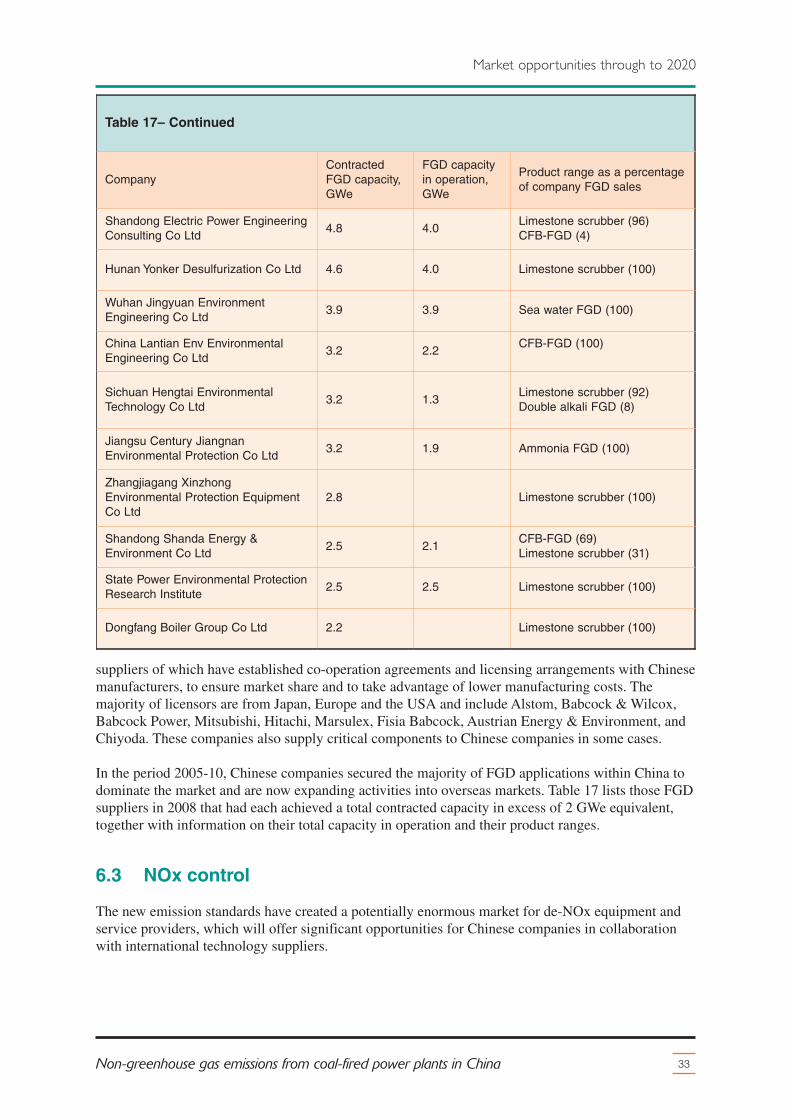
suppliers of which have established co-operation agreements and licensing arrangements with Chinesemanufacturers, to ensure market share and to take advantage of lower manufacturing costs. Themajority of licensors are from Japan, Europe and the USA and include Alstom, Babcock & Wilcox,Babcock Power, Mitsubishi, Hitachi, Marsulex, Fisia Babcock, Austrian Energy & Environment, andChiyoda. These companies also supply critical components to Chinese companies in some cases.
In the period 2005-10, Chinese companies secured the majority of FGD applications within China todominate the market and are now expanding activities into overseas markets. Table 17 lists those FGDsuppliers in 2008 that had each achieved a total contracted capacity in excess of 2 GWe equivalent,together with information on their total capacity in operation and their product ranges.
6.3 NOx control
The new emission standards have created a potentially enormous market for de-NOx equipment andservice providers, which will offer significant opportunities for Chinese companies in collaborationwith international technology suppliers.
33Non-greenhouse gas emissions from coal-fired power plants in China
Market opportunities through to 2020
Table 17– Continued
CompanyContractedFGD capacity,GWe
FGD capacityin operation,GWe
Product range as a percentageof company FGD sales
Shandong Electric Power EngineeringConsulting Co Ltd
4.8 4.0Limestone scrubber (96)CFB-FGD (4)
Hunan Yonker Desulfurization Co Ltd 4.6 4.0 Limestone scrubber (100)
Wuhan Jingyuan EnvironmentEngineering Co Ltd
3.9 3.9 Sea water FGD (100)
China Lantian Env EnvironmentalEngineering Co Ltd
3.2 2.2CFB-FGD (100)
Sichuan Hengtai EnvironmentalTechnology Co Ltd
3.2 1.3Limestone scrubber (92)Double alkali FGD (8)
Jiangsu Century JiangnanEnvironmental Protection Co Ltd
3.2 1.9 Ammonia FGD (100)
Zhangjiagang XinzhongEnvironmental Protection EquipmentCo Ltd
2.8 Limestone scrubber (100)
Shandong Shanda Energy &Environment Co Ltd
2.5 2.1CFB-FGD (69)Limestone scrubber (31)
State Power Environmental ProtectionResearch Institute
2.5 2.5 Limestone scrubber (100)
Dongfang Boiler Group Co Ltd 2.2 Limestone scrubber (100)
6.3.1 Likely opportunities
All coal-fired power station boilers that have been installed since 2003 are equipped with low NOxburners while the installed capacity of catalytic de-NOx systems at the end of 2010 was 58 GWe,which is about 8% of the total coal-fired capacity (21 Tradenet, 2011a). All but two percentage pointsof this comprised SCR rather than the less efficient but cheaper SNCR. Consequently, the drive willbe to install SCR as the required technology option (21 Tradenet, 2011a). Because there are so manyexisting power plants without NOx control systems and because China continues to lead the world inconstruction of new power plants, this will become the largest NOx control market over the nextdecade.
For the period to 2020, the MEP has predicted that:� by end 2015 some 817 GWe of existing and new capacity will have to add SCR/SNCR de-NOx
equipment; � by 2020 with capacity increasing possibly to 1065 GWe, a further 190-200 GWe of new capacity
will also require such equipment.
There is also the expectation that, in time, strict NOx emission standards will be applied to the ironand steel, non-ferrous metals, chemicals, and building materials industries, which will represent asubstantial expansion of the market.
As part of the projection to 2020 (istockAnalyst, 2011a), the MEP estimated that:� the market potential to 2015 for design, production, supply and installation of de-NOx systems
on existing and new coal power capacity will be some RMB195 billion (US$31 billion) withannual operating costs of RMB61 billion (US$9.6 billion); and
� by 2020 this cumulative market potential will be RMB 233 billion (US$37 billion) with annualoperating costs of RMB80–90 billion (US$12.6–14.2 billion).
These estimates are, at best, tentative and are assuming the majority of the costs are incurred withinChina, which may not be viable, as discussed below.
6.3.2 Likely technology suppliers
Initially all the technology came from international suppliers but now there are several experiencedChinese system companies that can provide core equipment and technical support. Examples of suchinternational suppliers and established Chinese counterparts are given in Table 18. The majority of thelatter companies are already active in the FGD market and they have been joined by the three majorpower plant engineering companies as all see opportunities for complementary expansion of theirbusiness activities.
Babcock and Wilcox (USA) and IHI (Japan) have already established joint ventures with theirpartners to provide local manufacturing facilities together with NOx control support services(Wang, 2010). LLB (Germany) and Cormetech (USA) have established local operations withDongfang and CPI Yuanda respectively.
There is also a rapidly growing Chinese catalyst manufacturing capability, with the major suppliersincluding Chengdu Dongfang KIWH Environmental Protection Catalysts Co Ltd and theSino-Environment Technology Group Ltd (FECC, 2010).
It has been estimated that for the period to 2015, the annual NOx catalyst market demand will be closeto 60,000–80,000 m3. At the end of 2010, the domestic production capacity (including joint ventures)was below 50,000 m3. While Chinese manufacturing capacity will increase rapidly, there wouldappear to be a need for some direct import of catalyst to provide the balance. However, beyond 2015,
34 IEA CLEAN COAL CENTRE
Market opportunities through to 2020
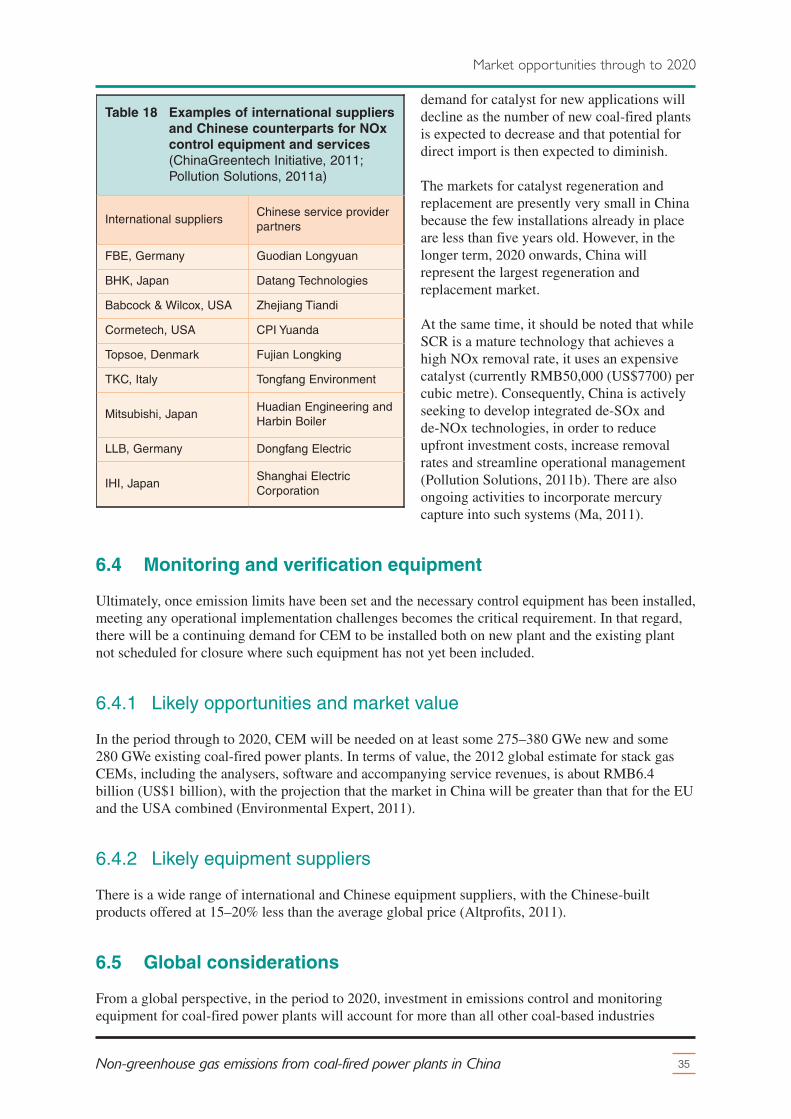
demand for catalyst for new applications willdecline as the number of new coal-fired plantsis expected to decrease and that potential fordirect import is then expected to diminish.
The markets for catalyst regeneration andreplacement are presently very small in Chinabecause the few installations already in placeare less than five years old. However, in thelonger term, 2020 onwards, China willrepresent the largest regeneration andreplacement market.
At the same time, it should be noted that whileSCR is a mature technology that achieves ahigh NOx removal rate, it uses an expensivecatalyst (currently RMB50,000 (US$7700) percubic metre). Consequently, China is activelyseeking to develop integrated de-SOx andde-NOx technologies, in order to reduceupfront investment costs, increase removalrates and streamline operational management(Pollution Solutions, 2011b). There are alsoongoing activities to incorporate mercurycapture into such systems (Ma, 2011).
6.4 Monitoring and verification equipment
Ultimately, once emission limits have been set and the necessary control equipment has been installed,meeting any operational implementation challenges becomes the critical requirement. In that regard,there will be a continuing demand for CEM to be installed both on new plant and the existing plantnot scheduled for closure where such equipment has not yet been included.
6.4.1 Likely opportunities and market value
In the period through to 2020, CEM will be needed on at least some 275–380 GWe new and some280 GWe existing coal-fired power plants. In terms of value, the 2012 global estimate for stack gasCEMs, including the analysers, software and accompanying service revenues, is about RMB6.4billion (US$1 billion), with the projection that the market in China will be greater than that for the EUand the USA combined (Environmental Expert, 2011).
6.4.2 Likely equipment suppliers
There is a wide range of international and Chinese equipment suppliers, with the Chinese-builtproducts offered at 15–20% less than the average global price (Altprofits, 2011).
6.5 Global considerations
From a global perspective, in the period to 2020, investment in emissions control and monitoringequipment for coal-fired power plants will account for more than all other coal-based industries
35Non-greenhouse gas emissions from coal-fired power plants in China
Market opportunities through to 2020
Table 18 Examples of international suppliersand Chinese counterparts for NOxcontrol equipment and services(ChinaGreentech Initiative, 2011;Pollution Solutions, 2011a)
International suppliersChinese service providerpartners
FBE, Germany Guodian Longyuan
BHK, Japan Datang Technologies
Babcock & Wilcox, USA Zhejiang Tiandi
Cormetech, USA CPI Yuanda
Topsoe, Denmark Fujian Longking
TKC, Italy Tongfang Environment
Mitsubishi, JapanHuadian Engineering andHarbin Boiler
LLB, Germany Dongfang Electric
IHI, JapanShanghai ElectricCorporation
combined, and the market will be dominated by China and to a lesser extent India (Market Research,2010). For ESP, FGD and de-NOx SCR systems for coal-fired power plants, China will represent90%, 53% and 90% of the total market respectively. For CEM, it will also be a major purchaser ofequipment (Pollution Engineering, 2010).
Consequently, this major Chinese environmental initiative will lead to a fundamental shift in themarket for power plant air pollution control systems. In particular, Chinese coal power capacity in2010 was just under 700 GWe. By 2020, it will be at least 960 GWe, possibly 1065 GWe as there isinevitably some uncertainty in the future growth of this sector, as indicated in previous chapters. Thus,on a conservative basis, for FGD systems in the decade up to end 2010, China had installed FGD onclose to 590 GWe coal-fired power capacity and so by 2020 this could rise to at least 960 GWe. Forthe rest of the world, the total installed capacity is some 380 GWe on coal-fired power plants since1980. China also expects to install SCR on all that coal-fired power plant capacity by end 2020. Therest of the world has installed about 300 GWe of SCR systems since 1980 (Environmental Expert,2009).
Such a demand will totally overload existing international suppliers, which has already led to Chinesecompanies establishing co-operation agreements with international organisations in order to set updomestic manufacturing capacity.
In these situations, China’s demand will dominate the global markets. Costs over the next decade willmost likely rise due to Chinese demand for resources outstripping global supply, leading to overallshortages in materials for components (for example catalysts for de-NOx and a wide range ofcomponents for FGD). However, in the longer term when the enormous need for advanced pollutioncontrol systems on the Chinese coal fleet has been met, there will be some major Chinese suppliersentering the global market, which will decrease prices (Environmental Expert, 2009). Chinesecompanies are already the world’s leading suppliers of ESP, while ten of their companies are amongthe twenty largest FGD suppliers (Pollution Solutions, 2011b).
36 IEA CLEAN COAL CENTRE
Market opportunities through to 2020
7 Comparison with the EU and the USA
37Non-greenhouse gas emissions from coal-fired power plants in China
An overview is provided of the recent coal power emissions legislation and standards in the EU andthe USA, and comparison made with the new requirements in China.
7.1 EU legislation and standards
There are two main directives and one impending directive which are relevant to coal-fired utilities inthe EU member states. The Integrated Pollution Prevention and Control (IPPC) Directive and theLarge Combustion Plant Directive (LCPD) will both continue to apply until the new IndustrialEmissions Directive (IED) comes into force in 2016. However, in terms of the emissions limits forcoal-fired plant, the IED encompasses the key aspects of the two current directives and so the focus inthis report will be on that particular piece of legislation.
7.1.1 Integrated Pollution Prevention and Control
The EU IPPC Directive (2008/1/EC) provides an integrated environmental regulatory approach thatapplies to some 45,000 industrial facilities, including large combustion plants. It is based on aplant-specific permit which details the requirements relevant to each individual facility and cantherefore take into account not only any international and national requirements but also regional andlocal considerations such as the preservation of sensitive watershed areas. Each installation mustobtain a permit that contains emission limit values (ELV) and other conditions based on theapplication of best available techniques (BAT) to minimise emissions of pollutants likely to be emittedin significant quantities to air, water or land. There is also a need to address energy efficiency, wasteminimisation, prevention of accidental emissions and site restoration (DEFRA, 2011).
In general, for plants with a capacity greater than 500 MWth, the minimum BAT requirements underIPCC are as follows (Adams, 2006):
With regard to technologies, the BAT optionscomprise:� Particulates: either ESP (99.5% efficiency)in combination with wet FGD, orbaghouses (fabric filters) (99.95%efficiency) in combination with wet FGD;
� SO2: either low sulphur fuel, wet FGDspray dry FGD, seawater FGD or acombined SO2 and NOx control system;
� NOx: either primary measures (air/fuelstaging, low NOx burners, reburn) incombination with SCR (or SNCR in somecases), or a combined SO2 and NOxsystem.
From a practical perspective most, if not all, large units in Europe will install some form of FGDsystem. For NOx, the situation is less clear cut since NOx emissions are not directly related to thenitrogen content of the coal, in the same way that SO2 emissions are related to its sulphur content, dueto some NOx being formed from N2 in the combustion air. New technologies for NOx control such asdry-low NOx systems or new combustion controls are still being developed which means that themarket place for NOx systems is more volatile than that for SO2 control systems (Robinson, 2007).
Table 19 BAT requirements under the IPPCDirective (Adams, 2006)
RequirementExistingplant
Newplant
Efficiency, % net, LHV basis 36–40 43–47
Particulates, mg/m3 5–20 5–10
SO2, mg/m3 20–200 20–150
NOx, mg/m3 90–200 90–150
The listings above are also overly simplistic. The actual selection of which technology to retrofit toeach plant is based on a study of the IPPC directive to determine how it applies to each unitindividually. The definition of BAT is open to interpretation and therefore the European Commission(EC) has published BREF – BAT reference documents. These are large and detailed documents,which provide a selective review of the many techniques and technologies that could be considered asBAT. They may not be representative as they concentrate on ‘best ever’ levels of emissions fromisolated cases rather than analyses of the wide range of feasible performance characteristics overdifferent plants in different situations (Tsadari, 2006).
The problems with the IPPC directive were evident even before its launch and by March 2006, in the18 member states involved, only 43% of the installations covered by the directive had completed theapplication process and been granted permits (Tsadari, 2006).
7.1.2 Large Combustion Plant Directive
The revised Large Combustion Plant Directive (LCPD 2001/80/EC) applies to combustion plants witha thermal output of greater than 50 MW. The requirements vary depending on whether it is either anew or existing plant, the definition of which is that (Sloss, 2003):� existing plants are those licensed before 1 July 1987;� new plants are those licensed after 1 July 1987 but before 27 November 2002 (and operational
before 27 November 2003); while � new-new plants are those licensed after 27 November 2003.
According to the directive, owners of all large combustion plants in Europe had to opt for one of thefollowing compliance options by 1 January 2008, to:� meet ELV for particulates, SO2 and NOx;� sign up to lower SO2 and NOx ‘bubbles’ that are equivalent to the ELV reductions (see below)
and which are part of a National Emission Reduction Plan (NERP); or� opt out of ELV and NERP and commit to close by 2015 while operating for no more than
20,000 hours over that period.
In order to meet the LCPD emission requirements, in practice, it means that a coal-fired power plantwould need to have FGD installed with combustion modifications to reduce NOx.
Within Europe as a whole, almost 25 GWe of coal units and 10 GWe of lignite units will not be fittedwith FGD, particularly in Western Europe because the owners chose to opt-out of the LCPD(Kramarchuk and Brunetti, 2008). Such plants were deemed to have been opted-out and would havebeen limited to a total operation of 20,000 hours before the end of 2015 after which the owners wouldhave had the choice of (Adams, 2006):� closure;� refurbishment to extend life and to meet LCPD requirements by retrofitting required technologies;� installing supercritical or advanced supercritical pulverised coal plant;� installing supercritical FBC (fluidised bed combustion) plant; � installing IGCC (integrated gasification combined cycle) plant.
The last three options would require either the installation of a new plant at the old site or anupgrading of the existing plant. These requirements have now been superseded by the IED and thetimeline extended (see below).
7.1.3 Industrial Emissions Directive
In 2007, in recognition that the EU legislation was both piecemeal and confusing, the EC merged
38 IEA CLEAN COAL CENTRE
Comparison with the EU and the USA
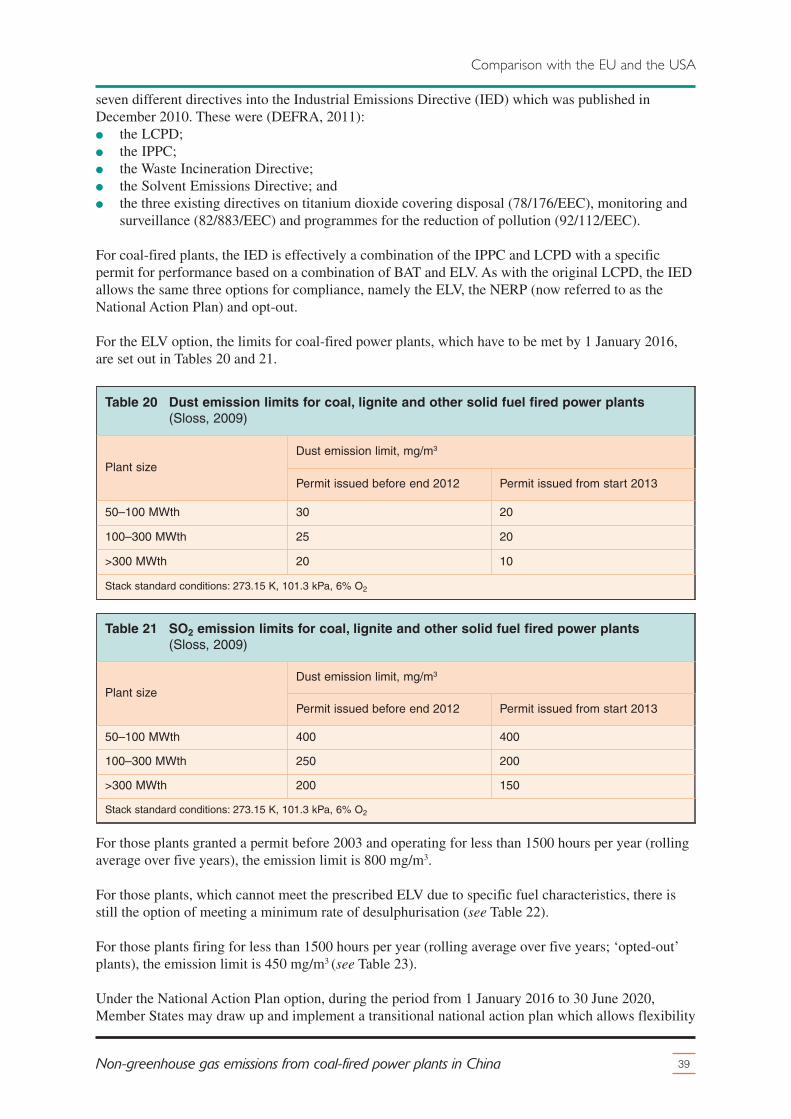
seven different directives into the Industrial Emissions Directive (IED) which was published inDecember 2010. These were (DEFRA, 2011):� the LCPD;� the IPPC;� the Waste Incineration Directive;� the Solvent Emissions Directive; and � the three existing directives on titanium dioxide covering disposal (78/176/EEC), monitoring and
surveillance (82/883/EEC) and programmes for the reduction of pollution (92/112/EEC).
For coal-fired plants, the IED is effectively a combination of the IPPC and LCPD with a specificpermit for performance based on a combination of BAT and ELV. As with the original LCPD, the IEDallows the same three options for compliance, namely the ELV, the NERP (now referred to as theNational Action Plan) and opt-out.
For the ELV option, the limits for coal-fired power plants, which have to be met by 1 January 2016,are set out in Tables 20 and 21.
For those plants granted a permit before 2003 and operating for less than 1500 hours per year (rollingaverage over five years), the emission limit is 800 mg/m3.
For those plants, which cannot meet the prescribed ELV due to specific fuel characteristics, there isstill the option of meeting a minimum rate of desulphurisation (see Table 22).
For those plants firing for less than 1500 hours per year (rolling average over five years; ‘opted-out’plants), the emission limit is 450 mg/m3 (see Table 23).
Under the National Action Plan option, during the period from 1 January 2016 to 30 June 2020,Member States may draw up and implement a transitional national action plan which allows flexibility
39Non-greenhouse gas emissions from coal-fired power plants in China
Comparison with the EU and the USA
Table 20 Dust emission limits for coal, lignite and other solid fuel fired power plants(Sloss, 2009)
Plant sizeDust emission limit, mg/m3
Permit issued before end 2012 Permit issued from start 2013
50–100 MWth 30 20
100–300 MWth 25 20
>300 MWth 20 10
Stack standard conditions: 273.15 K, 101.3 kPa, 6% O2
Table 21 SO2 emission limits for coal, lignite and other solid fuel fired power plants(Sloss, 2009)
Plant sizeDust emission limit, mg/m3
Permit issued before end 2012 Permit issued from start 2013
50–100 MWth 400 400
100–300 MWth 250 200
>300 MWth 200 150
Stack standard conditions: 273.15 K, 101.3 kPa, 6% O2
and co-operation between several plants to maintain emissions below the prescribed combined limit.This is the same as the NERP option under the LCPD but with a longer time schedule allowed.
Under the opt-out scheme, plants may be exempt from the ELV and National Action Planrequirements if they agree to: � operate for no more than 17,500 hours between 1 January 2016 and 31 December 2023 (a more
relaxed timescale than the LCPD);� report hours of operation on an annual basis;� maintain ELV prescribed in the plant permit on 31 January 2015 for the remaining operation
period of the plant.
The IED carries with it requirements for continuous emission monitoring of particulates/dust, SO2 andNOx. Although the IED does not set an ELV for mercury from coal-fired utilities, it does introduce arequirement for annual monitoring of mercury emissions.
In summary, the timescale for compliance with the IED is much longer and therefore more lenientthan that of the original LCPD and will mean that many countries in the EU will have less complianceissues than they had previously. However, the IED is still a major challenge to many utilities as it issetting requirements and limits that will result in the application of FGD and de-NOx technologiesacross most plants by 2016 and across the complete fleet of coal-fired power plants in the EU beyond2023, when all opted-out plants must close.
7.2 USA legislation and standards
Legislation in the USA has evolved over time in a piecemeal fashion, which has resulted in acombination of emission limits, reduction targets and trading allowances. There are often significant
40 IEA CLEAN COAL CENTRE
Comparison with the EU and the USA
Table 22 Desulphurisation rate for plants firing a challenging fuel (Sloss, 2009)
Plant size
Required desulphurisation rate, %
Permit issued before27 November 2012
Permit issued beforeend 2012
Permit issued from start2013
50–100 MWth 80 92 93
100–300 MWth 90 92 93
>300 MWth 96 96 97
Table 23 NOx emission limits for coal, lignite and other solid fuel fired power plants(Sloss, 2009)
Plant size
NOx emission limit, mg/m3
Permit issued before end 2012 Permit issued from start 2013
Coal Lignite Coal Lignite
50–100 MWth 300 450 300 400
100–300 MWth 200 200 200 200
>300 MWth 200 200 150 200
Stack standard conditions: 273.15 K, 101.3 kPa, 6% O2
differences from region to region, which mean that the permits for plants in the USA are likely to besignificantly more varied and site-specific than those in the EU. For individual plant operators thedecision on whether to retrofit flue gas control technologies has not been as clear cut as it is in the EU.The use of trading in the past has meant that the rate of adoption of FGD and SCR systems in theUSA is not as high as it is in Europe.
Where the EU has BAT, the USA has BACT (best available control technology) and MACT (maximumachievable control technology) requirements for pollution control. The term BACT is used in attainmentzones when dealing with major pollutants (for example particulates, SO2 and NOx) while MACT is usedwhen dealing with hazardous air pollutants. In a non-attainment zone where the air quality standards arenot being met, the term LAER (lowest achievable emission rate) applies since plants must still minimisetheir emissions even though they cannot comply with the standards (Sloss, 2003).
7.2.1 CAAA, NAAQS and NSPS
The US Clean Air Act Amendments (CAAA) of 1990 set emission limits for particulates, SO2 andNOx for certain plants and revised existing limits for others. Individual states within the USA adoptedthese emission standards under a State Implementation Plan (SIP). Individual utilities could complywith the rule by meeting annual emission limitations at each facility or on average for a group offacilities, or by applying for a less stringent alternative emission limit if the required controltechnology did not adequately reduce the emission level (Swisher and McAlpine, 2006).
In the past, the USA has favoured the use of emissions trading to control emissions of SO2 and NOx.SO2 trading was first included under the 1990 CAAA whereas NOx trading was introduced later.Phase 1 allowed plant operators to choose between either installing FGD or switching to a low sulphurfuel. At that time, the deregulation of the railway industry lowered the cost of transportationsignificantly and this meant that the use of, for example, Powder River Basin low sulphur coals was asignificantly more economic option than the installation of FGD. However, now that the emissionlegislation has tightened further under Phase II, fuel switching is no longer the best option on manyplants since few coals have a sulphur content low enough to ensure compliance with the newstandards (Lewandowski and others, 2004). Consequently, since the early 2000s, there has been amove towards increased installation of FGD, either as part of the CAAA or as a result of regionalrequirements.
41Non-greenhouse gas emissions from coal-fired power plants in China
Comparison with the EU and the USA
Table 24 Overview of NSPS emission requirements for a pulverised coal fired power plant(Krause and Rosenquist. 2001)
Pollutant NSPSProbableBACT/LAERemission limit
Typical BACT/LAERcontrol technology
TypicalBACT/LAERcontrol efficiency
TSP or PM1099% removal and13 mg/MJ (TSP)
4–7 mg/MJ (PM10) fabric filter/ESP >99.5% (PM10)
SOx70–90% removal and260–4420 mg/MJ
52–87 mg/MJmedium-low sulphurcoal
90–95% FGD
NOx 65 mg/MJ 22–44 mg/MJ SCR with LNB 50–90%
CO – 44–65 mg/MJ combustion control n/a
VOC – 13–22 mg/MJ combustion control n/a
Emission limits are based on recent BACT determinations for coal-fired units and on the known capabilities of currentlyavailable emission control technologies
For NOx control, while the trading approach has been broadly similar, the NOx allowance schemevaries not only from state to state but also from season to season with the amount of allowances beingreduced during those periods where seasonal ground level ozone is a problem. The market is thereforecomplex and volatile (Environmental Finance, 2005).
The national air quality standards (NAAQS) are set by the US EPA for the control of particulates,SO2, NOx, ozone and CO (Krause and Rosenquist, 2001). States that exceed the NAAQS for one ormore pollutant are required to include in their SIP details of how they will meet the standards withinthree years, which can mean the need to take action over and above that which would be required bythe national legislation (Schultz, 2008).
The requirements under the NSPS are not as stringent as BACT in most cases. The standards have noincentives for modifications and technology improvements (Li, 2002). If NSPS is applicable to a unitthen it must apply BACT to reduce emissions. However, if the unit is located in a non-attainment area,the unit must comply with LAER instead of BACT (Krause and Rosenquist, 2001). LAER is definedas either the most stringent emissions limitation contained in the state rules for such class or categoryof source or the most stringent limitation achieved in practice by such class or category of sourceanywhere (Daves, 2002). Since BACT includes an economic factor, permitting agencies have somediscretion to adjust emission limits. However, economic factors are not considered when determiningLAER so emission limits would generally be at the lower end of the range of emission limitssummarised in Table 24.
7.2.2 CAIR and CAMR (now vacated)
Two new rules proposed by the US EPA, have been abandoned (vacated) leaving those plants whichhad opted to make an early move towards compliance with the decision as to whether to continue toretrofit control technologies on the assumption that they will comply with subsequent new legislation,or to wait until further rules are approved. These are the Clean Air Mercury Rule (CAMR), which wasdesigned to reduce mercury emissions from coal combustion significantly within the next decade, andthe Clean Air Interstate Rule (CAIR), which aimed at further reducing emissions of SO2 and NOx, viatrading. Both have been replaced by the new Air Toxics Rule, which is considered below.
7.2.3 The new Air Toxics Rule
The new Air Toxics Rule was proposed in March 2011 with the final rule published on 21 December2011, and a compliance period that will run for three years from that publication date. This is basedon MACT and the US EPA must set ELV that are at least as stringent as the emission reductionsachieved by the average of the top 12% best controlled sources for the relevant source categories.
The rule concentrates on several air toxics: mercury, acid gases (HCl surrogate for all acid gases, withan alternate surrogate of SO2), non-mercury metallic toxic pollutants (such as arsenic and chromium,with either total metals or total particulate matter as surrogates), and organic air toxics (includingdioxins) (US EPA, 2011). The limits are challenging and, for example, the emission reduction rate formercury will mean the requirement for investment in specific, and potentially costly, mercury controltechnologies at many plants. It is likely that construction of many new plants will be put on hold untilfurther advancements in control technologies are achieved.
7.2.4 Regional legislation
In addition to national legislation, individual states may elect to set their own standards and targets,provided it is either as strict or stricter than the national legislation. Like all major sources, coal-fired
42 IEA CLEAN COAL CENTRE
Comparison with the EU and the USA

units are subject to restrictions arising from the local ambient air quality standards, as well as theNAAQS.
7.3 Implications
It is evident that China has learned extensively from interaction with OECD environmental regulators,and this has assisted the State Government in establishing their own approach. However, unlike in theEU and the USA where coal use is either stagnant or in decline, China has to continue to develop thisregulatory system since coal use is expected to show significant increases in the period to 2020 andprobably beyond, and as such there will be continuing environmental issues arising. This wasindicated in the MEP’s forward projections, which show that implementation of the new standardswill result in near term absolute reductions in the key non-GHG emissions but that in about ten yearssome of the benefits will be eroded due to ongoing introduction of additional coal-fired capacity.
It is interesting to note that in many aspects, such as SO2 and NOx, the Chinese emissions standardsfrom coal-fired plant are tighter than those in, say, the EU and the USA, both in terms of emissionlevels and in the timescale for implementation. In contrast, in the EU and the USA, the rigour forensuring the standards are met and the penalties for non-compliance are tougher, at least compared tothose applied in China during the period of the 11th FYP. However, as has been considered inChapter 5, China has taken advice from the USA and others to establish a much stronger monitoring,verification and control approach to be applied during the period of the 12th FYP.
43Non-greenhouse gas emissions from coal-fired power plants in China
Comparison with the EU and the USA
8 Conclusions
44 IEA CLEAN COAL CENTRE
It is important to recognise that the tightening of emissions standards in the power sector, although itwill have major ramifications for industry over the next decade, is only one part of a bigger andlonger-term effort by the State Government to establish energy-efficient and environmentally-friendlyindustries across all the traditional energy-intensive sectors, while creating self-reliant and innovationdriven growth, and encouraging more balanced regional development. This requires a co-ordinatedapproach between the various commissions, administrations and ministries together with adjustmentsto the command and control policies for emissions limitation.
8.1 Rationale and guiding principles
While China has established the world’s second largest economy, this has been achieved in partthrough the rapidly increasing use of coal to underpin growth in GDP and, as a consequence it hasbecome both the biggest energy-using nation in the world and a major emitter both of greenhousegases and fine particulates, SO2 and NOx (IEA, 2010). The non-GHG emissions have resulted insevere air pollution problems, with acid rain across large regions of Southern China, while, in citiesthroughout the country, the air pollution levels are high, with 90% of those assessed failing to meetWHO health-based standards. Such problems have a major impact on the overall economy, withvarious estimates suggesting that the annual cost of pollution to the economy is in excess of 3% ofGDP (Bloomberg News, 2010). There is also an increasing concern being voiced in the nationalmedia, which notes that quality of life is an important factor to be considered and that growth at allcosts should no longer be considered an acceptable way forward (China Daily, 2011e). As aconsequence, the government has put in motion a series of initiatives that are based on various guidingprinciples to ensure full implementation of the energy and environmental objectives, which wereinitiated during the 11th FYP and will be taken forward during the 12th FYP and beyond.
Thus, as discussed in Chapter 2, there are strategic targets to achieve much better air quality standardsthroughout China, but particularly in the cities and key developed regions. This requires both thereduction of emissions of concern from large energy-intensive processes together with a betterunderstanding and better assessment of air quality via the national indices. In order to address theseissues, the MEP, in conjunction with the NDRC and others, has reviewed the validity of the currentapproach to emissions control.
In China, the environmental regulatory structure is pollutant-specific, with enforcement ofenvironmental-performance standards (for example command-and-control) for the discharge ofpollutants rather than their creation. Thus, water, air, solid and hazardous wastes and noise pollutionare each addressed by separate laws, each with their own standards including concentration-baseddischarge limits for air and water pollution (Chinadialogue, 2011b). This approach can be relativelyeffective at reducing pollutant loads if the requirement is either constant or growing at a slow pace.However, for China, where the coal-fired power capacity has tripled since 2000, as part of theeconomic expansion, the levels of non-GHG emissions have either risen strongly (for example NOx)or at best been contained through a massive introduction of FGD for SO2 control with add-on benefitsin terms of particulates control. Consequently, in order to combat these problems, while China istightening the individual emissions limits as part of the continuing command and control policy, it isalso continuing to adjust its regulatory structure by introducing national caps on the total discharge ofcertain pollutants, for example SO2 as seen in the 11th and SO2 and NOx in the 12th FYP(Chinadialogue, 2011b) as well as pursuing a rigorous energy efficiency improvement programme.
For the future, China has indicated that it may well introduce the basis for either large regional ornational markets to be created by a cap-and-trade system on both conventional non-GHG pollutants
and CO2 emissions (Minchener, 2010). So far, there have been some pilot projects to testmarket-based variations on the traditional command-and-control models, including experimental SO2trading programmes that have involved power plants with emissions-monitoring devices sophisticatedenough to support the creation of such a scheme.
There is also considerable effort being applied to methods to:� ensure central and local co-ordination of all the initiatives, including the introduction of
incentives for local governments and firms to embrace clean energy; � implement realistic levies, taxation and pricing to ensure appropriate use of emissions control
devices; � introduce effective supervision mechanisms;� demonstrate that targets are a State Government leadership priority; � work co-operatively between ministries to alleviate conflicting priorities of economic growth and
environmental protection; � adapt policies over time to integrate lessons from policy experiments.
As an example of the latter point, China has learned a lot from its programme to have FGD fitted andproperly used on coal-fired power plants during the period of the 11th FYP. The interaction betweenexternal advice, policy, regulations, institutions, and technology provided many encouraging ideas forChina’s future environmental policy and management (Yale Environment 360, 2010). These have beendeveloped further in order that the MEP will be ready to undertake effective monitoring, verificationand control during the 12th FYP.
It is now a government priority to combine environmental protection with economic development, forwhich the latter will be achieved with regional targets to enhance economic development in the centraland less developed western regions. By 2015, this is expected to lead to a joint prevention and controlsystem for atmospheric pollution, as a means to better air quality in line with the strategic targets.
Linked in to emissions control will be the prevention of emissions in the first place, through muchstronger environmental impact assessments being established for regional industrial developmentplanning, to avoid overcapacity in energy-intensive sectors, especially in the key developed regions,including the compulsory closure of outdated production capacity.
Alongside these actions, the government is beginning to address the need to establish moremeaningful ambient air quality indices, including the need to include further pollutants of concern. Akey issue is the release of PM2.5, and the improvement of the indices is almost certainly going to leadto a further tightening of the emission standards for the coal-fired power and other energy-intensiveindustries.
Alongside these policies, there will be further emphasis on increasing the use of low-sulphur andlow-ash coal, with an emphasis on greater proportion of the coal being washed, while pushing forwardthe development of multi-pollutant control technologies such as combined control of SO2, NOx,particulates and mercury for coal-fired power plants.
8.2 Implementation within the Twelfth Five-Year Plan
The government approach to reducing coal-related emissions in the coal-fired power sector includescommand-and-control policies such as emission standards and limits (see above), compulsoryintroduction of certain technologies (for example SC and USC), and compulsory closures of smallinefficient units. This is complemented by the use of economic incentives such as pollution levies,lower prices for electricity from small, less-efficient power plants, and higher prices for electricityfrom power plants with satisfactory FGD operation. Implementation of the plans within the 12th FYPto reduce coal-based non-GHG emissions, implementation will be very challenging. While there are
45Non-greenhouse gas emissions from coal-fired power plants in China
Conclusions
extensive energy efficiency initiatives under way, together with the introduction of low- andzero-carbon alternative technologies that have an added benefit in limiting the release of the majorpollutants, fine particulates, SO2, and NOx coal will continue to dominate the energy mix and willcontinue to drive economic growth for the foreseeable future. The China Electricity Council has madeseveral projections of future power capacity and use (China-wire, 2010). In terms of total powergeneration capacity, this is expected to rise towards 1885 GWe by 2020, with about 64% based onfossil fuel technology, predominantly coal.
Consequently, the action by the Chinese Government, to address such problems as a keyenvironmental priority, can be regarded as very necessary. The intention to accelerate the developmentof systems, institutions and a technical knowledge base for sustained air quality improvement, whichis being supported with significant investments to meet the enormous national needs for cleanerenergy, air and water, suggests an ongoing developmental approach.
The inter-relationship between the emissions from coal-fired power plants, and other energy-intensiveindustries, and the need to improve air quality levels is critical in order to establish a more acceptableenvironment. In the near term, the new emission standards for the coal power sector represent a stepchange to what has previously been deemed acceptable, particularly in the nine key developed regionswhere measures are also in place to limit any new coal-fired power plants. This provides an impetusfor increasing economic activity in the as yet relatively undeveloped central and western provinces,since these regions will see new industries established together with large advanced coal-fired powerplants, for which, at present, the emissions standards will not be so strict.
For all regions, the new pollutant that will be regulated on coal-fired power plants is mercury and itscompounds, for which the limit has been set at a level that represents a core control. This means thatproviding the power plant operator meets the new particulate, SO2 and NOx standards then themercury standard should be met without the need to introduce an additional capture device, althoughthe emissions level will have to be measured on a regular basis.
The declared timescales for the power plants to upgrade particulate and SO2 removal systems andintroduce SCR for NOx control, are really quite short, given the overall number of coal-based units.The power sector is arguing that the schedule is unrealistic while the environmental advisors to theMEP are stating that there is little time to lose if the poor air quality and associated environmentalproblems on land and water are to be reversed.
8.3 Final thoughts
China is battling with the need to balance medium- to longer-term strategic environmental objectiveswith finding solutions to short-term difficulties. Its approach is a pragmatic but ambitious one, withthe need to address various interrelated challenges within the coal sector. The MEP has undertakensome studies to ascertain the benefits to the national economy of improving air quality through tighteremissions standards and related measures within the various energy-intensive sectors. Although thedetailed results are not available, it is understood that the cost benefit ratio is significant (He, 2011).However, it is the power companies that will have to make these very significant investments toimprove the environmental performance of their various coal-fired power plants. These companies arealready registering operational losses due to distortions from a market-based coal price and a powerprice that is capped by the government (istockAnalyst, 2010). This investment programme willrepresent a major dislocation within the national economy, both in terms of investment requirementsand increased operating costs for the power sector.
Thus, for the medium to longer term, it is evident that the government must pursue its comprehensiveprogramme to improve ambient air quality within the nation as a whole. However, in the short term, itneeds to achieve an important breakthrough within the coal power sector and it remains to be seen
46 IEA CLEAN COAL CENTRE
Conclusions
whether it can achieve such ambitious strategic environmental objectives, while maintaining overalleconomic competitiveness, through the reduction and control of non-GHG emissions from thecoal-fired power plants to levels lower than most other major coal using nations.
47Non-greenhouse gas emissions from coal-fired power plants in China
Conclusions
9 References
48 IEA CLEAN COAL CENTRE
21 Tradenet (2011a) Denitrification to hold up the new industry standard. Available from:www.21tradenet.com/news_2011-1-24/105203.htm (24 January 2011)21 Tradenet (2011b) Thermal power plant NOx emissions market, the new standard will sell offmore than 200 billion. Available from: http://www.21tradenet.com/news_2011-4-13/145665.htm(13 April 2011)Adams E (2006) Opting out of the LCPD - where to next? Available from: www.ipgconference.netPresented at IPG 2006; Conference on Implementing EC emission directives. Leipzig, Germany,pp 49-62 (15-16 November 2006)Altprofits (2011) Air pollution control market for coal fired power plants. Available from:http://www.altprofits.com/ref/ct/ctv/air___environment_management.html (2011)APCO (2010) China’s 12th Five-Year Plan. Available from:http://www.apcoworldwide.com/content/PDFs/Chinas_12th_Five-Year_Plan.pdf (10 December 2010)APIS (2006) The Large Combustion Plant Directive 2001/80/EC. Available from:www.apis.ac.uk/overview/regulations/overview_lcpd.htm Air Pollution Information System, 2 pp(19 June 2006)Bloomberg News (2010) China is set to lose 2% of GDP cleaning up decades of pollution. Availablefrom: http://www.bloomberg.com/news/2010-09-16/china-set-to-lose-2-of-gdp-fighting-pollution-as-doing-nothing-costs-more.html (17 September 2010)Business Wire (2010) China issues policy on NOx emissions. Available from:http://www.businesswire.com/news/home/20100211006462/en/China-Issues-Policy-NOx-Emissions(11 February 2010)CEC (2004) Action plan for improvement of particulate abatement systems of coal-fired powerplants in China. Available from: http://www.neaspec.org/download/Action-Plan-of-China.pdfChina Electricity Council (31 May 2004)CEC (2011) Annual development report of China’s power industry 2010. China Electricity Council,Beijing, China (2011) Chen P (2008) Air emission monitoring of thermal power plants. Presented at: Cleaner coalworkshop on solutions to Asia’s growing energy and environmental challenges, Halong City, Vietnam(19-21 August 2008)Chen W, Xu R (2010) Clean coal technology development in China. Energy Policy 38, 2123-2130(2010) Chinadialogue (2011a) Behind China’s green goals. Available from:http://www.chinadialogue.net/article/show/single/en/4181-Behind-China-s-green-goals (24 March 2011)Chinadialogue (2011b) Shaping China’s green laws. Available from:http://www.chinadialogue.net/article/show/single/en/4425-Shaping-China-s-green-laws (22 July 2011)China Business News (2009) Desulphurization equipment installed in 66 pct of China’s thermalpower capacity by 2008’s end. Available from: http://www.highbeam.com/China China BusinessNews (23 February 2009)China Daily (2010) Carbon tax likely, expert forecasts. Available from:http://www.chinadaily.com.cn/china/2010-05/10/content_9826546.htm (10 May 2010)China Daily (2011a) A hard rain is falling as acid erodes beauty. Available from:http://www.chinadaily.com.cn/cndy/2011-01/12/content_11831277.htm (12 January 2011)China Daily (2011b) Key targets of China’s 12th five-year plan. Available from:http://www.chinadaily.com.cn/china/2011npc/2011-03/05/content_12120283.htm (5 March 2011)China Daily (2011c) Road map for social, economic development unfolded. Available from:http://www.chinadaily.com.cn/china/2011npc/2011-03/06/content_12122579.htm (6 March 2011)China Daily (2011d) Challenges in environmental protection still serious. Available from:http://www.chinadaily.com.cn/china/2011-06/04/content_12640598.htm (4 June 2011)China Daily (2011e) Public backs ministry’s air quality plans. Available from:http://www.chinadaily.com.cn/china/2011-12/08/content_14229807.htm (8 December 2011)
China FAQs (2011) Cleaning China’s air: first regional air quality regulations. Available from:http://www.chinafaqs.org/blog-posts/cleaning-chinas-air-first-regional-air-quality-regulations(2 June 2010)China Greentech Initiative (2011) The China Greentech Report. Available from:www.china-greentech.com/cce (2011)China.org (2011) Senior official calls for cap on coal consumption. Available from:http://www.china.org.cn/china/NPC_CPPCC_2011/2011-03/13/content_22122403.htm (13 March 2011)China-wire (2010) China electricity consumption to almost double by 2020: China ElectricityCouncil. Available from: http://china-wire.org/?p=8979 (21 December 2010)China-US Focus (2011) China’s Twelfth Five-Year Plan: energy and environment positionedstrategically. http://www.chinausfocus.com/energy-environment/china%E2%80%99s-twelfth-five-year-planenergy-and-environment-positioned-strategically/ (29 March 2011)Clean Biz Asia (2011) Beijing to tighten emission controls for coal plants, industry and autosAvailable from: http://www.cleanbiz.asia/story/beijing-tighten-emission-controls-coal-plants-industry-and-autos (12 March 2011)Daves G (2002) Securing permits for that new coal-fired project. Power; 146 (8); 37-46 (Nov 2002)DEFRA (2011) Industrial Emissions Directive. Available from:http://www.defra.gov.uk/environment/quality/industrial/eu-international/industrial-emissions-directive/ (2006)Environmental Expert (2009) China will have a major impact on the cost of environmental andenergy investments. Available from: http://www.environmental-expert.com/news/china-will-have-a-major-impact-on-the-cost-of-environmental-and-energy-investments-58374 McIlvaine Company,USA (17 July 2009) Environmental Expert (2011) $3 billion market for air pollution monitoring, sampling and processcontrol. Available from: http://www.environmental-expert.com/news/3-billion-market-for-air-pollution-monitoring-sampling-and-process-control-223284/view-comments The McIlvaineCompany, USA (4 February 2011)Environmental Finance (2005) Ozone season blues. Environmental Finance; 7 (2); 14-15(November 2005)Environmental Protection (2011) McIlvaine forecasts up to $3B market for air pollutionmonitoring, control. Available from: http://eponline.com/articles/2011/02/07/mcilvaine-forecasts-3b-market-for-air-pollution-monitoring-control.aspx (7 February 2011)FECC (2010) Air pollution control and monitoring in China. Available from:http://www.4ppt.info/ppt/1/fecc-air-pollution-control-and-monitoring-in-china.html Pöyry (Beijing)Consulting Co., Ltd. (16 April 2010)Feng A (2010) Application status and future development tendency of bag filter technology inChinese coal-fired power plant flue gas ash removal. Available from:http://www.aesieap0910.org/upload/File/PDF/4-Technical%20Sessions/TS45/TS4504/TS4504_FP.pdfGuodian Science and Technology Research Institute (24 October 2010)GCCSI (2011) China’s 12th Five Year Plan. Available from:http://www.globalccsinstitute.com/community/blogs/authors/rposner/2011/03/24/china%E2%80%99s-12th-five-year-plan Global CCS Institute, Australia (24 March 2011)Global Impact Consulting (2011) Environmental global market insights and opportunities: China.Available from: http://globalimpactconsulting.com/4/2/2/hot_sectors/environmental/china.html(2011)Global Times (2010) China looks to promote strategic emerging industries. Available from:http://china.globaltimes.cn/chinanews/2010-09/571488.html (9 September 2010)Hao J (2008) Air pollution control strategy in China. Available from:http://www.landecon.cam.ac.uk/research/eeprg/cleed/pdf/HAO%20Jiming_Air.pdf TsinghuaUniversity, China (September 2008)He K (2011) Tsinghua University, China, personal communication (October 2011)IEA (2010) China overtakes the United States to become world’s largest energy consumer. Availablefrom: http://www.iea.org/index_info.asp?id=1479 International Energy Agency, Paris, France(20 July 2010)
49Non-greenhouse gas emissions from coal-fired power plants in China
References
istockAnalyst (2010) Analysis: China electricity price reform shambles ahead despite pressure ofCPI. Available from:http://www.istockanalyst.com/article/viewnewspaged/articleid/4763145/pageid/1 (22 December 2010)istockAnalyst (2011a) China to kick off denitration work in coal-fired plants in 2011, huge marketpre. Available from: http://www.istockanalyst.com/business/news/4945521/china-to-kick-off-denitration-work-in-coal-fired-plants-in-2011-huge-market-pre (5 March 2011)istockAnalyst (2011b) Top stories of the day: China power and coal? Available from:http://www.istockanalyst.com/business/news/5060168/top-stories-of-the-day-china-power-and-coal-apr-14 (14 April 2011)KPMG (2011) China’s 12th five year plan: energy. Available from:http://www.kpmg.com/cn/en/issuesandinsights/articlespublications/pages/china-12th-five-year-plan-energy-201104.aspx (5 March 2011)Kramarchuk R, Brunetti B (2008) New emission rules to weigh on EU ETS. EnvironmentalFinance; p 22 (February 2008)Krause T, Rosenquist W (2001) Environmental control technologies for our next generation of coalplants. In: Proceedings of the US EPA/DOE/EPRI combined power plant air pollutant controlsymposium: the Mega symposium, Chicago, Illinois, USA, 20-23 August 2001. Pittsburgh, PA, USA,Air and Waste Management Association, 15 pp (August 2001)Kuang M, Yang G, Hu W (2008) Analysis and prospect of technology for removing mercury fromflue gas. Journal Environmental Science & Technology, 31(5): 65-69 (2008)Lewandowski D, Deluliis N, Lindsay K (2004) Regulations spur demand for eastern coal. Power;148 (8); 34-36 (October 2004)Li C, Zhang Q, Krotkov N, Streets D, He K, Tsay S, Gleason J (2010) Recent large reduction insulfur dioxide emissions from Chinese power plants observed by the ozone monitoring instrument.Geophysical Research Letters Vol 37, L08807 (29 April 2010) Li L, Tan Z, Wang J, Xu J, Cai C, Hou Y (2011) Energy conservation and emission reductionpolicies for the electric power industry in China. Energy Policy 39, 3669-3679 (2011)Li M-X (2002) Evaluations of current air programs and suggestions. Paper presented at: 5th annualEUEC conference, Tucson, AZ, USA, 22-25 January 2002, 8 pp (January 2002)Lu Z, Streets D (2011) Sulfur dioxide and primary carbonaceous aerosol emissions in China andIndia, 1996-2010. Available from: http://www.atmos-chem-phys-discuss.net/11/20267/2011/acpd-11-20267-2011-print.pdf Atmospheric Chemistry and Physics Discussions (18 July 2011)Lu Z, Streets D, Zhang Q, Wang S, Carmichael G, Cheng Y, Wei C (2009) The trend of sulphurdioxide emissions in China after 2000. Available from:http://www.epa.gov/ttnchie1/conference/ei19/session5/lu.pdf (2009)Lu Z, Streets D, Zhang Q, Wang S, Carmichael G, Cheng Y, Wei C, Chin M, Diehl T, Tan Q(2010) Sulphur dioxide emissions in China and sulphur trends in East Asia since 2000. Availablefrom: http://www.atmos-chem-phys.org/10/6311/2010/acp-10-6311-2010.html Atmos. Chem. Phys.,10, 6311-6331, doi:10.5194/acp-10-6311-2010 (2010)Luan S (2011) Development of clean coal power generation technology in China. Presented at the 7th
International Symposium on Coal Combustion, Harbin, China (18-20 July 2011)Ma W-W (2011) Beijing Research Institute of Coal Chemistry, China, personal communication(October 2011)Mao J (2009) Tsinghua University, China, personal communication (October 2009)Mao J (2011) Ultra-supercritical technology- the best practical and economic way to reduce CO2emissions from coal fired power plants. Presented at the 7th International Symposium on CoalCombustion, Harbin, China (18-20 July 2011)Market Research (2010) Flue gas desulfurization systems market analysis to 2020. Available from:http://www.marketresearch.com/GlobalData-v3648/Flue-Gas-Desulfurization-FGD-Systems-6505711/ (30 November 2010)MEP (2008) The 2007 report on the state of the environment in China. Ministry of EnvironmentalProtection of the People’s Republic of China, Beijing, China (2008)MEP (2009a) Ministry of Environmental Protection of the People’s Republic of China. Availablefrom: http://english.mep.gov.cn/ (2009)
50 IEA CLEAN COAL CENTRE
References
MEP (2009b) New emission standards consultation notes. Ministry of Environmental Protection ofthe People’s Republic of China, Beijing, China (2009)MEP (2010) Promoting the joint prevention and control of air pollution and improving the quality ofthe public’s living environment. Available from:http://english.mep.gov.cn/Policies_Regulations/interpretation/201010/t20101025_196607.htmMinistry of Environmental Protection of the People’s Republic of China (21 June 2010)MEP (2011a) Environmental Air Quality Index daily technical regulations, second draft. Availablefrom:http://www.mep.gov.cn/pv_obj_cache/pv_obj_id_B8714221A3DAD7407C95FA4E939C498C73C31000/filename/W020110301385498188788.pdf Ministry of Environmental Protection of the People’sRepublic of China (February 2011)MEP (2011b) Setting coordinates for reducing pollution through emission standards andaccelerating the environmental protection pace of thermal power sector. Available from:http://english.mep.gov.cn/News_service/news_release/201109/t20110927_217787.htm Ministry ofEnvironmental Protection of the People’s Republic of China (21 September 2011)MEP (2011c) Emission standard of air pollutants for thermal power plants GB 13223-2011.Ministry of Environmental Protection of the People’s Republic of China, Beijing, China(September 2011)Mi J (2010) Upon power efficiency in China. Available from: http://www.iea.org/work/2010/india_bee/jianhua.pdf China Electricity Council (27 January 2010)Minchener A (2004) Coal in China. CCC/87, London, UK, IEA Clean Coal Centre. 59 pp (Jul 2004)Minchener A (2010) Developments in China’s coal-fired power sector. CCC/163, London, UK, IEAClean Coal Centre, 55 pp (Jan 2010)Minchener A (2011) CCS challenges and opportunities for China. CCC/190, London, UK, IEAClean Coal Centre, 95 pp (Dec 2011)Muztagh (2011) Map of China. Available from: http://www.muztagh.com/map-of-china/ (2011)NDRC (2006) Medium and long term energy conservation plan. Available from:http://www.gov.cn National Development and Reform Commission, Beijing, China (6 March 2006)NDRC (2007a) Proposal to State Council for accelerating decommission of inefficient small sizegenerating units. National Development and Reform Commission, Beijing, China. (2007)NDRC (2007b) Regulation on energy conservation power generation dispatching (try out). Jointlyissued by NDRC, SEPA, SERC and Office of National Leading Group on Energy. NationalDevelopment and Reform Commission, Beijing, China. (2007)NDRC (2011a) Main functions of the NDRC. Available from:http://en.ndrc.gov.cn/mfndrc/default.htm National Development and Reform Commission, Beijing,China (2011)NDRC (2011b) National Energy Administration. Available from: http://en.ndrc.gov.cn/mfod/NEA (2009) Materials provided by the National Energy Administration. Available from:www.china.org.cn/government/.../content_17868056.htm National Energy Administration, Beijing,China (1 June 2009)Northeastern University (2010) Datang International renewable energy development. Availablefrom: http://www.neui.com.cn/en/Item/Show.asp?m=113&d=8 Northeastern University Engineering& Research Institute Company Limited (2010)People’s Daily Online (2010a) China’s National Energy Commission is established. Available from:http://english.peopledaily.com.cn/90001/90778/90862/6880658.html (27 January 2010)People’s Daily Online (2010b) China to cut fossil fuel in total energy mix to 85 pct by 2020: ex-lawmaker. Available from: http://english.peopledaily.com.cn/90001/90778/90862/7139699.html(14 September 2010)People’s Daily Online (2011) The State Council. Available from:http://english.peopledaily.com.cn/data/organs/statecouncil.shtml (2011)Pollution Engineering (2010) $40 billion market for air pollution control products in 2011.Available from: http://www.pollutionengineering.com/Articles/Industry_News/BNP_GUID_9-5-2006_A_10000000000000959175 The McIlvaine Company, USA (11 December 2010)Pollution Solutions (2011a) Chinese power plants emit as much NOx as all the passenger cars in
51Non-greenhouse gas emissions from coal-fired power plants in China
References
the world. Available from: http://www.pollutionsolutions-online.com/articles/air-clean-up/16/mcilvaine_company/chinese_power_plants_emit_as_much_nox_as_all_the_passenger_cars_in_the_world_-_mcilvaine_company/980/ The McIlvane Company (23 March 2011)Pollution Solutions (2011b) $40 billion market for air pollution control products in 2011. Availablefrom: http://www.pollutionsolutions-online.com/news/air-clean- up/16/mcilvaine_company/40_billion_market_for_air_pollution_control_products_in_2011/13670/ Mcilvaine Company (23 March2011)RAP (2011) Air quality management in China. Available from:www.raponline.org/document/download/id/921 The Regulatory Assistance Project (June 2011)Reinforced Plastics (2009) China to add 358 000 MW of FGD by 2020. Available from:http://www.reinforcedplastics.com/view/3607/china-to-add-358-000-mw-of-fgd-by-2020/ (30 August2009)Reinforced Plastics (2010) FGD is a big but volatile FRP market. Available from:http://www.reinforcedplastics.com/view/6755/fgd-is-a-big-but-volatile-frp-market/ (1 March 2010)Reuters (2010) Coal ash cloud looms large over China. Available from: http://www.reuters.com/article/2010/10/03/idUS318418519320101003 (3 October 2010)Robinson A (2007) Security of supply issues. Available from:http://www.ofgem.gov.uk/MARKETS/WHLMKTS/CUSTANDINDUSTRY/WINTERTODATE/Documents1/19239_RWEnpower-Alan_Robinson.pdf (2007) Paper presented at: Ofgen Seminar. London, UK, 10 pp (28 March 2007)Schultz A (2008) New standards to boost NOx market. Environmental Finance; 9 (6); 9 (April 2008)Sloss L L (2003) Trends in emission standards. CCC/77, London, UK, IEA Clean Coal Centre, 64 pp(Nov 2003)Sloss L L (2009) Impacts of legislation on coal-fired power plants. CCC/145, London, UK, IEAClean Coal Centre, 51 pp (Feb 2009)Standards Administration of China (2010) Ambient Air Quality Standards, draft revision (GB 30962010). Available from: http://www.mep.gov.cn/gkml/hbb/bgth/201011/t20101130_198128.htmStandards Administration of China, China Ministry of Environmental Protection (November 2010)Swisher J N, McAlpine M C (2006) Environmental impact of electricity reregulation. Energy;31 (6/7); 1067-1083 (2006)Sxcoal (2010a) China to limit coal production to 3.6-3.8 Bt. Available from:http://en.sxcoal.com/414/40020/DataShow.html (2 November 2010)Sxcoal (2010b) China to reduce coal-fired electricity generation by 6 pct. Available from:www.en.sxcoal.com/613/40536/DataShow.html (16 November 2010)The Climate Group (2011) Delivering low carbon growth: executive summary. Available from:www.theclimategroup.org/.../delivering-low-carbon-growth-a-guide-to-chinas-12th-five-year-plan/(7 March 2011)Tsadari V (2006) Better regulation and the need for consistency of policies. Available from:www.ipgconference.net Presented at IPG 2006; Conference on Implementing EC emissiondirectives. Leipzig, Germany, 15-16 November 2006, 15-19 (November 2006)US EPA (2011) Reducing toxic pollution from power plants: EPA’s proposed mercury and air toxicsstandards. Available from: http://www.epa.gov/airquality/powerplanttoxics/pdfs/presentation.pdf18 pp (2011)Wang Y (2010) China’s FGD industry overview and 12th Five-Year Plan outlook. Available from:http://air.chinaep-tech.com China Environmental Industry Association (July 2010) Wang Y, Zeng S (2008) Environment protection regulations and practices on emission reduction ofcoal-fired power plants in China. Presented at Cleaner Coal Workshop on Solutions to Asia’sGrowing Energy and Environmental Challenges Halong City, Vietnam (19-21 August 2008)Weem A (2011) Reduction of mercury emissions from coal fired power plants. Available from:http://www.unece.org/fileadmin/DAM/env/documents/2011/eb/wg5/WGSR48/Informal%20docs/Info.doc.3_Reduction_of_mercury_emissions_from_coal_fired_power_plants.pdf United NationsEconomic Commission for Europe, Working Group of Strategies and Review, 48th Session, Geneva,Switzerland (11-15 April 2011) World Bank (2007) Cost of pollution in China: economic estimates of physical damages. Available
52 IEA CLEAN COAL CENTRE
References
from:http://siteresources.worldbank.org/INTEAPREGTOPENVIRONMENT/Resources/China_Cost_ofPollution.pdf (February 2007)Xu Y (2011) Improvements in the operation of SO2 scrubbers in China’s coal power plants. Environ.Sci. Technol. 45, 380-385 (2011)Yale Environment 360 (2010) China takes first Steps in the fight against acid rain. Available from: (28 October 2010)Yue G, Tsinghua University,China, personal communication (December 2011)Zhao Y, Wang S, Duan L, Lei Y, Cao P, Hao J (2008) Primary air pollutant emissions of coal-firedpower plants in China: current status and future prediction. Atmospheric Environment, Volume 42,Issue 36, pp 8442-8452 (2008)Zhao Z (2006) Current status of SO2 emissions control for coal-fired plants in China. Availablefrom: www.egcfe.ewg.apec.org/ Presented at an APEC meeting in Lampang, Thailand(22-25 February 2006)Zhong P (2010) China’s policies and actions on carbon capture and storage. Available from:http://www.ga.gov.au/image_cache/GA16219.pdf Presented at a workshop on CO2 geologicalstorage in Canberra, Australia (19 January 2010)Zhu F, Liu D and Wang S (2009) The review of NOx emission and control measures in thermalpower plants, Journal of Environmental Protection, (11A) 40-41 (200Zhu F, Wang S, Li H (2010) The current status and prospect of air pollution control for powersector in China. Available from:http://www.apiperu.com/argentina/trabajos/ECC_241_ZHU_Fa_hua.pdf (2010)
53Non-greenhouse gas emissions from coal-fired power plants in China
References