emmanuel saez berkeleysaez/course131/taxsavings_new.pdf · 131: public economics taxes on capital...
TRANSCRIPT
131: Public Economics
Taxes on Capital and Savings
Emmanuel Saez
Berkeley
1
MOTIVATION
1) Capital income is about 25-30% of national income (labor
income is 70-75%) but distribution of capital income is much
more unequal than labor income
Capital income inequality is due to differences in savings be-
havior but also inheritances received
⇒ Equity suggests it should be taxed more than labor
2) Capital Accumulation correlates strongly with growth [al-
though causality link is not obvious] and capital accumulation
might be sensitive to the net-of-tax return.
⇒ Efficiency cost of capital taxation might be high.
2
MOTIVATION
3) Capital more mobile internationally than labor
Key distinction is residence vs. source base capital taxation:
Residence: Capital income tax based on residence of owner
of capital.
Most individual income tax systems are residence based (with
credits for taxes paid abroad)
Incidence falls on the owner⇒ can only escape tax through tax
evasion (offshore tax heavens) or changing residence (mobility)
Tax evasion through tax heavens is a very serious concern
(Zucman’s book “Scourge of Tax Heavens” 2015)
3
Source: Capital income tax based on location of capital
Real estate property tax and corporate income tax are source
based (exception US corporate tax applies to worldwide profits
of US corporations but only upon rapatriation)
Incidence is then partly shifted to labor if capital is mobile
Mechanism: tax on capital, capital flees the country, hurts the
wage of domestic workers (as workers are less productive with
less capital) ⇒ Workers bear part of the burden
4) Capital taxation is extremely complex and provides many
tax avoidance opportunities particularly for multinational firms
(Gravelle, 94)
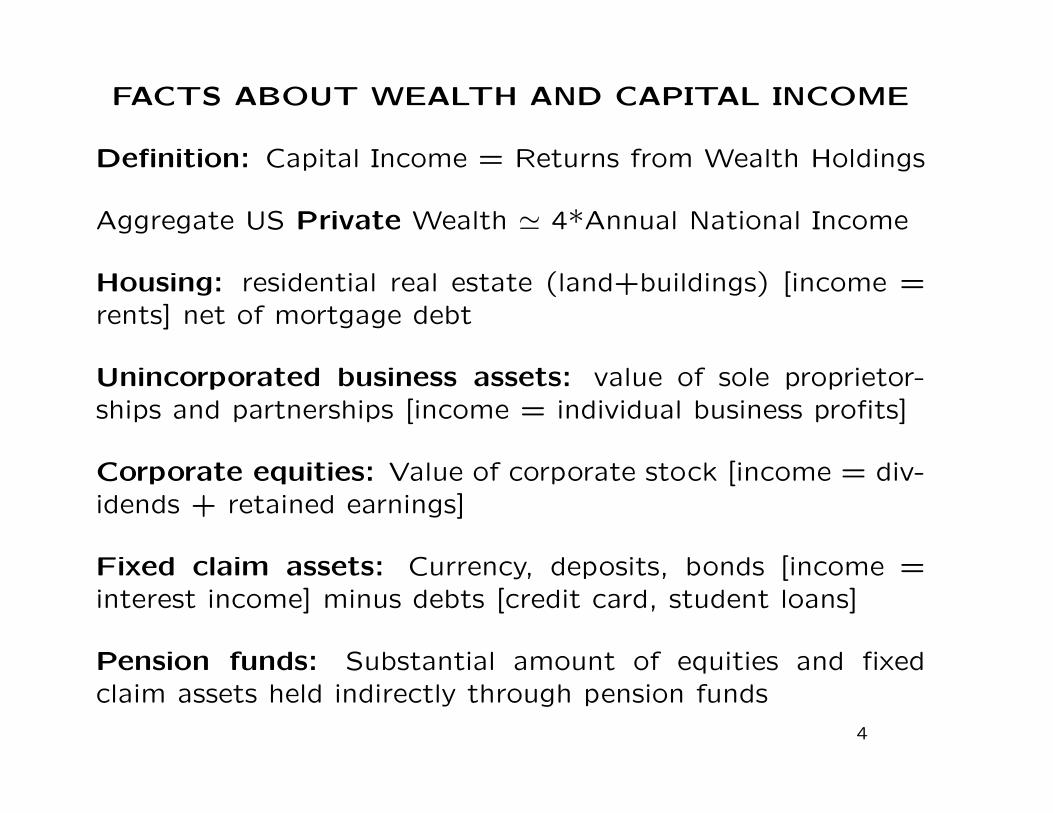
FACTS ABOUT WEALTH AND CAPITAL INCOME
Definition: Capital Income = Returns from Wealth Holdings
Aggregate US Private Wealth ' 4*Annual National Income
Housing: residential real estate (land+buildings) [income =rents] net of mortgage debt
Unincorporated business assets: value of sole proprietor-ships and partnerships [income = individual business profits]
Corporate equities: Value of corporate stock [income = div-idends + retained earnings]
Fixed claim assets: Currency, deposits, bonds [income =interest income] minus debts [credit card, student loans]
Pension funds: Substantial amount of equities and fixedclaim assets held indirectly through pension funds
4
0%
100%
200%
300%
400%
500% 19
13
1918
1923
1928
1933
1938
1943
1948
1953
1958
1963
1968
1973
1978
1983
1988
1993
1998
2003
2008
2013
% o
f nat
iona
l inc
ome
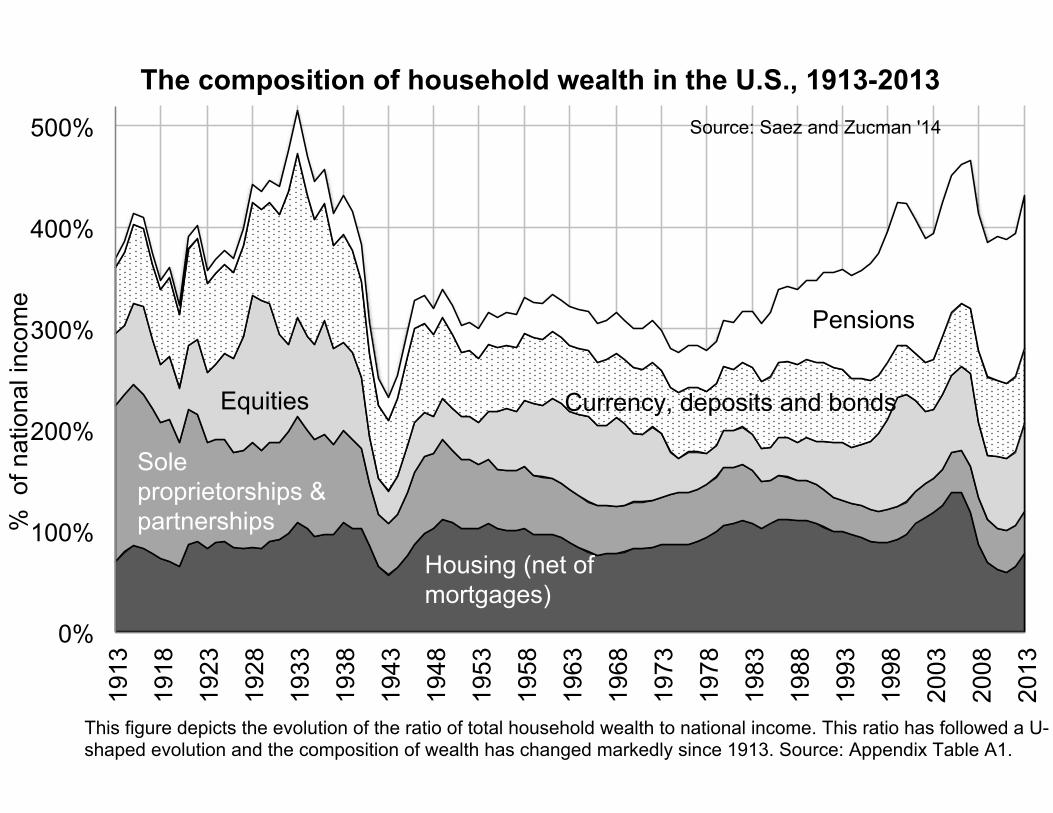
The composition of household wealth in the U.S., 1913-2013
Housing (net of mortgages)
Sole proprietorships & partnerships
Currency, deposits and bonds Equities
Pensions
This figure depicts the evolution of the ratio of total household wealth to national income. This ratio has followed a U-shaped evolution and the composition of wealth has changed markedly since 1913. Source: Appendix Table A1.
Source: Saez and Zucman '14
0%
5%
10%
15%
20%
25%
30%
35% 19
13
1918
1923
1928
1933
1938
1943
1948
1953
1958
1963
1968
1973
1978
1983
1988
1993
1998
2003
2008
2013
% o
f fac
tor-
pric
e na
tiona
l inc
ome
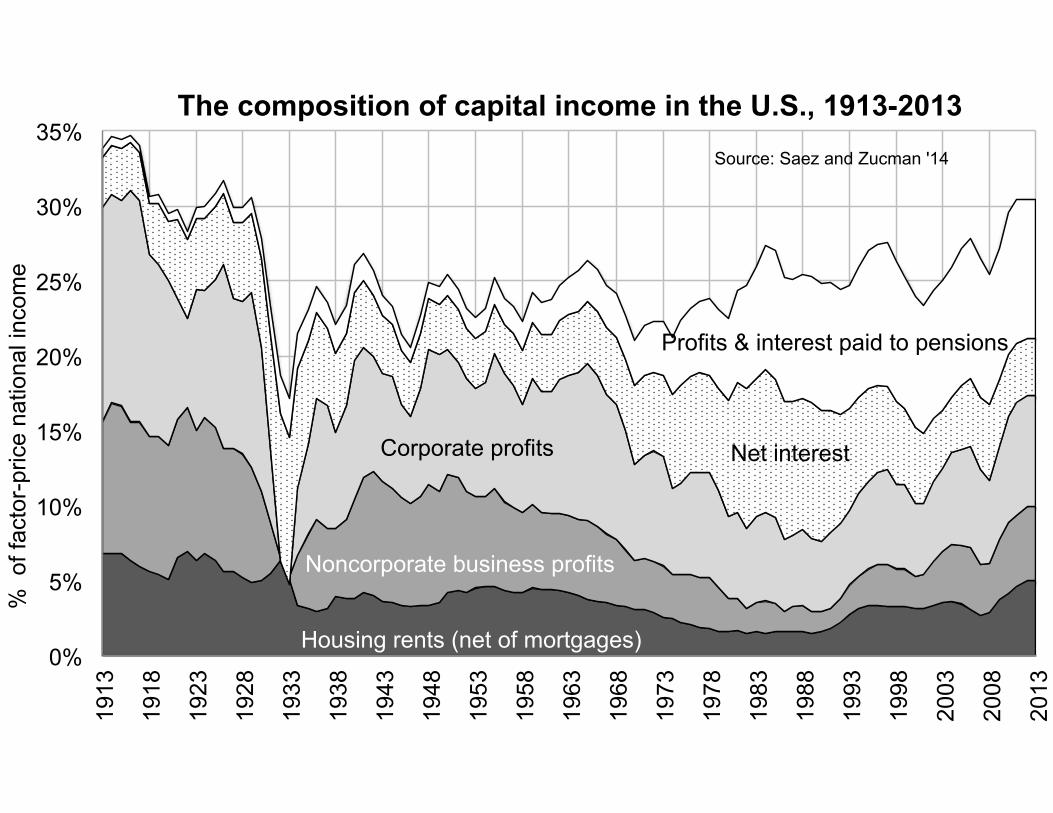
The composition of capital income in the U.S., 1913-2013
Housing rents (net of mortgages)
Noncorporate business profits
Net interest Corporate profits
Profits & interest paid to pensions
Source: Saez and Zucman '14
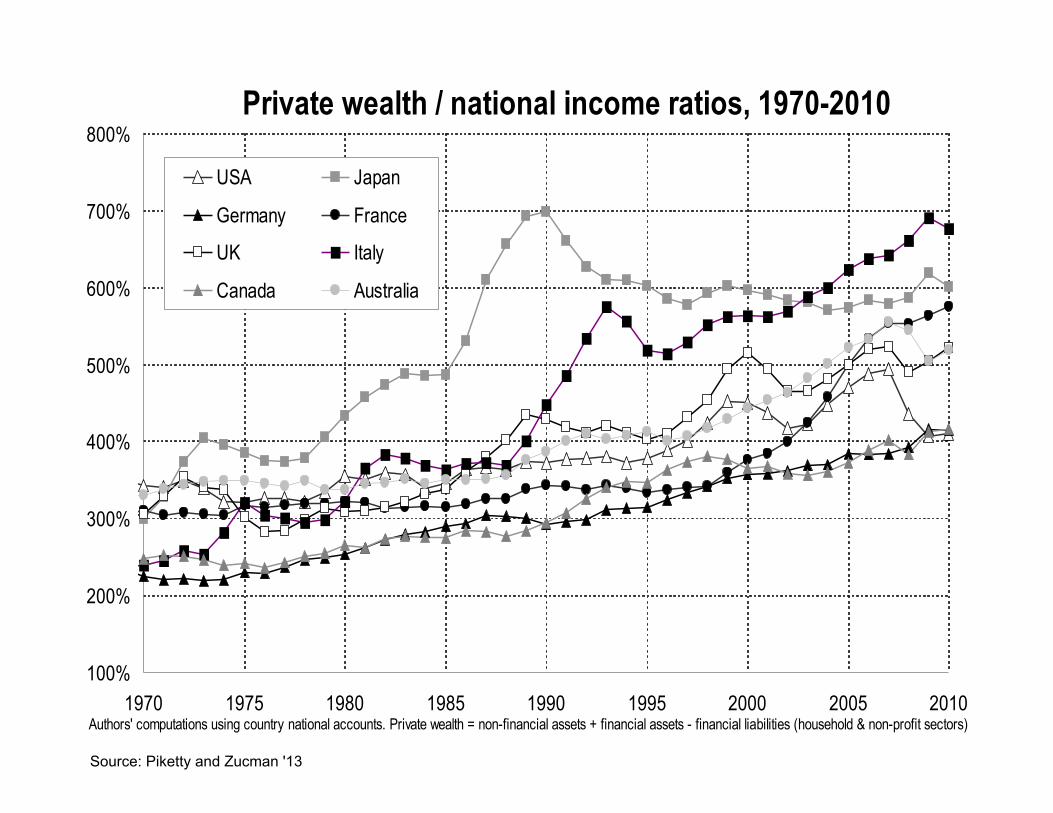
Private wealth / national income ratios, 1970-2010
100%
200%
300%
400%
500%
600%
700%
800%
1970 1975 1980 1985 1990 1995 2000 2005 2010Authors' computations using country national accounts. Private wealth = non-financial assets + financial assets - financial liabilities (household & non-profit sectors)
USA Japan
Germany France
UK Italy
Canada Australia
Source: Piketty and Zucman '13
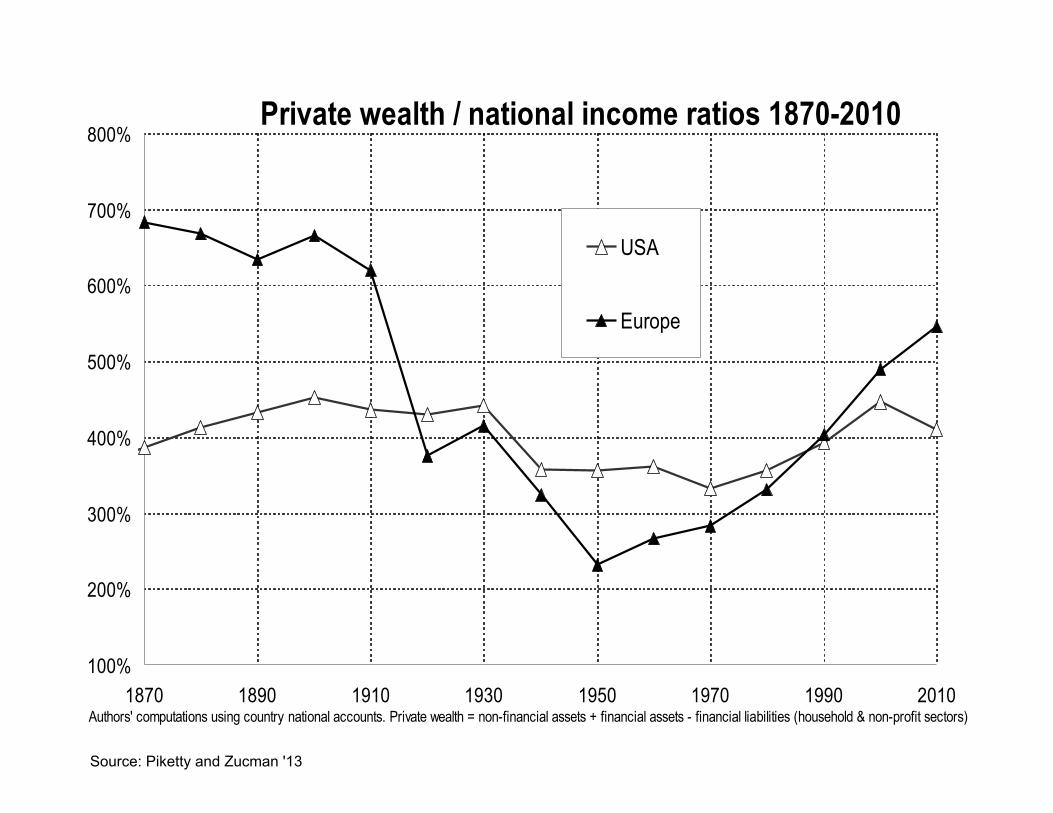
Private wealth / national income ratios 1870-2010
100%
200%
300%
400%
500%
600%
700%
800%
1870 1890 1910 1930 1950 1970 1990 2010Authors' computations using country national accounts. Private wealth = non-financial assets + financial assets - financial liabilities (household & non-profit sectors)
USA
Europe
Source: Piketty and Zucman '13

The changing nature of national wealth, France 1700-2010
0%
100%
200%
300%
400%
500%
600%
700%
800%
1700 1750 1780 1810 1850 1880 1910 1920 1950 1970 1990 2010National wealth = agricultural land + housing + other domestic capital goods + net foreign assets
(% n
atio
nal i
ncom
e)
Net foreign assets
Other domestic capital
Housing
Agricultural land
Source: Piketty, Handbook chapter, 2014Source: Piketty, Thomas [book]Capital in the 21st Century
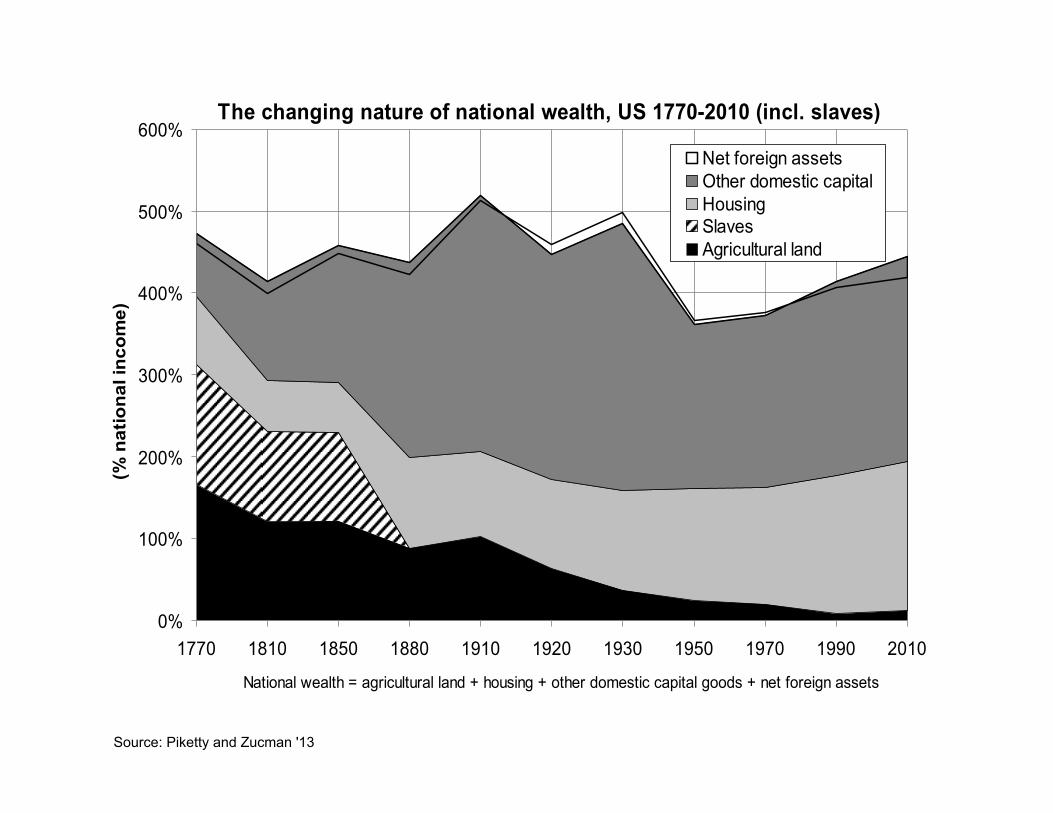
The changing nature of national wealth, US 1770-2010 (incl. slaves)
0%
100%
200%
300%
400%
500%
600%
1770 1810 1850 1880 1910 1920 1930 1950 1970 1990 2010
National wealth = agricultural land + housing + other domestic capital goods + net foreign assets
(% n
atio
nal i
ncom
e)
Net foreign assetsOther domestic capitalHousingSlavesAgricultural land
Source: Piketty and Zucman '13
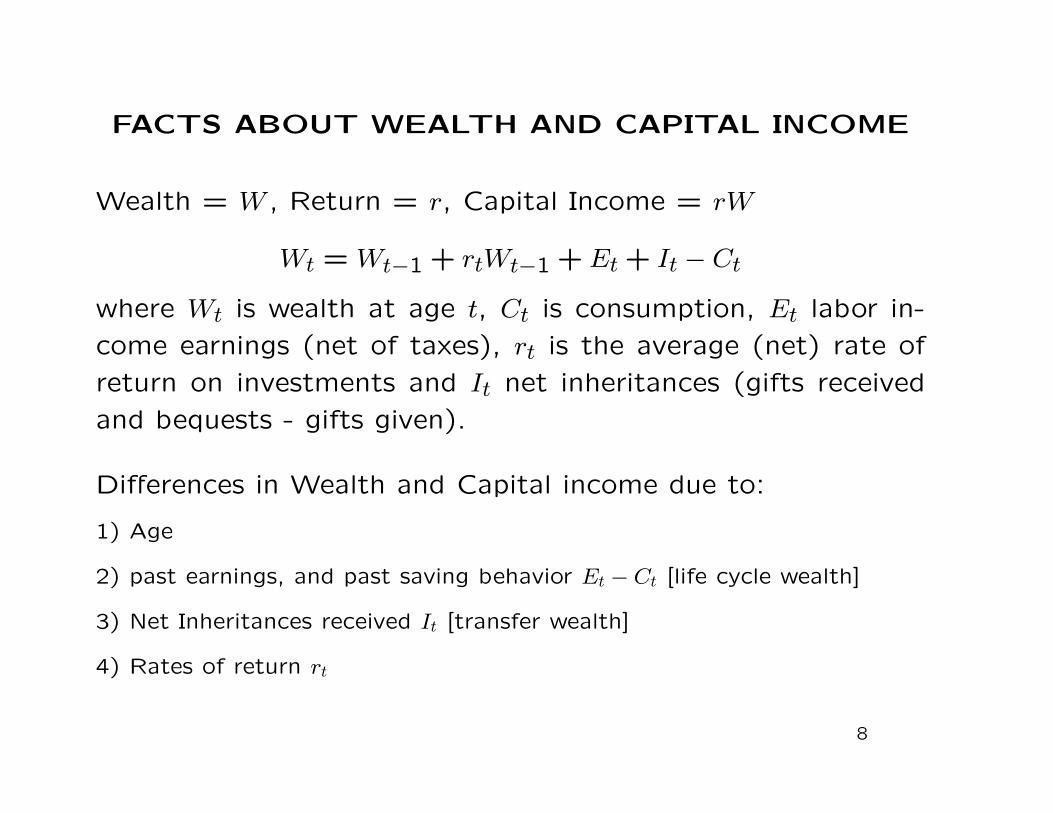
FACTS ABOUT WEALTH AND CAPITAL INCOME
Wealth = W , Return = r, Capital Income = rW
Wt = Wt−1 + rtWt−1 + Et + It − Ct
where Wt is wealth at age t, Ct is consumption, Et labor in-
come earnings (net of taxes), rt is the average (net) rate of
return on investments and It net inheritances (gifts received
and bequests - gifts given).
Differences in Wealth and Capital income due to:
1) Age
2) past earnings, and past saving behavior Et − Ct [life cycle wealth]
3) Net Inheritances received It [transfer wealth]
4) Rates of return rt
8

Wealth Inequality (Saez and Zucman ’14)
Wealth inequality is very large (always much higher than in-come inequality)
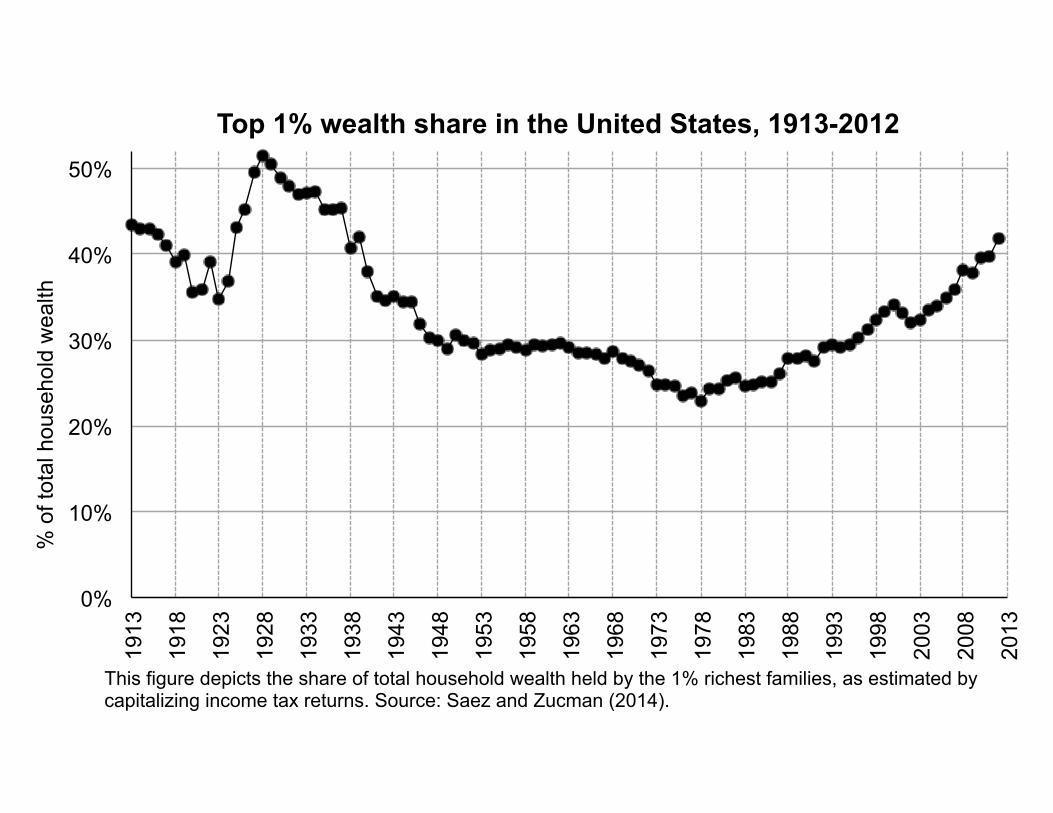
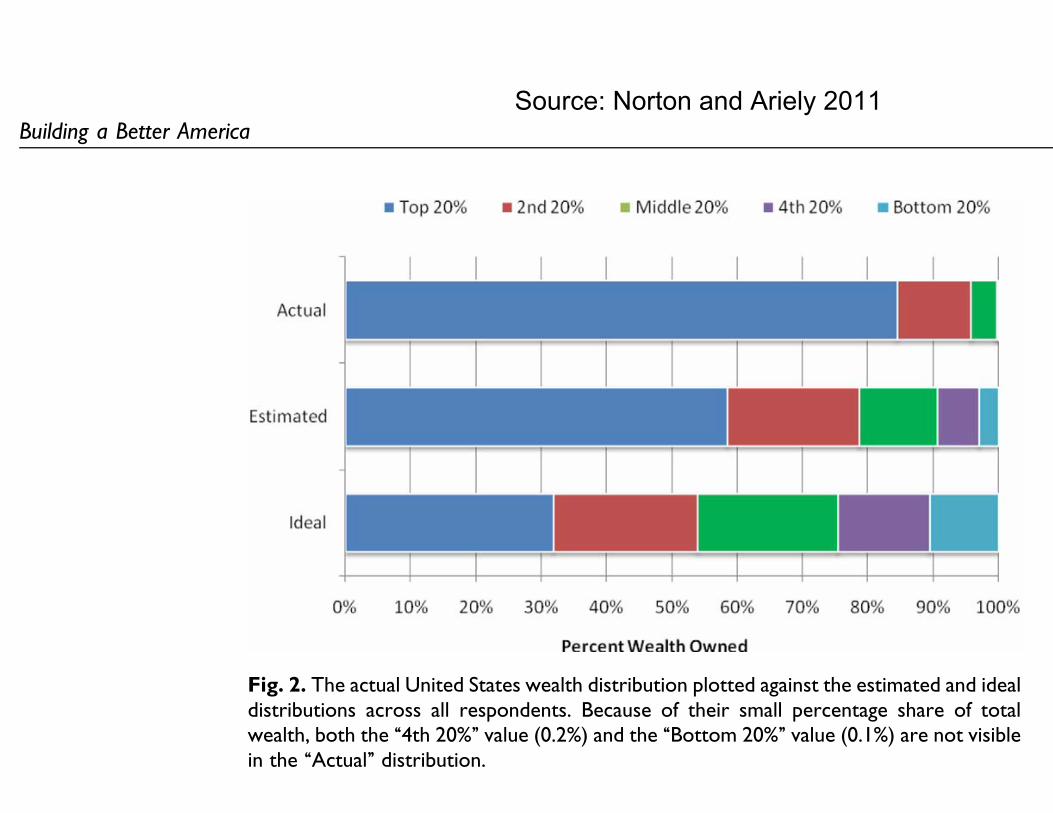
In the US 2012: Top 1% wealthiest families get 40% of totalwealth, Next 9% get about 35%, next 40% get 20%, bottom50% get about 0%
Wealth inequality decreases from 1929 to 1980: wealth de-mocratization due to rise in homeownership and pensions
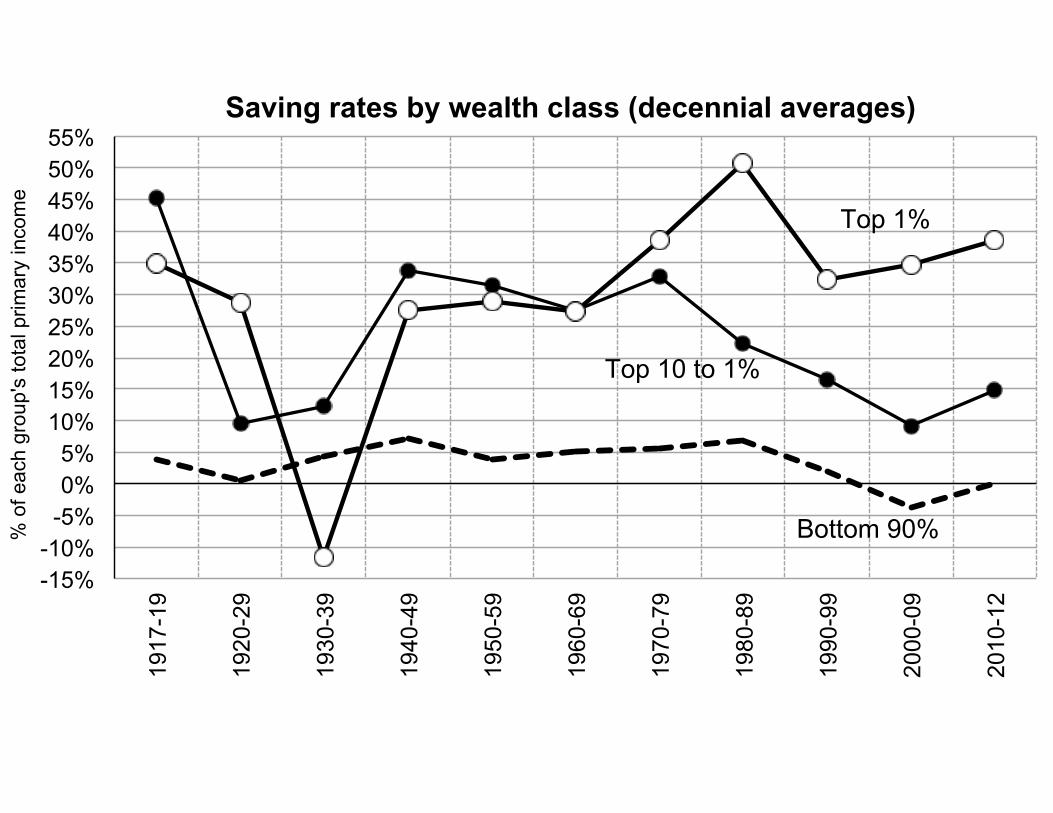
Wealth inequality increases sharply since 1980 fueled by in-creases in income inequality and savings inequality [bottom90% saves zero since 1990]
US public underestimates extent of wealth inequality and thinksthe ideal wealth distribution should be a lot more equal [Norton-Ariely ’11]
9

0%
5%
10%
15%
20%
25%
30%
35%
40% 19
17
1922
1927
1932
1937
1942
1947
1952
1957
1962
1967
1972
1977
1982
1987
1992
1997
2002
2007
2012
% o
f tot
al h
ouse
hold
wea
lth
Bottom 90% wealth share in the United States, 1917-2012
0%
5%
10%
15%
20%
25%
30%
35%
40% 19
17
1922
1927
1932
1937
1942
1947
1952
1957
1962
1967
1972
1977
1982
1987
1992
1997
2002
2007
2012
% o
f tot
al h
ouse
hold
wea
lth
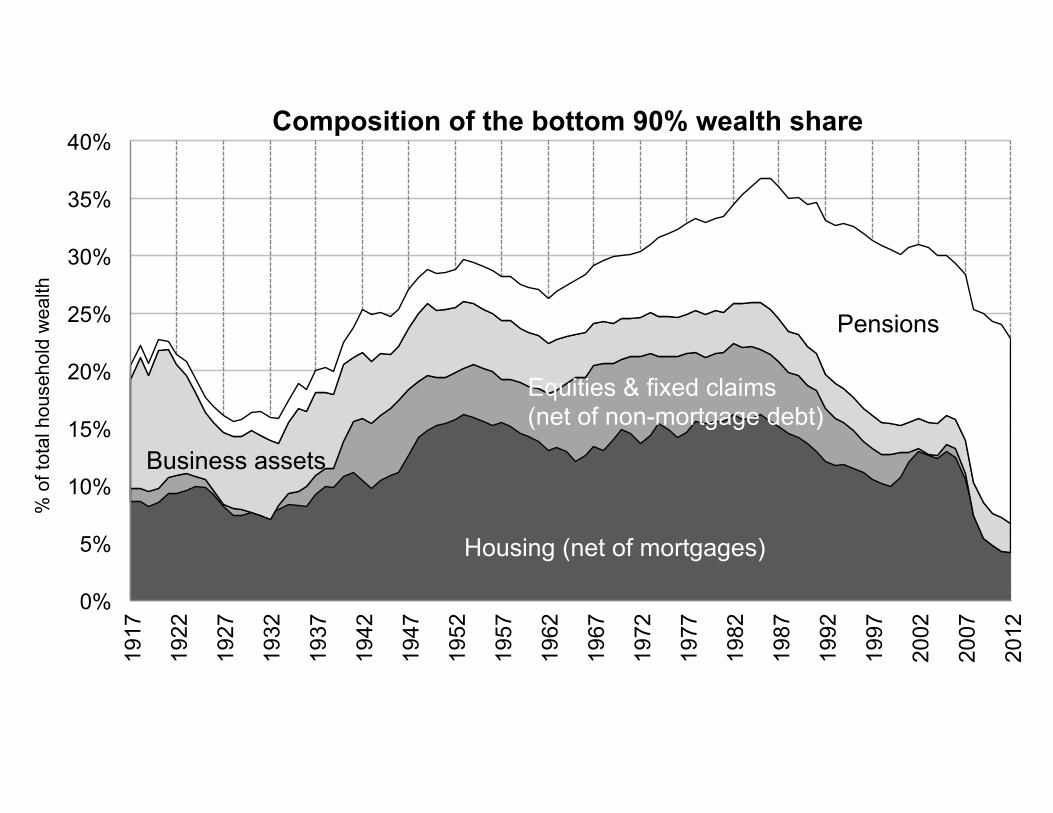
Composition of the bottom 90% wealth share
Pensions
Business assets
Housing (net of mortgages)
Equities & fixed claims (net of non-mortgage debt)
0%
10%
20%
30%
40%
50%
1913
1918
1923
1928
1933
1938
1943
1948
1953
1958
1963
1968
1973
1978
1983
1988
1993
1998
2003
2008
2013
% o
f tot
al h
ouse
hold
wea
lth
Top 1% wealth share in the United States, 1913-2012
This figure depicts the share of total household wealth held by the 1% richest families, as estimated by capitalizing income tax returns. Source: Saez and Zucman (2014).
0%
5%
10%
15%
20%
25% 19
13
1918
1923
1928
1933
1938
1943
1948
1953
1958
1963
1968
1973
1978
1983
1988
1993
1998
2003
2008
2013
% o
f tot
al h
ouse
hold
wea
lth
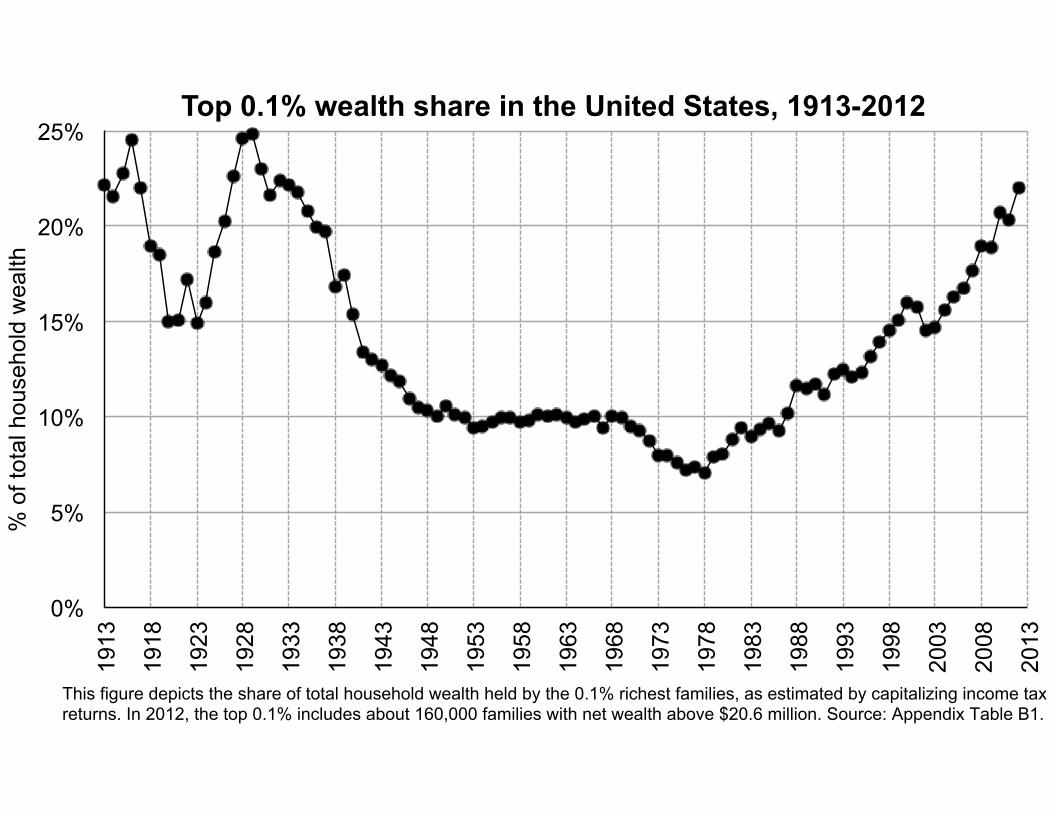
Top 0.1% wealth share in the United States, 1913-2012
This figure depicts the share of total household wealth held by the 0.1% richest families, as estimated by capitalizing income tax returns. In 2012, the top 0.1% includes about 160,000 families with net wealth above $20.6 million. Source: Appendix Table B1.
0
20,000
40,000
60,000
80,000
100,000
120,000
140,000
0
2,000,000
4,000,000
6,000,000
8,000,000
10,000,000
12,000,000
14,000,000 19
46
1950
1954
1958
1962
1966
1970
1974
1978
1982
1986
1990
1994
1998
2002
2006
2010
Bot
tom
90%
real
ave
rage
wea
lth
Top
1% re
al a
vera
ge w
elat
h
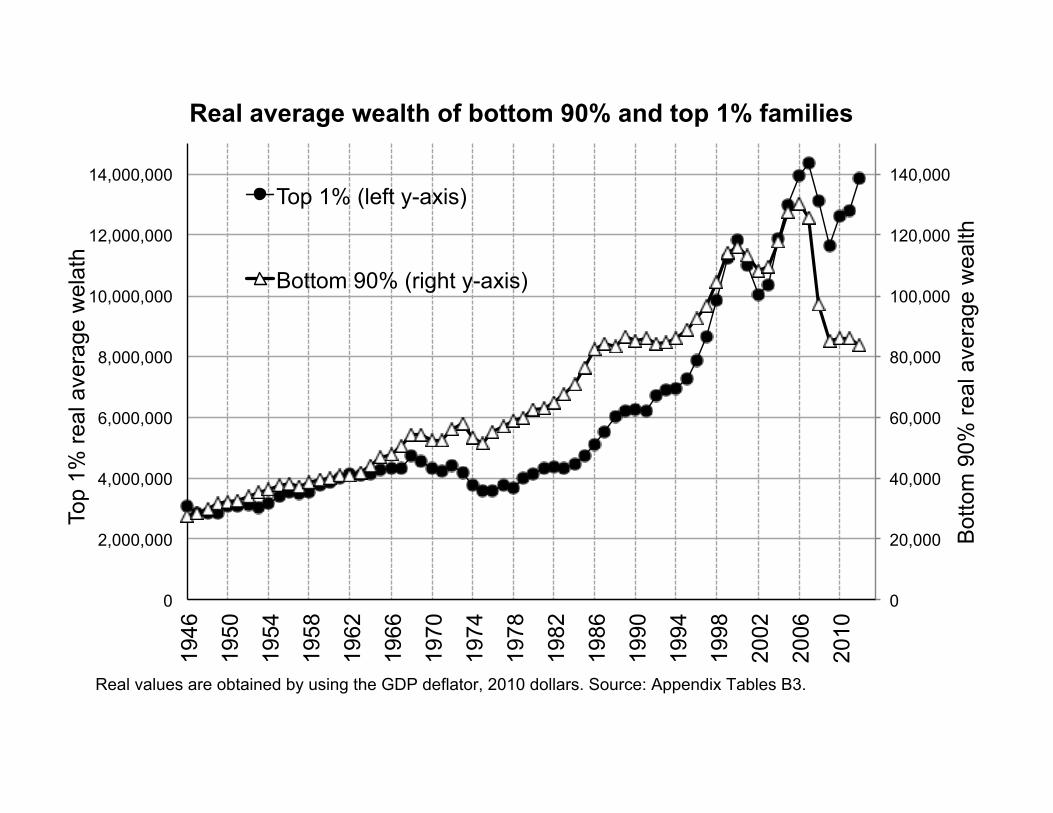
Real average wealth of bottom 90% and top 1% families
Top 1% (left y-axis)
Bottom 90% (right y-axis)
Real values are obtained by using the GDP deflator, 2010 dollars. Source: Appendix Tables B3.
-15% -10%
-5% 0% 5%
10% 15% 20% 25% 30% 35% 40% 45% 50% 55%
1917
-19
1920
-29
1930
-39
1940
-49
1950
-59
1960
-69
1970
-79
1980
-89
1990
-99
2000
-09
2010
-12
% o
f eac
h gr
oup'
s to
tal p
rimar
y in
com
e
Saving rates by wealth class (decennial averages)
Top 10 to 1%
Top 1%
Bottom 90%
agreed that such redistribution should take the form of moving
wealth from the top quintile to the bottom three quintiles. In
short, although Americans tend to be relatively more
favorable toward economic inequality than members of other
countries (Osberg & Smeeding, 2006), Americans’ consensus
about the ideal distribution of wealth within the United States
Fig. 3. The actual United States wealth distribution plotted against the estimated and idealdistributions of respondents of different income levels, political affiliations, and genders.Because of their small percentage share of total wealth, both the ‘‘4th 20%’’ value (0.2%)and the ‘‘Bottom 20%’’ value (0.1%) are not visible in the ‘‘Actual’’ distribution.
Fig. 2. The actual United States wealth distribution plotted against the estimated and idealdistributions across all respondents. Because of their small percentage share of totalwealth, both the ‘‘4th 20%’’ value (0.2%) and the ‘‘Bottom 20%’’ value (0.1%) are not visiblein the ‘‘Actual’’ distribution.
Building a Better America 11
at Harvard Libraries on February 3, 2011pps.sagepub.comDownloaded from
Source: Norton and Ariely 2011
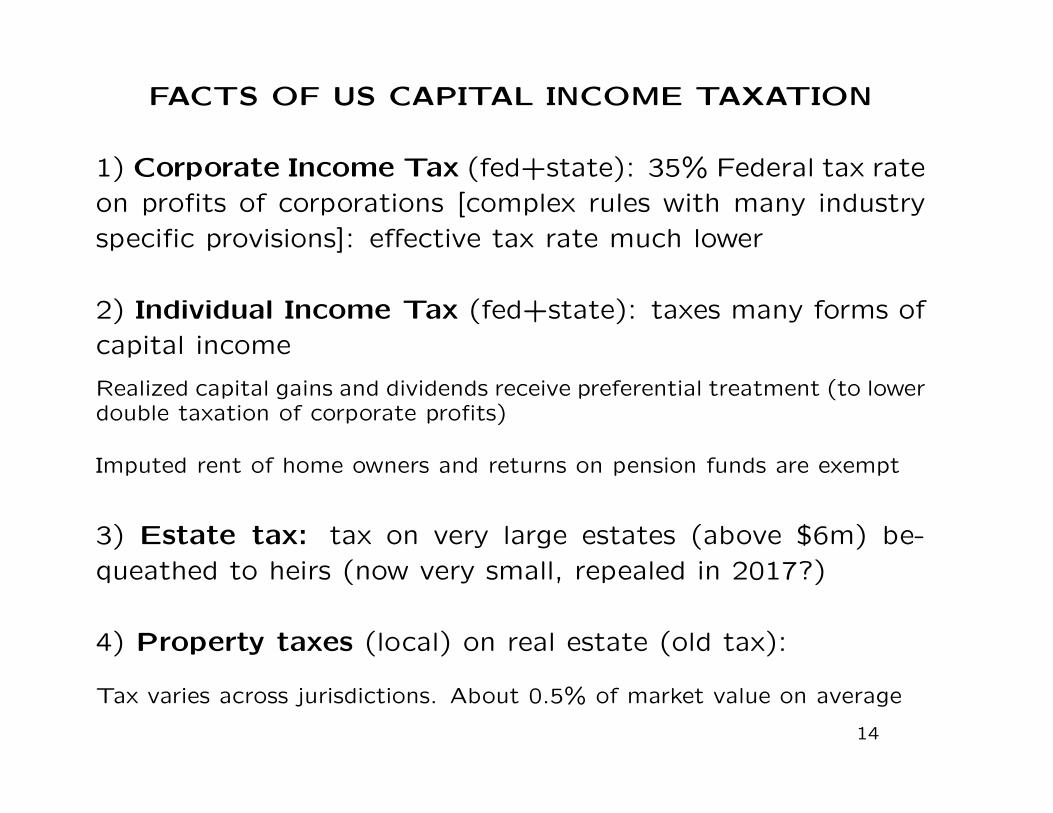
FACTS OF US CAPITAL INCOME TAXATION
1) Corporate Income Tax (fed+state): 35% Federal tax rate
on profits of corporations [complex rules with many industry
specific provisions]: effective tax rate much lower
2) Individual Income Tax (fed+state): taxes many forms of
capital income
Realized capital gains and dividends receive preferential treatment (to lowerdouble taxation of corporate profits)
Imputed rent of home owners and returns on pension funds are exempt
3) Estate tax: tax on very large estates (above $6m) be-
queathed to heirs (now very small, repealed in 2017?)
4) Property taxes (local) on real estate (old tax):
Tax varies across jurisdictions. About 0.5% of market value on average
14
LIFE CYCLE VS. INHERITED WEALTH
Economists divide existing wealth into 2 categories:
1) Life-cycle wealth is wealth from savings earlier in your life
2) Inherited wealth is wealth from inheritances received
Distinction matters for taxation because individuals are re-
sponsible for life-cycle wealth but not inherited wealth
Inherited wealth used to be very large in Europe (before World-
War I), became small in post-World War II period, but is grow-
ing in recent decades (especially in Europe)
15
60%
70%
80%
90%
100%
Cumu
lated
value
of in
herite
d wea
lth (%
total
wea
lth o
f the l
iving
)
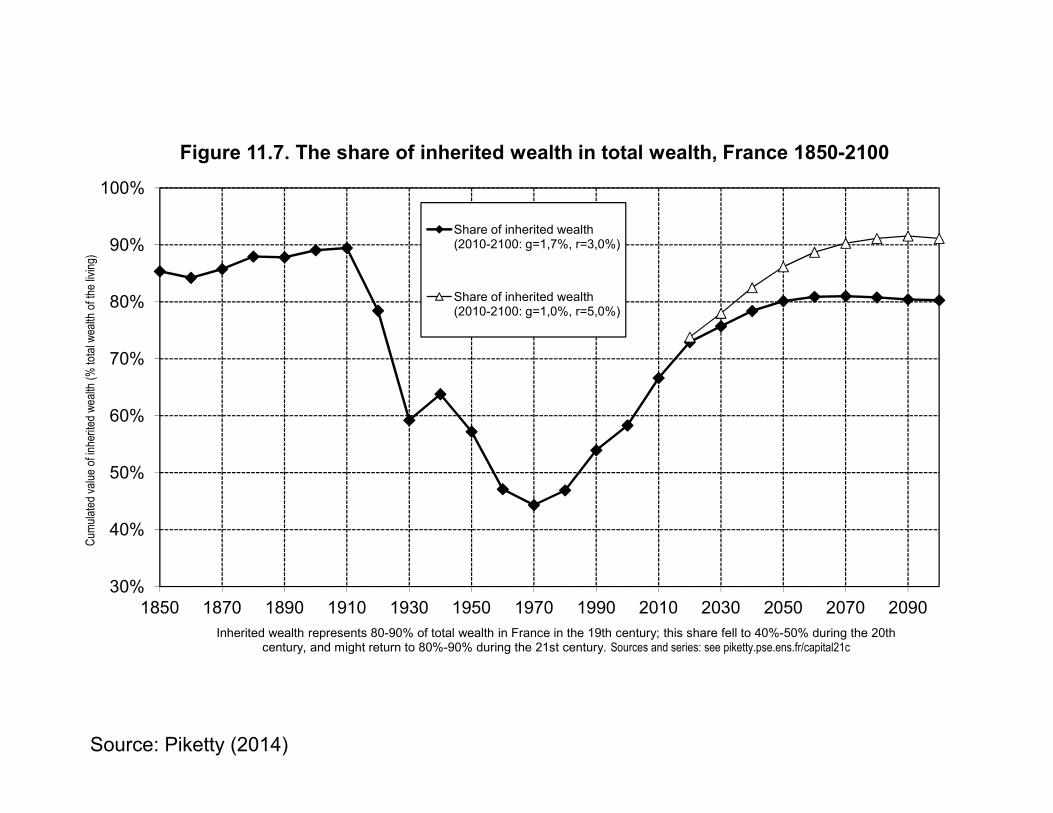
Figure 11.7. The share of inherited wealth in total wealth, France 1850-2100
Share of inherited wealth (2010-2100: g=1,7%, r=3,0%)
Share of inherited wealth (2010-2100: g=1,0%, r=5,0%)
30%
40%
50%
1850 1870 1890 1910 1930 1950 1970 1990 2010 2030 2050 2070 2090
Cumu
lated
value
of in
herite
d wea
lth (%
total
wea
lth o
f the l
iving
)
Inherited wealth represents 80-90% of total wealth in France in the 19th century; this share fell to 40%-50% during the 20th century, and might return to 80%-90% during the 21st century. Sources and series: see piketty.pse.ens.fr/capital21c
Source: Piketty (2014)
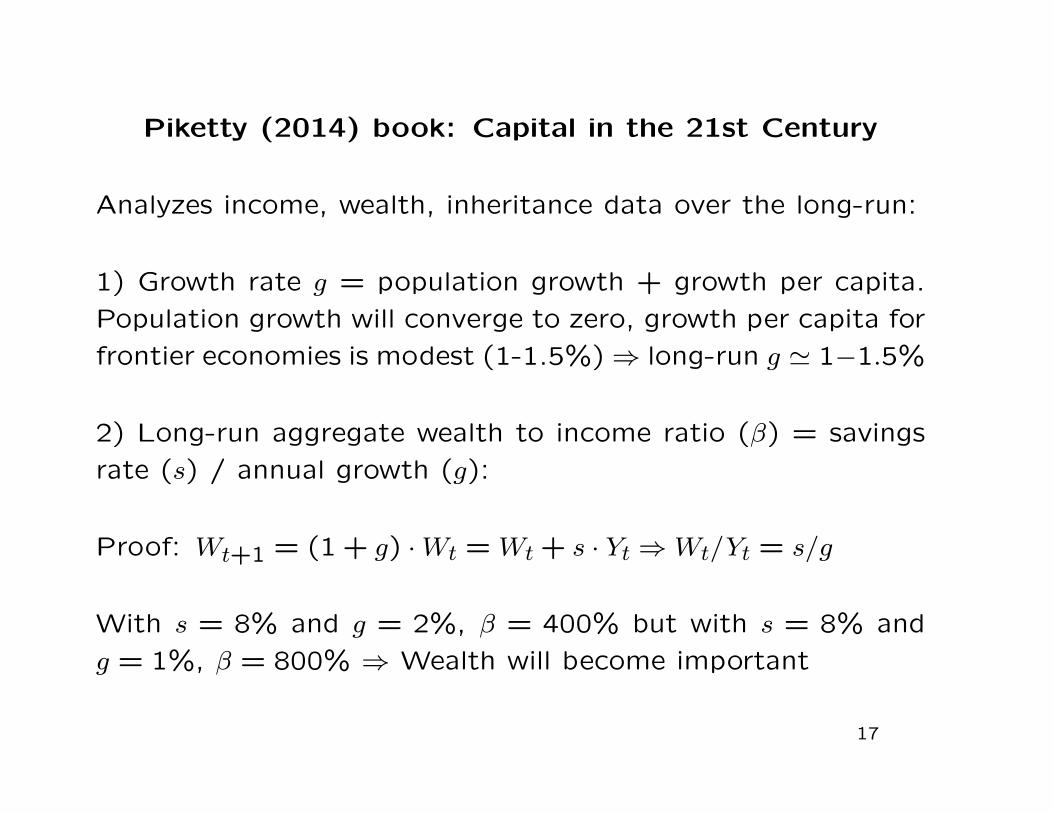
Piketty (2014) book: Capital in the 21st Century
Analyzes income, wealth, inheritance data over the long-run:
1) Growth rate g = population growth + growth per capita.
Population growth will converge to zero, growth per capita for
frontier economies is modest (1-1.5%)⇒ long-run g ' 1−1.5%
2) Long-run aggregate wealth to income ratio (β) = savings
rate (s) / annual growth (g):
Proof: Wt+1 = (1 + g) ·Wt = Wt + s · Yt ⇒Wt/Yt = s/g
With s = 8% and g = 2%, β = 400% but with s = 8% and
g = 1%, β = 800% ⇒ Wealth will become important
17
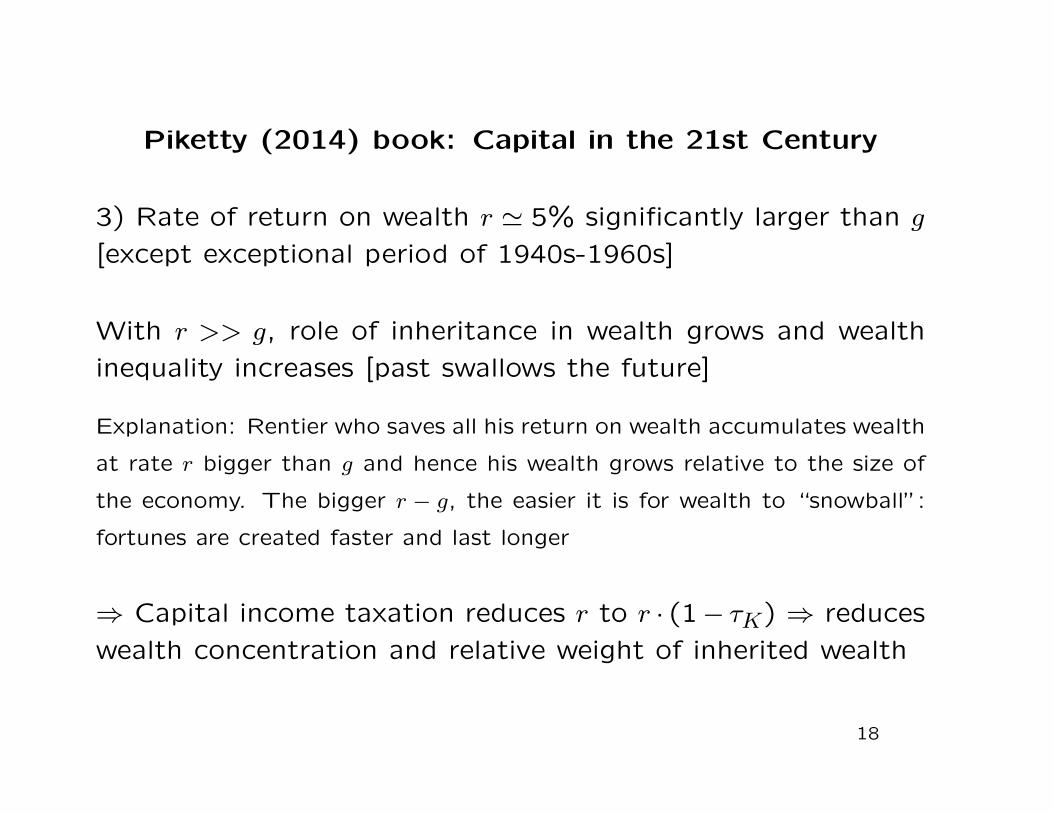
Piketty (2014) book: Capital in the 21st Century
3) Rate of return on wealth r ' 5% significantly larger than g
[except exceptional period of 1940s-1960s]
With r >> g, role of inheritance in wealth grows and wealth
inequality increases [past swallows the future]
Explanation: Rentier who saves all his return on wealth accumulates wealth
at rate r bigger than g and hence his wealth grows relative to the size of
the economy. The bigger r − g, the easier it is for wealth to “snowball”:
fortunes are created faster and last longer
⇒ Capital income taxation reduces r to r · (1− τK) ⇒ reduces
wealth concentration and relative weight of inherited wealth
18
2%
3%
4%
5%
6%
Annu
al ra
te o
f ret
urn
or ra
te o
f gro
wth
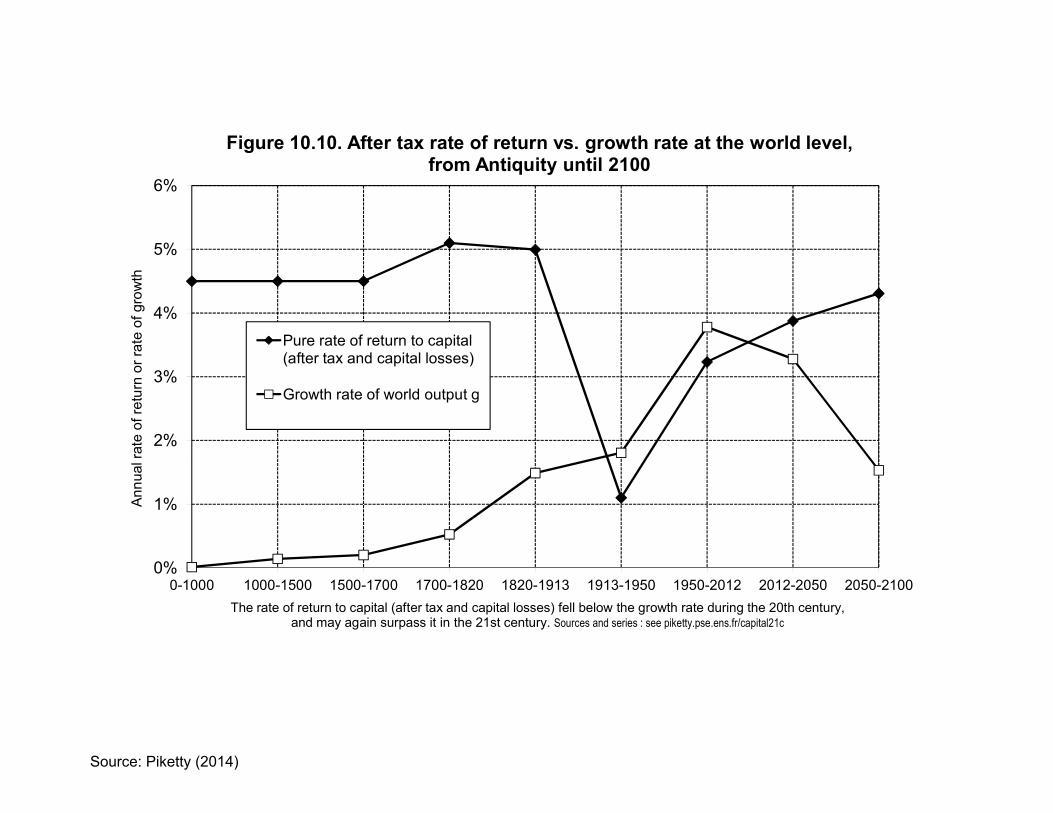
Figure 10.10. After tax rate of return vs. growth rate at the world level, from Antiquity until 2100
Pure rate of return to capital (after tax and capital losses)
Growth rate of world output g
0%
1%
0-1000 1000-1500 1500-1700 1700-1820 1820-1913 1913-1950 1950-2012 2012-2050 2050-2100
Annu
al ra
te o
f ret
urn
or ra
te o
f gro
wth
The rate of return to capital (after tax and capital losses) fell below the growth rate during the 20th century, and may again surpass it in the 21st century. Sources and series : see piketty.pse.ens.fr/capital21c
Source: Piketty (2014)
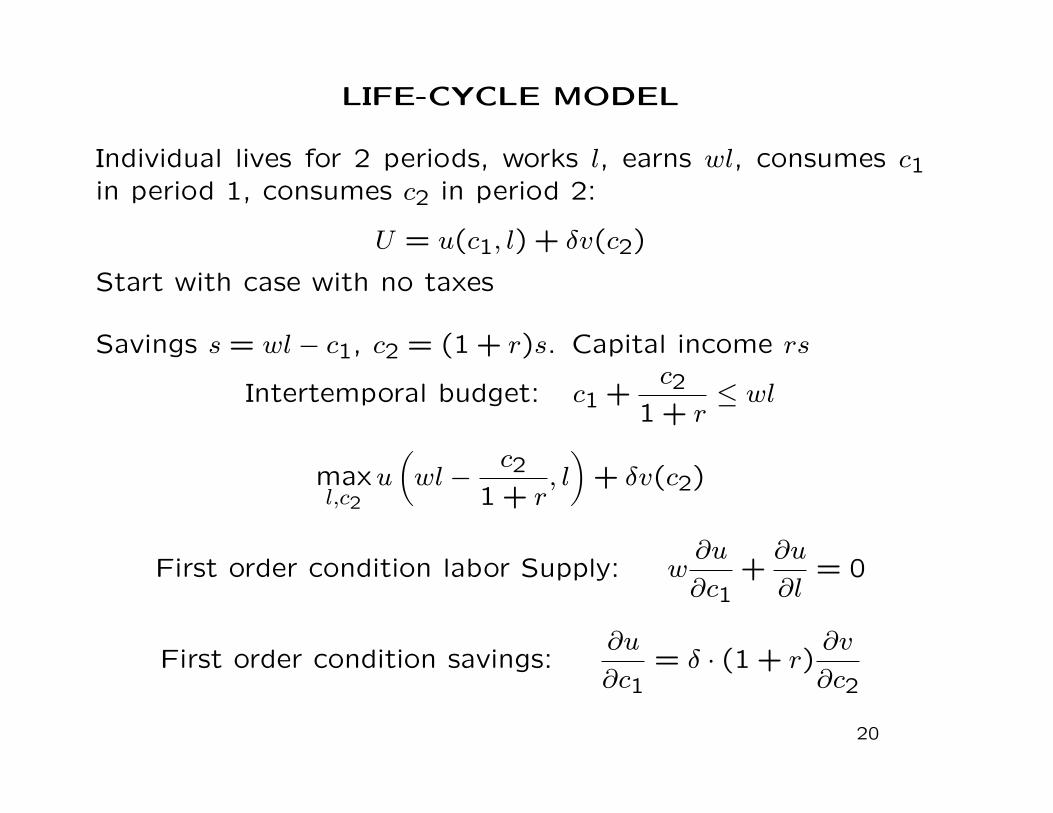
LIFE-CYCLE MODEL
Individual lives for 2 periods, works l, earns wl, consumes c1in period 1, consumes c2 in period 2:
U = u(c1, l) + δv(c2)
Start with case with no taxes
Savings s = wl− c1, c2 = (1 + r)s. Capital income rs
Intertemporal budget: c1 +c2
1 + r≤ wl
maxl,c2
u
(wl−
c21 + r
, l
)+ δv(c2)
First order condition labor Supply: w∂u
∂c1+∂u
∂l= 0
First order condition savings:∂u
∂c1= δ · (1 + r)
∂v
∂c2
20
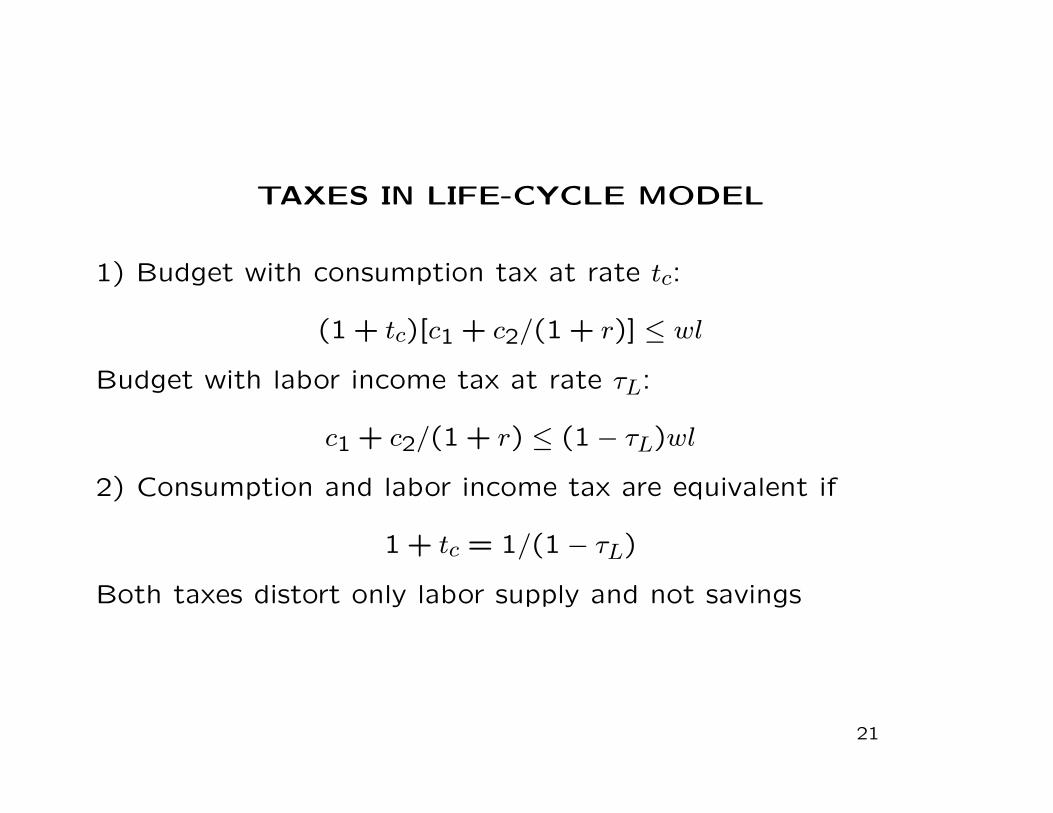
TAXES IN LIFE-CYCLE MODEL
1) Budget with consumption tax at rate tc:
(1 + tc)[c1 + c2/(1 + r)] ≤ wl
Budget with labor income tax at rate τL:
c1 + c2/(1 + r) ≤ (1− τL)wl
2) Consumption and labor income tax are equivalent if
1 + tc = 1/(1− τL)
Both taxes distort only labor supply and not savings
21
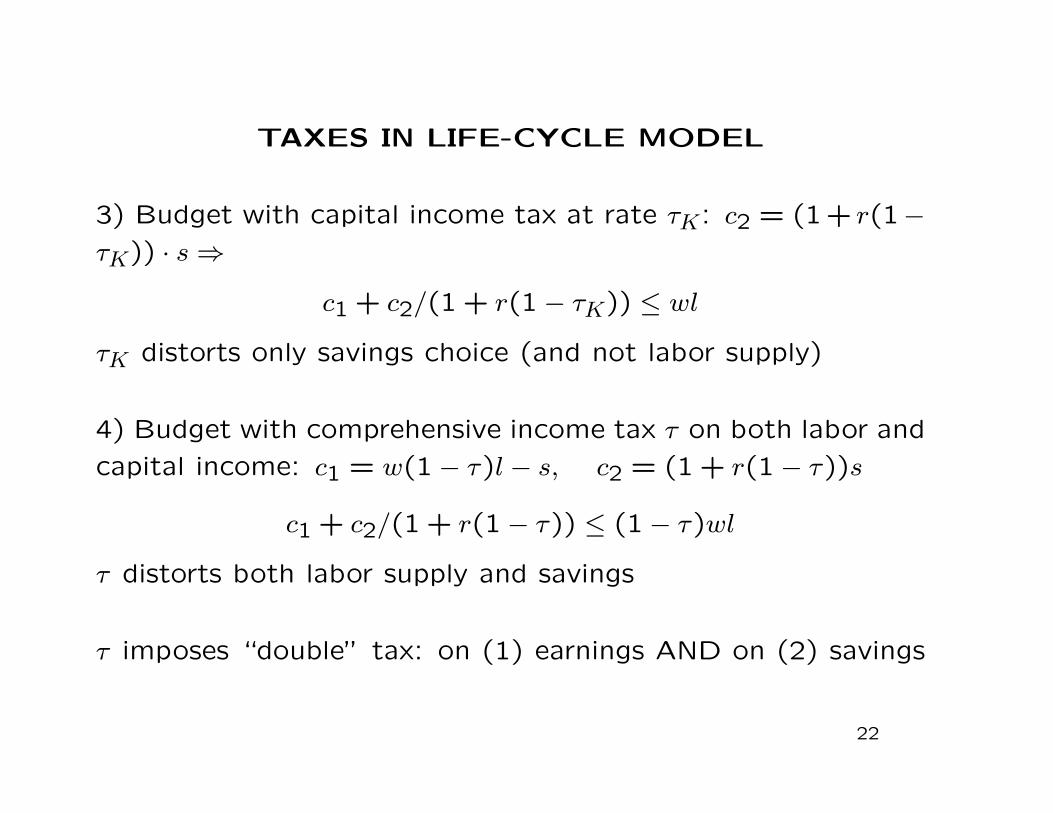
TAXES IN LIFE-CYCLE MODEL
3) Budget with capital income tax at rate τK: c2 = (1 + r(1−τK)) · s⇒
c1 + c2/(1 + r(1− τK)) ≤ wl
τK distorts only savings choice (and not labor supply)
4) Budget with comprehensive income tax τ on both labor and
capital income: c1 = w(1− τ)l − s, c2 = (1 + r(1− τ))s
c1 + c2/(1 + r(1− τ)) ≤ (1− τ)wl
τ distorts both labor supply and savings
τ imposes “double” tax: on (1) earnings AND on (2) savings
22
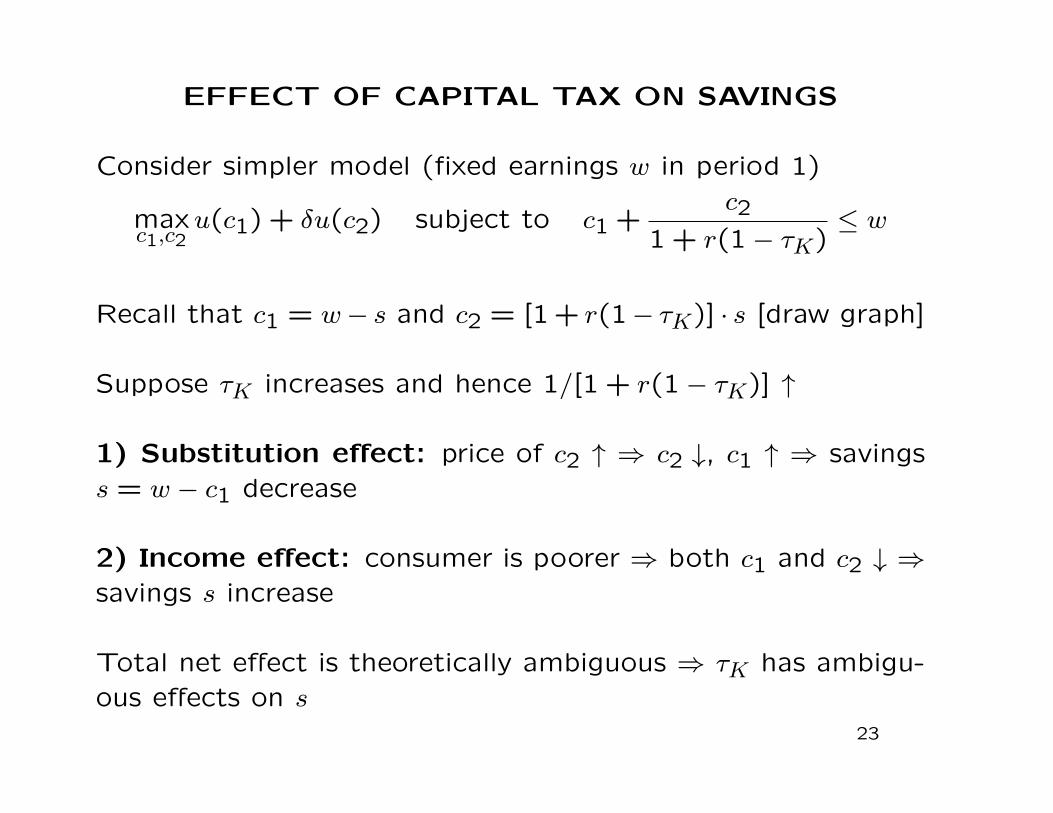
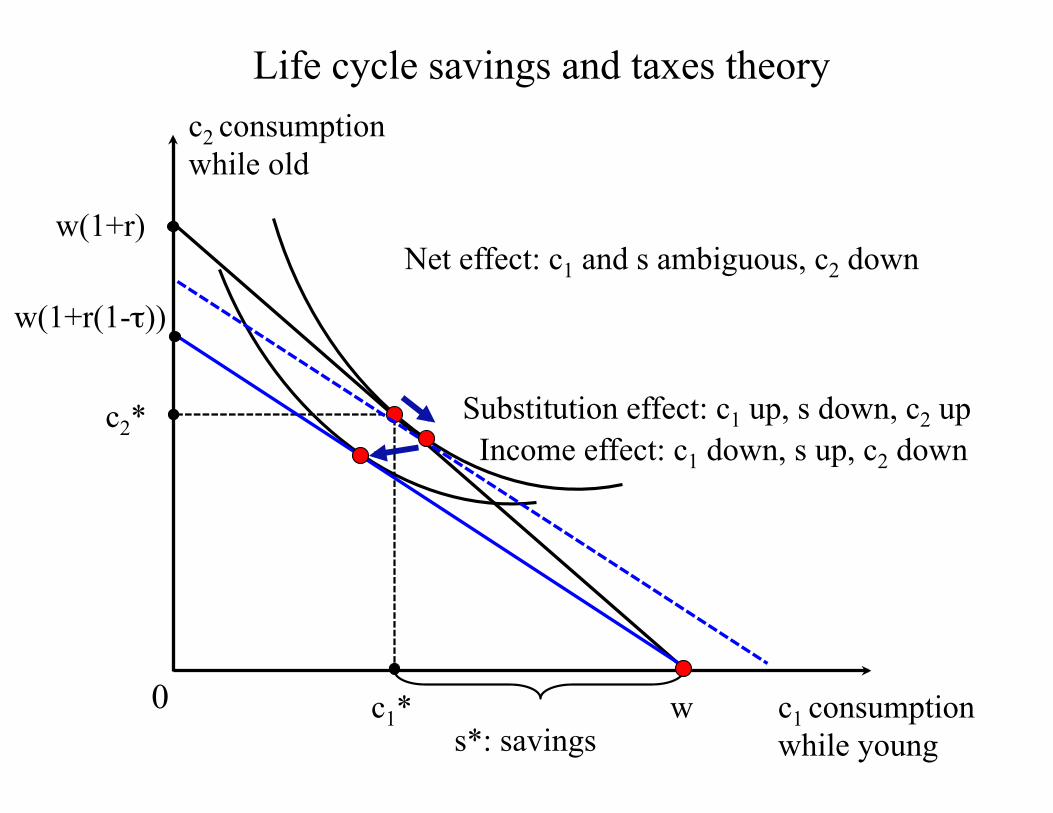
EFFECT OF CAPITAL TAX ON SAVINGS
Consider simpler model (fixed earnings w in period 1)
maxc1,c2
u(c1) + δu(c2) subject to c1 +c2
1 + r(1− τK)≤ w
Recall that c1 = w− s and c2 = [1 + r(1− τK)] · s [draw graph]
Suppose τK increases and hence 1/[1 + r(1− τK)] ↑
1) Substitution effect: price of c2 ↑ ⇒ c2 ↓, c1 ↑ ⇒ savingss = w − c1 decrease
2) Income effect: consumer is poorer ⇒ both c1 and c2 ↓ ⇒savings s increase
Total net effect is theoretically ambiguous ⇒ τK has ambigu-ous effects on s
23

0
Life cycle savings and taxes theory
w(1+r)
c2 consumption while old
c2*
c1* c1 consumption while young
Indifference curves u(c1,c2)=constant
s*: savings
w
Utility maximizing choice
Budget line slope –(1+r)
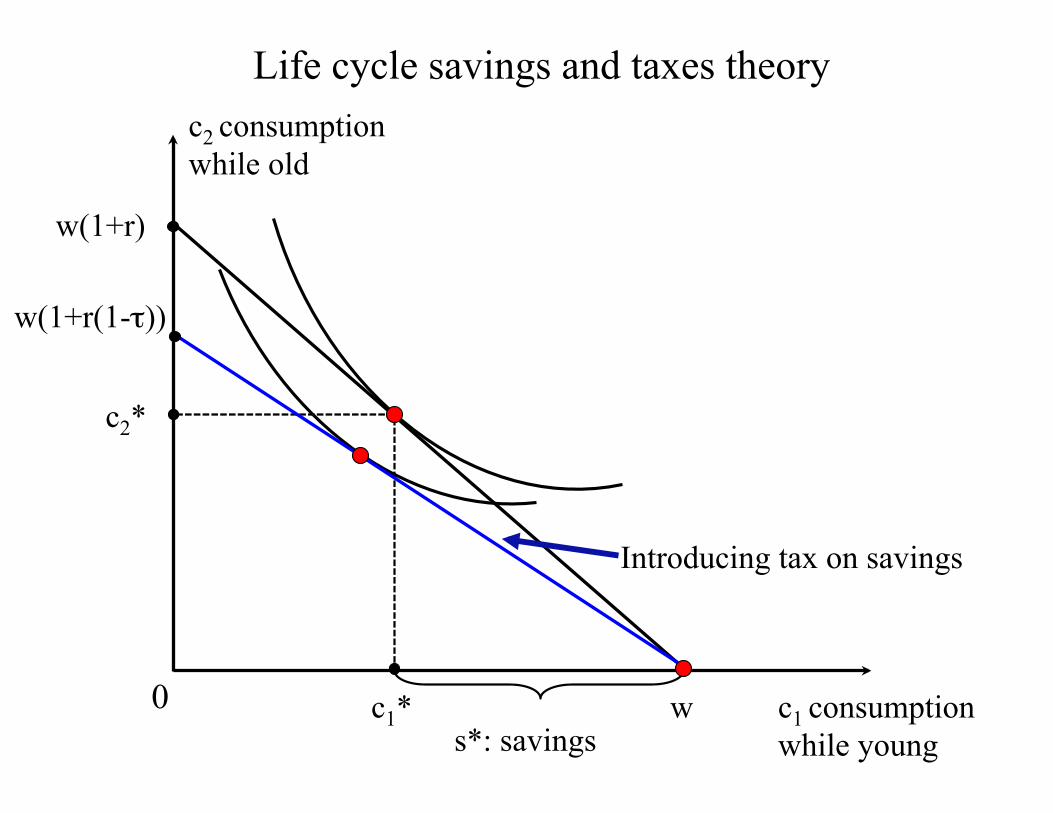
0
Life cycle savings and taxes theory
w(1+r)
c2 consumption while old
c2*
c1* c1 consumption while young s*: savings
w
Introducing tax on savings
w(1+r(1-τ))
0
Life cycle savings and taxes theory
w(1+r)
c2 consumption while old
c2*
c1* c1 consumption while young s*: savings
w
w(1+r(1-τ))
Substitution effect: c1 up, s down, c2 up Income effect: c1 down, s up, c2 down
Net effect: c1 and s ambiguous, c2 down
Fundamental tax reform: Shift to consumption taxation
Current US tax system is an income tax taxing both earnings
and capital income
Some conservatives advocate shifting to consumption tax
Consumption tax is equivalent to taxing only earnings
Shift from labor tax to consumption tax generates double tax-
ation of transitional generation (who have paid labor tax when
working and need to pay consumption tax when old)
Actual consumption taxes (such as value-added taxes) tend to
be flat while actual income taxes are generally progressive
25
OPTIMAL CAPITAL INCOME TAXATION
Two broad types of models:
1) Life-cycle models: wealth is due solely to life-cycle savings
2) Models with bequests: wealth is due solely to inheritances
26
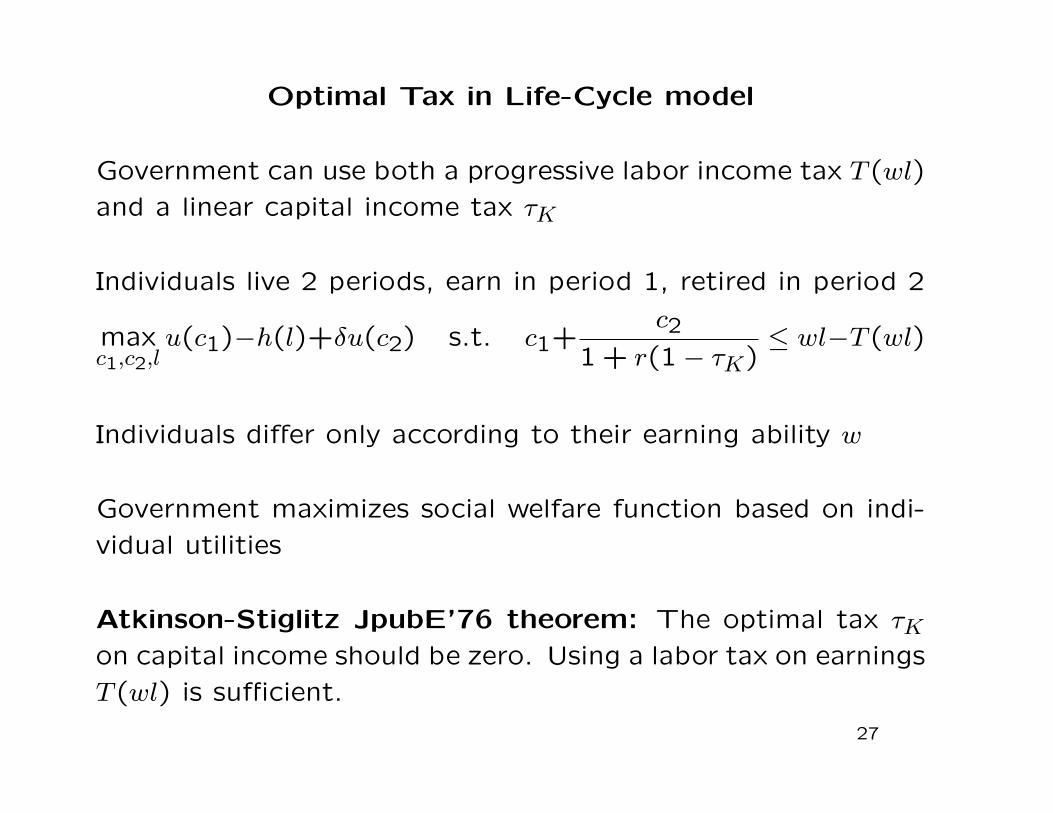
Optimal Tax in Life-Cycle model
Government can use both a progressive labor income tax T (wl)
and a linear capital income tax τK
Individuals live 2 periods, earn in period 1, retired in period 2
maxc1,c2,l
u(c1)−h(l)+δu(c2) s.t. c1+c2
1 + r(1− τK)≤ wl−T (wl)
Individuals differ only according to their earning ability w
Government maximizes social welfare function based on indi-
vidual utilities
Atkinson-Stiglitz JpubE’76 theorem: The optimal tax τKon capital income should be zero. Using a labor tax on earnings
T (wl) is sufficient.
27

Optimal Tax in Life-Cycle model
Atkinson-Stiglitz’ theorem shows that life-time savings should
not be taxed, tax only labor income
Key intuition: in basic life-cycle model, inequality in life-time
resources is due solely to differences in earnings ability. This
inequality can be addressed with labor income taxation. Cap-
ital income taxation needlessly distorts saving behavior.
From justice view: seems fair to not discriminate against
savers if labor earnings is the only source of inequality.
28
LIMITS OF LIFE-CYCLE MODEL
In reality, capital income inequality also due
(1) difference in rates of returns across individuals
(2) shifting of labor income into capital income
(3) inheritances
29

Difference in Rates of Returns Across Individuals
Rate of return on wealth varies significantly over time and
across individuals
Example: stock market can gain 30% in some years or lose
20% in others
Specific stocks can increase much faster for successful start-
ups (Google) or collapse entirely for bankrupt firms (Enron)
In general, richer individuals are able to invest in higher return
assets due to ability to take risks and scale effects in financial
advice [e.g., large University endowments get a larger return
than smaller ones, Piketty 2014, Chapter 12]
⇒ Taxing capital income is a way to mitigate such inequality
30
SHIFTING OF LABOR / CAPITAL INCOME
In practice, difficult to distinguish between capital and laborincome [e.g., small business profits, professional traders]
Differential tax treatment can induce shifting
(1) Carried interest in the US: hedge fund and private equityfund managers receive fraction of profits of assets they managefor clients. Those profits are really labor income but are taxedas realized capital gains
(2) Finnish Dual income tax system: taxes separately capitalincome at preferred rates since 1993: Pirttila and Selin SJE’11show that it induced shifting from labor to capital incomeespecially among self-employed
With income shifting, taxing capital income becomes desirableto curb this tax avoidance opportunity
31
Inheritance: Estate Taxation in the United States
Estate federal tax imposes a tax on estates above $5.5M ex-emption (only about .1% of deceased liable), tax rate is 40%above exemption (in 2013 and after)
Charitable and spousal giving are fully exempt from the tax
E.g.: if Bill Gates / Warren Buffet give all their wealth tocharity, they won’t pay estate tax
Popular support for estate tax is pretty weak (“death tax”)but public does not know that estate tax affects only richest
Support for estate tax increase shots up from 17% to 53%when survey respondents are informed that only richest payit (Kuziemko-Norton-Saez-Stantcheva AER’15 do an onlineMturk survey experiment)
32
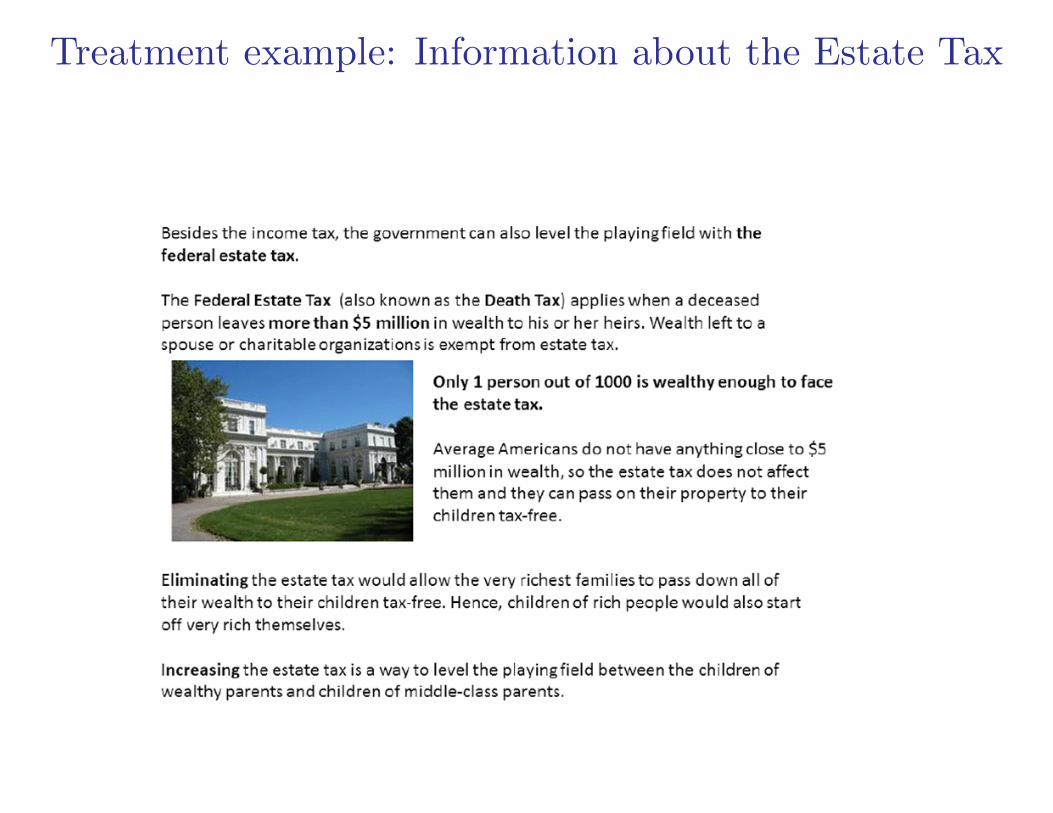
Treatment example: Information about the Estate Tax
14

Taxation of Inheritances: Welfare Effects
Inheritances (or gifts from living parents) raise difficult issues
of social justice [see Kaplow 2001]:
(1) Inequality in inheritances contributes to economic inequal-
ity and individuals not responsible for inheritances they receive:
⇒ seems fair to redistribute from those who received inheri-
tances to those who did not
(2) However, it seems unfair to tax the parents who worked
hard (and already paid tax on income) to pass on wealth to
children
34
Taxation of Inheritances: Behavioral Responses
Potential behavioral response effects of inheritance tax:
(1) reduces wealth accumulation of altruistic parents (andhence tax base) [no very good empirical evidence, Kopczuk-Slemrod 2001 suggest small effects]
(2) reduces labor supply of altruistic parents (less motivatedto work if cannot pass wealth to kids) [no good evidence]
(3) induces inheritors to work more through income effectsbecause they receive smaller inheritances (Carnegie effect, de-cent evidence from Holtz-Eakin,Joulfaian,Rosen QJE’93)
Critical to understand why there are inheritances for optimalinheritance tax policy. 3 models of bequests: (a) accidental,(b) altruistic bequests, (c) manipulative bequest motive
35
(a) ACCIDENTAL BEQUESTS
People die with a stock of wealth they intended to spend on
themselves (or that they accumulated out of love for wealth,
Carroll ’98):
Bequest taxation has no distortionary effect on behavior of
parent and can only increase labor supply of inheritors (through
income effects) ⇒ strong case for taxing bequests heavily
Surveys show that bequest motives are not the main driver of
wealth accumulation (Kopczuk-Lupton ’07):
Only 1/3 of people surveyed say that the main reason they
accumulate wealth is for bequests to their children
36
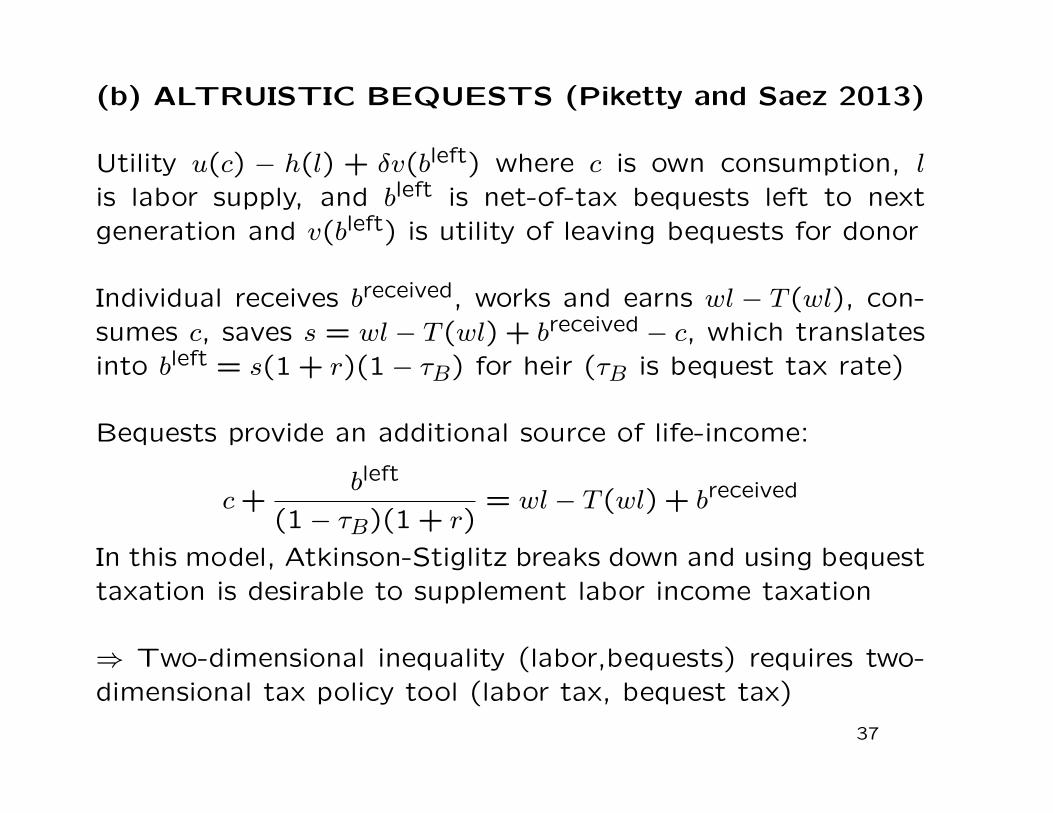
(b) ALTRUISTIC BEQUESTS (Piketty and Saez 2013)
Utility u(c) − h(l) + δv(bleft) where c is own consumption, l
is labor supply, and bleft is net-of-tax bequests left to nextgeneration and v(bleft) is utility of leaving bequests for donor
Individual receives breceived, works and earns wl − T (wl), con-sumes c, saves s = wl − T (wl) + breceived − c, which translatesinto bleft = s(1 + r)(1− τB) for heir (τB is bequest tax rate)
Bequests provide an additional source of life-income:
c+bleft
(1− τB)(1 + r)= wl− T (wl) + breceived
In this model, Atkinson-Stiglitz breaks down and using bequesttaxation is desirable to supplement labor income taxation
⇒ Two-dimensional inequality (labor,bequests) requires two-dimensional tax policy tool (labor tax, bequest tax)
37
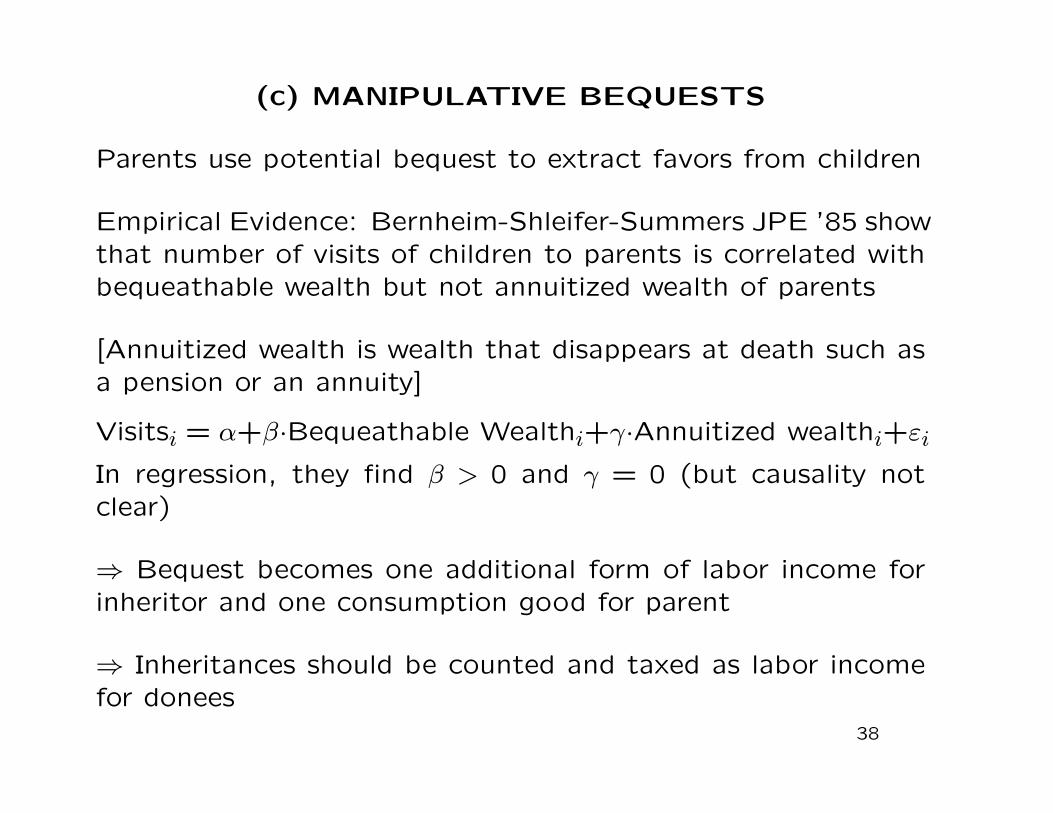
(c) MANIPULATIVE BEQUESTS
Parents use potential bequest to extract favors from children
Empirical Evidence: Bernheim-Shleifer-Summers JPE ’85 showthat number of visits of children to parents is correlated withbequeathable wealth but not annuitized wealth of parents
[Annuitized wealth is wealth that disappears at death such asa pension or an annuity]
Visitsi = α+β·Bequeathable Wealthi+γ·Annuitized wealthi+εi
In regression, they find β > 0 and γ = 0 (but causality notclear)
⇒ Bequest becomes one additional form of labor income forinheritor and one consumption good for parent
⇒ Inheritances should be counted and taxed as labor incomefor donees
38
(c) SOCIAL-FAMILY PRESSURE BEQUESTS
Parents may not want to leave bequests but feel compelledto by pressure of heirs or society: bargaining between parentsand children
With estate tax, parents do not feel like they need to give asmuch ⇒ parents are made better-off by the estate tax ⇒ Casefor estate taxation stronger
Empirical evidence:
Aura JpubE’05: reform of private pension annuities in the USin 1984 requiring both spouses signatures when worker decidesto get a single annuity or couple annuity: reform increasessharply couple annuities choice
Equal division of estates [Wilhelm AER’96, Light-McGarry’04]: estates are very often divided equally probably to avoidconflicts [gifts before death are not as equally split]
39
WEALTH IN TAX HAVENS
Official statistics substantially underestimate the net foreignasset positions of rich countries bc they do not capture mostof the assets held by households in off-shore tax havens
Example: Wealthy US individual opens a Cayman Islands ac-count and buys mutual fund shares (composed of US corporatestock): Cayman Islands record a liability but US do not recordan asset (because this is not reported in the US)
⇒ Total world liabilities are larger than world total assets
Zucman QJE’13 compiles international financial stats and es-timates that around 8% of the global financial wealth of house-holds is held in tax havens (3/4 of which is unrecorded = 6%)
If top 1% hold about 50% of total financial wealth, then about12% of financial wealth of the rich is hidden in tax heavens
40
CURBING OFF-SHORE TAX EVASION
Offshore tax evasion possible because of bank secrecy: US
cannot get a list of US individuals owning Swiss bank accounts
from Switzerland
⇒ No 3rd party reporting makes tax enforcement very difficult
In principle, problem could be solved with exchange of infor-
mation across countries BUT need all countries to cooperate
Johannesen-Zucman AEJ-EP’14 analyze tax haven crackdown:
G20 countries forced number of tax havens to sign bilateral
treaties on bank information sharing
Key result: Instead of repatriating funds, tax evaders shifted
deposits to havens not covered by treaty with home country.
41
CURBING OFF-SHORE TAX EVASION
FATCA’13 US regulations try to impose information ex-change for all entities dealing with US:
If foreign bank B does not provide list of all its US accountholders, any financial transaction between B and US will carry30% tax withholding ⇒ Interesting to see what it will do
Leaks like HSBC and Panama papers make tax evasion harder
Long-term solution will require:
a) Systematic registration of assets to ultimate owners [al-ready exists within countries for domestic tax enforcement]
b) Systematic information exchange between tax countrieswith no exceptions for tax heavens
⇒ Could be enforced with tariffs threats on tax heavens [Zuc-man JEP’14 and book ’15]
42
REFERENCES
Atkinson, A.B. and J. Stiglitz “The Design of Tax Structure: Direct VersusIndirect Taxation”, Journal of Public Economics, Vol. 6, 1976, 55-75.(web)
Aura, S. “Does the Balance of Power Within a Family Matter? The Caseof the Retirement Equity Act”, Journal of Public Economics, Vol. 89,2005, 1699-1717. (web)
Bernheim, B. D., A. Shleifer, and L. Summers “The Strategic BequestMotive”, Journal of Political Economy, Vol. 93, 1985, 1045-76. (web)
Carroll, C. “Why Do the Rich Save So Much?”, NBER Working Paper No.6549, 1998. (web)
Gravelle, Jane. “The Economic Effects of Taxing Capital Income.” [Book]MIT Press, 1994.
Holtz-Eakin, D., D. Joulfaian and H.S. Rosen “The Carnegie Conjecture:Some Empirical Evidence”, Quarterly Journal of Economics Vol. 108, May1993, pp.288-307. (web)
Johannesen, Niels and Gabriel Zucman “The End of Bank Secrecy? AnEvaluation of the G20 Tax Haven Crackdown,” forthcoming in AmericanEconomic Journal: Economic Policy, 2013. (web)
43
Kaplow, L. “A Framework for Assessing Estate and Gift Taxation”, inGale, William G., James R. Hines Jr., and Joel Slemrod (eds.) Rethinkingestate and gift taxation Washington, D.C.: Brookings Institution Press,2001. (web)
Kopczuk, Wojciech and Joseph Lupton 2007. “To Leave or Not to Leave:The Distribution of Bequest Motives,” Review of Economic Studies, 74(1),207-235. (web)
Kopczuk, Wojciech and Joel Slemrod, “The Impact of the Estate Tax onthe Wealth Accumulation and Avoidance Behavior of Donors”, in WilliamG. Gale, James R. Hines Jr., and Joel B. Slemrod (eds.), Rethinking Estateand Gift Taxation, Washington, DC: Brookings Institution Press, 2001,299-343. (web)
Kuziemko, Ilyana, Michael I. Norton, Emmanuel Saez, and Stefanie Stantcheva“How Elastic are Preferences for Redistribution? Evidence from Ran-domized Survey Experiments,” American Economic Review, 105(4), 2015,1478-1508 (web)
Light, Audrey and Kathleen McGarry. “Why Parents Play Favorites: Ex-planations For Unequal Bequests,” American Economic Review, 2004,v94(5,Dec), 1669-1681. (web)
Norton, M. and D. Ariely “Building a Better America–One Wealth Quintileat a Time”, Perspectives on Psychological Science 2011 6(9). (web)

Piketty, Thomas, Capital in the 21st Century, Cambridge: Harvard Uni-versity Press, 2014, (web)
Piketty, T. and E. Saez “A Theory of Optimal Inheritance Taxation”,Econometrica, 81(5), 2013, 1851-1886. (web)
Piketty, Thomas, Emmanuel Saez, and Gabriel Zucman, “DistributionalNational Accounts: Methods and Estimates for the United States”, NBERWorking Paper No. 22945, 2016. (web)
Piketty, Thomas and Gabriel Zucman, “Capital is Back: Wealth-IncomeRatios in Rich Countries, 1700-2010”, Quarterly Journal of Economics129(3), 2014, 1255-1310 (web)
Pirttila, Jukka and Hakan Selin, “Income Shifting Within a Dual IncomeTax System: Evidence from the Finnish Tax Reform,” Scandinavian Jour-nal of Economics, 113(1), 120-144, 2011. (web)
Saez, Emmanuel and Stefanie Stantcheva, A Simpler Theory of OptimalCapital Taxation, NBER Working Paper No. 22664, 2016 (web)
Saez, Emmanuel and Gabriel Zucman, “Wealth Inequality in the UnitedStates since 1913: Evidence from Capitalized Income Tax Data”, forth-coming Quarterly Journal of Economics 131(2), 2016, 519-578 (web)
Wilhelm, Mark O. “Bequest Behavior and the Effect of Heirs’ Earnings:Testing the Altruistic Model of Bequests,” American Economic Review,86(4), 1996, 874-892. (web)
Zucman, G. “The Missing Wealth of Nations: Are Europe and the USNet Debtors or Net Creditors”, Quarterly Journal of Economics, 2013,1321-1364. (web)
Zucman, G. The Hidden Wealth of Nations, September 2015, Universityof Chicago Press. (web)
Zucman, G. “Taxing across Borders: Tracking Personal Wealth and Cor-porate Profits” Journal of Economic Perspectives, 28(4), 2014, 121-148.(web)