employee training and wage dispersion: white and blue ...ftp.iza.org/dp4821.pdf · employee...
TRANSCRIPT
DI
SC
US
SI
ON
P
AP
ER
S
ER
IE
S
Forschungsinstitut zur Zukunft der ArbeitInstitute for the Study of Labor
Employee Training and Wage Dispersion:White and Blue Collar Workers in Britain
IZA DP No. 4821
March 2010
Filipe Almeida-SantosYekaterina ChzhenKaren Mumford

Employee Training and Wage Dispersion: White and Blue Collar Workers in Britain
Filipe Almeida-Santos Universidade Católica Portuguesa
Yekaterina Chzhen
University of York
Karen Mumford University of York
and IZA
Discussion Paper No. 4821 March 2010
IZA
P.O. Box 7240 53072 Bonn
Germany
Phone: +49-228-3894-0 Fax: +49-228-3894-180
E-mail: [email protected]
Any opinions expressed here are those of the author(s) and not those of IZA. Research published in this series may include views on policy, but the institute itself takes no institutional policy positions. The Institute for the Study of Labor (IZA) in Bonn is a local and virtual international research center and a place of communication between science, politics and business. IZA is an independent nonprofit organization supported by Deutsche Post Foundation. The center is associated with the University of Bonn and offers a stimulating research environment through its international network, workshops and conferences, data service, project support, research visits and doctoral program. IZA engages in (i) original and internationally competitive research in all fields of labor economics, (ii) development of policy concepts, and (iii) dissemination of research results and concepts to the interested public. IZA Discussion Papers often represent preliminary work and are circulated to encourage discussion. Citation of such a paper should account for its provisional character. A revised version may be available directly from the author.

IZA Discussion Paper No. 4821 March 2010
ABSTRACT
Employee Training and Wage Dispersion: White and Blue Collar Workers in Britain*
We use household panel data to explore the wage returns associated with training incidence and intensity (duration) for British employees. We find these returns differ depending on the nature of the training; who funds the training; the skill levels of the recipient (white or blue collar); the age of the employee; and if the training is with the current employer or not. Using decomposition analysis, training is found to be positively associated with wage dispersion: a virtuous circle of wage gains and training exists in Britain but only for white-collar employees. JEL Classification: J24, J31, J41 Keywords: training, wage compression, performance Corresponding author: Karen Mumford Department of Economics and Related Studies University of York York YO10 5DD United Kingdom E-mail: [email protected]
* Almeida-Santos is grateful for funding from the Fundacao para a Ciencia e Tecnologia - Ministerio da Ciencia e Tecnologia (Portugal). This paper is based on the earlier discussion paper: Filipe Almeida-Santos and Karen A. Mumford (2006). “Employee Training, Wage Dispersion and Equality in Britain.” IZA Discussion Paper No. 2276.

2
1. Introduction.
Training is a key factor in the economic performance of all countries. It is a major tool
for increasing productivity and living standards (Ok and Tergeist, 2002). Concentrating
training amongst workers who perform complex tasks and have high levels of formal
education may create a virtuous circle for these high skill workers resulting in higher
wages, further training opportunities, longer tenure and greater social status (Gershuny,
2005). In contrast, workers who are disadvantaged in the education process may be less
likely to receive training, inducing a vicious circle for these low skill workers; further
increasing their risk of unemployment and social exclusion (Keep et al, 2002).
Simply ensuring equity of training opportunity may not be sufficient to assure a
reduction in wage inequality among workers if individuals with different characteristics
obtain different benefits from the same training scheme. The British Government is
increasingly concerned with the potentially contradictory implications of training policy
for equity and efficiency, namely, redirecting training investment towards groups that
typically receive less training or towards groups of workers where expected returns are
larger (Department of Trade and Industry, 2005).
This paper concentrates on the relationship between training and wages. We seek to
address a fundamental question: what is the nature of the contribution of training (and
its financing) to wage inequality in Britain? In the process of seeking answers to this
question, it is important to estimate the individual employee’s rates of wage return to
training. Relevant empirical studies are not easy to locate; Frazis and Loewenstein
(2005) recently conclude “we are aware of few studies that attempt to estimate rates of
return to training”. Often due to data constraints, most of the relevant studies that do
exist estimate average returns for all training recipients, ignoring that the provision and
returns to training across employees may differ according to gender, age, education
level, occupation and sector of employment. Using longitudinal data on households and
individuals (the British Household Panel Survey, BHPS), we can address many of these
issues. Our results may also be seen as a further empirical investigation of the potential
returns from training which help to fill a gap in a still unresolved area of research
(Pischke, 2001: 543, Leuven, 2002: 34).

3
The modeling of wage returns to training is considered in section 2 of the paper, data
and variable descriptions are discussed in section 3, results are presented in section 4,
wage returns to training within skill groups are explored in section 5, and section 6
concludes.
2. Modeling Wage Returns
The relationship between investment in training and wages has been explored
extensively by Becker (1962 and 1964), Ben Porath (1967) and, of course, Mincer
(1958, 1962, 1970 and 1974) with the development of the well known Mincer wage
regression.
In subsequent years, authors have increased the number of explanatory variables
included in the regression with the addition of variables capturing individual, job and
firm characteristics (recent reviews are provided by Chiswick 2003 and Polachek,
2008). In this augmented framework, training may be considered as inherently
heterogeneous and it is legitimate to expect the size of any associated wage returns to
differ according to the nature and the type of the training program (Leuven, 2004: 19).
Several limitations have been identified in this research area associated with
methodological questions; with database quality; and with the mixed continuous-
discrete nature of training variables. We will return to discuss some of these issues
below.
Following in the tradition of the literature on training (in particular, Lowenstein and
Spletzer, 1998), we estimate the wage return from different types of training using the
following Mincer type wage regression:
1ln ijt ijt t it i ij ijtW X Y Tβ δ α µ υ ε−= + + + + + (1)
Where lnWijt is the natural logarithm of the real (2005 prices) hourly wage of individual
i in job j at time t; Xijt is a vector of individual and job characteristics; Tij-1 represents
single period lagged measures of training accumulated by the worker and Yt is a vector
of year-specific dummy variables. Unobserved characteristics are decomposed into an
individual fixed effect µi, an unobserved job match specific component νij and a
4
transitory shock εijt. The individual effect µi is considered as an omitted measure of time
invariant characteristics such as ability, motivation, and ambition or career commitment.
The unobserved components (µi and νij ) become a problem for the consistency of
estimates if they are in some way correlated with the regressors. Following Lowenstein
and Spletzer (1998), we address this problem by estimating the model with fixed effects
and approximating νij with a binary variable accounting for employer change.
3. The Data
The data are taken from the British Household Panel Survey (BHPS) which is a
nationally representative, annual sample of private British households. The BHPS was
launched in 1991. Each year, individual adult members of households are interviewed
over a broad range of socioeconomic topics resulting in a rich and relevant data set. In
1992 and 1993 respondents were asked for information on their lifetime employment
status and job histories which are included in the analyses below. The BHPS
questionnaire was extended in (and continuously from) wave 8, conducted in 1998, to
include information on the nature of the three most recent training courses attended
since September of the previous year; and how these courses were financed. Our focus
is on the 1998 to 2005 waves of data1 as we are particularly interested in this training
information, although information collected for individuals in all of the previous waves
is included in the analysis presented below.
Our sample is an unbalanced panel of employed individuals in Britain, in the 18 to 65
age bracket (that are original, temporary or permanent BHPS sample members). We
exclude those individuals missing relevant training information; the minority of workers
with no expected weekly working hours; and those reporting working more than 75
hours per week (including paid overtime). Any employed respondents with missing
hourly earnings were excluded, as were those with missing data on any of the pertinent
labour market or personal characteristics. Individuals with hourly earnings below £1 or
exceeding £100 were also excluded from the analysis. Our final sample contains 34,900
training observations over eight years (1998 to 2005), from 8,862 individuals, a little
over half of whom are women.
1 The latest wave of the BHPS data (2006/07) was released in late September 2008, however, the introduction of new definitions and coding in this latest wave limited our ability to use this wave of data at the time of carrying out the analysis for this paper.

5
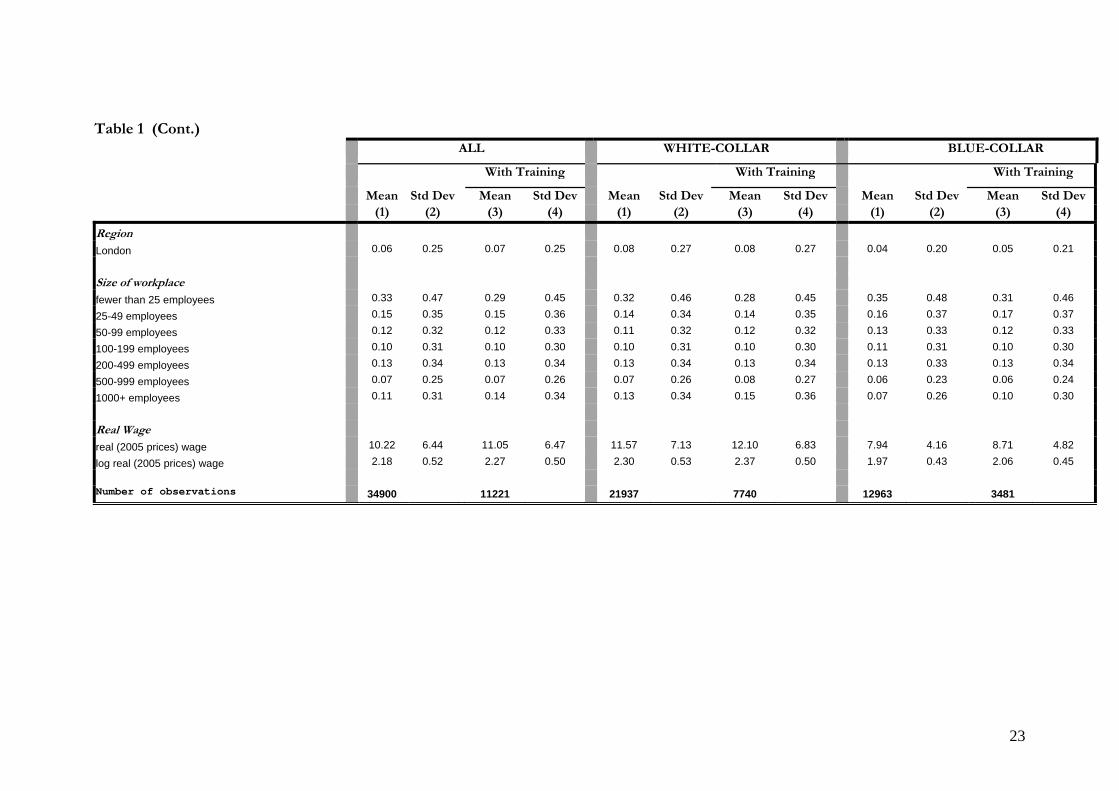
Concise variable definitions and summary statistics for the final sample are presented in
Table 1. Means and standard deviations are presented in columns one and two for the
full sample, and in columns three and four for those workers trained. Columns 5 to 8
(and columns 9 to 12) present analogous information for white collar (and blue collar)
employees. We define the white-collar group of employees to be the: managerial,
professional, associate professional and technical, sales, and clerical and secretarial
occupations. The blue-collar group consists of the: personal services, craft and related,
plant and machine operatives, and other semi-skilled and unskilled occupations.
3.1 Training Measures
The BHPS questionnaire asks individuals for information concerning the three most
recent training events they have been on since September of the previous year. For each
event they are asked if this training was:
1 - To help you get started in your current job?
2 - To increase your skills in your current job?
3 - To improve your skills in your current job?
4 - To prepare you for a job or jobs you might do in the future?
5 - To develop your skills generally?
Based on the answers to this question, we define two categories of training for the
construction of the dichotomous and continuous variables related to the incidence and
intensity (duration) of training respectively. The first is the widest category including
any of the five options and is defined simply as training. It consists of either specific
and/or general training components, and is expected to improve the worker’s skills
either in their current job or in any other job.
The second category is defined as general training. In this category, the interviewees
have chosen the fifth option and they explicitly recognized that the training event
included a general component, however, this option choice is not mutually exclusive
and they may have chosen other options too.
To construct the third and fourth measures, additional information concerning the
financing of training is included. We define the third measure as employer-financed

6
training, or simply financed training, and construct a binary indicator variable if the
training event (options 1 to 5 above) was also financed by the employer. This variable is
set equal to one if trained workers recognize that fees were paid by the employer or if
they respond that there were “no fees”. We similarly define the fourth measure as
employer-financed general training, or simply financed general training, and construct
a binary indicator variable that allows us to identify if the general training event (option
5 above) was also financed by the employer (or if the response was “no fees”).2 In our
sample, for more than 73% of courses attended in the current employer’s workplace (or
training centre) the workers involved reported no fees, implying the training was
employer financed.
The proportion of employees responding that they had received training in Britain was
just over 30% in the BHPS sample (column 1, panel 1 of Table 1). Amongst the specific
group of trained individuals, 87% of the courses attended include components that
explicitly improved their general skills whilst 75% of courses were additionally
financed by the employer. On average, trained workers participated in 5.9 training
courses over the eight years.
The average intensity (or duration) of the set of three training events attended per year
was approximately 19.6 days. Not surprisingly, general training courses and financed
general training events both tend to be of shorter duration. White collar workers
experience not only a higher training incidence but also an average higher intensity; this
is true across age groups.
3.2 Individual and Job Characteristics
Amongst the group of variables quantifying individual and demographic characteristics,
are several measures of the individual’s aptitude and opportunities which may be related
to wages and training outcomes, such as: labour market work experience; years of
formal education; the possession of a vocational qualification; current job tenure;
gender; and race.
2 Recent non-competitive models emphasise how market frictions may transform what the human capital model classifies to be general training into de-facto specific training (Acemoglu and Pischke, 1999). In such an environment, firms have an incentive to finance general training and to distribute these training opportunities amongst employees, thereby introducing issues of allocation.
7
We use a continuous variable for the years of actual labour market work experience
using the individual’s employment history since first leaving full-time education3. This
is a superior measure than the commonly used proxies of potential lifetime work
experience (Polachek, 2008; Regan and Oaxaca, 2009). Table 1 also reveals that trained
workers have more years of formal education and less years of tenure in their current
job.4
It is important when investigating the relationship between training and wages to
consider relationships that may otherwise limit the efficiency and/or consistency of
training estimates. First, training accumulated in the current job should be distinctly
measurable from training accumulated in previous jobs. This allows testing of the joint
hypothesis of no depreciation and that training is transferable across employer.
Furthermore, the measures of training incidence and intensity should ideally fully
capture the amount of training accumulated over the working life because it is the stock
of human capital accumulated via training, and not just by the most recent flow, that
affects wages. This is may be particularly pertinent for certain demographic groups,
such as women. On average, and in contrast with the results obtained using British
workplace data (Almeida-Santos and Mumford, 2005), women have a higher rate of
participation in training programmes than do men (35% and 30% respectively) in the
BHPS sample.
We have data on the cumulated events of training acquired in the period 1998 to 2005.
The stock of human capital accumulated before this period is captured by current job
tenure and previous work experience at the beginning of the period. Using cumulated
events allows for greater flexibility and reduces potential bias due to errors in self-
reported training (Ariga and Brunello, 2006; Frazis and Loewenstein, 2005; and Melero,
2004).
3 More specifically, we used the BHPS Combined Work-Life History Data 1990-2005 (see Halpin, 2006). This dataset combines information about the current activity status of each respondent with inter-wave activity history as well as the lifetime employment and occupation histories collected at Waves 2 and 3, respectively. 4 Employees have on average 5 years of tenure in their current job. This value is not out of line with estimates of current job tenure in Britain found in other studies using difference data sources (Mumford and Smith, 2004).
8
A further complication when calculating the return to training is related to promotions.
It is possible that employees are offered training prior to being promoted and before
increasing their job responsibilities; this potential correlation between job-related
training receipt and future promotions also needs to be addressed (Melero, 2004: page
14). The descriptive statistics in Table 1 indicate that individuals with longer working
hours, current union membership, full time employment status, vocational
qualifications, and who were promoted last year are more likely to be trained, especially
in the case of women. We control for promotion in our estimations below.
Amongst the occupational groupings, managers and administrators; professional
occupations; and associated professional and technical occupations are more likely to
participate in a training program compared to those employed in sales; plant and
machines operators; and elementary occupations. Suggesting that the likelihood to be
trained may also increase with the task’s complexity and the responsibility required for
the job. To further explore this possibility, as discussed above, the sample is divided
into white and blue-collar workers.
It is assumed that white collar workers are allocated to occupations where tasks are
more complex and job responsibilities higher. White-collar workers usually enjoy faster
wage growth, they are better educated, more able to perform intellectually complex
work related tasks (Bishop, 1997) and consequently are predicted to generate a higher
rate of return from training.
3.3 Workplace and Market Characteristics
Whilst non-work attributes may have a significant impact on training and productivity,
the work environment characteristics beyond the control of employees may also inhibit
ability and motivation to perform activities (Clifton, 1997). Several measures are
included in the empirical analyses as controls for some of these characteristics: region;
industrial sector; firm type (non-profit, privately owned); and firm size. The definitions
and summary statistics for these workplace and market characteristics are included in
the lower panels (panels 2 and 3) of Table 1.
9
4. Results
Results for the estimates from the fixed effect models (FE) for training incidence and
intensity are presented in Tables 2 to 5. Though only the relevant wage returns are
reported in these tables, the independent variables include the individual-level control
variables listed in Table 1 and discussed in section 35, plus the more aggregate level
controls (including the workplace characteristics6, and year specific dummy variables).
A full list of the controls is provided in the endnotes to the tables and full estimation
results are available from the authors upon request. All of the results are based upon
robust standard errors7. Overall, the parameter estimates are generally well defined and
have the expected sign.
Several alternative functional forms were also considered, with training measures
entering quadratically; as a logarithm; a cubic root; and incorporating interaction terms.
However, neither robust results8 nor higher goodness of fit measures were obtained
compared to the results reported in Tables 2 to 5. (These additional results are available
from the authors on request).
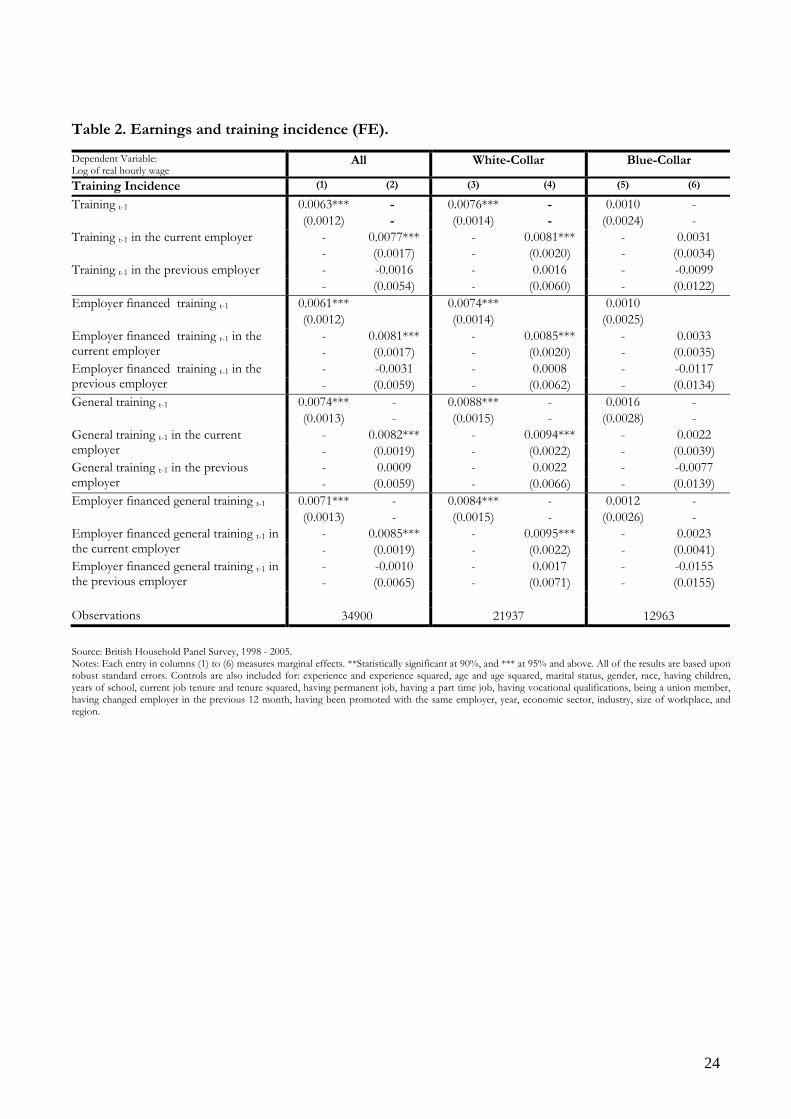
4.1 Training Incidence
As discussed above, the relationship between training incidence and wages may vary
across types of employees. To consider this possibility more fully, fixed effects wage
regressions are estimated for the full sample of employees (columns 1, and 2 of Table 2)
and for two separate worker groups: white-collar (columns 3 and 4) and blue-collar
(columns 5 and 6). Columns 1, 3 and 5 present the ‘base’ results for lagged training
incidence. In columns 2, 4 and 6 cumulated lagged training measures are split into
training with current employer and training with previous employers.
5 Age, age squared, work experience, experience squared, current job tenure, tenure squared, marital status, gender, having a dependent child, part-time employment, permanent contract, trade union membership, formal education received, having a vocational qualification, job leaver, promoted with current employer. 6 Industrial sector, workplace size, private ownership, non-profit, and region. 7 The overall test of the explanatory power of the regressors is significant at a 99% confidence level for all the regressions and whilst the goodness of fit measures are not high, they are comparable with those found in other studies of training (see Leuven, 2002). Full results are available from the authors on request. 8 The set of interaction terms considered in the model and found to be statistically insignificant are: training*years of school; training*female; training*tenure; training*tenure2; training*part-time; training*log hours; training*promoted and training*several occupation measures reveal. The inclusion of a quadratic term for training is statistically insignificant (at a level of 15%) and equal to zero.
10
Beginning with the results for the full sample of employees (Table 2, column 1), the
incidence of a training course (ignoring the components that the course may include) is
associated with a modest but significant increase of 0.63% in wages (column 1, panel
1); 0.61% if the training course is financed by the employer (panel 2).9 The wage return
to training that explicitly included a general component is associated with an increase of
0.74% (panel 3); 0.71% if the general training course is financed by the employer (panel
4).
Similar estimates of wage returns from training have been obtained by Lynch (1992a
and 1992b) and Veum (1995) using the American National Longitudinal Survey of
Youth Cohorts; and Schǿne (2004) using the Norwegian Survey of Organisations and
Employees). Arulampalam et al., (2004), using the European Community Household
Panel Series (which incorporates data from the BHPS for Britain), conclude that
“Britain, Denmark and Finland – are also amongst the countries with the lowest returns,
of approximately one percent per event”.
Our estimated wage returns to training are, however, relatively low compared to those
obtained by Booth and Bryan (2007) and Melero (2004) using the BHPS for the period
of 1998 to 2000 and for the period of 1991 to 2002, respectively. There are some
important differences between our approach and these earlier studies that may help to
explain our lower estimates. In particular, we consider employees aged 18 to 65 (they
included 16 to 65 year olds); we include public sector employees10; our sample period is
substantially longer; we control for a larger set of independent variables; and, perhaps
most importantly, we use broader definitions of training.11
Dividing training events into those with the current or previous employer (column 2 of
Table 2) reveals that training events with the previous employer do not have a
statistically significant relationship with current wages in the full sample estimates.
9 The estimates for training are robust to the inclusion of the promotion measure in the set of explanatory variables. Nevertheless, promotion has a significant and a positive relationship with wages. Employees can expect their wage to rise by 4% when they are promoted. 10 The returns to training (incidence or intensity) are not found to be significantly different for public and private sector employees in any of the models considered in this paper. These results are available from the authors upon request. 11 For example, Booth and Bryan (2007) use a subset of recent training occasions, the three longest in each year, which they divide into non-mutually exclusive current job training categories.

11
Further dividing training with previous employer into (i) firm financed training, (ii)
general training and (iii) firm financed general training (reading down column 2)
confirms this result; we consistently find that training events with previous employers
do not have a significant systematic relationship with wages for the full sample of
British employees. In contrast, across all the training categories considered, training
with current employer is associated with a modest but significant increase in wages for
the full sample of British employees. This finding is consistent with the human capital
model if, for example, skills received from training have depreciated and/or the skills
acquired from training are not transferable across employers. We further explore the
implications of these findings by next considering the white and blue collar employees
separately.
4.2 White and Blue Collar Employees.
Beginning with the results for white collar employees (columns 3 and 4 of Table 2), the
wage returns associated with training incidence are similar in size to those found for the
full sample, and training events with previous employers are again not found to be
significantly associated with wages (column 4).
For the blue-collar sample (columns 5 and 6), the wage returns related to training
incidence for all four categories are substantially lower than those found for the white-
collar workers, however, they are also imprecisely estimated.12 Indeed, for blue-collar
workers, training events are not found to have a significant association with wages for
any of the four training incidence measures considered. This is true for training events
with the previous or current employer.13
To reiterate, the results in Table 2 for training incidence indicate three major findings:
(1) for the full sample of British employees, the wage returns associated with a training
12 This finding may be inconsistent with the predictions of recent non-competitive models but still consistent with classical human capital theory in the presence of long-term labour contracts (Lazear and Oyer, 2004). 13 Given the imprecise nature of the blue collar training estimates, a full set of white collar and training interactive variables were introduced in the pooled sample (of all employees) to establish if the relationship between training and earnings is significantly different for blue and white collars employees. For all the training categories considered, the white collar returns are found to be significantly different from those of the blue collar employees at a minimum 80% confidence level (full results available for the authors upon request).
12
event are small and positive; (2) training events with previous employers are not
associated with wage gains; and (3) blue collar employees do not experience wage rises
related to training events.
4.3 Training Intensity
The estimates of the fixed effects models (FE) for training intensity (duration) are
reported in Table 3, the results presented in the table are scaled by 100 and should be
interpreted accordingly. The results for the full sample of British employees (columns 1
and 2) are consistent with those found for training incidence. All four of the training
measures are associated with wage increases (column 1). Furthermore, it is training with
the current employer that is associated with wage growth (column 2). There is no
significant evidence that training intensity with previous employers is related to wage
rates for the full sample of British employees.
Dividing the workers into white and blue collar, the results again reveal that training is
consistently and significantly positively related to wage changes for white-collar
employees (columns 3 to 4). For these employees, the cumulated days of training
(training intensity) with the current employer has a significant and positive relationship
with wages (0.03% in column 4, allowing for the scaling). A white collar employee
undergoing a training program (which includes general components) lasting for 20 days,
with their current employee, may expect a wage increase of 0.6%, ceteris paribus.
Training with previous employers is again found to have an insignificant association
with wage, in contrast to cumulated training days with the current employer. For blue-
collar workers (columns 5 and 6), there is evidence that training intensity (duration) is
associated with higher wage returns especially for training that includes an explicit
general component. Wage returns from training intensity are, however, typically small
and less well defined for blue collar workers in contrast to those found for white collar
workers.
In summary, our results indicate that whilst wage returns from training events
(incidence and intensity) with the current employee are consistent and significantly
positive for white collar employees, this is not the case for blue collar employees.
When positive and significant relationships are found for blue collar workers, the wage
returns are consistently low for these employees. Equal access to training programs will

13
not reverse wage inequality in favor of low skilled employees if blue-collar employees
do not derive a wage benefit from participating in training.
4.4 Decomposing the wage differential
It appears that training may have a non negligible role in wage inequality amongst
workers in Britain. We next evaluate the contribution of different types of training to
wage dispersion during the time period. Following Oaxaca and Ransom (1994), the
mean wage gap can be written as:
)( exp
)1ln(
*_
)1ln(
*_
(E)Part
)1ln(
*__
**
)ˆˆ()ˆˆ(ˆ)(lnln
UPartlainedUn
wwbb
Explained
Q
bwbw
bwwb
XXXXWW+∂+∂+
−+−+−=− βββββ (2)
Where Ww
represents the wages of the white-collar group (advantaged group) and Wb
represents the wages of the blue-collar group (disadvantaged group); ln(Qwb+1) is the
endowment component; ln(Dwb+1) = ln(δw*+1)+ln(δb*+1) is the remuneration or the
discrimination component; δw* and δb* are respectively the blue collar wage
disadvantage and white collar wage advantage associated with discrimination; and β* is
a set of benchmark coefficients equal to:
bw I^^
* )( βββ Ω−+Ω= (3)
representing a matrix of relative weights of the estimated vector of coefficients and the
identity matrix (I). A range of other choices have been suggested for the weighting
matrix Ω (Reimers (1983); Cotton (1988); Neumark (1988); Oaxaca and Ransom
(1994)).
The gross wage differential between white and blue collar workers across the time
period is 33 log wage points. We find training is associated positively with wage
dispersion14 and that the type of training is itself of little relevance for wage dispersion:
our widest category of training contributes little more than 1.9% of the overall wage
differentials. Cumulated training events that explicitly include general training, either
14 When the group of blue-collar workers is taken as the standard competitive (Ω=0) the portion of the measured wage gap due to coefficients differentials is smaller and the portion due to endowments differentials larger compared to using the white collar wage structure (Ω= 1). Even in this case, however, most of the wage differential is explained by measured productivity differentials across white and blue-collar workers.

14
financed by the employer or not, reveal a higher but still modest contribution (of up to
2.9%).
The results do not suggest that training is a major tool for reversing wage inequality
among workers. On the contrary, it seems that training is a contributor to the wage
dispersion across white and blue collar workers, even if the training program explicitly
includes general components that may be expected to increase the employee’s wage
offers across firms15. The implications of these findings may be further explored by
concentrating analyses on the returns to training for workers within skill and age bands.
Other studies have also found training to be positively associated with inequality,
beginning with the seminal work on income inequality and training by Chiswick and
Mincer (1972). Proxying training with years of labour market experience, they find
cyclical changes in employment had a major impact on labour market experience and on
income inequality in the US from 1939 (particularly so during years of the Great
Depression). Whilst they had limited data, they found income inequality was sensitive
to the rate of return to human capital (Chiswick and Mincer, 1972; page S47) and to the
age distribution of employees. They concluded that it is important to concentrate
analyses on the returns to training for workers within skill and age bands.
The implications of the human capital model for the relationship between trainings and
earnings over the life cycle (as the employee ages) are well known (Ben-Porath. 1967):
the time spent in post-school investment in human capital declines monotonically over
the life cycle, implying that the individual’s stock of human capital is increasing but at a
decreasing rate and that earnings will increase with age but at a decreasing rate.
Introducing depreciation into the model implies that skills may eventually depreciate at
a faster rate than investment and that net human capital will decline. Earnings functions
15 A limitation with the original Oaxaca and Blinder (1973) approach is that the wage gap is measured at the mean, thereby ignoring potential differences in the form of the entire wage distribution. The use of quantile regressions allow for the decomposition of the wage gap at different points of the wage distribution. We explored the relationship between wages and training (for all three of our training measures) using quantile regression techniques and did not find significant differences across the wage distribution. In our particular example, where we are interested in a comparison of high and low skill workers (rather than higher and lower waged workers, see Chzhen and Mumford, 2009) we believe that the Oaxaca and Blinder decomposition continues to be a valid and a pertinent approach.

15
are predicted to be concave with respect to age, and the logarithmic earnings profile to
be U shaped, (Polachek, 2003).
Periods of unemployment may constrain the process of post-school investment in
human capital, especially if this investment is primarily associated with on the job
training, resulting in flatter earnings functions over the life cycle (Polachek, 1975).
These periods on unemployment may be largely expected (for example, by those who
plan to take time off to raise children or those working in sectors that are particularly
affected by cyclical downturns or seasonal demand fluctuations) or they may be largely
unpredicted (due, for example, to structural change in the economy or periods of poor
health). As the individuals age, the accumulated effects of such spells become more
pronounced and greater earnings differences are found (Chiswick and Mincer, 1972).
The process may be confounded with the introduction of occupation based differences
in skill acquisition. For example, those expecting to spend time out of the labour market
to rear children may choose occupations with a lower skill depreciation rate and/or
skills that are also associated with increased productivity in their expected non-market
activity (such as the nurturing skills associated with infant year school teachers). If
structural changes in the economy (such as skilled bias technological changes) have
varying affects on different occupations intertemporally a more complex relationship
between earnings, training, age and occupation may arise. The inclusion of a more
extensive range of control variables in the augmented model (such as actual work
experience, gender, occupation and parental status) help to alleviate potential omitted
variable bias but would not be expected to fully capture these confounding effects. In an
attempt to further address some of these issues, we follow the example of Chiswick and
Mincer (1972) and next concentrate analyses on the returns to training for workers
within skill and age bands.
5. Wage Returns to Training within Groups
The white and blue-collar groups are further subdivided into three different age groups:
younger than thirty; between thirty and forty five, and older than forty-five years (i.e.
30<; 30-45; and >45). Table 4 presents the estimated wage returns from cumulated
training incidence split into training with current employer and training with previous
employers for the white-collar age groups (columns 1 to 3) and for the blue-collar age

16
groups (columns 4 to 6). The models presented in Table 4 are directly comparable to
those in Table 2, with the same set of control variables included (as listed in the
endnotes of the tables).
A striking result is found when different age bands of white and blue-collar employees
are examined. Cumulated training events are not statistically significantly related to
wages for either white or blue-collar workers who are younger than thirty years old. As
discussed above, the human capital model would predict that if an investment in human
capital via training is profitable, it will have a higher net value the earlier it is
undertaken, thereafter declining over time (Chiswick and Mincer, 1972 page S37). The
opportunity cost of engaging in training is also typically lower for younger employees
whose intertemporal earnings functions are generally still rising (Polacheck, 2008 page
174). The result that training events are not significantly related to wages for young
employees in Britain is therefore surprising.
Considering the white-collar employees in more detail, cumulated training events with
the current employer are found to be significantly related to wage increases for these
employees who are aged over 30. Whilst, all four of the training categories with the
previous employer have a negative, but rarely significant, relationship with wages with
white collar workers who are aged over 45 (as does total cumulated training with the
previous employee for those aged over 30).
For blue-collar employees, only training events with current employers are associated
with wage growth and this is true only for those employees aged between 30 and 45 (at
a significance level of 10%). Training events which explicitly include general training
has a similar relationship with wages for these workers but with less precision (at a
significance level of 15%). All four of the training categories with the previous
employer have a negative, but insignificant, relationship with wages for blue collar
workers aged over 30. No significant relationship is found between training incidence
and wages for the younger or older groups of blue collar workers.
Turning to consider training intensity (duration) by age and skill group, these results
(scaled by 100) are presented in Table 5 (and are comparable to the results in Table 3).
We again find that training intensity with current employee is positively associated with
17
wages for white collar employees (columns 1 to 3). For these workers who are aged
over 30, training with previous employer is typically associated with negative but
insignificant returns. For the younger white collar workers (aged under 30), training
intensity with previous employee is related to higher wages but only significantly so for
the measures of total accumulated training duration (with and without firm financing)
The results for training intensity are more extreme for blue collar workers (columns 4 to
6). For older blue collar workers there is no significant gain associated with training
intensity with their current employer and there are significant negative returns for
training intensity with their previous employer (regardless of training type or financing).
For younger blue collar workers there are only significant returns associated with
training intensity with current employer.
Taken in combination with the results presented in Table 4, for younger employees
(white or blue collar) it is important that their training events are more intense (longer
duration) and that this training takes place with their current employer. For those aged
between 30 and 45, longer training with current employee is generally associated with
higher returns for both skill groups. Whilst this is also true for older white collar
employees, we find no return from training (regardless of duration) for older blue collar
employees. Indeed, blue collar employees are found to face a significant wage penalty
associated with more intense training having occurred with previous employees.
The results reveal that the relationship between training (incidence and intensity), is not
uniform for white and blue collar employees nor is it constant over the working life of
an employee. Consequently, the impact of training policy may be distinct and/or have
very different impacts with respect to the age and the occupation of the recipients.
6. Conclusion
We use British household panel data from 1991 to 2005 to explore the wage returns
associated with training (both incidence and intensity) undertaken by employees
between 1998 and 2005. We find (after controlling for a range of individual and
workplace characteristics) estimated wage returns to a training incident for British
employees are typically small at less than 1%. Although, training courses that include

18
general components are associated with a higher wage as are training courses
undertaken with the current employer.
The relationship between training and wages is also found to differ according to the
occupation (white or blue-collar) and the age of the group of workers that participates in
the training programme. We find very limited evidence of wage returns from training
incidence for blue collar employees. This result contrasts with the range of positive
returns found for older (aged over 30) high skill employees. Training intensity
(duration) with current employer is found to be important for all white collar and for
younger (aged below 45) blue collar employees. However, we find no evidence that
training (incidence or duration) is associated with higher wages for older (above 45
years) blue collar employees.
White collar employees are shown to have higher training incidence and intensity than
do blue collar workers, suggesting a virtuous circle between training and wage growth
for white-collar employees (but not for blue-collar employees). Using decomposition
analysis, unequal returns associated with training for different skill groups are found to
contribute modestly to wage inequality across white and blue-collar employees in
Britain. These results imply that promoting equal access to training programs will not
reverse wage inequality in favour of blue collar workers. Indeed, it may exacerbate
wage inequality.
References Acemoglu, D and Pischke, J.S. (1999). ‘Beyond Becker: Training in imperfect labor
markets, The Economic Journal vol. 109, pp. F112-F142. Almeida-Santos, F. and Mumford, K. (2005). ‘Employee training and wage
compression in Britain’, The Manchester School vol. 73 (3), pp. 321-342. Ariga, K. and G. Brunello. (2006). Are the more educated receiving more training?
Evidence from Thailand. Industrial and Labor Relations Review, vol. 59 (4), pp. Arulampalam, W. Booth, A. and Bryan, M. (2004). ‘Are there asymmetries in the
effects of training on the conditional male wage distribution?’ IZA Discussion Paper No. 984.
Becker, G.S. (1962). ‘Investment in human capital: A theoretical analysis’, Journal of Political Economy vol. 70, pp. 9-49.
Becker, G.S. (1964). Human Capital: A Theoretical and Empirical Analysis, with Special Reference to Education (The University of Chicago Press, 3rd Edition, Chicago).

19
Ben-Porath, Y. (1967). ‘The production of human capital and the life cycle of earnings’, Journal of Political Economy, vol. 75, pp. 352-365.
Bishop, J.H. (1997). ‘What we know about employer-provided training? A review of the literature’, Research in Labor Economics vol.16, pp. 19-87.
Booth, A.L. and Bryan, M. L. (2007). ‘Who pays for general training in Private Sector Britain?’ Research in Labor Economics, vol. 26, pp. 83-121.
Chzhen, Y. and Mumford, K. (2009). ‘Decomposing gender gaps across earnings distributions in Britain.’ Mimeo, University of York.
Chiswick, B. and Mincer, J. (1972). ‘Time Series Changes in Income Inequality in the United States Since 1939, with Projections to 1985.’ Journal of Political Economy, Supplement vol. 80(2), pp. S34-S66.
Chiswick, B. (2003). ‘Jacob Mincer, experience and the distribution of earnings’, Review of Economics and the Household vol.1(4), pp. 343-362.
Clifton, J. (1997). ‘Constraining influences on the decision to participate in training: the importance of the non-work environment’, Cornell - Center for Advanced Human Resource Studies, Working paper no. 97-25.
Cotton, J. (1988). ‘On the decomposition of wage differentials’, Review of Economics and Statistics vol. 70, pp. 236-243.
Department of Trade and Industry. ( 2005). ‘Fairness at work. Chapter two. Business at Work’, retrieved from http://www.dti.gov.uk/er/fairness/part2.htm on 21/12/2005.
Frazis, H. and Loewenstein, M. A. (2005). ‘Reexamining the returns to training: Functional form, magnitude and interpretation’, Journal of Human Resources, vol. 40(2), pp. 435-452.
Gershuny, J. (2005). ‘Busyness as the badge of honor for the new super ordinate working class’, Social Research vol. 72(2), pp.287-314 .
Halpin, B. (2006). "BHPS Work-Life History Files, Version 2," mimeo, ISER, University of Essex, Colchester. Available online at UKDA (documentation for study 3954)
Keep, E. Mayhew, K. and Corney, M. (2002). ‘Review of the evidence on the rate of return to employers of investment in training and employer training measures’, SKOPE Research Paper Nº 34, (Summer), University of Warwick.
Lazear, E. and Oyer, P. (2004). ‘Internal and external labor markets: A personnel economics approach.’ Labour Economics 11(5), 527-554.
Leuven, E. (2002). ‘The economics of training: A survey of the literature’, mimeo, retrieved from http://www.fee.uva.nl/scholar/mdw/leuven/reviewart.pdf.
Leuven, E. (2004). ‘A review of the wage returns to private sector training’, EC-OECD Seminar on Human Capital and Labour Market Performance, Brussels.
Loewenstein, M.A. and Spletzer, J.R. (1998). ‘Dividing the costs and returns to general training’, Journal of Labor Economics vol. 16 (1), pp. 142-171.
Lynch, L. M. (1992a). ‘Differential effects of post-school training on early career mobility’, NBER Working Paper Series no. 4034.
Lynch, L. M. (1992b). ‘Private sector training and the earning of young workers’, American Economic Review, vol. 82(1), pp. 299-312;
Melero, E. (2004). ‘Evidence on training and career paths: human capital, information and incentives’, IZA Discussion Paper, no. 1377.
Mincer, J. (1958). ‘Investment in human capital and personal income distribution’, Journal of Political Economy, vol. 66(4), pp. 281-302;
Mincer, J. (1962). ‘On-the-job training: Costs, returns and some implications’, Journal of Political Economy, vol. 70(5) Part2, pp. S50-S79;

20
Mincer, J. (1970). ‘The distribution of labor incomes: A Survey with special reference to human capital approach’, The Journal of Economic Literature, vol. VII, (March), pp. 1-26.
Mincer, J. (1974). Schooling, Experience and Earnings, New York, Columbia University Press.
Mumford, K. and Smith, P.N. (2004). ‘Job tenure in Britain: Employee characteristics versus workplace effects’, Economica, vol. 71, pp. 275-298.
Neumark, D. (1988). ‘Employer’s discriminatory behavior and the estimation of wage discrimination’, Journal of Human Resources, vol. 23(3), pp. 279-295.
Oaxaca, R. L. (1973). ‘Male-female wage differentials in urban labor markets’, International Economic Review, vol. 14(3), pp. 693-709.
Oaxaca, R. L. and Ransom, M. R. (1994). ‘On discrimination and the decomposition of wage differentials’, Journal of Econometrics, vol. 61, pp. 5-24.
Ok, W. and Tergeist, P. (2002). ‘Supporting economic growth through continuous education and training – Some preliminary results’, Papers presented at the meeting of National Economic Research Organisations, OECD headquarters, Paris.
Pischke, J.S. (2001). ‘Continuous training in Germany’, Journal of Population Economics vol. 14, pp. 523-548.
Polachek, S. (1975). ‘Differences in Expected Post-School Investment as a Determinant of Market Wage Differentials.’ International Economic Review vol. 16 (2), pp. 451-70,
Polachek, S. (2003). ‘Mincer’s Overtaking Point and the Lifecycle Earnings Distribution.’ Review of Economics of the Household vol. 1 (4), pp. 273-304.
Polachek, S. (2006). “How the Human Capital Model Explains Why the Gender Wage Gap Narrowed.” Published in: F. Blau, M. Brinton, and D. Grusky, (eds.) The Declining Significance of Gender? ( New York: Russell Sage Foundation).
Polachek, S. (2008). ‘Earnings over the lifecycle: The Mincer earnings function and its applications.’ Foundations and Trends in Microeconomics 4 (3), 165-272.
Regan, T.L. and Oaxaca, R.L. (2009). ‘Work Experience as a Source of Specification Error in Earnings Models: Implications for Gender Wage Decompositions.’ Journal of Population Economics, 22 (2), 463 - 499.
Reimers, C. (1983). ‘Labor market discrimination against Hispanic and black men’, Review of Economics and Statistics, vol. 65, pp. 570-579.
Schǿne, P. (2004). ‘Why is the return to training so high?, Labour, vol. 18(3), pp.363-378.

21
Table 1. Variable Definitions and Means (1999-2005)
ALL WHITE-COLLAR BLUE-COLLAR
With Training With Training With Training
Mean Std Dev Mean Std Dev Mean Std Dev Mean Std Dev Mean Std Dev Mean Std Dev (1) (2) (3) (4) (1) (2) (3) (4) (1) (2) (3) (4)
(1) Individual employee characteristics
Years of experience 15.20 10.98 14.30 10.35 14.88 10.60 14.14 10.15 15.74 11.58 14.67 10.79
Age 39.54 11.08 38.28 10.61 39.29 10.81 38.39 10.51 39.96 11.51 38.02 10.83
Married 0.59 0.49 0.57 0.49 0.59 0.49 0.57 0.50 0.60 0.49 0.59 0.49
Female 0.51 0.50 0.55 0.50 0.59 0.49 0.61 0.49 0.38 0.49 0.42 0.49
White 0.98 0.15 0.97 0.17 0.97 0.17 0.97 0.18 0.98 0.13 0.98 0.14
having a child under 18 years old 0.42 0.49 0.42 0.49 0.41 0.49 0.40 0.49 0.44 0.50 0.47 0.50
Years of school 10.80 3.14 11.55 2.88 11.62 2.95 12.13 2.74 9.41 2.97 10.26 2.75
Years of tenure 5.13 6.08 4.31 5.38 4.55 5.42 3.91 4.87 6.12 6.95 5.20 6.29
Log Hours 3.49 0.38 3.52 0.34 3.49 0.34 3.51 0.31 3.50 0.43 3.52 0.39
Temporary job 0.03 0.17 0.03 0.18 0.03 0.18 0.03 0.18 0.03 0.17 0.03 0.17
Part time 0.18 0.39 0.15 0.36 0.18 0.38 0.15 0.35 0.19 0.39 0.17 0.37
Have a Vocational Qualification 0.42 0.49 0.46 0.50 0.44 0.50 0.46 0.50 0.40 0.49 0.46 0.50
Trained in previous 12 months 0.32 0.47 1.00 0.00 0.35 0.48 1.00 0.00 0.27 0.44 1.00 0.00
Number of training course – cumulated events 1998-2005 2.95 4.75 5.91 6.12 3.42 5.20 6.32 6.46 2.15 3.73 4.99 5.17
Participated in a general training course in the last year 0.28 0.45 0.87 0.34 0.31 0.46 0.87 0.33 0.23 0.42 0.85 0.35 Participated in a general training courses financed by employer in the last year 0.24 0.43 0.75 0.43 0.27 0.44 0.76 0.43 0.20 0.40 0.74 0.44
Number of general training course -cumulated events 98-05 1.91 2.68 3.81 3.16 2.18 2.83 4.00 3.24 1.45 2.33 3.36 2.93
--with current employer 0.74 1.53 1.72 2.10 0.83 1.62 1.77 2.15 0.60 1.35 1.60 1.97
--with previous employer 0.10 0.53 0.20 0.75 0.11 0.57 0.22 0.80 0.08 0.43 0.17 0.64 Number of general training course financed by the employer – cumulated events 98-05 1.65 2.50 3.31 3.07 1.89 2.65 3.49 3.16 1.26 2.16 2.93 2.82
--with current employer 0.65 1.44 1.51 2.00 0.73 1.52 1.56 2.06 0.53 1.27 1.41 1.88
--with previous employer 0.08 0.47 0.16 0.67 0.09 0.52 0.17 0.71 0.06 0.37 0.13 0.54
Days of training in previous 12 months 6.29 29.16 19.57 48.84 6.71 29.70 19.03 47.61 5.58 28.21 20.77 51.46 Days of training in a course with general components in the last year 5.53 27.56 17.19 46.49 5.86 27.94 16.60 45.09 4.97 26.90 18.49 49.44
Days of training in a course with general components financed by the employer in the last year 3.93 22.04 12.20 37.54 4.10 21.82 11.62 35.52 3.63 22.41 13.50 41.66

22
Table 1 (Cont.)
ALL WHITE-COLLAR BLUE-COLLAR
With Training With Training With Training
Mean Std Dev Mean Std Dev Mean Std Dev Mean Std Dev Mean Std Dev Mean Std Dev (1) (2) (3) (4) (1) (2) (3) (4) (1) (2) (3) (4)
Union member 0.33 0.47 0.39 0.49 0.32 0.47 0.39 0.49 0.35 0.48 0.40 0.49 Changed employer in the last year- either for a better job or was dismissed 0.07 0.25 0.07 0.26 0.07 0.25 0.07 0.25 0.07 0.25 0.08 0.26
Promoted in the last year 0.06 0.25 0.10 0.29 0.08 0.28 0.11 0.32 0.03 0.18 0.05 0.23 Occupations
Managers and Administrators 0.15 0.35 0.15 0.36 0.23 0.42 0.22 0.42 0.00 0.00 0.00 0.00
Professionals 0.10 0.30 0.14 0.35 0.16 0.37 0.21 0.41 0.00 0.00 0.00 0.00
Assoc. Professionals and Technicians 0.13 0.33 0.18 0.38 0.20 0.40 0.26 0.44 0.00 0.00 0.00 0.00
Clerical and Secretarial Occupations 0.18 0.39 0.17 0.37 0.29 0.45 0.24 0.43 0.00 0.00 0.00 0.00
Craft and Related Occupations 0.10 0.30 0.08 0.26 0.00 0.00 0.00 0.00 0.26 0.44 0.24 0.43
Personal and Protective Services Occupations 0.11 0.31 0.13 0.34 0.00 0.00 0.00 0.00 0.30 0.46 0.42 0.49
Sales and Related Occupations 0.07 0.26 0.05 0.21 0.11 0.32 0.07 0.25 0.00 0.00 0.00 0.00
Plants and Machines Operatives 0.09 0.28 0.06 0.23 0.00 0.00 0.00 0.00 0.24 0.42 0.19 0.39
Elementary Occupations 0.07 0.26 0.05 0.21 0.00 0.00 0.00 0.00 0.20 0.40 0.15 0.36 (2) Workplace characteristics Economic Sectors
Agriculture, Fishing, Mining; Electricity, Gas and Water 0.02 0.15 0.02 0.15 0.02 0.13 0.02 0.14 0.03 0.18 0.03 0.17
Manufacturing 0.18 0.39 0.14 0.35 0.13 0.33 0.11 0.31 0.28 0.45 0.22 0.41
Construction 0.04 0.20 0.04 0.19 0.02 0.15 0.02 0.15 0.07 0.26 0.07 0.26
Retail, Wholesale, Catering, Hospitality 0.17 0.38 0.11 0.32 0.19 0.39 0.12 0.32 0.14 0.35 0.10 0.30
Transport, storage and communication 0.06 0.24 0.05 0.22 0.05 0.22 0.04 0.20 0.09 0.28 0.07 0.25 Financial intermediation, Real state, renting and business activities 0.14 0.35 0.14 0.35 0.20 0.40 0.19 0.39 0.05 0.23 0.05 0.22
Public services and other sectors 0.37 0.48 0.49 0.50 0.40 0.49 0.50 0.50 0.34 0.47 0.46 0.50
Type of Organizations
Public organization 0.30 0.46 0.39 0.49 0.31 0.46 0.40 0.49 0.26 0.44 0.36 0.48
Private organization 0.67 0.47 0.56 0.50 0.64 0.48 0.54 0.50 0.71 0.45 0.61 0.49
Non-profitable organization 0.04 0.18 0.05 0.22 0.04 0.20 0.06 0.23 0.02 0.15 0.03 0.18
23
Table 1 (Cont.)
ALL WHITE-COLLAR BLUE-COLLAR
With Training With Training With Training
Mean Std Dev Mean Std Dev Mean Std Dev Mean Std Dev Mean Std Dev Mean Std Dev (1) (2) (3) (4) (1) (2) (3) (4) (1) (2) (3) (4)
Region London 0.06 0.25 0.07 0.25 0.08 0.27 0.08 0.27 0.04 0.20 0.05 0.21
Size of workplace
fewer than 25 employees 0.33 0.47 0.29 0.45 0.32 0.46 0.28 0.45 0.35 0.48 0.31 0.46
25-49 employees 0.15 0.35 0.15 0.36 0.14 0.34 0.14 0.35 0.16 0.37 0.17 0.37
50-99 employees 0.12 0.32 0.12 0.33 0.11 0.32 0.12 0.32 0.13 0.33 0.12 0.33
100-199 employees 0.10 0.31 0.10 0.30 0.10 0.31 0.10 0.30 0.11 0.31 0.10 0.30
200-499 employees 0.13 0.34 0.13 0.34 0.13 0.34 0.13 0.34 0.13 0.33 0.13 0.34
500-999 employees 0.07 0.25 0.07 0.26 0.07 0.26 0.08 0.27 0.06 0.23 0.06 0.24
1000+ employees 0.11 0.31 0.14 0.34 0.13 0.34 0.15 0.36 0.07 0.26 0.10 0.30
Real Wage
real (2005 prices) wage 10.22 6.44 11.05 6.47 11.57 7.13 12.10 6.83 7.94 4.16 8.71 4.82
log real (2005 prices) wage 2.18 0.52 2.27 0.50 2.30 0.53 2.37 0.50 1.97 0.43 2.06 0.45
Number of observations 34900 11221 21937 7740 12963 3481
24
Table 2. Earnings and training incidence (FE).
Dependent Variable: Log of real hourly wage
All White-Collar Blue-Collar
Training Incidence (1) (2) (3) (4) (5) (6)
Training t-1 0.0063*** - 0.0076*** - 0.0010 -(0.0012) - (0.0014) - (0.0024) -
Training t-1 in the current employer - 0.0077*** - 0.0081*** - 0.0031- (0.0017) - (0.0020) - (0.0034)
Training t-1 in the previous employer - -0.0016 - 0.0016 - -0.0099- (0.0054) - (0.0060) - (0.0122)
Employer financed training t-1 0.0061*** 0.0074*** 0.0010 (0.0012) (0.0014) (0.0025)
Employer financed training t-1 in the current employer
- 0.0081*** - 0.0085*** - 0.0033- (0.0017) - (0.0020) - (0.0035)
Employer financed training t-1 in the previous employer
- -0.0031 - 0.0008 - -0.0117- (0.0059) - (0.0062) - (0.0134)
General training t-1 0.0074*** - 0.0088*** - 0.0016 -(0.0013) - (0.0015) - (0.0028) -
General training t-1 in the current employer
- 0.0082*** - 0.0094*** - 0.0022- (0.0019) - (0.0022) - (0.0039)
General training t-1 in the previous employer
- 0.0009 - 0.0022 - -0.0077- (0.0059) - (0.0066) - (0.0139)
Employer financed general training t-1 0.0071*** - 0.0084*** - 0.0012 -(0.0013) - (0.0015) - (0.0026) -
Employer financed general training t-1 in the current employer
- 0.0085*** - 0.0095*** - 0.0023- (0.0019) - (0.0022) - (0.0041)
Employer financed general training t-1 in the previous employer
- -0.0010 - 0.0017 - -0.0155- (0.0065) - (0.0071) - (0.0155)
Observations 34900 21937 12963
Source: British Household Panel Survey, 1998 - 2005. Notes: Each entry in columns (1) to (6) measures marginal effects. **Statistically significant at 90%, and *** at 95% and above. All of the results are based upon robust standard errors. Controls are also included for: experience and experience squared, age and age squared, marital status, gender, race, having children, years of school, current job tenure and tenure squared, having permanent job, having a part time job, having vocational qualifications, being a union member, having changed employer in the previous 12 month, having been promoted with the same employer, year, economic sector, industry, size of workplace, and region.

25
Table 3. Earnings and training intensity (FE).
Dependent Variable: Log of real hourly wage
All White-Collar Blue-Collar
Training Intensity/100 (1) (2) (3) (4) (5) (6)
Training t-1 0.0249*** - 0.0275*** - 0.0161 - (0.0051) - (0.0062) - (0.0102) -
Training t-1 in the current employer - 0.0284*** - 0.0321*** - 0.0195** - (0.0064) - (0.0078) - (0.0117)
Training t-1 in the previous employer - 0.0087 - 0.0040 - 0.0092 - (0.0171) - (0.0227) - (0.0247)
Employer financed training t-1 0.0308*** - 0.0343*** - 0.0173 - (0.0058) - (0.0063) - (0.0123) -
Employer financed training t-1 in the current employer
- 0.0361*** - 0.0396*** - 0.0223 - (0.0075) - (0.0089) - (0.0146)
Employer financed training t-1 in the previous employer
- 0.0169 - 0.0157 - 0.0044 - (0.0198) - (0.0238) - (0.0419)
General training t-1 0.0273*** - 0.0282*** - 0.0231*** - (0.0055) - (0.0067) - (0.0109) -
General training t-1 in the current employer
- 0.0301*** - 0.0325*** - 0.0233** - (0.0070) - (0.0087) - (0.0130)
General training t-1 in the previous employer
- 0.0075 - -0.0051 - 0.0179 - (0.0178) - (0.0216) - (0.0268)
Employer financed general training t-1 0.0329*** - 0.0337*** - 0.0247** - (0.0059) - (0.0065) - (0.0129) -
Employer financed general training t-1 in the current employer
- 0.0373*** - 0.0392*** - 0.0270** - (0.0080) - (0.0096) - (0.0157)
Employer financed general training t-1 in the previous employer
- 0.0109 - 0.0022 - -0.0026 - (0.0196) - (0.0212) - (0.0545)
Observations 34900 21937 12963 Source: British Household Panel Survey, 1998 - 2005. Notes: Each entry in columns (1) to (6) measures marginal effects. **Statistically significant at 90%, and *** at 95% and above. All of the results are based upon robust standard errors. Controls are also included for: experience and experience squared, age and age squared, marital status, gender, race, having children, years of school, current job tenure and tenure squared, having permanent job, having a part time job, having vocational qualifications, being a union member, having changed employer in the previous 12 month, having been promoted with the same employer, year, economic sector, industry, size of workplace, and region.

26
Table 4. Earnings and training incidence, by age group (FE).
Dependent Variable: Log of real hourly wage
White-Collar Blue-Collar
Training Incidence <30 [30-45] >45 <30 [30-45] >45
(1) (2) (3) (4) (5) (6)
Training t-1 in the current employer 0.0073 0.0107*** 0.0072*** 0.0084 0.0080** -0.0003 (0.0057) (0.0030) (0.0034) (0.0095) (0.0047) (0.0070)
Training t-1 in the previous employer 0.0091 -0.0000 -0.0104 0.0106 -0.0222 -0.0369 (0.0119) (0.0082) (0.0175) (0.0182) (0.0250) (0.0277)
Employer financed training t-1 in the current employer
0.0041 0.0110*** 0.0073*** 0.0039 0.0081** 0.0009 (0.0061) (0.0030) (0.0033) (0.0100) (0.0046) (0.0077)
Employer financed training t-1 in the previous employer
0.0075 -0.0004 -0.0164 0.0059 -0.0319 -0.0284 (0.0117) (0.0089) (0.0175) (0.0229) (0.0272) (0.0275)
General training t-1 in the current employer 0.0094 0.0124*** 0.0072** 0.0060 0.0083 -0.0010
(0.0057) (0.0032) (0.0039) (0.0105) (0.0051) (0.0088) General training t-1 in the previous employer
0.0084 0.0044 -0.0272 0.0044 -0.0149 -0.0454 (0.0141) (0.0089) (0.0203) (0.0196) (0.0288) (0.0341)
Employer financed general training t-1 in the current employer
0.0071 0.0119*** 0.0082*** 0.0025 0.0078 0.0011 (0.0062) (0.0033) (0.0039) (0.0112) (0.0051) (0.0098)
Employer financed general training t-1 in the previous employer
0.0063 0.0059 -0.0387** -0.0032 -0.0405 -0.0339 (0.0136) (0.0096) (0.0212) (0.0245) (0.0320) (0.0352)
Observations 4806 10526 6605 2848 5769 4346 Source: British Household Panel Survey, 1998 - 2005. Notes: Each entry in columns (1) to (8) measures marginal effects. **Statistically significant at 90%, and *** at 95% and above. All of the results are based upon robust standard errors. Controls are also included for: experience and experience squared, age and age squared, marital status, gender, race, having children, years of school, current job tenure and tenure squared, having permanent job, having a part time job, having vocational qualifications, being a union member, having changed employer in the previous 12 month, having been promoted with the same employer, year, economic sector, industry, size of workplace, and region.

27
Table 5. Earnings and training intensity, by age group (FE).
Dependent Variable: Log of real hourly wage
White-Collar Blue-Collar
Training Days/100 <30 [30-45] >45 <30 [30-45] >45
(1) (2) (3) (4) (5) (6)
Training t-1 in the current employer 0.0494*** 0.0243** 0.0238** 0.0582*** 0.0331*** -0.0247 (0.0141) (0.0130) (0.0126) (0.0233) (0.0166) (0.0220)
Training t-1 in the previous employer 0.0737*** -0.0257* 0.0141 0.0253 -0.0005 -0.1619*** (0.0355) (0.0171) (0.0774) (0.0421) (0.1028) (0.0692)
Employer financed training t-1 in the current employer
0.0450*** 0.0264** 0.0429*** 0.0728*** 0.0390*** -0.0293 (0.0160) (0.0159) (0.0108) (0.0261) (0.0185) (0.0273)
Employer financed training t-1 in the previous employer
0.0722*** -0.0330** -0.0586 0.0011 0.0024 -0.4915*** (0.0366) (0.0191) (0.0677) (0.0994) (0.0755) (0.1998)
General training t-1 in the current employer
0.0518*** 0.0244** 0.0259** 0.0690*** 0.0359*** -0.0141 (0.0158) (0.0145) (0.0142) (0.0251) (0.0177) (0.0250)
General training t-1 in the previous employer
0.0408 -0.0238 0.0555 0.0315 0.0532 -0.1559*** (0.0412) (0.0176) (0.0787) (0.0546) (0.0797) (0.0651)
Employer financed general training t-1 in the current employer
0.0485*** 0.0082 0.0431*** 0.0724*** 0.0333 -0.0135 (0.0177) (0.0216) (0.0109) (0.0299) (0.0228) (0.0344)
Employer financed general training t-1 in the previous employer
0.0370 -0.0291*** -0.0267 0.0063 -0.0876 -0.4549*** (0.0432) (0.0092) (0.1273) (0.1562) (0.2011) (0.1747)
Observations 4806 10526 6605 2848 5769 4346
Source: British Household Panel Survey, 1998 - 2005. Notes: Each entry in columns (1) to (8) measures marginal effects. **Statistically significant at 90%, and *** at 95% and above. All of the results are based upon robust standard errors. Controls are also included for: experience and experience squared, age and age squared, marital status, gender, race, having children, years of school, current job tenure and tenure squared, having permanent job, having a part time job, having vocational qualifications, being a union member, having changed employer in the previous 12 month, having been promoted with the same employer, year, economic sector, industry, size of workplace, and region.