wage dispersion and productive efficiency: evidence for sweden
TRANSCRIPT
Wage Dispersion and Productive Efficiency:Evidence For Sweden
Douglas A. Hibbs, Jr.Department of Economics, Göteborg University
andHåkan Locking
Department of Management and Economics, Växjö University
Working Papers in Economics no 212000-01-24
Department of EconomicsGöteborg University
forthcoming in -RXUQDO�RI�/DERU�(FRQRPLFV, October 2000
$EVWUDFWThe effects of wage dispersion on productive efficiency is a topic rich in theoreticalconjecture, a common object of Scandinavian polemical debate and at the same time an issuealmost barren of systematic econometric evidence. The Swedish record of enormouscompression of relative wages under the institutional regime of centralized solidaritybargaining, followed by substantial de-compression of wages after central bargaining brokedown, supplies observations well suited for empirical testing of theories and assertions aboutthe response of productive efficiency to shifts in wage distribution. Results presented in thispaper obtained from regression experiments based on distribution-augmented production andlabor productivity functions yield no support of ‘fairness, morale and cohesiveness’ theoriesimplying that wage leveling within workplaces and industries may enhance productivity. Wedo find substantial evidence, however, that reduction of inter-industry wage differentialscontributed positively to aggregate output and productivity growth, most likely for thestructural reasons first emphasized by leading Swedish trade union economists almost a halfcentury ago.
Keywords: productivity; wages; distribution
JEL Codes: J23; J31; J51; L16
Correspondence To: Douglas A. Hibbs, Jr., Department of Economics, Göteborg University,Box 640, SE 405 30 Göteborg, Sweden;e-mail: [email protected]
11
Wage Dispersion And Productive Efficiency: Evidence For Sweden*
1. Introduction
From 1956 up to 1983, without interruption, two peak bargaining organizations, LO1 for
workers and SAF2 for employers, negotiated detailed “framework” wage agreements covering
the entire blue-collar labor force in Swedish private industry.3 Equality of wage distribution
was a vital union goal, and wage dispersion data indicate that during this era of centralized
“solidarity” bargaining LO succeeded in obtaining large changes in the structure of relative
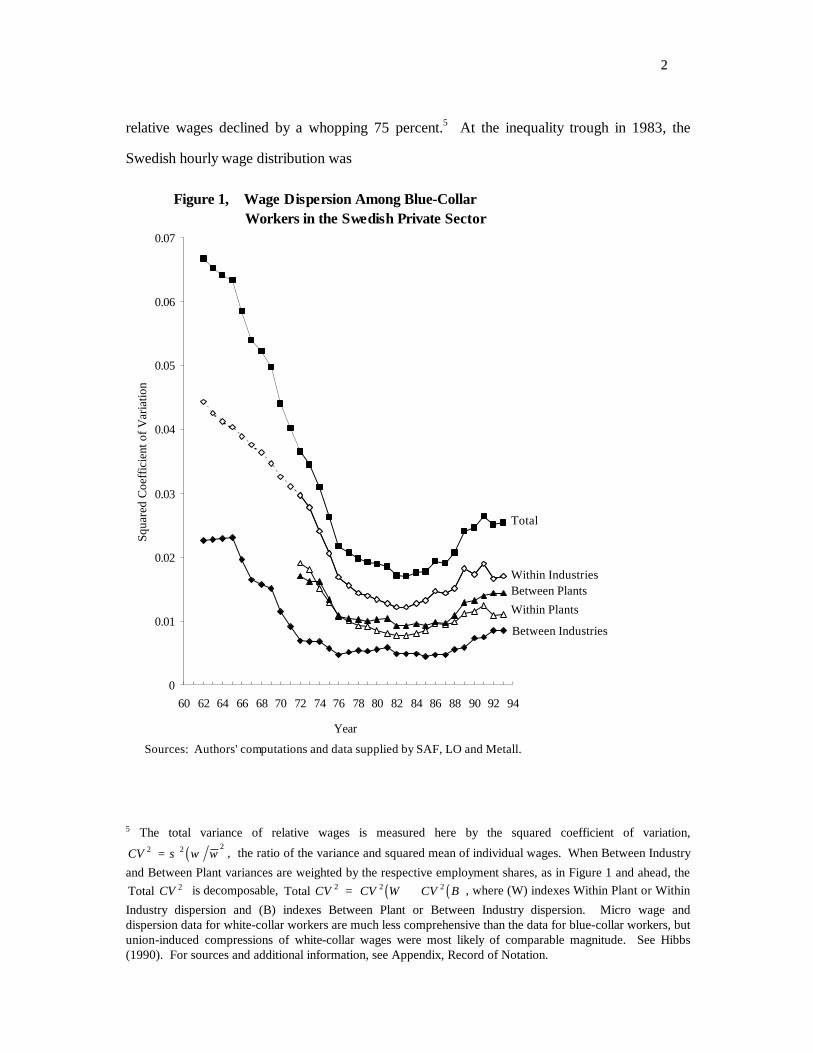
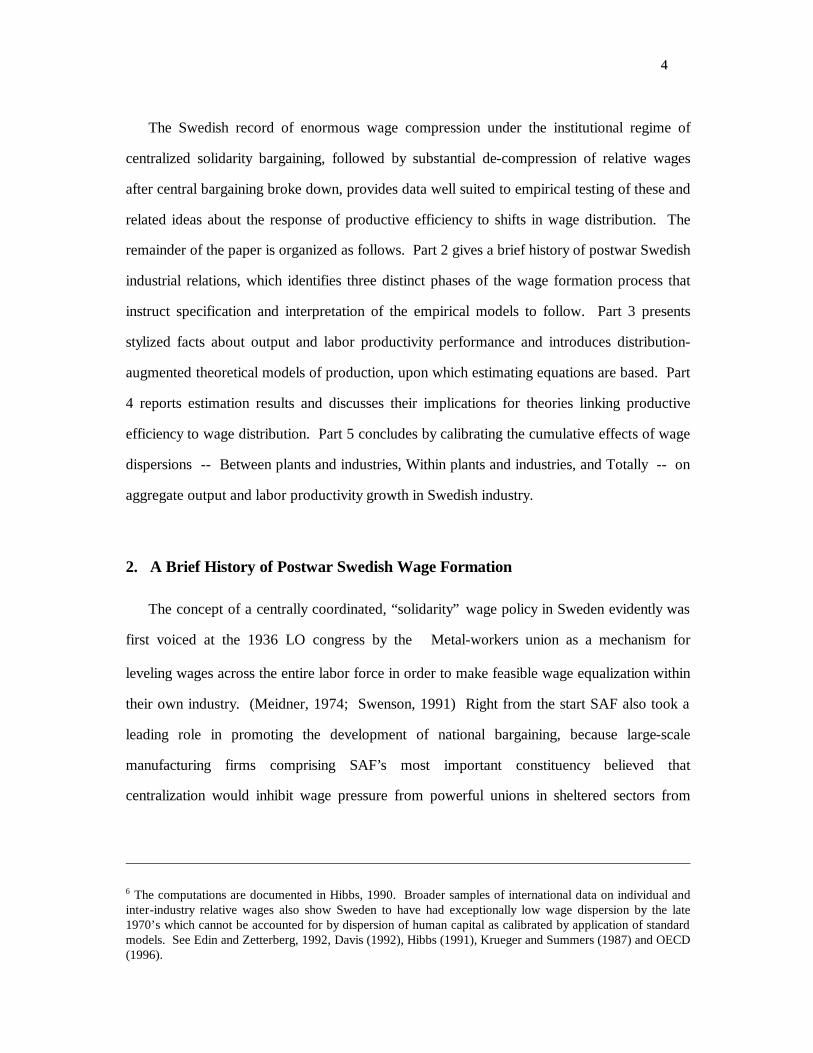
wages.4 In fact, as the data graphed in Figure 1 illustrate, between the early 1960’s and the
breakdown of central wage formation in the early 1980’s, the total variance of blue-collar
* The authors are grateful to the Swedish Council for Social Science Research (HSFR), the Ministry of Labor (EFA) and the Jan Wallander Foundation for grants to Hibbs supporting our research on Swedish wage formation, to authorities at LO, Metall and SAF for making available to us micro wage data and wage dispersion statistics, and to Jonas Agell, David Levine, Alan Manning, Pascal Petit, David Soskice, Anders Vredin and participants at seminars at the Australian National University, the University of California, Berkeley, University of California, Los Angeles, Stockholm School of Economics, the Norwegian School of Business, the University of Trondheim, the Trade Union Institute for Economic Research and the Science Center Berlin for comments on earlier drafts of the paper. Hibbs also thanks the International Center for Economic Research, Torino, for providing a most congenial research environment during early phases of the research. 1 The central organization of blue-collar unions. 2The central confederation of private employers. 3 The system is more precisely described as a highly integrated, three-tier process: a central framework agreement negotiated by LO and SAF (or SAF and PTK, the central organization of private white-collar workers), followed by industry bargaining, and then plant level negotiations to implement the arrangements contracted above. LO and SAF and their constituent organizations acted like a single organization engaging in multi-level bargaining and throughout the paper we refer to this tri-level process as the ‘centralized’ institutional regime. More details on institutional arrangements are given in Hibbs (1990) and Nilsson (1993). 4 Extensive evidence that wage dispersion trends were driven by central agreements incorporating LO’s egalitarian objectives, rather than by normal market forces, is given in Edin and Topel, 1997, Hibbs, 1991, Hibbs, 1990 and Jonsson and Siven, 1986. Hibbs and Locking, 1996, develop and test a model of LO-SAF bargaining in which LO’s wage compression goal plays a key role.
22
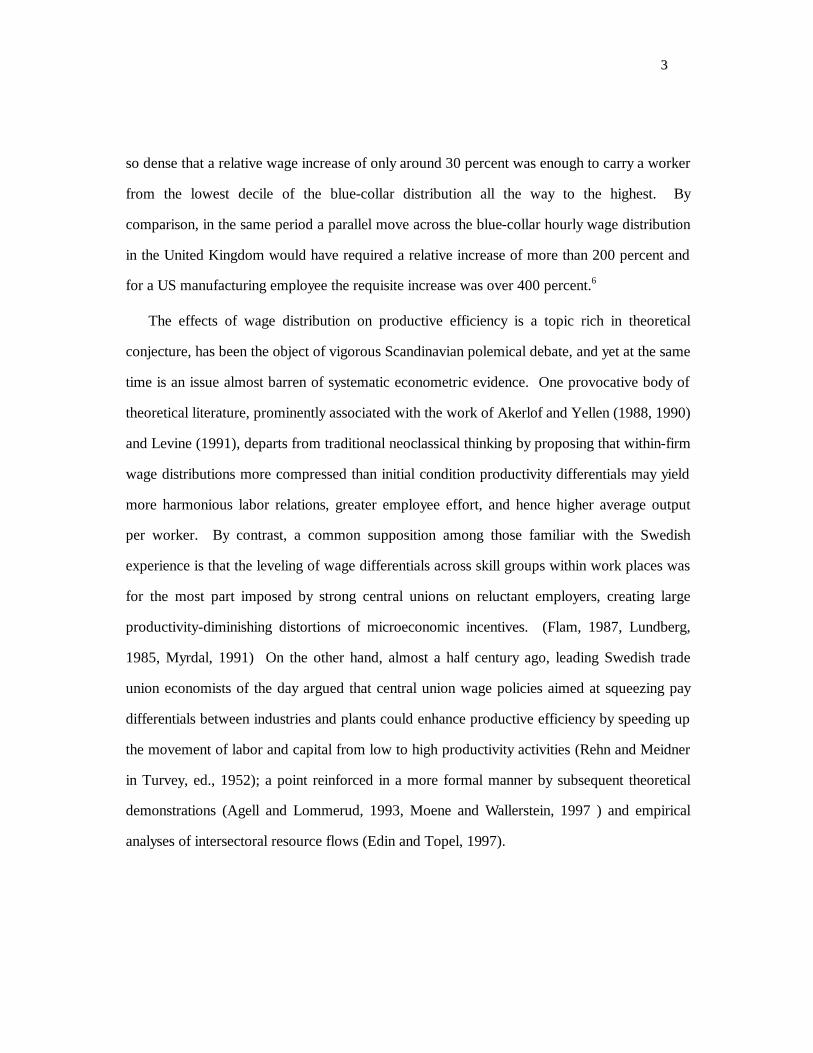
relative wages declined by a whopping 75 percent.5 At the inequality trough in 1983, the
Swedish hourly wage distribution was
0
0.01
0.02
0.03
0.04
0.05
0.06
0.07
60 62 64 66 68 70 72 74 76 78 80 82 84 86 88 90 92 94
Year
Squa
red
Coe
ffic
ient
of V
aria
tion
Figure 1, Wage Dispersion Among Blue-Collar Workers in the Swedish Private Sector
Sources: Authors' computations and data supplied by SAF, LO and Metall.
Total
Within Plants
Within IndustriesBetween Plants
Between Industries
5 The total variance of relative wages is measured here by the squared coefficient of variation,
( )CV w w2 2 2= σ , the ratio of the variance and squared mean of individual wages. When Between Industry and Between Plant variances are weighted by the respective employment shares, as in Figure 1 and ahead, the Total CV 2 is decomposable, ( ) ( )Total CV CV W CV B2 2 2= + , where (W) indexes Within Plant or Within Industry dispersion and (B) indexes Between Plant or Between Industry dispersion. Micro wage and dispersion data for white-collar workers are much less comprehensive than the data for blue-collar workers, but union-induced compressions of white-collar wages were most likely of comparable magnitude. See Hibbs (1990). For sources and additional information, see Appendix, Record of Notation.
33
so dense that a relative wage increase of only around 30 percent was enough to carry a worker
from the lowest decile of the blue-collar distribution all the way to the highest. By
comparison, in the same period a parallel move across the blue-collar hourly wage distribution
in the United Kingdom would have required a relative increase of more than 200 percent and
for a US manufacturing employee the requisite increase was over 400 percent.6
The effects of wage distribution on productive efficiency is a topic rich in theoretical
conjecture, has been the object of vigorous Scandinavian polemical debate, and yet at the same
time is an issue almost barren of systematic econometric evidence. One provocative body of
theoretical literature, prominently associated with the work of Akerlof and Yellen (1988, 1990)
and Levine (1991), departs from traditional neoclassical thinking by proposing that within-firm
wage distributions more compressed than initial condition productivity differentials may yield
more harmonious labor relations, greater employee effort, and hence higher average output
per worker. By contrast, a common supposition among those familiar with the Swedish
experience is that the leveling of wage differentials across skill groups within work places was
for the most part imposed by strong central unions on reluctant employers, creating large
productivity-diminishing distortions of microeconomic incentives. (Flam, 1987, Lundberg,
1985, Myrdal, 1991) On the other hand, almost a half century ago, leading Swedish trade
union economists of the day argued that central union wage policies aimed at squeezing pay
differentials between industries and plants could enhance productive efficiency by speeding up
the movement of labor and capital from low to high productivity activities (Rehn and Meidner
in Turvey, ed., 1952); a point reinforced in a more formal manner by subsequent theoretical
demonstrations (Agell and Lommerud, 1993, Moene and Wallerstein, 1997 ) and empirical
analyses of intersectoral resource flows (Edin and Topel, 1997).
44
The Swedish record of enormous wage compression under the institutional regime of
centralized solidarity bargaining, followed by substantial de-compression of relative wages
after central bargaining broke down, provides data well suited to empirical testing of these and
related ideas about the response of productive efficiency to shifts in wage distribution. The
remainder of the paper is organized as follows. Part 2 gives a brief history of postwar Swedish
industrial relations, which identifies three distinct phases of the wage formation process that
instruct specification and interpretation of the empirical models to follow. Part 3 presents
stylized facts about output and labor productivity performance and introduces distribution-
augmented theoretical models of production, upon which estimating equations are based. Part
4 reports estimation results and discusses their implications for theories linking productive
efficiency to wage distribution. Part 5 concludes by calibrating the cumulative effects of wage
dispersions -- Between plants and industries, Within plants and industries, and Totally -- on
aggregate output and labor productivity growth in Swedish industry.
2. A Brief History of Postwar Swedish Wage Formation
The concept of a centrally coordinated, “solidarity” wage policy in Sweden evidently was
first voiced at the 1936 LO congress by the Metal-workers union as a mechanism for
leveling wages across the entire labor force in order to make feasible wage equalization within
their own industry. (Meidner, 1974; Swenson, 1991) Right from the start SAF also took a
leading role in promoting the development of national bargaining, because large-scale
manufacturing firms comprising SAF’s most important constituency believed that
centralization would inhibit wage pressure from powerful unions in sheltered sectors from
6 The computations are documented in Hibbs, 1990. Broader samples of international data on individual and inter-industry relative wages also show Sweden to have had exceptionally low wage dispersion by the late 1970’s which cannot be accounted for by dispersion of human capital as calibrated by application of standard models. See Edin and Zetterberg, 1992, Davis (1992), Hibbs (1991), Krueger and Summers (1987) and OECD (1996).
55
spilling over to wage settlements in the competitive, traded goods sectors.7 By the 1950’s
these objectives had taken strong institutional form and, as already noted, between 1956 and
1983 LO and SAF forged framework agreements specifying the wages of all private blue-
collar workers.
The history of Swedish wage formation since the 1950’s is usefully divided into three
phases: Two phases of centralized, solidarity bargaining associated with the enormous
compression of relative wages just reviewed, followed in the last dozen years by a regime of
decentralized industry and local level bargaining during which wage dispersion rapidly
escalated.
2.1 Phase I: Wage Leveling Between Industries and Plants
In the initial phase of solidarity bargaining, which dates from the first comprehensive
framework agreement in 1956 up to the end of the 1960’s, central bargaining was guided by
the principle of “equal pay for equal work” regardless of firms’ profitability or “ability to pay”,
as advocated in the late 1940’s and early 1950’s by the LO economists Gösta Rehn and Rudolf
Meidner. Under Phase I solidarity wage policy, weak industries and firms were therefore not
permitted to survive by paying wages commensurate with their sub-par productivity and
profitability. An active labor market policy, providing extensive job placement and retraining
services, would ease the pain to dislocated workers created by the forced demise of inefficient
firms as human and physical resources flowed to more efficient ones. Consistent with the
policy, wage equalization during the 1960’s in comparison to later years was
disproportionately between industries and plants, rather than within industries and plants and
across occupations and skill grades. (See Figure 1 above and Table 1 below)
7 In fact, SAF’s initial adamant insistence on centralization was probably decisive to its implementation. As an LO official would later observe: “SAF’s uncompromising [favorable] attitude on the question of a central wage bargain was immensely helpful to us. Without this position we would not have been able to convince the unions.” (Heclo and Madsen, 1987, galley copy at p.115)
66
The effects of Phase I central union pay policy may explain at least partly why wage levels
across firms and industries in Sweden, by contrast to the United States and other countries
with decentralized industrial relations, exhibit no “non-competitive” correlations with
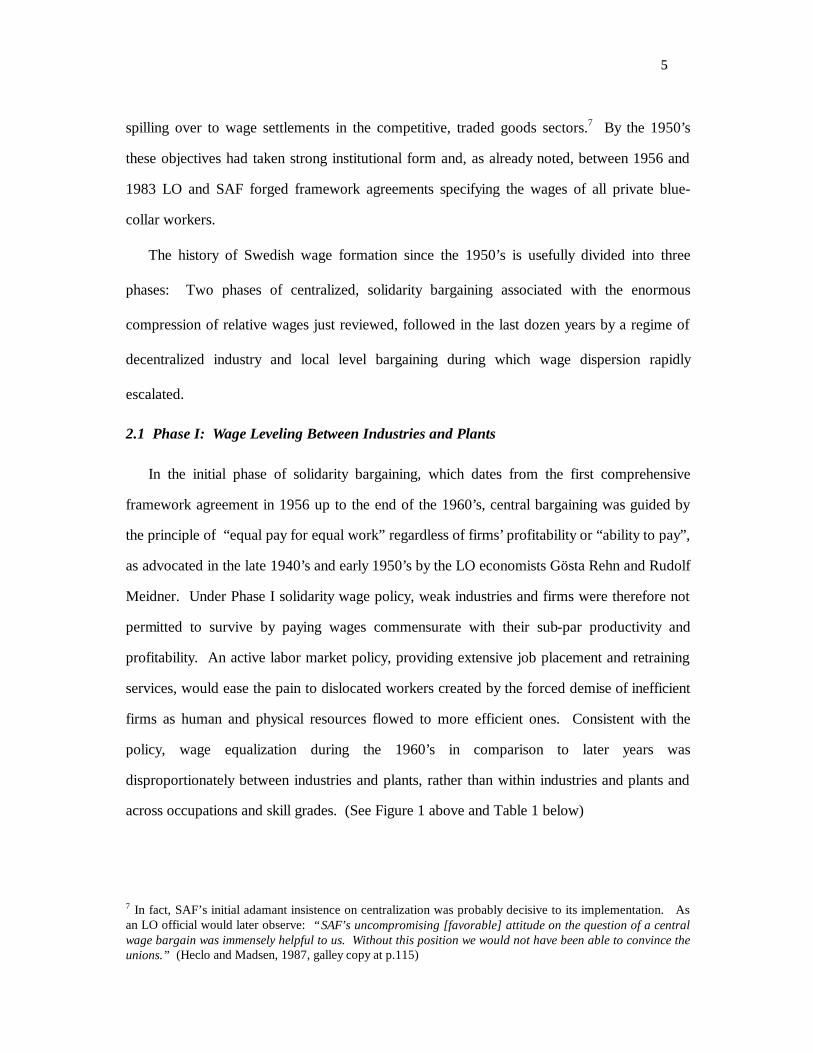
profitability, average productivity and capital intensity. Figure 2 presents 1983 data for
Swedish industrial firms documenting the absence of any relation between net value added per
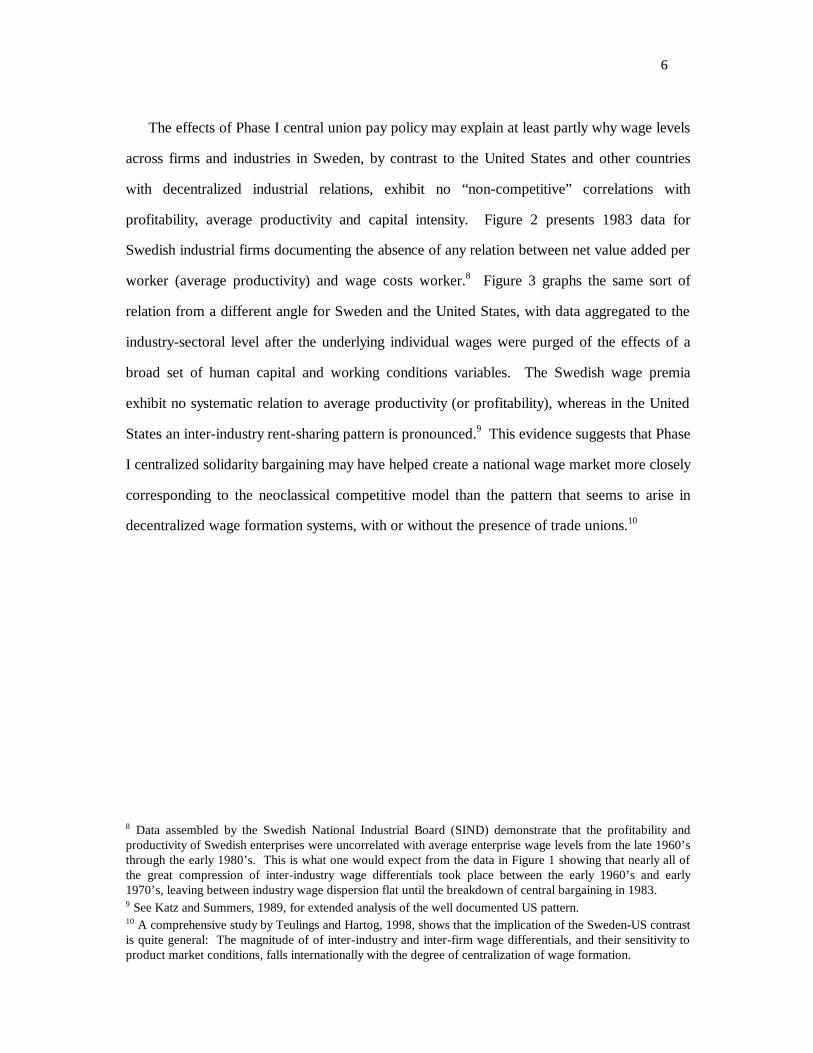
worker (average productivity) and wage costs worker.8 Figure 3 graphs the same sort of
relation from a different angle for Sweden and the United States, with data aggregated to the
industry-sectoral level after the underlying individual wages were purged of the effects of a
broad set of human capital and working conditions variables. The Swedish wage premia
exhibit no systematic relation to average productivity (or profitability), whereas in the United
States an inter-industry rent-sharing pattern is pronounced.9 This evidence suggests that Phase
I centralized solidarity bargaining may have helped create a national wage market more closely
corresponding to the neoclassical competitive model than the pattern that seems to arise in
decentralized wage formation systems, with or without the presence of trade unions.10
8 Data assembled by the Swedish National Industrial Board (SIND) demonstrate that the profitability and productivity of Swedish enterprises were uncorrelated with average enterprise wage levels from the late 1960’s through the early 1980’s. This is what one would expect from the data in Figure 1 showing that nearly all of the great compression of inter-industry wage differentials took place between the early 1960’s and early 1970’s, leaving between industry wage dispersion flat until the breakdown of central bargaining in 1983. 9 See Katz and Summers, 1989, for extended analysis of the well documented US pattern. 10 A comprehensive study by Teulings and Hartog, 1998, shows that the implication of the Sweden-US contrast is quite general: The magnitude of of inter-industry and inter-firm wage differentials, and their sensitivity to product market conditions, falls internationally with the degree of centralization of wage formation.
77
0
50
100
150
200
250
300
350
400
450
0 10 20 30 40 50 60 70 80 90 100 110 120 130 140 150
Swed
ish
Kro
nor (
1000
s)
Net Value Added
Average Wage Cost
Figure 2, Wage Costs and Net Value Added Per Employee, Sweden 1983
Source: SIND, Stockholm
Industrial Firms Ordered by Intervals of Net Value Added per Employee
3
3.5
4
4.5
5
5.5
-20 -10 0 10 20 30 40Percentage Wage Premium
Log
Val
ue a
dded
per
Wor
ker (
US,
Dol
lars
)an
d pe
r Hou
r (Sw
eden
, Kro
nor)
Sources: Computed by authors from data in Edin and Zetterberg (1992), Katz and Summers (1989) and Statistics Sweden (1993).
Figure 3, Value Added and Net Inter–Industry Wage Premia, Sweden and US, 1984
US
Sweden

88
Non-compensating profit- and productivity-related wage premia obviously provide an
incentive for labor to migrate out of stagnating sectors to expanding and efficient ones, at the
cost of ‘wage-taxing’ profitable enterprises. But LO’s Phase I wage policy could in principle
achieve the same efficiency enhancing movements of labor (and capital) by squeezing such
wage premia to nil, thereby depriving older or inherently unproductive enterprises of a cheap
labor lifeline without imposing any relative wage tax on newer, more profitable ones. For this
reason the policy has been interpreted theoretically as akin to an industrial policy that
rewarded “sunrise industries” (Agell and Lommerud, 1993) which, if wage levels were
sufficiently restrained in the expanding sectors, might have boosted industrial output as well as
productivity growth (Moene and Wallerstein, 1997). Hence stylized interpretations of the
Phase I union pay policy appear to have some attractive properties in theory. Whether an
egalitarian wage formation regime that essentially sacrificed the carrot of wage premia in favor
of the stick of wage-induced shrinkage and outright bankruptcy in practice benefited aggregate
output as well as productivity performance, however, is controversial.11 At bottom the issue
can only be resolved empirically.
2.2 Phase II: Wage Leveling Within Industries and Plants
At the end of the 1960’s wage solidarity took a more radically egalitarian form, moving
away from the initial concept of leveling wages among jobs of comparable difficulty, risk and
skill, in the direction of compressing relative wages more or less across-the-board. The shift
to Phase II solidarity wage policy, which might be caricatured as a transformation of the idea
11 For example, Erik Lundberg, among the most eminent postwar Swedish economists, asserted (without reference to systematic evidence): “The rapid rise in productivity, especially during the second half of the 1960’s [Phase I policy], was achieved at the cost of growth in total industrial production.” (1985, p.20) Jonsson and Siven, make the same assertion: “...increase in productivity in industry has occurred at the price of lower industrial employment and stagnating industrial output.” (1986, p.98)

99
"equal pay for equal work" to "equal pay for all work",12 was marked by a concerted drive to
improve the relative wages of the low paid, which clearly shows up in the distributional
profiles of the central wage agreements negotiated by LO with SAF. (See Hibbs, 1990 and
Hibbs and Locking, 1996) Framework agreements with pronounced low wage provisions
were a distinguishing feature of wage formation in Sweden from 1969-70 all the way up to
1983, when central bargaining broke down and the emphasis on equality in the wage formation
process began to diminish.
By contrast to Phase I solidarity policy, which as noted above was associated with deep
compressions of wage differentials between industries and plants, Phase II policy promoted
dramatic leveling of relative wages within plants and industries and across occupations and
skill grades. (Direct evidence of inter-occupational wage leveling is reported in Hibbs, 1991,
Jonsson and Siven, 1986 and Lindbeck, 1983.) Although LO for the most part exercised
leadership in the drive for wage leveling, the central private white collar union cartel, PTK,
followed suit (especially the unions representing public sector white collar workers and lower
echelon clerical employees), and probably for pretty much the same reason: During these
years most Swedish trade union leaders and large numbers of their members shared a deep
ideological commitment to equality.13
It is easy by appeal to economic first principles to identify unattractive consequences of
union-imposed wage leveling that opens up large gaps between wage and marginal
productivity distributions (See Flam, 1987, and Siven, 1987 for arguments oriented to
Swedish experience), though, as noted in the introduction and expanded upon in part 3 ahead,
“morale and cohesiveness” theories propose that within-firm wage compression may enhance
productive efficiency (Akerloff and Yellen, 1988, Levine, 1991). In any case, the
12 Our use of ‘caricatured’ may be unnecessarily reserved. Rudolf Meidner, LO’s former Director of Research, described the policy shift as “a simple striving for the elimination of all wage differentials, however caused.” (Meidner, 1974, p.41) 13 Some data on union members’ preferences about wage leveling are reported in Olsson (1989), chapter 6.
1100
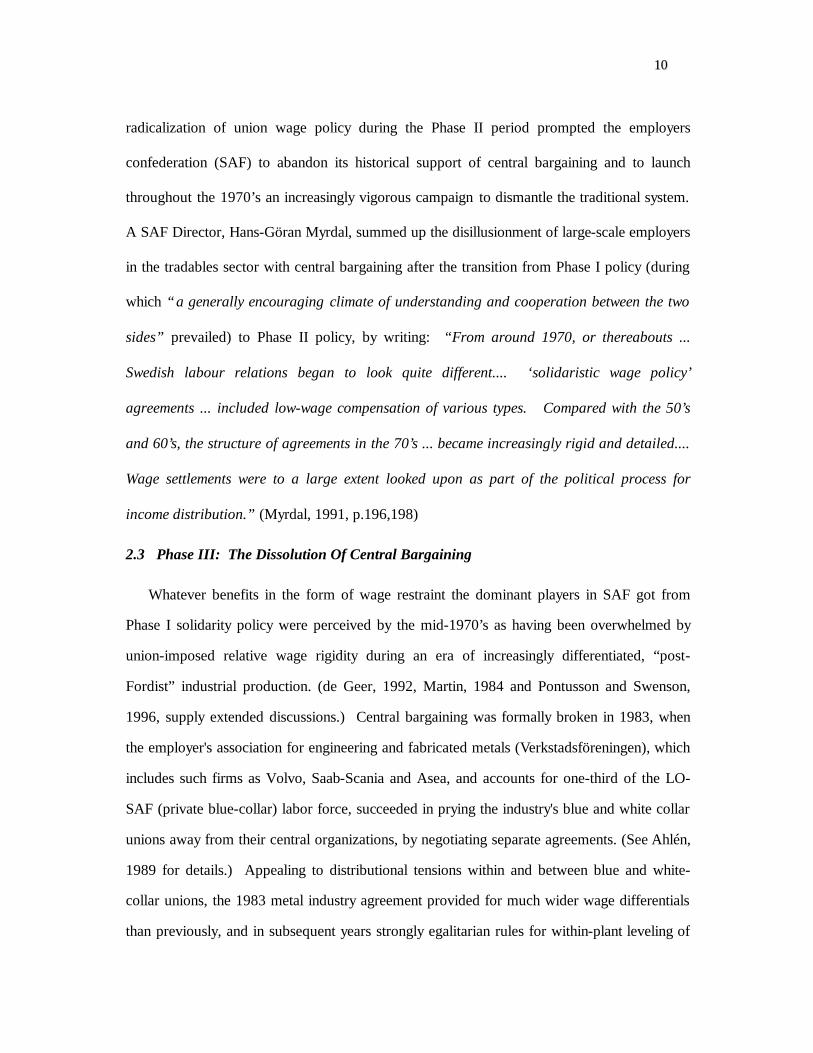
radicalization of union wage policy during the Phase II period prompted the employers
confederation (SAF) to abandon its historical support of central bargaining and to launch
throughout the 1970’s an increasingly vigorous campaign to dismantle the traditional system.
A SAF Director, Hans-Göran Myrdal, summed up the disillusionment of large-scale employers
in the tradables sector with central bargaining after the transition from Phase I policy (during
which “a generally encouraging climate of understanding and cooperation between the two
sides” prevailed) to Phase II policy, by writing: “From around 1970, or thereabouts ...
Swedish labour relations began to look quite different.... ‘solidaristic wage policy’
agreements ... included low-wage compensation of various types. Compared with the 50’s
and 60’s, the structure of agreements in the 70’s ... became increasingly rigid and detailed....
Wage settlements were to a large extent looked upon as part of the political process for
income distribution.” (Myrdal, 1991, p.196,198)
2.3 Phase III: The Dissolution Of Central Bargaining
Whatever benefits in the form of wage restraint the dominant players in SAF got from
Phase I solidarity policy were perceived by the mid-1970’s as having been overwhelmed by
union-imposed relative wage rigidity during an era of increasingly differentiated, “post-
Fordist” industrial production. (de Geer, 1992, Martin, 1984 and Pontusson and Swenson,
1996, supply extended discussions.) Central bargaining was formally broken in 1983, when
the employer's association for engineering and fabricated metals (Verkstadsföreningen), which
includes such firms as Volvo, Saab-Scania and Asea, and accounts for one-third of the LO-
SAF (private blue-collar) labor force, succeeded in prying the industry's blue and white collar
unions away from their central organizations, by negotiating separate agreements. (See Ahlén,
1989 for details.) Appealing to distributional tensions within and between blue and white-
collar unions, the 1983 metal industry agreement provided for much wider wage differentials
than previously, and in subsequent years strongly egalitarian rules for within-plant leveling of
1111
wages, the hallmark of Phase II solidarity wage policy, disappeared from industrial wage
agreements.
After 1982 central influence on wages therefore began to dissolve and Sweden
experienced a change of wage formation regime -- from tri-level bargaining with powerful
central coordination, to a system dominated by industry and firm-level bargaining. Although
central ‘wage frames’ covering the whole private blue collar work force were negotiated by
LO and SAF in 1985 and 1986-87, the agreements were largely notional. Parties at industry
negotiations were under no obligation to adhere to the distributional profiles of the frames,
which in any event contained no ‘low wage’ rules for within-plant, inter-occupational leveling.
Traditional equality-oriented solidarity bargaining, which expired de facto in 1983, was
terminated de jure in 1990 when the SAF Board of Directors simply shut down its bargaining
unit. The devolution of power over wage setting to industry and local levels meant that
central union authorities lost the institutional capacity to promote egalitarian wage policies. At
the same time strong local and industrial unions, no longer constrained by central framework
contracts, were free to exercise their market power in subnational bargaining. The ideas of
“different pay for different work,” extra compensation for the (high-skilled) “wrongly paid”
and earnings based on company profitability (“ability to pay”) began to drive the wage
formation process. Consequently, as Edin and Holmlund’s (1995) empirical work shows, after
1983 a correlation began to arise between firm and industry wage levels and productivity and
profitability.
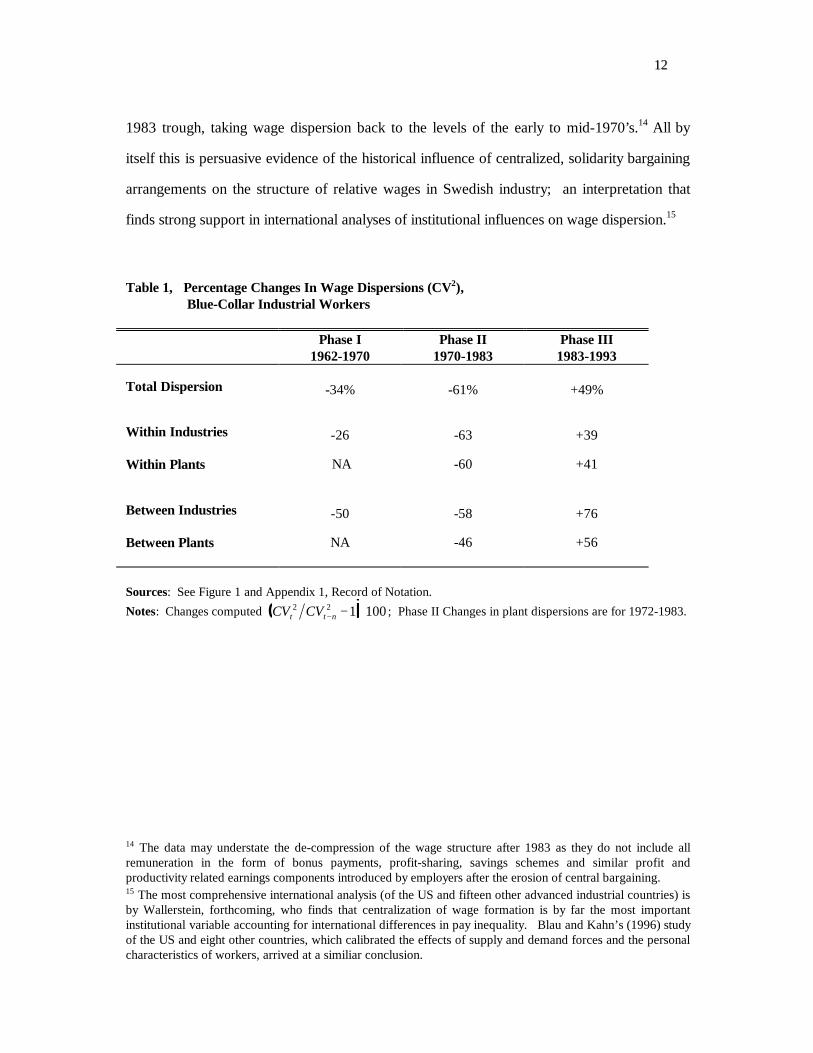
The Phase III shift to decentralized bargaining arrangements is readily identified in the
wage dispersion data graphed in Figure 1. (Also see the computations in Table 1 below.)
1983 marks the end of the decades long history of wage leveling. By the early 1990’s the
variance of relative wages among LO-SAF workers had risen by almost 50 percent from the
1122
1983 trough, taking wage dispersion back to the levels of the early to mid-1970’s.14 All by
itself this is persuasive evidence of the historical influence of centralized, solidarity bargaining
arrangements on the structure of relative wages in Swedish industry; an interpretation that
finds strong support in international analyses of institutional influences on wage dispersion.15
14 The data may understate the de-compression of the wage structure after 1983 as they do not include all remuneration in the form of bonus payments, profit-sharing, savings schemes and similar profit and productivity related earnings components introduced by employers after the erosion of central bargaining. 15 The most comprehensive international analysis (of the US and fifteen other advanced industrial countries) is by Wallerstein, forthcoming, who finds that centralization of wage formation is by far the most important institutional variable accounting for international differences in pay inequality. Blau and Kahn’s (1996) study of the US and eight other countries, which calibrated the effects of supply and demand forces and the personal characteristics of workers, arrived at a similiar conclusion.
Table 1, Percentage Changes In Wage Dispersions (CV2), Blue-Collar Industrial Workers Phase I
1962-1970 Phase II
1970-1983 Phase III 1983-1993
Total Dispersion
-34%
-61%
+49%
Within Industries
-26 -63 +39
Within Plants NA -60 +41
Between Industries
-50 -58 +76
Between Plants NA -46 +56 Sources: See Figure 1 and Appendix 1, Record of Notation. Notes: Changes computed CV CVt t n
2 2 1 100− − ⋅d i ; Phase II Changes in plant dispersions are for 1972-1983.
1133
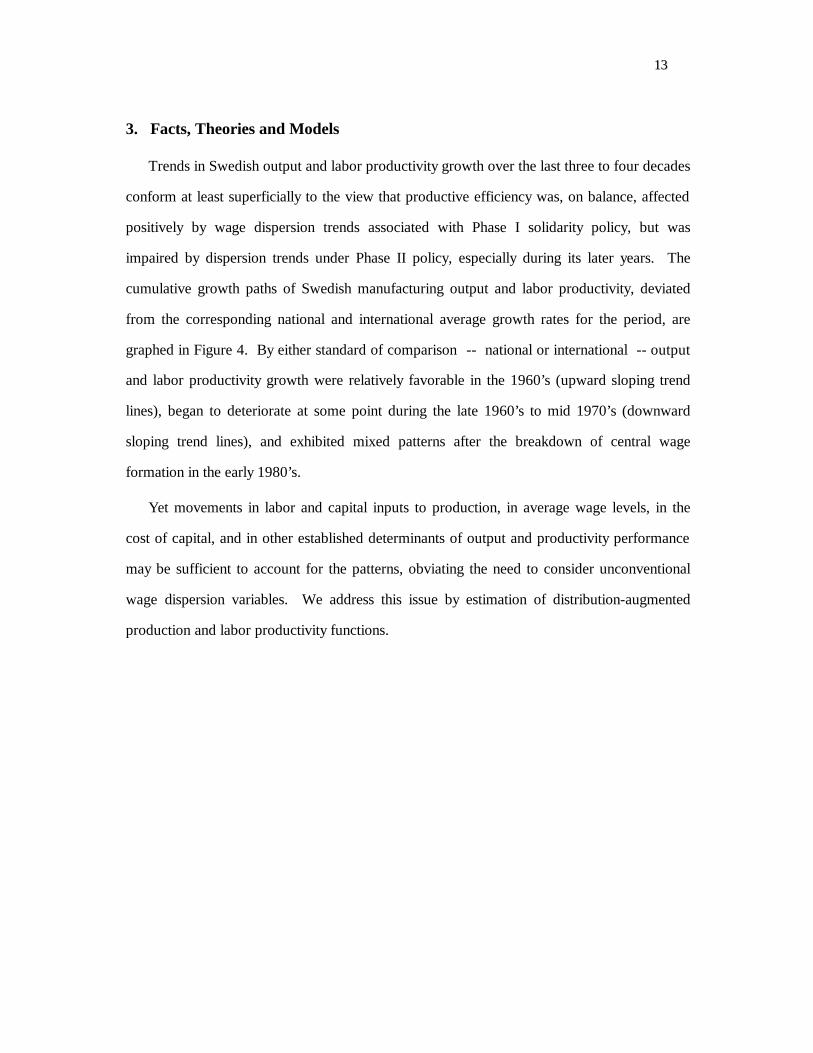
3. Facts, Theories and Models
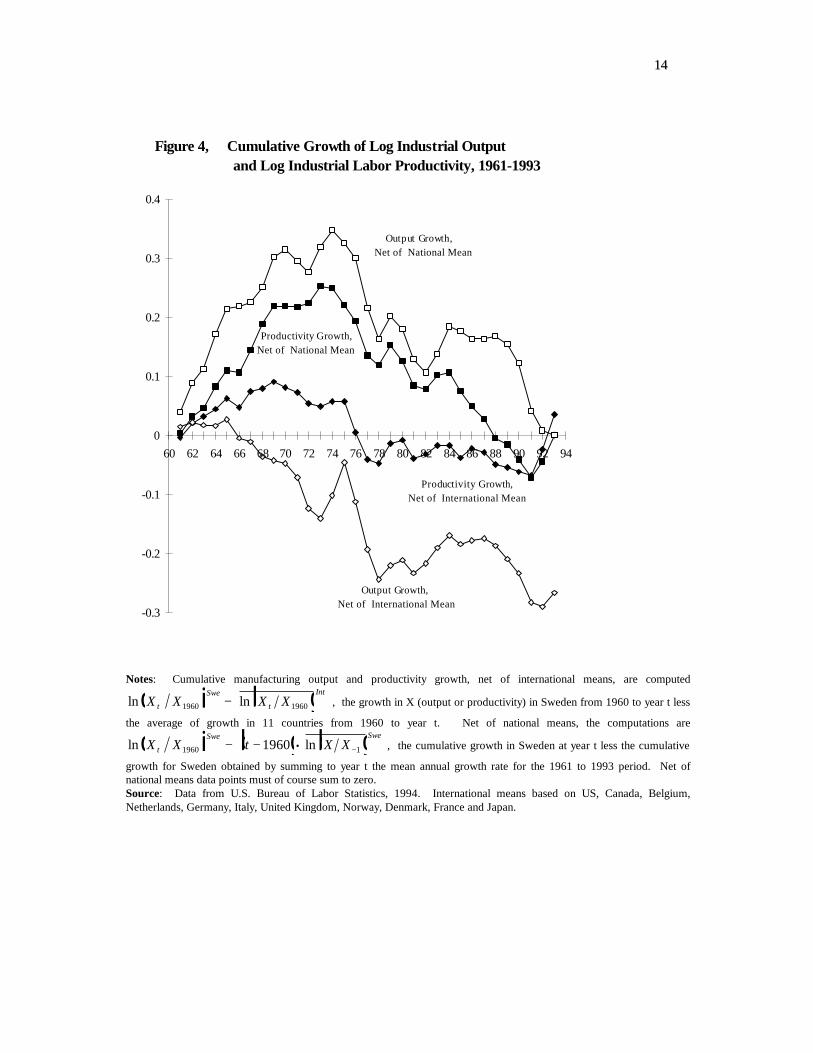
Trends in Swedish output and labor productivity growth over the last three to four decades
conform at least superficially to the view that productive efficiency was, on balance, affected
positively by wage dispersion trends associated with Phase I solidarity policy, but was
impaired by dispersion trends under Phase II policy, especially during its later years. The
cumulative growth paths of Swedish manufacturing output and labor productivity, deviated
from the corresponding national and international average growth rates for the period, are
graphed in Figure 4. By either standard of comparison -- national or international -- output
and labor productivity growth were relatively favorable in the 1960’s (upward sloping trend
lines), began to deteriorate at some point during the late 1960’s to mid 1970’s (downward
sloping trend lines), and exhibited mixed patterns after the breakdown of central wage
formation in the early 1980’s.
Yet movements in labor and capital inputs to production, in average wage levels, in the
cost of capital, and in other established determinants of output and productivity performance
may be sufficient to account for the patterns, obviating the need to consider unconventional
wage dispersion variables. We address this issue by estimation of distribution-augmented
production and labor productivity functions.
1144
-0.3
-0.2
-0.1
0
0.1
0.2
0.3
0.4
60 62 64 66 68 70 72 74 76 78 80 82 84 86 88 90 92 94
Figure 4, Cumulative Growth of Log Industrial Output and Log Industrial Labor Productivity, 1961-1993
Output Growth, Net of International Mean
Productivity Growth,Net of International Mean
Output Growth, Net of National Mean
Productivity Growth,Net of National Mean
Notes: Cumulative manufacturing output and productivity growth, net of international means, are computed
ln lnX X X Xt
Swe
t
Int
1960 1960d i b g− , the growth in X (output or productivity) in Sweden from 1960 to year t less
the average of growth in 11 countries from 1960 to year t. Net of national means, the computations are
ln lnX X t X Xt
Swe Swe
1960 11960d i b g b g− − • − , the cumulative growth in Sweden at year t less the cumulative
growth for Sweden obtained by summing to year t the mean annual growth rate for the 1961 to 1993 period. Net of national means data points must of course sum to zero. Source: Data from U.S. Bureau of Labor Statistics, 1994. International means based on US, Canada, Belgium, Netherlands, Germany, Italy, United Kingdom, Norway, Denmark, France and Japan.
1155
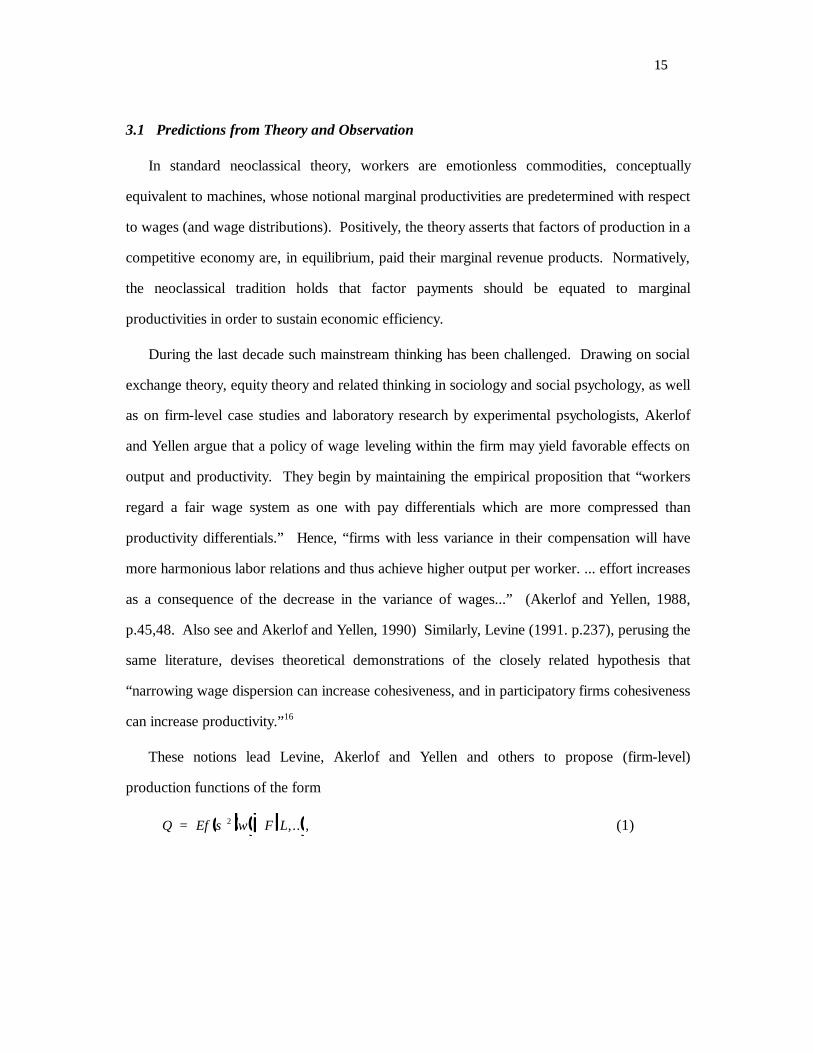
3.1 Predictions from Theory and Observation
In standard neoclassical theory, workers are emotionless commodities, conceptually
equivalent to machines, whose notional marginal productivities are predetermined with respect
to wages (and wage distributions). Positively, the theory asserts that factors of production in a
competitive economy are, in equilibrium, paid their marginal revenue products. Normatively,
the neoclassical tradition holds that factor payments should be equated to marginal
productivities in order to sustain economic efficiency.
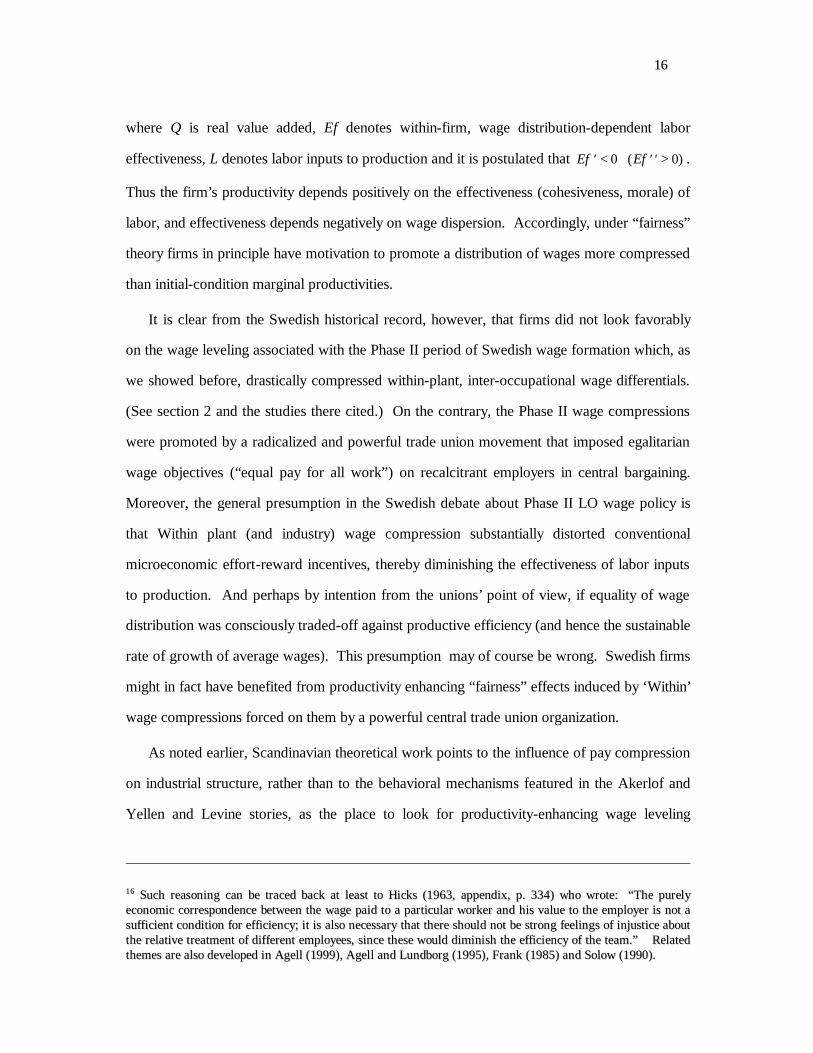
During the last decade such mainstream thinking has been challenged. Drawing on social
exchange theory, equity theory and related thinking in sociology and social psychology, as well
as on firm-level case studies and laboratory research by experimental psychologists, Akerlof
and Yellen argue that a policy of wage leveling within the firm may yield favorable effects on
output and productivity. They begin by maintaining the empirical proposition that “workers
regard a fair wage system as one with pay differentials which are more compressed than
productivity differentials.” Hence, “firms with less variance in their compensation will have
more harmonious labor relations and thus achieve higher output per worker. ... effort increases
as a consequence of the decrease in the variance of wages...” (Akerlof and Yellen, 1988,
p.45,48. Also see and Akerlof and Yellen, 1990) Similarly, Levine (1991. p.237), perusing the
same literature, devises theoretical demonstrations of the closely related hypothesis that
“narrowing wage dispersion can increase cohesiveness, and in participatory firms cohesiveness
can increase productivity.”16
These notions lead Levine, Akerlof and Yellen and others to propose (firm-level)
production functions of the form
Q Ef w F L= σ 2 b gd i b g,.. , (1)
1166
where Q is real value added, Ef denotes within-firm, wage distribution-dependent labor
effectiveness, L denotes labor inputs to production and it is postulated that Ef Ef′< ′′>0 0( ) .
Thus the firm’s productivity depends positively on the effectiveness (cohesiveness, morale) of
labor, and effectiveness depends negatively on wage dispersion. Accordingly, under “fairness”
theory firms in principle have motivation to promote a distribution of wages more compressed
than initial-condition marginal productivities.
It is clear from the Swedish historical record, however, that firms did not look favorably
on the wage leveling associated with the Phase II period of Swedish wage formation which, as
we showed before, drastically compressed within-plant, inter-occupational wage differentials.
(See section 2 and the studies there cited.) On the contrary, the Phase II wage compressions
were promoted by a radicalized and powerful trade union movement that imposed egalitarian
wage objectives (“equal pay for all work”) on recalcitrant employers in central bargaining.
Moreover, the general presumption in the Swedish debate about Phase II LO wage policy is
that Within plant (and industry) wage compression substantially distorted conventional
microeconomic effort-reward incentives, thereby diminishing the effectiveness of labor inputs
to production. And perhaps by intention from the unions’ point of view, if equality of wage
distribution was consciously traded-off against productive efficiency (and hence the sustainable
rate of growth of average wages). This presumption may of course be wrong. Swedish firms
might in fact have benefited from productivity enhancing “fairness” effects induced by ‘Within’
wage compressions forced on them by a powerful central trade union organization.
As noted earlier, Scandinavian theoretical work points to the influence of pay compression
on industrial structure, rather than to the behavioral mechanisms featured in the Akerlof and
Yellen and Levine stories, as the place to look for productivity-enhancing wage leveling
1166 SSuucchh rreeaassoonniinngg ccaann bbee ttrraacceedd bbaacckk aatt lleeaasstt ttoo HHiicckkss ((11996633,, aappppeennddiixx,, pp.. 333344)) wwhhoo wwrroottee:: ““TThhee ppuurreellyy eeccoonnoommiicc ccoorrrreessppoonnddeennccee bbeettwweeeenn tthhee wwaaggee ppaaiidd ttoo aa ppaarrttiiccuullaarr wwoorrkkeerr aanndd hhiiss vvaalluuee ttoo tthhee eemmppllooyyeerr iiss nnoott aa ssuuffffiicciieenntt ccoonnddii ttiioonn ffoorr eeffffiicciieennccyy;; iitt iiss aallssoo nneecceessssaarryy tthhaatt tthheerree sshhoouulldd nnoott bbee ssttrroonngg ffeeeelliinnggss ooff iinnjjuussttiiccee aabboouutt tthhee rreellaattiivvee ttrreeaattmmeenntt ooff ddiiffffeerreenntt eemmppllooyyeeeess,, ssiinnccee tthheessee wwoouulldd ddiimmiinniisshh tthhee eeffffiicciieennccyy ooff tthhee tteeaamm..”” RReellaatteedd tthheemmeess aarree aallssoo ddeevveellooppeedd iinn AAggeellll ((11999999)),, AAggeellll aanndd LLuunnddbboorrgg ((11999955)),, FFrraannkk ((11998855)) aanndd SSoollooww ((11999900))..

1177
effects. In Swedish context, this means looking to the Phase I LO wage policy (“equal pay for
equal work”), which squeezed wage differentials between industries and plants, potentially
accelerating the flow of labor and capital out of low productivity enterprises.
Our empirical analyses of aggregate industrial productive efficiency therefore admit the
possibility of ‘good’ (efficiency increasing) and ‘bad’ (efficiency diminishing) wage
compressions by decomposing the variance of individual relative wages Within and Between
plants and industries
Ef Ef CV W CV B= 2 2b g b gd i, , (2)
where, as before, CV W2 b g denotes the Within component and CV B2 b g the Between
component of the total variance of relative wages (squared coefficient of variation) among
workers arrayed by industries or plants. The behavioral reasoning of Akerlof and Yellen and
Levine, which pertains mainly to enterprise wage structures, implies that compression of
wages Within plants (and Within industries17) may enhance productive efficiency,
∂ ∂Ef CV W2 0b g < , and is silent about the effects of wage dispersions Between plants (or
Between industries), ∂ ∂Ef CV B2 b g . Results obtained in a number of structurally oriented
Scandinavian theoretical models (Agell and Lommerud, 1993; Flam, 1987; Moene and
Wallerstein, 1997), as well as the conventionally grounded observations of partisans to
Swedish central bargaining (for example, Myrdal, 1991), are taken together more compatible
with the hypotheses that Within plant and Within industry wage leveling adversely affected
productive efficiency, ∂ ∂Ef CV W2 0b g > , whereas union policies achieving compression of
wages Between plants and industries exerted favorable effects, ∂ ∂Ef CV B2 0b g < .
17 Though Akerloff and Yellen, like Levine, write mostly about relations within firms or workplaces, they occasionally also refer to industries (“...in industries where it is advantageous to pay some employees highly, it is considered fair [by employees] to also pay other employees well.” 1988, p.44). Their reasoning therefore seems to imply ( )∂ ∂Ef CV W2 0< for wage data arrayed by industries as well as plants.
1188
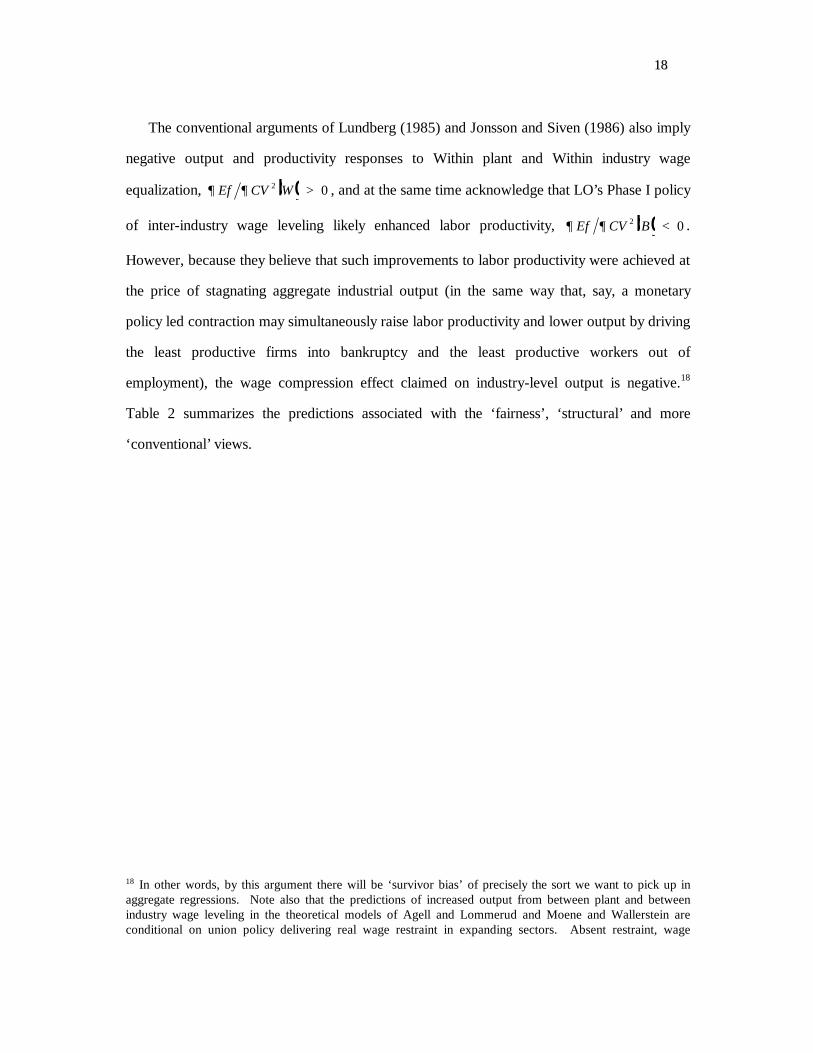
The conventional arguments of Lundberg (1985) and Jonsson and Siven (1986) also imply
negative output and productivity responses to Within plant and Within industry wage
equalization, ∂ ∂Ef CV W2 0b g > , and at the same time acknowledge that LO’s Phase I policy
of inter-industry wage leveling likely enhanced labor productivity, ∂ ∂Ef CV B2 0b g < .
However, because they believe that such improvements to labor productivity were achieved at
the price of stagnating aggregate industrial output (in the same way that, say, a monetary
policy led contraction may simultaneously raise labor productivity and lower output by driving
the least productive firms into bankruptcy and the least productive workers out of
employment), the wage compression effect claimed on industry-level output is negative.18
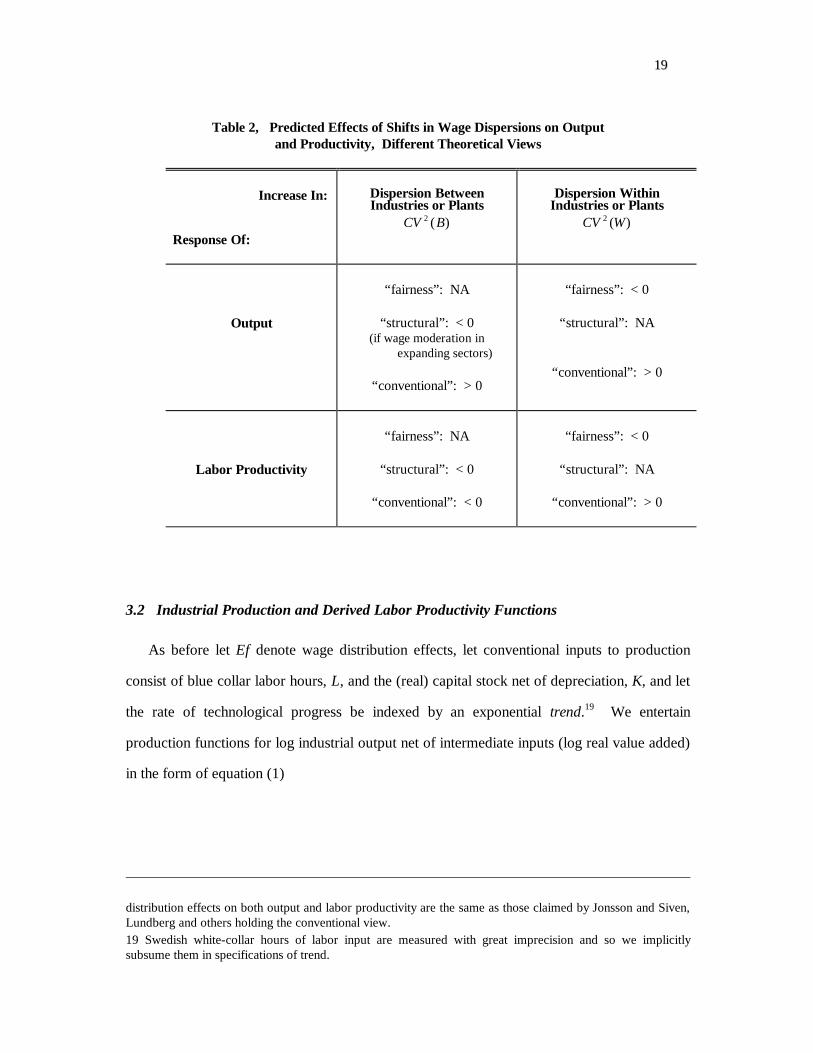
Table 2 summarizes the predictions associated with the ‘fairness’, ‘structural’ and more
‘conventional’ views.
18 In other words, by this argument there will be ‘survivor bias’ of precisely the sort we want to pick up in aggregate regressions. Note also that the predictions of increased output from between plant and between industry wage leveling in the theoretical models of Agell and Lommerud and Moene and Wallerstein are conditional on union policy delivering real wage restraint in expanding sectors. Absent restraint, wage
1199
Table 2, Predicted Effects of Shifts in Wage Dispersions on Output and Productivity, Different Theoretical Views
Increase In:
Response Of:
Dispersion Between Industries or Plants
CV B2 ( )
Dispersion Within
Industries or Plants CV W2 ( )
Output
“fairness”: NA
“structural”: < 0
(if wage moderation in expanding sectors)
“conventional”: > 0
“fairness”: < 0
“structural”: NA
“conventional”: > 0
Labor Productivity
“fairness”: NA
“structural”: < 0
“conventional”: < 0
“fairness”: < 0
“structural”: NA
“conventional”: > 0
3.2 Industrial Production and Derived Labor Productivity Functions
As before let Ef denote wage distribution effects, let conventional inputs to production
consist of blue collar labor hours, L, and the (real) capital stock net of depreciation, K, and let
the rate of technological progress be indexed by an exponential trend.19 We entertain
production functions for log industrial output net of intermediate inputs (log real value added)
in the form of equation (1)
distribution effects on both output and labor productivity are the same as those claimed by Jonsson and Siven, Lundberg and others holding the conventional view. 19 Swedish white-collar hours of labor input are measured with great imprecision and so we implicitly subsume them in specifications of trend.
2200
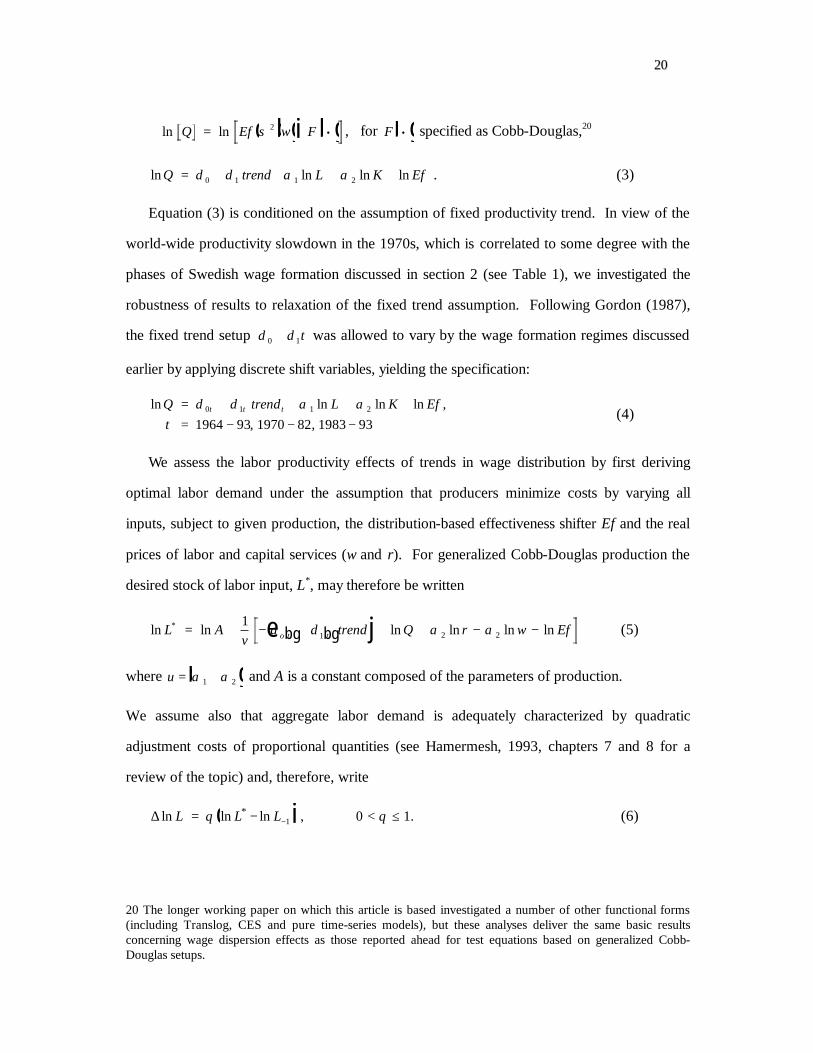
ln lnQ Ef w F= •σ 2 b gd i b g , for F •b g specified as Cobb-Douglas,20
ln ln ln lnQ trend L K Ef= + + + +δ δ α α0 1 1 2 . (3)
Equation (3) is conditioned on the assumption of fixed productivity trend. In view of the
world-wide productivity slowdown in the 1970s, which is correlated to some degree with the
phases of Swedish wage formation discussed in section 2 (see Table 1), we investigated the
robustness of results to relaxation of the fixed trend assumption. Following Gordon (1987),
the fixed trend setup δ δ0 1+ t was allowed to vary by the wage formation regimes discussed
earlier by applying discrete shift variables, yielding the specification:
ln ln ln ln ,
, ,Q trend L K Ef= + + + +
= − − −δ δ α α
ττ τ τ0 1 1 2
1964 93 1970 82 1983 93 (4)
We assess the labor productivity effects of trends in wage distribution by first deriving
optimal labor demand under the assumption that producers minimize costs by varying all
inputs, subject to given production, the distribution-based effectiveness shifter Ef and the real
prices of labor and capital services (w and r). For generalized Cobb-Douglas production the
desired stock of labor input, L*, may therefore be written
ln ln ln ln ln ln*L Av
trend Q r w Efo= + − + + + − −11 2 2δ δ α ατ τb g b ge j (5)
where υ α α= +1 2b g and A is a constant composed of the parameters of production.
We assume also that aggregate labor demand is adequately characterized by quadratic
adjustment costs of proportional quantities (see Hamermesh, 1993, chapters 7 and 8 for a
review of the topic) and, therefore, write
∆ ln ln ln , .*L L L= − < ≤−θ θ1 0 1d i (6)
20 The longer working paper on which this article is based investigated a number of other functional forms (including Translog, CES and pure time-series models), but these analyses deliver the same basic results concerning wage dispersion effects as those reported ahead for test equations based on generalized Cobb-Douglas setups.

2211
Further, because we believe tight specifications of output and optimal labor demand functions
should not be taken literally (on this score, see Roemer’s 1993 review essay, along with the
associated comments and discussion), parameter constraints implied by strict application of
(3)-(6) were not imposed when deriving labor productivity estimating equations. Hence (5)
and (6) are used to obtain the following unrestricted log linear labor productivity equation
ln ln ln
ln ln ,
Q L trend Q w
r Ef L
b g b g b g= + + ++ + + −
β β β ββ β β
τ τ0 1 2 3
4 5 6 1 (7)
where coefficients should be signed β β β β β β β4 6 0 1 2 3 50, , , , ,< < and the right-side lnQ
must be treated as endogenous in regression experiments.
Note that distinctions drawn between dispersion effects on output and labor productivity in
regression experiments based on (4) and (7) are somewhat arbitrary. The labor productivity
models are derived for output given, so they are just rearrangements of conditional labor
demand functions. Consequently, regression experiments based on (7) could just as well be
interpreted as delivering the effects of wage dispersion on employment. Analagously, output
production functions like (4) are indistinguishable from direct productivity equations obtained
by subtracting ln L from both sides of (3), and so wage dispersion coefficients obtained in
regressions based on them could be interpreted as estimating effects on productivity. As
Gordon (1987) and Pehkonen (1995), however, we want to condition productivity responses
to wage distribution on real wage levels; therefore we also adopt the derived view of
productivity.
4. Empirical Results
Regression models were fit to two time ranges -- 1964-1993 and 1972-1993 -- which
were determined by the availability of data available for calculation of Within and Between
variance components of wages arrayed by plants or industries. (See Appendix 1, Record of
Notation.) As we have seen, theory and opinion concerning potential responses of productive
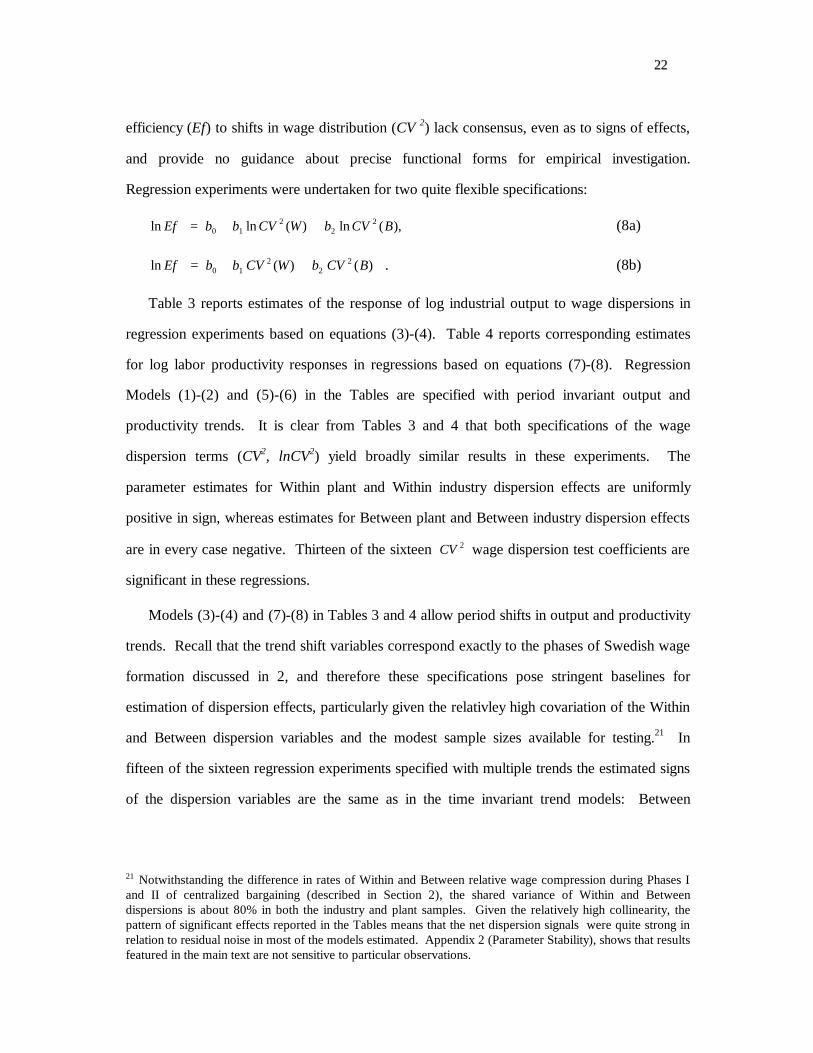
2222
efficiency (Ef) to shifts in wage distribution (CV 2) lack consensus, even as to signs of effects,
and provide no guidance about precise functional forms for empirical investigation.
Regression experiments were undertaken for two quite flexible specifications:
ln ln ( ) ln ( ),Ef b b CV W b CV B= + +0 12
22 (8a)
ln ( ) ( )Ef b b CV W b CV B= + +0 12
22 . (8b)
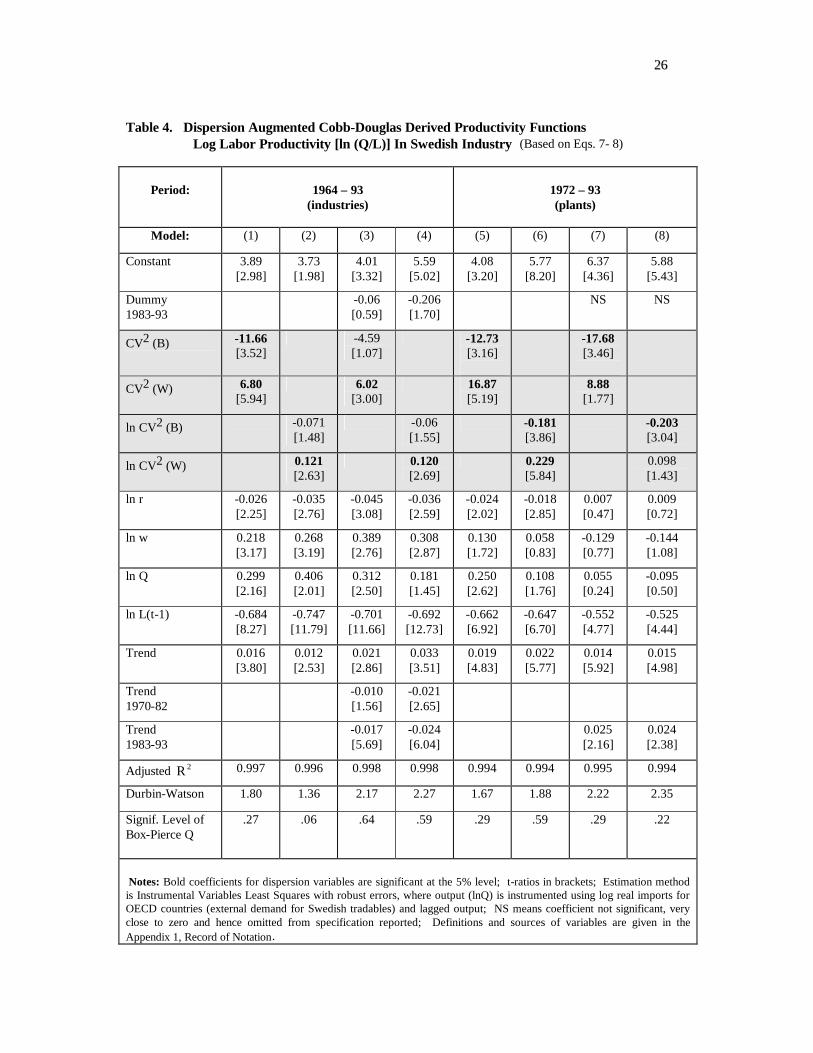
Table 3 reports estimates of the response of log industrial output to wage dispersions in
regression experiments based on equations (3)-(4). Table 4 reports corresponding estimates
for log labor productivity responses in regressions based on equations (7)-(8). Regression
Models (1)-(2) and (5)-(6) in the Tables are specified with period invariant output and
productivity trends. It is clear from Tables 3 and 4 that both specifications of the wage
dispersion terms (CV2, lnCV2) yield broadly similar results in these experiments. The
parameter estimates for Within plant and Within industry dispersion effects are uniformly
positive in sign, whereas estimates for Between plant and Between industry dispersion effects
are in every case negative. Thirteen of the sixteen CV 2 wage dispersion test coefficients are
significant in these regressions.
Models (3)-(4) and (7)-(8) in Tables 3 and 4 allow period shifts in output and productivity
trends. Recall that the trend shift variables correspond exactly to the phases of Swedish wage
formation discussed in 2, and therefore these specifications pose stringent baselines for
estimation of dispersion effects, particularly given the relativley high covariation of the Within
and Between dispersion variables and the modest sample sizes available for testing.21 In
fifteen of the sixteen regression experiments specified with multiple trends the estimated signs
of the dispersion variables are the same as in the time invariant trend models: Between
21 Notwithstanding the difference in rates of Within and Between relative wage compression during Phases I and II of centralized bargaining (described in Section 2), the shared variance of Within and Between dispersions is about 80% in both the industry and plant samples. Given the relatively high collinearity, the pattern of significant effects reported in the Tables means that the net dispersion signals were quite strong in relation to residual noise in most of the models estimated. Appendix 2 (Parameter Stability), shows that results featured in the main text are not sensitive to particular observations.
2233
dispersions exhibit negative effects and Within dipersions positive effects. As would be
expected, there is some tendency for the magnitudes of the effects to be attenuated by
comparison to the uniform trend models, yet twelve of the sixteen test coefficients are
significant.
Taken as a whole, evidence from the regression experiments support the conclusion that
the large reductions in the variances of relative wages Within plants and Within industries,
which from the early 1960’s until the breakdown of central bargaining in the first part of the
1980’s were on the order of 72 percent, most likely depressed output and labor productivity
growth in Swedish industry. Hence the regressions yield no support of the thesis promoted by
Akerlof and Yellen and Levine that wage leveling Within workplaces or Within industries
enhances productive efficiency; at least when interest focuses on macroeconomic effects and
so output, productivity, wage dispersions and other relevant variables are aggregated up to the
industry level, as is the case here.22
Yet it is likely that wage leveling in Sweden went far beyond the unspecified, but clearly ‘at
the margin’, magnitudes that advocates of ‘fairness, morale and cohesiveness’ theories have in
mind. Moreover, equity theories speak most forcefully to the potential enhancements of labor
effectiveness accompanying Within plant pay compression, and plant wage dispersion data
were available only for the shorter of the two sample periods, 1972-93. But as late as 1968
wage inequality in Sweden was roughly equivalent to that in the United States (Edin and
Topel, 1997), and much of the Within plant (and industry) wage leveling took place following
the radicalization of LO wage policy in 1969-70 (the beginning of the Phase II regime
described earlier). In any case, no functional form we were able to devise (including
specifications with lagged dispersion terms and parabolic forms allowing sign reversals,
threshold effects and so on) managed to detect any positive output or productivity response to
22 Unfortunately sufficient data for more disaggregated analyses are not available.
2244
the large movements of Within plant and Within industry wage dispersion observed in the
1972-93 and 1964-93 data samples.23
Estimation results for the effects of wage compressions Between plants and industries,
however, conform wholly to the arguments first advanced by the LO economists Gösta Rehn
and Rudolf Meidner in the 1940’s, and written down with more formal precision almost a half
century later by Agell and Lommerud (1993), and Moene and Wallerstein (1997).
Equalization of relative wages Between plants and industries evidently raised aggregate output
and productivity significantly, most likely, as Edin and Topel’s (1997) sectoral empirical
analyses indicate, by expediting the flow of labor and capital resources from less to more
efficient activities.
23 David Levine has emphasized to us that since the Within Industries variance is composed of Within Plants given industry and Between Plants given industry components, equity theory might receive greater support from analyses based on a tripartite decomposition of Total Wage Variance by Industry: Within Plants given industry + Between plants given industry + Between industries. However, regressions using this decomposition of total relative wage variance by industry (which because of data limitations were confined to the shorter 1972-93 sample), consistently yielded significant positive coefficients for the Within plants component and consistently negative significant coefficients for at least one of the Between variance components, thus sustaining the pattern of results reported in Tables 3 and 4.

2255
Table 3. Dispersion Augmented Cobb-Douglas Production Functions Log Real Value Added [ln Q] In Swedish Industry (Based on Eqs. 3-4)
Period:
1964 – 93
(industries)
1972 – 93 (plants)
Model: (1) (2) (3) (4) (5) (6) (7) (8)
Constant 7.712 [3.30]
9.73 [4.14]
7.789 [7,72]
7.177 [9.68]
7.532 [3.41]
8.595 [4.26]
7.738 [4.87]
8.023 [4.74]
Dummy 1983-93
-0.267 [9.57]
-0.444 [11.79]
NS NS
CV2 (B) -20.66 [10.4]
-15.21 [7.95]
-6.311 [1.35]
-9.689 [2.51]
CV2 (W) 7.17 [7.04]
-1.24 [0.59]
14.45 [4.81]
9.913 [5.19]
ln CV2 (B) -0.228 [7.85]
-0.151 [8.06]
-0.095 [1.66]
-0.119 [2.68]
ln CV2 (W) 0.213 [8.43]
0.057 [2.77]
0.180 [4.41]
0.119 [5.70]
ln L 0.241 [1.36]
0.08 [0.49]
0.240 [3.11]
0.231 [4.29]
0.241 [1.44]
0.197 [1.35]
0.240 [2.01]
0.218 [1.96]
ln K 0.06 [2.92]
0.056 [2.52]
0.068 [5.08]
0.061 [7.23]
0.072 [4.93]
0.075 [5.67]
0.075 [9.80]
0.076 [10.35]
Trend 0.021 [4.94]
0.018 [4.16]
0.028 [6.13]
0.045 [11.98]
0.018 [3.43]
0.017 [3.49]
0.009 [2.24]
0.009 [2.42]
Trend 1970-82
-0.021 [8.36]
-0.03 [10.38]
Trend 1983-93
-0.001 [0.24]
-0.019 [3.81]
0.014 [2.28]
0.013 [2.21]
Adjusted R 2 .981 .972 .988 .988 .961 .963 .966 .966
Durbin-Watson 1.35 1.26 1.36 1.32 1.24 1.26 1.20 1.21
Signif. Level of Box-Pierce Q
.72 .62 .02 .02 .09 .07 .01 .01
Notes: Bold coefficients for dispersion variables are significant at the 5% level; t-ratios in brackets; Estimation method is OLS with robust errors (White 1980); NS means coefficient not significant, very close to zero and hence omitted from specification reported; Definitions and sources of variables are given in the Appendix 1, Record of Notation
2266
Table 4. Dispersion Augmented Cobb-Douglas Derived Productivity Functions Log Labor Productivity [ln (Q/L)] In Swedish Industry (Based on Eqs. 7- 8)
Period:
1964 – 93 (industries)
1972 – 93 (plants)
Model: (1) (2) (3) (4) (5) (6) (7) (8)
Constant 3.89 [2.98]
3.73 [1.98]
4.01 [3.32]
5.59 [5.02]
4.08 [3.20]
5.77 [8.20]
6.37 [4.36]
5.88 [5.43]
Dummy 1983-93
-0.06 [0.59]
-0.206 [1.70]
NS NS
CV2 (B) -11.66 [3.52]
-4.59 [1.07]
-12.73 [3.16]
-17.68 [3.46]
CV2 (W) 6.80 [5.94]
6.02 [3.00]
16.87 [5.19]
8.88 [1.77]
ln CV2 (B) -0.071 [1.48]
-0.06 [1.55]
-0.181 [3.86]
-0.203 [3.04]
ln CV2 (W) 0.121 [2.63]
0.120 [2.69]
0.229 [5.84]
0.098 [1.43]
ln r -0.026 [2.25]
-0.035 [2.76]
-0.045 [3.08]
-0.036 [2.59]
-0.024 [2.02]
-0.018 [2.85]
0.007 [0.47]
0.009 [0.72]
ln w 0.218 [3.17]
0.268 [3.19]
0.389 [2.76]
0.308 [2.87]
0.130 [1.72]
0.058 [0.83]
-0.129 [0.77]
-0.144 [1.08]
ln Q 0.299 [2.16]
0.406 [2.01]
0.312 [2.50]
0.181 [1.45]
0.250 [2.62]
0.108 [1.76]
0.055 [0.24]
-0.095 [0.50]
ln L(t-1) -0.684 [8.27]
-0.747 [11.79]
-0.701 [11.66]
-0.692 [12.73]
-0.662 [6.92]
-0.647 [6.70]
-0.552 [4.77]
-0.525 [4.44]
Trend 0.016 [3.80]
0.012 [2.53]
0.021 [2.86]
0.033 [3.51]
0.019 [4.83]
0.022 [5.77]
0.014 [5.92]
0.015 [4.98]
Trend 1970-82
-0.010 [1.56]
-0.021 [2.65]
Trend 1983-93
-0.017 [5.69]
-0.024 [6.04]
0.025 [2.16]
0.024 [2.38]
Adjusted R 2 0.997 0.996 0.998 0.998 0.994 0.994 0.995 0.994
Durbin-Watson 1.80 1.36 2.17 2.27 1.67 1.88 2.22 2.35
Signif. Level of Box-Pierce Q
.27 .06 .64 .59 .29 .59 .29 .22
Notes: Bold coefficients for dispersion variables are significant at the 5% level; t-ratios in brackets; Estimation method is Instrumental Variables Least Squares with robust errors, where output (lnQ) is instrumented using log real imports for OECD countries (external demand for Swedish tradables) and lagged output; NS means coefficient not significant, very close to zero and hence omitted from specification reported; Definitions and sources of variables are given in the Appendix 1, Record of Notation.
2277
5. Implications And Conclusions
What about the magnitudes of distribution effects on productive efficiency? We roughly
calibrate the scale of effects implied by the regression evidence by applying the relevant
coefficient estimates to observed changes in Within and Between variance components, which
were then cumulated over the period studied:
lnTotal Cumulative Effect b f CV W b f CV Bt W B
t
= +=
∑ ∆ ∆2 2
0
( ) ( )d i d iτ ττ
where f indexes the functional form for lnEf in (8a)-(8b), ∆ denotes year to year changes and
b bW Band denote the associated wage dispersion parameter estimates in the log output and
log labor productivity regressions reported in Tables 3 and 4. The time paths of cumulative
effects, averaged over all estimates reported in the Tables, are graphed in Figures 5 and 6.24
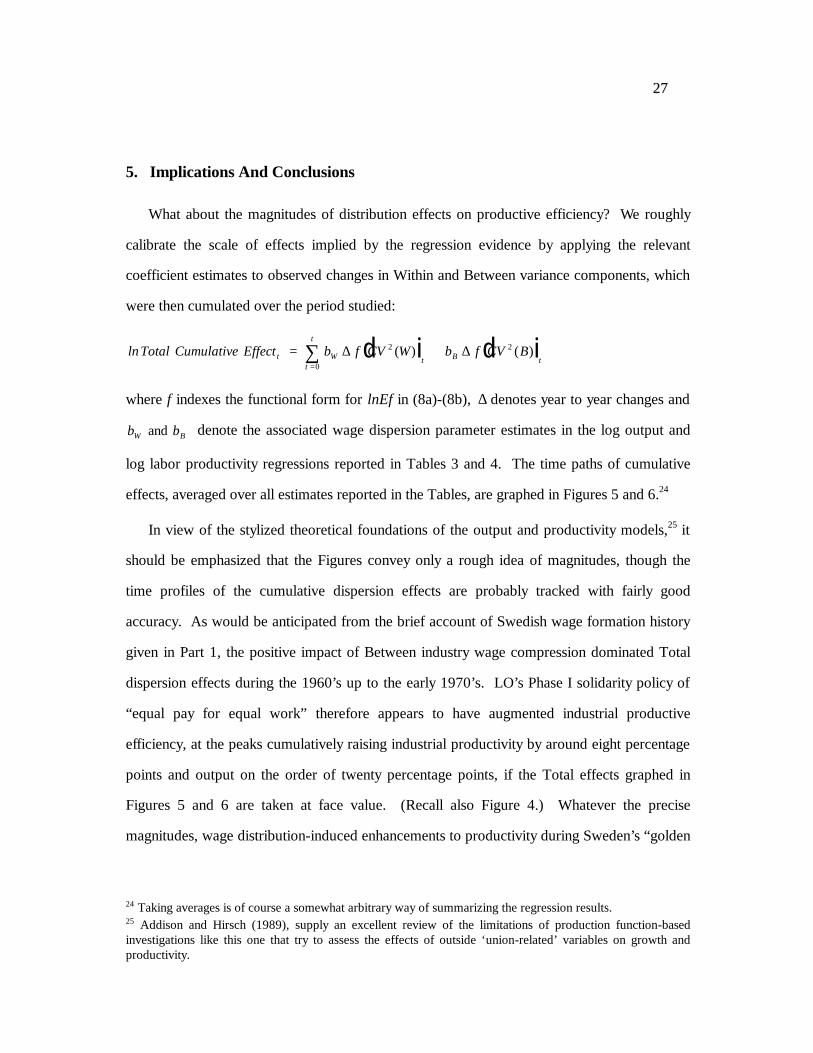
In view of the stylized theoretical foundations of the output and productivity models,25 it
should be emphasized that the Figures convey only a rough idea of magnitudes, though the
time profiles of the cumulative dispersion effects are probably tracked with fairly good
accuracy. As would be anticipated from the brief account of Swedish wage formation history
given in Part 1, the positive impact of Between industry wage compression dominated Total
dispersion effects during the 1960’s up to the early 1970’s. LO’s Phase I solidarity policy of
“equal pay for equal work” therefore appears to have augmented industrial productive
efficiency, at the peaks cumulatively raising industrial productivity by around eight percentage
points and output on the order of twenty percentage points, if the Total effects graphed in
Figures 5 and 6 are taken at face value. (Recall also Figure 4.) Whatever the precise
magnitudes, wage distribution-induced enhancements to productivity during Sweden’s “golden
24 Taking averages is of course a somewhat arbitrary way of summarizing the regression results. 25 Addison and Hirsch (1989), supply an excellent review of the limitations of production function-based investigations like this one that try to assess the effects of outside ‘union-related’ variables on growth and productivity.
2288
decade” from the early 1960’s to the early 1970’s, evidently were not achieved at the cost of
lower aggregate output, as Lundberg (1985) and Jonsson and Siven (1986), among others,
asserted.
The radicalization of solidarity wage policy during the 1970’s, however, appears to have
eroded much, if not all, of the favorable legacy of Phase I policy. Wage differentials Within
plants and Within industries (across occupations and skill-grades) were leveled drastically –
by around 60 percentage points when measured by CV 2 – during the Phase II period. (Table
1) The computations reported in Figures 5 and 6 indicate that improvements to industrial
productivity under Phase I policy were as a result offset completely (and maybe worse) and
that Phase I enhancements to gross output were reduced by more than half.
Figure 5, Cumulative Wage Dispersion Effects on Log Output, 1964-1993
-0.3
-0.2
-0.1
0
0.1
0.2
0.3
0.4
64 66 68 70 72 74 76 78 80 82 84 86 88 90 92
Total
Between
Within
2299
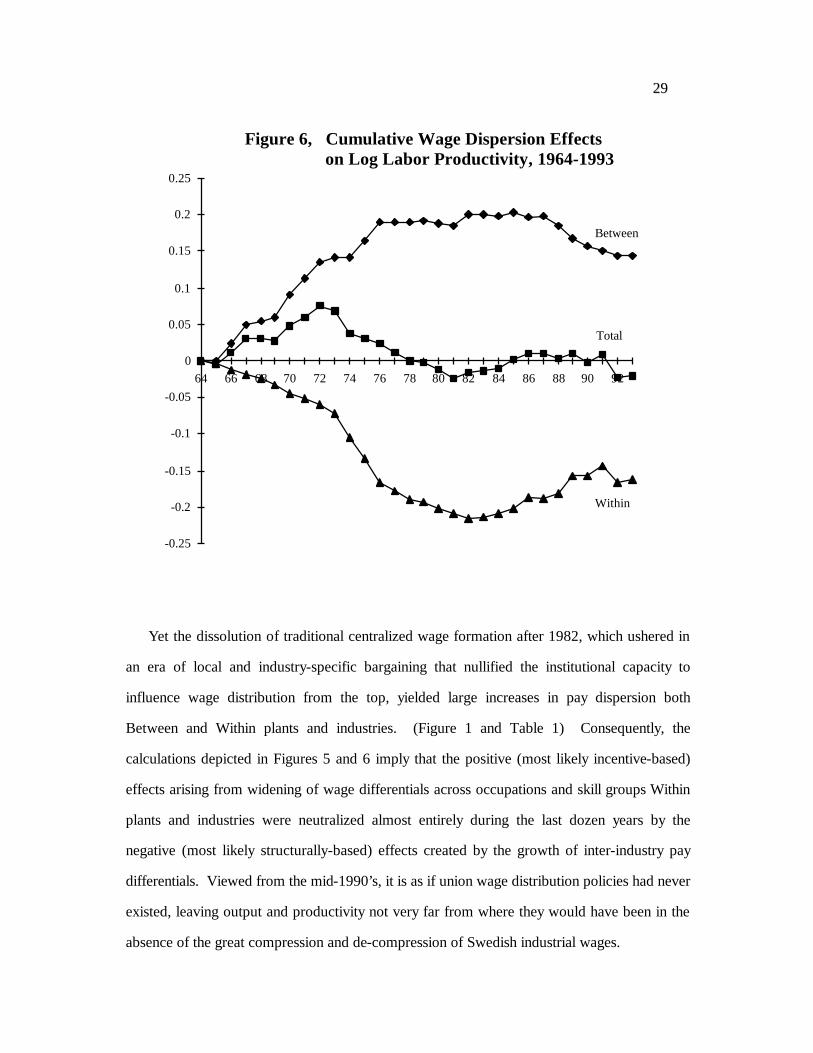
Figure 6, Cumulative Wage Dispersion Effects on Log Labor Productivity, 1964-1993
-0.25
-0.2
-0.15
-0.1
-0.05
0
0.05
0.1
0.15
0.2
0.25
64 66 68 70 72 74 76 78 80 82 84 86 88 90 92
Between
Within
Total
Yet the dissolution of traditional centralized wage formation after 1982, which ushered in
an era of local and industry-specific bargaining that nullified the institutional capacity to
influence wage distribution from the top, yielded large increases in pay dispersion both
Between and Within plants and industries. (Figure 1 and Table 1) Consequently, the
calculations depicted in Figures 5 and 6 imply that the positive (most likely incentive-based)
effects arising from widening of wage differentials across occupations and skill groups Within
plants and industries were neutralized almost entirely during the last dozen years by the
negative (most likely structurally-based) effects created by the growth of inter-industry pay
differentials. Viewed from the mid-1990’s, it is as if union wage distribution policies had never
existed, leaving output and productivity not very far from where they would have been in the
absence of the great compression and de-compression of Swedish industrial wages.
3300
References
Addison, John T. and Barry T. Hirsch, 1989, Union Effects on Productivity, Profits and Growth: Has the Long Run Arrived? Journal of Labor Economics, 7, 72-105.
Agell, Jonas, 1999, On the Benefits from Rigid Labour Markets: Norms, Market Failures, and Social Insurance. The Economic Journal, 109, F143-F164.
Agell, Jonas and Per Lundborg, 1995, Theories of Pay and Unemployment: Survey Evidence from Swedish Manufacturing Firms. Scandinavian Journal of Economics, 97, 295-307.
Agell, Jonas and Kjell Erik Lommerud, 1993, Egalitarianism and Growth. Scandinavian Journal of Economics, 95, 559-579.
Ahlén, Kristina, 1989, Swedish Collective Bargaining Under Pressure: Inter-union Rivalry and Incomes Policies. British Journal of Industrial Relations, 27, 330-346.
Akerloff, George A. and Janet L. Yellen, 1988, Fairness and Unemployment. American Economic Review, Papers and Proceedings, May, 44-49.
Akerloff, George A. and Janet L. Yellen, 1990, The Fair Wage-Effort Hypothesis and Unemployment. Quarterly Journal of Economics, May, 255-283.
Blau, Francine and Lawrence Kahn, 1996, International Differences in Male Wage Inequality: Institutions and Market Forces. Journal of Political Economy, 104, 791-837.
Davis, Steven J., 1992, Cross-Country Patterns of Change in Relative Wages. In Olivier Jean Blanchard and Stanley Fischer, eds., NBER Macroeconomics Annual. Cambridge, MA: MIT Press, 239-292.
Edin, P-A and Johnny Zetterberg, 1992, Interindustry Wage Differentials: Evidence from Sweden and a Comparison with the United States. American Economic Review, 82, 1341-1349.
Edin, Per-Anders and Bertil Holmlund, 1995, The Swedish Wage Structure: The Rise and Fall of Solidarity Wage Policy? In Richard Freeman and Lawrence Katz eds. Differences and Changes in Wage Structures. Chicago: University of Chicago Press.
Edin, Per-Anders and Robert Topel, 1997, Wage Policy and Restructuring - The Swedish Labor Market Since 1960. In Richard Freeman, Robert Topel and Birgitta Swedenborg, eds. The Welfare State in Transition. NBER, University of Chicago Press.
Flam, Harry, 1987, Equal Pay for Unequal Work. Scandinavian Journal of Economics, 89, 435-450.
Frank, Robert H., 1985, Choosing the Right Pond: Human Behavior and the Quest for Status. New York: Oxford University Press.
de Geer, Hans, 1992, The Rise and Fall of the Swedish Model. Chichester: Carden Publications.
Gordon, Robert J., 1987, Productivity, Wages and Prices Inside and Outside of Manufacturing in the U.S., Japan and Europe, European Economic Review, 31, 695-733.

3311
Hamermesh, Daniel S., 1993, Labor Demand. Princeton University Press.
Heclo, Hugh and Henrik Jess Madsen, 1987, Policy and Politics in Sweden. Philadelphia: Temple University Press.
Hibbs, Douglas A. Jr. and Håkan Locking, 1996, Wage Compression, Wage Drift and Wage Inflation in Sweden. Labour Economics, 3, 109-141.
Hibbs, Douglas A. Jr., 1990, Wage Dispersion and Trade Union Action in Sweden, in: Inga Persson (ed): Generating Equality in the Welfare State -- The Swedish Experience. Olso: Norwegian University Press.
Hibbs, Douglas A. Jr., 1991, Market Forces, Trade Union Ideology and Trends in Wage Dispersion. Acta Sociologica, 34, 89-102
Hicks, John R., 1963, The Theory of Wages. London: Macmillan (2.ed.)
Jonsson, Lennart and Claes-Henric Siven, 1986, Why Wage Differentials. Stockholm: SAF’s Förlag.
Katz, Lawrence F. and Lawrence Summers, 1989, Industry Rents: Evidence and Implications. Brookings Papers on Economic Activity: Microeconomics 1989, 209-90.
Krueger, Alan B. and Lawrence Summers, 1987.. Reflections on the Inter-industry Wage Structure. In K. Lang and J.S. Leonard, eds., Unemployment and the Structure of Labor Markets. Oxford: Blackwell, 17-47.
Levine, David, 1991, Cohesiveness, Productivity, and Wage Dispersion. Journal of Economic Behavior and Organization, 15, 237-255.
Levine, David, 1992, Can Wage Increases Pay for Themselves? Tests With A Production Function. The Economic Journal, 102, 1102-1115.
Lindbeck, Assar, 1983, Interpreting Income Distributions in a Welfare State. European Economic Review, 21: 227-256.
Lundberg, Erik, 1985, The Rise and Fall of the Swedish Model. Journal of Economic Literature, 23, 1-36.
Martin, Andrew, 1984, Trade Unions in Sweden: Strategic Responses to Change and Crisis. In P. Gourevitch et al. eds., Unions and Economic Crisis: Britain, West Germany and Sweden. London: George Allen & Unwin.
Meidner, Rudolf, 1974, Co-ordination and Solidarity: An Approach to Wages Policy. Stockholm: Prisma.
Moene, Karl Ove and Michael Wallerstein, 1997, Pay Inequality and Job Creation. Journal of Labor Economics, 15: 403-30.
Myrdal, Hans-Göran, 1991, The Hard Way from a Centralized to a Decentralized Industrial Relations System: The Case of Sweden and SAF. In Dieter Sadowski and Otto Jacobi, eds., Employer’s Associations in Europe: Policy and Organization. Baden-Baden: Nomos Verlag.
Nilsson, Christian, 1993, The Swedish Model: Market Institutions and Contracts. In J. Hartog and J. Theeuwes, eds. Labour Market Contracts and Institutions, A Cross-National Comparison, Amsterdam: North Holland.
3322
OECD, 1996, Earnings Inequality, Low-Paid Employment and Earnings Mobility. Employment Outlook, July, 59-108.
Olsson, Anders S., 1989, The Swedish Wage Negotiation System. Uppsala, Department of Sociology Uppsala University (doctoral dissertation).
Pehkonen, J., 1995, Wages and Productivity Growth in the Nordic Countries. European Economic Review, 39, 1181-1196.
Pontusson, Jonas and Peter Swenson, 1996, Labor Markets, Production Strategies and Wage-Bargaining Institutions: The Swedish Employer Offensive in Comparative Perspective” Comparative Political Studies, 29, 223-250.
Roemer, Paul M., 1993, Crazy Explanations for the Productivity Slowdown. In Olivier Jean Blanchard and Stanley Fischer, eds. NBER Macroeconomics Annual, 163-202. Cambridge, MIT Press.
Siven, Claes-Henric, 1987, The Wage Structure and the Functioning of the Labor Market, In Siven, ed. Unemployment in Europe, Stockholm, Timbro.
Solow, Robert M., 1990, The Labor Market as a Social Institution. Cambridge, MA and Oxford: Basil Blackwell.
Swenson, Peter. 1993. Fair Shares: Unions, Pay and Politics in Sweden and West Germany. Ithaca: Cornel University Press.
Teulings, C.N. and J. Hartog, 1998, Corporatism or Competition? Labour Contracts, Institutions and Wage Structures in International Comparison. Cambridge University Press.
Turvey, Ralph (ed.), 1952, Wages Policy Under Full Employment. (William Hodge and Co., London).
U.S. Bureau of Labor Statistics, 1994, International Comparisons of Manufacturing Productivity and Unit Labor Cost Trends, August.
Wallerstein, Michael, forthcoming, Wage Setting Institutions and Pay Inequality in Advanced Industrial Societies. American Journal of Political Science, forthcoming.
3333
Appendix 1, Record of Notation (principal variables)
Wage Dispersion Variables, based on individual wages of LO-SAF private sector workers recorded in the second quarter of each year except construction where individual wages are not available. Dispersion statistics are from authors’ computations and computations and data supplied by SAF, LO and Metall.
CV2(B): squared coefficient of variation between LO-SAF plants for 1972-93 sample and between LO-SAF contract areas (industries) for 1963-93 samples. Weighted by employment shares.
CV2(W): squared coefficient of variation within LO-SAF plants for 1972-93 sample and within LO-SAF contract areas (industries) for 1963-93 samples. . For the years 1963-72 CV2(W) are estimated from micro data for the engineering and fabricated metals industry (Verkstadsföreningen).
Macroeconomic Variables, all for manufacturing plus mining (ISIC 2+3). Q, N, L K and w are from SCB (Central Bureau of Statistics), Statistics Sweden, assembled by project SNEP at Uppsala University.
Q: real value added.
L: blue-collar hours.
K: real capital stock, net of depreciation and adjusted for utilization.
r: real user cost of capital, from Professor Jan Södersten, Uppsala University
w: average blue-collar real product wage, inclusive of payroll taxes.
OECD import volumes (used as one instrument for lnQ in Table 4) from International Financial Statistics, various volumes.
3344
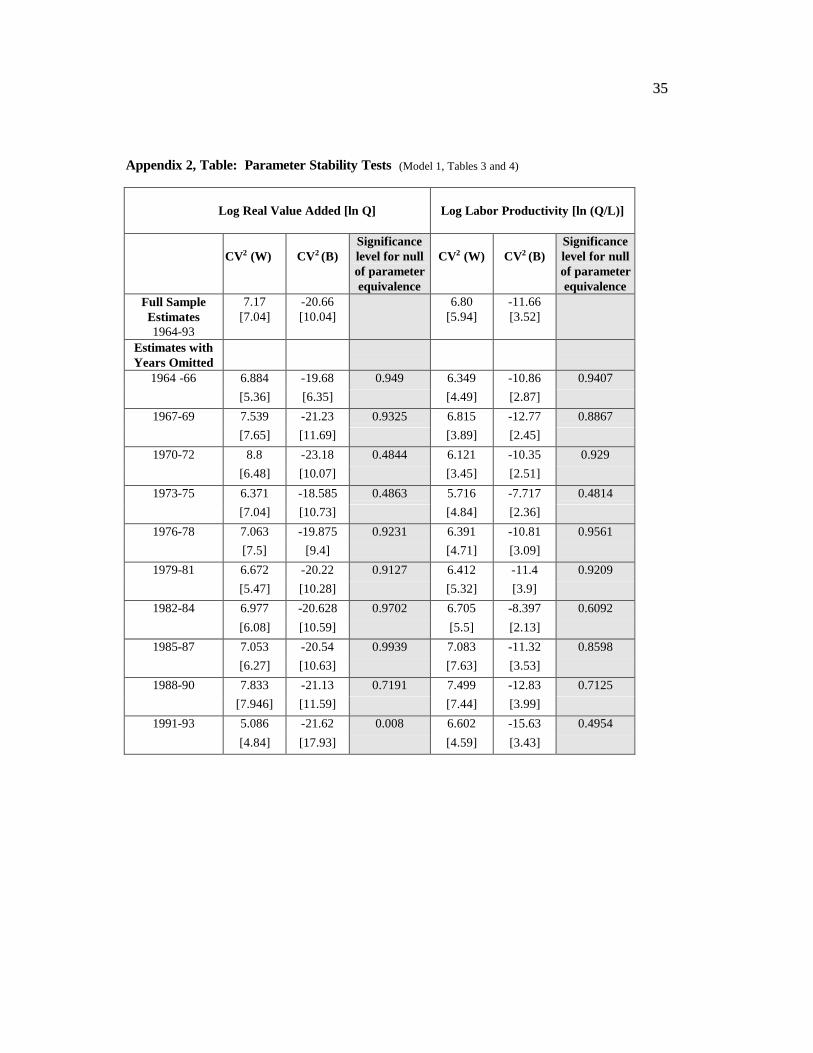
Appendix 2, Parameter Stability
The table below reports tests of the joint null hypotheses that the wage dispersion
parameter estimates for Model 1 of Tables 3 and 4 are equivalent to estimates obtained in
parallel regression experiments in which adjacent sets of three observations were omitted. In
only one of the twenty regressions reported can the null of parameter equivalence be rejected
formally. However, even in that case (the last regression for log real value added; years 1991-
93 omitted), the estimates obtained are obviously very similar substantively to the full sample
estimates. Similar experiments undertaken with the log dispersion variables and for the shorter
‘plants’ samples also demonstrate that the results featured in the paper are quite robust to
deletion of observations.
3355
Appendix 2, Table: Parameter Stability Tests (Model 1, Tables 3 and 4)
Log Real Value Added [ln Q]
Log Labor Productivity [ln (Q/L)]
CV2 (W)
CV2 (B) Significance level for null of parameter equivalence
CV2 (W)
CV2 (B)
Significance level for null of parameter equivalence
Full Sample Estimates 1964-93
7.17 [7.04]
-20.66 [10.04]
6.80 [5.94]
-11.66 [3.52]
Estimates with Years Omitted
1964 -66 6.884 -19.68 0.949 6.349 -10.86 0.9407 [5.36] [6.35] [4.49] [2.87]
1967-69 7.539 -21.23 0.9325 6.815 -12.77 0.8867 [7.65] [11.69] [3.89] [2.45]
1970-72 8.8 -23.18 0.4844 6.121 -10.35 0.929 [6.48] [10.07] [3.45] [2.51]
1973-75 6.371 -18.585 0.4863 5.716 -7.717 0.4814 [7.04] [10.73] [4.84] [2.36]
1976-78 7.063 -19.875 0.9231 6.391 -10.81 0.9561 [7.5] [9.4] [4.71] [3.09]
1979-81 6.672 -20.22 0.9127 6.412 -11.4 0.9209 [5.47] [10.28] [5.32] [3.9]
1982-84 6.977 -20.628 0.9702 6.705 -8.397 0.6092 [6.08] [10.59] [5.5] [2.13]
1985-87 7.053 -20.54 0.9939 7.083 -11.32 0.8598 [6.27] [10.63] [7.63] [3.53]
1988-90 7.833 -21.13 0.7191 7.499 -12.83 0.7125 [7.946] [11.59] [7.44] [3.99]
1991-93 5.086 -21.62 0.008 6.602 -15.63 0.4954 [4.84] [17.93] [4.59] [3.43]