employer branding – a valuable tool for attraction and...
TRANSCRIPT

EMPLOYER BRANDING – A VALUABLE TOOL FOR ATTRACTION AND RETENTION IN IRISH ORGANISATIONS?
Jeyaseelie O’Sullivan
A Dissertation submitted in partial fulfilment for the MA in Human Resource
Management Submitted to the National College of Ireland August 2017

2
Abstract
The aim of this study is to provide an in-depth analysis into the usefulness of an
organisation’s Employer Brand and the impact it has on candidate attraction and employee
retention for Irish organisations.
Previous research into the area was focused outside of Ireland and predominantly based on
the student population. This study strove to ascertain whether or not Irish organisations were
justified in spending their resources in building and strengthening their Employer Brand with
the aim of attraction and retention.
A quantitative method in the form of a survey was used to collect the data for this study.
There were 198 participants which generated a significant amount of data. Upon analysis
there were two specific findings. Firstly, that undoubtedly Employer Branding is a valuable
tool in attracting candidates to Irish organisations and secondly that Employer Branding is
not a valuable tool for Irish organisations in retaining their employees.

3
Declaration
Submission of Thesis and Dissertation
National College of Ireland
Research Students Declaration Form
(Thesis/Author Declaration Form)
Name: Jeyaseelie O’Sullivan
Student Number: 14128802
Degree for which thesis is submitted: MAHRM
Material submitted for award:
(a) I declare that the work has been composed by myself;
(b) I declare that all verbatim extracts contained in the thesis have been distinguished by
quotation marks and the sources of information specifically acknowledged;
(c) My thesis will be included in electronic format in the College Institutional Repository
TRAP (thesis reports and projects) ;
(d) Either *I declare that no material contained in the thesis has been used in any other
submission for an academic award;
Or *I declare that the following material contained in the thesis formed part of a submission
for the award of
________________________________________________________________
(State the award and the awarding body and list the material below)
Signature of research student: _____________________________________
Date: _______________

4
Submission of Thesis to Norma Smurfit Library, National College of Ireland
Student name: Jeyaseelie O’Sullivan
Student number: 14128802
School: School of Business
Course: MA in HRM
Degree to be awarded: Masters
Title of Thesis: Employer Branding – a valuable tool in attraction and retention for Irish
organisations?
One hard bound copy of your thesis will be lodged in the Norma Smurfit Library and will be
available for consultation. The electronic copy will be accessible in TRAP
(http://trap.ncirl.ie/), the National College of Ireland’s Institutional Repository. In accordance
with normal academic library practice all theses lodged in the National College of Ireland
Institutional Repository (TRAP) are made available on open access.
I agree to a hard bound copy of my thesis being available for consultation in the library. I also
agree to an electronic copy of my thesis being made publicly available on the National
College of Ireland’s Institutional Repository TRAP.
Signature of Candidate:
____________________________________________________________
For completion by the School: The aforementioned thesis was received
by__________________________ Date: _______________
This signed form must be appended to all hard bound and electronic copies of your thesis
submitted to your school.

5
Acknowledgments
This dissertation is dedicated to my parents Katherine and Gene because without their
unending support, encouragement and belief in my abilities I would firstly not be the
person that I am today and secondly not have considered undertaking the huge
commitment that has been this Master’s program.
To my supervisor Aine McManus, thank you for your guidance.
To Jonathan Lambert, the unsung hero of NCI who made SPSS and Quantitative
Analysis a less challenging process - I cannot thank you enough.
Finally, thank you to my colleagues and friends, who always encouraged me and
convinced me I was doing the right thing even when I was at my most low and
demotivated.

6
Table of Contents
ABSTRACT .............................................................................................................................. 2
DECLARATION...................................................................................................................... 3
SUBMISSION OF THESIS TO NORMA SMURFIT LIBRARY, NATIONAL
COLLEGE OF IRELAND ...................................................................................................... 4
ACKNOWLEDGMENTS ....................................................................................................... 5
INTRODUCTION.................................................................................................................... 8
2. LITERATURE REVIEW ................................................................................................... 9 2.1 EMPLOYER BRANDING ....................................................................................................... 9
2.2 EXTERNAL EMPLOYER BRAND AND CORPORATE BRAND .................................................. 11
2.3 INTERNAL EMPLOYER BRAND .......................................................................................... 12
2.4 ATTRACTION ................................................................................................................... 13
2.5 RETENTION AND TURNOVER INTENT ................................................................................ 15
2.6 PREVIOUS STUDIES .......................................................................................................... 16
3.RESEARCH METHODOLOGY ...................................................................................... 17 3.1 RESEARCH OBJECTIVES ................................................................................................... 17
3.2 RESEARCH PHILOSOPHY .................................................................................................. 17
3.2 SECONDARY RESEARCH .................................................................................................. 18
3.3 RESEARCH APPROACH .................................................................................................... 18
3.4 PRIMARY RESEARCH ....................................................................................................... 19
3.5 ETHICAL CONSIDERATIONS ............................................................................................. 20
3.6 DATA ANALYSIS ............................................................................................................. 20
3.7 SAMPLE ........................................................................................................................... 20
3.8 CHARACTERISTICS OF RESPONDENTS .............................................................................. 21
3.9 SCALE IDENTIFICATION AND RELIABILITY ...................................................................... 23
3.10 SCALE RELIABILITY ...................................................................................................... 24
3.10.1 Interest Value reliability results............................................................................ 25
3.10.2 Social Value Reliability results ............................................................................. 25
3.10.3 Economic Value Reliability results ....................................................................... 26
3.10.4 Developmental Value Reliability results ............................................................... 26
3.10.5 Application Value Reliability results .................................................................... 27
3.10.6 Turnover Intent Reliability results ........................................................................ 27
4. RESULTS ........................................................................................................................... 28 4.1 DESCRIPTION OF VARIABLE DISTRIBUTIONS ................................................................... 28
4.2 RELATIONSHIP BETWEEN EMPLOYEE BRANDING SUBSCALES AND TURNOVER INTENT .. 32
4.3 CORRELATION ANALYSIS ................................................................................................ 33
3.4 FURTHER ANALYSIS ........................................................................................................ 34
3.5 LIMITATIONS OF STUDY AND RECOMMENDATIONS FOR FUTURE RESEARCH ..................... 36
5. CONCLUSION .................................................................................................................. 37
6. RECOMMENDATIONS AND COSTINGS ................................................................... 38 6.1. INTEREST VALUE ........................................................................................................... 39
6.1.1 Costings................................................................................................................... 39
6.2 SOCIAL VALUE ................................................................................................................ 39
6.2.1 Costings................................................................................................................... 39
6.3 ECONOMIC VALUE .......................................................................................................... 39
6.3.1 Costings................................................................................................................... 40

7
6.4. DEVELOPMENTAL VALUE .............................................................................................. 40
6.4.1 Costing .................................................................................................................... 40
6.5 APPLICATION VALUE ...................................................................................................... 40
6.5.1 Costing .................................................................................................................... 41
6.6 TIMELINES FOR RECOMMENDATIONS .............................................................................. 41
6.7 PERSONAL LEARNING STATEMENT ................................................................................. 41
7. REFERENCE LIST ........................................................................................................... 42
APPENDICES ........................................................................................................................ 47 APPENDIX 1 QUESTIONNAIRE INTRODUCTION ....................................................................... 47
APPENDIX 2 DEMOGRAPHIC QUESTIONS ............................................................................... 47
APPENDIX 3 SCALES ............................................................................................................. 48

8
Introduction
As the so called “war” for talent continues to gather momentum, increasingly, employers are
needing to turn their attention to innovative new methods to attract and retain talent. One of
the more strategic methods seen used to combat this in recent years has been through the use
of employer branding, with many large organisations investing significantly in it (Backhaus
and Tikoo, 2004; Davies, 2008). Lenaghan & Eisner (2006) describe Employer Branding as a
strategic attempt to attract and retain employees by establishing their organisation as an
“employer of choice”. Backhaus and Tikoo (2004) note that the employer brand is used to not
only recruit but also to ensure organisational commitment. According to Heilmann (2013) a
strong employer brand will enable recruitment to become more cost and time efficient and will
attract a better quality of candidate. In addition, it has been noted by several subject experts
that a strong employer brand will also increase job satisfaction among employees and inspire
increased loyalty and commitment to the organisation (Barrow and Mosley, 2005; Sartain and
Schumman, 2006; Fulmer et al., 2003). Organisations that boast high levels of employee
engagement and commitment tend to have significant advantage over their competitors not
only in terms of revenue but also overall desirability as an employer (Backhaus and Tikoo,
2004; Barrow and Mosley, 2005).
Undoubtedly this makes the correlation between employer brand and employee attraction and
employee retention an extremely relevant topic. Numerous studies have focused on areas
related to this topic including Highhouse et al., (2003) whose paper focused on measuring how
individuals are attracted to organisations. Sivertzen et al., (2013) touched on the value of
employer branding as a retention tool while Sokro (2012) research into employer branding and
its effect on attraction and retention was focused on the banking sector in Ghana. Das and
Ahmed (2014) delved into how the Tesco brand perception affects their recruitment and
selection processes. Minchington (2006) makes the observation that some organisations are
failing to utilise their employer brand in the most optimum way and therefore not availing of
the competitive advantage it could deliver if maintained and developed properly. Khalid and
Tariq (2015) focused their research on the impact employer brand had on recruitment and
selection in Pakistan while Ilesanmi (2014) research on employer branding and attraction and
retention was carried out on employees in the Nigerian brewing industry.

9
The research carried out to date examining the perceived positive relationship between
employer brand and employee attraction and retention has limitations. It has been focused
primarily on third level students or has been outside of Ireland. What has been noted is that the
influence employer branding has on both employee and the organisation’s performance is an
area worth investigating (Ambler and Barrow, 1996; Backhaus and Tikoo, 2004; McLaren,
2011).
Ireland is one of the most popular locations for foreign direct investment with countless
multinational and tech. companies choosing to set up operations here. Considering this and the
time and money that organisations in Ireland spend in developing their employer brand with
the intention of attracting employees and reducing turnover and the lack of current relevant
empirical justification for this, it is now timely that a study is carried out on the topic within an
Irish perspective.
The researcher herself is a HR professional in a large Irish organisation, has noted that much
time and discussion is spent on the subject of employer branding and she would like to be able
to have some solid facts on the topic that is based solely on Irish employees. To have carried
out such a study will be of great benefit to her career and also will provide her with an area of
subject expertise that she can continue to build on and grow.
2. Literature Review
2.1 Employer Branding
Employer branding is an area of huge interest for organisations and the perceived benefits of it
appear to be endless. According to Backhaus and Tikoo (2004) the considerable resources that
organisations spend in developing their employer brand is indicative of its value. Furthermore,
they go on to note that the employer brand is used both to attract potential employees and to
ensure that current employees are committed to the organization. The notion of it was first
discussed by Ambler and Barrow (1996) where through their research they deduced that
employer branding was extremely relevant to the area of human resource management. They
go on to describe how an employer brand has three specific benefits “functional, economic and
psychological”.

10
Its origins are most certainly derived from corporate branding which has the aim of creating a
brand that is positive, desirable and different and one that will deliver sustained competitive
advantage (Foster et al., 2010; Mosley, 2007). According to Sullivan (2004), employer
branding is defined as “a targeted, long-term strategy to manage the awareness and perceptions
of employees, potential employees, and related stakeholders with regards to a particular firm”.
Alternatively, Shaker and Ahmed (2014) take a simpler approach and define employer
branding as the positive manner in which an organisation represents itself in the market to
prospective employees. Undoubtedly, employer branding is the way an organisation
communicates its message externally to potential employees and internally to its existing
employees. An organisation’s employer brand will focus on its employees as internal
customers and prospective candidates as external customers. The existing employees or
internal customers are immersed in the company culture which is a key component of the
employer brand and can therefore be inspired to enhance it through positive experiences,
feelings and beliefs (Heilmann et al., 2013).
Throughout the literature on employer branding there appears to be a number of key
components that are consistently present. Researchers seem to agree with the notion that
employer branding is holistic by nature but aimed at creating a positive experience for
employees (Gaddam 2008; Mosley 2004). Another area constantly highlighted is around the
use of the employer’s brand essence and how it should be incorporated into work-related
activities and the organisation’s surroundings and then also, how it would be communicated
externally (Ambler and Barrow 1996; Mosley 2005). Brand essence is essentially the
organisation’s culture and values. According to Backhaus and Tikoo (2005) an organisation’s
employer brand is what differentiates it from its competitors and is one of its most valuable
assets.
Various studies focus on the advantages of utilising employer branding as a business strategy.
Some of the perceived benefits concluded from a thorough review of the literature are: reducing
attrition rates (Lenaghan and Eisner 2005; Minchington and Thorne 2007), reducing
recruitment costs (Barrow and Mosley 2007), increasing employee engagement and employee
retention (Backhaus et.al., 2004; Van Mossevelde 2010; Love et.al.,2011), and most
importantly, increasing both company revenue and shareholders returns (Becker and Huselid
2001).
11
An organisation’s employer brand has two areas in which can be used to add value: these are
their internal employer brand and their external employer brand. The employer brand can be
marketed externally to attract employees and marketed internally to increase satisfaction,
motivation and retention. A strong internal employer brand can be difficult for an
organisation’s competitors to replicate and this can be a powerful source of competitive
advantage (Stamler 2001).
2.2 External Employer Brand and Corporate Brand
An organisation’s external employer brand is generally the first touch point for prospective
employees. It is usually identical to or at least similar to the organisation’s corporate brand and
is what would have attracted the individual to the organisation in the first instance. Backhaus
and Tikoo (2004) make the observation that there are two main differences between external
employer brand and corporate branding - firstly that employer brands have internal and external
components whereas a corporate brand only focuses externally. Secondly, they also note that
the employer brand will never seek to communicate with the organisation’s customers, as its
sole function is to attract new employees. However, the reason that the employer brand and
corporate brand support each other is that they are each formed with components of the core
mission and values of the organisation (Barrow and Mosley 2005). Both the employer brand
and corporate brand can be communicated by the organisation’s employees (Foster et al.,
2010). An organisation’s external brand seeks to attract the top talent available in the labour
market by making it an employer of choice while the corporate brand is focused on attracting
customers or new business to the organisation for financial gain.
According to Miles and Mangold (2005) an organisation’s external brand will be
communicated to its audience much like its corporate brand through formal methods such as
media, advertisements and participating in “employer of choice” awards and surveys and also
informally through its employees’ feelings and descriptions of their employer to their friends
and peers.

12
2.3 Internal Employer Brand
Internal employer branding refers to the methods an organisation uses to engage, motivate and
retain their employees through their culture and brand personality (Thompson et al., 1999) The
desired result of these efforts is to deliver a sustained competitive advantage through their
human capital and not in the typical manner of business practices and procedures. (Jacobs
2003) For an employer brand to be successful, it is critical that its values are aligned with its
employees’ values (Harris and de Chernatony 2001).
According to Martin (2011) the shift of focus from external branding to internal branding was
as a direct result of the recent economic downturn. Organisations realised that using their
employees as brand ambassadors was a more cost effective way of spreading their brand
message and consequently, focused their attentions on building their employer brand internally.
What greater advocates could an organisation hope to have for their company then their own
employees and it is with this intention that organisations have even begun to recruit
employees that fit with the culture and values of the organisation, so they can immediately
become brand ambassadors. According to Cushen (2009), once employees begin to
internalise the employer brand values they will be able to deliver the brand promise and
experience externally.
According to King and Grace (2010) the management of the organisation’s internal brand is
based on the proposition of an exchange between organisation and employee of material goods
for commitment and hard work. Its success is defined by the working environment and whether
it is favourable for its employees, in order to foster that brand loyalty and commitment that is
essential in a strong internal employer brand. A well-developed internal brand will culminate
in increased organisational identification from its employees and this has been found to reduce
turnover and increase performance in employees (Riketta 2005).
An organisation’s internal brand can be communicated through formal sources such as policies,
procedures, training and development initiatives which signify the organisation’s obligation
and value that they place in their employees. Informal sources also aid to communicate the
brand such as the spread of values and messages from co-workers and managers (Miles and
Mangold 2005). Effective communication between employees and management is the key in

13
communicating the internal brand. However, a breakdown in this communication can be
detrimental and can result in the internal brand message not being shared between internal
stakeholders (Punjaisri and Wilson 2007).
2.4 Attraction
Employer attractiveness is defined as the imagined benefit prospective employees imagine to
be achieved by working for a specific organisation. (Berethon et al., 2005) According to
Backhaus and Tikoo (2004) people wanted to be viewed positively and therefore candidates
that are able to identify themselves with the brand or persona of the company are far more
likely to seek employment with that company. Highhouse et al., (2007) agreed with the findings
of Backhaus and Tikoo (2004) and further expanded on it by explaining this phenomenon with
two types of attraction: firstly, “social adjustment need” which is where candidates will wish
to identify themselves with the positive image of an organisation, because by working for an
organisation that is held in high regard, the individual’s public identity is strengthened leading
to social approval. Secondly, Highhouse et al., (2007) spoke about “value expression”.
Similarly, a person that is high in value expression is concerned with working for a highly
reputable organisation- they need to feel pride in their organisation.
Hedlund et al., (2009) note that an organisation is found to be attractive if candidates want to
apply to roles in it, are then engaged in their roles and intend to stay. Previously organisations
relied heavily on their tangible benefits i.e. compensation packages in order to ensure they
attracted the best talent in the market; however, it is now acknowledged that there are other
factors that impact candidate attraction to organisations. Intangible benefits such as
recognition, praise, flexible working agreements have also been found to increase motivation
and organisational commitment and it has been found that candidates are attracted to employers
that provide a good work-life balance (Saqib et al., 2015).
Talent attraction has always been one of the key functions of human resource management
(HRM) alongside performance management, talent management, reward, retention, planning,
change management etc. While each of these functions are extremely important and critical to
organisational success the function of attraction, recruitment and selection of talent is the one

14
that can be the most impactful and necessary for the continued success of an organisation.
Leonard’s (2000) now iconic statement of how organisations “live and die on the basis of their
ability to attract the right talent for the job” is more pertinent than ever before in today’s current
tight labour market.
Nolan and Harold (2010) agree with Backhaus and Tikoo (2004), Highhouse et al., (2007)
notion that applicants are attracted to organisations whose image correlates with their own
perceived self-image. They go on to describe how an organisation’s image has two
components, these being, “instrumental attributes” and “symbolic meanings” with the latter
relating to feelings and perceived fit of the employee to the organisation, and the former
relating to location, remuneration etc. Slaughter et al., (2004) echo this sentiment with their
observation that an organisation’s brand and image is developed through both their advertising
strategies, products and services and also by their employees, customers and actual locations
of their businesses. Both components will aid a prospective employee in deciding whether an
organisation shares the values that they deem to be important and reflective of themselves, as
ultimately this will influence their attraction to a particular organisation (Nolan and Harold
2010; Backhaus and Tikoo 2004; Slaughter et al., 2004).
An extremely popular method of measuring organisational attractiveness was first employed
by Fisher et al., (1979) where they used three measures: company attractiveness, intent and
prestige. These three measures have been used by numerous researchers in the years since then
(Highhouse et al., 2003). Company attractiveness reveals an individual’s feelings towards a
particular organisation but does not necessarily imply that the individual will act on these
feelings. Intent however takes it a step further and reveals whether the individual intends to act
on these feelings. Prestige looks into the organisation and whether its reputation is perceived
to be positive or negative by the individual and the public (Highhouse et al., 2003).
As noted by Berethon et al., (2005) the more attractive an organisation is perceived to be then
the stronger the employer brand is. There are numerous means that can be employed to build a
strong employer brand and therefore increase attraction, retention and overall satisfaction. One
of the more popular strategies utilised by organisations in recent years is through the use of
Corporate Social Responsibility (CSR) programs. Such an approach had a two-pronged effect
as it not only delivers a source of competitive advantage through enhancing their employer

15
brand but also ticks a box for them in terms of philanthropy. CSR has been proven to be a
deciding factor in job selection, Bustamente (2014), Kim and Park (2011) in addition to
organisational commitment Brammer et al., (2007). Organisations have begun to successfully
blend their CSR strategy with their employer brand and now it is difficult to differentiate which
purpose came first. Undoubtedly, an organisation that clearly shows signs of caring about their
corporate social responsibility has a positive reputation as a result of it. Bustamente (2014)
notes that this shift into utilising CSR as a brand strategy came about as a result of the global
financial crisis. Organisations, with the intention of rebuilding the trust that had been broken
in them developed robust strategies to improve their image.
2.5 Retention and Turnover intent
Over the past number of years, the labour market has become very much candidate driven.
Organisations are constantly challenged by high attrition rates with employees changing
employers more frequently than ever before. While some of this may be unavoidable due to
retirement and natural attrition, losing one’s key employees to competitors can be detrimental
to an organisation’s performance as a result of valuable knowledge and skills being lost
(Beardwell and Claydon 2010).
High employee turnover may also have a harmful effect on the organisation’s culture and
morale of its existing employees (Tanova and Holtem 2008). Therefore, it is crucial that
organisations take necessary steps to increase its retention rates and reduce turnover. In order
to do so, they will need to fully comprehend the elements that encourage employees to remain
committed to their organisation (Pilbeam and Corbridge 2010).
The concept of employer branding as a retention tool is a relatively new one. According to
Taylor (2002) organisations should make their employment offering so differentiated and
superior to that of its competitors that their employees would never be tempted to leave. If an
organisation develops and utilises its employer brand effectively, it will result in the transfer
of an employee from a contract of employment to psychological contract.
The concept of the psychological contract is directly linked to employer branding strategies.
Branding experts have taken the psychological contract theory and formed the basis of their

16
branding strategies with the intention of forming a psychological contract with their
employees. According to Rousseau (1995), the psychological contract refers to the subtleties
of the working relationship between employer and employee and it is what affects an
employee’s behaviours and feelings while on the job. Employees no longer are solely
motivated by money and in order to retain talent, organisations are seeking to maintain a
bond with them through the development of their psychological contract through building a
strong employer brand loyalty (Capelli 2001). An organisation can begin to build the
psychological contract from the recruitment stage and build on it throughout the employment
life cycle. Components of the psychological contract can include developmental
opportunities, job security, trust in management, fairness and equality, and trust in the
employer to keep the promises it made. (Armstrong 2001) However, the psychological
contract can be broken when an organisation forgets about the promises it has made to its
employees and instead focuses solely on its own goals and targets. This can then result in an
increase in turnover. (Rousseau 1995) Chiang et al., (2013) found Employer Branding to
have a positive connection with the psychological contract as it positively influenced the
behaviours and attitudes of its employees.
A strong employer brand has been recognised to induce “organisational identification” in
employees, which has according to “social identity theory” been proven to be a powerful
predictor of turnover intention (Riketta 2005). Employees that display high levels of
organisational identification can be utilised by the organisation as champions of the brand and
communicate it to other employees.
Turnover intention has been defined as the likelihood that an individual will change their
employment within a specified timeframe. (Souza-Poza 2007) While Lacity et al., (2008)
described it as “the extent to which an employee plans to leave an organisation”. However,
turnover intent is not categorical and there is a difference between turnover intent and actual
turnover that has been measured in various studies. (Byrne 2005; Steensma et al., 2004)
Obviously high turnover rates are strongly correlated with high turnover intention.
2.6 Previous Studies
From a thorough review of the literature it is clear that the topic of employer branding and its
use as tool for attraction and retention of top talent is a valuable one. While there have been

17
similar studies undertaken in previous years (Sokro 2012; Ilesanmi 2014; Botha 2011; Kheswa
2014; Kidrakarn 2014), their research has been based on their home countries all of which are
non EU countries. Furthermore, to date the majority of the research on employer branding has
been carried out using an external perspective with very little research carried out on its role in
retaining and being attractive to current employees.
Therefore, as there is a substantial gap in the research carried out to date, I propose that my
research shall aim to bridge that gap by providing a detailed analysis into the benefits of using
employer branding as a tool to attract and retain talent in the Irish organisations.
3.Research Methodology
3.1 Research Objectives
The main objectives of this dissertation are to:
1. Ascertain whether employer branding is a valuable tool in attracting candidates in Irish
organisations;
2. To establish if employer branding is a valuable tool in retaining employees in Irish
organisations.
3.2 Research Philosophy
According to Saunders et al., (2008) the research philosophy that a researcher chooses can
indicate their very outlook on life and when deciding which philosophy to use the researcher
should use their research question as a guide. There are two main ways of looking at research
philosophy, these are ontology and epistemology.
“Ontology is concerned with the nature of reality”. (Saunders et al., 2008) It is generally
associated with business and management researchers, those who tend to be more practical and
realistic with their research. Ontology has two aspects to it - objectivism and subjectivism
(Quinlan 2011).
Epistemology is related to knowledge, both what constitutes knowledge and also what creates
knowledge. There are three main views to epistemology: positivism, interpretivism and realism
(Saunders et al., 2008).

18
In summary Ontology is concerned with what is true and Epistemology is focused on
discovering and understanding those truths. Saunders et al., (2008) note that neither philosophy
is better than the other. It is just simply dependant on what is being researched and by whom.
3.2 Secondary Research
Both primary and secondary research methods were used for this piece of research. In the first
instance secondary research was employed, the findings of this can be found in the literature
review section. This secondary data was gleaned from academic journals, websites and books
related to the topic being researched. The researcher focused the bulk of her secondary research
on previous studies directly linked to her own topic. This allowed her to find a gap in their
research and also to avoid doubling up on research that had already been carried out. The main
disadvantage associated with the secondary data collected in this piece of research, is that the
notion of employer branding is a relatively new one and therefore there is a limited amount of
secondary data available.
3.3 Research Approach
One can either adopt a deductive approach or an inductive approach to research. According to
Bryman and Bell (2011), a deductive approach is aimed at testing theory, whereas an inductive
approach is concerned with developing new theories. As a result of this, deductive approaches
use quantitative research methods, while inductive use qualitative. However this is not a set
rule. Gabriel (2013) Bryman and Bell (2011) go on to note that deductive approaches tend to
follow a more linear pattern while inductive approaches to research can more iterative and not
necessarily following a specific configuration.
As the purpose of this research is to examine the correlation between three variables the use of
a deductive approach is the more suitable to test the hypothesis stated for this thesis, which
has been of course derived from existing literature and theories. This approach will allow a
much wider sample to be researched and in this instance give much deeper insights into the
question at hand.

19
3.4 Primary Research
In research one can either use quantitative research, qualitative research or a combination of
both methods. Quantitative research uses questionnaires, surveys or experiments to generate
numerical data in the form of statistics. Quantitative research can focus on a large number of
participants and can make deductions on a whole population by using a sample (Bryman and
Bell 2011). Quantitative research is generally linked with a positivist research philosophy and
deductive research approach, both of which are extremely relevant to this piece of research.
However, in the future a qualitative research approach could be used to give more depth into
this area.
Qualitative research is non-calculating in nature and instead focuses on discovering underlying
factors rather than measuring numbers through the use of interviews, focus groups and
observations. (Bryman and Bell 2011) Qualitative is more descriptive by nature and evaluates
thoughts and feelings (Barnham 2015).
Mixed method research is another method that is commonly used, this is where the researcher
utilises a mixture of quantitative and qualitative research. (Horn 2009) While such a method
can provide increased depth compared to the use of a single method, it can be quite time
consuming and was deemed to be unnecessary for this piece of research.
For the purpose of this piece of research the use of a deductive quantitative research approach
has been deemed to be the most appropriate to use. The researcher felt that in order to reach a
wider population and taking into consideration time-constraints and convenience chose to do
quantitative research.
The quantitative data was collected using an online survey tool called Question Pro in the form
of a self-completed questionnaire that was distributed via email and various social media
channels. Self-completed questionnaires allow the respondents to remain completely
anonymous which can encourage completion by a wider population. They also enable the
researcher to reach a wider audience. The anonymity provided by a self-completed
questionnaire has been found to enable respondents to answer questions more truthfully and
therefore the results may be more reliable than other methods. (Nardi 2003) The questionnaires
were constructed mainly using two well tested scales with some demographic and open ended
questions also included.

20
3.5 Ethical Considerations
Confidentiality for the participants of the research was the primary concern of the researcher.
Each survey was completed on a completely anonymous basis and participation was voluntary.
At no time was any personal information requested and participants were able to withdraw
from the survey at any stage during the process. Contact details of the researcher were provided
to each respondent should they wish to receive a summary of the findings of the research.
3.6 Data Analysis
Data was analysed using SPSS software. Data was firstly exported to Excel from Question Pro
and the copied to SPSS. Once in SPSS the data had to be cleaned and sorted in order to begin
analysing.
3.7 Sample
Convenience sampling was the method employed to collect data for this dissertation. The
researcher utilised her network of connections from LinkedIn to collect the data. As a former
recruiter, she has an extensive network of business professionals at her disposal and decided
the most suitable and convenient method to gather a sample from Irish organisations was to
use the business networking site.
While it may seem to be an ad-hoc method of collecting results, it actually was more strategic
than that. This network of professional business connections has been cultivated and grown
over a five year period and contains countless valuable contacts and connections. The purpose
of having such a network was to not only have a suitable candidate pool to recruit from but
also for the purpose of business development and networking. This sampling method allowed
access to a unique sample of considerable value. Having recruited previously up to senior
executive level, the range of respondents that were asked to complete the questionnaire was
vast and wide reaching.
The questionnaire was shared on LinkedIn to a possible 3,500 connections but with the request
that only individuals based in Ireland complete it. The researcher initially hoped to collect 100

21
completed questionnaires but the response rate exceeded expectations with 198 completions of
the questionnaire.
3.8 Characteristics of Respondents
In order to gain further insight into the characteristics of the participants, descriptive statistics
were used through SPSS. As mentioned previously, there were 198 participants to the survey.
As can be seen below in the table below showing the gender of respondents 42.4% of
respondents were male and 57.6% of respondents were female.
Frequency Percent Valid Percent
Cumulative
Percent
Valid Male 84 42.4 42.4 42.4
Female 114 57.6 57.6 100.0
Total 198 100.0 100.0
Gender
The table below shows the age demographic of participants. The largest age range surveyed
belonged to the 30-39 age bracket with 42.9% of respondents falling into this category. The
smallest age range surveyed was the 60-69 age bracket, with only 2.5% of participants
belonging to this category.
Frequency Percent Valid Percent
Cumulative
Percent
Valid 18 to 29 Years 55 27.8 27.8 27.8
30 to 39 Years 85 42.9 42.9 70.7
40 to 49 Years 34 17.2 17.2 87.9
50 to 59 Years 19 9.6 9.6 97.5
60 to 69 Years 5 2.5 2.5 100.0
Total 198 100.0 100.0
Age
22
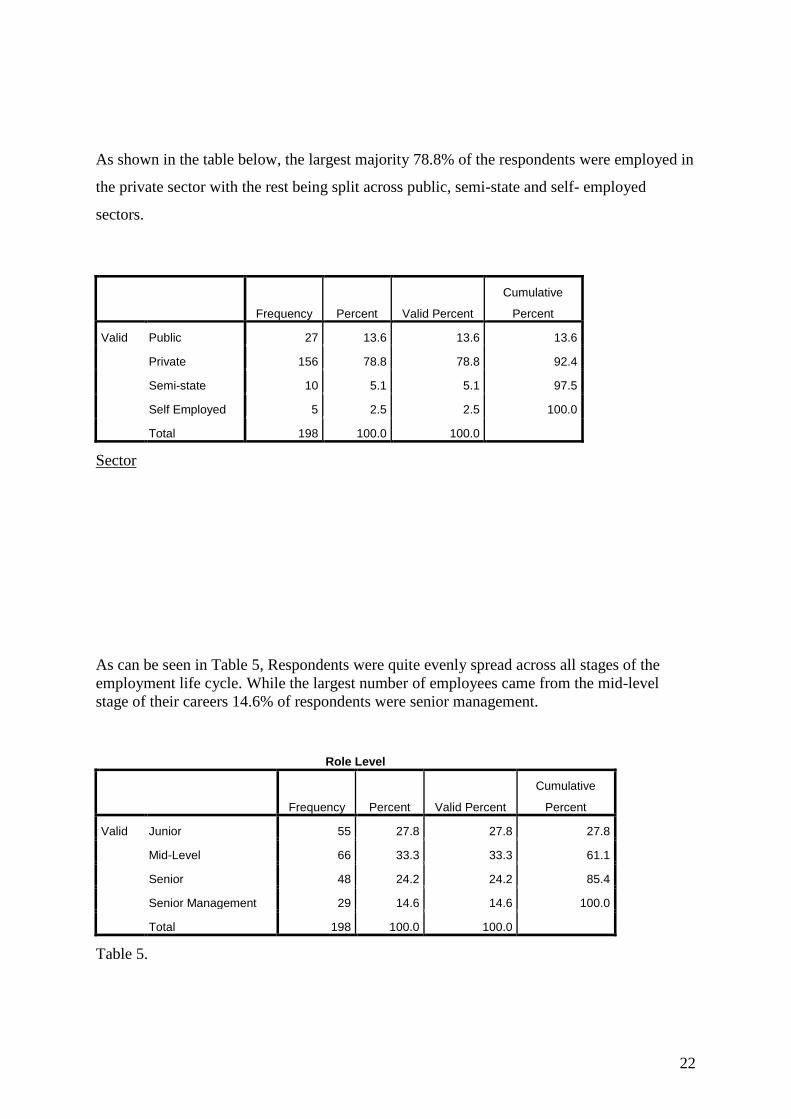
As shown in the table below, the largest majority 78.8% of the respondents were employed in
the private sector with the rest being split across public, semi-state and self- employed
sectors.
Frequency Percent Valid Percent
Cumulative
Percent
Valid Public 27 13.6 13.6 13.6
Private 156 78.8 78.8 92.4
Semi-state 10 5.1 5.1 97.5
Self Employed 5 2.5 2.5 100.0
Total 198 100.0 100.0
Sector
As can be seen in Table 5, Respondents were quite evenly spread across all stages of the
employment life cycle. While the largest number of employees came from the mid-level
stage of their careers 14.6% of respondents were senior management.
Role Level
Frequency Percent Valid Percent
Cumulative
Percent
Valid Junior 55 27.8 27.8 27.8
Mid-Level 66 33.3 33.3 61.1
Senior 48 24.2 24.2 85.4
Senior Management 29 14.6 14.6 100.0
Total 198 100.0 100.0
Table 5.

23
The final table below indicates whether or not respondents split by role level have individuals
reporting into them. This will give an indication of the seniority of the roles.
Role Frequency Percent Valid Percent
Cumulative
Percent
Junior Valid Yes 5 9.1 9.1 9.1
No 50 90.9 90.9 100.0
Total 55 100.0 100.0
Mid-Level Valid Yes 26 39.4 39.4 39.4
No 40 60.6 60.6 100.0
Total 66 100.0 100.0
Senior Valid Yes 28 58.3 58.3 58.3
No 20 41.7 41.7 100.0
Total 48 100.0 100.0
Senior Management Valid Yes 27 93.1 93.1 93.1
No 2 6.9 6.9 100.0
Total 29 100.0 100.0
Reports
3.9 Scale Identification and Reliability
To test employer brand and attraction the 25 item EmpAt (Employee Attitudes) scale was used.
Berethon et al (1995) devised the unique EmpAt scale to assess the dimensions of employer
attractiveness in employer branding. This scale has been proven to measure the strength of an
organisation’s employer brand by how attracted an individual is to it in relation to the 25 items.
EmpAt has been used in several studies since it was developed, for example, Broeke (2015);
Tamoniene (2015); and Arrehag (2014).
The scale consists of 25 items which measured five constructs: “interest value, social value,
economic value, development value and application value”.
Interest value evaluates whether an exciting workplace, that is highly innovative is a factor in
attracting the individual to the organisation and to what extent. Social value investigates

24
whether a happy working environment with colleagues that are friends is an indicator of
attraction and also the level of it. Economic value focuses on the extent that compensation
affects attraction. Development value assesses how attracted an individual is to an organisation
because of its career progression and developmental opportunities and finally Application
value focuses on the extent an individual would be attracted to an organisation that would allow
them to give back either in charitable means or also in terms of developing others in the
organisation (Berethon et al 2005).
The second scale used in this study was the Turnover scale (tis-6) as developed by Roodt
(2004). This scale has been proven to measure an employee’s intent to leave their current
employment using a 6 item scale (Bothma and Roodt 2013). Originally it contained 15 items
but has been narrowed to be a 6 item scale which is known as Tis-6. It has been validated and
proved to be a highly reliable method of deducing turnover intent among employees by several
researchers including Bothma and Roodt’s (2013) study which investigated its reliability.
Firstly, the aim of this research is to measure, using EmpAt, whether an organisation’s
employer brand is a factor in attracting prospective candidates. Secondly Tis-6 will measure
the same individual’s intent to leave, in order to deduce whether a strong or weak brand
correlates with turnover intent.
3.10 Scale Reliability
In order to assess reliability of scales used, it is necessary to have both scales undertake the
computation of coefficient alpha (Cronbach 1951) or more commonly known as Cronbach’s
alpha. It is widely noted across academia that Nunnally (1978) deemed a Cronbach Alpha score
of 0.70 or above to be accepted to be reliable.
The results for this particular sample are detailed below but in summary, all are deemed to be
reliable with the exception of Economic Value which scored 0.593 and Application Value
which was borderline at 0.683. This was somewhat surprising as Berethon (1995) found each
value to have a Cronbach of 0.91 and this scale has been widely reported by other researchers
to be reliable. However, the researcher acknowledges that the demographic makeup of the
sample she surveyed was very different to that of Berethon et al., (1995). Berethon et al., (1995)
study focused on students in Australia whereas this piece of research is focused on

25
professionals in Ireland. The researcher recognises that while these scales may be deemed to
be unreliable it, is necessary for the purpose of this dissertation to continue with the research.
3.10.1 Interest Value reliability results
Table 1 and 2 below outline the results of the reliability analysis on Interest Value. There were
198 responses across five items which contributes to the overall Interest Value composite score.
For Interest Value a Cronbach Alpha score of 0.717 is reported.
Case Processing Summary
N %
Cases Valid 198 100.0
Excludeda 0 .0
Total 198 100.0
Table 1.
Reliability Statistics
Cronbach's
Alpha N of Items
.717 5
Table 2.
3.10.2 Social Value Reliability results
Table 3 and 4 below outline the results of the reliability analysis on Social Value. There were
198 responses across five items which contributes to the overall Social Value composite score.
For Interest Value a Cronbach Alpha score of 0.809 is reported.
Case Processing Summary
N %
Cases Valid 198 100.0
Excludeda 0 .0
Total 198 100.0
Table 3.
Reliability Statistics
Cronbach's
Alpha N of Items
.809 5
Table 4

26
3.10.3 Economic Value Reliability results
Table 5 and 6 below outline the results of the reliability analysis on Economic Value. There
were 198 responses across five items which contributes to the overall Economic Value
composite score. For Economic Value a Cronbach Alpha score of 0.593 is reported.
Case Processing Summary
N %
Cases
Valid 194 98.0
Excludeda 4 2.0
Total 198 100.0
Table 5.
Reliability Statistics
Cronbach's
Alpha N of Items
.593 5
Table 6.
3.10.4 Developmental Value Reliability results
Table 7 and 8 below outline the results of the reliability analysis on Developmental Value.
There were 198 responses across five items which contributes to the overall Developmental
Value composite score. For Developmental Value a Cronbach Alpha score of 0.752 is reported.
Case Processing Summary
N %
Cases Valid 198 100.0
Excludeda 0 .0
Total 198 100.0
Table 7.
Reliability Statistics
Cronbach's Alpha N of Items
.752 5
Table 8.

27
3.10.5 Application Value Reliability results
Table 9 and 10 below outline the results of the reliability analysis on Application Value. There
were 198 responses across five items which contributes to the overall Application Value
composite score. For Application Value a Cronbach Alpha score of 0.683 is reported.
Case Processing Summary
N %
Cases Valid 198 100.0
Excludeda 0 .0
Total 198 100.0
Table 9.
Reliability Statistics
Cronbach's Alpha N of Items
.683 5
Table 10.
3.10.6 Turnover Intent Reliability results
Table 1 and 2 below outline the results of the reliability analysis on Turnover Intent (Tis-6).
There were 198 responses across five items which contributes to the overall Turnover Intent
composite score. For Turnover Intent a Cronbach Alpha score of 0.792 is reported.
This result was very similar to the one Bothma and Roodt (2013) achieved when the validated
Roodt (2004) scale.

28
Case Processing Summary
N %
Cases Valid 198 100.0
Excludeda 0 .0
Total 198 100.0
Table 1.
Reliability Statistics
Cronbach's Alpha N of Items
.792 6
Table 2.
4. Results
In this section we present the results associated with this research. We first present a descriptive
overview of the characteristics of each variable under consideration. We present both graphical
representations and numerical measures of centre and dispersion.
4.1 Description of Variable Distributions
Figures 1 through to 6 present a description of each variable’s distribution. As can clearly be
seen each distribution is positively skewed, with the exception of turnover which is symmetric.
This positive skew would indicate that the vast majority of respondents - low values indicating
acceptance - feel that the measure is important with respect to branding.
Figures 1 to 5 are related to Employer Branding and Attraction. A positive skew is indicative
of a positive correlation between the five components, Berethon et al (2005), associated as
being contained in an organisation’s employer brand and how attracted an individual is to an
organisation as a result of them. As stated above and can be seen below in Figures 1 to 5, our
results have found there to be a highly positive skew and can therefore confirm a strong
relationship between employer branding and candidate attraction.

29
Figure 1.
Figure 2.
Figure 3.
Figure 4.
Figure 5.
Figure 6
Figure 1. which relates to Interest Value clearly indicates that the respondents found
innovation, creativity, and excitement to be extremely important to them when selecting an
organisation to work for. It indicates that an organisation that has these attributes is extremely
attractive. This is not surprising, with organisations that display these characteristics such as
Google and Facebook, constantly topping employer of choice awards.
As can be seen in Figure 2, respondents surveyed valued a happy, safe working environment
and that relationships with both colleagues and superiors were of value. It is clear that
organisations that display these characteristics are indeed attractive. The notion that social

30
value would be an indicator of a strong Employer Brand is indeed in agreement with the
literature, specifically on the idea of the psychological contract. As mentioned previously
Armstrong (2001) found job security and trust in management to be important components of
the psychological contract and therefore an employer’s brand.
Figure 3. shows the relationship between employer brand and Economic Value, which is again
positively skewed indicating that respondents valued promotional opportunities, job security
and generous compensation packages. It indicates that if an organisation was displaying these
characteristics that they would indeed be attracted to it. Economic Value as a component of
Employer Brand is directly linked with Nolan and Harold (2010) idea that an Employer Brand
has two key components, “instrumental attributes” being the one similar to economic value as
it relates to remuneration and other tangible benefits incurred as a result of working for the
organisation.
Developmental Value as can be seen in Figure 4 is an important component of an organisation’s
brand and one that respondents found to be very important. It shows that there is a positive
relationship between how working for a particular organisation makes a person feel and if they
would be attracted to work there. The Respondents who feel this value is very important, need
to feel pride in their organisation and a feeling of belonging. Backhaus and Tikoo (2004) as
seen in the literature also found that individuals will be attracted to an organisation that will
either fit with their own perceived persona or indeed improve it. This is in agreement with
Highhouse et al., (2007) theory of “social adjustment need” where they found that individuals
will want to identify themselves with the positive image of an organisation and Nolan and
Harold 2010 idea of “symbolic meanings” which relates to feelings or perceived fit with the
organisation.
Figure 5. Shows the positive skew between Application Value and organisational attraction.
Organisations that are highly focused on CSR or perhaps NGO’s or Humanitarian aid
organisations would certainly be highly attractive to respondents who rate this value highly.
Application Value is similarly related to Highhouse et al., (2007) theory of “value expression”

31
where people that are high in value expression are concerned with working for a highly
reputable organisation.
Finally Figure 6. Indicates the symmetrical score between Employer Branding and Turnover
Intent. It shows that there is little or no relationship between these two items. This is in contrast
to some of the reviewed literature where Sokro (2012) research found that 82.8% of their
respondents that felt their organisations brand image had positive values intended to stay for at
least five years more and Ilesanmi (2014) who also found that individuals that found their
organisations employer brand to be strong did not intend to leave. Their research was obviously
carried out on a very different sample, in Sokro’s case it was focused in Ghana while Ilesanmi’s
was in Nigeria. Chiang et al., (2013) research into the correlation between Employer Brand
and the psychological contract which led to organisational commitment by the employees and
then their intention to stay, reported a positive correlation. However, the findings are in line
and supportive of Badawy et al., (2015) Egyptian study on the effect Employer Brand has on
retention and motivation. They found that there was an insignificant correlation between
Employer Brand and Retention
Table 1 presents an overview of a number of numerical measures of centre (mean and median)
and a number of measures of dispersion (std. Dev, Skewness). Recall that a value of 3 on each
scale indicates neither agreement or disagreement. Clearly, with the exception of Turnover, all
other scales have average values of less than 3 which indicates that they strongly agree, this
clearly supports the graphical interpretation that was presented above.
Table 1.

32
4.2 Relationship between Employee Branding Subscales and Turnover Intent
Figures 1 to 5 show the relationship between the Employer Branding subscales and Turnover
Intent. Figure 1 indicates that the connection between Interest Value and Turnover Intent is
neutral. One does not have effect on the other. Figure 2 suggests that again the relationship
between Social Value and Turnover Intent is also neutral. Figure 3 which denotes the
connection between Economic Value and Turnover Intent indicates a very slight relationship
between these two factors. Figures 4 and 5 which show the relationship between
Developmental Value and Application Value and Turnover Intent show that the relationship is
again neutral or that there is no significant relationship. These results as noted above are in
agreement with Badawy et al., (2015) but in disagreement with Chiang et al., (2013); Ilesanmi
(2014); Sokro (2012).
Figure 1
Figure 2
Figure 3

33
Figure 4
Figure 5
4.3 Correlation Analysis
As can be seen in the table below, a correlation analysis between the components of Employer
Branding and Turnover Intent was carried out. The correlation analysis found that the
correlation between Employer Branding and Turnover Intent was neither positive nor negative
but in fact neutral. Therefore, for the purpose of this dissertation and based on the sample of
individuals surveyed there is no correlation between Employer Brand and Turnover Intent.
This indicates that for this particular sample of respondents, although an organisation’s
employer brand would be a factor in attracting them it would not be a factor in retaining them.
Possible reasons for this could be based on the sample tested. Perhaps for these individuals
there are other factors that may influence their intent to leave. Another possible factor resulting
in this neutral score could be the reduction on the “job for life” mentality. Modern employees
and certainly the individuals sampled that are regular users of LinkedIn which is predominantly
used as a recruitment tool/networking site, no longer expect to work in a job for 35 years and
then retire. They instead are now open to and actively seeking their new employment which
would certainly concur with the findings of this piece of research. Regardless of how strong an
organisation’s employer brand is, these individuals plan to leave their current employments at
some stage in the future and therefore are indifferent to their organisation’s employer brand
once employed, as it will not be a deciding factor when considering a career move.
Although it has been widely proved that correlation does not imply causation, for this research,
the lack of association certainly does indicate no causation. It should be again noted at this
point that two of the scales received Cronbach Alpha scores of less than the required 0.7 which

34
was in contrast to Berethon et al., (1995) own Cronbach Alpha score of 0.91. That is not to
imply that it impacted the findings, it is just acknowledged.
Interest Value
Composite
Economic Value
Composite
Social Value
Composite
Development
Value Composite
Application Value
Composite
Turnover Intent Composite -.025 -.210 .072 -.040 -.092
.725 .003 .312 .571 .198
198 198 198 198 198
Correlations
3.4 Further Analysis
While the above correlation analysis clearly shows no correlation between Employer Brand
and Turnover Intent a further analysis was carried out to investigate whether the results would
differ if focused on any particular demographic. A number of tests were carried out using SPSS
using demographic characteristics such as education, level of role, gender and age. Only one
demographic characteristic was found to have a linkage between Employer Brand and
Turnover Intent, this was the age demographic characteristic. As can be seen below in Figure
1, 2 and 3 when splitting the sample by the demographic characteristic ‘age’ there is a clear
linkage between Economic Value and Turnover Intent in respondents aged between 18-29 ,40-
49 and 50-59 which is in contrast to the above findings. However Economic Value is only one
of five components of Employer Branding Berethon et al., (1995), and therefore does not
indicate a complete correlation.
Of all the values, for there to have been a relationship with this, possibly the least surprising is
the 18-29 demographic group which is generally the lowest paid in an organisation and
consequently the most motivated by money, thus making them the most likely to leave should
higher remuneration be possible in another organisation. It is somewhat surprising in the 40-
49 and 50-59 demographic groups as they are usually the ones who are better paid and have
achieved financial success and security in their roles.

35
Figure 1
Figure 2
Figure 3
As can be seen in the table below, a correlation analysis between the components of Employer
Branding and Turnover Intent and split by the demographic characteristic age was carried out.
The correlation analysis found that as stated above, there was indeed a correlation between age
and the effect Employer Branding has on Turnover Intent when related to Economic Value
specifically in the age groups 18-29, 40-49 and 50-59. The other age groups are seemingly
unaffected.

36
Correlations
Age
Turnover Intent
Composite
18 to 29
Years
Economic Value
Composite
Pearson
Correlation -.386
Sig. (2-tailed) .004
N 55
30 to 39
Years
Economic Value
Composite
Pearson
Correlation -.056
Sig. (2-tailed) .610
N 85
40 to 49
Years
Economic Value
Composite
Pearson
Correlation -.371
Sig. (2-tailed) .031
N 34
50 to 59
Years
Economic Value
Composite
Pearson
Correlation -.373
Sig. (2-tailed) .116
N 19
60 to 69
Years
Economic Value
Composite
Pearson
Correlation .049
Sig. (2-tailed) .938
N 5
3.5 Limitations of study and recommendations for future research
The main limitation of this study was the method of sampling employed and that the research
was not based within a specific organisation. While convenience sampling was indeed the most
convenient method it is certainly not the most accurate. On reflection, having completed the
research, the researcher acknowledges that in order to ascertain truly if an organisation’s
Employer Brand effects attraction and retention to it, further research should be carried out
with employees of an individual organisation. Furthermore, using a combination of qualitative
and quantitative research would provide deeper insight into the matter.

37
5. Conclusion
The aim of this dissertation was to examine whether Employer Branding was a valuable tool
in attraction and retention for Irish organisations. A thorough review of relevant literature was
carried out and a gap in research identified which formed the basis for this dissertation. Upon
identifying this gap, all research methodologies were considered and quantitative research
method was selected on the basis of being the most suitable and enabling the researcher to
reach a larger sample.
A unique sample was surveyed for the purpose of this dissertation. The researcher utilised her
LinkedIn network of business professionals. Although seemingly ad-hoc, the method of data
collection gathered for the purpose of revenue generation and new business development,
contained valuable and worthwhile respondents.
Data was collected and analysed and the main findings that were uncovered were that:
Employer Branding is indeed a valuable tool in attracting candidates for Irish organisations.
This was in agreement with the original findings of Backhaus and Tikoo (2004) and Highhouse
et al., (2003) and also corresponded with the more recent research carried out by Sokro (2015).
However, the findings of this piece of research indicate that the respondents surveyed felt that
none of these components of Employer Brand impacted their turnover intent and therefore
would not be of benefit in retaining employees.
Our findings indicate that Employer Branding does not seem to have any correlation with
Turnover Intent and therefore cannot be a valuable tool in retaining employees in Irish
organisations. The researcher found the second finding to be not only largely in contradiction
to the research and literature reviewed, but also inconsistent to her own beliefs. However, the
researcher acknowledges that what may be of value to her may not be of value to others. In
relation to the lack of evidence indicating a correlation between Employer Brand and retention,
it appears that for the respondents surveyed none of the components of Employer Brand that
Berethon et al., (1995) indicated have any impact on their intent to stay or leave their
organisation.
This contradicts the whole notion of the psychological contract (Rousseau 1995). Armstrong
described components of the psychological contract to include: developmental opportunities,
job security, trust in management, fairness and equality, and trust in the employer to keep the
promises it made with Rousseau (1995) noting that the psychological contract can be broken

38
when an organisation forgets about the promises it has made to its employees and instead
focuses solely on its own goals and targets. This can then result in an increase in turnover.
Chiang et al., (2013) found Employer Branding to have a positive connection with the
psychological contract as it positively influenced the behaviours and attitudes of its employees.
In relation to the lack of evidence indicating a correlation between Employer Brand and
retention, it appears that for the respondents surveyed none of the components of Employer
Brand that Berethon et al., (1995) indicated have any impact on their intent to stay or leave
their organisation. This was in contrast to the findings of Ilesanmi (2014) and Sokro (2012)
who found there to be strong linkages between Employer Branding and retention and Chiang
et al., (2013) who found that Employer Branding would create a psychological ownership
between the employee and the brand similar to Rousseau’s (1995) psychological contract and
would therefore increase retention.
Nevertheless, this research has undoubtedly proven that Employer Brand is a valuable tool in
attracting candidates to Irish organisations and thus is an area worthy of allocating resources
to. Recruitment costs can be extremely high for organisations and having a strong Employer
Brand that is recognisable and substantial in the market will be of great value to organisations.
The recommendations given below will provide cost effective methods that should not only
increase satisfaction in existing employees but also strengthen the external Employer Brand.
6. Recommendations and Costings
Although this piece of research has found that there is no relationship between Employer Brand
and retention, it does indeed recognise the value of Employer Branding in attraction or
recruitment. Many organisation need to employ the aid of recruitment agencies in order to
secure top talent for their organisations at considerable expense when in fact they should focus
on building and strengthening their employer brand as a means of attracting employees.
I have taken inspiration from Berethon et al., (1995) EmpAt scale for my recommendations
and focused on low cost options that will not only build and strengthen the employer brand but
increase satisfaction.

39
6.1. Interest Value
“The organisation both values and makes use of your creativity” (Berethon et al., 1995). As a
method of inspiring and encouraging creativity, an organisation could allow its employees to
have some allocated time to work on ideas or projects of their own interest on that are not
particularly related to work. Something like one half day per month would be sufficient. Such
an initiative would not only be a great benefit for employees but will also have a strengthening
effect on the psychological contract.
6.1.1 Costings
Allocating some flexi time to employees would have minimal costs associated with it except
the loss of earnings associated with each employee. However, the types of employees that
would value and make use of this time, would be inclined to make up their workload in the rest
of the month anyway, so the organisation would be unlikely to be at a disadvantage as a result
of such an initiative.
6.2 Social Value
“Having a good relationship with your colleagues and superiors and fun working
environments” (Berethon et al., 1995). Organisations should encourage employee run social
clubs and help facilitate them. Candidates now are interested in what else organisations offer
outside of remuneration packages and factor-in all elements offered when making a decision
regarding a desirable place to work. Opportunities for employees of all levels to mix in a social
setting and outside of the office hierarchy can be both good not only for the Employer Brand
but also the satisfaction of employees.
6.2.1 Costings
Social clubs although encouraged by organisations can be subsidised by the employees so cost
should be kept low. For example the club could arrange Yoga, Pilates or HIIT classes on site
for employees and just charge per session, because of the size of the group the cost is minimal.
An average cost for a class of 30 people is around 5 euro per person which also covers
insurance.
6.3 Economic Value
“Good promotion opportunities within the organisation” (Berethon et al., 1995). Regularly
employees can be somewhat vague about promotional opportunities with their organisation.
40
They may not understand the level their own job is graded at and be unaware of the steps
needed to get to the next level. Organisations should have well-defined, transparent career
paths for employees. All roles should be advertised internally in the first instance and external
candidates should not be approached until the internal pool has been exhausted. Too often
discontent occurs in organisations where employees never hear a role has been vacant until an
external candidate is appointed. Organisations should at least allow their employees to compete
for a role. Offering sessions with their experienced HR employees in relation to CV clinics,
interviews skills and mock interviews will at least facilitate promotional opportunities.
6.3.1 Costings
There will be no cost associated with making the internal recruitment process fair and
transparent. Exhausting the internal talent pool will not only show belief in existing staff but
may also reduce external recruitment costs. Utilising existing HR staff to provide clinics also
will not create cost.
6.4. Developmental Value
“Feeling good about yourself as a result of working for a particular organisation” (Berethon et
al., 1995). Introducing a CSR programme will not only improve an organisation’s public image
but also instil pride in its employees. It does not need to be at huge cost either, initiatives like
donating days for employees to work for charities of their own choice are a low cost method
for all involved.
6.4.1 Costing
Again as costs should be minimal for this, donating days and staff to charities will not cost
hugely to the organisation, just the loss of earnings associated with that employee for the day
or days. What it will do for the organisation’s reputation will far outweigh the loss of earnings.
6.5 Application Value

41
“Opportunity to teach others what you have learned” (Berethon et al 1995). A well-run and
designed Mentoring Program will allow employees to utilise their application value and share
their skills and knowledge with other employees. A Mentoring Program will be of great value
not only to the mentee but also the mentor.
6.5.1 Costing
Again there should be no cost for a Mentoring Program as it is utilising senior employees to
act as Mentors to junior ones.
6.6 Timelines for Recommendations
The recommendations that I have suggested are all initiatives that will take a short time to
introduce. All five recommendations could be executed and up and running in no more than a
six month time period.
6.7 Personal Learning Statement
I found the dissertation process to be an extremely challenging one as I can on occasion struggle
with sustaining motivation. It was by far the hardest and most testing element of the Master’s
program. However, having the opportunity to research an area that was of such great interest
to me was extremely rewarding and shall be of great benefit to me in my career. Carrying out
an in-depth investigation into the area of Employer Branding and attraction and retention has
given me a depth of knowledge and expertise that I feel I will continue to build on in the future.
The area of quantitative research was completely new to me and although I found it quite
difficult to grasp, the support of Jonathan in NCI enabled me to be able to analyse and interpret
my data. Taking on something that was so much outside my comfort zone and managing to
succeed in it, will certainly give me confidence to do so again in any future endeavours.
This has been by far the largest piece of research or academic work that I have ever undertaken
or probably will ever undertake. Having to self- motivate and manage my own time efficiently
was a constant struggle but I am very proud that I not only managed to complete this
dissertation but that I was able to do so well ahead of time. It was rewarding to be able to see
a piece of work take shape and to be able to in some way discover findings that I will be able
to take away and apply in my own work.

42
7. Reference List
Al Badawy, A., Fahmy, M. and Magdy, M. (2015). Can Employer Branding Surge the
Retention and Motivation of Egyptian Employees? Competition Forum, 13(2), pp. 253-265.
Al Mehrzi, N, Kumar Singh, S, J. (2016)," Competing through employee engagement: a
proposed framework ", International Journal of Productivity and Performance Management,
Vol. 65 Issue 6 pp 831-843
Ambler, T., and Barrow, S. (1996), ‘The employer brand’, Journal of Brand Management,
Vol.4, pp.185-206.
Armstrong, M. (2001). A Handbook of Human Resources Management Practice. Kogan Page
Limited: London
Backhaus, K., and S. Tikoo, 2004, ‘Conceptualizing and Researching Employer Branding’.
Career Development International, 9(5), 501-517.
Barnham, C. (2015), "Quantitative and qualitative research: perceptual foundations",
International Journal of Market Research, vol. 57, no. 6, pp. 837.
Barrow, S. & Mosley R. (2005). The employer brand: Bringing the best of brand
management to people at work. Chichester, England: John Wiley & Sons Ltd.
Beardwell, J, and Claydon, T. (2010). Human Resource Management – a contemporary
approach, Pearson Education.
Becker, B.E., Huselid, M.A., & Ulrich, D. 2001. The HR scorecard: Linking people, strategy,
and performance. Boston, MA: Harvard Business School Press.
Berethon, P., Ewing, M., and Hah, L. L. (2005), “Captivating company: dimensions of
attractiveness in employer branding”, International Journal of Advertising, Vol. 24, No. 2, pp
151-172.
Bothma, C., and Roodt, G. (2013) “The validation of the turnover scale”. SA Journal of
Human Resource Management; Vol 11, No 1
Brammer, S.; Millington, A. & Rayton, B. (2007): The contribution of corporate social
responsibility to organizational commitment, The International Journal of Human Resource
Management, 18, 10, 1701 – 1719
Bryman, A. & Bell, E., (2011) Business Research Methods. Oxford, Oxford University Press
Byrne, Z., 2005. Fairness Reduces the Negative Effects of Organisational Politics on
Turnover Intentions, Citizenship Behaviour and Job Performance. Journal of Business and
Psychology, 20, 175–200.

43
Capelli, P. (2001). A Market Drive Approach to Retaining Talent. Harvard Business School
Press: Boston
Chiang, H. H., Chang, A., Han, T. S., & McConville, D. (2013). Corporate branding, brand
psychological ownership and brand citizenship behaviour: multilevel analysis and managerial
implications. Journal of General Management, 39(1), 55-80
Cushen, J. (2009), Branding employees. Qualitative Research in Accounting and
Management, 6(1/2), 102-114.
Das, S, C. and Ahmed, Z, I. (2014), "The Perception of Employer Brand to Enhance
Recruitment and Selection Processes", European Journal of Business and Management,
European Journal of Business and Management, Vol.6, No.6.
Davies, G., 2008, ‘Employer Branding and Its Influence on Managers’. European Journal of
Marketing, 42, 667-681.
Foster, C., Punjaisri, K., & Cheng, R. (2010). “Exploring the relationship between corporate,
internal and employer branding”. Journal of Product & Brand Management, 19(6), 401–409.
Fulmer, I., Gerhart, B. & Scott, K. (2003). ‘Are the 100 best better? An empirical
investigation of the relationship between being a “great place to work” and firm
performance’. Personnel Psychology, 56(4), p. 965-993.
Gabriel, D. (2013) “Inductive and deductive approaches to research”. Available at:
http://deborahgabriel.com/2013/03/17/inductive-and-deductive-approaches-to-research/
[Accessed on 02/07/2017]
Harris, F., and de Chernatony, L. (2001), “Corporate branding and corporate brand
performance”, European Journal of marketing, Vol, 35, No. 3/4, pp 441-456.
Hedlund, A.A.M., Andersson, I.M., & Rosén, G. (2010). Assessing motivation for work
environment improvements: Internal consistency, reliability and factorial structure. Journal of
safety research, 41(2), pp.145-151.
Heilmann, P.A., (2010), ‘Employer Brand Image in a Health Care Organization’.
Management Research Review, 33(2),134-144.
Horn, R., (2009) Researching and Writing Dissertations – A Complete Guide for Business
and Management Students. London: CIPD
Ilesanmi, O. (2014). The relevance of Employer Branding in attracting and retaining
employees in Nigeria’s brewery industry. Available at:
http://esource.dbs.ie/bitstream/handle/10788/1808/mba_ilesanmi_o_2014.pdf?sequence=1
[Accessed on 12/03/2017]

44
Jacobs, R. (2005), ‘Turn employees into brand ambassadors’, Bank Marketing, vol. 35, no. 3,
April, pp. 22–6.
Khalid, S., and Tariq, S. (2015) “Impact of employer brand on selection and recruitment
process”, Pakistan Economic and Social Review Volume 53, No. 2, pp. 351-372
Kheswa, P. (2015) “The role of Employer Branding in Talent Attraction and Talent Retention
in South Africa”. Available at: https://core.ac.uk/download/pdf/39675768.pdf [Accessed on
06/06/2017]
Kim, S. & Park, H. (2011): Corporate Social Responsibility as an Organizational
Attractiveness for Prospective Public Relations Practitioners, Journal of Business Ethics 103
(4), 639-653.
King, C., and Grace, D. (2010), “Building and measuring employee-based brand equity”,
European Journal of Marketing, Vol. 44, No. 7/8, pp 938-971.
Lacity, M.C., Lyer, V.V., and P.S. Rudramuniyaiah, 2008. Turnover Intentions of Indian IS
Professionals. Information Systems Frontiers on Outsourcing, 10, 225–241. Mendes, F., and
McGee, G. W. and R. C. Ford, 1987. Two (or More) Dimension of Organizational
Commitment: Re-Examination of the Affective and Continuance Commitment Scales.
Journals of Applied Psychology, 72, 638-642.
Lenaghan, J.A., & Eisner, A.B. (2006). Employers of choice and competitive advantage: The
proof of the pudding is in the eating. Journal of Organizational Culture, Communications and
Conflict, 10(1), 99.
Lenaghan, J. and Eisner, A. 2005, ‘An Exploration of the Competitive Advantage of
Employer of Choice Programs on International Human Resource Management’, HR
Magazine, Vol. 52 No. 3, pp. 1-11.
Leonard, D. (2000) They’re coming to take you away, Fortune Magazine Online, Available
at: http://money.cnn.com/magazines/fortune/fortune_archive/2000/05/29/280609/index.htm
[Accessed on: 03/06/2017].
Love, L.F. and Singh, P. (2011), ‘Workplace branding: leveraging human resources
management practices for competitive advantage through ‘best employer’ surveys’, Journal
of Business and Psychology, Vol. 26 No. 2, pp. 175-181.
Martin, G., Gollan, P.J. and Grigg, K. (2011) ‘Is there a Bigger and Better future for
Employer Branding? Facing up to Innovation, Corporate reputations and Wicked Problems in
SHRM’. The International Journal of Human Resource Management, 22(17): pp. 3618-3637.
McLaren, J. (2011). ‘Mind the gap: Exploring congruence between the espoused and
experienced employer brand’. Thesis for Doctor of Education degree. University of

45
Pennsylvania. USA
Miles, S. J., and Mangold, W. G. (2005), “Positioning Southwest Airlines through employee
branding”, Business horizons, Vol. 48, No. 6, pp 535-545.
Minchington, B. (2006). Your employer brand. Torrensville: Hyde Park Press.
Minchington, B. and Thorne, K. (2007), ‘Measuring the effectiveness of your employer
brand’, Human Resources Magazine, Vol. 12 No. 4, pp. 14-16.
Mosley, R. (2007). Customer experience, organisational culture and the employer brand.
Brand Management, 15(2), 123–134.
Mosley, R. (2007). Customer experience, organisational culture and the employer brand.
Brand Management, 15(2), 123–134.
Nardi, P. M., (2003) “Doing Survey Research: A Guide to Quantitative Methods”, Boston,
Massachusetts
Nolan, K. and Harold, C. (2010) 'Fit with what? The influence of multiple self-concept
images on organizational attraction', Journal of Occupational and Organizational Psychology,
83, pp. 645-662, Journal of Occupational & Organizational Psychology
Nunnally, J. C. (1978). Psychometric theory (2nd ed.). New York: McGraw-Hill.
Pilbeam, S. and Corbridge, M. (2010). People Resourcing and Talent Planning HRM in
Practice. 4th ed. England: Pearson Education Limited. 109.
Punjaisri, K. and Wilson, A. (2007) “The Role of Internal Branding in the Delivery of
Employee Brand Promise”, Journal of Brand Management, 15 (1), 57 70.
Quinlan, C. (2011) Business Research Methods. United Kingdom: Cengage Learning.
Riketta, M. (2005) “Organizational Identification: A meta-analysis”, Journal of Vocational
Behaviour, Vol. 66, No. 2, pp 358-384.
Roodt, G. (2004). Turnover intentions. Unpublished document: University of Johannesburg
Rousseau, D. M. (1995). Psychological Contracts in Organisations. Understanding Written
and Unwritten Agreements. SAGE: Newbury
Saqib, S., Abrar, M., Sabir, H.M., Bashir, M., & Baig, S.A. (2015). Impact of tangible and
intangible rewards on organizational commitment: evidence from the textile sector of
Pakistan. American Journal of Industrial and Business Management, pp. 138-147.
Sartain, L. & Schumann, M. (2006). Brand from the inside. San Francisco, USA: Jossey-
Bass.
Sivertzen et al. (2013) "Employer branding: employer attractiveness and the use of social
media", Journal of Product & Brand Management, Vol. 22 Issue: 7, pp.473-483,

46
Slaughter, J., Zickar, M., Highhouse, S. and Mohr, D. (2004) 'Personality Trait Inferences
About Organizations: Development of a Measure and Assessment of Construct Validity',
Journal of Applied Psychology, 89 (1), pp. 85-103.
Sokro, S. (2012) "Impact of Employer Branding on Employee Attraction and Retention".
European Journal of Business and Management, Vol 4, No.18, 2012
Sousa-Poza, A., 2007. The Effect of Job Satisfaction on Labour Turnover by Gender: An
Analysis for Switzerland. The Journal of Socio-Economics 36, 895–913.
Stamler, B. (2001), “Companies are developing brand messages as a way to inspire loyalty
among employees”, New York Times, July, Vol. 5, p. 5.
Steensma, H., Van Breukelen, W., and M. Sturm, 2004. Studying Employee Turnover by
Splitting up the usual Comparison Group. Journal of Individual Employment Rights, 11,
211–227.
Tanova, C, and Holtom, B, C. (2008) “Using job embeddedness to explain employee
turnover in four European countries”, The international Journal of Human Resource
Management, Vol 19, no 3. Pp 363- 376.
Thomson, K., L. de Chernatony, L. Arganbright and S. Khan (1999), ‘The buy-in benchmark:
how staff understanding and commitment impact brand and business performance’, Journal
of Marketing Management, vol. 15, no.8, Nov., pp. 819–35.
Van Mossevelde, C. (2010), “Employer branding: five reasons why it matters & five steps to
action”, available at: www.employerbrandingtoday.com/uk/ [Accessed on 21/01/2017]

47
Appendices
Appendix 1 Questionnaire introduction
Hello
You are invited to participate in our survey in which we hope to measure the value of
Employer Branding in attracting and retaining employees. In this survey, you will be asked to
complete a survey that seeks to create insight into the area of employer branding and how it
affects attraction and turnover intention. It will take approximately 5 minutes to complete the
questionnaire.
Your participation in this study is completely voluntary. However, if you feel uncomfortable
answering any questions, you can withdraw from the survey at any point. It is very important
for us to learn your opinions.
Your survey responses will be strictly confidential and data from this research will be
reported only in the aggregate. Your information will be coded and will remain confidential.
If you have questions at any time about the survey or the procedures, you may contact
Jeyaseelie O'Sullivan at 0879770573 or by email at [email protected].
Thank you very much for your time and support. Please start with the survey now by clicking
on the Continue button below.
Appendix 2 Demographic Questions
What is your gender
1. Male
2. Female
What is your age?
1. 18-29
2. 30-39
3. 40-49
4. 50-59
5. 60-69
What is the highest level of education you have attained?
1. Leaving cert or equivalent
2. Trade/technical/vocational training
3. Undergraduate
4. Postgraduate
5. PHD
Which sector are you employed in?

48
1. Public sector
2. Private sector
3. Semi- state
4. Self employed
What level is your current role graded at?
1. Junior
2. Mid -level
3. Senior
4. Senior management
Do you have anyone reporting to you?
1. Yes
2. No
Appendix 3 Scales
EmpAt Scale
How important are the following to you when considering potential employers?
Very important 1 2 3 4 5 Not important
Interest Value
Innovative employer – novel work practices/forward-thinking
The organisation produces high-quality products and services
The organisation both values and makes use of your creativity
The organisation produces innovative products and services
Working in an exciting environment
Social Value
Having a good relationship with your colleagues
Having a good relationship with your superiors
Supportive and encouraging colleagues
A fun working environment
Happy work environment
Economic Value
Good promotion opportunities within the organisation
Job security within the organisation
Hands-on inter-departmental experience
An above average basic salary
An attractive overall compensation package

49
Developmental Value
Recognition/appreciation from management
A springboard for future employment
Feeling good about yourself as a result of working for a particular organisation
Feeling more self-confident as a result of working for a particular organisation
Gaining career-enhancing experience
Application Value
Humanitarian organisation - gives back to society
Opportunity to apply what was learned at a tertiary institution
Opportunity to teach others what you have learned
Acceptance and belonging
The organisation is customer-orientated
Turnover Scale (tis-6) Scale: 1 = Never to 5 = Always
How often do you dream about getting another job that will better suit your personal
needs?
How often are you frustrated when not given the opportunity at work to achieve your
personal work-related goals?
How often have you considered leaving your job?
How likely are you to accept another job at the same compensation level should it be
offered to you?
To what extent is your current job satisfying your personal needs?
How often do you look forward to another day at work?