employment report - michigan ross · employment report 2017. 2 recruiters and ... there is no fee...
TRANSCRIPT

EMPLOYMENT REPORT2017

22
Recruiters and Michigan Ross students make a great team.
If you’re a recruiter looking for new hires or interns, you won’t do better than our deep and diverse talent pool. Employers tell us Ross graduates stand out as bright, energetic, and collaborative. Our rigorous action-based learning curriculum — truly unmatched at any other school — produces driven, creative graduates who deliver incredible results for your company in today’s ever-changing world.
It is our mission to be the world’s best career accelerator and source of business talent globally. And when recruiters and Michigan Ross students get together, some great partnerships are formed. We invite you to see for yourself in the following pages as we guide you through a smooth and rewarding recruiting process.
Heather Byrne Managing Director Career Development Office
WELCOME

3

4
At Michigan Ross, you will work with one point of contact on our recruiting and outreach team within the Career Development Office for all your on- and off-campus recruiting needs.
The Employer Relations team understands the requirements of your industry and company, and will assist you in customizing a recruiting strategy that works for your organization. Likewise, we’ll help tailor an approach that’s appropriate for the specific students you will meet in our various degree programs. The recruiting process itself is similar across all of our programs, making it as seamless as possible for you.
4
RECRUITING AT ROSS
5
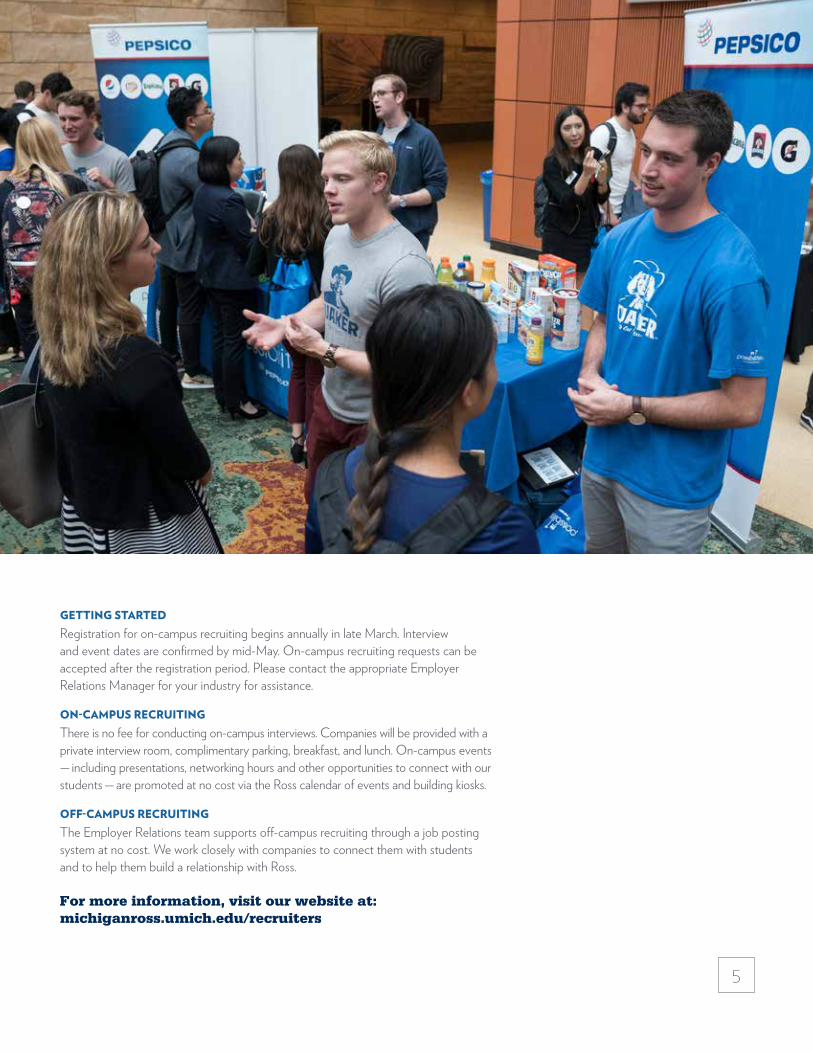
GETTING STARTEDRegistration for on-campus recruiting begins annually in late March. Interview and event dates are confirmed by mid-May. On-campus recruiting requests can be accepted after the registration period. Please contact the appropriate Employer Relations Manager for your industry for assistance.
ON-CAMPUS RECRUITINGThere is no fee for conducting on-campus interviews. Companies will be provided with a private interview room, complimentary parking, breakfast, and lunch. On-campus events — including presentations, networking hours and other opportunities to connect with our students — are promoted at no cost via the Ross calendar of events and building kiosks.
OFF-CAMPUS RECRUITINGThe Employer Relations team supports off-campus recruiting through a job posting system at no cost. We work closely with companies to connect them with students and to help them build a relationship with Ross.
For more information, visit our website at: michiganross.umich.edu/recruiters
6
Your company can collaborate with Michigan Ross in several different ways. You’ll find substantial benefits: meeting potential hires, raising your visibility among top prospects, and enriching your company’s culture.
HOW TO GET INVOLVED
6

7
SPONSOR AN ACTION-BASED LEARNING PROJECTThrough our MAP Program, our bright, creative students can tackle a project or challenge for your company at a minimal cost to you. Students get a real-world experience, and you get great results, as well as an opportunity to see Ross students in action.
PARTICIPATE IN THE CLASSROOM We welcome corporate partners to discuss business case studies in Ross classes. Our students learn firsthand how things happen on the front lines, and you will have the opportunity to hear some unique ideas and different perspectives.
HOST AN ON-SITE VISIT We encourage you to host Ross students for a visit at your corporate headquarters. This is a great way to showcase your corporate culture and facilities to an engaged audience.
SPEAK TO OUR STUDENTSRoss welcomes a wealth of guest speakers in settings of all sizes — from schoolwide symposiums to informal meetings with student clubs. It’s a great way for corporate partners and students to share perspectives and experiences.
SPONSOR OR PARTICIPATE IN AN EVENTRoss hosts a number of conferences and special events every year — many of which are regional or national in scope — with a particular business focus. We encourage corporate participation in these events, which range from the Positive Business Conference and the Healthcare & Life Sciences Forum to the Women in Leadership Conference.
For more information on how you can get involved, visit our website at: michiganross.umich.edu/recruiters

88
EMPLOYMENT DATA

9
2017 TOP HIRING COMPANIESCOMPANY NAME MBA PT MBA MSCM MACC MM BBA
TOTAL FULL-TIME INTERN FULL-TIME FULL-TIME FULL-TIME FULL-TIME FULL-TIME INTERN
PwC 106 4 13 17 1 20 51Amazon 81 38 27 12 1 3EY 65 6 9 22 13 15Deloitte 63 14 9 1 16 1 7 15McKinsey & Co. 53 28 8 1 1 10 5Citi 41 6 12 10 13J.P. Morgan 35 2 4 14 15The Boston Consulting Group 31 12 11 1 5 2KPMG LLP 31 4 1 14 1 2 9Microsoft Corp. 28 12 8 1 5 2PepsiCo Inc. 27 6 10 5 6Accenture 25 12 6 1 1 5 Plante Moran 25 11 2 12IBM Corp. 24 2 6 1 11 4General Motors Corp. 23 4 6 2 7 4Goldman Sachs Group 22 3 1 1 8 9Morgan Stanley 19 9 10Ford Motor Co. 19 2 2 1 1 6 7Bain & Co. Inc. 18 6 8 3 1RBC Capital Markets 16 1 2 9 4Whirlpool Corp. 15 5 5 2 3A.T. Kearney Inc. 14 6 6 2 Deutsche Bank 14 1 3 6 4American Express Co. 13 3 4 4 2Bank of America Merrill Lynch 13 4 4 1 4United Airlines 13 1 3 4 5Walmart Stores Inc. 13 5 7 1 ZS Associates 12 2 2 1 4 3Johnson & Johnson 12 6 6 Barclays PLC 11 4 2 2 3Google Inc. 11 1 5 1 3 1L'Oreal USA Inc. 10 0 3 1 6S.C. Johnson & Son Inc. 10 2 4 2 2Houlihan Lokey 9 5 4

MBA
17
10
CLASS OF 2017
MBA GRADUATES
Our rigorous two-year curriculum attracts students with significant academic and career accomplishments from all over the globe. Our philosophy of experience-driven education ensures that our graduates are fully prepared to handle the demands of their career.
DEMOGRAPHIC OVERVIEW Class Size......................................................................................................407Undergraduate MajorsBusiness & Economics ................................................................................................ 38%Engineering/STEM ......................................................................................................37%Humanities/Social Sciences ................................................................................... 25%Average Full-Time Work Experience (years) ............................................ 5Average Age ................................................................................................. 27Women ........................................................................................................32%Underrepresented Minorities .................................................................. 10% International ...............................................................................................35%
Geographic DistributionAfrica ................................................................................................................................... < 1%Asia ....................................................................................................................................... 13%Australia & New Zealand........................................................................................... < 1%Europe ...................................................................................................................................2%India ......................................................................................................................................10%Middle East ..........................................................................................................................1%North America ................................................................................................................ 67%South America................................................................................................................... 7%Grade Point Average (GPA) ..................................................................... 3.4GMAT ScoreMiddle 80% Range ..............................................................................................660-760Average ............................................................................................................................... 708
MBA Graduate Overview
This report conforms to the MBA Career Services & Employer
Alliance Standards for Reporting MBA Employment Statistics.
OF GRADUATES HAD AN OFFER WITHIN 3 MONTHS
OF GRADUATION
97%
MBA
17
MBA
17
11
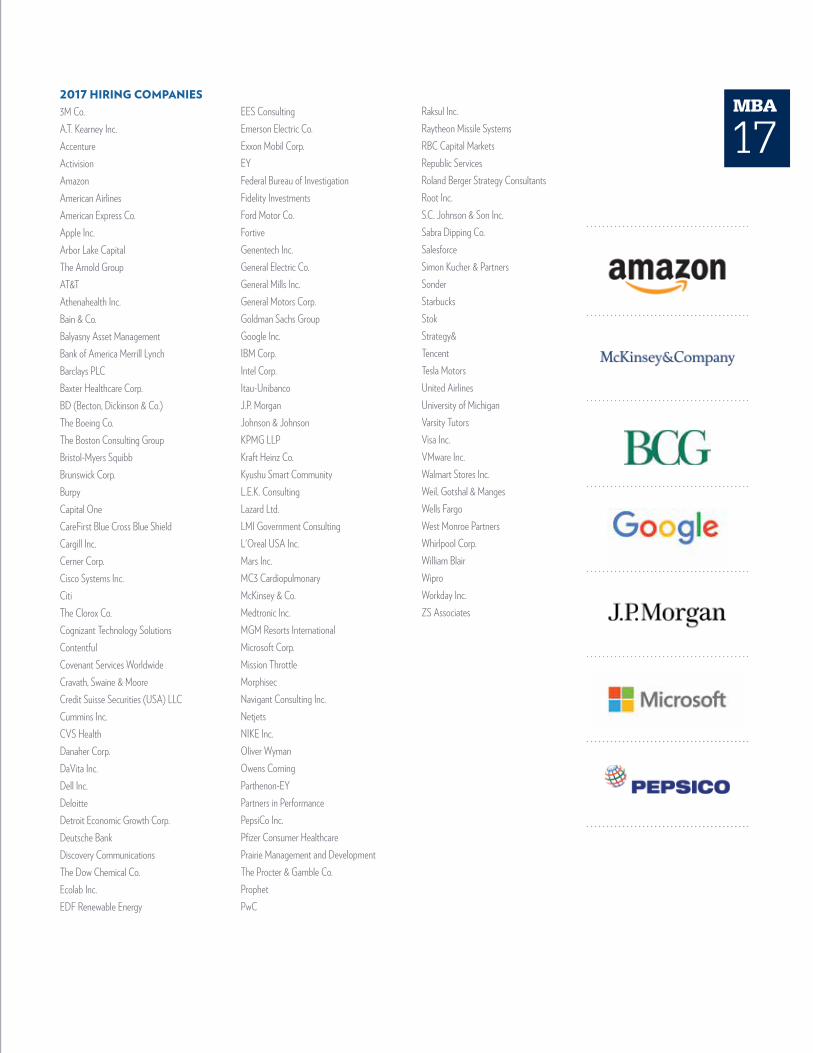
2017 HIRING COMPANIES 3M Co.A.T. Kearney Inc.AccentureActivisionAmazonAmerican AirlinesAmerican Express Co.Apple Inc.Arbor Lake CapitalThe Arnold GroupAT&TAthenahealth Inc.Bain & Co.Balyasny Asset ManagementBank of America Merrill LynchBarclays PLCBaxter Healthcare Corp.BD (Becton, Dickinson & Co.)The Boeing Co.The Boston Consulting GroupBristol-Myers SquibbBrunswick Corp.BurpyCapital OneCareFirst Blue Cross Blue ShieldCargill Inc.Cerner Corp.Cisco Systems Inc.CitiThe Clorox Co.Cognizant Technology SolutionsContentfulCovenant Services WorldwideCravath, Swaine & MooreCredit Suisse Securities (USA) LLCCummins Inc.CVS HealthDanaher Corp.DaVita Inc.Dell Inc.DeloitteDetroit Economic Growth Corp. Deutsche BankDiscovery CommunicationsThe Dow Chemical Co.Ecolab Inc.EDF Renewable Energy
EES ConsultingEmerson Electric Co.Exxon Mobil Corp.EYFederal Bureau of InvestigationFidelity InvestmentsFord Motor Co.FortiveGenentech Inc.General Electric Co.General Mills Inc.General Motors Corp.Goldman Sachs GroupGoogle Inc.IBM Corp.Intel Corp.Itau-UnibancoJ.P. MorganJohnson & JohnsonKPMG LLPKraft Heinz Co.Kyushu Smart CommunityL.E.K. ConsultingLazard Ltd.LMI Government ConsultingL'Oreal USA Inc.Mars Inc.MC3 CardiopulmonaryMcKinsey & Co.Medtronic Inc.MGM Resorts InternationalMicrosoft Corp.Mission ThrottleMorphisecNavigant Consulting Inc.NetjetsNIKE Inc.Oliver WymanOwens CorningParthenon-EYPartners in PerformancePepsiCo Inc.Pfizer Consumer HealthcarePrairie Management and DevelopmentThe Procter & Gamble Co.ProphetPwC
Raksul Inc.Raytheon Missile SystemsRBC Capital MarketsRepublic Services Roland Berger Strategy ConsultantsRoot Inc.S.C. Johnson & Son Inc.Sabra Dipping Co.SalesforceSimon Kucher & PartnersSonderStarbucksStokStrategy&TencentTesla MotorsUnited AirlinesUniversity of MichiganVarsity TutorsVisa Inc.VMware Inc.Walmart Stores Inc.Weil, Gotshal & MangesWells FargoWest Monroe PartnersWhirlpool Corp.William BlairWiproWorkday Inc.ZS Associates
MBA
17

MBA
17
12
8.8%CONSUMER
PACKAGED GOODS
32.7%CONSULTING
23.6%TECHNOLOGY
10.4%OTHER
6.9%HEALTHCARE
6.6%MANUFACTURING
11%FINANCIALSERVICES
MBA Graduate Acceptances by Industry
2017 DETAILED COMPENSATION INFORMATION (91% of accepted offers included usable industry salary data.)
BASE SALARY SIGNING BONUS
% OF % OF INDUSTRY REPORTED MEDIAN MEAN RANGE REPORTED MEDIAN
Consulting 32.7% $144,500 $138,962 $85,000-$170,000 83.7% $25,000Consumer Packaged Goods 8.8% $106,250 $110,500 $100,000-$145,000 84.6% $25,000Financial Services 11.0% $125,000 $121,226 $100,000-$150,000 90.3% $50,000Healthcare 6.9% $115,000 $118,842 $100,000-$143,000 89.5% $25,000Manufacturing 6.6% $113,000 $115,750 $100,000-$135,000 94.4% $25,000Technology 23.6% $120,000 $119,637 $80,000-$145,000 81.7% $30,500Other 10.4% $110,000 $114,398 $75,500-$180,000 53.6% $25,000
50% OF GRADUATES WENT
INTO CONSULTING OR TECHNOLOGY
MBA
17

MBA
17
13
4.1%OTHER
2017 DETAILED COMPENSATION INFORMATION (91% of accepted offers included usable function salary data.)
BASE SALARY SIGNING BONUS
% OF % OF FUNCTION REPORTED MEDIAN MEAN RANGE REPORTED MEDIAN
Consulting 35.2% $140,000 $137,070 $85,000-$170,000 84.1% $25,000Internal Consulting 3.8% $120,000 $119,345 $92,145-$143,000 91.7% $20,000Strategy Consulting 30.8% $145,000 $139,616 $85,000-$170,000 83.9% $25,000General Consulting 0.6% — — — — —Finance 18.2% $123,000 $118,943 $100,000-$150,000 88.7% $45,000Corporate Finance 8.8% $113,000 $113,481 $100,000-$140,000 88.9% $29,000Investment Banking 7.2% $125,000 $126,190 $125,000-$150,000 95.2% $50,000General Finance 2.2% $120,000 $118,000 $100,000-$125,000 60.0% $40,000General Management 11.0% $120,000 $115,516 $90,000-$135,000 90.3% $22,500Human Resources 1.9% $105,500 $104,650 $97,250-$109,000 100.0% $32,000Marketing/Sales 19.5% $116,000 $116,509 $80,000-$145,000 84.2% $25,500General Marketing 6.0% $114,000 $113,375 $80,000-$135,000 68.8% $25,000Product/Brand Management 13.5% $120,000 $117,732 $100,000-$145,000 90.2% $25,500Operations/Supply Chain Management 6.6% $120,000 $120,722 $106,000-$137,000 72.2% $30,000Strategic Planning 3.5% $115,000 $112,889 $80,000-$145,000 66.7% $20,000Other 4.1% $120,000 $125,773 $75,500-$180,000 18.2% $23,750
MBA Graduate Acceptances by Function
35.2%CONSULTING
19.5%MARKETING/SALES
6.6%OPERATIONS/SUPPLY CHAIN
MANAGEMENT
1.9%HUMAN RESOURCES
3.5%STRATEGIC PLANNING
11%GENERAL MANAGEMENT
18.2%FINANCE
MBA
17

MBA
17
14
MBA Graduate Acceptances by Region
2017 DETAILED COMPENSATION INFORMATION (91% of accepted offers included usable region salary data.)
BASE SALARY SIGNING BONUS
% OF % OF REGION REPORTED MEDIAN MEAN RANGE REPORTED MEDIAN
Mid-Atlantic 3.1% $120,000 $120,627 $92,145-$152,500 77.8% $20,000Philadelphia Metro 0.6% — — — — —Washington DC Metro 1.6% $123,000 $118,429 $92,145-$140,000 80.0% $15,000Other 0.9% — — — — —Midwest 34.6% $125,000 $126,843 $75,500-$175,000 83.3% $25,000Chicago Metro 21.1% $140,000 $131,516 $100,000-$170,000 84.1% $25,000Detroit Metro 6.0% $113,000 $119,767 $75,500-$152,000 86.7% $25,000Minneapolis/St. Paul Metro 2.8% $110,000 $115,000 $100,000-$147,000 77.8% $30,000Other 4.7% $120,000 $121,400 $100,000-$175,000 80.0% $25,000Northeast 15.4% $125,000 $127,383 $100,000-$180,000 87.2% $30,000Boston Metro 2.8% $130,000 $132,278 $113,000-$150,000 88.9% $25,000Tri-State Area 12.6% $125,000 $126,224 $100,000-$180,000 86.8% $32,000(New York, New Jersey, & Connecticut) South 3.1% $105,000 $115,100 $84,000-$152,000 72.7% $15,000Atlanta Metro 0.6% — — — — — Other 2.5% $105,000 $106,500 $84,000-$125,000 62.5% $15,000Southwest 4.1% $132,500 $127,450 $100,000-$152,500 100.0% $25,000Dallas Metro 1.9% $105,000 $120,900 $100,000-$152,500 100.0% $25,000Denver Metro 0.9% — — — — —Houston Metro 0.6% — — — — —Phoenix Metro 0.6% — — — — —West 32.1% $120,000 $125,530 $90,000-$170,000 81.7% $27,250Los Angeles Metro 2.2% $126,000 $129,000 $106,000-$162,500 100.0% $25,000San Francisco Bay Area 10.4% $134,500 $131,567 $90,000-$170,000 80.0% $25,000Seattle Metro 17.6% $120,000 $121,652 $97,250-$152,000 80.4% $35,000Other 1.9% $114,500 $109,333 $90,000-$120,000 83.3% $20,000International 7.5% $115,000 $113,540 $80,000-$150,000 65.0% $25,000Asia 6.0% $120,000 $116,028 $80,000-$150,000 61.1% $25,000South America 1.6% — — — — —
MBA
17

MBA
17
15
ROSS GRADS GO EVERYWHERE. MORE THAN 2/3 ACCEPT JOBS ON THE EAST COAST, WEST COAST, OR IN CHICAGO.7.5%
INTERNATIONAL
10.4%SAN FRANCISCOBAY AREA
12.6%TRI-STATE AREA
21.1%CHICAGO METRO
17.6%SEATTLE METRO
32.1%WEST 34.6%
MIDWEST
4.1%SOUTHWEST 3.1%
SOUTH
3.1%MID-
ATLANTIC
15.4%NORTHEAST
23
MBA
17

MBA
17
16
Summary of Graduates U.S. CITIZENS/ PERMANENT RESIDENTS FOREIGN NATIONALS TOTAL GRADUATING CLASS
Seeking Employment 57.5% 234 25.8% 105 83.3% 339Returning to Internship Employer 18.4% 75 8.6% 35 27.0% 110Seeking New Employment 39.1% 159 17.2% 70 56.3% 229Not Seeking Employment 4.7% 19 1.7% 7 6.4% 26Continuing Education 0.7% 3 0.5% 2 1.2% 5Postponing Job Search 0.7% 3 0.0% — 0.7% 3Company Sponsored 1.0% 4 1.2% 5 2.2% 9Not Seeking Employment for Other Reasons 1.0% 4 0.0% — 1.0% 4Starting a Business 1.2% 5 0.0% — 1.2% 5No Recent Information Available 5.9% 24 4.4% 18 10.3% 42Grand Total 68.1% 277 31.9% 130 100.0% 407
Position Source NUMBER % OF TOTAL
On-Campus/School Facilitated 241 75.3%On-Campus Recruiting 81 25.3%Returning to On-Campus/School Facilitated Internship 111 34.7%Other School Facilitated (Posting, Alumni/Faculty Networking, Etc.) 49 15.3%Off-Campus/Direct Contact 67 20.9%Direct Contact 37 11.6%Other Off-Campus Contact (Personal Network, Other Job Postings, Etc.) 30 9.3%Not Reported 12 3.8%Grand Total 320 100.0%
87%OF GRADUATES ARE CAREER SWITCHERS
80+ ROSS HAS 80+ MBA PEER
CAREER COACHES — MORE THAN ANY OTHER MBA PROGRAM
MBA
17
MBA
17
17
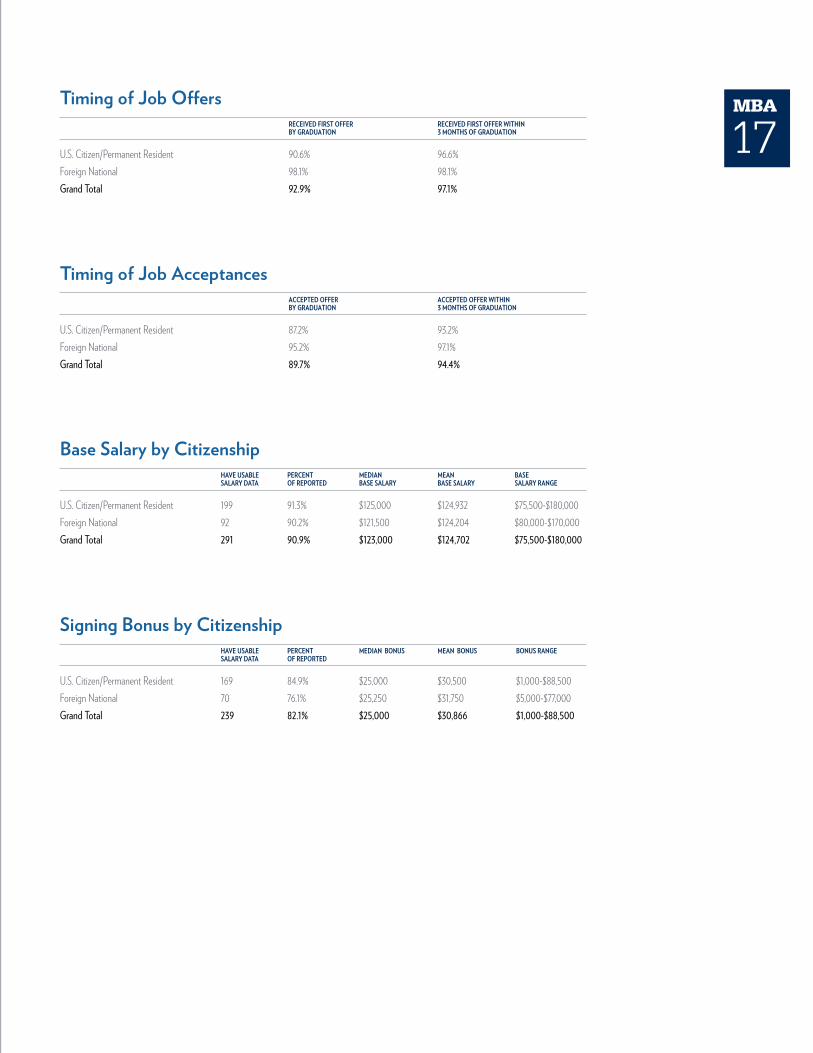
Base Salary by Citizenship HAVE USABLE PERCENT MEDIAN MEAN BASE SALARY DATA OF REPORTED BASE SALARY BASE SALARY SALARY RANGE
U.S. Citizen/Permanent Resident 199 91.3% $125,000 $124,932 $75,500-$180,000Foreign National 92 90.2% $121,500 $124,204 $80,000-$170,000Grand Total 291 90.9% $123,000 $124,702 $75,500-$180,000
Signing Bonus by Citizenship HAVE USABLE PERCENT MEDIAN BONUS MEAN BONUS BONUS RANGE SALARY DATA OF REPORTED
U.S. Citizen/Permanent Resident 169 84.9% $25,000 $30,500 $1,000-$88,500Foreign National 70 76.1% $25,250 $31,750 $5,000-$77,000Grand Total 239 82.1% $25,000 $30,866 $1,000-$88,500
Timing of Job Offers RECEIVED FIRST OFFER RECEIVED FIRST OFFER WITHIN BY GRADUATION 3 MONTHS OF GRADUATION
U.S. Citizen/Permanent Resident 90.6% 96.6%Foreign National 98.1% 98.1% Grand Total 92.9% 97.1%
Timing of Job Acceptances ACCEPTED OFFER ACCEPTED OFFER WITHIN BY GRADUATION 3 MONTHS OF GRADUATION
U.S. Citizen/Permanent Resident 87.2% 93.2%Foreign National 95.2% 97.1%Grand Total 89.7% 94.4%
MBA
17
MBA
18
18
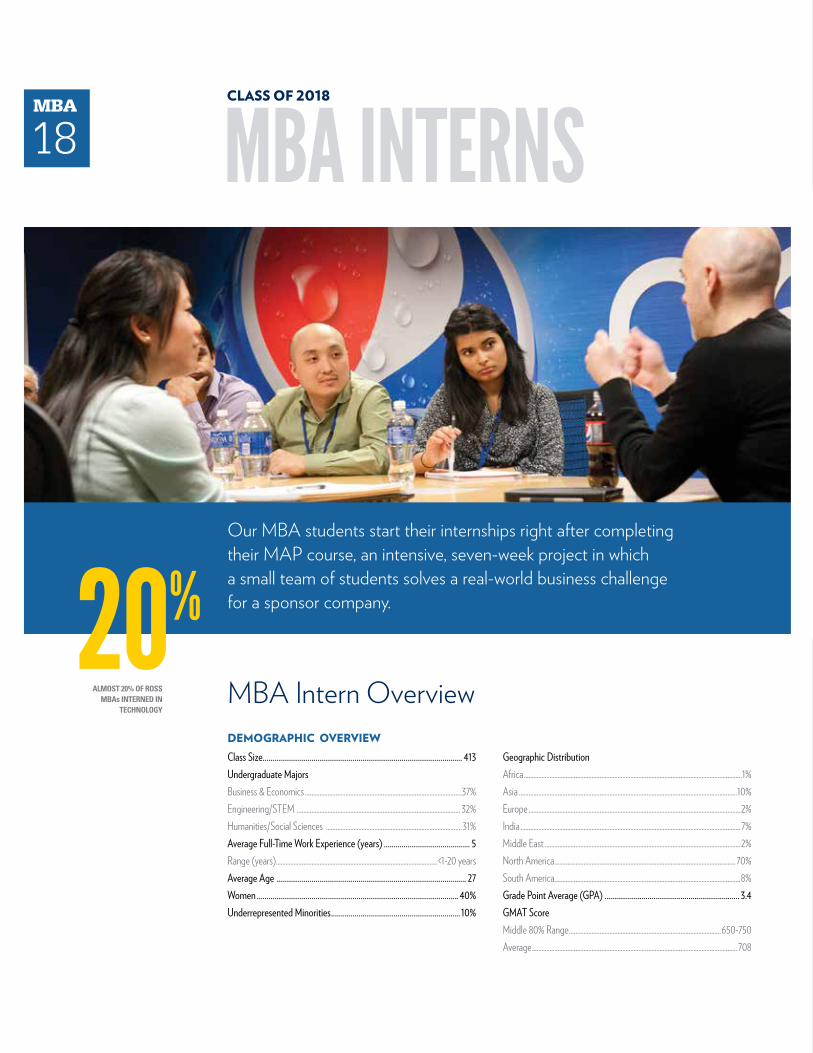
CLASS OF 2018
MBA INTERNS
DEMOGRAPHIC OVERVIEWClass Size...................................................................................................... 413Undergraduate MajorsBusiness & Economics .................................................................................................37%Engineering/STEM ..................................................................................................... 32%Humanities/Social Sciences ....................................................................................31%Average Full-Time Work Experience (years) ............................................ 5Range (years)....................................................................................................<1-20 yearsAverage Age ................................................................................................. 27Women ....................................................................................................... 40%Underrepresented Minorities .................................................................. 10%
Geographic DistributionAfrica .......................................................................................................................................1%Asia .......................................................................................................................................10%Europe ...................................................................................................................................2%India ........................................................................................................................................ 7%Middle East .........................................................................................................................2%North America ................................................................................................................ 70%South America...................................................................................................................8%Grade Point Average (GPA) ..................................................................... 3.4GMAT ScoreMiddle 80% Range ..............................................................................................650-750Average ............................................................................................................................... 708
MBA Intern Overview
Our MBA students start their internships right after completing their MAP course, an intensive, seven-week project in which a small team of students solves a real-world business challenge for a sponsor company.
ALMOST 20% OF ROSS MBAs INTERNED IN
TECHNOLOGY
20%
MBA
18

MBA
18
19
2017 HIRING COMPANIES 3M Co.A.T. Kearney Inc.AccentureAFREECARAmazonAmcor Rigid PlasticsAmerican AirlinesAmerican Express Co.Amgen Inc.AncestryAnthem Business Improvement GroupAstellas Pharma Global Developmentathenahealth Inc.Bain & Co. Inc.Bank of America Merrill LynchBarclays PLCBASFBaxter Healthcare Corp.Becton, Dickinson and Co.Bimbo Bakeries USABMO Capital MarketsThe Boeing Co.BorgWarner Inc.The Boston Consulting GroupBoston ScientificCardConnectThe Chartis GroupCisco Systems Inc.CitiThe Clorox Co.Cooperative Business VenturesCredicorpCredit Suisse Securities (USA) LLCCummins Inc.CVS HealthDanaher Corp.Danone North AmericaDaVita Inc.Dell Inc.DeloitteDelta Air Lines Inc.Deutsche BankDimensional Fund AdvisorsDiscover Financial Services, LLCThe Dow Chemical Co.DuPontEcolab Inc.Eli Lilly & Co.Environmental Defense FundEYFacebook Inc.
Fidelity InvestmentsFlexFord Motor Co.Genentech Inc.General Mills Inc.General Motors Corp.GettGlaxoSmithKline plcGlobal Fairness InitiativeGoldman Sachs GroupGoogle Inc.Greenhill & Co.Haitong Securities Co. Ltd.Hotels.comHumana Inc.Intel Corp.InterbankItau-UnibancoJ.P. MorganJiu You Capital Co. Ltd.Johnson & JohnsonKabbageKaiser PermanenteKPMG LLPLand O'Lakes Inc.Lazard Ltd.LegWorks Inc.Liberty Mutual InsuranceL'Oreal USA Inc.McKinsey & Co.Medtronic Inc.Mercedes-BenzMetLife InvestmentsMicrosoft Corp.MillerCoorsMoelis & Co.National Basketball AssociationNIKE Inc.Omidyar NetworkOperation SmileOwens CorningPacific Gas & Electric Co.PepsiCo Inc.Pfizer Inc.Pinnacle Foods GroupPPG Industries Inc.Princeton EnterprisesProcter & Gamble Co.Prodigy FinanceProfimexPrudential Financial, Inc.
PwCRBC Capital MarketsReckitt BenckiserREDFThe Related Companies L.P.Rocket Fuel Inc.Rocky Mountain InstituteRoland Berger Strategy ConsultantsRoom to ReadRoot Inc.S.C. Johnson & Son Inc.SalesforceSamsungSpotifyStanley Black & DeckerStarbucksStessa Inc.Strategy&Suzano Papel e CeluloseSVN Inc.Takeda Pharmaceuticals USA IncTarget Corp.TeslaT-HubTruliaTyson Foods Inc. United AirlinesUnitedHealth Group Inc.Urban AshesUS CellularUSAAVarsity TutorsVipshopVirtus PartnersVisa Inc.Vista Equity PartnersEnvironmental Defense FundVMwareWalmart Stores Inc.The Walt Disney Co.Wasserman GroupWells FargoWhirlpool Corp.White & Case LLPWilliam BlairWinWinZS Associates
MBA
18

MBA
18
20
2017 DETAILED COMPENSATION INFORMATION (95% of accepted offers included usable industry salary data.)
% OF MEDIAN BASE SALARY MEAN BASE SALARY BASE SALARY RANGE INDUSTRY REPORTED (ANNUALIZED) (ANNUALIZED) (ANNUALIZED)
Consulting 21.7% $136,080 $131,989 $73,632-$156,000Consumer Packaged Goods 11.0% $86,400 $84,336 $40,800-$96,000Education/Government/Non-Profit 2.2% $48,000 $51,200 $36,000-$67,200Financial Services 17.0% $120,000 $108,294 $24,000-$150,000Healthcare 7.4% $86,400 $84,244 $50,400-$109,200Manufacturing 8.8% $85,440 $85,152 $48,000-$116,400Technology 18.1% $96,000 $84,863 $19,200-$103,200Other 13.8% $84,600 $82,252 $26,400-$144,000
MBA Intern Acceptances by Industry
11%CONSUMER
PACKAGED GOODS
21.7%CONSULTING
18.1%TECHNOLOGY
13.8%OTHER
17%FINANCIAL SERVICES
7.4%HEALTHCARE
8.8%MANUFACTURING
2.2%EDUCATION/GOV'T
NONPROFIT
MBA
18
MBA
18
21
26.1%MARKETING/SALES
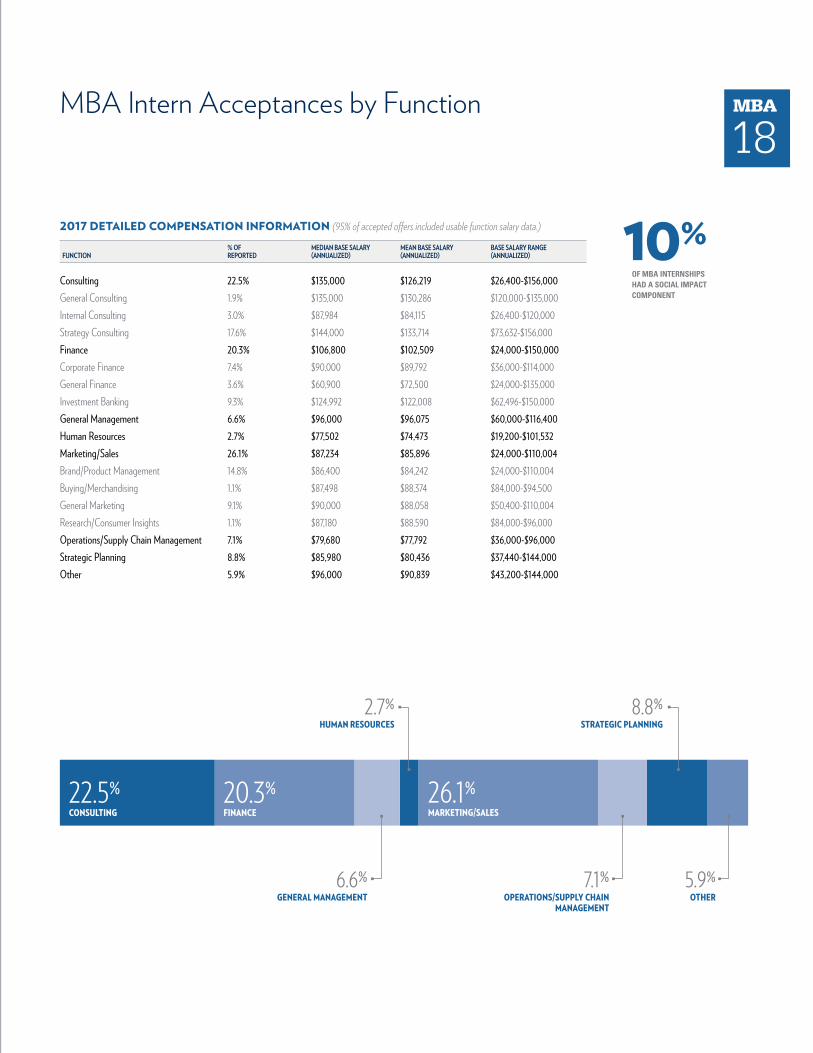
MBA Intern Acceptances by Function
2017 DETAILED COMPENSATION INFORMATION (95% of accepted offers included usable function salary data.)
% OF MEDIAN BASE SALARY MEAN BASE SALARY BASE SALARY RANGE FUNCTION REPORTED (ANNUALIZED) (ANNUALIZED) (ANNUALIZED)
Consulting 22.5% $135,000 $126,219 $26,400-$156,000General Consulting 1.9% $135,000 $130,286 $120,000-$135,000Internal Consulting 3.0% $87,984 $84,115 $26,400-$120,000Strategy Consulting 17.6% $144,000 $133,714 $73,632-$156,000Finance 20.3% $106,800 $102,509 $24,000-$150,000Corporate Finance 7.4% $90,000 $89,792 $36,000-$114,000General Finance 3.6% $60,900 $72,500 $24,000-$135,000Investment Banking 9.3% $124,992 $122,008 $62,496-$150,000General Management 6.6% $96,000 $96,075 $60,000-$116,400Human Resources 2.7% $77,502 $74,473 $19,200-$101,532Marketing/Sales 26.1% $87,234 $85,896 $24,000-$110,004Brand/Product Management 14.8% $86,400 $84,242 $24,000-$110,004Buying/Merchandising 1.1% $87,498 $88,374 $84,000-$94,500General Marketing 9.1% $90,000 $88,058 $50,400-$110,004Research/Consumer Insights 1.1% $87,180 $88,590 $84,000-$96,000Operations/Supply Chain Management 7.1% $79,680 $77,792 $36,000-$96,000Strategic Planning 8.8% $85,980 $80,436 $37,440-$144,000Other 5.9% $96,000 $90,839 $43,200-$144,000
22.5%CONSULTING
20.3%FINANCE
7.1%OPERATIONS/SUPPLY CHAIN
MANAGEMENT
5.9%OTHER
6.6%GENERAL MANAGEMENT
8.8%STRATEGIC PLANNING
2.7%HUMAN RESOURCES
10% OF MBA INTERNSHIPS HAD A SOCIAL IMPACT COMPONENT
MBA
18

MBA
18
22
MBA Intern Acceptances by Region
2017 DETAILED COMPENSATION INFORMATION (95% of accepted offers included usable region salary data.)
% OF MEDIAN BASE SALARY MEAN BASE SALARY BASE SALARY RANGE REGION REPORTED (ANNUALIZED) (ANNUALIZED) (ANNUALIZED)
Mid-Atlantic 3.0% $120,000 $114,946 $48,000-$153,600Philadelphia Metro 0.5% — — — Washington DC Metro 1.4% $147,000 $127,920 $48,000-$153,600Other 1.1% $114,600 $109,851 $85,200-$125,004Midwest 36.5% $94,800 $103,896 $37,440-$150,000Chicago Metro 20.9% $125,004 $117,556 $62,496-$150,000Detroit Metro 5.2% $80,400 $77,866 $37,440-$150,000Minneapolis/St. Paul Metro 4.4% $84,000 $85,062 $76,800-$90,000Other 6.0% $94,800 $91,915 $42,000-$116,400Northeast 20.1% $103,500 $103,324 $40,800-$150,000Boston Metro 2.2% $120,000 $118,047 $93,600-$144,000Tri-State Area 17.3% $103,500 $102,209 $40,800-$150,000(New York, New Jersey, & Connecticut)Other 0.5% — — —South 5.2% $84,000 $79,881 $24,000-$147,000Atlanta Metro 1.4% $102,000 $101,640 $24,000-$147,000Miami Metro 0.3% — — —Other 3.6% $79,500 $73,964 $36,000-$103,992Southwest 5.8% $86,814 $86,092 $26,400-$150,000Dallas Metro 2.7% $87,234 $96,415 $72,000-$147,000Denver Metro 0.5% — — —Houston Metro 0.3% — — —Phoenix Metro 0.3% — — —Other 1.9% $63,360 $55,642 $26,400-$88,572West 20.6% $96,000 $91,972 $19,200-$150,000Los Angeles Metro 1.1% $97,902 $100,380 $70,716-$135,000San Francisco Bay Area 7.7% $96,000 $96,743 $51,432-$150,000Seattle Metro 10.4% $96,000 $90,255 $19,200-$103,200Other 1.4% $71,052 $72,535 $60,000-$85,512International 8.8% $91,200 $85,008 $24,000-$156,000Africa 0.3% — — —Asia 4.0% $86,400 $82,294 $24,000-$156,000Europe 0.3% — — —Mexico 0.3% — — — Middle East 0.3% — — —South America 3.6% $96,000 $90,400 $54,600-$126,000
MBA
18

MBA
18
23
8.8%INTERNATIONAL
7.7%SAN FRANCISCOBAY AREA
17.3%TRI-STATE AREA
20.9%CHICAGO METRO
10.4%SEATTLE METRO
20.6%WEST 36.5%
MIDWEST
5.8%SOUTHWEST 5.2%
SOUTH
3%MID-
ATLANTIC
20.1%NORTHEAST
MBA
18

MM
17
24
DEMOGRAPHIC OVERVIEW Class Size........................................................................................................ 67Women ........................................................................................................ 51%Underrepresented Minorities ....................................................................9%International ............................................................................................... 16%Grade Point Average (GPA) ..................................................................... 3.5GMAT Average .......................................................................................... 668
Undergraduate MajorsCommunications .............................................................................................................. 7%Economics ......................................................................................................................... 13%Engineering .......................................................................................................................18%Humanities ........................................................................................................................ 13%International Relations ...................................................................................................6%Natural Sciences ............................................................................................................. 12%Political Science ................................................................................................................6%Social Science ....................................................................................................................6%Sports Management .......................................................................................................8%Other .....................................................................................................................................11%
CLASS OF 2017
MM GRADUATES
MM Graduate Overview
Ross’ innovative Master of Management Program is for recent liberal arts, science, or engineering grads who want to learn core business fundamentals. The intensive, 10-month program includes rigorous study in subjects like accounting, finance, and marketing.
OF GRADUATES HAD A JOB OFFER WITHIN 6 MONTHS
OF GRADUATION
98%
MM
17

MM
17
25
2017 HIRING COMPANIES AccentureAon HewittAppleBloomingdalesThe Boston Consulting GroupCharles River Development Creative Artists AgencyDaVita Inc.DeloitteDowEli LillyElysium HealthFiat Chrysler AutomobilesGartner
General Motors Corp.Goldman SachsGrabrHNA Holdings GroupIBM Corp.Jet.comKPMGMarketing Associates LLCMCCannMercerMichigan MedicineMorningstar Inc.Needham & Co.NVIDIA
Oracle Corp.Philips Lumileds Lighting Co.Piper Jaffray & Co.PwCRehmannRiskifiedRoush IndustriesShiloh IndustriesSolidianceUberUniversity of MichiganVillageMDYelpZS Associates
A DIVERSE MIX OF EMPLOYERS LOVE ROSS MMS:
MM
17

MM
17
26
MM Graduate Acceptances by Function2017 DETAILED COMPENSATION INFORMATION % OF MEDIAN BASE MEAN BASE BASE SALARY FUNCTION REPORTED SALARY SALARY RANGE
Consulting 26.5% $65,000 $66,000 $55,000-$75,000Internal Consulting 5.9% — — —Strategy Consulting 14.7% $75,000 $70,000 $60,000-$75,000General Consulting 5.9% — — —Finance 14.7% $68,850 $68,425 $56,000-$80,000Marketing/Sales 23.5% $62,000 $61,166 $41,000-$90,000Sales 8.8% $76,000 $76,000 $62,000-$90,000General Marketing 14.7% $56,160 $55,232 $41,000-$66,000Other 35.3% $56,000 $58,373 $40,000-$78,000
26.5%CONSULTING
14.7%FINANCE
35.3%OTHER
23.5%MARKETING/SALES
2017 DETAILED COMPENSATION INFORMATION % OF MEDIAN BASE MEAN BASE BASE SALARY INDUSTRY REPORTED SALARY SALARY RANGE
Consulting 26.5% $63,000 $62,800 $46,000-$75,000Consumer Packaged Goods 8.8% $70,200 $72,120 $56,160-$90,000Financial Services 17.6% $67,500 $61,706 $41,000-$80,000Healthcare 11.8% $62,000 $62,333 $60,000-$65,000Manufacturing 5.9% — — —Retail 2.9% — — —Technology 5.9% — — —Other 20.6% $50,000 $53,167 $40,000-$78,000
5.9%MANUFACTURING
8.8%CONSUMER
PACKAGED GOODS
MM Graduate Acceptances by Industry
26.5%CONSULTING
20.6%OTHER
11.8%HEALTHCARE
17.6%FINANCIAL SERVICES
2.9%RETAIL
5.9%TECHNOLOGY
27% OF GRADUATES WENT
INTO CONSULTING
MM
17

MM
17
27
MM Graduate Acceptances by Region2017 DETAILED COMPENSATION INFORMATION (59% of accepted offers included usable region salary data.)
% OF MEDIAN BASE SALARY MEAN BASE SALARY BASE SALARY RANGE REGION REPORTED
Mid-Atlantic 2.9% — — —Washington DC Metro 2.9% — — —Midwest 58.8% $60,000 $61,827 $40,000-$90,000Chicago Metro 17.6% $75,000 $70,000 $50,000-$90,000Detroit Metro 32.4% $55,000 $56,729 $40,000-$78,000Other 8.8% $62,000 $63,500 $56,000-$72,500Northeast 20.6% $67,500 $65,706 $45,000-$80,000Boston Metro 5.9% — — —Tri-State Area 14.7% $66,750 $64,625 $45,000-$80,000(New York, New Jersey, & Connecticut) South 5.9% — — —Atlanta Metro 2.9% — — —Other 2.9% — — —West 5.9% — — —Los Angeles Metro 2.9% — — —San Francisco Metro 2.9% — — —International 5.9% — — —Asia 5.9% — — —
17.6%CHICAGO METRO
32.4%DETROIT METRO
5.9%BOSTON METRO
5.9%WEST 58.8%
MIDWEST
5.9%SOUTH
2.9%MID-
ATLANTIC
20.6%NORTHEAST
5.9%INTERNATIONAL
MM
17

MM
17
28
Summary of Graduates U.S. CITIZENS/ PERMANENT RESIDENTS FOREIGN NATIONALS TOTAL GRADUATING CLASS
Seeking Employment 68.3% 41 10.0% 6 78.3% 47Not Seeking Employment 10.0% 6 0.0% — 10.0% 6Continuing Education 1.7% 1 0.0% — 1.7% 1Not Seeking Employment for Other Reasons 8.3% 5 0.0% — 8.3% 5No Recent Information 10.0% 6 1.7% 1 11.7% 7Total Graduates 88.3% 53 11.7% 7 100.0% 60
Position Source NUMBER % OF TOTAL
On-Campus/School Facilitated 13 29.5%Faculty/Career Services/Student Referral 2 4.5%On-Campus Recruiting 7 15.9%School Facilitated (Posting, Alumni/Faculty, Networking, etc.) 4 9.1%Off-Campus/Direct Contact 15 34.1%Direct Contact 4 9.1%Other Off-Campus Direct Contact (Personal networking, Other Job Postings, etc.) 10 22.7%Prior Employer 1 2.3%Not Reported 16 36.4%Grand Total 44 100.0%
MM
17

MSCM
16
29
Timing of Job Offers RECEIVED FIRST OFFER RECEIVED FIRST OFFER WITHIN RECEIVED FIRST OFFER WITHIN BY GRADUATION 3 MONTHS OF GRADUATION 6 MONTHS OF GRADUATION
U.S. Citizen/Permanent Resident 58.5% 78.0% 97.6%Foreign National 16.7% 83.3% 100.0%Grand Total 53.2% 78.7% 97.9%
Timing of Job Acceptances ACCEPTED OFFER ACCEPTED OFFER WITHIN ACCEPTED OFFER WITHIN BY GRADUATION 3 MONTHS OF GRADUATION 6 MONTHS OF GRADUATION
U.S. Citizen/Permanent Resident 53.7% 70.7% 95.1%Foreign National 16.7% 66.7% 83.3%Grand Total 48.9% 70.2% 93.6%
Base Salary by Citizenship HAVE USABLE PERCENT MEDIAN MEAN BASE SALARY DATA OF REPORTED BASE SALARY BASE SALARY SALARY RANGE
U.S. Citizen/Permanent Resident 25 64.1% $62,000 $61,822 $40,000-$90,000Foreign National 1 20.0% — — —Grand Total 26 59.1% $62,500 $62,138 $40,000-$90,000
MM
17

MSCM
16
30
Ranked No. 4 in the nation, the newly revamped Ross Master of Supply Chain Management provides academic rigor, real-world projects in a corporate setting, and leadership development. Graduates emerge prepared to take on the most pressing challenges in the supply chain field.
OF GRADUATES HAD AN OFFER WITHIN 6 MONTHS
OF GRADUATION
96%
CLASS OF 2016
MSCM GRADUATES
DEMOGRAPHIC OVERVIEW Class Size........................................................................................................ 27Average Full-Time Work Experience (years) .............................................7Range (years).................................................................................................... <1-10 yearsAverage Age .................................................................................................30Women ........................................................................................................ 19%Geographic DistributionUnited States ....................................................................................................................11%India ..................................................................................................................................... 59%Asia ...................................................................................................................................... 22%Other ......................................................................................................................................8%Average Grade Point Average (GPA) ................................................... 3.42GMAT ScoreMiddle 80% Range ...............................................................................................680-710Average ............................................................................................................................... 688
MSCM Graduate Overview2016 HIRING COMPANIES AmazonBarkawi Management ConsultantsBoston ScientificDHLGeneral MillsHome Chef
Huawei TechnologiesMcKinsey & Co.Microsoft Corp.NITS SolutionsRyder Supply Chain SolutionsSanDisk Corp.Wal-Mart
MSCM
16
MSCM
16
31
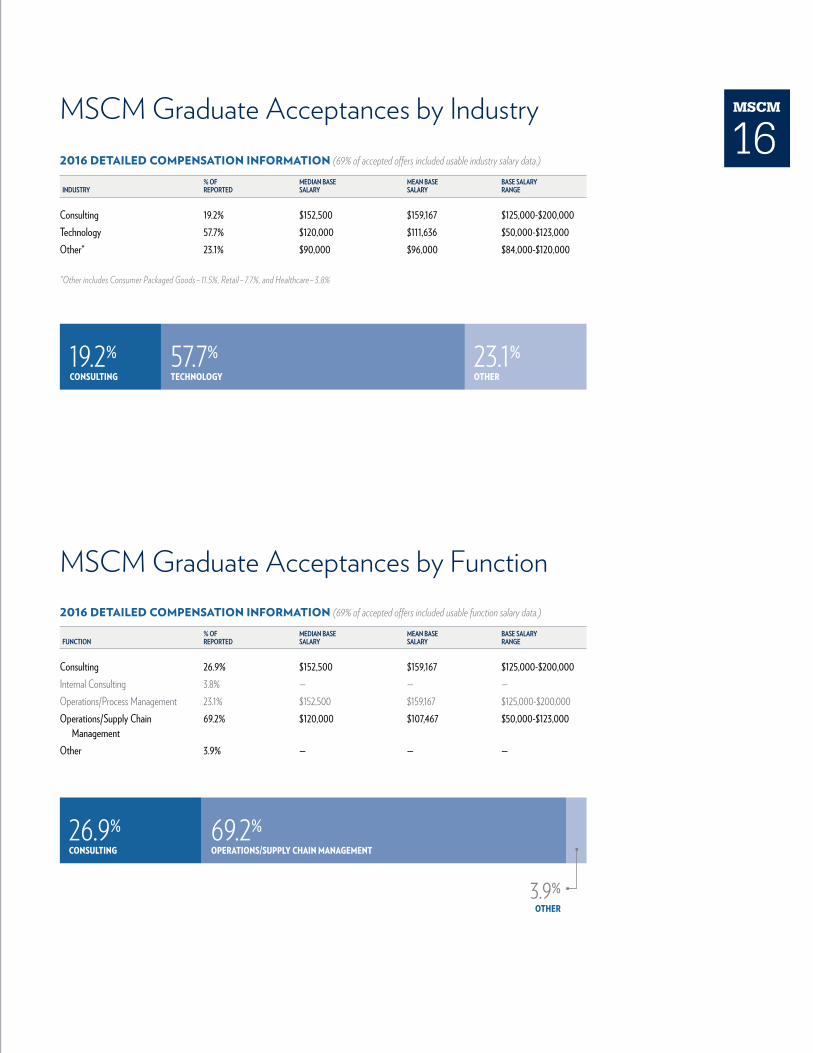
MSCM Graduate Acceptances by Function2016 DETAILED COMPENSATION INFORMATION (69% of accepted offers included usable function salary data.)
% OF MEDIAN BASE MEAN BASE BASE SALARY FUNCTION REPORTED SALARY SALARY RANGE
Consulting 26.9% $152,500 $159,167 $125,000-$200,000Internal Consulting 3.8% — — —Operations/Process Management 23.1% $152,500 $159,167 $125,000-$200,000Operations/Supply Chain 69.2% $120,000 $107,467 $50,000-$123,000
Management Other 3.9% — — —
MSCM Graduate Acceptances by Industry2016 DETAILED COMPENSATION INFORMATION (69% of accepted offers included usable industry salary data.)
% OF MEDIAN BASE MEAN BASE BASE SALARY INDUSTRY REPORTED SALARY SALARY RANGE
Consulting 19.2% $152,500 $159,167 $125,000-$200,000Technology 57.7% $120,000 $111,636 $50,000-$123,000Other* 23.1% $90,000 $96,000 $84,000-$120,000
*Other includes Consumer Packaged Goods – 11.5%, Retail – 7.7%, and Healthcare – 3.8%
26.9%CONSULTING
69.2%OPERATIONS/SUPPLY CHAIN MANAGEMENT
3.9%OTHER
57.7%TECHNOLOGY
19.2%CONSULTING
23.1%OTHER
MSCM
16
MSCM
16
32
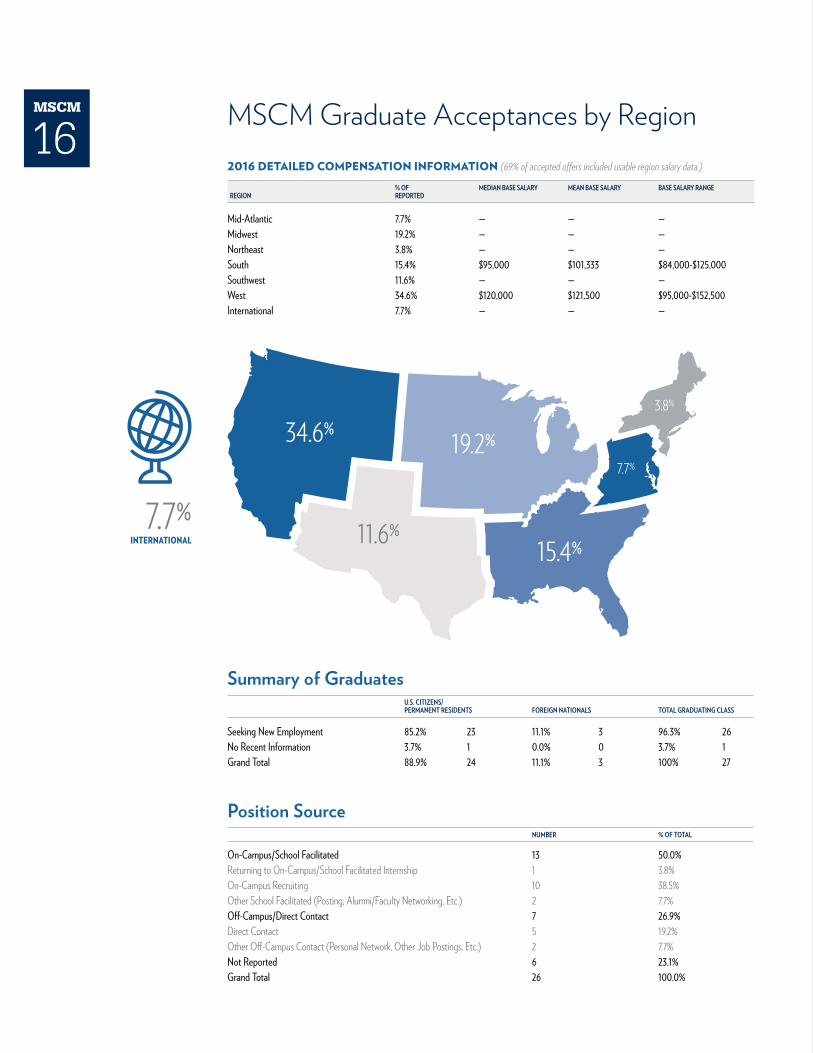
MSCM Graduate Acceptances by Region2016 DETAILED COMPENSATION INFORMATION (69% of accepted offers included usable region salary data.)
% OF MEDIAN BASE SALARY MEAN BASE SALARY BASE SALARY RANGE REGION REPORTED
Mid-Atlantic 7.7% — — —Midwest 19.2% — — —Northeast 3.8% — — —South 15.4% $95,000 $101,333 $84,000-$125,000Southwest 11.6% — — —West 34.6% $120,000 $121,500 $95,000-$152,500International 7.7% — — —
34.6%19.2%
11.6%15.4%
7.7%
3.8%
7.7%INTERNATIONAL
Summary of Graduates U.S. CITIZENS/ PERMANENT RESIDENTS FOREIGN NATIONALS TOTAL GRADUATING CLASS
Seeking New Employment 85.2% 23 11.1% 3 96.3% 26No Recent Information 3.7% 1 0.0% 0 3.7% 1Grand Total 88.9% 24 11.1% 3 100% 27
Position Source NUMBER % OF TOTAL
On-Campus/School Facilitated 13 50.0%Returning to On-Campus/School Facilitated Internship 1 3.8%On-Campus Recruiting 10 38.5%Other School Facilitated (Posting, Alumni/Faculty Networking, Etc.) 2 7.7%Off-Campus/Direct Contact 7 26.9%Direct Contact 5 19.2%Other Off-Campus Contact (Personal Network, Other Job Postings, Etc.) 2 7.7%Not Reported 6 23.1%Grand Total 26 100.0%
MSCM
16

MSCM
16
33
Base Salary by Citizenship HAVE USABLE PERCENT MEDIAN MEAN BASE SALARY DATA OF REPORTED BASE SALARY BASE SALARY SALARY RANGE
U.S. Citizen/Permanent Resident 2 66.7% — — — Foreign National 16 69.6% $120,000 $113,563 $50,000-$200,000Grand Total 52 55.9% $59,000 $58,977 $51,000-$88,000
Signing Bonus by Citizenship HAVE USABLE PERCENT MEDIAN BONUS MEAN BONUS BONUS RANGE SALARY DATA OF REPORTED
U.S. Citizen/Permanent Resident 2 100.0% — — — Foreign National 11 68.7% $25,500 $23,682 $3,000-$45,500Grand Total 13 72.2% $25,500 $23,923 $3,000-$45,500
Summary of Graduates U.S. CITIZENS/ PERMANENT RESIDENTS FOREIGN NATIONALS TOTAL GRADUATING CLASS
Seeking New Employment 85.2% 23 11.1% 3 96.3% 26No Recent Information 3.7% 1 0.0% 0 3.7% 1Grand Total 88.9% 24 11.1% 3 100% 27
Position Source NUMBER % OF TOTAL
On-Campus/School Facilitated 13 50.0%Returning to On-Campus/School Facilitated Internship 1 3.8%On-Campus Recruiting 10 38.5%Other School Facilitated (Posting, Alumni/Faculty Networking, Etc.) 2 7.7%Off-Campus/Direct Contact 7 26.9%Direct Contact 5 19.2%Other Off-Campus Contact (Personal Network, Other Job Postings, Etc.) 2 7.7%Not Reported 6 23.1%Grand Total 26 100.0%
Timing of Job Offers RECEIVED FIRST OFFER RECEIVED FIRST OFFER WITHIN RECEIVED FIRST OFFER WITHIN BY GRADUATION 3 MONTHS OF GRADUATION 6 MONTHS OF GRADUATION
U.S. Citizen/Permanent Resident 100.0% 100.0% 100.0%Foreign National 69.6% 95.7% 100.0%Grand Total 73.1% 96.2% 100.0%
Timing of Job Acceptances ACCEPTED OFFER ACCEPTED OFFER WITHIN ACCEPTED OFFER WITHIN BY GRADUATION 3 MONTHS OF GRADUATION 6 MONTHS OF GRADUATION
U.S. Citizen/Permanent Resident 100.0% 100.0% 100.0%Foreign National 69.6% 95.7% 100.0%Grand Total 73.1% 96.2% 100.0%
MSCM
16

MAcc
17
34
DEMOGRAPHIC OVERVIEW Class Size...................................................................................................... 105Women ....................................................................................................... 60%Underrepresented Minorities ....................................................................5% Average Grade Point Average (GPA) ..................................................... 3.6GMAT ScoreAverage ...............................................................................................................................644
Undergraduate MajorsBusiness .......................................................................................................94%Accounting .......................................................................................................................45%BBA ...................................................................................................................................... 35%Economics .........................................................................................................................10%Finance ..................................................................................................................................2%Commerce ............................................................................................................................1%Marketing ..............................................................................................................................1%Other..............................................................................................................6%History ...................................................................................................................................2%Asian Studies.......................................................................................................................1%History ....................................................................................................................................1%Home Interiors ...................................................................................................................1%Psychology ...........................................................................................................................1%
MAcc Graduate Overview
Master of Accounting graduates generally complete the one-year program directly after earning their undergraduate degree. While the primary emphasis is master’s-level coursework to sit for the CPA exam, MAcc students also take MBA-level electives to round out their experience.100%
OF GRADUATES RECEIVED AN OFFER WITHIN 6 MONTHS
OF GRADUATION
CLASS OF 2017
MAcc GRADUATESMAcc
17

MAcc
17
35
11
2017 HIRING COMPANIES BDO USA LLPCapital OneCotton & Co.DeloitteEYFinancial Accounting Standards Board
Ford Motor Co.Google Inc.Grant Thornton KPMG LLPMalone Bailey LLPPlante Moran
PwCSchultz and AssociatesStout Risius RossUniversity of Michigan
11 ROSS MAcc GRADUATES HAVE EARNED THE ELIJAH WATT SELLS AWARD SINCE 2012
THE BIG FOUR ACCOUNTING FIRMS SEEK ROSS MAcc STUDENTS
FOR NATIONAL PLACEMENT
I am always impressed at the quality of candidates that we meet at Ross. They are intellectual, prepared, and ambitious. When we see them in the workplace we know that they will leverage those skills to improve themselves, their teams, and those we serve.”ANGIE MAGAZINOCAMPUS RECRUITING SPECIALIST // DELOITTE
MAcc
17
MAcc
17
36
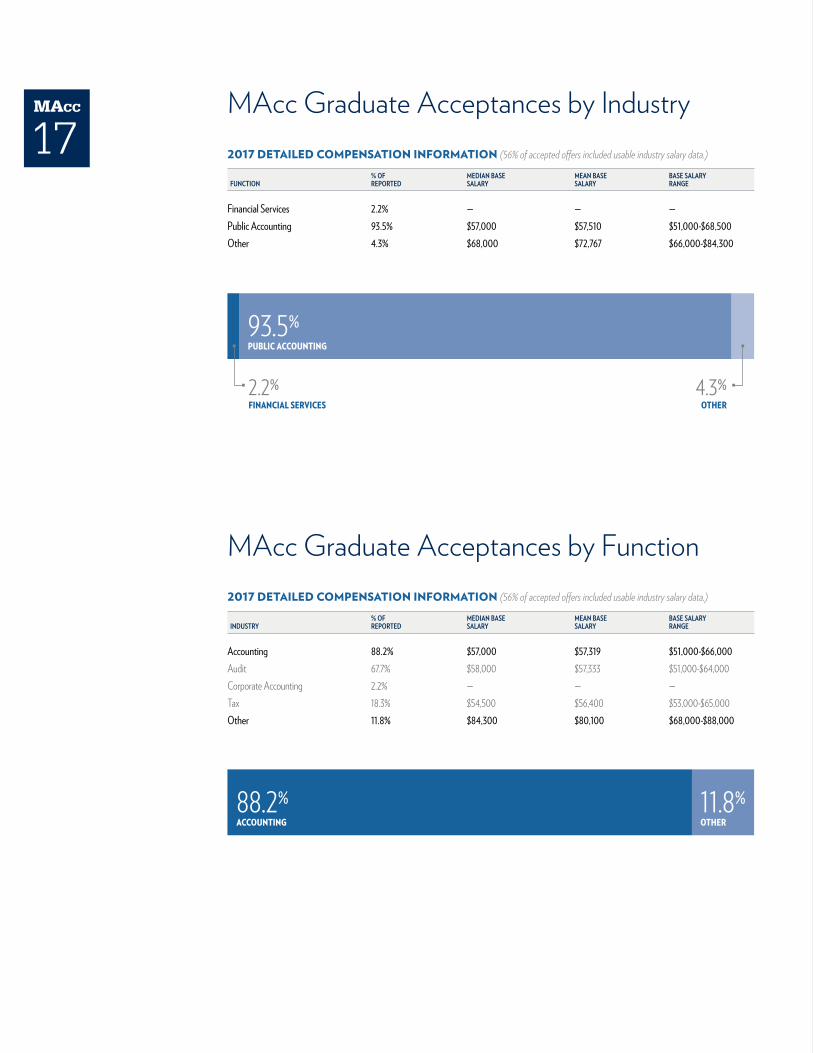
MAcc Graduate Acceptances by Industry2017 DETAILED COMPENSATION INFORMATION (56% of accepted offers included usable industry salary data.)
% OF MEDIAN BASE MEAN BASE BASE SALARY FUNCTION REPORTED SALARY SALARY RANGE
Financial Services 2.2% — — —Public Accounting 93.5% $57,000 $57,510 $51,000-$68,500Other 4.3% $68,000 $72,767 $66,000-$84,300
4.3%OTHER
93.5%PUBLIC ACCOUNTING
2.2%FINANCIAL SERVICES
MAcc Graduate Acceptances by Function2017 DETAILED COMPENSATION INFORMATION (56% of accepted offers included usable industry salary data.)
% OF MEDIAN BASE MEAN BASE BASE SALARY INDUSTRY REPORTED SALARY SALARY RANGE
Accounting 88.2% $57,000 $57,319 $51,000-$66,000Audit 67.7% $58,000 $57,333 $51,000-$64,000Corporate Accounting 2.2% — — —Tax 18.3% $54,500 $56,400 $53,000-$65,000Other 11.8% $84,300 $80,100 $68,000-$88,000
88.2%ACCOUNTING
11.8%OTHER
MAcc
17

MAcc
17
37
MAcc Graduate Acceptances by Region2017 DETAILED COMPENSATION INFORMATION (56% of accepted offers included usable region salary data.)
% OF MEDIAN BASE SALARY MEAN BASE SALARY BASE SALARY RANGE REGION REPORTED
Mid-Atlantic 3.2% $74,000 $74,000 $60,000-$88,000Washington DC Metro 3.2% $74,000 $74,000 $60,000-$88,000Midwest 60.2% $55,000 $57,619 $51,000-$84,300Chicago Metro 18.3% $60,000 $61,450 $59,000-$68,500Detroit Metro 35.5% $55,000 $56,226 $53,000-$84,300Minneapolis/St. Paul Metro 1.1% — — —Other 5.3% $55,000 $53,667 $51,000-$55,000Northeast 15.1% $60,000 $60,333 $57,000-$64,000Boston Metro 1.1% — — —Tri-State Area 14.0% $60,000 $60,333 $57,000-$64,000(New York, New Jersey, & Connecticut)South 3.2% — — —Atlanta Metro 2.1% — — —Other 1.1% — — —Southwest 2.2% — — —Denver Metro 1.1% — — —Other 1.1% — — —West 6.5% $60,000 $61,667 $59,000-$66,000Los Angeles Metro 2.2% — — —San Francisco Bay Area 4.3% $62,500 $62,750 $60,000-$66,000International 9.6% — — —Asia 8.5% — — —South America 1.1% — — —
4.3%SAN FRANCISCOBAY AREA
35.5%DETROIT METRO
6.5%WEST 60.2%
MIDWEST
2.2%SOUTHWEST 3.2%
SOUTH
3.2%MID-
ATLANTIC
15.1%NORTHEAST 14.0%
TRI-STATE AREA
18.3%CHICAGO METRO
9.6%INTERNATIONAL
MAcc
17
MAcc
17
38
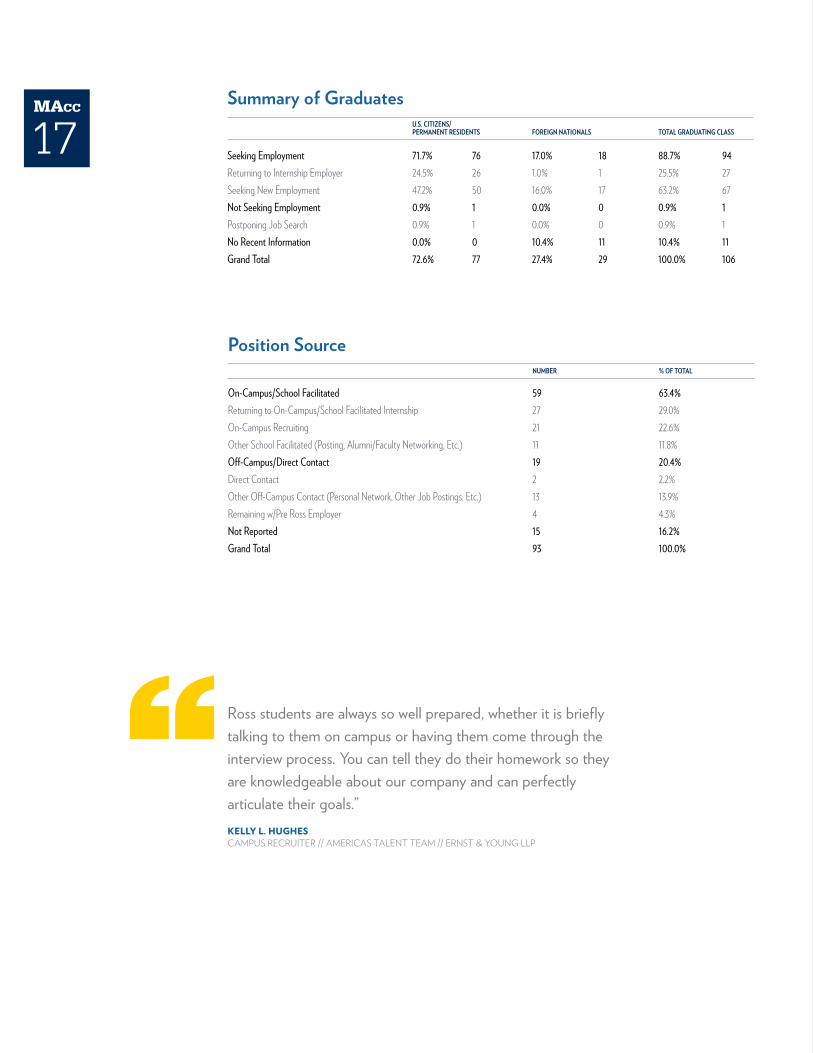
Summary of Graduates U.S. CITIZENS/ PERMANENT RESIDENTS FOREIGN NATIONALS TOTAL GRADUATING CLASS
Seeking Employment 71.7% 76 17.0% 18 88.7% 94Returning to Internship Employer 24.5% 26 1.0% 1 25.5% 27Seeking New Employment 47.2% 50 16.0% 17 63.2% 67Not Seeking Employment 0.9% 1 0.0% 0 0.9% 1Postponing Job Search 0.9% 1 0.0% 0 0.9% 1No Recent Information 0.0% 0 10.4% 11 10.4% 11Grand Total 72.6% 77 27.4% 29 100.0% 106
Position Source NUMBER % OF TOTAL
On-Campus/School Facilitated 59 63.4%Returning to On-Campus/School Facilitated Internship 27 29.0%On-Campus Recruiting 21 22.6%Other School Facilitated (Posting, Alumni/Faculty Networking, Etc.) 11 11.8%Off-Campus/Direct Contact 19 20.4%Direct Contact 2 2.2%Other Off-Campus Contact (Personal Network, Other Job Postings, Etc.) 13 13.9%Remaining w/Pre Ross Employer 4 4.3%Not Reported 15 16.2%Grand Total 93 100.0%
Ross students are always so well prepared, whether it is briefly talking to them on campus or having them come through the interview process. You can tell they do their homework so they are knowledgeable about our company and can perfectly articulate their goals.”KELLY L. HUGHESCAMPUS RECRUITER // AMERICAS TALENT TEAM // ERNST & YOUNG LLP
MAcc
17

MAcc
17
39
Base Salary by Citizenship HAVE USABLE PERCENT MEDIAN MEAN BASE SALARY DATA OF REPORTED BASE SALARY BASE SALARY SALARY RANGE
U.S. Citizen/Permanent Resident 49 64.4% $59,000 $58,996 $51,000-$88,000Foreign National 3 17.6% $57,000 $58,667 $54,000-$65,000Grand Total 52 55.9% $59,000 $58,977 $51,000-$88,000
Signing Bonus by Citizenship HAVE USABLE PERCENT MEDIAN BONUS MEAN BONUS BONUS RANGE SALARY DATA OF REPORTED
U.S. Citizen/Permanent Resident 11 22.4% $3,000 $4,045 $1,000-$12,000Foreign National 1 33.3% $2,000 $2,000 $2,000-$2,000Grand Total 12 23.1% $2,500 $3,875 $1,000-$12,000
Timing of Job Offers RECEIVED FIRST OFFER RECEIVED FIRST OFFER WITHIN RECEIVED FIRST OFFER WITHIN BY GRADUATION 3 MONTHS OF GRADUATION 6 MONTHS OF GRADUATION
U.S. Citizen/Permanent Resident 100.0% 100.0% 100.0%Foreign National 88.9% 94.4% 100.0%Grand Total 97.9% 98.9% 100.0%
Timing of Job Acceptances ACCEPTED OFFER ACCEPTED OFFER WITHIN ACCEPTED OFFER WITHIN BY GRADUATION 3 MONTHS OF GRADUATION 6 MONTHS OF GRADUATION
U.S. Citizen/Permanent Resident 100.0% 100.0% 100.0%Foreign National 88.9% 94.4% 100.0%Grand Total 97.9% 98.9% 100.0%
MAcc
17

BBA
17
40
190+ COMPANIES HIRED GRADUATES IN 2017
Our Bachelor of Business Administration students graduate from a top-ranked program with an innovative curriculum emphasizing hands-on learning. Students take about half their credits outside of Ross, ensuring that our graduates are well-rounded, creative, and skilled in critical thinking.
DEMOGRAPHIC OVERVIEW Regular AdmissionClass Size......................................................................................................395Grade Point Average (GPA) ..................................................................... 3.7Women ........................................................................................................43%Underrepresented Minorities ....................................................................4% International Students ................................................................................ 7%
Preferred AdmissionClass Size.........................................................................................................77Grade Point Average (GPA) ..................................................................... 3.7Women ........................................................................................................ 27%Underrepresented Minorities .....................................................................1% International Students .............................................................................. 10%
BBA Graduate Overview
CLASS OF 2017
BBA GRADUATES
190+
BBA
17

BBA
17
41
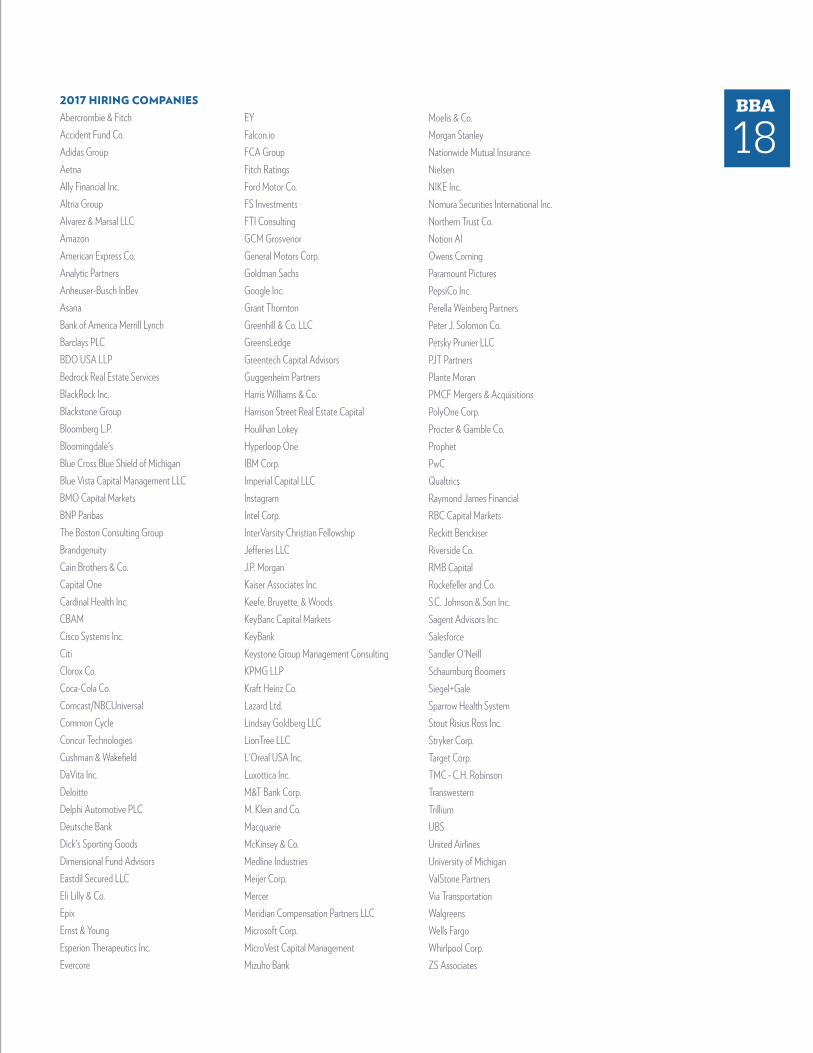
2017 HIRING COMPANIES A.T. Kearney Inc.Abercrombie & FitchAccentureAetnaAgvantage Solutions Alidade Capital LLCAllyAlvarez & Marsal LLCAmazonAmerican Express Co.Anheuser-Busch Companies Inc.AppleThe Ardent Co.Ares Management LLCAutomation IdeasBain & Co. Inc.Bank of America Merrill LynchBarclays PLCBay Area Urban DevelopmentBlackRock Inc.The Blackstone GroupBloomberg L.P.Bluewolf GroupBLVD Capital InvestmentBMO Capital MarketsBNP ParibasBoschThe Boston Consulting GroupBP America Inc.Brixmor Property GroupBTIGBusiness InsiderCantor FitzgeraldCapgeminiCapital OneCardinal Health Inc.CBRE Inc.Centerview Partners LLCChange HealthcareCisco Systems Inc.CitiCity YearThe Clorox Co.Comcast/NBCUniversalCornerstone ResearchCrèdit Agricole CIBDaVita Inc.Dell Inc.DeloitteDeutsche BankDHL ConsultingDick's Sporting GoodsDigitasDimensional Fund AdvisorsDrake Star PartnersDTE EnergyDuff & Phelps LLCEli Lilly & Co.End-to-End AnalyticsEvercoreEYFacebook Inc.Federal Bureau of InvestigationFord Motor Co.FTI ConsultingGartnerGCM Grosvenor
General Motors Corp.Geronimo EnergyGoldman Sachs GroupGoogle Inc.Graceland Fruit Inc.Greentech Capital AdvisorsGuggenheim PartnersHeitmanHorizon Media Inc.Houlihan LokeyHudson's Bay Co. – Lord & TaylorHuron Consulting GroupIBM Corp.Insight Venture PartnersIntel Corp.InterVarsity Christian FellowshipJ.P. MorganJefferies LLCJet.comJLL The Keystone Group Management ConsultingKPMG LLPKraft Heinz Co.The Kresge FoundationL.E.K. ConsultingLazardLieberman Research WorldwideLinkedInLord AbbettL'Oreal USA Inc.M&T Bank Corp.Macquarie Holdings (USA) Inc.Marcus & Millichap Real Estate Investment ServicesMariner Investment GroupMcKinsey & Co.MercerMeritorMerrill Lynch Wealth ManagementMicrosoft Corp.Middleburg ManagementMizuho BankMorgan StanleyMotiva EnterprisesMUFGNAI WisinskiNewbury PartnersNielsenNomura Securities International, Inc.Northrop GrummanThe NRP Group LLCNWQ Investment ManagementOch-Ziff Capital Management GroupOctagonOgilvy and MatherOneStream Software LLCOraclePeak6 InvestmentsPenski LogisticsPepsiCo Inc.Peter J. Solomon Co.Pfizer Inc.Pickering PacificPJT PartnersPlante MoranPolyOne Corp.
Practice IgnitionPrime Finance PartnersProcter & Gamble Co.ProphetPwCQualtricsQuicken LoansQuill.comThe Raine GroupRaymond James & AssociatesRBC Capital MarketsReckitt BenckiserRefinery29Rent the RunwayResidential Capital ManagementRightpoint Consulting Roland Berger Strategy ConsultantsRothschild Inc.S&P Capital IQ / McGraw Hill FinancialS.C. Johnson & Son Inc.Sagent Advisors Inc.Saks Fifth AvenueSalesforceService.comThe Scion GroupShell Oil Co.SitusStarwood Retail Partners StifelStone Street PropertiesStout Risius Ross Inc.Strategy&Stryker Corp.Sumitomo Mitsui Banking Corp. NikkoSusquehanna International Group, LLPSynchrony FinancialTarget Corp.Tenex Capital ManagementTPG CapitalTrafiguraTreacy & Co.Uber TechnologiesUBSUnileverUnion Pacific Railroad Co.United AirlinesUnited States of America Peace CorpsUniversity of MichiganThe Vanguard GroupVaynerMediaVenture for AmericaVillageMDVisaVista Equity PartnersWalgreensWells FargoWhirlpool Corp.William BlairWilliam Morris EndeavorWomen's Alzheimer's MovementXL CatlinYahoo! Inc.YelpZillow GroupZS Associates
BBA
17

BBA
17
42
BBA Graduate Acceptances by Industry
2017 DETAILED COMPENSATION INFORMATION (75% of accepted offers included usable industry salary data.)
BASE SALARY SIGNING BONUS
% OF % OF INDUSTRY REPORTED MEDIAN MEAN RANGE REPORTED MEDIAN
Consulting 20.8% $75,000 $73,742 $50,000-$95,000 64.2% $5,000Consumer Packaged Goods 6.7% $62,000 $62,119 $45,000-$70,000 26.9% $5,000Energy 1.3% $66,000 $66,000 $52,000-$75,000 80.0% $5,500Financial Services 38.2% $85,000 $79,246 $50,000-$100,000 48.3% $10,000Healthcare 3.3% $62,500 $61,042 $53,000-$67,000 61.5% $5,000Manufacturing 3.3% $69,992 $66,918 $58,000-$73,800 53.8% $10,000Media/Entertainment/Sports 1.8% $52,500 $56,250 $35,000-$85,000 28.6% $7,500Real Estate 4.6% $62,500 $64,500 $55,000-$85,000 27.8% $5,000Retail 2.8% $58,500 $58,750 $50,000-$65,000 45.5% $6,000Technology 9.7% $70,000 $68,423 $34,000-$103,000 36.8% $6,000Other* 7.5% $57,000 $58,615 $21,000-$85,000 27.6% $5,000
*Other includes Education/Government/Nonprofit - 1.8%
2.8%RETAIL
20.8%CONSULTING
38.2%FINANCIAL SERVICES
9.7%TECHNOLOGY
6.7%CONSUMER
PACKAGED GOODS
3.3%HEALTHCARE
4.6%REAL ESTATE
1.8%MEDIA/ENTERTAINMENT/SPORTS
3.3%MANUFACTURING
1.3%ENERGY
7.5%OTHER
BBA
17

BBA
17
43
42.1%FINANCE
BBA Graduate Acceptances by Function
2017 DETAILED COMPENSATION INFORMATION (75% of accepted offers included usable function salary data.)
BASE SALARY SIGNING BONUS
% OF % OF FUNCTION REPORTED MEDIAN MEAN RANGE REPORTED MEDIAN
Accounting 3.3% $58,500 $57,500 $53,000-$65,000 50.0% $3,000Consulting 22.6% $75,000 $72,806 $45,000-$95,000 75.0% $5,000Internal Consulting 2.3% $66,000 $70,333 $60,000-$85,000 83.3% $5,000IT/Systems Consulting 4.1% $70,000 $67,115 $45,000-$77,500 61.5% $7,750Operations/Process Management 1.3% $70,000 $74,200 $64,000-$95,000 100.0% $5,000Strategy Consulting 14.9% $75,000 $74,510 $50,000-$85,000 75.0% $5,000Finance 42.1% $85,000 $77,960 $50,000-$100,000 63.9% $10,000Asset Management 10.3% $80,000 $74,672 $50,000-$90,000 44.8% $10,000Corporate Finance 7.2% $63,250 $63,925 $55,000-$80,000 66.7% $5,500General Finance 1.3% $80,000 $80,000 $65,000-$95,000 25.0% $10,000Investment Banking 16.9% $85,000 $84,182 $65,000-$100,000 72.7% $10,000Private Equity/Venture Capital 2.3% $85,000 $80,714 $60,000-$90,000 71.4% $10,000Sales & Trading 4.1% $85,000 $82,929 $70,000-$85,000 71.4% $10,000General Management 2.1% $62,500 $62,500 $55,000-$70,000 50.0% $5,000Human Resources 1.3% $70,000 $65,000 $53,000-$72,000 33.3% $6,500Marketing/Sales 17.7% $62,000 $62,000 $35,000-$93,500 44.9% $5,000Buying/Merchandising 1.3% $56,000 $55,500 $50,000-$60,000 75.0% $5,000General Marketing 6.7% $64,500 $60,583 $35,000-$85,000 38.9% $5,000Brand/Product Management 3.6% $61,500 $65,292 $57,000-$89,000 41.7% $6,000Sales 6.2% $65,000 $62,800 $35,000-$93,500 46.7% $5,000Operations/Supply Chain Management 1.8% $70,000 $70,026 $64,000-$80,000 100.0% $10,000Other* 9.1% $66,500 $64,050 $21,000-$103,000 50.0% $8,000
*Other includes Strategic Planning – 0.5%, and IT – 0.8%
22.6%CONSULTING
9.1%OTHER
2.1%GENERAL MANAGEMENT
1.8%OPERATIONS/
SUPPY CHAIN MANAGEMENT
1.3%HUMAN RESOURCES
3.3%ACCOUNTING
17.7%MARKETING/SALES
$72.5K MEDIAN BASE SALARY
BBA
17

BBA
17
44
BBA Graduate Acceptances by Region
2017 DETAILED COMPENSATION INFORMATION (75% of accepted offers included usable function salary data.)
BASE SALARY SIGNING BONUS
% OF % OF REGION REPORTED MEDIAN MEAN RANGE REPORTED MEDIAN
Mid-Atlantic 1.0% — — — — —Washington DC Metro 0.7% — — — — —Other 0.3% — — — — —Midwest 36.8% $65,000 $66,671 $21,000-$85,000 62.6% $5,000Chicago Metro 21.1% $70,000 $69,436 $47,500-$85,000 67.1% $5,000Detroit Metro 9.1% $65,000 $63,787 $21,000-$80,000 60.0% $5,000Minneapolis/St. Paul Metro 1.6% $57,000 $63,833 $53,000-$85,000 33.3% $3,500Other 5.0% $58,000 $59,214 $53,000-$70,000 57.1% $5,000Northeast 41.5% $85,000 $78,357 $35,000-$95,000 63.3% $10,000Boston Metro 1.3% — — — — —Tri-State Area 38.9% $85,000 $78,774 $35,000-$95,000 64.0% $10,000(New York, New Jersey, & Connecticut) Other 1.3% $71,250 $66,375 $38,000-$85,000 25.0% $12,000South 3.1% $62,000 $61,000 $45,000-$75,000 55.6% $5,000Atlanta Metro 1.0% — — — — —Miami Metro 0.5% — — — — —Other 1.6% $55,000 $58,000 $45,000-$70,000 60.0% $5,000Southwest 2.9% $65,000 $63,500 $50,000-$70,000 70.0% $5,000Dallas Metro 0.5% — — — — —Denver Metro 0.8% — — — — —Houston Metro 0.5% — — — — —Phoenix Metro 0.3% — — — — —Other 0.8% — — — — —West 12.0% $70,000 $73,547 $45,000-$103,000 65.6% $7,000Los Angeles Metro 2.3% $75,000 $75,000 $65,000-$85,000 50.0% $12,500San Francisco Bay Area 6.8% $70,000 $72,775 $45,000-$95,000 70.0% $7,000Seattle Metro 1.6% $78,000 $80,000 $60,000-$103,000 40.0% $4,000Other 1.3% $64,000 $66,000 $64,000-$70,000 100.0% $5,000International 2.7% $80,000 $73,800 $35,000-$100,000 Africa 0.3% — — — — —Asia 1.8% $84,000 $84,667 $70,000-$100,000 — —Europe 0.3% — — — — —Australia 0.3% — — — — —
BBA
17

BBA
17
45
6.8%SAN FRANCISCOBAY AREA
9.1%DETROIT METRO
1.6%SEATTLE METRO
12%WEST 36.8%
MIDWEST
2.9%SOUTHWEST 3.1%
SOUTH
1%MID-
ATLANTIC
41.5%NORTHEAST
2.7%INTERNATIONAL
21.1%CHICAGO METRO
38.9%TRI-STATE AREA
76% OF GRADUATES ACCEPT JOBS ON THE EAST COAST, WEST COAST, OR IN CHICAGO
76%
BBA
17

BBA
17
46
Summary of Graduates U.S. CITIZENS/ PERMANENT RESIDENTS FOREIGN NATIONALS TOTAL GRADUATING CLASS
Seeking Employment 385 78.4% 17 3.5% 402 81.9%Returning to Internship Employer 117 23.8% 4 0.8% 121 24.6%Seeking New Employment 268 54.6% 13 2.6% 281 57.2%Not Seeking Employment 30 6.1% 6 1.2% 36 7.3%Continuing Education 25 5.1% 6 1.2% 31 6.3%Not Currently Seeking Employment 1 0.2% — 0.0% 1 0.2%Postponing Job Search 1 0.2% — 0.0% 1 0.2%Starting/Buying Company 3 0.6% — 0.0% 3 0.6%No Information Available 52 10.6% 1 0.2% 53 10.8%Grand Total 467 95.1% 24 4.9% 491 100.0%
Position Source NUMBER % OF TOTAL
On-Campus/School Facilitated 233 59.7%On-Campus Recruiting 63 16.2%Returning to On-Campus/School Facilitated Internship 121 31.0%Other School Facilitated (Posting, Alumni/Faculty Networking, Etc.) 49 12.5%Off-Campus/Direct Contact 109 28.0%Direct Contact 41 10.6%Other Off-Campus Contact (Personal Network, Other Job Postings, Etc.) 45 11.5%Prior Employer 23 5.9%Not Reported 48 12.3%Grand Total 390 100.0%
BBA
17

BBA
17
47
Timing of Job Offers RECEIVED FIRST OFFER RECEIVED FIRST OFFER WITHIN BY GRADUATION 3 MONTHS OF GRADUATION
U.S. Citizen/Permanent Resident 86.5% 98.4%Foreign National 70.6% 88.2%Grand Total 85.8% 98.0%
Timing of Job Acceptances ACCEPTED OFFER ACCEPTED OFFER WITHIN BY GRADUATION 3 MONTHS OF GRADUATION
U.S. Citizen/Permanent Resident 84.4% 97.4%Foreign National 70.6% 88.2%Grand Total 83.8% 97.0%
Base Salary by Citizenship HAVE USABLE PERCENT MEDIAN MEAN BASE SALARY DATA OF REPORTED BASE SALARY BASE SALARY SALARY RANGE
U.S. Citizen/Permanent Resident 288 76.8% $72,250 $71,909 $21,000-$103,000Foreign National 7 46.6% $80,000 $77,286 $67,000-$85,000Grand Total 295 75.6% $72,500 $72,036 $21,000-$103,000
Signing Bonus by Citizenship HAVE USABLE PERCENT MEDIAN BONUS MEAN BONUS BONUS RANGE SALARY DATA OF REPORTED
U.S. Citizen/Permanent Resident 182 63.2% $7,500 $8,072 $1,000-$40,000Foreign National 2 28.6% — — —Grand Total 184 62.4% $7,500 $8,038 $1,000-$40,000
98% OF GRADUATES RECEIVED AN OFFER WITHIN 3 MONTHS OF GRADUATION
BBA
17

BBA
18
48
BBA Intern Overview
Students in the Ross BBA Program learn critical business skills with a boundary-breaking approach. They start with a strong foundation in core classes, and expand their experience with electives and often study overseas.
DEMOGRAPHIC OVERVIEW Regular AdmissionClass Size......................................................................................................465Grade Point Average (GPA) ..................................................................... 3.7Women ........................................................................................................35%Underrepresented Minorities ....................................................................4% International Students ................................................................................6%
Preferred AdmissionClass Size...................................................................................................... 105Grade Point Average (GPA) ..................................................................... 3.7Women ........................................................................................................ 41%Underrepresented Minorities .................................................................... 7% International Students ................................................................................6%
OVER 150 COMPANIES HIRED BBA INTERNS
IN 2017
150+
CLASS OF 2018
BBA INTERNS BBA
18
BBA
18
49
2017 HIRING COMPANIES Abercrombie & FitchAccident Fund Co.Adidas GroupAetnaAlly Financial Inc.Altria GroupAlvarez & Marsal LLCAmazonAmerican Express Co.Analytic PartnersAnheuser-Busch InBevAsanaBank of America Merrill LynchBarclays PLCBDO USA LLPBedrock Real Estate ServicesBlackRock Inc.Blackstone GroupBloomberg L.P.Bloomingdale's Blue Cross Blue Shield of MichiganBlue Vista Capital Management LLCBMO Capital MarketsBNP ParibasThe Boston Consulting GroupBrandgenuityCain Brothers & Co.Capital OneCardinal Health Inc.CBAMCisco Systems Inc.CitiClorox Co.Coca-Cola Co.Comcast/NBCUniversalCommon CycleConcur TechnologiesCushman & WakefieldDaVita Inc.DeloitteDelphi Automotive PLCDeutsche BankDick's Sporting GoodsDimensional Fund AdvisorsEastdil Secured LLCEli Lilly & Co.EpixErnst & YoungEsperion Therapeutics Inc.Evercore
EYFalcon.ioFCA GroupFitch RatingsFord Motor Co.FS InvestmentsFTI ConsultingGCM GrosvenorGeneral Motors Corp.Goldman SachsGoogle Inc.Grant Thornton Greenhill & Co. LLCGreensLedgeGreentech Capital AdvisorsGuggenheim PartnersHarris Williams & Co.Harrison Street Real Estate CapitalHoulihan LokeyHyperloop OneIBM Corp.Imperial Capital LLCInstagramIntel Corp.InterVarsity Christian FellowshipJefferies LLCJ.P. MorganKaiser Associates Inc.Keefe, Bruyette, & WoodsKeyBanc Capital MarketsKeyBankKeystone Group Management ConsultingKPMG LLPKraft Heinz Co.Lazard Ltd.Lindsay Goldberg LLCLionTree LLCL'Oreal USA Inc.Luxottica Inc.M&T Bank Corp.M. Klein and Co.MacquarieMcKinsey & Co.Medline IndustriesMeijer Corp.MercerMeridian Compensation Partners LLCMicrosoft Corp.MicroVest Capital Management Mizuho Bank
Moelis & Co.Morgan StanleyNationwide Mutual InsuranceNielsenNIKE Inc.Nomura Securities International Inc.Northern Trust Co.Notion AIOwens CorningParamount PicturesPepsiCo Inc.Perella Weinberg PartnersPeter J. Solomon Co.Petsky Prunier LLCPJT PartnersPlante MoranPMCF Mergers & AcquisitionsPolyOne Corp.Procter & Gamble Co.ProphetPwCQualtricsRaymond James FinancialRBC Capital MarketsReckitt BenckiserRiverside Co.RMB CapitalRockefeller and Co.S.C. Johnson & Son Inc.Sagent Advisors Inc.SalesforceSandler O'NeillSchaumburg BoomersSiegel+GaleSparrow Health SystemStout Risius Ross Inc.Stryker Corp.Target Corp.TMC – C.H. RobinsonTranswesternTrilliumUBSUnited AirlinesUniversity of MichiganValStone PartnersVia TransportationWalgreensWells FargoWhirlpool Corp.ZS Associates
BBA
18

BBA
18
50
54.3%FINANCIAL SERVICES
BBA Intern Acceptances by Industry
2017 DETAILED COMPENSATION INFORMATION (81% of accepted offers included usable industry salary data.)
% OF MEDIAN BASE SALARY MEAN BASE SALARY BASE SALARY RANGE INDUSTRY REPORTED (ANNUALIZED) (ANNUALIZED) (ANNUALIZED)
Consulting 11.4% $60,000 $62,583 $26,880-$80,004Consumer Packaged Goods 8.0% $43,200 $47,390 $27,000-$97,200Financial Services 54.3% $69,600 $65,136 $12,000-$120,000Healthcare 3.4% $36,480 $42,982 $33,600-$79,200Manufacturing 5.2% $39,600 $40,151 $28,800-$46,800Media/Entertainment/Sports 1.2% $24,900 $25,770 $12,000-$41,280Real Estate 3.1% $43,200 $51,750 $24,000-$96,000Retail 2.8% $36,000 $36,333 $21,600-$52,800Technology 7.1% $48,000 $52,951 $24,000-$110,004Other 3.5% $37,200 $37,648 $12,000-$60,000
11.4%CONSULTING
8%CONSUMER
PACKAGED GOODS
1.2%MEDIA/ENTERTAINMENT/SPORTS
5.2%MANUFACTURING
7.1%TECHNOLOGY
3.4%HEALTHCARE
3.5%OTHER
2.8%RETAIL
3.1%REAL ESTATE
BBA
18

BBA
18
51
BBA Intern Acceptances by Function
2017 DETAILED COMPENSATION INFORMATION (81% of accepted offers included usable function salary data.)
% OF MEDIAN BASE SALARY MEAN BASE SALARY BASE SALARY RANGE FUNCTION REPORTED (ANNUALIZED) (ANNUALIZED) (ANNUALIZED)
Accounting 10.9% $54,240 $54,803 $44,160-$69,000Advisory 2.5% $58,128 $56,823 $44,160-$67,500Audit 6.2% $54,120 $54,063 $47,040-$60,000General Accounting 2.2% $47,040 $53,640 $46,080-$69,000Consulting 11.7% $60,960 $62,539 $21,600-$80,004IT/Systems Consulting 1.5% $66,480 $66,180 $53,760-$78,000Strategy Consulting 7.4% $64,800 $63,769 $26,880-$80,004General Consulting 2.8% $60,000 $57,776 $21,600-$72,000Finance 50.3% $72,000 $64,387 $12,000-$120,000Asset Management 7.7% $42,000 $48,408 $12,000-$86,400Corporate Finance 10.8% $42,000 $46,461 $30,720-$72,000General Finance 3.1% $60,156 $67,994 $42,240-$96,000Investment Banking 22.8% $84,000 $76,577 $14,400-$120,000Private Equity/Venture Capital 1.9% $48,000 $53,400 $24,000-$90,000Sales & Trading 4.0% $84,000 $83,184 $78,456-$84,996Marketing/Sales 14.8% $39,600 $42,148 $12,000-$97,200Brand/Product Management 4.0% $42,240 $43,512 $27,000-$55,800General Marketing 5.9% $38,520 $42,495 $21,600-$71,400Sales 4.9% $37,680 $40,650 $12,000-$97,200Operations/Supply Chain Management 3.7% $47,400 $54,892 $36,000-$110,004Strategic Planning 1.5% $38,400 $39,552 $12,000-$57,600Other* 7.1% $41,640 $43,763 $24,000-$96,000
*Other includes IT – 0.6%, Human Resources – 0.6%, and General Management – 0.3%
50.3%FINANCE
14.8%MARKETING/SALES
11.7%CONSULTING
10.9%ACCOUNTING
7.1%OTHER
3.7%OPERATIONS/
SUPPLY CHAIN MANAGEMENT
1.5%STRATEGIC PLANNING
$53.7KMEAN BASE ANNUALIZED SALARY
BBA
18

BBA
18
52
BBA Intern Acceptances by Region
2017 DETAILED COMPENSATION INFORMATION (81% of accepted offers included usable region salary data.)
% OF MEDIAN BASE SALARY MEAN BASE SALARY BASE SALARY RANGE REGION REPORTED (ANNUALIZED) (ANNUALIZED) (ANNUALIZED)
Mid-Atlantic 3.7% $41,700 $44,723 $21,600-$74,400Other 0.6% — — —Philadelphia Metro 0.3% — — — Washington DC Metro 2.8% $45,000 $48,484 $24,000-$74,400Midwest 38.0% $47,040 $50,802 $12,000-$96,000Chicago Metro 17.9% $60,000 $58,649 $12,000-$96,000Detroit Metro 12.0% $46,080 $43,572 $12,000-$80,004Minneapolis/St. Paul Metro 0.9% — — — Other 7.2% $40,320 $41,438 $12,000-$72,000Northeast 43.5% $70,002 $65,254 $15,600-$120,000Tri-State Area 43.2% $70,008 $65,480 $15,600-$120,000(New York, New Jersey, & Connecticut) — — — —Other 0.3% — — — South 1.5% $39,360 $41,064 $35,520-$51,000Atlanta Metro 0.3% — — — Other 1.2% $40,320 $41,970 $35,520-$51,000Southwest 1.9% $51,504 $52,070 $36,720-$60,312Dallas Metro 1.6% $51,504 $50,010 $36,720-$60,312Other 0.3% — — —West 11.1% $54,000 $58,537 $14,400-$110,004Los Angeles Metro 2.2% $54,000 $60,708 $28,200-$84,996San Francisco Bay Area 5.9% $58,620 $61,727 $14,400-$110,004Seattle Metro 1.5% $62,400 $61,800 $45,600-$72,000Other 1.5% $40,320 $40,752 $33,600-$49,200International 0.3% — — — Asia 0.3% — — —
BBA
18

BBA
18
53
11.1%WEST 38%
MIDWEST
1.9%SOUTHWEST 1.5%
SOUTH
3.7%
MID-ATLANTIC
43.5%
NORTHEAST
0.3%INTERNATIONAL
44% OF BBAs INTERNED IN THE NORTHEAST
44%
17.9%CHICAGO METRO
5.9%SAN FRANCISCOBAY AREA
BBA
18

54
RECRUIT WITH ROSSmichiganross.umich.edu/[email protected]
Career Development OfficeStephen M. Ross School of Business University of Michigan 700 East University Blau Hall, Second Floor Ann Arbor, MI 48109-1234
NEVER STOP LEARNINGHelp transform your organization and your career with Ross Executive Education programsmichiganross.umich.edu/execed
STAY UP-TO-DATEGet the latest in practical business research with the Ross Thought in Action newslettermichiganross.umich.edu/rtia
CONNECTWITH US

THE REGENTS OF THE UNIVERSITY OF MICHIGAN Michael J. Behm, Mark J. Bernstein, Shauna Ryder Diggs, Denise Ilitch, Andrea Fischer Newman, Andrew C. Richner, Ron Weiser, Katherine E. White, Mark S. Schlissel (ex officio)
UNIVERSITY OF MICHIGAN NONDISCRIMINATION POLICY NOTICE The University of Michigan, as an equal opportunity/affirmative action employer, complies with all applicable federal and state laws regarding nondiscrimination and affirmative action. The University of Michigan is committed to a policy of equal opportunity for all persons and does not discriminate on the basis of race, color, national origin, age, marital status, sex, sexual orientation, gender identity, gender expression, disability, religion, height, weight, or veteran status in employment, educational programs and activities, and admissions. Inquiries or complaints may be addressed to the Senior Director for Institutional Equity, and Title IX/Section 504/ADA Coordinator, Office for Institutional Equity, 2072 Administrative Services Building, Ann Arbor, Michigan 48109-1432, 734-763-0235, TTY 734-647-1388, [email protected]. For other University of Michigan information call 734-764-1817.
© 2018 The Stephen M. Ross School of Business at the University of Michigan
Career Development OfficeStephen M. Ross School of BusinessUniversity of Michigan 700 East UniversityBlau Hall, Second Floor Ann Arbor, MI 48109-1234 734-764-1373 [email protected]/recruiters