enbis presentation(2)
DESCRIPTION
TRANSCRIPT

06 /09/2011
Research Project “ Methodology for scaling Applied
Statistics as Competitive Advantage”
1
Igor BARAHONA TORRES. And
Alex RIBA CIVIL

2
IN THIS PRESENTATION.
INTRODUCTION
STATE OF THE ART
RESEARCH OBJECTIVES
THE DRAFT OF A SCALE
THE METHODOLOGY
CONCLUSIONS

3
IN THIS PRESENTATION.
INTRODUCTION
STATE OF THE ART
RESEARCH OBJECTIVES
THE DRAFT OF A SCALE
THE METHODOLOGY
CONCLUSIONS

4
INTRODUCTION
At first, some basic information about Catalonia is provided
441,858 756,293 810,564 5,526,536 7,535,251
47,150,819
Lleida Girona Tarragona Barcelona Cataluña España
Population
Catalonia is located in the north East of Spain
It is composed for 4 regions
Catalonia represents around 16% of the total population of Spain
Around 73% of Catalonia's population live in Barcelona
IDESCAT & lNE (2011)

5 5
INTRODUCTION
WHAT IS THE BUSINESS
MANAGEMENT ENVIRONMENT
LIKE TODAY?
BETTER INFORMATION SYSTEMS. (MRP, CRM, ERP, etc)
MORE COMPLEXITY AND UNCERTAINTY
INTERNET IS AVAILABLE FOR MOST OF THE COMPANIES
MORE POWERFUL COMPUTERS
BIGGER AMOUNT OF DATA AVAILABLE FOR ANALYSIS
Burby & Atchison (2007), Petroni & Braglia. (2000) & Roberts (1990)

6
INTRODUCTION
IF COMPANIES HAVE MORE DATA AND BETTER
INFORMATION SYSTEMS
HOW CAN HIGHER
PROFITS BE OBTAINED?
THE POINT IS..........

7
STATE OF THE ART
INTRODUCTION
STATE OF THE ART
RESEARCH OBJECTIVES
THE DRAFT OF A SCALE
THE METHODOLOGY
CONCLUSIONS

8
APPLIED STATISTICS IN BUSINESS. WHAT IT IS?
One approach is to understand it as a process with INPUTS and OUTPUTS.
8
WHAT IS APPLIED STATISTICS IN BUSINESS MANAGEMENT?
Extensive use of data and statistical methods
To understand the past performance
To reduce uncertainty
To forecast the future and to predict behaviors.
Better decision making
Evidence-based decision making
OUTPUTS
ADDED VALUE
INPUTS

9
Systematic Thinking
Management support
To remove obstacles
To provide the technical human and financial resources
.
To encourage the staff to be involved in the project
Emergence
Hierarchy
Communication
Control.
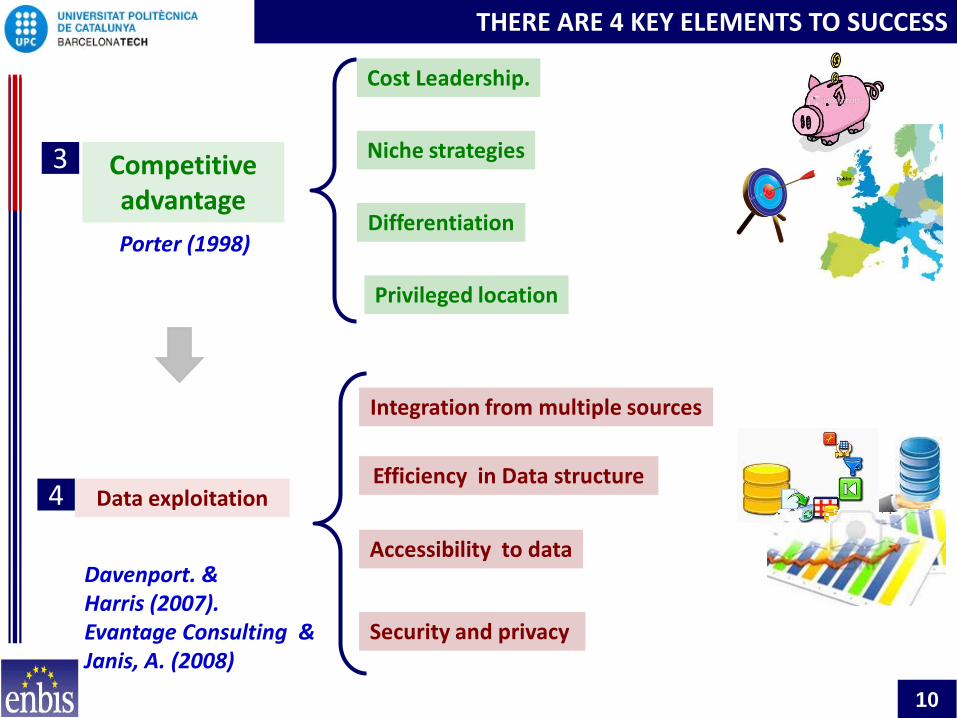
THERE ARE 4 KEY ELEMENTS TO SUCCESS
Jackson (1992) & Yeo (1993)
McDonough (2000), Banks (1993) & Deming (2000)
1
2
10
Competitive advantage
Data exploitation
Cost Leadership.
Niche strategies
Differentiation
Privileged location
4
Integration from multiple sources
Efficiency in Data structure
Accessibility to data
Security and privacy
Porter (1998)
Davenport. & Harris (2007). Evantage Consulting & Janis, A. (2008)
THERE ARE 4 KEY ELEMENTS TO SUCCESS
3
11
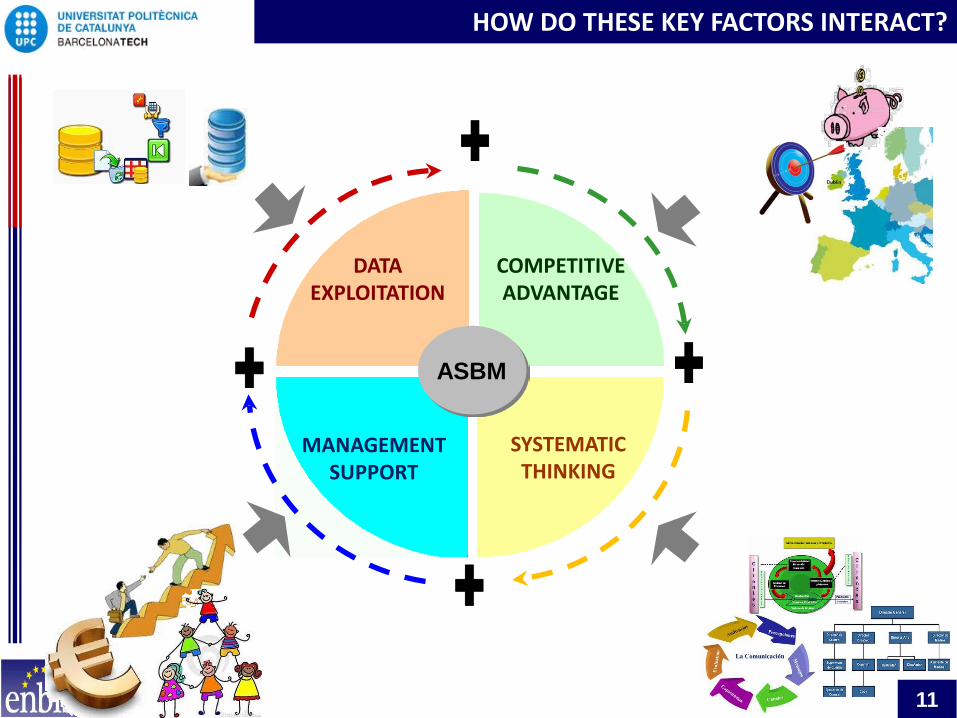
HOW DO THESE KEY FACTORS INTERACT?
ASBM
COMPETITIVE ADVANTAGE
SYSTEMATIC THINKING
MANAGEMENT SUPPORT
DATA EXPLOITATION
12
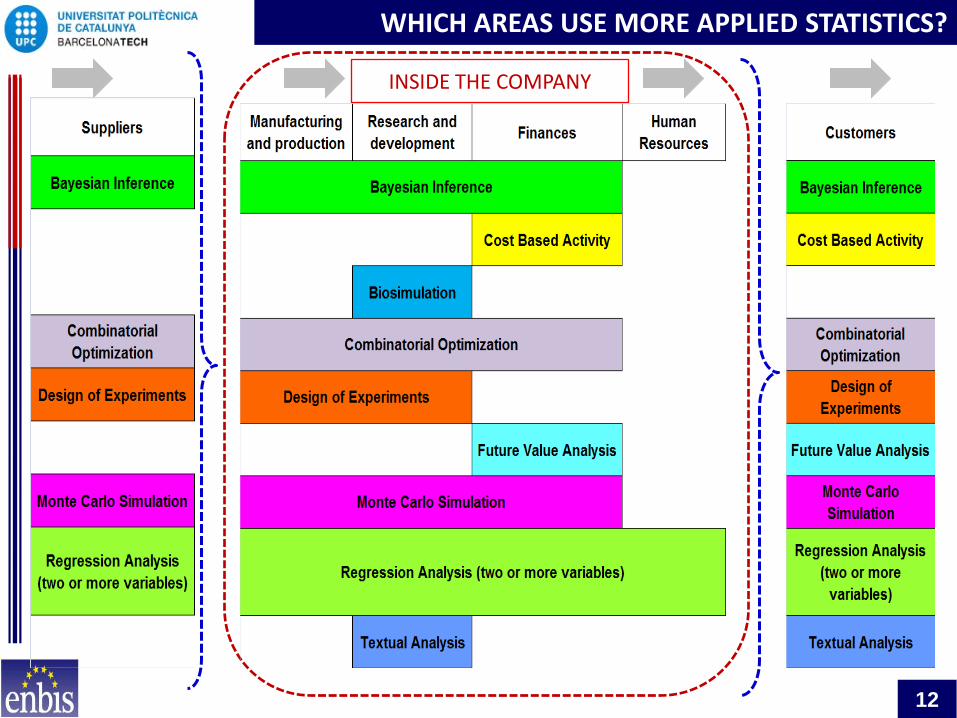
WHICH AREAS USE MORE APPLIED STATISTICS?
INSIDE THE COMPANY

13
RESEARCH OBJECTIVES
INTRODUCTION
STATE OF THE ART
RESEARCH OBJECTIVES
THE DRAFT OF A SCALE
THE METHODOLOGY
CONCLUSIONS

14
RESEARCH OBJECTIVES
1. To create a quantitative scale for ranking a sample of Catalonian Companies according to their 1) Data exploitation with statistical tools, 2) Competitive advantage, 3) Management support and 4) Systematic thinking
2. To apply the created scale on a previously defined sample of Catalonian Companies, in order to know their capacity for applying statistics to decision making
3. To find out associations between each analysed variable. The impact of data exploitation, Competitive advantage, Management support and Systematic thinking on decision making
4. To validate the methodology to upgrade companies on the proposed scale and to make applied statistics a competitive advantage

15
THE DRAFT OF ONE SCALE
INTRODUCTION
STATE OF THE ART
RESEARCH OBJECTIVES
THE DRAFT OF ONE SCALE
THE METHODOLOGY
CONCLUSIONS

16
SOME BASIC IDEAS OF ONE POSSIBLE SCALE
1. The proposed scale has 5 possible levels
2. At level 1 we find companies that do not use any statistical methods
3. At level 5 we find companies that use applied statistics as a strategic support for their competitive advantage.
4. At levels 2, 3 and 4 we find companies that are improving their use of statistical methods
5. A survey, in depth interviews and on site study cases will be used to validate the scale
HIGHLIGHTS

SOME BASIC IDEAS OF ONE POSSIBLE SCALE
STATISTICAL IGNORANCE.
LOCAL AND INDIVIDUAL
EFFORTS
STATISTICAL ASPIRATIONS
STATISTICAL ENGINEERING
STATISTICS AS COMPETITIVE ADVANTAGE
Decision making process is based mainly on past experience and subjective evidence
To pick up reliable and valid data
Statistics support only specific activities in the company. Those efforts are usually isolated with local impact.
To increase and improve interactions between local applications
The first level of using statistics as Competitive Advantage. Leadership, Systematic Thinking and Data Quality are introduced.
To develop use of 4 key drivers to improve business results
All decisions in the company are made through Statistical analysis
To make sure that statistics is used at Strategic, Tactical and Operative levels.
Mastering the use of statistics,. It provides important support to develop a successful competitive advantage
To obtain the leadership in the market.
1
2
4
3
5
NAME DESCRIPTION TARGET
18
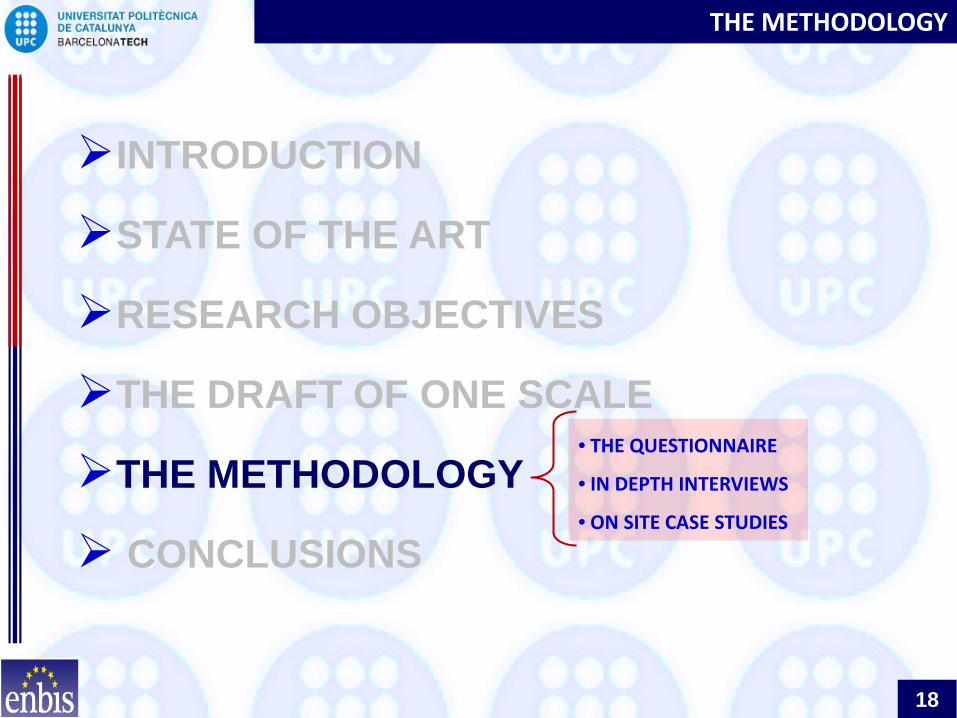
THE METHODOLOGY
INTRODUCTION
STATE OF THE ART
RESEARCH OBJECTIVES
THE DRAFT OF ONE SCALE
THE METHODOLOGY
CONCLUSIONS
• THE QUESTIONNAIRE
• IN DEPTH INTERVIEWS
• ON SITE CASE STUDIES

19
THE METHODOLOGY
THE QUESTIONNAIRE
IN-DEPTH INTERVIEWS
ON-SITE CASES STUDIES
THE METHODOLOGY

20
THE QUESTIONNAIRE
THE QUESTIONNAIRE
IN-DEPTH INTERVIEWS
ON-SITE CASES STUDIES
THE METHODOLOGY

This is the questionnaire s structure There are 7 sections and 48 ITEMS in the questionnaire, as it is shown in the following table:
21
section number of ITEMS
General information about the company 4
Competitive Advantage 3
Data exploitation and usage 5
Management support 5
Systemacic Thinking 5
Statistical Methods inventory 19
Company´s departments 11
Total 48
THE QUESTIONNAIRE
https://www.surveymonkey.com/s/surveyEAGE_english

22
WHO IS IT BEING SENT TO?
1003 questionnaires were sent in the last 2 month
82 questionnaires were received by August 31
Questionnaires still need to be sent to 5208 companies
Target Group size Number of responses
Response rate
Investigar en España
1,264 6 0.05%
Estadística para todos
425 6 1.4%
Investigación y Estadística 237 5 2.1%
250 27 11%
1,003 38 3.8%
23
IS OUR QUESTIONNAIRE VALID AND RELIABLE?
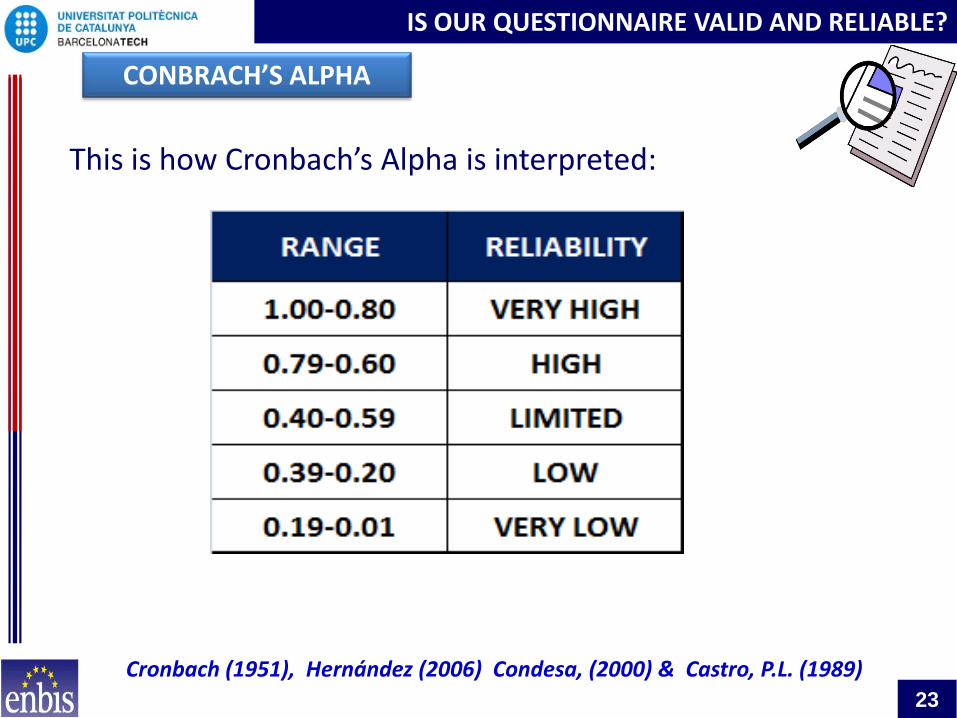
CONBRACH’S ALPHA
This is how Cronbach’s Alpha is interpreted:
Cronbach (1951), Hernández (2006) Condesa, (2000) & Castro, P.L. (1989)
24
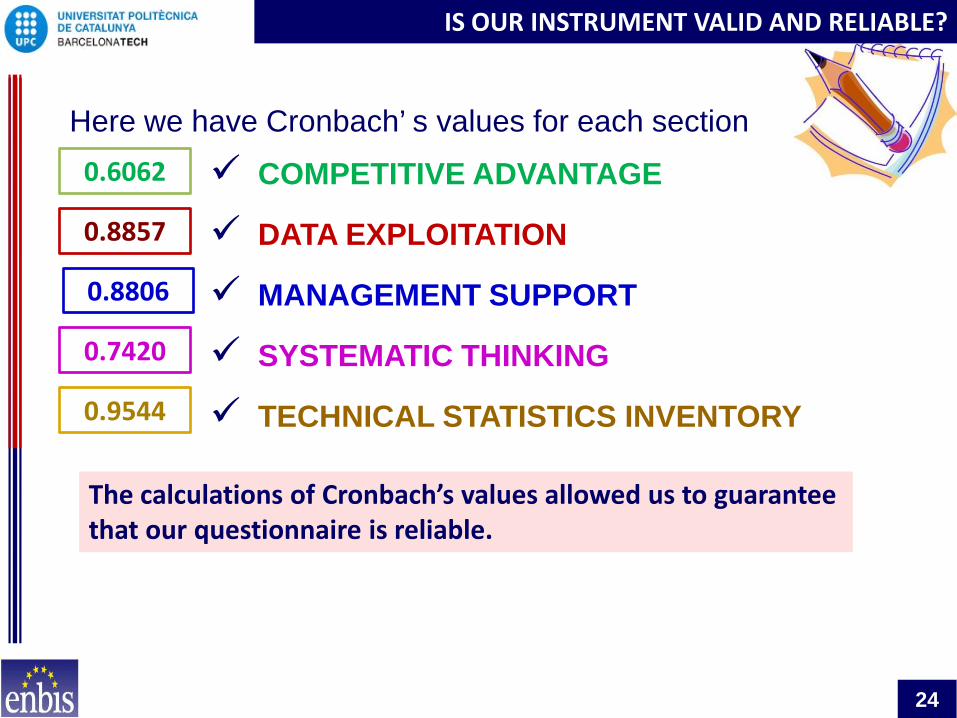
Here we have Cronbach’ s values for each section
COMPETITIVE ADVANTAGE
DATA EXPLOITATION
MANAGEMENT SUPPORT
SYSTEMATIC THINKING
TECHNICAL STATISTICS INVENTORY
IS OUR INSTRUMENT VALID AND RELIABLE?
0.6062
0.8857
0.8806
0.7420
0.9544
The calculations of Cronbach’s values allowed us to guarantee that our questionnaire is reliable.

25
IN-DEPTH INTERVIEWS
THE QUESTIONNAIRE
IN-DEPTH INTERVIEWS
ON-SITE CASES STUDIES
THE METHODOLOGY

26
IN-DEPTH INTERVIEWS
WHY DO WE DO DEPTH
INTERVIEWS?
To include in the research, issues that are neither evident in the literature nor the questionnaire.
To validate or refute the findings of the questionnaire
To find perception from Business s owners, Managers and Academics
To find aspects of Applied Statistics which are undetectable with the questionnaire
The Multicriteria Decisions Analysis used by Nutt, King y Lawrence (2010) is also taken as reference for carrying out the interviews
The concepts developed by French , Maule y & Papamichail (2009) will be used for designing and preparing the interview

27
IN-DEPTH INTERVIEWS
In the following table shows how interviews are classified according to the type of stakeholder
The total number of interviews is not definitive and it will be altered according the homogeneity of the responses obtained

28
ON-SITE CASES STUDIES
THE QUESTIONNAIRE
IN-DEPTH INTERVIEWS
ON-SITE CASES STUDIES
THE METHODOLOGY

29
ON-SITE CASES STUDIES
The survey and interviews will be the input for the methodology that can be implemented in three study cases.
WHY DO WE DO ON-SITE
CASES STUDIES?
To implement the key drivers for the increase in the use of applied statistics
To validate or refute the findings obtained with questionnaires and interviews
To build a practical and helpful methodology accessible to any Consultant, Practitioner or Academic
To replicate and to reproduce the key elements identified

30
ON-SITE CASES STUDIES FLOW CHART
This is the flow chart that will be used for carrying out the on-site cases studies
INITIAL ASSESSMENT
One level at the scale
Level 5
Level 4
Level 3
Level 2
Level 1
Actions to upgrade
from L1 to L2
Actions to upgrade
from L2 to L3
Actions to upgrade
from L3 to L4
Actions to upgrade
from L4 to L5
To maintain and to
improve
• Management support
• Systematic Thinking
• Data exploitation and usage
• Competitive advantage
• Statistical Methods inventory
FINAL ASSESSMENT
Is it improved?
NO
YES
• To keep records • To replicate • To standardize
• To review •To identify • To point out

31
THE CONCLUSIONS
INTRODUCTION
STATE OF THE ART
RESEARCH OBJECTIVES
THE DRAFT OF ONE SCALE
THE METHODOLOGY
CONCLUSIONS
32
FIRST ROUND CONCLUSIONS
THERE IS EVIDENCE TO DEMONSTRATE THE RISING OF THE USE OF APPLIED STATISTICS IN BUSINESS IN THE LAST 20 YEARS
THIS REPRESENTS A UNIQUE OPPORTUNITY FOR COMPANIES
WE ARE WORKING WITH A QUESTIONNAIRE THAT IS VALID AND RELIABLE
THIS METHODOLOGY WILL BE A UNIQUE TOOL FOR THE INCREASE IN THE USE OF APPLIED STATISTICS IN BUSINESS MANAGEMENT

33
THE END OF PRESENTATION
THANKS!

34
RADAR CHART
S. Thinking
M. Support
Statistical Methods Use of Data
C. Advantage
S. Thinking
M. Support
Statistical Methods Use of data
C. Advantage
CHECKING AND TESTING

35
CHECKING AND TESTING

36
CHECKING AND TESTING
37
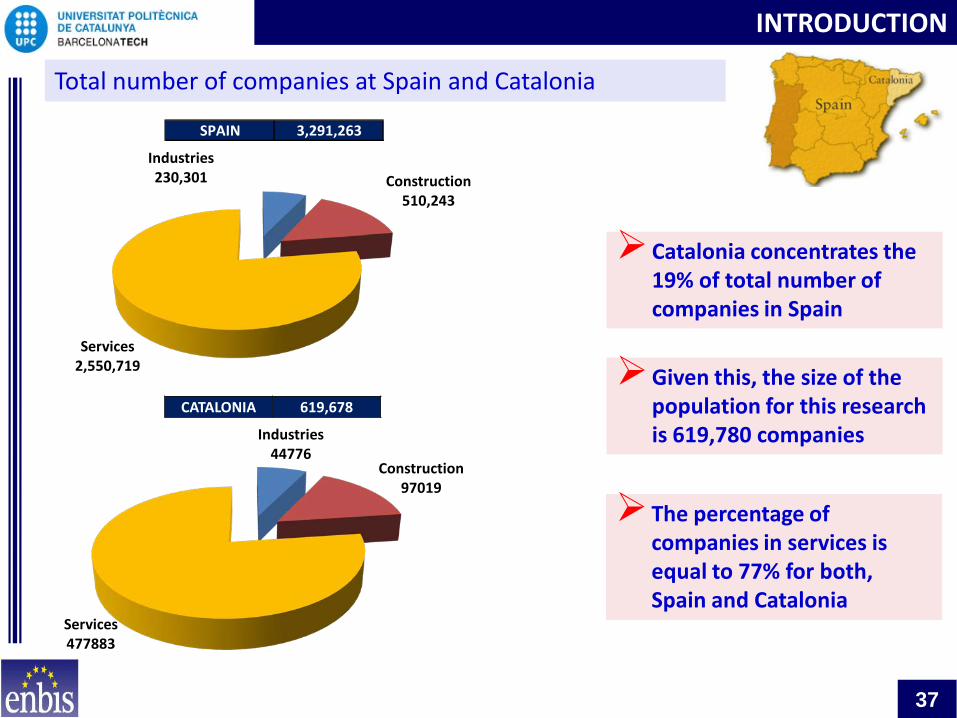
INTRODUCTION
Industries 230,301 Construction
510,243
Services 2,550,719
Total number of companies at Spain and Catalonia
Industries 44776
Construction 97019
Services 477883
Catalonia concentrates the 19% of total number of companies in Spain
Given this, the size of the population for this research is 619,780 companies
The percentage of companies in services is equal to 77% for both, Spain and Catalonia
SPAIN 3,291,263
CATALONIA 619,678
38
IS OUR QUESTIONNAIRE VALID AND RELIABLE?
Reliability is related to the precision and stability of the questionnaire
Validity is related with the Questionnaire’s capacity to measure all the variables and issues for which it was created
The Conbrach’s Alpha is calculated and interpreted to measure reliability
In order to guarantee the validity, an operational definition of variables is used
HIGHLIGHTS
Cronbach (1951), Hernández (2006) Condesa, (2000) & Castro, P.L. (1989).

......
......
......
......
......
......
...... 39
HOW CRONBACH’S ALPHA IS CALCULATED?

40
CONBRACH’S ALPHA
Data Exploitation
HOW CRONBACH’S ALPHA IS CALCULATED?
1. Reliability for DATA EXPLOITATION section is VERY HIGH .
2. Additionally all the correlations between ITEMS have positive values

41
IS OUR QUESTIONNAIRE VALID AND RELIABLE?
CONBRACH’S ALPHA 1. The mathematic definition of Cronbach s alpha is:
2. This is how Cronbach’s Alpha is interpreted:
3. Additionally one Cronbach’s Alpha was calculated for each variable that is intended to measure