enea 2016 - financial results (english)
TRANSCRIPT

We are increasing the energy security in Poland and reliability of energy supplies to our Customers
31 March 2017
Q4 2016, 2016

2
We are building an optimum model of operation which strengthens the Group’s position on the market
Financial data2016
Operating data2016
Key investments2016
Strategyadoption and
implementation
• PLN 11 256 mln net sales revenue
• PLN 1 119 mln EBIT
• PLN 2 328 mln EBITDA
• PLN 849 mln net profit
• PLN 2 742 mln CAPEX
• 1.9 net debt/EBITDA
• PLN 9 038 thou. tonnescoal net production
• PLN 13 567 GWh electricity generation
• 18 741 GWh sales of distribution services to end users
• 17 989 GWh sales of electricity and gas to retail customers
• Ostrów deposit completion of drilling works by exploratory bores
• 95% progressin the construction of a new unit in Kozienice Power Plant 1)
• Modernisationand investments in the environmental protection in Kozienice Power Plant
• Modernisation, extensionand automation of grid assets
• Acquisition of PołaniecPower Plant
• New development strategy of the area of mining in Enea Group
• Feasibility study of the unit in clean coal technology (IGCC)
• New unit - Ostrołęka C
• Building an ecosystem for innovation
Stable development of an innovative commodity and energy concern1) As at March 2017

3
Agenda
Coal, energy markets, key operational and sales data
Enea CG's financial results in Q4 2016 and 2016
Implementation of Enea CG’s development strategy
LW Bogdanka CG's financial results in Q4 2016 and 2016
Key initiatives in 2016

8,0
8,5
9,0
9,5
10,0
10,5
I II III IV V VI VII VIII IX X XI XII I II III IV V VI VII VIII IX X XI XII
2015 2016
PLN
/GJ
energetyka zawodowa - miały Indeks PSCMI - miały
Average price in 2016of coal dust for
commercial power industrydropped by ca. 10.3% yoy
Situation on world coal markets affects the domestic market with some delay
Coal, energy market, key operating and sales data
Coal dust price
4
Average prices in 2016:• Amsterdam - Rotterdam
- Antwerp: 60.06 USD/t• Richards Bay: 64.44 USD/t• Newcastle: 66.11 USD/t• New Orleans: 55.20 USD/t
35
45
55
65
75
85
95
105
I II III IV V VI VII VIII IX X XI XII I II III IV V VI VII VIII IX X XI XII
2015 2016
USD
/t
Monthly indices of coal prices
Richards Bay (RPA) Newcastle (Australia) ARA (Europa Zach.) Nowy Orlean (USA)
Commercial power industry – fuel dusts Index PSCMI – fuel dusts
(West Europe)

130
140
150
160
170
180
190
200
210
I II III IV V VI VII VIII IX X XI XII I II III IV VI VI VII VIII IX X XI XII
2015 2016
PLN
/MW
h
BASE Y-17 BASE Y-16 SPOT
Coal, energy market, key operating and sales data
The price of energy on the spot market grew slightly in 2016
5
BASE Y and SPOT prices
• Growth in the average price of baseload on SPOT market in 2016 by 1.4% yoy to 159.20 PLN/MWh • The average energy price on forward market - baseload for 2017 dropped by 4.3% yoy to 159.31 PLN/MWh in 2016
20
40
60
80
100
120
140
160
180
200
I II III IV V VI VII VIII IX X XI XII I II III IV V VI VII VIII IX X XI XII
2015 2016
PLN
/MW
h
Indeks sesyjny Indeks OTC
Coal, energy market, key operating and sales data
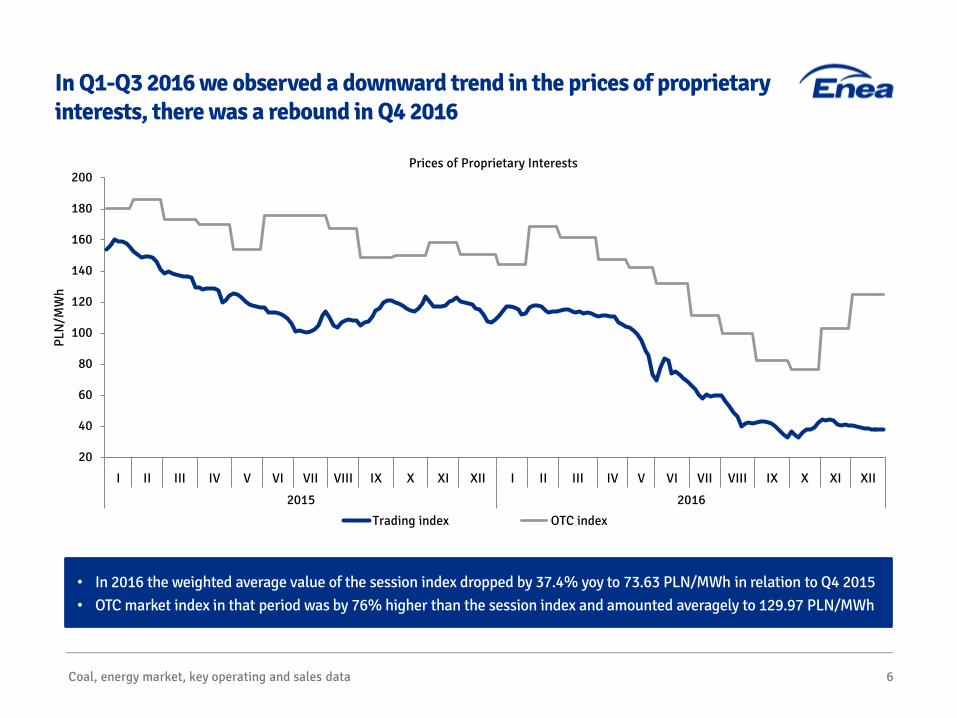
In Q1-Q3 2016 we observed a downward trend in the prices of proprietary interests, there was a rebound in Q4 2016
Prices of Proprietary Interests
• In 2016 the weighted average value of the session index dropped by 37.4% yoy to 73.63 PLN/MWh in relation to Q4 2015 • OTC market index in that period was by 76% higher than the session index and amounted averagely to 129.97 PLN/MWh
6
Trading index OTC index
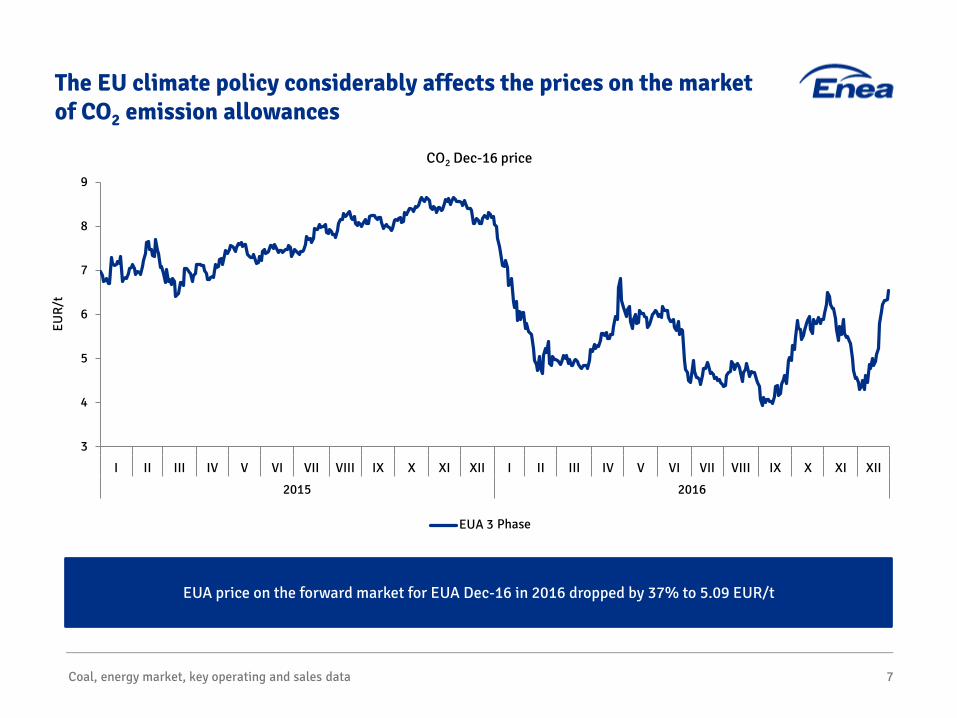
EUA price on the forward market for EUA Dec-16 in 2016 dropped by 37% to 5.09 EUR/t
Coal, energy market, key operating and sales data 7
3
4
5
6
7
8
9
I II III IV V VI VII VIII IX X XI XII I II III IV V VI VII VIII IX X XI XII
2015 2016
EUR/
t
CO2 Dec-16 price
EUA 3 Faza
The EU climate policy considerably affects the prices on the market of CO2 emission allowances
Phase

Coal, energy market, key operating and sales data 8
We reported good operating ...
Enea CG’s operational data Q4 2015 Q4 2016 Change 2015 2016 Change
Generation of electricity [GWh] 3 444 3 401 -1.2% 13 142 13 567 3.2%
from conventional sources 3 228 3 255 0.8% 12 293 13 028 6.0%
from renewable energy sources 216 146 -32.4% 849 539 -36.5%
Gross generation of heat [TJ] 1 616 1 804 11.6% 5 217 5 299 1.6%
Sales of distribution services to end users [GWh] 4 545 4 817 6.0% 17 936 18 741 4.5%
Sales of electricity and gasto retail customers [GWh] 4 542 4 693 3.3% 17 038 17 989 5.6%

3 976 17 989
Przychody ze sprzedaży Wolumen sprzedaży
4 07617 038
0
4 000
8 000
12 000
16 000
20 000
0
900
1 800
2 700
3 600
4 500
Przychody ze sprzedaży Wolumen sprzedaży
Coal, energy market, key operating and sales data 9
… and sales results
2015
2016
Electricity
1 311
16 678
16 192
846
132
3 944
3 882
94
2.5% GWhPLN mln 5.6%
2015
2016
Gas
Sales revenue Sales volume

Coal, energy market, key operating and sales data 10
In 2016 LW Bogdanka CG sold by almost 7% more coal than in the previous year
LW Bogdanka CG’s operatingresults [‘000 tonnes] Q4 2015 Q4 2016 Change 2015 2016 Change
Gross output 3 994 3 638 -8.9% 12 940 14 389 11.2%
Net production 2 527 2 356 -6.8% 8 457 9 038 6.9%
Yield 63.3% 64.8% 1.5 p.p. 65.4% 62.8% -2.6 p.p.
Sale of coal 2 554 2 402 -6.0% 8 562 9 141 6.8%
Closing stocks 228 125 -45.2% 228 125 -45.2%

Agenda
11
Coal, energy markets, key operational and sales data
Enea CG's financial results in Q4 2016 and 2016
Implementation of Enea CG’s development strategy
LW Bogdanka CG's financial results in Q4 2016 and 2016
Key initiatives in 2016

Wyniki finansowe GK Enea w IVQ 2016 i 2016 12
In 2016 Enea Group generated solid financial results
Enea CG’s financial data [PLN mln] Q4 2015 Q4 2016 Change 2015 2016 Change
Net sales revenue 2 698.1 2 951.7 9.4% 9 848.4 11 255.7 14.3%
EBIT -1 209.1 170.2 - -162.1 1 119.3 -
EBIT excluding one-offs 1) 292.5 401.6 37.3% 1 046.3 1 400.1 33.8%
EBITDA 524.6 499.2 -4.8% 2 129.9 2 327.8 9.3%
EBITDA excluding one-offs 2) 524.6 681.9 30.0% 1 836.7 2 510.4 36.7%
Net result -1 236.7 128.3 - -398.9 848.9 -
Net debt / EBITDA 3) 1.8 1.9 5.6% 1.8 1.9 5.6%
1) Impact on EBIT: tangible assets impairment write-down in Q4 2015 PLN -1,501.6 mln, in Q4 2016 PLN -48.8 mln, in 2016 PLN -98.2 mln; settlement of LTPPA in Q3 2015 PLN +293.1 mln; provision related tothe estimation of the value of shares in Eco-Power sp. z o.o. amounting to PLN 129.0 mln in Q4 2016; provisions for the new Programme of Voluntary Redundancy totalling to PLN 53.6 mln in Q4 2016
2) Impact on EBITDA: settlement of LTPPA in Q3 2015 PLN +293.1 mln; provision related to the estimation of the value of shares in Eco-Power sp. z o.o. amounting to PLN 129.0 mln in Q4 2016; provisions forthe new Programme of Voluntary Redundancy totalling to PLN 53.6 mln in Q4 2016
3) Debt = long-term and short-term: credits, loans and debt securities + financial lease liabilities
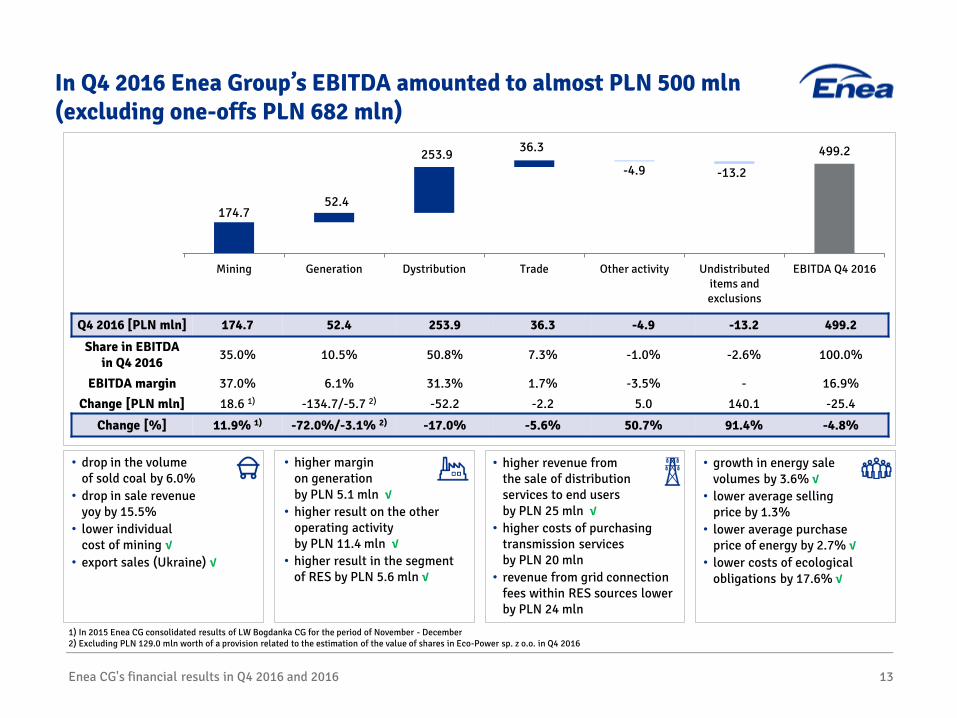
In Q4 2016 Enea Group’s EBITDA amounted to almost PLN 500 mln(excluding one-offs PLN 682 mln)
Enea CG's financial results in Q4 2016 and 2016 13
Q4 2016 [PLN mln] 174.7 52.4 253.9 36.3 -4.9 -13.2 499.2
Share in EBITDAin Q4 2016 35.0% 10.5% 50.8% 7.3% -1.0% -2.6% 100.0%
EBITDA margin 37.0% 6.1% 31.3% 1.7% -3.5% - 16.9%Change [PLN mln] 18.6 1) -134.7/-5.7 2) -52.2 -2.2 5.0 140.1 -25.4
Change [%] 11.9% 1) -72.0%/-3.1% 2) -17.0% -5.6% 50.7% 91.4% -4.8%
• drop in the volume of sold coal by 6.0%
• drop in sale revenue yoy by 15.5%
• lower individual cost of mining √
• export sales (Ukraine) √
• higher margin on generation by PLN 5.1 mln √
• higher result on the other operating activity by PLN 11.4 mln √
• higher result in the segment of RES by PLN 5.6 mln √
• higher revenue from the sale of distribution services to end users by PLN 25 mln √
• higher costs of purchasing transmission services by PLN 20 mln
• revenue from grid connection fees within RES sources lowerby PLN 24 mln
• growth in energy sale volumes by 3.6% √
• lower average selling price by 1.3%
• lower average purchase price of energy by 2.7% √
• lower costs of ecological obligations by 17.6% √
499.2
174.752.4
253.9 36.3
-4.9 -13.2
Mining Generation Dystribution Trade Other activity Undistributeditems andexclusions
EBITDA Q4 2016
1) In 2015 Enea CG consolidated results of LW Bogdanka CG for the period of November - December2) Excluding PLN 129.0 mln worth of a provision related to the estimation of the value of shares in Eco-Power sp. z o.o. in Q4 2016

2 327.8
611.8
517.5
1 111.3 154.0 27.5
-94.3
Mining Generation Dystribution Trade Other activity Undistributeditems andexclusions
EBITDA 2016
In 2016 almost 50% of EBITDA was generated by the area of distribution
Enea CG's financial results in Q4 2016 and 2016 14
2016 [PLN mln] 611.8 517.5 1 111.3 154.0 27.5 -94.3 2 327.8
Share in EBITDAin 2016 26.3% 22.2% 47.7% 6.6% 1.2% -4.0% 100.0%
EBITDA margin 34.3% 15.6% 36.0% 2.1% 5.2% - 20.7%
Change [PLN mln] 455.7 1) -377.9/44.2 2) -27.6 27.9 8.3 111.6 198.0
Change [%] 291.9% 1) -42.2%/7.3% 2) -2.4% 22.1% 42.9% 54.2% 9.3%
• growth in sales of coal by 6.8% √
• growth in coal production by 6.9% √
• lower individual cost of mining √
• export sales (Ukraine) √
• higher margin on generation by PLN 71.8 mln √
• higher result in the segmentof heat by PLN 24.2 mln √
• settlement of PLN 293.1 mln LTPPA in Q3 2015 (one-off)
• higher fixed costs by PLN 40 mln – higher provisions for employee benefits by PLN 32.8 mln
• higher revenue from the sale of distribution services to end users by PLN 63 mln √
• higher costs of purchasing transmission services by PLN 49 mln
• revenue from grid connection fees within RES sources lowerby PLN 31 mln
• growth in energy sale volumes by 3.0% √
• lower average energy selling price by 1.4%
• lower average purchase price of energy by 1.7% √
• higher costs of ecological obligations by 2.7%
1) In 2015 Enea CG consolidated results of LW Bogdanka CG for the period of November - December2) Excluding PLN 293.1 mln revenue from LTPPA in Q3 2015 and PLN 129.0 mln provision related to the estimation of the value of shares in Eco-Power sp. z o.o. Q4 2016
Agenda
15
Coal, energy markets, key operational and sales data
Enea CG's financial results in Q4 2016 and 2016
Implementation of Enea CG’s development strategy
LW Bogdanka CG's financial results in Q4 2016 and 2016
Key initiatives in 2016

LW Bogdanka's financial results in Q4 2016 and 2016 16
Stable financial results despite low coal prices
LW Bogdanka CG's financial results [PLN mln] Q4 2015 Q4 2016 Change 2015 2016 Change
Net sales revenue 558.4 471.9 -15.5% 1 885.4 1 786.3 -5.3%
EBIT -500.8 82.4 - -326.2 237.0 -
EBITDA 1) 228.2 174.3 -23.6% 686.3 606.5 -11.6%
Net result -411.8 61.8 - -279.6 182.0 -
CAPEX 68.5 95.2 39.0% 300.7 307.7 2) 2.3%
Net debt / EBITDA 3) 0.67 0.14 -79.1% 0.67 0.14 -79.1%
1) Explanation of EBITDA presentation difference of LW Bogdanka CG and area of mining in Enea CG in Q4 2016 and 2016 is given in attachments 1-22) The result excludes PLN 142 thou. from LW Bogdanka’s subsidiaries not included in the investment plan3) Debt = long-term liabilities due to bond issue + long-term credits and loans + short-term credits and loans

Lower EBITDA in Q4 2016 was determined by a drop in sales and coal price lower by 8.0% yoy
LW Bogdanka's financial results in Q4 2016 and 2016 17
• drop of EBITDA by PLN 53.9 mln (-23.6%)• drop in the volume of sold coal by 6.0% • drop in the price of sold coal by 8.0%• other revenue in Q4 2016 on the level of the same period of 2015• the unit cost of sold products, goods excluding amortisation did not change considerably
(drop in nominal costs by 5.9% with volume of sold coal lower by 6.0%) • higher selling costs - customs and logistic handling costs of coal sold to Ukraine• higher other operating revenue (calculated fines) √• lower other costs and net losses √
228.2
-0.3
174.3-12.6
-43.9 -0.2 -4.8
7.9
EBITDA Q4 2015 Volumeof coal sold
Coal price Other revenue Unit cost of productsand materials sold
without depreciation
Sales andadministration
costs
Result on the otheroperating activity
EBITDA Q4 2016
Q4 2016 [PLN mln] 200.4 503.1 6.1 290.0 36.1 3.8 174.3
Q4 2015 [PLN mln] 213.0 547.0 6.4 289.8 31.3 -4.1 228.2
Change [PLN mln] -12.6 -43.9 -0.3 0.2 4.8 7.9 -53.9
Change [%] -5.9% -8.0% -4.7% 0.1% 15.3% - -23.6%

Lower unit cost and growth in the volume in 50% compensateddecreasing coal prices in 2016
LW Bogdanka's financial results in Q4 2016 and 2016 18
• drop of EBITDA by PLN 79.8 mln (-11.6%)• growth in sale volumes of coal by 6.8% √• drop in the price of sold coal by 10.0%• other revenue in 2016 on the level of 2015• drop in the unit cost of sold products, goods without amortisation
(growth in nominal costs by 2.7% with higher volume of sold coal by 6.8%) å lower selling and administrative costs (derecognition of management options costs for 2016 and previous years,
higher selling costs - customs and logistic handling costs of coal sold to Ukraine) √
• positive result on the other operating activity (release of the provision for claims) √
686.3
-186.4 -0.3
606.544.1
40.2 4.7 17.9
EBITDA 2015 Volumeof coal sold
Coal price Other revenue Unit cost of productsand materials sold
without depreciation
Sales andadministration
costs
Result on the otheroperating activity
EBITDA 2016
2016 [PLN mln] 696.8 1 681.2 22.6 1 028.6 126.5 13.5 606.5
2015 [PLN mln] 652.7 1 867.6 22.9 1 068.8 131.2 -4.4 686.3
Change [PLN mln] 44.1 -186.4 -0.3 -40.2 -4.7 17.9 -79.8
Change [%] 6.8% -10.0% -1.3% -3.8% -3.6% - -11.6%

19
Agenda
Coal, energy markets, key operational and sales data
Enea CG's financial results in Q4 2016 and 2016
Implementation of Enea CG’s development strategy
LW Bogdanka CG's financial results in Q4 2016 and 2016
Key initiatives in 2016

Building optimum synergies we are increasing the Group’s effectiveness
Key initiatives in 2016 20
• Execution of 23.8 km of new excavations
• Completion of drilling works by exploratory bores in Ostrów area and acquisition of the right to utilise the geological information of that deposit
• Completion of the installation and all objects of the central air-conditioning of Bogdanka field
• Optimisation of direct production costs and capital expenditures
• Continuation of the construction of flue gas desulphurisation plant on K7 and K8 boilers
• Installation of the catalytic denitrogenation of flue gases (SCR):
• units No. 1-2, 5-7 -commissioning
• units No. 4 and 8 - continuation of the construction
• units No. 9-10 - execution of an agreement witha contractor
• Construction of industrial waste and rainwater treatment
• Considerable enhancement of planned and unplanned interruption indices in 2016:• SAIDI - by 44% yoy• SAIFI - by 30% yoy
• Improvement of connection processes
• Completion of a series of investments implemented on high and medium voltage,e.g. 7 transformer/switchingstations
• Development of information tools supporting the grid management
Sales:
• launching the Customer loyalty programme
• new products for households and business Customers
• completion of a migration process of Customer data to the central billing system
Wholesale trading:• development and
implementation of a model of long-term price paths for products listed on wholesale markets
Key initiatives 2016
Mining Generation Distribution Trade

• Assembly of the boiler house's main structure
• Assembly of start-up boilers
• Connecting 110 kV voltage
• Assembly of the pressure system - water test of the boiler
• Assembly of electrostatic precipitator's supporting structure
• Reinforced concrete structure of gypsum store
• Assembly of stacker-reclaimers
• Assembly of coal pulvilizers
Key initiatives in 2016 21
The key investment project will be commissioned in 2017
Unit No. 11 - works realised in 2016
95%
progress in the new unit’s construction 1)
1) As at March 2017

We are consistently investing in Enea Group’s development
Key initiatives in 2016 22
Generation
Distribution
Mining
Support and other
PLN 141 mln on investments relating toenvironmental protection
in 2016
51%
34%
11%
4%
Capital expenditures [PLN mln] 2015 2016 Change 2017 Plan
Generation 1 954.9 1 390.2 -28.9% 1 168.9
Distribution 925.1 920.4 -0.5% 970.5
Mining 51.1 1) 307.7 2) 502.2% 385.6
Support and other 120.4 123.7 2.7% 172.6
TOTAL 3 051.5 2 742.0 -10.1% 2 697.6
Capital expenditures in 2016
1) Expenditure incurred in November-December 2015 after incorporation of LW Bogdanka under Enea CG within the area of mining2) The result excludes PLN 142 thou. from LW Bogdanka’s subsidiaries not included in the investment plan

23
Agenda
Coal, energy markets, key operational and sales data
Enea CG's financial results in Q4 2016 and 2016
Implementation of Enea CG’s development strategy
LW Bogdanka CG's financial results in Q4 2016 and 2016
Key initiatives in 2016
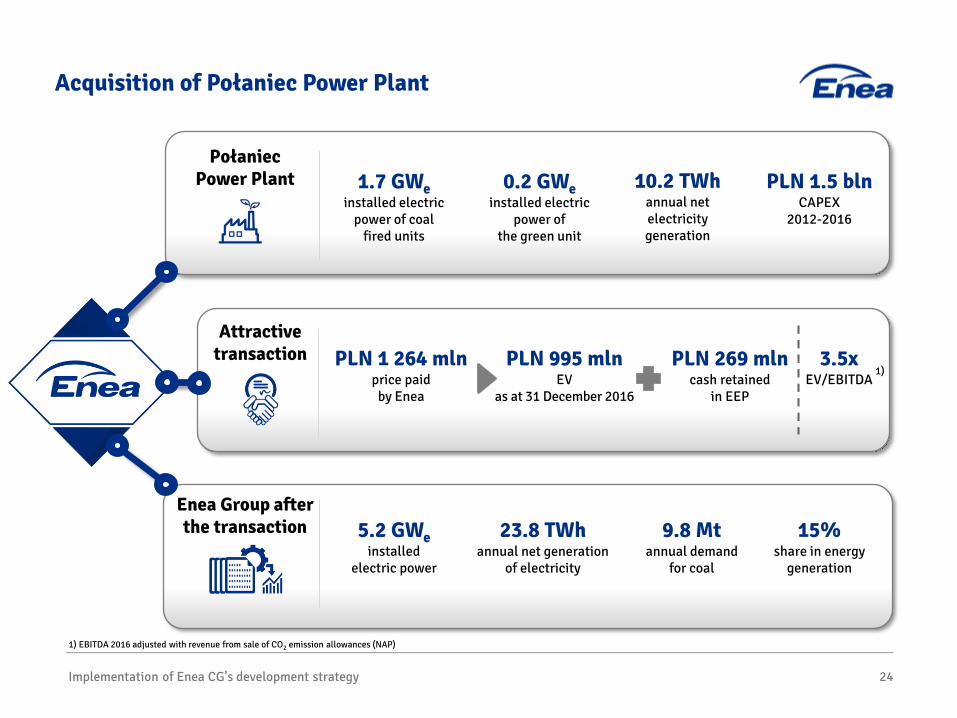
Połaniec Power Plant 1.7 GWe
installed electric power of coal
fired units
0.2 GWeinstalled electric
power of the green unit
PLN 1.5 blnCAPEX
2012-2016
10.2 TWhannual net electricity generation
Implementation of Enea CG’s development strategy 24
Acquisition of Połaniec Power Plant
Enea Group after the transaction
PLN 1 264 mln price paid
by Enea
PLN 995 mln EV
as at 31 December 2016
PLN 269 mln cash retained
in EEP
3.5xEV/EBITDA
1) EBITDA 2016 adjusted with revenue from sale of CO2 emission allowances (NAP)
5.2 GWeinstalled
electric power
15%share in energy
generation
9.8 Mtannual demand
for coal
Attractive transaction
23.8 TWhannual net generation
of electricity
1)
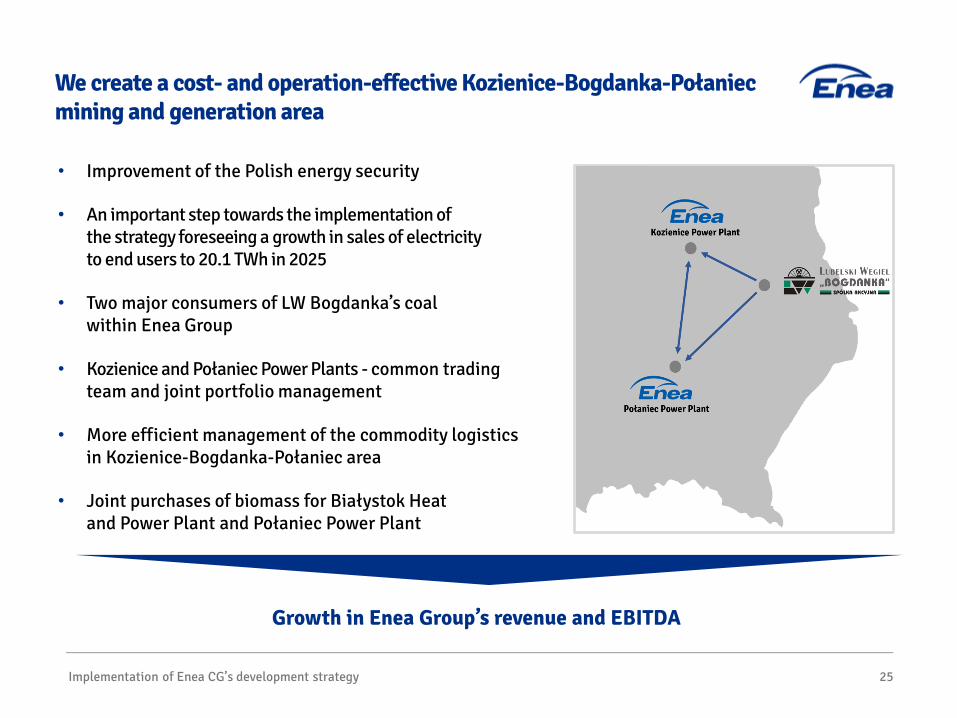
We create a cost- and operation-effective Kozienice-Bogdanka-Połaniecmining and generation area
25
Joint energy purchase and sale
Logistics
Implementation of Enea CG’s development strategy
• Improvement of the Polish energy security
• An important step towards the implementation of the strategy foreseeing a growth in sales of electricity to end users to 20.1 TWh in 2025
• Two major consumers of LW Bogdanka’s coal within Enea Group
• Kozienice and Połaniec Power Plants - common trading team and joint portfolio management
• More efficient management of the commodity logistics in Kozienice-Bogdanka-Połaniec area
• Joint purchases of biomass for Białystok Heat and Power Plant and Połaniec Power Plant
Growth in Enea Group’s revenue and EBITDA

Implementation of Enea CG’s development strategy 26
Enea Group develops dynamically utilising the occurring market opportunities
Implementation of Enea CG’s development
strategy until 2030
Joint investment with Energaby the construction of Ostrołęka C
• Participation in the process of modernising the Polish power sector using Polish coal as fuel
• Increasing the share in the generation market • Asset management optimisation within the Group
New development strategy of the area of mining
• Development of the base of commodities and extending mines’ lifetimes
• Further improvement of the energy generation efficiency based on LW Bogdanka’s commodity
• Growth in the coal consumption index for Enea CG’s own needs from 43% to 75% in 2025
A modern unit in clean coal technology
• A new market for coal - increasing the Polish economy's energy independence
• Feasibility study of the construction of the power unit with coal gasificationinstallation (IGCC)
• 26 ha plot (Łęcza/Bogdanka) obtained as a result of EEP acquisition
Coal supplies diversification• PGG and KHW - current suppliers of coal to the Group,
accounting for ca. 7% and ca. 12% of supplies in 2016• Estimated growth in own conventional capacities to
the level of 5.8 GW - increasing the demand for bituminous coal from the current level of ca. 5.5 mln tonnes annually to ca. 10.9 mln tonnes annually in 2025
• Business-like approach to the transaction as regards the economic effects and diversification of coal supplies to the Group
Electromobililty• Electromobility Development Plan in Poland - impact on the future shape of the electricity market• Establishment of a dedicated company ElectroMobility Poland• Joining the works related to the increase in the number of electrical buses in cities and communes within the existing
systems of mass communication

We are increasing the energy security in Poland and reliability of energy supplies to our CustomersQ4 2016, 2016

Attachments

174.3174.7 174.7
-0.10.00.5
170
171
172
173
174
175
176
EBITDA LWB CGstatutory data
amortisation/depreciation
recognition difference
other presentationdifference
EBITDA LWB CGdata in Enea CG's
report
adjustments resultingfrom the valuation to
the fair value ofassets and liabilities
as at the date ofshares acquisition by
Enea SA
EBITDAArea ofMining
Enea CG
PLN mln
Attachments 29
Att. 1 - Explanation of EBITDA presentation difference in LW Bogdanka CG and area of mining in Enea CG in Q4 2016
Q4 2016

606.5
608.6
611.8
1.11.0
3.2
600
602
604
606
608
610
612
614
EBITDA LWB CGstatutory data
amortisation/depreciation
recognition difference
other presentationdifference
EBITDA LWB CGdata in Enea CG's
report
adjustments resultingfrom the valuation to
the fair value ofassets and liabilities
as at the date ofshares acquisition by
Enea SA
EBITDAArea ofMining
Enea CG
PLN mln
Attachments 30
Att. 2 - Explanation of EBITDA presentation difference in LW Bogdanka CG and area of mining in Enea CG in 2016
2016

Att. 3 – We are modernising our generation assets and adjusting them to rigorous environmental standards
Attachments 31
Investment CAPEX 2016 [PLN mln]
Total CAPEX [PLN mln]
Progress of works at the end
of 2016 [%]
Anticipated date of completion
Construction of a 1,075 MW power unit No. 11 1 093 5 744.6 94% 2017
IOS IV flue gas desulphurisation plant 9.1 288.3 99% 2017
Modernisation of unit No. 4 30.6 31.8 98% 2017
Modernisation of unit No. 5 74.8 87.9 100% 2016
Construction of industrial waste and rainwater treatment 7.3 29.4 99% 2017
Installation of flue gases denitrification - SCR for units No. 1 and 2 12.5 97.9 99% 2016
Modernisation of unit No. 9 as a part of 2 x 500 MW units modernisation programme 0 90.0 1% 2017
Modernisation of cooling water intake - stabilising checkdam on the Vistula River 0.6 33.0 2% 2019
SCR installation and modernisation of electrostatic recipitatorsfor units No. 9 and 10 as part of the 2 x 500 MW units modernisation programme
6.1 314.2 1% 2019
Installation of flue gases denitrification - SCR for units No. 4-8 62.1 203.7 86% 2017
Installation of flue gases denitrification - SNCR for unit No. 3 0 42.6 1% 2017
Construction of flue gas desulphurisation plant on K7 and K8 boilers 34.0 105.5 55% 2017
Modernisation of unit No. 10 as part of 2 x 500 MW units modernisation programme 0 88.1 1% 2018

Attachments
Att. 4 – Despite higher first contribution margin EBITDA of the area of trade in Q4 2016 reported a slight drop yoy
-10.9
12.9
-4.238.5
36.3
0
10
20
30
40
50
60
EBITDA Q4 2015 First contribution margin Internal costs Other factors EBITDA Q4 2016
Trade – EBITDA Q4 2016 bridge[PLN mln]
32

Attachments
Att. 5 – Higher first contribution margin, lower provisions for litigation and latent claims and lower receivables written-off supported EBITDA of the area of trade in 2016
24.119.0
-15.2
126.1
154.0
0
20
40
60
80
100
120
140
160
180
EBITDA 2015 First contribution margin Internal costs Other factors EBITDA 2016
Trade – EBITDA 2016 bridge[PLN mln]
33

Attachments
Att. 6 – In Q4 2016 EBITDA of the area of distribution was under the pressure
-9.8-11.3 -9.8
-21.2
306.0
253.9
0
100
200
300
400
EBITDA Q4 2015 Margin of licencedactivity
Non-licenced activity Operating costs Other operatingactivity
EBITDA Q4 2016
Distribution – EBITDA Q4 2016 bridge[PLN mln]
34

Attachments
Att. 7 – In 2016 the drop in EBITDA of the area of distribution was in the major part affected by lower revenue from non-licensed operations yoy
-1.3 -0.8
5.1
-30.6
1 138.9 1 111.3
0
200
400
600
800
1 000
1 200
1 400
EBITDA 2015 Margin of licencedactivity
Non-licenced activity Operating costs Other operatingactivity
EBITDA 2016
Distribution – EBITDA 2016 bridge [PLN mln]
35

Attachments
Att. 8 – Excluding the provision related to the estimation of the value of shares in Eco-Power sp. z o.o. (one-off) the result of the area of generation reported just a slight drop in Q4 2016 by 3.1% yoy
-8.8 -2.5
52.4
5.6
-129.0
181.4
0
40
80
120
160
200
EBITDA Q4 2015 Segment ofSystem Power
Plants
Segmentof Heat
Segmentof RES
Provisionrelated to
the estimation ofthe value of sharesin Eco-Power sp. z
o.o.
EBITDA Q4 2016 EBITDA Q4 2016excl. provision
Generation – EBITDA Q4 2016 bridge[PLN mln]
36
187.1
Provision related to the estimation
of the value of shares in
Eco-Power sp. z o.o.
Attachments
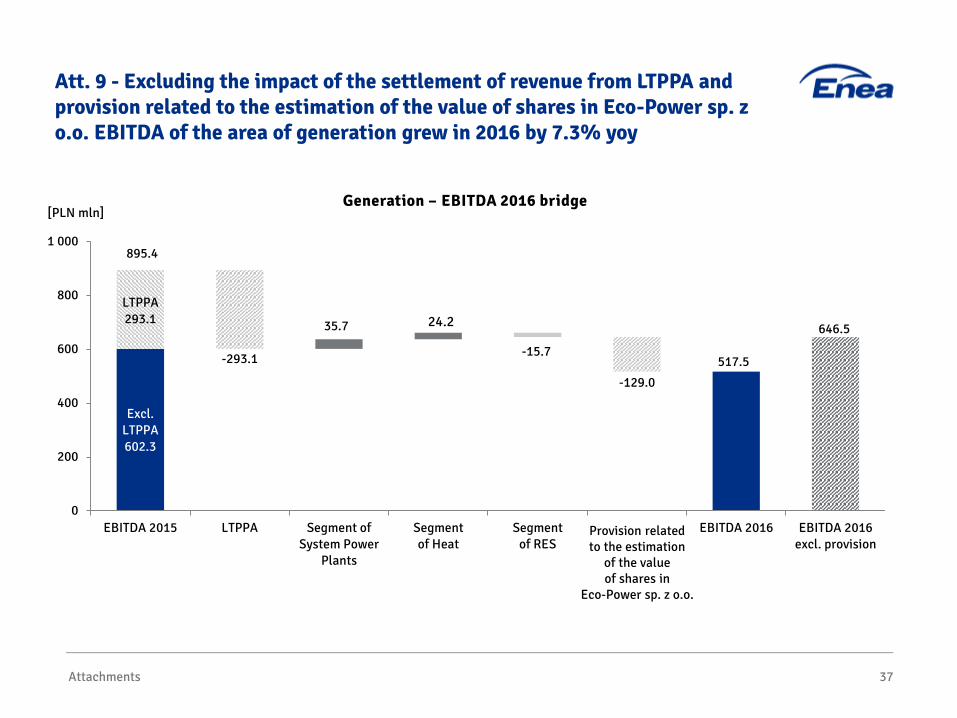
Att. 9 - Excluding the impact of the settlement of revenue from LTPPA and provision related to the estimation of the value of shares in Eco-Power sp. z o.o. EBITDA of the area of generation grew in 2016 by 7.3% yoy
Excl. LTPPA602.3
-293.1
35.7
517.5
24.2
-15.7
-129.0
LTPPA293.1
646.5
0
200
400
600
800
1 000
EBITDA 2015 LTPPA Segment ofSystem Power
Plants
Segmentof Heat
Segmentof RES
EBITDA 2016 EBITDA 2016excl. provision
Generation – EBITDA 2016 bridge
37
895.4
[PLN mln]
Provision related to the estimation
of the value of shares in
Eco-Power sp. z o.o.
Attachments
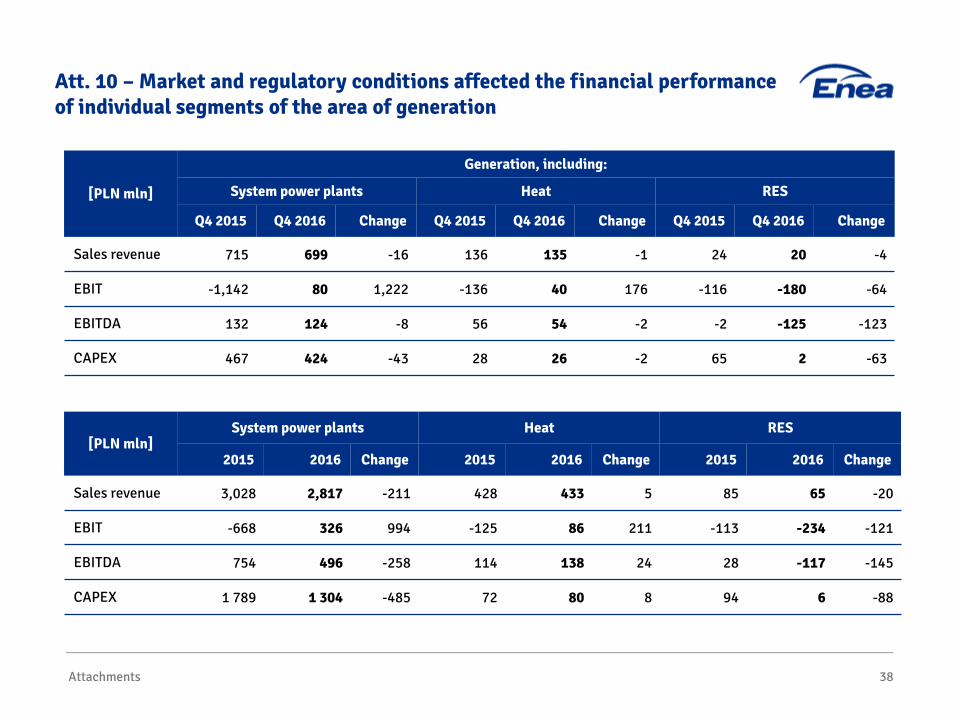
Att. 10 – Market and regulatory conditions affected the financial performance of individual segments of the area of generation
38
[PLN mln]
Generation, including:
System power plants Heat RES
Q4 2015 Q4 2016 Change Q4 2015 Q4 2016 Change Q4 2015 Q4 2016 Change
Sales revenue 715 699 -16 136 135 -1 24 20 -4
EBIT -1,142 80 1,222 -136 40 176 -116 -180 -64
EBITDA 132 124 -8 56 54 -2 -2 -125 -123
CAPEX 467 424 -43 28 26 -2 65 2 -63
[PLN mln]System power plants Heat RES
2015 2016 Change 2015 2016 Change 2015 2016 Change
Sales revenue 3,028 2,817 -211 428 433 5 85 65 -20
EBIT -668 326 994 -125 86 211 -113 -234 -121
EBITDA 754 496 -258 114 138 24 28 -117 -145
CAPEX 1 789 1 304 -485 72 80 8 94 6 -88