energizing earth - aries agro
TRANSCRIPT

1 Energizing Earth October 2014
Safe Harbor
The views expressed here may contain information derived from publicly available sources that have not been independently verified.
No representation or warranty is made as to the accuracy, completeness, reasonableness or reliability of this information. Any forward looking
information in this presentation including, without limitation, any tables, charts and/or graphs, has been prepared on the basis of a number of
assumptions which may prove to be incorrect. This presentation should not be relied upon as a recommendation or forecast by Aries Agro
Limited (”Aries") and its subsidiaries. Past performance of Aries and its subsidiaries cannot be relied upon as a guide to future performance.
This presentation contains 'forward-looking statements' – that is, statements related to future, not past, events. In this context, forward-looking
statements often address our expected future business and financial performance, and often contain words such as 'expects,' 'anticipates,'
'intends,' 'plans,' 'believes,' 'seeks,' or 'will.' Forward–looking statements by their nature address matters that are, to different degrees,
uncertain. For us, uncertainties arise from the behaviour of meteorological conditions, fluctuations in interest and or exchange rates and input
prices; and from numerous other matters of national, regional and global nature, including those of a environmental, climatic, natural, political,
economic, business, competitive or regulatory nature. These uncertainties may cause our actual future results to be materially different that
those expressed in our forward-looking statements. We do not undertake to update our forward-looking statements.
This presentation is not intended, and does not, constitute or form part of any offer, invitation or the solicitation of an offer to purchase,
otherwise acquire, subscribe for, sell or otherwise dispose of, any securities in Aries or any of its subsidiary undertakings or any other
invitation or inducement to engage in investment activities, nor shall this presentation (or any part of it) nor the fact of its distribution form the
basis of, or be relied on in connection with, any contract or investment decision.
2

ARIES AGRO- KEY FACTS
Promoted by Dr. T.B. Mirchandani and Mrs. Bala Mirchandani in 1969, Aries is India’s
leading micro-nutrient player with sales of INR 2.9bn (FY14) and Exports to around
12 countries
Started with manufacturing of mineral feed additives for animals, diversified after
1975 into micro-nutrients, secondary nutrients and water-soluble NPK fertilisers for
plants. Introduced the concept of “chelates” in India (Agromin, Chelamin, etc.)
Incorporated in 1969, Aries went public in FY08 raising INR 58.5cr.
Driven by strong manufacturing and International Business, reported 19% revenue
CAGR, 16% EBITDA CAGR over FY09-FY13
Pan-India presence with 6 factories and total capacity of 84,600 mtpa.
International presence through own manufacturing in Sharjah and Fujairah
Distributed through 8,000 distributors reaching 200,000+ villages
Recipient of many awards including “Certificate of Excellence’ for Exemplary
Growth – 2011 - ranking of India's 500 fastest-growing mid-size enterprises.
Winner of the 2011, 2012 & 2013 Inc India Awards for the 500 fastest growing mid-
size companies in India. 2013 Inc India Innovative 100 Award for the 100 most
innovative Indian companies under the categories of product design and responsible
business. India 500 is an offshoot of the annual Inc. 500 Award.
3
KEY DATA
BLOOMBERG TICKER ARIE:IN
FACE VALUE (RS) 10
NO. OF SHARES (MN) 13
PRICE* (RS)
MCAP* (RS MN)
SHAREHOLDING DATA (%) (AS ON MAR 31ST, 2014)
PROMOTERS 52.74
DIIS 8.37
OTHERS 38.89

SUMMARY CONSOLIDATED FINANCIALS
4
0.70
0.59
0.98 1.06
0.84
-
0.20
0.40
0.60
0.80
1.00
1.20
FY10 FY11 FY12 FY13 FY14
Net D/E (x)
11.39
14.03
10.60 10.47
12.24
-
5.00
10.00
15.00
FY10 FY11 FY12 FY13 FY14
Diluted EPS (Rs.)
150.90
177.80
236.30 251.80
297.80 34.10
17.83
32.90
6.56
18.27
-
5.00
10.00
15.00
20.00
25.00
30.00
35.00
40.00
-
50.00
100.00
150.00
200.00
250.00
300.00
350.00
FY10 FY11 FY12 FY13 FY14
INR
Cr.
. Net Sales Chng (%)
34.30
43.60
51.20 52.30
62.30
19.24
21.14
16.72 16.90
17.55
-
5.00
10.00
15.00
20.00
25.00
-
10.00
20.00
30.00
40.00
50.00
60.00
70.00
FY10 FY11 FY12 FY13 FY14
INR
Cr.
. PBDIT OPM (RHS%)

INDIA NEEDS MORE FOOD WITH LESS LAND
Higher food inflation, through constrained monetary policy and decreased savings, impacts economic growth
Food inflation at 6.7% CAGR despite food production rising from 169.9 mn te (FY89) to 234.5 mn te (FY09)
Rising food prices due to growing global and domestic food demand, decreasing arable land
Declining per capita arable land- Population rising at 1.4% p.a.; arable land declining due to non-agricultural usage, deteriorating soil quality and dipping water tables
Total agricultural land in India declined from 185.142 mn ha to 182.385 mn ha in the last two decades.
Raising crop yield critical for food security. Current Indian yields woefully lower than potential yields
In India, 50% of PFCE is on food, implying higher vulnerability to food shortages and inflation.
5
0
0.05
0.1
0.15
0.2
0.25
0.3
0.35
0.4
19
61
19
65
19
69
19
73
19
77
19
81
19
85
19
89
19
93
19
97
20
01
20
05
20
09
hecta
res p
er
pers
on
India- Declining Arable land (ha) per capita
0
50
100
150
200
250
300
350
400F
Y95
FY
97
FY
99
FY
01
FY
03
FY
05
FY
07
FY
09
FY
11
India- Food Articles WPI (CAGR- 6.7%) India- Below global yields
2010 Cereal Yield (kg/ha)

MICRO-NUTRIENTS- PLAYING A CRITICAL ROLE IN RAISING YIELD
Crop nutrition and protection critical to improving yields and thus total food production
Yields typically 20-50 percent of those on equivalent US cropland
India’s fertiliser consumption has grown at 4.8% p.a. over the last decade, however, this has been unbalanced due to subsidies. Total
fertiliser subsidy for FY14 revised estimated at INR. 680bn.
Balanced mix of nutrients needed to improve crop yield based on the specific needs of the crop and the soil quality
Relatively higher major (NPK fertilisers) and secondary fertilisers (Mg, S, Ca) are being used.
Micro-nutrients (Bo, Zn, Si, Mn, Fe, Cu, Mo based) have been ignored due to lower awareness
Micro-nutrients are metal-based nutrients complementary to major fertilisers and called so because of the relatively low volume
required in the overall balanced nutrition needs of a plant.
Micro-nutrient deficiencies are quite common. An estimated 50% of the world cereal soils are deficient in Zinc and 30% of cultivated
soils globally are deficient in Iron.
More than half the global population suffers from Fe and Zn deficiencies. Approximately 30% of children have stunted growth primarily
due to micronutrient (Fe, Zn) deficiency.
Dietary Zn deficiency is a major nutritional disorder of the poor households of countries like India which depend heavily on rice.
Micronutrient enrichment of crops can be an effective strategy to address dietary Zn deficiencies in human.
6
MICRO-NUTRIENTS- GROWTH DRIVERS AND INDUSTRY DYNAMICS
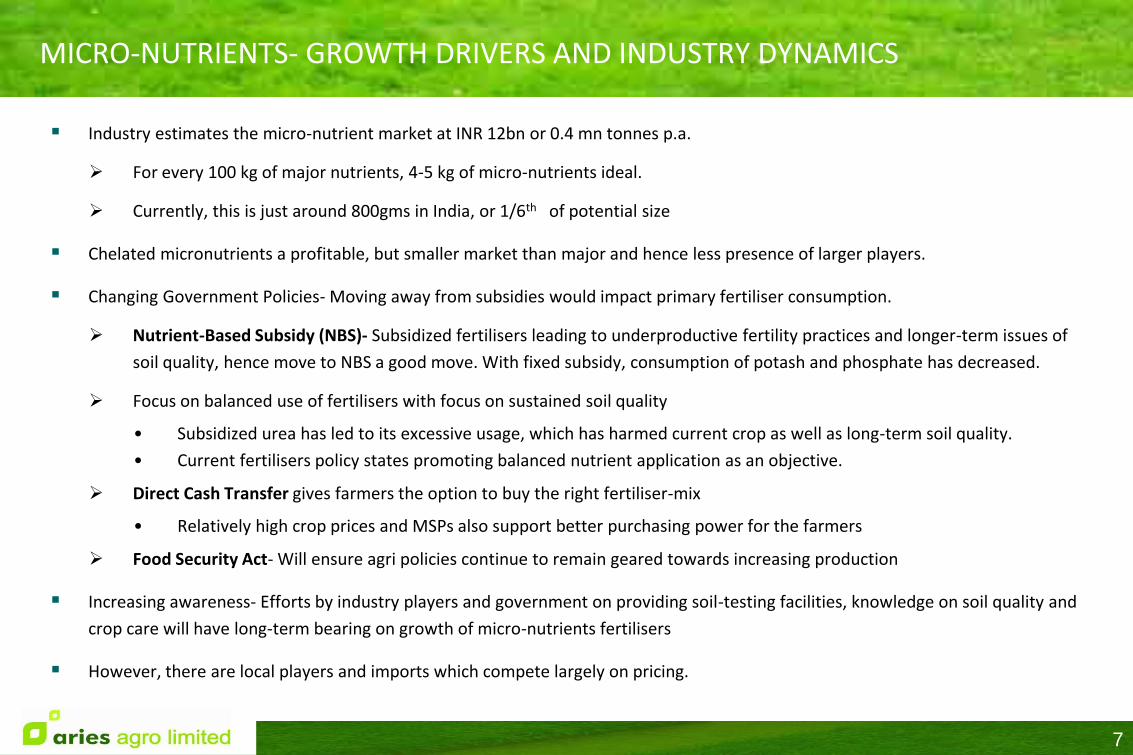
Industry estimates the micro-nutrient market at INR 12bn or 0.4 mn tonnes p.a.
For every 100 kg of major nutrients, 4-5 kg of micro-nutrients ideal.
Currently, this is just around 800gms in India, or 1/6th of potential size
Chelated micronutrients a profitable, but smaller market than major and hence less presence of larger players.
Changing Government Policies- Moving away from subsidies would impact primary fertiliser consumption.
Nutrient-Based Subsidy (NBS)- Subsidized fertilisers leading to underproductive fertility practices and longer-term issues of
soil quality, hence move to NBS a good move. With fixed subsidy, consumption of potash and phosphate has decreased.
Focus on balanced use of fertilisers with focus on sustained soil quality
• Subsidized urea has led to its excessive usage, which has harmed current crop as well as long-term soil quality.
• Current fertilisers policy states promoting balanced nutrient application as an objective.
Direct Cash Transfer gives farmers the option to buy the right fertiliser-mix
• Relatively high crop prices and MSPs also support better purchasing power for the farmers
Food Security Act- Will ensure agri policies continue to remain geared towards increasing production
Increasing awareness- Efforts by industry players and government on providing soil-testing facilities, knowledge on soil quality and
crop care will have long-term bearing on growth of micro-nutrients fertilisers
However, there are local players and imports which compete largely on pricing.
7

INDUSTRY: SPECIALTY PLANT NUTRITION SOLUTIONS
8

9
THE WONDER OF CHELATION TECHNOLOGY
Nutrients can be applied to crops in inorganic form or Chelate form
60% of inorganic compounds are wasted by leaching, fixation and due to its property of reacting easily with air, water & soil
Key advantages of chelated (derived from Greek word “chel” meaning a crab’s claw) micro-nutrients
Chemically inert and soluble in water and easily absorbed by plants
Increase the availability of nutrients by binding relatively insoluble iron, ensuring 100% availability
Prevent nutrients from leaching
Prevents mineral nutrients from forming insoluble precipitates

ARIES-DIVERSIFIED PORTFOLIO, PAN-INDIA PRESENCE
Leading chelated micro-nutrients player and exposure to secondary nutrients and Soluble NPK
10
Balanced revenue from Kharif and Rabi crops
Manufactured Sales as % of Total Sales
Product-wise Manufactured Sales break-up
-
50.00
100.00
150.00
FY11 FY12 FY13 FY14
(in
Rs. C
r.)
Animal Feed
Insecticides
Micronutrients
0%
20%
40%
60%
80%
100%
120%
FY11 FY12 FY13 FY14
Rabi
Kharif
58.00
63.00
68.00
73.00
FY11 FY12 FY13 FY14
65.46
62.99
72.32
59.44

PAN INDIA SALES – STATEWISE SALES BREAKUP FOR THE YEAR 2013 - 14
11
WEST BENGAL, 11
MAHARASHTRA, 15
BIHAR, 4
ANDHRA PRADESH, 18
RAJASTHAN, 4
PUNJAB, 11
UTTRAPRADESH, 5
TAMIL NADU, 3
ASSAM, 2
ORISSA, 2
GUJARAT, 4
UTTARANCHAL, 2
HARYANA, 3
JHARKHAND, 1
KARNATAKA, 5
MADHYAPRADESH, 5
MUMBAI, 6

STRONG PRODUCT PORTFOLIO, CONTINUOUS INNOVATION
Aries caters to a wide variety of agri-produce including Rice, Wheat, Pulses, etc.
Product portfolio consists of market-leading products including Agromin, Chelamin, etc.
Agromin and Chelamin contributed 35% of revenue in FY14
New product launch has been a key driver of growth
Recent new product launches include Zinconite, Ferrocare, Hortimin, ZincMag.
Strong R&D focus led by 70-member team and trials conducted over 100 Universities and Institutions
Products are priced at a premium to the rest of the market owing to their higher brand awareness
Significant efforts go into educating the farmers and the distributor channels about Aries products.
Aries has entered into a Purchase and Sale Agreement for purchase of “Biodegradable Spray Oils” for sale and marketing
of the same under Aries’ brand name.
12

SOME PICTURES OF MANUFACTURED AND TRADED PRODUCT PACKS
13

OPERATIONAL CAPABILITIES- STRONG MANUFACTURING AND DISTRIBUTION
Aries has strong, distributed manufacturing network to meet its pan-India
marketing presence
With 6 factories, domestic production capacity of 84,600tpa.
Stable capacity utilisation
No capacity expansion required until FY15 for projected growth
International manufacturing presence in Sharjah (FZC) and Fujairah to
produce Chelates and Sulphur Bentonite, respectively
Long term marketing tie-ups with producers outside India
Aries depends significantly for key inputs like Boron on imports
Almost 67% of RM consumed in FY14 was imported
Company has strong relationship with its supplier base, but high imports
also implies a significantly longer working capital cycle.
Pan-India, well-penetrated distribution capabilities
25 branches across 23 states
Direct access through retailers to 200,000 villages (1/6th villages of India)
14
Extensive Distribution
Sufficient Production Capacity; rising utilization
AAL
8000+ distributors
90000+ retailers
9mn + Farmers
451
Ma
rke
tin
g p
ers
on
ne
l
pro
vid
ing
te
ch
nic
al su
pp
ort
35
40
45
50
20000
30000
40000
50000
60000
70000
80000
90000
FY11 FY12 FY13 FY14
Capacity (MT)
Capacity Utilisation

INTERNATIONAL BUSINESSES- SOURCING STRENGTH, NEW EXPORT MARKETS
GOLDEN HARVEST MIDDLE EAST FZC (SHARJAH, UAE)
Supplies chelates to Aries as well as external customers.
In FY14, 34% of its sales was to Aries and rest to
customers located in Asia, M.E., Africa and Latin America.
Sales down by 12.44% in FY14, while capacity utilization in
FY14 was almost at the same level as that of FY13.
• Rationale:
• In-house cheaper source of EDTA critical for Aries as chelated products from more than 2/3rd of Aries Sales.
• Potential to serve new markets.
AMARAK CHEMICALS FZC (FUJAIRAH, UAE)
Supplies Sulphur Bentonite, a key secondary nutrient, to
Aries and external customers. In FY14, 0.76% was supplied
to Aries.
Sales in FY14 was AED 31mn. FY14 capacity utilization has
been 32%.
15
• Aries’ International Business increased by 2% as compared to 17% in FY2012-13 and now constitutes to 27% of the total
revenue of the Aries Group.
• Golden Harvest Middle East FZC (Sharjah) and Amarak Chemicals FZC (Fujairah) (75% step-down of Golden Harvest) are the two
international subsidiaries with production capacities of 10,800mtpa and 60,000mtpa respectively
• Aries has deployed INR 600 Mn in Golden Harvest Middle East FZC and Amarak Chemicals FZC.
• Marketing strategy for International Business: • Distributors have been appointed and Sales have commenced in more than 12 countries including Brazil, New Zealand, Taiwan, Australia,
Pakistan, Viet Nam and United Kingdom.
• Global business team based out of Mumbai, India and UAE.

ARIES- UNIQUELY POSITIONED
16
Commodity NPK Fertilizers
Water Soluble NPK Fertilizers Secondary nutrients
Value added Micronutrients Inorganic Micronutrients
Aries Presence ✗ ✔ ✔ ✔ ✔
Typical products Urea, DAP, SOP 20-20-20, 13-0-45, 0-52-
34, 0-0-50 Ca, Mg, S Chelates Sulphates
Price Control ✔ ✗ ✗ ✗ ✗
Subsidies ✔ ✗ ✗ ✗ ✗
Volumes High Low Medium Low Medium
Profitability Very Low Medium Medium High Low
Aries Revenue share % -- 12% 10% 58% 9%
Gross Margins % -- 12% 30% 55% 15%
• While Aries does not get subsidy benefits, it faces no price control and uncertainty over pricing and working capital due to subsidy. • Aries enjoys much higher profit margins than commodity fertilisers and inorganic micronutrients.

RISKS AND CHALLENGES
Poor monsoon
Company’s past performance demonstrates that only less than half of Aries’ performance can be explained by rainfall.
Stronger focus on developing cash crop markets and horticulture crops during Rabi, since water availability is known before Rabi season.
Power deficiency leading to unavailability and increased power cost
This is now a growing concern in power deficient States after FY14.
Re-orienting our product and market-mix towards states with surplus power
Almost 67% of our Imports is in forex
Forex gain in the first six months of FY15 is INR 0.61Cr
Awareness- Price of Aries products are 4-6x Urea prices, and hence “assumed substitutability” leads to farmers using more
Urea. However, the quantity of Chelated micronutrients needed is much lower than that of major fertilisers. Besides,
micronutrients improve the performance of major fertilisers. Aries makes sustained efforts to improve the awareness about
Chelated micronutrients.
17

KEY TAKEAWAYS
Favorable Industry dynamics for the medium to long-term given the food security issues, rising population and changing
government policies.
Aries- India’s largest chelated micronutrient player.
Pan-India presence with a strong product portfolio catering to both Kharif and Rabi crops.
Continued new product launches driving growth
Mix to change in favour of manufactured sales
Non-India sales to increase its share in consolidated revenue
Strong manufacturing capabilities to cater to growth until FY15 without any significant capex.
6 plants spread across India with a total capacity of 84,600 MTPA. Current capacity utilization 45%
Well-entrenched distribution network, reaching almost a sixth of India’s villages and farmers.
Key concerns would be power shortage, besides dependence of Indian agriculture on monsoon.
18

FOR QUERIES AND FURTHER INFORMATION
19
Energizing Earth
Aries House, Plot No.24, Deonar, Govandi (East), Mumbai 400 043, India.
www.ariesagro.com
For further information, contact:
Mr. S. Ramamurthy
Chief Financial Officer
Aries Agro Limited
Email: [email protected] Phone: +91-22-25564052| Fax: +91-22-25564054
Mr. Qaiser Ansari
Company Secretary
Aries Agro Limited
Email: [email protected]
Phone: +91-22-25564052| Fax: +91-22-25564054
ANNEXURE I: KEY MICRO-NUTRIENTS AND THEIR ROLE
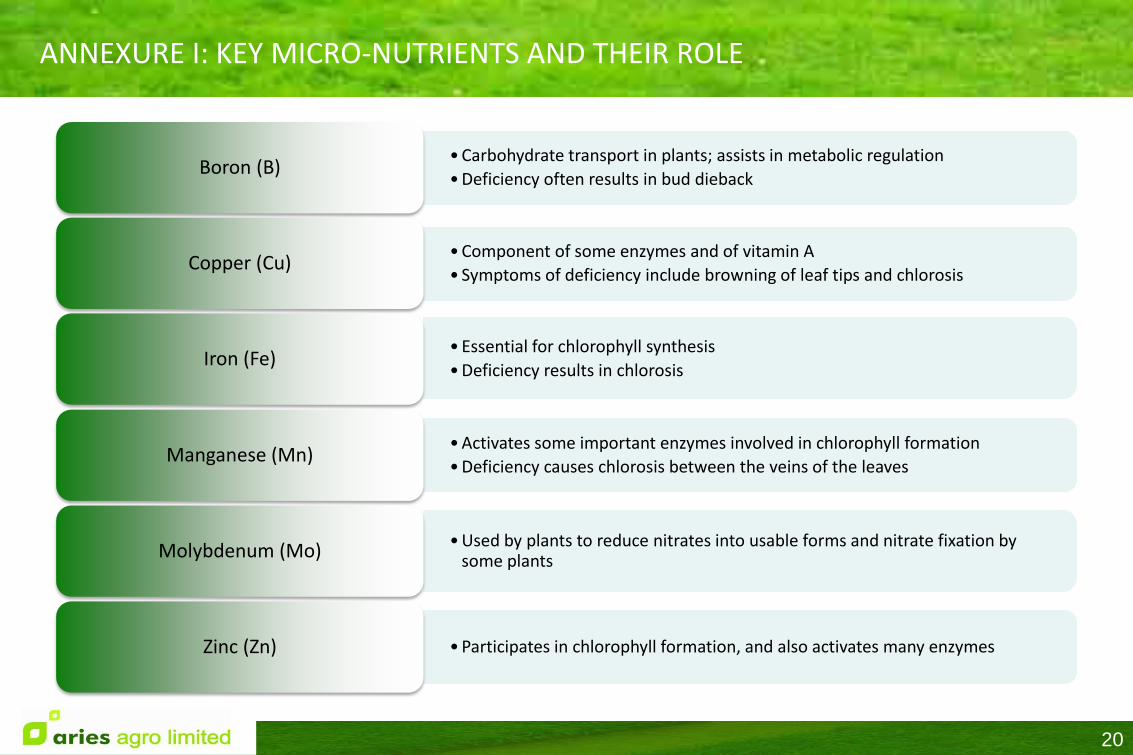
• Carbohydrate transport in plants; assists in metabolic regulation
• Deficiency often results in bud dieback Boron (B)
• Component of some enzymes and of vitamin A
• Symptoms of deficiency include browning of leaf tips and chlorosis Copper (Cu)
• Essential for chlorophyll synthesis
• Deficiency results in chlorosis
Iron (Fe)
• Activates some important enzymes involved in chlorophyll formation
• Deficiency causes chlorosis between the veins of the leaves Manganese (Mn)
• Used by plants to reduce nitrates into usable forms and nitrate fixation by some plants
Molybdenum (Mo)
• Participates in chlorophyll formation, and also activates many enzymes Zinc (Zn)
20

ANNEXURE II: TYPICAL SEASONALITY OF INDIAN OPERATIONS
Q1 (APR - JUN) Q2 (JUL – SEP) Q3 (OCT – DEC) Q4 (JAN – MAR)
Revenues – Nutrients 10% 35% 35% 20%
Revenues - Sprayers 35% 35% 30% --
Inventory (across all locations) High – to build up
for Kharif
Highest High Reduces by year end
Receivables (from registered
distributors)
Low High High Reduces by year end
Expenses High as % to Q1
sales
Stable Stable Highest, includes year
end discounts
Working Capital needs High Highest High Reduces by year end
21