energy and buildings · ter model with an energyplus model. first, the energyplus model calculates...
TRANSCRIPT
Ep
Ma
b
a
ARRAA
KBUUU
1
WaEthmltttbe
uitd
h0
Energy and Buildings 96 (2015) 221–235
Contents lists available at ScienceDirect
Energy and Buildings
j ourna l ho me page: www.elsev ier .com/ locate /enbui ld
stimation of urban temperature and humidity using a lumpedarameter model coupled with an EnergyPlus model
iguel Martina,∗, Afshin Afshari a, Peter R. Armstronga, Leslie K. Norfordb
Masdar Institute of Science and Technology, PO Box 54224, Abu Dhabi, United Arab EmiratesMassachusetts Institute of Technology, 77 Massachusetts Avenue, R.5-414, Cambridge, 02139 MA, United States of America
r t i c l e i n f o
rticle history:eceived 1 December 2014eceived in revised form 17 February 2015ccepted 18 February 2015vailable online 11 March 2015
eywords:
a b s t r a c t
In this paper, we describe a lumped thermal parameter model coupled with an EnergyPlus model usedfor estimating temperature and specific humidity in the near-surface urban environment. Estimationsmade by the model are compared to measurements obtained from data loggers installed in an urbancanyon of Masdar Institute (Abu Dhabi). Based on these comparisons, we first evaluate the most likelyratios of heat released into the urban canyon by a building air handling unit and the wind tower thatproduces adiabatically cooled air. Next, we analyze three specific case studies to obtain a local estimate
uilding energy modelrban canopy modelrban specific humidityrban temperature
of the accuracy that is reached by the coupled scheme. To estimate its global precision, we perform asensitivity and Monte-Carlo analysis over the most likely ratios of heat emitted by the air handling unitand the wind tower. Although validation in a dense downtown is still lacking and will be undertaken inthe future, this study suggests that urban temperature and humidity can be estimated with an acceptableaccuracy under moderate waste heat releases and anthropogenic heat gains.
© 2015 Elsevier B.V. All rights reserved.
. Introduction
The Middle-East is well-known for its hot and humid climate.hile a number of studies report interesting analyses of temper-
ture and humidity measured within the urban canopy layer ofuropean cities [1,2], Middle Eastern cities have seldom been inves-igated. For instance, the experiment by Charabi and Bakhit [3]ighlights certain properties of the Urban Heat Island (UHI) effecteasured in Muscat (Oman). The UHI phenomenon was also ana-
yzed in Kuwait City (Kuwait) by Nasrallah et al. [4]. Comparinghe UHI effect reported in several arid North American locationso the one measured in Kuwait City, they discovered that the posi-ion of the city, the absence of dense vegetation, and the height ofuildings could enable us to mitigate the UHI effect in hot and aridnvironment.
Past studies have often focus on the experimental analysis ofrban temperature, rarely giving in-depth consideration of humid-
ty. Among the few studies providing equal attention to humidity,he research led by Jáuregui and Tejeda [5] showed the averageiurnal cycle of specific humidity for rural, suburban, and urban
∗ Corresponding author. Tel.: +971 28109333.E-mail address: [email protected] (M. Martin).
ttp://dx.doi.org/10.1016/j.enbuild.2015.02.047378-7788/© 2015 Elsevier B.V. All rights reserved.
areas of Mexico City. Nevertheless, their analysis is purely basedon measurements and does not provide explicit guidance that canbe used for including an estimation of humidity in an urban canopymodel.
Urban canopy models were developed to improve the rep-resentation of urban areas in meteorological models. Severalurban canopy models now in widespread use include a build-ing energy model to more accurately represent the impact ofbuilding thermal processes on the ambient environment in theUrban Canopy Layer (UCL), the lowest layer of the Urban Bound-ary Layer (UBL) [6–8]. Urban canopy models can be run asstand-alone programs or, alternatively, driven by a meteorologi-cal simulation. In either mode, they are used mainly by the urbanclimate research community, which largely focuses on the char-acteristics of the urban environment and not the performance ofbuildings.
Building energy models allow us to approximate the indoorenergy consumption in response to outdoor conditions. Buildingenergy models are widely employed in isolated mode by consult-ing engineers working with architects and building owners. After
defining a suitable basic design, analysts try to evaluate the effi-ciency of different design options or retrofitting strategies [9,10].The main drawback in using building energy models in a stand-alone mode is that the UHI phenomenon is neglected.
222 M. Martin et al. / Energy and Bui
˛x albedo of surface x, –ıex air handling unit exhaust heat ratio, – or %ıwt wind tower heat ratio, – or %ε emissivity, –�q latent heat recovery effectiveness, – or %�T sensible heat recovery effectiveness, – or %�x density of x, kg/m3
�x relative humidity of x, – or %ωx water content of x, m3/m3
Ax area of x, m2
Cx sensible heat capacitance of x, J/KCx latent heat capacitance of x, Jcx specific heat of x, J/(kg K)dx depth of x, mHx scheduled dependent value of x- or %Ix water provided by irrigation on x, kg/(m2 s)k U-value, W/(m2 K)Lx latent heat of vaporization of x, J/kglx length of x, mmx mass flow rate of x, kg/sn(.) cardinality, –Qx sensible heat of x, WQx latent heat of x, WPx precipitation on x, kg/(m2 s)px pressure on x, Paqx specific humidity of x, kg/kgqsat specific humidity at saturation, kg/kgRx,y sensible heat resistance between x and y, (m2 K)/WRx,y latent heat resistance between x and y, m2/Wrx,y aerodynamic resistance between x and y, s/mTx temperature of x, ◦C or KTx average temperature of x, ◦C or Kt time, sVx volume of x, m3
wx width of x, mzx height of x, m
Subscriptsb buildingex exhaust air from the air handling unitf facadeg ground (soil)HL HOBO loggerI irrigation systems streetsky skyr roadubl urban boundary layerurb urban canyonveg vegetationwa wall
atdi
e
wi windowwt wind tower
Before developing a building energy model for Town Energy Bal-nce (TEB), Bueno et al. [11] coupled TEB to an EnergyPlus1 model
o exploit the advantages and overcome the drawbacks of both. Toevelop a simulation scheme of complexity appropriate for build-ng professionals and engineers, Bueno proposed a Resistance and
1 EnergyPlus is a detailed dynamic building energy simulation engine (cf. Crawleyt al. [12]).
ldings 96 (2015) 221–235
Capacitance (RC) representation of a building energy model and thecoupled adjacent atmosphere [13]. In the Urban Weather Genera-tor (UWG), he extended the lumped parameter approach to energybalances to include a rural reference weather station and the UBLabove the UCL [14]. In this way, the UWG maps a reference weatherfile to estimated conditions at an urban neighborhood. While theUWG itself necessarily couples the building to the UCL, the useof the UWG is decoupled from the building energy model. Thisrequires the user to provide to the UWG the same key buildingparameters to be used in the building energy model.
This paper proposes a new method that leverages the capa-bilities of detailed building performance simulations but retainsthe direct coupling of that simulation with a representation of theurban canopy model, for which the new scheme uses a lumped ther-mal parameter model. The fact of coupling an urban canopy modelwith an EnergyPlus model ordinarily adds complexity in terms ofsoftware programming. In order to solve this issue, we decidedto use the Building Controls Virtual Test Bed (BCVTB) [15]. Thistechnology allowed us to implement a Matlab thread that executesthe lumped thermal parameter model and communicates with theEnergyPlus external interface. While building surface temperaturesand convective heat transfer coefficients, waste heat emissions,and air handling unit exhausts approximated from the EnergyPlusmodel were iteratively employed by the lumped thermal parame-ter model, the latter was mainly in charge of computing dry-bulbtemperature, wet-bulb temperature, and wind speed in the UCL toimprove the accuracy of exterior surface conditions considered bythe EnergyPlus model.
The coupled scheme can be used in several applications. First,a model of urban temperature is required to estimate the buildingcooling energy penalty due to the UHI effect. The model also allowsus to develop and test different approaches to reducing the UHIeffect. Finally, in order to optimize city-wide demand side man-agement interventions, what-if retrofitting scenarios can easily begenerated and evaluated by changing the parameters of the coupledscheme model. This could become an effective decision support toolfor policy makers. Before being employed in all these applications,the reliability of the coupled scheme in terms of urban temperatureand specific humidity estimations must be proved.
2. Coupled scheme
To estimate dry-bulb temperature and specific humidity in theUCL of Masdar Institute, we coupled a lumped thermal parame-ter model with an EnergyPlus model. First, the EnergyPlus modelcalculates sensible and latent heat fluxes coming from air han-dling unit exhausts, and waste heat releases. The building energymodel also computes wall and window surface temperature. Next,all these values are employed by the lumped thermal parametermodel to evaluate the urban canyon temperature, specific humid-ity, and pressure. The same parameters are also computed for roadand soil surfaces. In addition to the information assessed from theEnergyPlus model, the lumped thermal parameter model requiresvalues for meteorological parameters in the UBL: dry-bulb temper-ature, precipitation, pressure, relative humidity, and wind speed.For this purpose, an EnergyPlus weather file is created based onactual hourly measurements we obtained from the weather stationlocated at the top of the Masdar wind tower. Finally, the dry-bulbtemperature, wet-bulb temperature, and wind speed calculatedfrom the lumped thermal parameter model are used by the Energy-Plus model as outdoor boundary conditions of walls and windows.
Fig. 1 shows the urban topography we considered for designingthe coupled scheme. Like Bueno et al. [11], the building definedvia the EnergyPlus model (also called the reference building) isassumed to be surrounded by buildings of equal height zb, length

M. Martin et al. / Energy and Buildings 96 (2015) 221–235 223
Fa
la
tsmriaorhhEntfht
Q
Q
wuca
erec
FecE
Fig. 3. Lumped thermal parameter model used for the computation of latent
˜
ig. 1. 3D urban topography considered by the coupled-scheme. Buildings aressumed to have same dimensions and thermal properties. Streets are also identical.
b, and width wb. Streets located all around the reference buildingre also the same width ws.
Similar to Bueno et al. [13], we defined a system of differen-ial equations representing sensible heat transfers from the UBL,treets, and buildings to the urban canyon. The resulting state spaceodel has three state variables: urban canyon air temperature,
oad temperature, and ground temperature. As input variables, wencluded UBL temperature, left and right fac ade temperatures, anddditional sensible heat gain Q ∗
urb. The latter corresponds to the sum
f sensible heat coming from anthropogenic activity Qag (i.e. heateleases emitted by human activity on streets), exhausts Qex (i.e.eat rejected by the air handling unit), waste heat releases Qwr (i.e.eat rejected by the chiller plant), and the Masdar wind tower Qwt.ven though anthropogenic heat gains and waste heat releases areegligible in Masdar Institute (i.e. Qag ∼= 0 and Qwr ∼= 0), we decidedo consider these two parameters to test the coupled scheme in auture case study in which they would be significant. The sensibleeat released by the air handling unit Qex and the Masdar windower Qwt can be computed as:
ex = ıex(Qex,zones − Qrecov) (1)
wt = ıwtHwtmwtcp(Twt − Turb) (2)
here ıex and ıwt are the ratios of heat coming from the air handlingnit and the Masdar wind tower, respectively, going into the urbananyon. These two formulas are further explained in Appendices And B. The resulting lumped parameter model is illustrated in Fig. 2.
Following a similar strategy, we expressed latent heat
xchanges in terms of latent heat capacitances and latent heatesistances (cf. Fig. 3). Comparable to the system of differentialquations defining sensible heat transfers, latent heat exchangesan be solved as a state space model with one state variable: theig. 2. Lumped thermal parameter model used for the computation of sensible heatxchanges where Q ∗
urb= Qag + Qex + Qwr + Qwt . It shows variables that are internally
omputed (solid circle), and the ones obtained from the weather file (cross) and thenergyPlus model (solid square).
heat exchanges where Q ∗urb
= Qag + Qex + Qwr + Qwt . In agreement with [6,22], we
defined qwi = qsat(Twi, purb), qwa = qsat(Twa, purb), qr = qsat(Tr , ps), qg = �gqsat(Tg , ps),and qveg = qsat(Tg , ps).
urban specific humidity. The input variables are represented byspecific humidity of the UBL, ground, vegetation, walls, and win-dows. The additional latent heat gain in the urban canyon Q ∗
urbwas
assessed from the same source of heat as Q ∗urb
such as:
Qex = ıex(Qex,zones − Qrecov) (3)
Qwt = ıwtHwtmwtLv(qwt − qurb) (4)
According to Masson [6], a latent heat resistance Rx,urb betweenany thermal node x and the urban canyon urb can be calculated asfunction of an aerodynamic resistance rx,urb = curb�urbRx,urb:
Rx,urb = rx,urbLurb�urb
= curbLurb
Rx,urb (5)
where Rx,urb is the sensible heat resistance. The latent heat capaci-
tance of the urban canyon Curb can also be expressed as a functionof a sensible heat capacitance Curb:
Curb = VurbLurb�urb = Lurbcurb
Curb (6)
While incident solar gain on street surfaces was processed bythe lumped thermal model, the EnergyPlus model was in chargeof computing incident solar radiations on fac ade surfaces. The wayEnergyPlus performs incident solar radiation calculations on walland window surfaces can be found in the Engineering Ref. [16].Unfortunately, the only parameters one can change on wall andwindow surfaces via the EnergyPlus external interface are con-vective heat transfer coefficient, outdoor air dry-bulb temperature,outdoor air wet-bulb temperature, and outdoor air wind speed (atleast in EnergyPlus v.8.1). An access to the variable managing inci-dent solar gain on fac ade surfaces would be a great feature to addin future versions of EnergyPlus.
2.1. Solar radiation incident on street surfaces
The sensible heat gains on the road and the ground dependon solar radiation incident on their respective surfaces (i.e. Q ∗
r =ArS∗
s (˛r) and Q ∗g = AgS∗
s (˛g)). Based on Masson [6], solar radiationincident on surface x – covering the street – was expressed as alinear combination of street direct solar radiation S⇓
s , street dif-fuse solar radiation S↓
s , and solar reflection incident from fac ades
Mf Given the albedo ˛x:S∗(˛x) = (1 − ˛x)S⇓s + (1 − ˛x)S
↓s + (1 − ˛x)(1 − �s)Mf (7)
where �s is the sky view factor of street surface.

224 M. Martin et al. / Energy and Bui
F˛
aFafasfUs
S
S
wo
waae
˛
wso
˛
wt
2
tIsaUc
⎨ 1sat g wilt
ig. 4. Estimation of road and facade shaded area based on zenith �sun and azimuthsun angles of the sun.
In the literature, the shaded area in an urban canyon is expresseds a function of the zenith angle only [6,8]. As demonstrated inig. 4, we tried to improve the computation of the direct solar radi-tions S⇓
s and S⇓f
reaching the street surface and the sun exposedac ade, respectively. Based on trigonometry of zenith and azimuthngles of the sun �sun and ˛sun, respectively, we approximated thetreet shaded area A∗
s either as a trapezoid or as a triangle, and theac ade shaded area A∗
fas a rectangle. Referring to Eq. (4.15) of Bueno
nzeta [17], we adopted the expressions for street and fac ade directolar gain:
⇓s = Idir cos(�sun)
(1 − A∗
s
As
)(8)
⇓f
= −Idir sin(�sun) cos(˛sun − f )
(1 −
A∗f
Af
)(9)
here f is the angle between the North axis and the normal vectorf the shaded fac ade.
The calculation of solar reflections (cf. Eq. (17) of Masson [6])as also improved by considering that street and building fac ades
re made up of surfaces with differing albedo. Due to the fact that building fac ade consists of walls and windows, we estimated thequivalent albedo of a fac ade ¯ f as:
¯ f = (1 − ıwi)˛wa + ıwi˛wi (10)
here ıwi is the window area fraction. From our definition of atreet surface, the albedo ¯ s was evaluated as a linear combinationf road albedo, ground albedo, and vegetation albedo.
¯ s = (1 − ıg)˛r + ıg(1 − ıveg)˛g + ıgıveg˛veg (11)
here ıg and ıveg are the fraction of street covered by ground, andhe fraction of ground covered by vegetation, respectively.
.2. Sensible heat resistances
Referring to the literature, we expressed sensible heat resis-ances between the urban canyon and all connected thermal nodes.n accordance with Eq. (23) of Masson [6], we first estimate the
ensible resistance between the road and the urban canyon asfunction of the effective wind speed. The effective wind speed
eff =√u2∗ + U2
can inside the urban canyon depends on its verti-al and horizontal wind components u* and Ucan, respectively. To
ldings 96 (2015) 221–235
approximate the friction velocity u*, we employed the drag coeffi-cient a2Fm defined in Eq. (8) of Mascart et al. [18]. In short, a2Fm canbe described as function of the Richardson number between theUBL and the urban canyon, the roughness length for momentumZom = zb/10 [19], and the roughness length for heat Zoh = Zom/200[17]. We then iteratively obtained convective heat transfer coeffi-cients for exterior wall hwa and window hwi surfaces employing anEnergyPlus model. We made the choice of using the Thermal Anal-ysis Research Program (TARP) as the surface convection algorithm[20]. Consequently, we simply defined the sensible heat resistancebetween fac ade surfaces and the urban canyon as the inverse ofconvective heat transfer coefficient. Next, the sensible heat resis-tance between the UBL and the urban canyon is evaluated basedon the exchange velocity Uex defined in Eq. (C.13) of Bueno Unzeta[21]. In addition to heat fluxes traveling from the UBL, the streetsurfaces, and fac ade surfaces to the urban canyon, we finally con-sider long wave radiative heat interactions with the sky (cf. Eqs.(D.1)–(D.2) of Bueno Unzeta [21]). Estimations of the effective skytemperature Tsky are computed by the EnergyPlus model.
The computation of some sensible heat resistances requires theestimation of pressures inside the urban canyon. Supposing that allpressures measured at the UBL are hydrostatic, we can express thepressure at the top of an urban canyon pzb as:
pzb = publ + �ublgzb (12)
where zb and g = 9.81 m/s2 are the height of the urban canyonand the gravitational acceleration, respectively. Making the sameassumption for pressures in the UCL, we defined the pressure in theurban canyon purb and at street level ps as the pressure we couldmeasure at height zb/2 and 0, respectively:
purb = pzb + 12�urbgzb (13)
ps = pzb + �urbgzb (14)
where �urb is the density of the urban air canyon.
2.3. Ground relative humidity
Referring to Eqs. (11) and (12) of Noilhan and Mahfouf [22], therelative humidity of the ground �g depends on its water contentωg. Assuming that the water coming from the deep-soil is negligi-ble compared to water provided by precipitation and the irrigationsystem, the variation over time of the ground water content can beestimated as:
dωgdt
= C1
�wdg(Pg − Eg) (15)
where �w = 103 kg/m3 is the density of water. To include the waterprovided by an irrigation system, we defined ground precipitationPg = Publ + HIIg as the summation of precipitation coming from theUBL Publ and the effective water provided by the irrigation systemHIIg at a given hour of the day. The formula used for evaluatingevaporation of water from the ground Eg was adopted from Eq.(14) of Noilhan and Mahfouf [22] using rg,urb = curb�urbRg,urb as theaerodynamic resistance between the ground and the urban canyon.
The force-restore coefficient C1 should be approximated in twodifferent ways depending on the current water content ωg com-pared to the wilting point ωwilt:⎧⎪⎪⎪ C
(ωsat
)b/2+1
If ω ≥ ω
C1 = ⎪⎪⎪⎩ωg
C1 max exp
[− (ωg − ωmax)2
22
]otherwise
(16)
M. Martin et al. / Energy and Bui
pua
3
darohdpttmm
csaitcfTTmcctadb
spTtnrNda
Fig. 5. Masdar Institute residential buildings (left) and laboratories (right).
The first case of Eq. (16) was calculated using the formula of C1satresented by Noilhan and Planton [23], while the second was eval-ated using the parameters C1max, ωmax, and defined in Noilhannd Mahfouf [22].
. Case study
Masdar Institute is a new graduate university located in Mas-ar City (near Abu Dhabi, UAE). The campus consists of residentialnd laboratory buildings. Residential buildings associate traditionalegional architecture with modern technologies to satisfy demandsf style as well as energy efficiency. The laboratories are made ofighly insulated and air tight fac ades for reducing indoor coolingemand in an extremely hot environment. To limit the anthro-ogenic heat gain, an underground network of personal rapidransit vehicles has been installed in the undercroft of Masdar Insti-ute. Most of buildings at Masdar Institute are equipped with a
etering system to provide energy consumption to the buildinganagement system in each unit.Both residential buildings and laboratories were designed to
reate a low energy cost neighborhood. The campus pedestriantreets are characterized by a relatively high height-to-width rationd oriented to benefit from the shading effect. Each residencenterior hallway has an automatically controlled and naturally ven-ilated central atrium cooling the interior of walls. Each atrium isonnected to openings on the podium level where fresh air comesrom, and louvers at the top of the building where cool air flows out.hese openings are closed when the outdoor temperature is high.he metering system in each apartment enables building facilitiesanagers and individual occupants to monitor and alter energy
onsumption depending on the demand in electricity, water, orooling. To reduce the amount of heat flowing in the buildings,he envelope of laboratories is composed of highly insulated andir tight fac ades. A natural daylight control system is used for win-ows to eliminate high and low level angled sunlight. A picture ofoth residential and laboratory buildings is shown in Fig. 5.
To improve outdoor and indoor thermal comfort, two specificystems were installed in Masdar Institute: a district energy systemroviding chilled water, and air handling units providing fresh air.he central plant of the district system is located around 500 m fromhe campus. Therefore, waste heat releases caused by chiller haveo impact on urban temperature of Masdar Institute. Cool air in
esidences and laboratories is delivered by four air handling units:orth-East, North-West, South-East, and South-West unit. Air han-ling units are installed underground so as to get air at ground levelnd release it at roof level. Contrary to chiller waste heat, the heatldings 96 (2015) 221–235 225
rejected by air handling units through exhaust risers might have asignificant impact on urban temperatures.
3.1. Wave block urban canyon
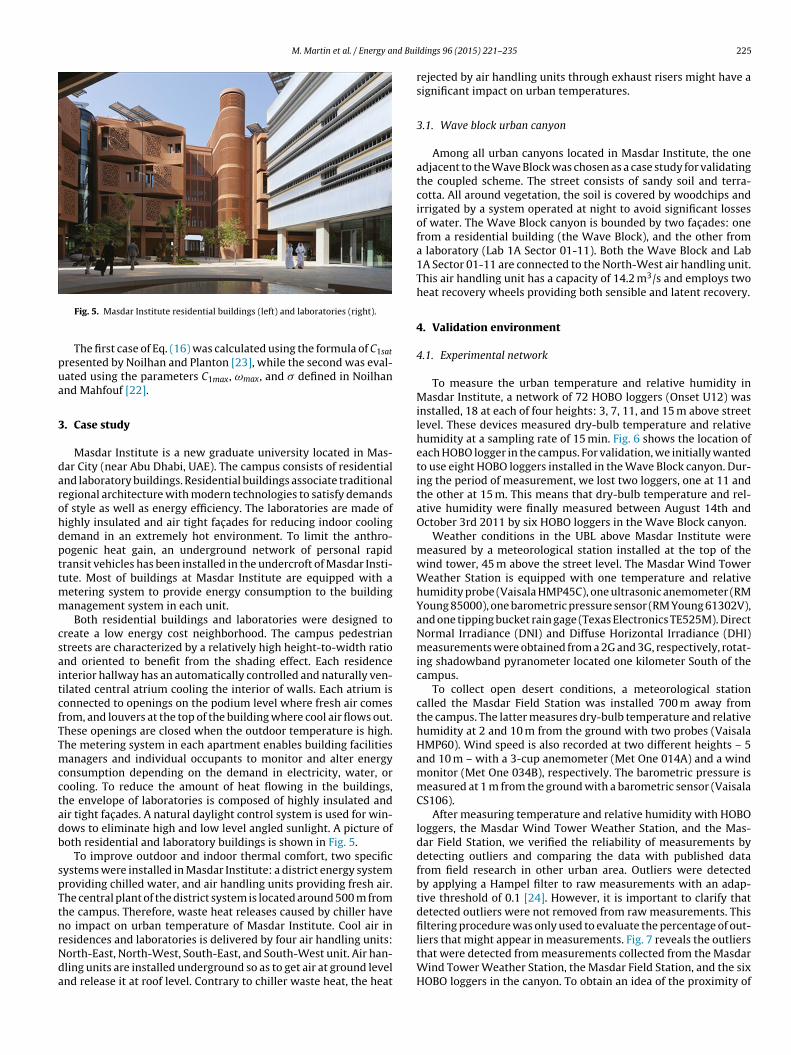
Among all urban canyons located in Masdar Institute, the oneadjacent to the Wave Block was chosen as a case study for validatingthe coupled scheme. The street consists of sandy soil and terra-cotta. All around vegetation, the soil is covered by woodchips andirrigated by a system operated at night to avoid significant lossesof water. The Wave Block canyon is bounded by two fac ades: onefrom a residential building (the Wave Block), and the other froma laboratory (Lab 1A Sector 01-11). Both the Wave Block and Lab1A Sector 01-11 are connected to the North-West air handling unit.This air handling unit has a capacity of 14.2 m3/s and employs twoheat recovery wheels providing both sensible and latent recovery.
4. Validation environment
4.1. Experimental network
To measure the urban temperature and relative humidity inMasdar Institute, a network of 72 HOBO loggers (Onset U12) wasinstalled, 18 at each of four heights: 3, 7, 11, and 15 m above streetlevel. These devices measured dry-bulb temperature and relativehumidity at a sampling rate of 15 min. Fig. 6 shows the location ofeach HOBO logger in the campus. For validation, we initially wantedto use eight HOBO loggers installed in the Wave Block canyon. Dur-ing the period of measurement, we lost two loggers, one at 11 andthe other at 15 m. This means that dry-bulb temperature and rel-ative humidity were finally measured between August 14th andOctober 3rd 2011 by six HOBO loggers in the Wave Block canyon.
Weather conditions in the UBL above Masdar Institute weremeasured by a meteorological station installed at the top of thewind tower, 45 m above the street level. The Masdar Wind TowerWeather Station is equipped with one temperature and relativehumidity probe (Vaisala HMP45C), one ultrasonic anemometer (RMYoung 85000), one barometric pressure sensor (RM Young 61302V),and one tipping bucket rain gage (Texas Electronics TE525M). DirectNormal Irradiance (DNI) and Diffuse Horizontal Irradiance (DHI)measurements were obtained from a 2G and 3G, respectively, rotat-ing shadowband pyranometer located one kilometer South of thecampus.
To collect open desert conditions, a meteorological stationcalled the Masdar Field Station was installed 700 m away fromthe campus. The latter measures dry-bulb temperature and relativehumidity at 2 and 10 m from the ground with two probes (VaisalaHMP60). Wind speed is also recorded at two different heights – 5and 10 m – with a 3-cup anemometer (Met One 014A) and a windmonitor (Met One 034B), respectively. The barometric pressure ismeasured at 1 m from the ground with a barometric sensor (VaisalaCS106).
After measuring temperature and relative humidity with HOBOloggers, the Masdar Wind Tower Weather Station, and the Mas-dar Field Station, we verified the reliability of measurements bydetecting outliers and comparing the data with published datafrom field research in other urban area. Outliers were detectedby applying a Hampel filter to raw measurements with an adap-tive threshold of 0.1 [24]. However, it is important to clarify thatdetected outliers were not removed from raw measurements. Thisfiltering procedure was only used to evaluate the percentage of out-
liers that might appear in measurements. Fig. 7 reveals the outliersthat were detected from measurements collected from the MasdarWind Tower Weather Station, the Masdar Field Station, and the sixHOBO loggers in the canyon. To obtain an idea of the proximity of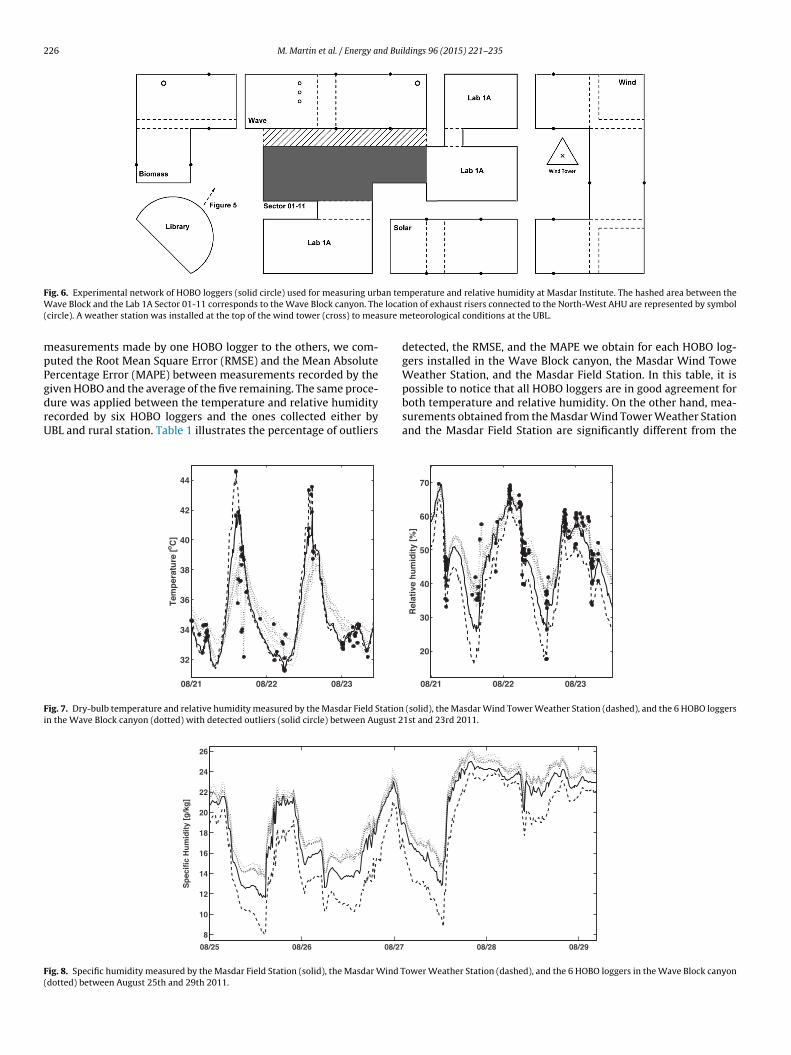
226 M. Martin et al. / Energy and Buildings 96 (2015) 221–235
F an temW e loca( sure m
mpPgdrU
Fi
F(
ig. 6. Experimental network of HOBO loggers (solid circle) used for measuring urbave Block and the Lab 1A Sector 01-11 corresponds to the Wave Block canyon. Th
circle). A weather station was installed at the top of the wind tower (cross) to mea
easurements made by one HOBO logger to the others, we com-uted the Root Mean Square Error (RMSE) and the Mean Absoluteercentage Error (MAPE) between measurements recorded by the
iven HOBO and the average of the five remaining. The same proce-ure was applied between the temperature and relative humidityecorded by six HOBO loggers and the ones collected either byBL and rural station. Table 1 illustrates the percentage of outliers08/21 08/22 08/23
32
34
36
38
40
42
44
Tem
per
atu
re [o
C]
ig. 7. Dry-bulb temperature and relative humidity measured by the Masdar Field Stationn the Wave Block canyon (dotted) with detected outliers (solid circle) between August 2
08/25 08/26 08/27
8
10
12
14
16
18
20
22
24
26
Sp
ecif
ic H
um
idit
y [g
/kg
]
ig. 8. Specific humidity measured by the Masdar Field Station (solid), the Masdar Wind Tdotted) between August 25th and 29th 2011.
perature and relative humidity at Masdar Institute. The hashed area between thetion of exhaust risers connected to the North-West AHU are represented by symbol
eteorological conditions at the UBL.
detected, the RMSE, and the MAPE we obtain for each HOBO log-gers installed in the Wave Block canyon, the Masdar Wind ToweWeather Station, and the Masdar Field Station. In this table, it is
possible to notice that all HOBO loggers are in good agreement forboth temperature and relative humidity. On the other hand, mea-surements obtained from the Masdar Wind Tower Weather Stationand the Masdar Field Station are significantly different from the08/21 08/22 08/23
20
30
40
50
60
70
Rel
ativ
e h
um
idit
y [%
]
(solid), the Masdar Wind Tower Weather Station (dashed), and the 6 HOBO loggers1st and 23rd 2011.
08/28 08/29
ower Weather Station (dashed), and the 6 HOBO loggers in the Wave Block canyon
M. Martin et al. / Energy and Buildings 96 (2015) 221–235 227
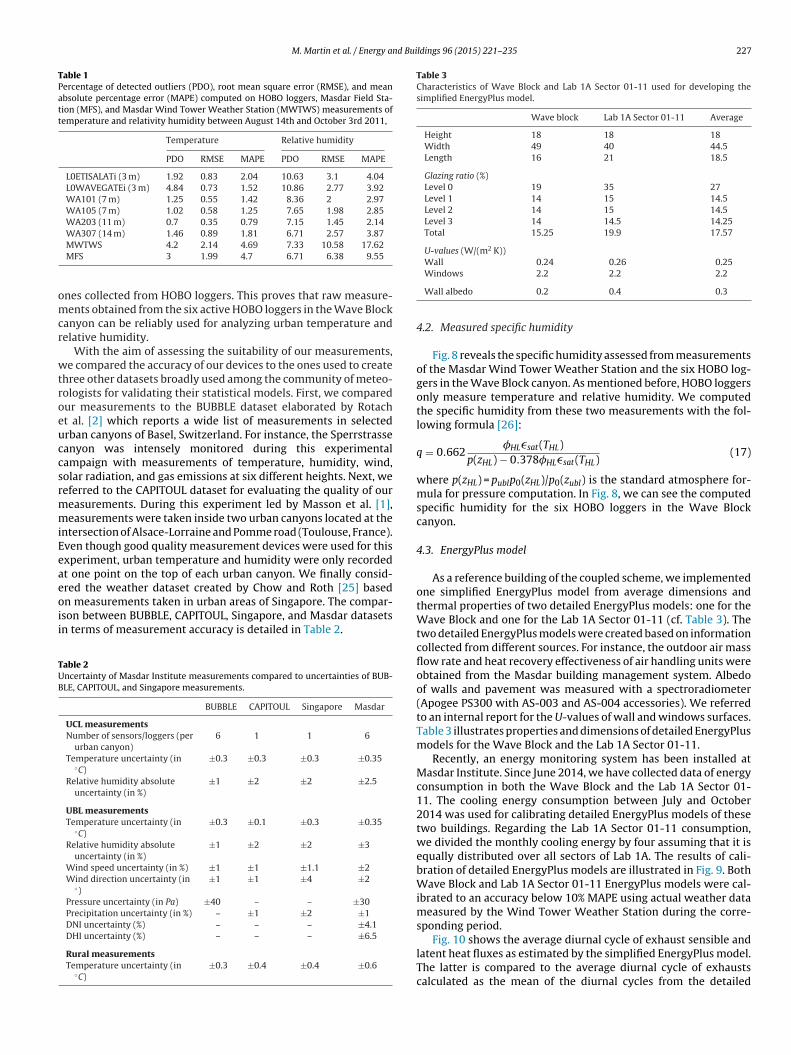
Table 1Percentage of detected outliers (PDO), root mean square error (RMSE), and meanabsolute percentage error (MAPE) computed on HOBO loggers, Masdar Field Sta-tion (MFS), and Masdar Wind Tower Weather Station (MWTWS) measurements oftemperature and relativity humidity between August 14th and October 3rd 2011,
Temperature Relative humidity
PDO RMSE MAPE PDO RMSE MAPE
L0ETISALATi (3 m) 1.92 0.83 2.04 10.63 3.1 4.04L0WAVEGATEi (3 m) 4.84 0.73 1.52 10.86 2.77 3.92WA101 (7 m) 1.25 0.55 1.42 8.36 2 2.97WA105 (7 m) 1.02 0.58 1.25 7.65 1.98 2.85WA203 (11 m) 0.7 0.35 0.79 7.15 1.45 2.14WA307 (14 m) 1.46 0.89 1.81 6.71 2.57 3.87
omcr
wtroeuccsrmmiEeaeoii
TUB
Table 3Characteristics of Wave Block and Lab 1A Sector 01-11 used for developing thesimplified EnergyPlus model.
Wave block Lab 1A Sector 01-11 Average
Height 18 18 18Width 49 40 44.5Length 16 21 18.5
Glazing ratio (%)Level 0 19 35 27Level 1 14 15 14.5Level 2 14 15 14.5Level 3 14 14.5 14.25Total 15.25 19.9 17.57
U-values (W/(m2 K))Wall 0.24 0.26 0.25
MWTWS 4.2 2.14 4.69 7.33 10.58 17.62MFS 3 1.99 4.7 6.71 6.38 9.55
nes collected from HOBO loggers. This proves that raw measure-ents obtained from the six active HOBO loggers in the Wave Block
anyon can be reliably used for analyzing urban temperature andelative humidity.
With the aim of assessing the suitability of our measurements,e compared the accuracy of our devices to the ones used to create
hree other datasets broadly used among the community of meteo-ologists for validating their statistical models. First, we comparedur measurements to the BUBBLE dataset elaborated by Rotacht al. [2] which reports a wide list of measurements in selectedrban canyons of Basel, Switzerland. For instance, the Sperrstrasseanyon was intensely monitored during this experimentalampaign with measurements of temperature, humidity, wind,olar radiation, and gas emissions at six different heights. Next, weeferred to the CAPITOUL dataset for evaluating the quality of oureasurements. During this experiment led by Masson et al. [1],easurements were taken inside two urban canyons located at the
ntersection of Alsace-Lorraine and Pomme road (Toulouse, France).ven though good quality measurement devices were used for thisxperiment, urban temperature and humidity were only recordedt one point on the top of each urban canyon. We finally consid-red the weather dataset created by Chow and Roth [25] based
n measurements taken in urban areas of Singapore. The compar-son between BUBBLE, CAPITOUL, Singapore, and Masdar datasetsn terms of measurement accuracy is detailed in Table 2.able 2ncertainty of Masdar Institute measurements compared to uncertainties of BUB-LE, CAPITOUL, and Singapore measurements.
BUBBLE CAPITOUL Singapore Masdar
UCL measurementsNumber of sensors/loggers (per
urban canyon)6 1 1 6
Temperature uncertainty (in◦C)
±0.3 ±0.3 ±0.3 ±0.35
Relative humidity absoluteuncertainty (in %)
±1 ±2 ±2 ±2.5
UBL measurementsTemperature uncertainty (in
◦C)±0.3 ±0.1 ±0.3 ±0.35
Relative humidity absoluteuncertainty (in %)
±1 ±2 ±2 ±3
Wind speed uncertainty (in %) ±1 ±1 ±1.1 ±2Wind direction uncertainty (in
◦)±1 ±1 ±4 ±2
Pressure uncertainty (in Pa) ±40 – – ±30Precipitation uncertainty (in %) – ±1 ±2 ±1DNI uncertainty (%) – – – ±4.1DHI uncertainty (%) – – – ±6.5
Rural measurementsTemperature uncertainty (in
◦C)±0.3 ±0.4 ±0.4 ±0.6
Windows 2.2 2.2 2.2
Wall albedo 0.2 0.4 0.3
4.2. Measured specific humidity
Fig. 8 reveals the specific humidity assessed from measurementsof the Masdar Wind Tower Weather Station and the six HOBO log-gers in the Wave Block canyon. As mentioned before, HOBO loggersonly measure temperature and relative humidity. We computedthe specific humidity from these two measurements with the fol-lowing formula [26]:
q = 0.662�HL�sat(THL)
p(zHL) − 0.378�HL�sat(THL)(17)
where p(zHL) = publp0(zHL)/p0(zubl) is the standard atmosphere for-mula for pressure computation. In Fig. 8, we can see the computedspecific humidity for the six HOBO loggers in the Wave Blockcanyon.
4.3. EnergyPlus model
As a reference building of the coupled scheme, we implementedone simplified EnergyPlus model from average dimensions andthermal properties of two detailed EnergyPlus models: one for theWave Block and one for the Lab 1A Sector 01-11 (cf. Table 3). Thetwo detailed EnergyPlus models were created based on informationcollected from different sources. For instance, the outdoor air massflow rate and heat recovery effectiveness of air handling units wereobtained from the Masdar building management system. Albedoof walls and pavement was measured with a spectroradiometer(Apogee PS300 with AS-003 and AS-004 accessories). We referredto an internal report for the U-values of wall and windows surfaces.Table 3 illustrates properties and dimensions of detailed EnergyPlusmodels for the Wave Block and the Lab 1A Sector 01-11.
Recently, an energy monitoring system has been installed atMasdar Institute. Since June 2014, we have collected data of energyconsumption in both the Wave Block and the Lab 1A Sector 01-11. The cooling energy consumption between July and October2014 was used for calibrating detailed EnergyPlus models of thesetwo buildings. Regarding the Lab 1A Sector 01-11 consumption,we divided the monthly cooling energy by four assuming that it isequally distributed over all sectors of Lab 1A. The results of cali-bration of detailed EnergyPlus models are illustrated in Fig. 9. BothWave Block and Lab 1A Sector 01-11 EnergyPlus models were cal-ibrated to an accuracy below 10% MAPE using actual weather datameasured by the Wind Tower Weather Station during the corre-sponding period.
Fig. 10 shows the average diurnal cycle of exhaust sensible andlatent heat fluxes as estimated by the simplified EnergyPlus model.The latter is compared to the average diurnal cycle of exhaustscalculated as the mean of the diurnal cycles from the detailed

228 M. Martin et al. / Energy and Buildings 96 (2015) 221–235
Jul. Aug. Sept. Oct.0
5
10
15
20
25
30
35
40
45
50
Co
olin
g E
ner
gy
Co
nsu
mp
tio
n [
MW
h]
Jul. Aug. Sept. Oct.0
10
20
30
40
50
60
Co
olin
g E
ner
gy
Co
nsu
mp
tio
n [
MW
h]
Fig. 9. Measured cooling energy consumption (bars) compared to the one estimated (das01-11 (right).
5 10 15 2010
15
20
25
30
35
Hours
Exh
aust
Air
Sen
sib
le R
ate
[kW
h]
5 10 15 205
10
15
20
25
30
35
40
45
Hours
Exh
aust
Air
Lat
ent
Rat
e [k
Wh
]
Fig. 10. Comparison between sensible and latent heat rates coming from exhaustsae
EAwtrs
Fs
for estimating temperature and specific humidity in the Wave Blockcanyon with the coupled scheme.
Table 4Coupled-scheme parameters we used for estimating urban temperature and specifichumidity in the Wave Block canyon.
Location Masdar City (Latitude: 24.43◦; Longitude: 54.61◦)
ir approximated by the simplified EnergyPlus model (dashed) and the average onesstimated by the detailed EnergyPlus models of Wave Block and Lab. 1A (solid).
nergyPlus models for the Wave Block and Lab 1A Sector 01-11.fter making a few adjustments in the simplified EnergyPlus model,e reached an accuracy of 0.8% and 7.5% MAPE in the approxima-
ion of the average diurnal cycle of sensible and latent exhausts,espectively, assessed from detailed EnergyPlus models. A repre-
entation of the simplified EnergyPlus model is shown in Fig. 11.ig. 11. Representation of simplified building used for validation of the coupled-cheme.
hed) from the detailed EnergyPlus model of the Wave Block (left) and Lab 1A Sector
4.4. Invariant parameters of the coupled scheme
In addition to characteristics of the reference building (i.e. thesimplified EnergyPlus model), the coupled scheme also requiressome information regarding the street surface. For example, theroad-to-ground and the ground-to-vegetation ratios are among theinvariant parameters that the developed coupled scheme requiresfor running a simulation. They were computed by measuring thetotal surface area of ground and vegetation that covers the WaveBlock canyon. Because the ground soil is entirely sand, we took thevalues mentioned in McCumber and Pielke [27] to defined watercontent parameters. Precipitation coming from the irrigation sys-tem was estimated by simulation of the water content in the WaveBlock canyon. Table 4 summarizes all invariant parameters we used
Simulation time-step 3600 sSimulation period 05/29 – 12/31 (2011)
StreetWidth 8 mRoad d = 0.75 m; �cp = 1.4 × 10⁶ J/(m3 K);(= 89% of street area) = 0.4; ε = 0.95Ground soil d = 0.5 m; �cp = 1.2 × 10⁶ J/(m3 K);(= 11% of street area) = 0.1; ε = 0.8
Water content (Sand) - ωsat = 0.395 m3/m3; sat = −0.121 m; Ksat = 1.76 × 10⁻⁴ m/s; b = 4.03Vegetation (= 50% of ground surface) - = 0.15
Irrigation system Ig = 1.5 × 10⁻³ kg/(m2 s)(Schedule: nighttime)
Reference buildingHeight 18 mLength 18.5 mWidth 44.5 mNumber of floors 1 (i.e. 4 floors treated as one)Orientation from North 37◦
Walls = 0.3; k = 0.25 W/(m2 K)West and East windows = 0.08; k = 2.2 W/(m2 K)(= 17.5% of facade area)Thermostat 24 ◦CIdeal cooling system mmv = 4 m3/s; �T = 41%; �q = 18%(Schedule: always on)

M. Martin et al. / Energy and Buildings 96 (2015) 221–235 229
F ns froe
5
rd
D
�
womtaae
R
H
5
maTtdtacui
ig. 12. Squared deviation (left) and RMSH (right) for urban temperature estimatioxhaust and wind tower air ratios.
. Results
The average diurnal cycle Dx of time series x = {xt}Tt=1 may beepresented by the set of average values �h(x) and the standardeviations h(x) at each hour h of a day, i.e:
¯ x = {< �h(x), h(x) > ∀h ∈ {1, ..., 24}} (18)
h(x) = 1n(Xh)
∑xh∈Xh
xh (19)
h(x) =√
1n(Xh)
∑xh∈Xh
(xh − �h(x))2 (20)
here Xh is the set of values of x at hour h. In this study, we devel-ped a distance between two average diurnal cycles based on theetric of Hellinger [28]. The Hellinger distance for normal distribu-
ions is very convenient because it is defined in terms of the meannd the standard deviation. To express a distance between the aver-ged diurnal cycles Dx and Dy, we computed the Root Mean Squarerror of Hellinger (RMSH) distances H2
h(x, y) at each hour h:
MSH(Dx, Dy) =
√√√√ 124
24∑h=1
H2h
(x, y) (21)
2h (x, y) = 1 −
√2h(x)h(y)
2h
(x) + 2h
(y)
× e−1/4(�h(x) − �h(y))2/2h (x) + 2
h (y) (22)
.1. Likelihood of heat ratios
The accuracy of urban temperature and specific humidity esti-ations was computed over exhaust heat ratios ıex between 0%
nd 200%, and wind tower heat ratios ıwt between 0% and 100%.he upper bound of 200% for the exhaust heat ratio ıex correspondso the theoretical limit when all the heat released by the air han-ling unit through exhaust risers comes from both the right andhe left building of the urban canyon. In practice, the two ratios ıex
nd ıwt are difficult to measure. For this reason, we first decided toalculate the mean value and the average diurnal cycle of estimatedrban temperature and specific humidity over the widest theoret-
cal range of ıwt and ıex. Then, we fixed a threshold of tolerance
m August 14th 2011 at 1:00 am to October 3rd at 12:00 am UTC +4 as function of
for the squared deviation between measured and estimated aver-age temperature and specific humidity over the period of study.A threshold of tolerance was also defined for the RMSH betweenmeasured and approximated average diurnal cycles. Finally, wedefined the most likely range of heat ratios as the restricted rangeof ıwt and ıex under which urban temperature and specific humid-ity estimated by the coupled scheme satisfies the thresholds oftolerance.
According to the U.S. EPA [29], the peak demand for urban elec-tricity rises between 1.5% and 2% for every 0.6 ◦C increase of theaverage outdoor temperature. Due to the fact that the interest inusing a coupled scheme is also to provide an accurate approxima-tion of the energy consumption in a building, we considered thevalue of 0.36 ◦C as threshold of tolerance for the Squared Devia-tion (D2) between the measured and the estimated average urbantemperature over the period of study. The value of 0.25 has beenempirically chosen as threshold of the tolerance for the estimatedaverage diurnal cycles of urban temperature.
Fig. 12 shows the D2 between the measured and the estimatedaverage urban temperature over the period of study. This figure alsoillustrates the RMSH between average diurnal cycles for urban tem-perature assessed from the coupled scheme and measurements.According to these two metrics, the estimated urban temperaturesdo not satisfy the threshold of tolerance for all values of ıwt lowerthan 10% and higher than 25%. To achieve the threshold of tolerancefor both D2 and RMSH when ıwt varies between 10% and 25%, ıex
must be between 35% and 40% (Fig. 13).After computing the accuracy of estimated urban temperature
in terms of D2 and RMSH over several values of ıex and ıwt, we per-formed the same analysis with the specific humidity. As a thresholdof tolerance for D2 between the measured and the estimatedaverage urban specific humidity, we took the value of 3 mg/kg.According to Ihara et al. [30], the sensitivity of electricity con-sumption to specific humidity is between 0.6 and 0.9 W/(m2 g/kg).Consequently, the threshold of tolerance we chose for specifichumidity potentially allows us to limit the estimation error in elec-tricity consumption to 1.53 W/m2. Regarding the RMSH betweenmeasured and estimated average diurnal cycle for specific humid-ity, we employed the same tolerance threshold we defined fortemperature.
As illustrated in Fig. 13, estimated urban specific humidity by2
the coupled scheme satisfies thresholds of tolerance for D andRMSH for all ıex lower than 45% and ıwt between 10% and 25%.Based on this outcome and the previous ones, we conclude that themost likely range of heat ratios according to the coupled scheme is
230 M. Martin et al. / Energy and Buildings 96 (2015) 221–235
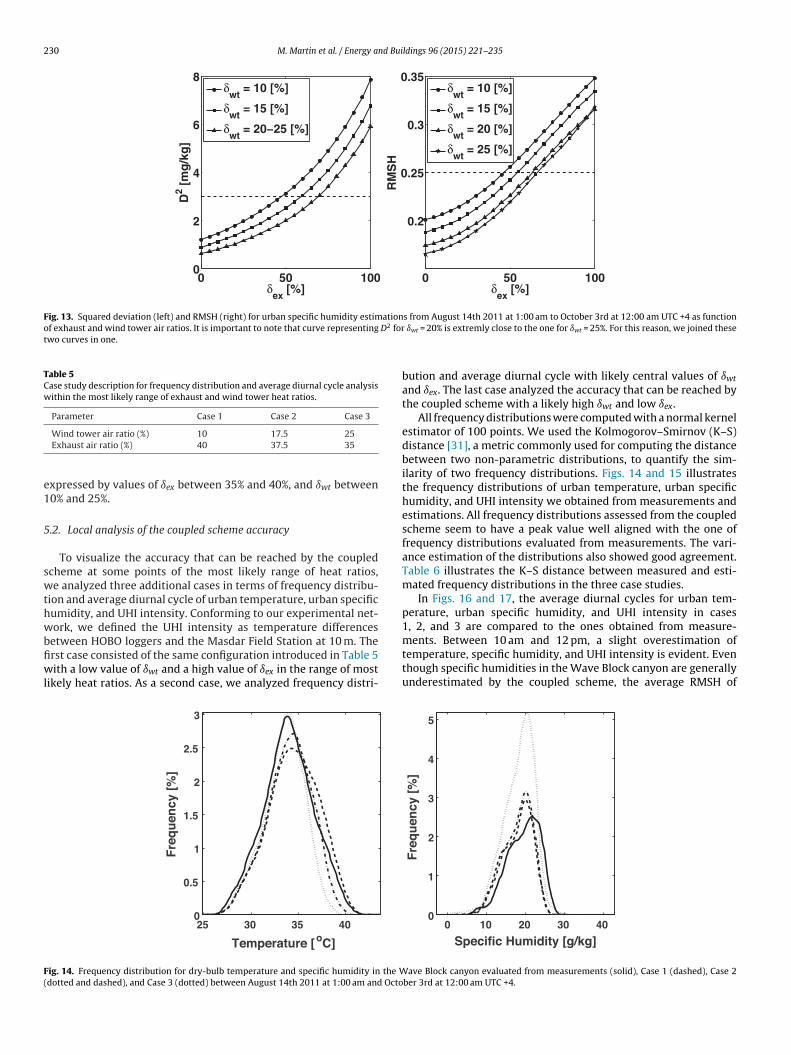
Fig. 13. Squared deviation (left) and RMSH (right) for urban specific humidity estimations from August 14th 2011 at 1:00 am to October 3rd at 12:00 am UTC +4 as functionof exhaust and wind tower air ratios. It is important to note that curve representing D2 fortwo curves in one.
Table 5Case study description for frequency distribution and average diurnal cycle analysiswithin the most likely range of exhaust and wind tower heat ratios.
Parameter Case 1 Case 2 Case 3
e1
5
swthwbfiwl
F(
Wind tower air ratio (%) 10 17.5 25Exhaust air ratio (%) 40 37.5 35
xpressed by values of ıex between 35% and 40%, and ıwt between0% and 25%.
.2. Local analysis of the coupled scheme accuracy
To visualize the accuracy that can be reached by the coupledcheme at some points of the most likely range of heat ratios,e analyzed three additional cases in terms of frequency distribu-
ion and average diurnal cycle of urban temperature, urban specificumidity, and UHI intensity. Conforming to our experimental net-ork, we defined the UHI intensity as temperature differences
etween HOBO loggers and the Masdar Field Station at 10 m. Therst case consisted of the same configuration introduced in Table 5ith a low value of ıwt and a high value of ıex in the range of most
ikely heat ratios. As a second case, we analyzed frequency distri-
25 30 35 400
0.5
1
1.5
2
2.5
3
Temperature [oC]
Fre
qu
ency
[%
]
ig. 14. Frequency distribution for dry-bulb temperature and specific humidity in the Wdotted and dashed), and Case 3 (dotted) between August 14th 2011 at 1:00 am and Octo
ıwt = 20% is extremly close to the one for ıwt = 25%. For this reason, we joined these
bution and average diurnal cycle with likely central values of ıwt
and ıex. The last case analyzed the accuracy that can be reached bythe coupled scheme with a likely high ıwt and low ıex.
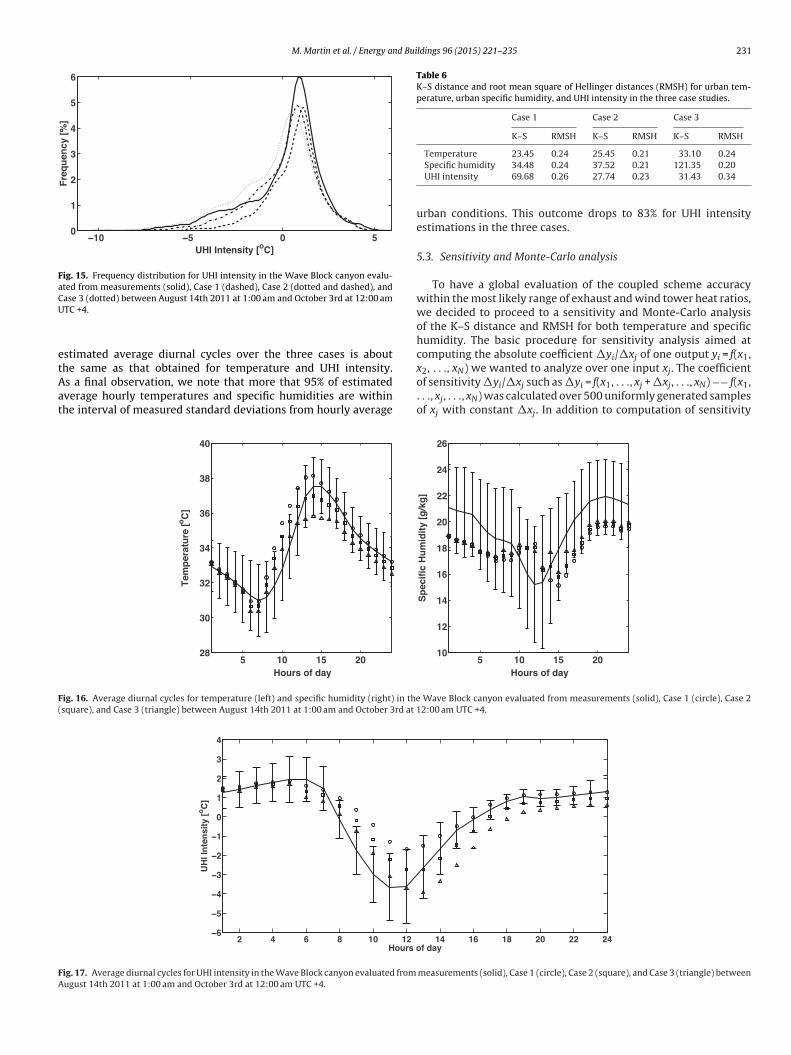
All frequency distributions were computed with a normal kernelestimator of 100 points. We used the Kolmogorov–Smirnov (K–S)distance [31], a metric commonly used for computing the distancebetween two non-parametric distributions, to quantify the sim-ilarity of two frequency distributions. Figs. 14 and 15 illustratesthe frequency distributions of urban temperature, urban specifichumidity, and UHI intensity we obtained from measurements andestimations. All frequency distributions assessed from the coupledscheme seem to have a peak value well aligned with the one offrequency distributions evaluated from measurements. The vari-ance estimation of the distributions also showed good agreement.Table 6 illustrates the K–S distance between measured and esti-mated frequency distributions in the three case studies.
In Figs. 16 and 17, the average diurnal cycles for urban tem-perature, urban specific humidity, and UHI intensity in cases1, 2, and 3 are compared to the ones obtained from measure-
ments. Between 10 am and 12 pm, a slight overestimation oftemperature, specific humidity, and UHI intensity is evident. Eventhough specific humidities in the Wave Block canyon are generallyunderestimated by the coupled scheme, the average RMSH of0 10 20 30 400
1
2
3
4
5
Specific Humidity [g/kg]
Fre
qu
ency
[%
]
ave Block canyon evaluated from measurements (solid), Case 1 (dashed), Case 2ber 3rd at 12:00 am UTC +4.
M. Martin et al. / Energy and Buildings 96 (2015) 221–235 231
−10 −5 0 50
1
2
3
4
5
6
UHI Intensity [oC]
Fre
qu
ency
[%
]
Fig. 15. Frequency distribution for UHI intensity in the Wave Block canyon evalu-ated from measurements (solid), Case 1 (dashed), Case 2 (dotted and dashed), andCU
etAat
Table 6K–S distance and root mean square of Hellinger distances (RMSH) for urban tem-perature, urban specific humidity, and UHI intensity in the three case studies.
Case 1 Case 2 Case 3
K–S RMSH K–S RMSH K–S RMSH
Temperature 23.45 0.24 25.45 0.21 33.10 0.24
x2, . . ., xN) we wanted to analyze over one input xj. The coefficient
F(
FA
ase 3 (dotted) between August 14th 2011 at 1:00 am and October 3rd at 12:00 amTC +4.
stimated average diurnal cycles over the three cases is abouthe same as that obtained for temperature and UHI intensity.
s a final observation, we note that more that 95% of estimatedverage hourly temperatures and specific humidities are withinhe interval of measured standard deviations from hourly average5 10 15 2028
30
32
34
36
38
40
Hours of day
Tem
per
atu
re [o
C]
ig. 16. Average diurnal cycles for temperature (left) and specific humidity (right) in thesquare), and Case 3 (triangle) between August 14th 2011 at 1:00 am and October 3rd at 1
2 4 6 8 10 12−6
−5
−4
−3
−2
−1
0
1
2
3
4
Hours o
UH
I In
ten
sity
[oC
]
ig. 17. Average diurnal cycles for UHI intensity in the Wave Block canyon evaluated from
ugust 14th 2011 at 1:00 am and October 3rd at 12:00 am UTC +4.
Specific humidity 34.48 0.24 37.52 0.21 121.35 0.20UHI intensity 69.68 0.26 27.74 0.23 31.43 0.34
urban conditions. This outcome drops to 83% for UHI intensityestimations in the three cases.
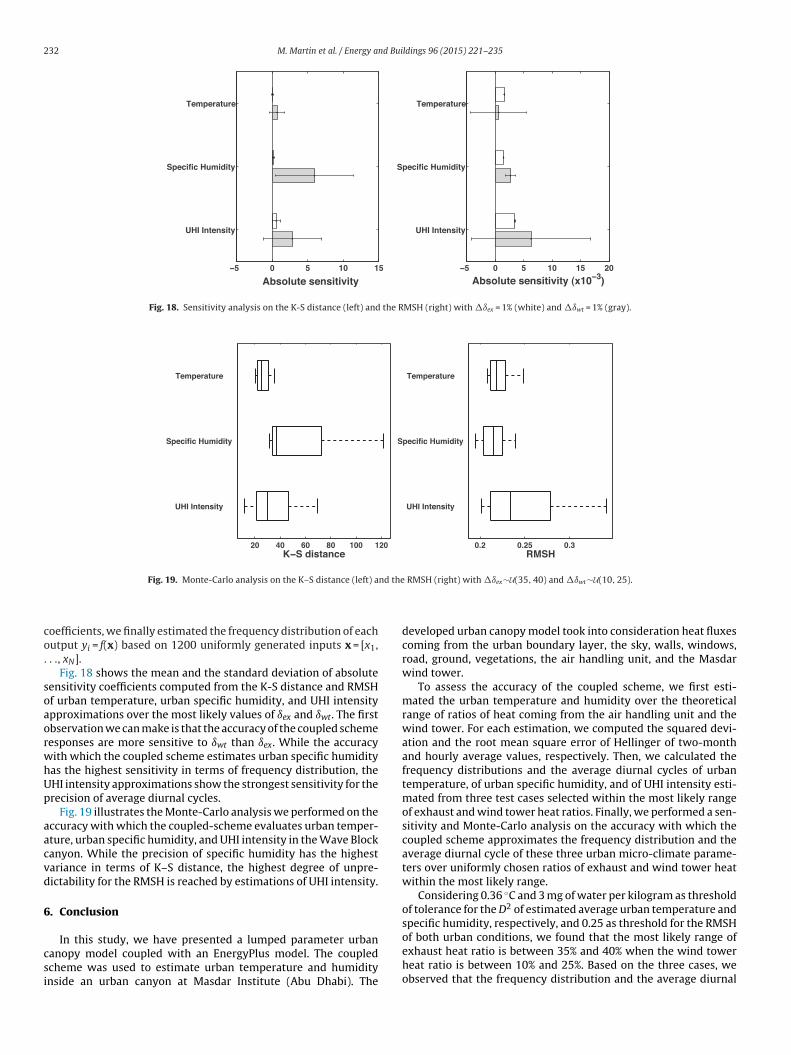
5.3. Sensitivity and Monte-Carlo analysis
To have a global evaluation of the coupled scheme accuracywithin the most likely range of exhaust and wind tower heat ratios,we decided to proceed to a sensitivity and Monte-Carlo analysisof the K–S distance and RMSH for both temperature and specifichumidity. The basic procedure for sensitivity analysis aimed atcomputing the absolute coefficient yi/ xj of one output yi = f(x1,
of sensitivity yi/ xj such as yi = f(x1, . . ., xj + xj, . . ., xN) −− f(x1,. . ., xj, . . ., xN) was calculated over 500 uniformly generated samplesof xj with constant xj. In addition to computation of sensitivity
5 10 15 2010
12
14
16
18
20
22
24
26
Hours of day
Sp
ecif
ic H
um
idit
y [g
/kg
]
Wave Block canyon evaluated from measurements (solid), Case 1 (circle), Case 22:00 am UTC +4.
14 16 18 20 22 24f day
measurements (solid), Case 1 (circle), Case 2 (square), and Case 3 (triangle) between
232 M. Martin et al. / Energy and Buildings 96 (2015) 221–235
Temperature
Specific Humidity
UHI Intensity
−5 0 5 10 15
Absolute sensitivity
Temperature
Specific Humidity
UHI Intensity
−5 0 5 10 15 20
Absolute sensitivity (x10−3)
Fig. 18. Sensitivity analysis on the K-S distance (left) and the RMSH (right) with ıex = 1% (white) and ıwt = 1% (gray).
20 40 60 80 100 120
UHI Intensity
Specific Humidity
Temperature
K−S distance0.2 0.25 0.3
UHI Intensity
Specific Humidity
Temperature
RMS H
nd the
co.
soaorwhUp
aacvd
6
csi
Fig. 19. Monte-Carlo analysis on the K–S distance (left) a
oefficients, we finally estimated the frequency distribution of eachutput yi = f(x) based on 1200 uniformly generated inputs x = [x1,
. ., xN].Fig. 18 shows the mean and the standard deviation of absolute
ensitivity coefficients computed from the K-S distance and RMSHf urban temperature, urban specific humidity, and UHI intensitypproximations over the most likely values of ıex and ıwt. The firstbservation we can make is that the accuracy of the coupled schemeesponses are more sensitive to ıwt than ıex. While the accuracyith which the coupled scheme estimates urban specific humidityas the highest sensitivity in terms of frequency distribution, theHI intensity approximations show the strongest sensitivity for therecision of average diurnal cycles.
Fig. 19 illustrates the Monte-Carlo analysis we performed on theccuracy with which the coupled-scheme evaluates urban temper-ture, urban specific humidity, and UHI intensity in the Wave Blockanyon. While the precision of specific humidity has the highestariance in terms of K–S distance, the highest degree of unpre-ictability for the RMSH is reached by estimations of UHI intensity.
. Conclusion
In this study, we have presented a lumped parameter urbananopy model coupled with an EnergyPlus model. The coupledcheme was used to estimate urban temperature and humiditynside an urban canyon at Masdar Institute (Abu Dhabi). The
RMSH (right) with ıex∼U(35, 40) and ıwt∼U(10, 25).
developed urban canopy model took into consideration heat fluxescoming from the urban boundary layer, the sky, walls, windows,road, ground, vegetations, the air handling unit, and the Masdarwind tower.
To assess the accuracy of the coupled scheme, we first esti-mated the urban temperature and humidity over the theoreticalrange of ratios of heat coming from the air handling unit and thewind tower. For each estimation, we computed the squared devi-ation and the root mean square error of Hellinger of two-monthand hourly average values, respectively. Then, we calculated thefrequency distributions and the average diurnal cycles of urbantemperature, of urban specific humidity, and of UHI intensity esti-mated from three test cases selected within the most likely rangeof exhaust and wind tower heat ratios. Finally, we performed a sen-sitivity and Monte-Carlo analysis on the accuracy with which thecoupled scheme approximates the frequency distribution and theaverage diurnal cycle of these three urban micro-climate parame-ters over uniformly chosen ratios of exhaust and wind tower heatwithin the most likely range.
Considering 0.36 ◦C and 3 mg of water per kilogram as thresholdof tolerance for the D2 of estimated average urban temperature andspecific humidity, respectively, and 0.25 as threshold for the RMSH
of both urban conditions, we found that the most likely range ofexhaust heat ratio is between 35% and 40% when the wind towerheat ratio is between 10% and 25%. Based on the three cases, weobserved that the frequency distribution and the average diurnal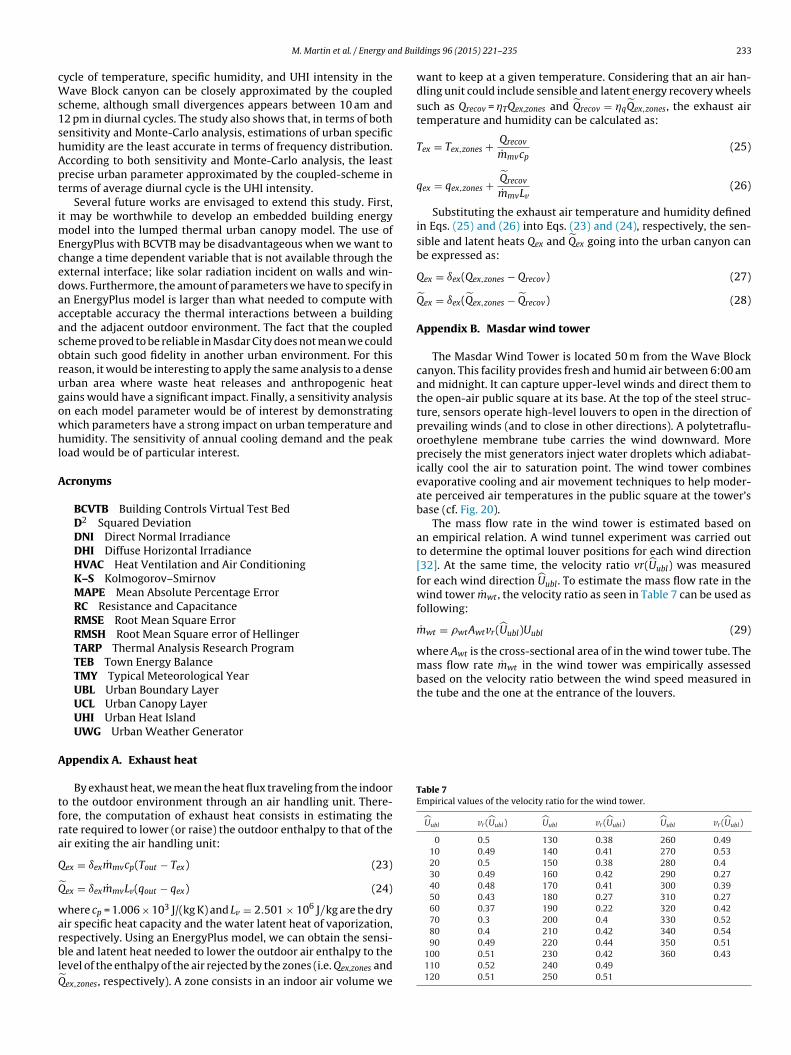
nd Bui
cWs1shApt
imEcedaaasorugowhl
A
A
tfra
Q
Q
warblQ
the tube and the one at the entrance of the louvers.
Table 7Empirical values of the velocity ratio for the wind tower.
Uubl vr (Uubl) Uubl vr (Uubl) Uubl vr (Uubl)
0 0.5 130 0.38 260 0.4910 0.49 140 0.41 270 0.5320 0.5 150 0.38 280 0.430 0.49 160 0.42 290 0.2740 0.48 170 0.41 300 0.3950 0.43 180 0.27 310 0.2760 0.37 190 0.22 320 0.4270 0.3 200 0.4 330 0.5280 0.4 210 0.42 340 0.54
M. Martin et al. / Energy a
ycle of temperature, specific humidity, and UHI intensity in theave Block canyon can be closely approximated by the coupled
cheme, although small divergences appears between 10 am and2 pm in diurnal cycles. The study also shows that, in terms of bothensitivity and Monte-Carlo analysis, estimations of urban specificumidity are the least accurate in terms of frequency distribution.ccording to both sensitivity and Monte-Carlo analysis, the leastrecise urban parameter approximated by the coupled-scheme inerms of average diurnal cycle is the UHI intensity.
Several future works are envisaged to extend this study. First,t may be worthwhile to develop an embedded building energy
odel into the lumped thermal urban canopy model. The use ofnergyPlus with BCVTB may be disadvantageous when we want tohange a time dependent variable that is not available through thexternal interface; like solar radiation incident on walls and win-ows. Furthermore, the amount of parameters we have to specify inn EnergyPlus model is larger than what needed to compute withcceptable accuracy the thermal interactions between a buildingnd the adjacent outdoor environment. The fact that the coupledcheme proved to be reliable in Masdar City does not mean we couldbtain such good fidelity in another urban environment. For thiseason, it would be interesting to apply the same analysis to a denserban area where waste heat releases and anthropogenic heatains would have a significant impact. Finally, a sensitivity analysisn each model parameter would be of interest by demonstratinghich parameters have a strong impact on urban temperature andumidity. The sensitivity of annual cooling demand and the peak
oad would be of particular interest.
cronyms
BCVTB Building Controls Virtual Test BedD2 Squared DeviationDNI Direct Normal IrradianceDHI Diffuse Horizontal IrradianceHVAC Heat Ventilation and Air ConditioningK–S Kolmogorov–SmirnovMAPE Mean Absolute Percentage ErrorRC Resistance and CapacitanceRMSE Root Mean Square ErrorRMSH Root Mean Square error of HellingerTARP Thermal Analysis Research ProgramTEB Town Energy BalanceTMY Typical Meteorological YearUBL Urban Boundary LayerUCL Urban Canopy LayerUHI Urban Heat IslandUWG Urban Weather Generator
ppendix A. Exhaust heat
By exhaust heat, we mean the heat flux traveling from the indooro the outdoor environment through an air handling unit. There-ore, the computation of exhaust heat consists in estimating theate required to lower (or raise) the outdoor enthalpy to that of their exiting the air handling unit:
ex = ıexmmvcp(Tout − Tex) (23)˜ex = ıexmmvLv(qout − qex) (24)
here cp = 1.006 × 10³ J/(kg K) and Lv = 2.501 × 10⁶ J/kg are the dryir specific heat capacity and the water latent heat of vaporization,
espectively. Using an EnergyPlus model, we can obtain the sensi-le and latent heat needed to lower the outdoor air enthalpy to theevel of the enthalpy of the air rejected by the zones (i.e. Qex,zones and˜ex,zones, respectively). A zone consists in an indoor air volume we
ldings 96 (2015) 221–235 233
want to keep at a given temperature. Considering that an air han-dling unit could include sensible and latent energy recovery wheelssuch as Qrecov = �TQex,zones and Qrecov = �qQex,zones, the exhaust airtemperature and humidity can be calculated as:
Tex = Tex,zones + Qrecovmmvcp
(25)
qex = qex,zones + QrecovmmvLv
(26)
Substituting the exhaust air temperature and humidity definedin Eqs. (25) and (26) into Eqs. (23) and (24), respectively, the sen-sible and latent heats Qex and Qex going into the urban canyon canbe expressed as:
Qex = ıex(Qex,zones − Qrecov) (27)
Qex = ıex(Qex,zones − Qrecov) (28)
Appendix B. Masdar wind tower
The Masdar Wind Tower is located 50 m from the Wave Blockcanyon. This facility provides fresh and humid air between 6:00 amand midnight. It can capture upper-level winds and direct them tothe open-air public square at its base. At the top of the steel struc-ture, sensors operate high-level louvers to open in the direction ofprevailing winds (and to close in other directions). A polytetraflu-oroethylene membrane tube carries the wind downward. Moreprecisely the mist generators inject water droplets which adiabat-ically cool the air to saturation point. The wind tower combinesevaporative cooling and air movement techniques to help moder-ate perceived air temperatures in the public square at the tower’sbase (cf. Fig. 20).
The mass flow rate in the wind tower is estimated based onan empirical relation. A wind tunnel experiment was carried outto determine the optimal louver positions for each wind direction[32]. At the same time, the velocity ratio vr(Uubl) was measuredfor each wind direction Uubl . To estimate the mass flow rate in thewind tower mwt , the velocity ratio as seen in Table 7 can be used asfollowing:
mwt = �wtAwtvr(Uubl)Uubl (29)
where Awt is the cross-sectional area of in the wind tower tube. Themass flow rate mwt in the wind tower was empirically assessedbased on the velocity ratio between the wind speed measured in
90 0.49 220 0.44 350 0.51100 0.51 230 0.42 360 0.43110 0.52 240 0.49120 0.51 250 0.51

234 M. Martin et al. / Energy and Buildings 96 (2015) 221–235
Fig. 20. Masdar Institute wind tower with automatically controllable louvers (1) and mist jets (2).
Taas
Q
Q
wa
A
fe
R
[
[
[
[
[
[[
[
[
[
[[
[
[
[
[
[
Referring to the psychrometric chart, the output air temperaturewt was approximated by computing the temperature of moist airt 100 percent relative humidity with enthalpy equal to the inputir (at temperature Tubl and specific humidity qubl). Therefore, theensible and latent heat fluxes were defined as following:
wt = ıwtHwtmwtcp(Twt − Turb) (30)˜wt = ıwtHwtmwtLv(qwt − qurb) (31)
here Hwt is equal to one if the wind tower is running at hour h,nd zero otherwise.
ppendix C. Supplementary data
Supplementary data associated with this article can beound, in the online version, at http://dx.doi.org/10.1016/j.nbuild.2015.02.047.
eferences
[1] V. Masson, L. Gomes, G. Pigeon, C. Liousse, V. Pont, J.-P. Lagouarde, J. Voogt, J.Salmond, T.R. Oke, J. Hidalgo, et al., The canopy and aerosol particles interac-tions in Toulouse urban layer (CAPITOUL) experiment, Meteorol. Atmos. Phys.102 (3-4) (2008) 135–157.
[2] M.W. Rotach, R. Vogt, C. Bernhofer, E. Batchvarova, A. Christen, A. Clappier,B. Feddersen, S.E. Gryning, G. Martucci, H. Mayer, et al., BUBBLE – an urbanboundary layer meteorology project, Theor. Appl. Climatol. 81 (3-4) (2005)231–261.
[3] Y. Charabi, A. Bakhit, Assessment of the canopy urban heat island of a coastalarid tropical city: the case of Muscat, Oman, Atmos. Res. 101 (1) (2011)215–227.
[4] H.A. Nasrallah, A.J. Brazel, R.C. Balling, Analysis of the Kuwait City urban heatisland, Int. J. Climatol. 10 (4) (1990) 401–405.
[5] E. Jáuregui, A. Tejeda, Urban–rural humidity contrasts in Mexico City, Int. J.Climatol. 17 (2) (1997) 187–196.
[6] V. Masson, A physically-based scheme for the urban energy budget in atmo-spheric models, Bound.-Layer Meteorol. 94 (3) (2000) 357–397.
[7] A. Martilli, A. Clappier, M.W. Rotach, An urban surface exchange param-eterization for mesoscale models, Bound.-Layer Meteorol. 104 (2) (2002)
261–304.[8] H. Kusaka, F. Kimura, Thermal effects of urban canyon structure on thenocturnal heat island: numerical experiment using a mesoscale modelcoupled with an urban canopy model, J. Appl. Meteorol. 43 (12) (2004)1899–1910.
[
[
[9] W.A. Friess, K. Rakhshan, T.A. Hendawi, S. Tajerzadeh, Wall insulation measuresfor residential villas in Dubai: a case study in energy efficiency, Energy Build.44 (2012) 26–32.
10] A. Afshari, C. Nikolopoulou, M. Martin, Life-cycle analysis of building retrofitsat the urban scale – a case study in United Arab Emirates, Sustainability 6 (1)(2014) 453–473.
11] B. Bueno, L. Norford, G. Pigeon, R. Britter, Combining a detailed building energymodel with a physically-based urban canopy model, Bound.-Layer Meteorol.140 (3) (2011) 471–489.
12] D.B. Crawley, L.K. Lawrie, F.C. Winkelmann, W.F. Buhl, Y.J. Huang, C.O. Pedersen,R.K. Strand, R.J. Liesen, D.E. Fisher, M.J. Witte, et al., EnergyPlus: creating a new-generation building energy simulation program, Energy Build. 33 (4) (2001)319–331.
13] B. Bueno, L. Norford, G. Pigeon, R. Britter, A resistance–capacitance networkmodel for the analysis of the interactions between the energy performance ofbuildings and the urban climate, Build. Environ. 54 (2012) 116–125.
14] B. Bueno, R. Matthias, L. Norford, R. Li, Computationally efficient predictionof canopy level urban air temperature at the neighborhood, Urban Clim. 9 (0)(2014) 35–53.
15] M. Wetter, Building Control Virtual Testbed – BCVTB, 2009.16] US DOE, EnergyPlus engineering reference. The Reference to EnergyPlus Calcu-
lations, 2013.17] B. Bueno Unzeta, An urban weather generator coupling a building simulation
program with an urban canopy model, 2010.18] P. Mascart, J. Noilhan, H. Giordani, A modified parameterization of flux-
profile relationships in the surface layer using different roughness lengthvalues for heat and momentum, Bound.-Layer Meteorol. 72 (4) (1995)331–344.
19] C.S.B. Grimmond, T.R. Oke, Aerodynamic properties of urban areasderived from analysis of surface form, J. Appl. Meteorol. 38 (9) (1999)1262–1292.
20] G. Walton, TARP – Thermal Analysis Research Program, User Manual, 1984.21] B. Bueno Unzeta, Study and Prediction of the Energy Interactions Between
buildings and the Urban Climate, Massachusetts Institute of Technology, 2012,Ph.D. thesis.
22] J. Noilhan, J.-F. Mahfouf, The ISBA land surface parameterization scheme, Glob.Planet. Change 13 (1) (1996) 145–159.
23] J. Noilhan, S. Planton, A simple parameterization of land surface processes formeteorological models, Mon. Weather. Rev. 117 (3) (1989) 536–549.
24] D.P. Allen, A frequency domain Hampel filter for blind rejection of sinu-soidal interference from electromyograms, J. Neurosci. Methods 177 (2) (2009)303–310.
25] W.T.L. Chow, M. Roth, Temporal dynamics of the urban heat island of Singapore,Int. J. Climatol. 26 (15) (2006) 2243–2260.
26] J.M. Wallace, P.V. Hobbs, Atmospheric science: an introductory survey, vol. 92,Academic Press, 2006.
27] M.C. McCumber, R.A. Pielke, Simulation of the effects of surface fluxes of heatand moisture in a mesoscale numerical model: 1. Soil layer, J. Geophys. Res.:Oceans (1978–2012) 86 (C10) (1981) 9929–9938.
28] B.S. Everitt, The Cambridge Dictionary of Statistics, Cambridge, Cambridge,2002.

nd Bui
[
[
[31] Y. Rubner, C. Tomasi, L.J. Guibas, The earth mover’s distance as a metric for
M. Martin et al. / Energy a
29] EPA, Reducing Urban Heat Islands: Compendium of Strategies Urban
Heat Island Basics, 2009, available at http://www.epa.gov/hiri/resources/compendium.htm30] T. Ihara, Y. Genchi, T. Sato, K. Yamaguchi, Y. Endo, City-block-scale sensitiv-ity of electricity consumption to air temperature and air humidity in businessdistricts of Tokyo, japan, Energy 33 (11) (2008) 1634–1645.
[
ldings 96 (2015) 221–235 235
image retrieval, Int. J. Comput. Vis. 40 (2) (2000) 99–121.32] S. Carmichael, D. Philips, A. Belanger, A. Davies, MIST – wind tower controls
louver operation & mist release. Technical report, Rowan 42 Williams Davies& Irwin Inc., Canada, August 2009.