energy consumption and thermal performance of … consumption and thermal performance of typical...
TRANSCRIPT

Energy Consumption and Thermal Performance of Typical
Residential Buildings in Turkey
DISSERTATION
Approved by the
Faculty of Building (Civil engineering and Architecture) University of Dortmund
for the Degree of
Doctor of Science in Engineering
(Dr.-Ing.)
by
Umit Esiyok (Dipl.-Ing. Architect)
Dortmund, Germany, 2006

Date of submission: September 2006
Date of oral examination: 26.03.2007
Examination Committee:
Chairman: Prof. Dr.-Ing. Atilla Otes
1. Examiner: Prof. Dr.-Ing. Helmut F.O. Muller
2. Examiner: Prof. Dr.-Ing. AbuBakr S. Bahaj (University of Southampton, England)


Table of Contents
1. Introduction . . . . . . . . . . . . . . . . . . . . . . . . . . . . . . . . . . . . . . . . . . . . . . . . . . . . . . . . .1
1.1. Objectives of the work . . . . . . . . . . . . . . . . . . . . . . . . . . . . . . . . . . . . . . . . . . . . . 3
1.2. Structure and methodology . . . . . . . . . . . . . . . . . . . . . . . . . . . . . . . . . . . . . . . . 5
2. Energy sources in Turkey . . . . . . . . . . . . . . . . . . . . . . . . . . . . . . . . . . . . . . . . . . . . 8
2.1. Geographical characteristics of Turkey. . . . . . . . . . . . . . . . . . . . . . . . . . . . . . . . . 8
2.2. Energy sources and problems in Turkey . . . . . . . . . . . . . . . . . . . . . . . . . . . . . . . 9
3. Climate and climate classifications . . . . . . . . . . . . . . . . . . . . . . . . . . . . . . . . . . . . . . 17
3.1. Climate characteristics of Turkey . . . . . . . . . . . . . . . . . . . . . . . . . . . . . . . . . . . . 22
3.2. Climate classifications for building energy standards . . . . . . . . . . . . . . . . . . . . . 25
3.2.1. Climate classification used for
TS-825 (Turkish Standard-825) . . . . . . . . . . . . . . . . . . . . . . . . . . . . . . . . 25
3.2.2. Climate classification used for ASHRAE standards. . . . . . . . . . . . . . . . . . 27
3.2.3. New Turkish climate classification
according to the ASHRAE method . . . . . . . . . . . . . . . . . . . . . . . . . . . . . . 28
4. Building energy standards . . . . . . . . . . . . . . . . . . . . . . . . . . . . . . . . . . . . . . . . . . . . . 32
4.1. Building energy regulations in Turkey . . . . . . . . . . . . . . . . . . . . . . . . . . . . . . . . 33
4.2. Regulations in developed countries . . . . . . . . . . . . . . . . . . . . . . . . . . . . . . . . . . . 36
4.2.1. European Union (EU) . . . . . . . . . . . . . . . . . . . . . . . . . . . . . . . . . . . . . . . 36

ii
4.2.1.1.Building energy performance directive . . . . . . . . . . . . . . . . . . . . . . . 36
4.2.1.2.German regulations . . . . . . . . . . . . . . . . . . . . . . . . . . . . . . . . . . . . . . 38
4.2.1.3.Swedish, Norwegian and Danish Regulations . . . . . . . . . . . . . . . . . . 39
4.2.1.4.UK regulations . . . . . . . . . . . . . . . . . . . . . . . . . . . . . . . . . . . . . . . . . . 40
4.2.2. USA standards . . . . . . . . . . . . . . . . . . . . . . . . . . . . . . . . . . . . . . . . . . . . 41
4.2.3. Japanese and Korean regulations. . . . . . . . . . . . . . . . . . . . . . . . . . . . . . . . . 42
4.2.4. Other countries . . . . . . . . . . . . . . . . . . . . . . . . . . . . . . . . . . . . . . . . . . . . . 43
4.3. Conclusions and discussions . . . . . . . . . . . . . . . . . . . . . . . . . . . . . . . . . . . . . . . 45
5. Prefabricated residential building systems in some developed countries and
description of selected residential building systems in Turkey . . . . . . . . . . . . . . . 49
5.1. Prefabricated residential building technologies, passive and energy efficient
housing in developed countries. . . . . . . . . . . . . . . . . . . . . . . . . . . . . . . . . . . . . . 49
5.1.1 Energy efficient and passive housing approach . . . . . . . . . . . . . . . . . . . . . 49
5.1.2. Prefabricated residential buildings . . . . . . . . . . . . . . . . . . . . . . . . . . . . . . . 51
5.1.3. Prefabricated residential building in some developed countries . . . . . . . . 52
5.1.3.1. Germany. . . . . . . . . . . . . . . . . . . . . . . . . . . . . . . . . . . . . . . . . . . . . . 53
5.1.3.2. Japan. . . . . . . . . . . . . . . . . . . . . . . . . . . . . . . . . . . . . . . . . . . . . . . . 53
5.1.3.3. Scandinavia, Ireland . . . . . . . . . . . . . . . . . . . . . . . . . . . . . . . . . . . 56
5.1.3.4. Canada, USA. . . . . . . . . . . . . . . . . . . . . . . . . . . . . . . . . . . . . . . . . . 57
5.1.4. Integration of the renewable energies to residential buildings . . . . . . . . . . 57
5.2. Prefabricated residential building systems in Turkey. . . . . . . . . . . . . . . . . . . . . . 62

iii
5.1.1. Interlocking brick system . . . . . . . . . . . . . . . . . . . . . . . . . . . . . . . . . . . . . . 62
5.1.2. Lightweight steel system. . . . . . . . . . . . . . . . . . . . . . . . . . . . . . . . . . . . . . 63
5.1.3. Aerated concrete system . . . . . . . . . . . . . . . . . . . . . . . . . . . . . . . . . . . . . . 64
5.2. Traditional (Reinforced concrete) residential system . . . . . . . . . . . . . . . . . . . . . . 65
5.3. Conclusions and recommendations . . . . . . . . . . . . . . . . . . . . . . . . . . . . . . . . . . . 66
6. Energy analysis of the sample building systems in Turkey. . . . . . . . . . . . . . . . . 69
6.1. Methods . . . . . . . . . . . . . . . . . . . . . . . . . . . . . . . . . . . . . . . . . . . . . . . . . . . . . . . . 69
6.2. Climate characteristics of the selected cities . . . . . . . . . . . . . . . . . . . . . . . . . . . . 71
6.3. Building model . . . . . . . . . . . . . . . . . . . . . . . . . . . . . . . . . . . . . . . . . . . . . . . . . . 75
6.4. Strategies and assumptions for the simulations . . . . . . . . . . . . . . . . . . . . . . . . . . 76
6.5. Analysis of the simulation results . . . . . . . . . . . . . . . . . . . . . . . . . . . . . . . . . . . 82
6.5.1. Analysis of the results with regard to heating and
cooling energy loads . . . . . . . . . . . . . . . . . . . . . . . . . . . . . . . . . . . . . . . . 83
6.5.2. Analysis of the results with regard to zone temperatures
greater than 26°C for improved systems. . . . . . . . . . . . . . . . . . . . . . . . . . . 88
6.5.3. Analysis of the results with regard to zone temperatures for improved
systems on the two warmest day . . . . . . . . . . . . . . . . . . . . . . . . . . . . . . . . 91
6.5.4. Analysis of the results with regard to different
design strategies for improved systems . . . . . . . . . . . . . . . . . . . . . . . . . . . 98
6.5.4.1. Ventilation . . . . . . . . . . . . . . . . . . . . . . . . . . . . . . . . . . . . . . . . . . . . 98
6.5.4.2. Glazing variables . . . . . . . . . . . . . . . . . . . . . . . . . . . . . . . . . . . . . .102

iv
6.5.4.3. Thermal mass internal walls . . . . . . . . . . . . . . . . . . . . . . . . . . . . . 105
6.5.4.4. Shading. . . . . . . . . . . . . . . . . . . . . . . . . . . . . . . . . . . . . . . . . . . . . .107
6.5.4.5. Orientation . . . . . . . . . . . . . . . . . . . . . . . . . . . . . . . . . . . . . . . . . . 108
6.5.4.6. Insulation . . . . . . . . . . . . . . . . . . . . . . . . . . . . . . . . . . . . . . . . . . . .109
- Economic profitability of the insulation for
reinforced concrete systems. . . . . . . . . . . . . . . . . . . . . . . . . . . . . . . . . . 112
6.5.5. Summary of simulation results. . . . . . . . . . . . . . . . . . . . . . . . . . . . . . . . . . . . . . . 115
7. Conclusions and recommendations . . . . . . . . . . . . . . . . . . . . . . . . . . . . . . . . . . . 116
Literature and list of references . . . . . . . . . . . . . . . . . . . . . . . . . . . . . . . . . . . . . . . . . . 118
List of tables . . . . . . . . . . . . . . . . . . . . . . . . . . . . . . . . . . . . . . . . . . . . . . . . . . . . . . . . . . 122
List of figures . . . . . . . . . . . . . . . . . . . . . . . . . . . . . . . . . . . . . . . . . . . . . . . . . . . . . . . . . 123
Acknowledgements
Appendices

v
ABSTRACT
Turkey has a large energy potential for reducing CO2 emissions by energy consumption in
residential buildings, applying sustainable design strategies and renewable energies. Two
critical elements of building energy consumption are climate and building energy
standards, thus, a new detailed climate analysis of Turkey was prepared by using the
classification methods in ASHRAE transactions 4610-4611. A review of building energy
standards for selected countries allows for comparison with Turkey regarding standard
updates or preparation. Four typical residential building types from Turkey were selected
and analysed as to their energy consumption and thermal comfort, using the TRNSYS
simulation program. Three of the building types are pre-fabricated and one is realised in a
traditional building technology, which represents a significant number of dwellings in
Turkey. The thermal simulation of the building types was carried out for three different
climatic zones of Turkey: Hot, Moderate and Cold. The variation of design parameters
shows, that high energy savings can be achieved by basic design strategies, including
ventilation, orientation of large window areas with respect to solar heat gain, thermal
insulation of building envelope, and utilization of thermal mass. It is shown in a systematic
approach, how the thermal comfort and the energy performance for typical building s and
climatic zones of Turkey can be improved to a level, which is comparable with advanced
European standards of high comfort and low energy buildings. The remaining energy
demand can partly be provided by integrating renewable energy technologies in the
building such as solar thermal or photovoltaic panels.
Ümit Esiyok, September 2006

vi

Introduction 1
1. Introduction
Energy consumption, energy conservation and energy efficiency in buildings have been
important research areas for countries due to increasing energy demand, lack of the natural
sources caused by utilization of fossil fuel based energy sources and environmental issues
like the greenhouse effect, acid rain and ozone depletion. Energy consumption is partly
dependent on the weather, for example, in a cold year more energy is consumed to
maintain comfortable internal temperature than in a warmer year. However not only
climate characteristics but also buildings themselves have influence on energy use. A
building with a weak envelope doesn’t perform as well as a building with an energy
efficient envelope regarding energy use.
Energy consumption is the amount of fossil fuels, renewable fuels and electricity
consumed by end use sectors; industrial, residential, transport and service. One of the
largest sectors that consume a significant amount of total energy in the world is the
residential sector. For instance, in Europe the household and service sectors share 41% of
total energy consumption; transport and industry follow with 30% and 29% of total
demand respectively. In Turkey, the residential sector, placed in first place regarding
energy consumption, represented almost one third of total energy consumption in 1990 (28,
98 %-15358 Ktoe). In 2001 it decreased by 21,62 %,-18541 Ktoe, making the residential
sector second after the industrial sector, according to the statistics presented by the
Ministry of Energy and Natural Sources.[1].
The contribution of building to environmental problems is increasing significantly. A
considerable amount of energy is being used for the heating and cooling of a building to
maintain its resident’s thermal comfort. Due to this known fact scientists, organizations
and academicians are looking for new solutions to decrease the energy consumption of
buildings by using advanced design strategies, which perform to keep inhabitants thermal
comfort within acceptable limits as well.
The building’s envelope, which consists of everything that separates the indoor
environment from the outdoor environment, including the basement slab, external walls
and roof, plays an essential role in the energy demand of buildings. As a result, the design

Introduction 2
of energy efficient housing can be obtained by using more industrialized methods in
production and construction processes and can provide improved indoor comfort, reduced
drafts, moisture and improved air quality.
This work claims that pre-fabricated construction systems can be an adequate choice for
energy efficient building envelopes since industrialized production and construction
processes yield higher quality components that shape the building envelope (for example
high quality in thermal insulation, the most important element of the energy efficient
building) and flexible design that can affect solar heat gain and thermal mass (pre-
fabricated shutters, portable wall units, etc.) compared to the conventional construction
system. Pre-fabricated construction offers a dense, uniform, continuous air barrier with
fewer thermal bridges, thanks to its high quality insulation. Another reason to choose pre-
fabricated building technologies for simulation purposes is that these systems will
dominate the building sector in the future due to their advantages with respect to its time
saving, economic and quality advantages.
The components in pre-fabricated systems work together, not as an individual part. For
example, the practice of gluing the components together in addition to the conventional
fastenings in some examples makes pre-fabricated systems tighter than conventional
systems. In conventional construction systems, work quality also depends on the ability of
workers; therefore, construction quality will not be the same as in pre-fabricated systems.
Because of these reasons the thesis asserts that pre-fabricated systems are better than
conventional systems with regards to thermal behavior and energy consumption. Due to
the reduced waste during the production and construction process pre-fabricated systems
are considered to be environmentally friendly systems. Beside those advantages, choice of
materials and design details are important factors for thermal performance.
In addition to all of those assessments mentioned above, energy sources, climate and
geographical characteristics of Turkey are the starting point of this work.
Along with these evaluations, this study examines energy consumption and thermal
performance in residential buildings, mainly in pre-fabricated residential buildings, in
Turkey.

Introduction 3
1.1. Objectives of The Work
This thesis deals with energy standards of residential buildings. Building energy standards
for different countries from different regions and continents have been shortly examined
and both prescriptive and performance requirements for residential building envelopes are
illustrated.
The first objective of this study is to define and examine energy and energy consumption
matter in Turkey in general terms and the policies carried out by the government.
Accordingly importance of building energy standards is investigated. Standards in Turkey
and in some developed countries, such as the European Union (Sweden, Norway, and
Denmark as the countries that represent the best building energy standards in the world),
Germany, USA and other countries which have competitive standard applications, are
briefly explained and compared to each other. With regard to Turkey’s application for EU
membership, requirements for the candidate countries on the energy performance of
buildings are main targets and following routes for Turkey in the light of “Directive
2002/91/EC of the European Parliament and of the Council of 16 December on the Energy
Performance of Buildings”, which explains and indicates requirements for buildings and
should be applied by member countries by 2006. In October 2005, Turkey was accepted to
start negotiations for EU membership; this fact encourages Turkey to reach EU standards
in general and specifically in the energy field.
Climate classification is an important element for setting energy standards. As a result in
this work different climate classifications are assessed. A new climate classification for
Turkey was prepared according to the ASHRAE Transactions 4610 and 4611, which
describe the development of a new climate classification for use in characterizing the
performance of energy efficiency measures for buildings.
Following the simulations of selected systems, some comparisons are made between pre-
fabricated construction systems and traditional construction systems to see whether the
developments in the former pre-fabricated housing construction systems, which are
expected to be in high quality, are efficient regarding energy consumption and their
thermal performance, otherwise the systems need to be re-evaluated. One of the sample
building systems selected for thermal simulation is a reinforced concrete system that is a

Introduction 4
compound of reinforced columns, beams and lightweight hollow bricks, representing most
of the residential building technology in Turkey
This work also aims at introducing new pre-fabricated residential building systems based
on the proven performance of the buildings that were tested by the companies in developed
countries, as regards energy consumption and thermal comfort.
Pre-fabricated buildings are manufactured through an industrialized process improvement
in quality brings many advantages in energy consumption and thermal comfort. One
example for this system will be the Sekishui housing system developed by Sekishui
Housing Business in Japan. The system includes completely finished units built in a
covered area (Factory). Therefore, testing those units will be as easy as testing other
factory made products that means each unit’s quality, the energy performance of each, will
be equal. Then those units are connected and put together on the site by using
industrialized techniques. The applications were not examined in just Japan, but also, in
other countries such as Sweden, Canada and the USA, where the combination of energy
efficient building and prefabrication is an important concern of residential building,
Energy efficient and passive housing approaches were defined and examined briefly.
Integration of the renewable energies in the residential buildings is an essential step to
reduce CO2 emission, thus, some samples of PV (Photovoltaic) architectural integrations in
the Netherlands, the USA, Germany and some other countries were illustrated. In addition,
judgment of applicability and adaptability of those systems in Turkey was subsequently
discussed.
Another goal is to encourage the institutions related with energy (builders, building
product manufacturers, industry organizations, academics, researchers and government) to
focus on innovative technologies in energy and the pre-fabricated building sector by
introducing new components, systems developed in industrialized countries and by
providing a correlation between them to stress the importance of the energy efficiency in
buildings, particularly in residential buildings.

Introduction 5
The main tasks in this work are,
� Introduction of a new climate classification of Turkey, for the cities in the
METEONORM databank (over 50 cities), according to the ASHRAE Transactions
4610 and 4611
� a short energy regulation review of some countries in the world from different
continents, regions with respect to building envelope and energy consumption
requirements
� determination, examination of the current situation of the selected residential buildings,
which exemplify most of the housing types in Turkey and are made of different
materials, both in pre-fabricated and conventional systems
� analysis of overall energy consumption (heating, cooling) and thermal performance of
residential buildings in different climate regions by using scientific methods,
simulation program TRNSYS
� comparisons between pre-fabricated and conventional systems regarding their energy
efficiency performance
� lastly, recommendations for general targets of overall energy consumption and
appropriate measures for housing in Turkey
1.2. Structure and Methodology
- Methodology:
Methods used for energy the analysis of the sample residential buildings in different
regions are literature review, simulation programs, physical observations and the
measurements done by other scientists. Much of the literature, related to the energy, pre-
fabricated residential building technologies in the universities, on the Internet, from
companies and institutions was examined. Selected buildings systems could be
investigated by using various simulation programs such as TRNSYS, DOE 2, and
ENERGY PLUS etc. TRNSYS, a transient simulation program developed by Wisconsin
University in the USA, is used for a simulation of the selected building systems. The
components of TRNSYS are written in FORTRAN language. TRNSYS consists of the

Introduction 6
TRNSHELL, ISIBAT, PRESIM sub programs. Building envelope and some strategies of
simulation are described in PREBID; the building model component. All weather data are
provided from METEONORM.
- Structure:
After a brief introduction in chapter one, geographical characteristics of the country,
energy sources and their potentials (especially renewable energy potential) in Turkey are
analyzed in the second chapter.
In the third chapter, climate characteristics of Turkey according to different scientists
and climate classification methods are examined. In addition, the new climate
classification of Turkey is introduced by using the classification method described in
ASHRAE Transaction 4610 and 4611climate. Building energy performance standards in
different countries around the world are investigated in the fourth chapter. Some
recommendations are made with respect to improving Turkish energy standards.
The fifth chapter aims at indicating energy efficient and passive housing approaches, new
pre-fabricated building systems, integration of renewable energy sources, specifically
integration of photovoltaic in residential buildings (PV) in developed countries such as
Germany, USA, Japan and Scandinavian countries. Some residential building systems in
Turkey were described as inputs for simulations.
The simulation program TRNSYS, assumptions and strategies used for simulations and an
energy analysis of four residential building systems are explained in the sixth chapter. In
addition, climate characteristics of the three selected cities are assessed. Design strategies
and assumptions are graphically detailed. The results are analyzed with respect to four
different conditions: heating-cooling energy demand, zone temperatures higher than 26°C,
zone temperatures on the hottest day of year and different design strategies, including
ventilation, glazing variables, thermal mass internal walls, shading, orientation variables
and insulation. In this chapter the economic efficiency of the insulation thickness applied
to a traditional system is graphically illustrated and assessed.
In conclusion, after reviewing all results derived from the study, the importance of the
energy consumption, energy efficient design and factory made residential buildings is

Introduction 7
underlined. General recommendations for targets of overall energy consumption and
appropriate measures for housing in Turkey are given in the last chapter.
In this thesis, the factors influencing energy demands of a building are classified into two
main classes: climate and regulations. Improved building energy regulations, which are
presented and formulated by using climate data, decrease energy consumption, since the
main target is to reach or exceed required values of standards.
Several research projects were carried out regarding energy efficient residential buildings
in Turkey. One of them is a research project that funded by TUBITAK – The Scientific
and Technical Research Council of Turkey- and carried out by four scientists in 1997. The
research project is entitled “Developing Energy Efficient External Envelope by Retrofitting
in Rehabilitation of Existing Residential Buildings”. The main objective of this research
project was to develop applicable economic and energy efficient retrofitting systems for
the external envelope of existing residential buildings in Istanbul. A five story reinforced
concrete building block was selected as a model. Improvements were classified with
regards to building area, dimensions (width/length) and physical properties. The DOE-2.1E
computer program was used for the simulations. [43].
Obviously, that research project was done just for Istanbul and applied only for reinforced
concrete systems. In addition, ventilation variables were not investigated, however their
influence on energy loss were explained. Energy losses with regards to different variables
(insulation thickness, glazing types, orientation and number of floors) were investigated.
Some of the results of this research are as follows:
- increasing thickness of the thermal insulation material results in increased energy savings
- replacing single glazing with energy efficient glazing has longest payback period if
applied with improved opaque elements
This thesis can also be considered as supplementary work to complete that research work
by taking different cities and different residential building systems into account, since it is
important to examine and investigate different cities and building technologies for a
comparison.

Energy Sources in Turkey 8
2. Energy Sources in Turkey
2.1. Geographical Characteristics of Turkey
Turkey is one of the largest countries in Europe and Middle East with its 779452 km² total
area (23764 km² on the European side, 755688 km² on the Asian side). The country lies
between 36-42 north latitude and 26-45 east longitude (roughly rectangular in shape) and
situated between two continents - Europe and Asia (Figure 2.1).
It is surrounded by three seas with a total of 8372 km total coastline; the Aegean with 2805
km, the Mediterranean with 1577 km, the Black Sea with 1695 km and the inner sea
Marmara with 972 km. The Marmara connects the Black Sea and the Aegean via two
straits: Istanbul and Canakkale straits. The country has seven geographical regions:
Marmara, Aegean, Mediterranean, Southeast Anatolia, East Anatolia, Black Sea and
Central Anatolia. The neighboring countries are Greece and Bulgaria to the northwest,
Armenia and Georgia to the northeast, Iraq and Iran to the southeast and Syria to the south
(Figure 2.2). The highest mountain in Turkey is Mount Ararat (5165 m) and biggest lake is
Lake Van: both are located in eastern Anatolia.
Figure 2.1: Turkey’s location between Europe and Asia (Source: www.Worldpress.org)

Energy Sources in Turkey 9
Turkey is the fifteenth most populated country in the world with approximately 73 million
inhabitants. Istanbul houses almost 15 million of these inhabitants, making the city one of
the most populated cities in the world (2005 World Population Data Sheet, www.prb.org)
Figure 2.2: Geographical map of Turkey (Source: www.Worldpress.org)
2.2. Energy Sources and Problems in Turkey
As a developing country an in conjunction with its fast growing economy and population -
a population increase of almost one million inhabitants per year - Turkey’s energy
consumption has increased rapidly between 1996 and 2004. While total primary energy
consumption in 1996 was 70.77 Mtoe, in 2004 it raised 87.78 Mtoe. On the other hand,
total energy production in 1996 was 28.29 and 24.17 in 2004 (Figure 2.3).
The industrial sector accounted for 36% of total energy consumption, while residential and
commercial sectors represented 35% in 1997. In recent years, the difference between the
industrial and residential sectors has increased much more than in former years, according
to the MENR (Ministry of Energy and Natural Resources) statistics. Among the EU
candidate countries, Turkey has the second largest energy consumption, 50.1 Mtoe, after
Poland, 58.4 Mtoe, according to the European Commission Yearbook “Statistical yearbook
on candidate countries” in 2003.

Energy Sources in Turkey 10
0
10
20
30
40
50
60
70
80
90
100
1996 2000 2001 2002 2003 2004
Prim
ary
ener
gy [M
toe]
Production [Mtoe] Consumption [Mtoe]
Figure 2.3: Energy production and consumption in Turkey
As it can be seen, Turkey is an energy importing country and dependent on the imported
energy sources. Furthermore this trend seems to be continuing in the future. Although it
has a wide variety of energy sources, the quality and quantity of most of the sources are not
sufficient to produce energy. Some of the energy sources in Turkey are hard coal, lignite,
asphalt, oil, natural gas, hydropower, geothermal, wood, animal and plant wastes (bio
mass), solar and wind energy (Table 2.1). The proven reserves of lignite, the most
abundant domestic energy source, is 7300 million ton and found in almost all of the
country’s regions. Lignite has the largest percentage in total energy production with its
42.5 percent share. After lignite, wood has the greatest share in total energy production
with its 20% and oil accounts for 13%, 12.4% hydro and the final 15% includes animal
wastes, solar, hard coal, natural gas, geothermal electricity and geothermal heat.

Energy Sources in Turkey 11
Table 2.1: Primary energy sources in Turkey (Source: MENR)
Source Apparent Probable Possible Total Hard Coal (million tons) 428 449 249 1126
Lignite (million tons) 7339 626 110 8075
Asphaltite (million tons) 45 29 8 82
Bituminous schist (million tons) 555 1086 1641
Hydropower (MW/year) 35.045 - - 35.045
Oil (million tons) 48,4 - - 48,4
Natural gas (billion tons) 8,8 - - 8,8
Nuclear (tons)
Uranium 9129 - - 9129
Thorium 380.000 - - 380.000
Geothermal (MW/year)
Electric 200 - 4300 4500
Thermal 2250 - 28.850 31.100
Solar (Mtoe/year)
Electric - - - 8,8
Heat - - - 26,4
Turkey’s various renewable energy sources represent its second largest energy source after
coal. Biomass and animal waste account 67.3 %, hydropower 29.5 %, geothermal 2 % and
wind and solar account for 1.2 % each of total renewable energy production
There are many rivers in Turkey, thus water sources are one of the most important energy
sources. 19 % of electricity generation was provided by hydropower in 2001, and it
increased to 26 % in 2002. Turkey’s largest hydroelectric power plant is the Atatürk Power
Plant, which has the 6th largest capacity in the world, with the capacity of 2400 MWe
Karakaya with 1800 MWe Keban 1330 MWe Thirty four hydro plants are under
construction, and 329 more hydro power plants are projected. The largest hydro power
project in Turkey is the Southeastern Anatolia Project (GAP), which covers 74000 km2 of
the country. Upon competition, GAP will have an installed capacity of 7476 MW 22% of
Turkey’s total estimated economic potential [1] [2].
In spite of its high energy productivity benefits the power plants cause major
environmental and social problems such as migration of residences, loss of valuable
agriculturally productive alluvial bottomland, alteration of ecosystem.

Energy Sources in Turkey 12
In addition to water sources, Turkey has significant reserves of other renewable energy
sources such as wind, solar, biogas and geothermal energy. Wind energy: western,
northern and southeastern Anatolia is favorable for wind power generations, as annual
wind speed is around 2.5 m/second (Figure 2.4). The first wind power facility which has 12
wind turbines for a capacity of 7.2 Mwe, was commissioned in 1998 in Izmir. In addition
to this build-operate-transfer power station, 17 more were approved in 2001 and more
applications are under evaluation by the Ministry of Environment and Natural Resources.
Turkey had a total installed capacity of 18.9 MW in 2002.
0
50
100
150
200
250
300N
NNE
NE
ENE
E
ESE
SE
SSE
S
SSW
SW
WSW
W
WNW
NW
NNW
Figure 2.4: Turkey’s wind direction
Another renewable energy source for which Turkey has significant potential is the
geothermal energy source, which represents one eighth of the world’s total geothermal
potential. Much of this potential does not have a high quality, which is required to produce
electricity. Thus it mainly is used for heating purposes. By the end of 2001 geothermal
energy potential of electricity and thermal was predicted to be 4500 MW/y and 31100
MW/s respectively. The total installed capacity for heating was 820 MWth, all of which
provided heating for 51600 residences. Geothermal districts which have temperatures
above 40 °C are around the West, Northwest and Middle Anatolia. It has been expected
that five million houses will be heated by using geothermal energy sources. The country’s
geothermal energy potential is determined by the fact that Turkey lies on the Alpine
Himalayan organic belt [2].

Energy Sources in Turkey 13
Solar energy use in Turkey has increased dramatically in recent years, mostly for water
heating purposes. Turkey’s average annual sunshine duration is 2640 h (7.2 hours/day) and
average solar intensity 3.6 kWh/m² day (Table 2.2). The main solar energy utilization in
Turkey comes from flat plate collectors in the domestic hot water systems. Flat plate solar
collectors can be seen at the top of a residential building’s roof with a water tank almost in
every region especially in the southern and western regions even in the villages. [3]
Table 2.2: Turkey’s monthly solar energy and sunshine duration (Source: MENR)
SUNSHINE DURATION(Kcal/cm2-month) (kWh/m2-month) (hours /month)
January 4.45 51.75 103February 5.44 63.27 115
March 8.31 96.65 165
April 10.51 122.23 197
May 13.23 153.86 273June 14.51 168.75 325
July 15.08 175.38 365
August 13.62 158.4 343
September 10.6 123.28 280October 7.73 89.9 214
November 5.23 60.82 157
December 4.03 46.87 103
TOTAL 112.74 1311 2640AVERAGE 308,0 cal/cm2-day 3,6 kWh/m2-day 7,2 hours/day
MONTHS MONTHLY TOTAL SOLAR ENERGY

Energy Sources in Turkey 14
China 50.84%
EU 12.70%Turkey 9%
Japan 7%
Other 1.70%
South Africa 0.50%
India 0.90%
Australia 1.40%
United States 1.80%
Brazil 2.10%
Israel 4.40%
Figure 2.5: Share of existing solar hot water/heating capacity in the World (Source: Renewable 2005 Global
Status Report)
Turkey is one of the leading countries in the world for total installed capacity with a total
of collector area 8.2 million m² as of 2002. After China and the European Union, Turkey
has the third largest solar hot water/heating capacity with 9% (Figure 2.5). [4]. Total
energy production in 1998 was 210000 TOE it increased to 290000 TOE in 2001. There
are almost 100 solar energy companies with the 750000 m2 of annual manufacturing
capacity. Photovoltaic systems are used rarely in Turkey, since they are limited by the
applications of governmental works such as telecom stations, forest fire observation towers
and highway emergencies.
Turkey’s solar energy potential has been estimated to be 26.4 million tons as thermal and
8.8 million tons as electricity. On the other hand, new preparations of solar energy source
potential statistics are being prepared by MENR. Southeastern Anatolia has the highest
sunshine duration (2993 hours/year) and is followed by the Mediterranean region (2956
hours/year), the East Anatolia (2664 hours/year) and the Aegean region (2738 hours/year)
(Figure 2.6)

Energy Sources in Turkey 15
Figure 2.6: Sunshine duration hours of Turkey (Source: MENR)
Turkey uses a substantial amount of bio energy resources, including animal and plant
wastes. For instance in 1997 animal and plant wastes accounted for nearly 6% of (6575
Ttoe) total energy production, but this number declined to 5790 Ttoe in 2001 and is
expected to decline even more in the future. Turkey’s biogas potential was identified as 3-4
bcm (1.5-2 million tons of oil equivalents, Mtoe) per year. In 2001, the quantity of raw
material available was 4739 million tons as animal dung and 1790 million tons as wood
residues. These sources are mainly used for heating purposes in rural regions.
Turkey’s CO² emissions have increased parallel with its energy consumption. Turkey was
ranked third among IEA member countries regarding the CO2 emissions increase rate
between 1990 and 1995, when it increased from 138.50 Mt to 160.50 Mt, and it has been
expected that it will increase to 308.20 Mt in 2005 and to 424.50 Mt in 2010. Since 1990
Turkey’s energy-related carbon emissions have increased from almost 138.50 Mt/year to
210.46 Mt/year. In contrast, the share of the residential sector was 16% in 1990, and it
remained at 16% in 2000. In Turkey, total CO2 emission per year from dwellings is 25.948
million tons, which at 5.3% ranks Turkey seventh among twenty European countries,
according to the survey prepared by EURIMA (European Insulation Manufacturers
Association) in 2001. [5]
According to the European Commission Yearbook “Statistical yearbook on candidate
countries” in 2003 Turkey had the highest (227 Mt, 3.4 tons per capita) total CO2
emissions among the EU candidate countries (Figure 2.7).

Energy Sources in Turkey 16
Even though Turkey became a member of UNFCCC (United Nations Framework
Convention on Climate Change) on May 24, 2004, Turkey is not a party to Kyoto Protocol,
but it is placed in Annex-1 countries which were defined in Marrakech in 2001.
Figure 2.7: Total CO2 emissions per year from dwellings (Source EURIMA)

Climate and Climate Classification 17
3. Climate and Climate Classifications
Climate is defined in the Oxford Dictionary as “the general weather conditions prevailing
in an area over a long period”. Another detailed definition made in the intergovernmental
panel on climate change report in 2001 is:
“Climate in a narrow sense is usually defined as the “average weather”, or more
rigorously, as the statistical description in terms of the mean and variability of relevant
quantities over a period of time ranging from months to thousands or millions of years.
The classical period is 30 years, as defined by the World Meteorological Organization
(WMO). These quantities are most often surface variables such as temperature,
precipitation, and wind. Climate in a wider sense is the state, including a statistical
description, of the climate system” [6]
Among other variables such as building envelope, heating system, type of use, etc., climate
is the most important element and has the greatest influence on the energy consumption of
buildings. Building envelopes are mainly shaped by climate characteristics of the
surrounding environment where they are built. Therefore, analyzing the climatic conditions
of buildings or places is one of the essential phases of design, which focuses on providing
comfortable and energy efficient living spaces. Although a building may have a very good
envelope construction, it still consumes more heating energy in a cold climate than that in
hot climate. As a result, climate considered design plays a vital role for designers,
engineers and architects, who should consider climate elements that influence both human
comfort and a building’s thermal performance.
Some climatic elements considered in building design are:
-air temperature
-radiation, diffuse and beam radiation, or long wave short wave.
-wind speed
-relative humidity
-sky conditions

Climate and Climate Classification 18
-rainfall
-air movement [7]
Climate classification becomes an essential matter at this point due to the determination
and selection of the design strategies and material choices, since most energy performance
standards are established by referring to regional climate classifications. The “Degree Day
Method” is used in determining new generation climate classifications. They are used for
calculating heat losses as well.
� Degree Days
Degree days are originally used to evaluate energy demand and energy consumption. They
represent energy demand of a place and are an essential indicator for estimating energy
needs. In many standards such as ASHRAE, TS 825, degree days are taken into account in
order to calculate energy demands and energy losses. Once the climate classifications are
made with the help of degree days, reference values of energy consumptions for each
climate class are determined and used in calculations of energy demands.
� Heating Degree Day (HDD)
The heating Degree Day can be defined as the sum of the differences between average
ambient temperature and the lowest reference temperature. Degree days can be calculated
weekly, monthly or yearly. Internal base temperature is specified according to climate
regions and buildings. For example in the USA the base temperature for heating degree
day is generally defined as 65 °F (18. 3 °C), while in the UK base temperature is 15.5°C.
We choose 18°C, above which the building is assumed not to need heating. If the daily
average temperature is lower than the 18 °C reference temperature, the difference between
those temperatures gives heating degree days.
Heating Degree Days (HDD) Gt = ∑=
−Z
n
adknamim1
]/.)[,( θθ (1)
Where imθ : Reference temperature for heating
amθ : Average ambient temperature

Climate and Climate Classification 19
� Cooling Degree Day (CDD)
The cooling Degree Day is the sum of the difference between average ambient temperature
and the upper reference temperature. The internal base temperature may be determined
according to the building structure. In this work we choose the base temperature of 10°C
referring ASHRAE transactions 4610-4611.
Cooling Degree Days Gt, K = ∑=
−Z
n
adknamim1
]/.)[,( θθ (2)
Where imθ : Reference temperature for cooling
amθ : Average ambient temperature. [8]
In some cases, the Degree-hours (DH) method is used. Degree-hours are the result of the
mean ambient temperature compared to an inside reference temperature. They help to
monitor energy consumption of a house, as well as to detect possible anomalies. Degree
hours together with the calculation of the thermal energy index are the two components of
the energy signature of a building. Degree hours are not only a representative indication of
the heating and cooling energy consumption but also it is an indication of energy saved for
cooling and natural ventilation.[9] [15]
Heating and cooling degree days for the selected cities - Antalya, Istanbul and Erzurum -
are illustrated in Figure 3.1. Degree days are calculated by referring to ASHRAE
Transactions 4610 and 4611 which describe climate classification methods for ASHRAE
standards. Heating degree days and cooling degree days are calculated by taking the base
temperatures of 18°C and 10°C respectively. However, it seems that the cooling degree
day’s base temperature can be increased to 18 °C or 20 °C after reviewing the simulation
results that we gained in this work. For instance, average ambient temperature doesn’t
exceed 20°C in Erzurum due to that reason it can be estimated and a higher base
temperature may be used for calculating cooling degree days.

Climate and Climate Classification 20
IstanbulAntalya
ErzurumIstanbul(base
18,3°C)Antalya (base
18,3°C) Erzurum(base
18,3°C)
Cooling Degree Days
Heating Degree Days
1990
963
4652
1964
963
4652
19233180
848
4501083
89
0
500
1000
1500
2000
2500
3000
3500
4000
4500
5000
Cooling Degree Days Heating Degree Days
Figure 3.1: Heating and cooling degree days of selected cities (ASHRAE Method and CDD -18.3°C base)
The relation between degree days and energy consumption can also give prior approximate
information before construction starts. In the research work done by A. Matzarakis and C.
Balafoutis, it is concluded that a residential building in Florina (Greece), which has 1784.4
HDDs, spends almost nine times more energy to enjoy the same heating comfort than on
the island of Rhodes (Greece), while the HDD ratio between those cities are approximately
nine fold as well. Along with the degree days calculated for this work, the relation between
degree days and energy consumption is also graphically illustrated. [10]
The Figures 3.2a and 3.2b represent the relations between energy demand and HDD and
CDD for Antalya, Erzurum and Istanbul. It gives some information about climate as well
and answers the question of how cold or hot the cities are. After examining the relation
between degree days and energy consumption, we concluded that there is an almost linear
relation between them. Heating and cooling degree days, heating and cooling energy
demands of selected cities indicated in (Figure 3.2a, 3.2b), for instance the heating energy
demand for Erzurum is almost 7 times that in Antalya. The heating degree day number of
those cities shows almost the same relation for traditional construction. In addition, the
ratio between cooling energy demand and cooling degree days is almost 1:2. However, the

Climate and Climate Classification 21
correlation between degree days and energy consumption depends on construction features
as well.
As it is illustrated in the Figure 3.2a and 3.2b, four different construction systems in three
different climate regions are investigated with regards to degree days and their energy
consumption before improvements are made for the simulations. The linear regression
method is used to evaluate the relation between two variables energy consumption and
degree days for three cities Istanbul, Antalya and Erzurum. The energy consumption of the
reference cases for each building types in these cities were obtained through the energy
simulations by TRNSYS. The linear regression line of traditional building system differs
from other systems because of its worst cooling energy performance in Antalya. In
addition, only three cities were investigated, more data can provide appropriate regression
line. The intersection points of energy consumption and degree days represent the
performance of the different systems, for instance, if we investigate energy consumption of
the traditional system in another city out of three cities that have cooling degree days of
1500, it can be estimated that the cooling consumption of this traditional building in
selected city would be around 15 kWh/m²a The energy consumption values are taken from
simulation results of the selected three cities in the reference case.
0
10
20
30
40
50
60
70
80
0 500 1000 1500 2000 2500 3000 3500
Cooling Degree Days [CDD]
Coo
ling
Ene
rgy
Dem
and
[kW
h/m
².a]
Intbrick Trad Lw Aerated
Erz-CDDIst-CDD
Ant-CDDTraditionalAerated
Lightweight
Interlockin
Erzurum Istanbul Antalya
Figure 3.2a: The relation between cooling energy demand and degree days

Climate and Climate Classification 22
Each residential building system represents different relations between degree days and
heating/cooling energy consumption. For example, both systems with insulation have
higher cooling degree days in a cold climate, while they perform better in hot climates with
regards to cooling energy.
0
50
100
150
200
250
300
350
400
450
0 1000 2000 3000 4000 5000
Heating Degree Days [HDD]
Hea
ting
Ene
rgy
Dem
and
[kW
h/m
².a]
Trad Intbrick Lw Aerated
Ist-HDD
Erz-HDD
Ant HDD
Traditional
Aerated
Lightweight
Interlocking
ErzurumIstanbulAntalya
Figure 3.2b: The relation between heating energy demand and degree days
3.1. Climate Characteristics of Turkey
The world is divided into five main climatic zones according to Köppen Classification:
tropical, arid, temperate, continental and polar climates. [44] Turkey is situated in the
temperate Mediterranean climatic and geographical zone. The country has three main
climatic zones: the Black Sea region is mild and generally rainy throughout the year with
the temperature neither very low in winter nor very high in summer. The southern and
western coastlines have a typical Mediterranean climate with mild winters and hot, dry
summers. The Interior parts of Anatolia, with high land plains and a mountainous region
east of Anatolia are marked by cold and snowy winters, hot and dry summers.

Climate and Climate Classification 23
Figure 3.3: World climate zones (Source: http://encyclopedia.farlex.com)
Although the country has three main climate zones, the climate shows different
characteristics and can be grouped into five climate groups (according to the scientists)
because of their different geographical characteristics. For example in the Mediterranean
region, mountains (Taurus Mountains) run parallel to the coasts and prevent the clouds
from passing over into the interior parts of the country therefore the coastal side of the
region receives more rainfall than the other part of the region. In conclusion it can be
concluded that Turkey shows both continental climate and subtropical climate
characteristics.
In the “Turkey Baseline Report on Climate Change” Turkey is divided into five climate
zones [11].
� The Mediterranean climate
Characteristic of the Mediterranean climate are hot, moderately dry summers and mild,
rainy winters. This climatic region represents all Mediterranean and a big part of the
Aegean geographical regions. The highest annual average temperature reaches 20 °C on
the eastern parts of the coast. The Mediterranean climate is classified into two classes:
- Humid Mediterranean climate,

Climate and Climate Classification 24
- Semi-humid Mediterranean climate.
- Humid Mediterranean climate
Mean January temperature changes between 8 °C and 10°C, average temperature in July
and August, the hottest months, reaches 28°C. Annual average precipitation is 1060mm
mostly in winters, in January 240mm, in December 250mm.
- Semi-humid Mediterranean climate
Mean temperature varies between 5°C and 8°C in the coldest month, January. In the
winters short term frost can be seen more than in the humid Mediterranean climate region.
The rain season is in the winter. The annual mean precipitation is 650mm-850 mm.
Particularly in summers, evaporation is high.
� The Black Sea climate
The Black Sea climate region receives the highest amount of rainfall throughout the year in
Turkey. The eastern part of the Black Sea region has 2200mm annual average precipitation
some years it even reaches 2300mm. The Black Sea Climate region covers all Black Sea
coasts and includes the northern part of the Marmara region. Average temperature is 8°C-
12°C. The region receives most of the rainfall in autumn and winter. The percentage of the
rainy days in the summer is the highest.
� The Semi-humid Marmara climate
This climate zone includes the entire Marmara region except The Black Sea coasts of the
region and a small part of the western cities of the Marmara which are influenced by
eastern Europe’s climate. The climate is moderate. Annual average temperature is 14°C.
The hottest months of the region, July and August, have an average temperature of 23°C.
The highest recorded temperature for those months is 37 °C. The coldest month is January
with a 5°C average temperature. Annual precipitation varies between 500mm-700mm. The
share of summer rainfall is %10-%15.

Climate and Climate Classification 25
� Steppe climate
Central Anatolia, the Lake District, the Midwest Anatolia, Southeastern Anatolia, part of
the west Marmara region and the interior regions of the Black Sea region are the regions
affected by the steppe climate. It is divided into two groups:
- The Semi - arid Central Anatolia climate
- The Semi-arid Southeastern Anatolia climate
- The Semi- arid Central Anatolia climate
Winters are cold, intensity increases towards the northeastern part of Central Anatolia.
Mean temperature in the coldest month, January, fluctuates between –3°C and 0°C. In
August it is 20°C-22°C. Average annual precipitation varies between 350mm and 500mm.
- The Semi-arid Southeastern Anatolia climate
Summers are very hot; the average temperature is greater than 30°C in the hottest months,
July and August. January and February are the coldest months with temperatures of 3°C
and 4°C respectively. Summers are dry and long lasting. Amount of annual rainfall is
350mm- 800mm. This climate region is the most arid region of Turkey.
� The Continental Eastern Anatolia climate
The continental Eastern Anatolia climate has the coldest weather in Turkey. Mean
temperature is –8°C - 10°C in the winter. The hottest months do not exceed 20°C. Due to
its high mountains, this region sometimes referred to as Turkey’s roof [11]
3.2. Climate Classifications for Building Energy Standards
3.2.1. Climate Classification Used for TS-825 (Turkish Standard-825)
The Turkish State Meteorological Service and TSE (Turkish Standards Institution)
classified Turkish climate regions as “Thermal Insulation Regions” by using a degree-day
method which was developed by the Turkish State Meteorological Service. The

Climate and Climate Classification 26
classification, the number of temperature over 10 °C which is derived from 236 stations
between 1981 and 2001, has been calculated as follows:
Effective Total Temperature (Degree Days) = ( ) NM *10− (3)
M : Monthly mean temperature,
N: Number of days in the month [12]
Degree days for all cities and some towns are listed by using monthly mean temperatures
in the equation. Degree days are not classified as heating and cooling degree days like it
was mentioned in the ASHRAE classification. According to this classification Turkey is
divided into four insulation regions: this was used for the Turkish Standard 825 (thermal
insulation in buildings) to determine consumption values and insulation requirements.
(Appendix A) The Climate classification of Turkey is made also by scientists but not used
for standards.
- Classifications Created by Different Scientists
Different climate classifications for Turkey have been formulated by scientists. They have
classified the climate according to the drought coefficients of the cities. These climate
classifications differ in calculating water balances. The long range average weather data
were used for classification. Some of the classifications are the Aydeniz classification, the
Erinc classification and the Thornthwaite classification. The Aydeniz classification is
illustrated in the Figure 3.4. As shown in the figure climate is divided according to the
drought coefficient from very dry to wet [10].

Climate and Climate Classification 27
Figure 3.4: Classification of climate zones in Turkey according to the Aydeniz formula (Source:MENR)
3.2.2. Climate Classification Used for ASHRAE Standards (ASHRAE Transactions
4610-4611)
The climate classification was developed to be used in the implementation of building
energy codes, standards, design guidelines and building energy analyses in the Unites
States.
Compared to the climate classification used for the Turkish Standard TS-825, ASHRAE
Transactions 4610 and 4611 are more detailed than the Turkish classification. The
classification in the ASHRAE Transactions was made in two phases:
Firstly, climate regions were divided into three main groups, and each group has its own
definition: marine definition, dry definition and humid definition. These definitions were
made according to the some criteria for the locations, for instance; locations meeting the
following criteria are defined as Marine definition;
• Mean temperature of coldest month between -3°C and 18°C and
• Warmest month mean temperature < 22°C and
• At least four months with mean temperature over 10°C and
• Dry season in summer.

Climate and Climate Classification 28
Dry definition;
• Not marine and <2.0 * (Tc+7) where
Pcm: annual precipitation in cm, Tc: annual mean temperature in degrees Celsius
Humid definition;
• Not marine and Pcm = 2.0 * (Tc+7) (Appendix B)
Having those major climate definitions, the next step is thermal zone definition by using
cooling degree day and heating degree day reference temperatures with the help of the
Köppen Classification (Appendix C). The USA is divided into 8 climate zones. With sub-
climate zone definitions, seventeen climate zones are explained with regards to thermal
criteria and their names in the Köppen Classification. At the end of this research some of
the cities around the world are classified as well. [13]
The zone boundaries of the CDD and HDD temperatures are selected according to the
conditions in the USA, but from previous experience in other countries it can be said that
CDD and HDD reference temperatures will be different for other countries, for instance for
Europe.
3.2.3. New Turkish Climate Classification According to the ASHRAE Method
In this chapter Turkey’s new climate classification has been made by using the climate
classification method used for the ASHRAE standards. All definitions in ASHRAE 4610
and 4611 for zone and thermal classifications were integrated in Microsoft Excel and the
weather data were taken from METEONORM for each city. For that classification purpose
precipitation and monthly mean temperature data are needed. The method is applied to 51
cities in Turkey. Hourly weather data, including average temperature and precipitation
over 10 years, are used for classification purposes. One problem with using this
classification for Turkey and Europe could be the determination of base temperatures for
CDD and the boundary of climate classification, since the parameters mainly reflect the
United States of America. The reason to reclassify Turkey’s climate regions according to
ASHRAE classification is to compare it to the old climate classification of the country and
to show the way to present and prepare classifications, especially since the classification
that used by TS 825 is not sufficiently detailed

Climate and Climate Classification 29
Some similarities can be seen among some cities when we compare two climate
classification maps of Turkey used for energy standards. These two maps show the
classification mentioned in TS-825, “Insulation regions in Turkey”, and the classification
done by using the ASHRAE Transaction 4610-4611 method. Especially the cities by the
sea show the same properties in both climate maps. The interior regions are divided into
more divisions in the ASHRAE 4610-4611 classification than in the TS-825 classification
mainly due to specific geographical characteristics of the cities. The Mediterranean,
Aegean, Marmara and some parts of the Black Sea regions showed similar characteristics
in two classifications. In the new classification some cities which have extreme climates
can be easily seen. (Figure 3.6)
The new classification made for Antalya, Istanbul and Erzurum indicated that the
classification of these cities seems to be at the right climate zones. Antalya, Istanbul and
Erzurum found places in warm, mixed and cold climate zones respectively, reflecting the
city’s climate characteristics more accurately (Figure 3.5).
0
500
1000
1500
2000
2500
3000
3500
4000
4500
5000
5500
6000
0 500 1000 1500 2000 2500 3000 3500 4000 4500 5000 5500 6000 6500 7000 7500 8000
Heating Degree-Days, Base 18,3°C [Kd/a]
Coo
ling
Deg
ree-
Day
s, B
ase
10°C
[Kd/
a]
MODERATE (C) HUMID (A) DRY (B) NO MAJOR TYPE (-)
(1) VERY HOT
(2) HOT
(3) WARM
(4) MIXED
(5) COOL (6) COLD (7) VERY COLD(8) SUB-ARCTIC
Athens
Bordeaux
Lyon Falkenberg
Braintree
Norwich
Madrid
St. Augustin
Walford
JoensuuKristinehamn
Berlin
Biberach
Freiburg
La Rochelle
Florence
Recanati
Navarra
Güimar
La Valetta
Antalya
Istanbul
Erzurum
Figure 3.5: ASHRAE climate classification of three selected cities with some European cities.

Climate and Climate Classification 30
1 Yalova 15 Denizli 29 Cankiri 43 Nigde 57 Bayburt 71 Van2 Kocaeli 16 Mugla 30 Ankara 44 Nevsehir 58 Erzincan 72 Bitlis3 Istanbul 17 Antakya 31 Kirikkale 45 Yozgat 59 Tunceli 73 Mus4 Kirklareli 18 Burdur 32 Kirsehir 46 Corum 60 Bingol 74 Agri5 Edirne 19 Isparta 33 Konya 47 Kastamonu 61 Elazig 75 Igdir6 Tekirdag 20 Afyon 34 Karaman 48 Sinop 62 Malatya 76 Kars7 Canakkale 21 Eskisehir 35 Mersin 49 Samsun 63 Adiyaman 77 Erzurum8 Balikesir 22 Bilecik 36 Adana 50 Amasya 64 Urfa 78 Rize9 Bursa 23 Sakarya 37 Hatay 51 Ordu 65 Mardin 79 Artvin
10 Izmir 24 Duzce 38 Osmaniye 52 Tokat 66 Diyarbakir 80 Ardahan11 Manisa 25 Zonguldak 39 Kilis 53 Sivas 67 Batman 81 Aksaary12 Kutahya 26 Bartin 40 Gaziantep 54 Giresun 68 Siirt13 Usak 27 Karabuk 41 K.Maras 55 Trabzon 69 Sirnak14 Aydin 28 Bolu 42 Kayseri 56 Gumushane 70 Hakari
Figure 3.6: New Turkish climate classification according to the classification methods used
for ASHRAE Standards
Sun path (stereographic) diagrams of three selected cities help us to evaluate sun shine
time, solar radiation on the surfaces and sun declination according to the seasons. As it can
be seen, sun declination is lower during the winter seasons and higher in the summer
seasons due to Turkey’s geographical situation. Regarding all those variations, design
improvements - for instance shading devices, solar heat gains through windows, walls and

Climate and Climate Classification 31
roofs - can be formulated easier. For example; the sun shines almost at a 90° angle in June
in Antalya, accordingly solar heat gain should be mostly received on roofs and the south
exterior wall of a given building, thus, the construction design and strategies for the roof
and the south wall construction become more important issues. Another important
reference derived from sun path diagrams is the decision for orientation of a building.
Designers can orientate the situation of exterior walls according to the heat gain and loss
parameters.
In case of cold climates (Erzurum), the south surface should be designed carefully with
regards to the maximum solar energy gain during the winter, even sometimes during the
summer. Due to this reason the window area on the south surface determines the amount of
solar heat gain through the windows, and in summer the windows may be shaded to
prevent overheating. (Appendices D, E and F)

Building Energy Standards 32
4. Building Energy Standards
The building envelope is responsible for most of the heating and cooling energy loads that
mainly depend on the structure of the building elements (walls, roofs, windows, etc.). In
order to minimize those effects on energy use, it is essential to develop or improve building
energy standards which are composed of requirements, maximum and minimum thermal
transmittance values of building envelope elements and energy efficient strategies for
building envelopes in different climate regions. A large amount of energy savings can be
achieved by applying energy efficient standards, as it has been shown in many simulations
and improvements of envelopes.
Figure 4.1: Impact of thermal building code improvements between 1975 and 2000 in Germany (Source: Franunhofer Institute)
As an example, Figure 4.1 above shows energy load reduction after updating thermal
insulation codes between 1975 and 2001 in Germany. In Germany a new residential
building in 2001 consumes approximately 30 % of a residential building in 1975,
according to the research done by the Fraunhofer Institute. [14]

Building Energy Standards 33
In a significant number of countries, energy standards have not yet been successfully
enforced, and many countries do not even have any energy regulations at all. Considering
the number of the countries that do not have any energy regulations, the net energy loss in
the World is very high. Having looked at the general energy regulation circumstances of
the World, it can be mentioned that some of the countries became aware of the importance
of building energy regulations very late, except Sweden, Denmark, North America, Europe
and some other countries from different regions. The regulations either are not mandatory
or are just for non-residential buildings. (Figure 4.2) [15]
Figure 4.2: Status of building energy standards in the World (Source: www.deringergroup.com)
4.1. Building Energy Regulations in Turkey
In this chapter, the regulations with respect to energy performance of buildings and energy
efficiency in heating and cooling energy consumption will be discussed. Regulations
regarding energy conservation and saving issues are not sufficient or detailed in Turkey.

Building Energy Standards 34
Due to Turkey’s application for EU membership, in recent years the country has reviewed
and followed EU regulations and directives for member countries. Many legislative actions
and energy directives are going to be harmonized and adapted from EU rules about energy
efficiency in buildings [16].
TS-825 “Thermal Insulation in Buildings”, which became mandatory in June 2000, is the
most important and detailed standard related to energy conservation and heating energy
consumption in buildings.
� Thermal Insulation Standards in Buildings, TS-825
TS-825 defines the rules of calculation of heating energy demand in buildings and gives
the reference and permeable values for heating energy. However, these rules are not
defined for the buildings which include passive solar energy systems. In addition, cooling
energy demands of the buildings are calculated by using international standard PrEn ISO
13791. The TS-825 standard was prepared by adapting ISO 9164² and EN 832 standards to
Turkey’s condition [3].
Energy performance of the different types of buildings, the calculation method of annual
heating energy demand, thermal transmittance “U” values (for walls, floors, windows,
glazing and ground floor) for each region, which is defined by using the “degree day
method” in TS-825, and the maximum heating demand values according to regions were
described. Both prescriptive and performance based requirements were given (Table 4.1).
The main objectives of the standard are;
- to limit heating energy loads in Turkey in order to increase energy saving
performance
- to indicate and determine the calculation methods and their values
- to determine the heating energy consumption of existing buildings
- to indicate energy retrofit performance before the renovation of a building

Building Energy Standards 35
Table 4.1: “U” values for building envelope in TS-825 standard
Regions defined in TS-825
Walls UD (W/m²K)
Ground floor
UT (W/m²K)
Floor Ut (W/m²K)
Windows UP (W/m²K)
1.Region 0.80 0.50 0.80 2.80
2.Region 0.60 0.40 0.60 2.80
3.Region 0.50 0.30 0.45 2.80
4.Region 0.40 0.25 0.40 2.80
The monthly outdoor temperature and solar radiation, which were taken into consideration
in this standard to calculate heating loads of buildings, are classified separately according
to each region and month. In addition, maximum heating loads were given according to the
A/V (Area/Volume) rates of buildings for each region in terms of area and volume (Table
4.2). Having seen the insulation regions in Turkey and the A/V rates for each region, the
heating load requirements (reference values of heating loads) for the three cities, selected
for simulation in this work, are as follows:
for the A/V value smaller than 0.2: Istanbul which is in the second region 48 kWh/m²
Antalya, which is in the first region 27 kWh/m², and Erzurum, which is in the fourth
region 104 kWh/m². [17]
Table 4.2: Heating energy demands for each region according to TS 825 for lowest and highest A/V rate
for A/V ≤
0.2 for A/V ≥ 1.05 Unit
Q'1REG 27 66 kWh/m²
8.5 21 kWh/m³
Q'2REG 48 104 kWh/m²
14.7 33 kWh/m³
Q'3REG 64 121 kWh/m²
20.4 39 kWh/m³
Q'4REG 104 175 kWh/m²
33.4 56 kWh/m³

Building Energy Standards 36
4.2. Regulations in Developed Countries
Many countries in the World have formulated building energy standards by referencing
other detailed standards mostly from neighbor countries and ASHRAE fundamentals.
Some countries adapted the rules for developed standards for their climatic conditions and
construction types. For instance Canada, ASEAN countries and many other countries used
USA standards as a reference. [18]
Turkey has reviewed EU directives and standards, ISO standards and DIN standards and
adapted them to its conditions. Along with those adaptations of mostly European standards,
some other standards in the World may have given interesting ideas about the preparation
and measures of energy standards for Turkey, thus, in this work energy efficiency
standards will be investigated in various countries in the World. Generally the prescriptive
requirements (maximum thermal transmittance of the building envelope elements) will be
introduced for most of the selected countries.
4.2.1. European Union (EU)
Energy regulations within the European Union (EU) vary according to the climate and
geographic features of the countries. In most of the European countries, energy regulations
are mandatory for both residential and commercial buildings. Many countries adapt their
energy regulations according to the EU directives. One of the important directives
concerning building energy is the “EU Building Energy Performance Directive”.
4.2.1.1. EU Building Energy Performance Directive
The European Union (EU) prepared a directive for all member and candidate countries
entitled “Directive 2002/91/EC of the European Parliament and of the Council of 16
December on the Energy Performance of Buildings” which was adopted in November
2002 and published in the Official Journal of the European Communities. This Directive is
important because it obliges all EU member and candidate countries to implement various
measures in the field of energy efficiency of buildings. [19]
Building Energy Standards 37
Directive 2002/91/EC of the European Parliament and of the Council of 16 December
on the Energy Performance of Buildings:
The objective of this directive is to promote improvements in the energy performance of
buildings within the European Union community, taking into account outdoor climate and
local conditions, as well as indoor climate requirements and cost-effectiveness (Directive
2002/91/EC of the European Parliament and of the Council of 16 December on the energy
performance of buildings, January 2003). According to the requirements indicated by the
directive member countries must:
- define a building energy performance calculation methodology, which takes
national or regional conditions into account
- apply minimum requirements for new buildings
- apply minimum requirements for large existing buildings that will be renovated
- administer energy performance certification of buildings when they sold or rented
- and implement regular inspection of boiler and air-conditioning
According to the directive the building energy performance calculation methodology
should include the following aspects:
- thermal characteristics of the building (envelope and internal partitions)
- heating installation and hot water supply, including their insulation characteristics
- air-conditioning installation
- ventilation
- built-in lighting installation
- position and orientation of buildings, including outdoor climate
- passive solar systems and solar protection
- natural ventilation

Building Energy Standards 38
- indoor climate conditions, including designed indoor climate, in addition building
types should be classified [20]
4.2.1.2. German Regulations
Germany has detailed regulations, named DIN. Germany adopted its first thermal
insulation ordinance in 1977 and reviewed it several times. In 2001, ENEV
(Energiesparverordnung), a law for energy saving, was released, and in 2004 some changes
were made. The requirements for thermal insulation and heating systems for major
renovations and new buildings are detailed in this law. It lists both elemental and system
requirements. This energy ordinance saves almost 60% more heating energy than the old
ordinance in 1977. (Table 4.3) [21]
Table 4.3: Maximum values of the heat transition coefficients during first renovation, replacement and
renewal of construction units
Buildings according Buildings according to §1Sect. 1Nr.1 to §1Sect. 1Nr.2 Line Elements According to Maximum Thermal Transmittance
Umax (W/m²K)
1 2 3 4
1a External Walls General 0.45 0.75 b Nr.1 b, d and e 0.35 0.75
2a Windows Glass doors Skylights
Nr. 2 a 1.7 2.8
b Glazing Nr. 2c 1.5 No requirement c Curtain walls General 1.9 3
3a Windows Glass doors Skylights with special glazing
Nr. 2a and b 2 2.8
b Special glazing Nr. 2c 1.6 No requirement c Curtain walls with special glazing
Nr. 6 Sent 2 2.3 3
4a Ceilings, roofs and pitched roof area
Nr. 4.1 0.3 0.4
b Roofs Nr. 4.2 0.25 0.4
5a Ceilings and walls near to unheated rooms
Nr. 5b and e 0.4 No requirement
b Or ground Nr. 5a,c, d and f 0.5 No requirement
According to the new energy regulations, there is no requirement for thermal transmittance
(U-W/m².K) values for the new buildings; however, systems performance requirements are

Building Energy Standards 39
given according to annual primary energy consumptions with respect to A/V value
(Appendix G). This new approach for buildings energy performance sets the requirements
for new and old buildings. Thermal insulation requirements are explained for two seasons,
in winter and in summer. [22] Turkey adopted some of the DIN regulations in developing
its own standards
4.2.1.3. Swedish, Norwegian and Danish Regulations
Sweden is known for having high quality regulations with respect to housing standards.
Almost 50 years ago Sweden implemented a thermal insulation standard for buildings.
Norway followed shortly thereafter and Denmark after fifty years, and both adopted the
Swedish standards to their own. In “Building Regulations-BBR” the mandatory
requirements and general recommendations for energy were published under the ninth
chapter (Energy Economy and Heat Retention). In this chapter the building envelope
requirements were given with regards to thermal insulation and transmission losses, air
tightness, ventilation, production and distribution of heat. The reason for concentrating on
the thermal loses is the cold climate of Sweden. The Swedish housing requirements for
new apartments were defined as follows (BFS 2002). [23]
Table 4.4: Maximum “U” values defined in Swedish and Norwegian standards
Sweden Norway Elements
Maximum transmission coefficient (U-W/m²K)
External Walls 0.18 0.22
Ceilings Under Roofs 0.2 0.15
Floors next to ground 0.2 0.22
Windows 1.5 1.6

Building Energy Standards 40
Table 4.5: Maximum “U” values defined in Danish standards
Element Maximum transmission coefficient (U-W/m²K)
External Walls 0.2 (timber frame) 0.3 for brick/block construction
0.3 for brick/block Ceilings with voids above
0.15
Attic type roofs 0.2 Ground floors 0.2 (timber frame) 0.3 (brick/block) Windows and Outer Doors Including Skylights
1.8
4.2.1.4. UK Regulations
In the UK the standard for the thermal performance of buildings is called “Conservation of
Fuel and Power”. In this regulation there are three different methods to investigate energy
consumption requirements and envelope requirements. These are:
- Elemental Method
- Target U-value Method
- Carbon Index Method
The Elemental Method indicates maximum U-values of the building elements for two
different heating systems. Types of heating systems mentioned in this standard are “Gas or
oil central heating with boiler” and “Other gas or oil central heating, or any electric heating
system or solid fuel central heating or undecided”. Thermal transmittance values of each
building envelope include the wall between unheated and heated spaces, roof attics, walls
and flat roofs [24]. (Figure 4.3)

Building Energy Standards 41
Figure 4.3: Maximum U-values using the Elemental Method in the UK standard.
4.2.2. USA (ASHRAE Standards)
ASHRAE (The American Society of Heating, Refrigerating and Air-Conditioning
Engineers) was founded in 1894 in New York City. ASHRAE publishes standards,
handbooks, transactions and journals. Having compared it to other standards in the World,
it can be easily concluded that ASHRAE is the most detailed building energy standard in
the World. Thus, many countries referenced ASHRAE standards in the process of
preparing their own standards regarding the field of heating, ventilation, air-conditioning
and refrigeration. Many laboratories, researchers and government organizations have
contributed to the preparation process of ASHRAE. The standards are periodically
reviewed, revised and published.
ASHRAE Standard 90.2-2001: Energy-efficient design of low rise residential
buildings
One of the standards reviewed for this work is the ASHRAE Standard 90.2-2001, entitled
“Energy-Efficient Design of Low Rise Residential Buildings”. Purpose of this standard is
to provide minimum requirement for the energy efficient design of low-rise residential
buildings. This standard provides three different methods by which compliance can be
determined for low-rise residential buildings: the prescriptive method, performance path
a) Gas or oil central heating with boiler b) Other gas or oil central heating, or any electric heating system or solid fuel central heating or undecided

Building Energy Standards 42
method and annual energy cost method. In the prescriptive path method, minimum R-
values of elements of the building envelope, the maximum U-factors and maximum
SHGC-values for fenestration have been specified. The performance path method indicates
the maximum U-value of the building envelope and the SHGC value of glass openings.
[25] (Appendix H)
Some states in the USA have their own standards, which are more detailed and localized
than ASHRAE. For example California, Oregon and Florida all have very advanced
standards which were developed by using computer based methods. After the energy crisis
in California in recent years, the state reviewed the 2001 standards and released the “2005
Building Energy Efficiency Standards for Residential and Nonresidential Buildings” which
came into effect in October 2005. The ASHRAE Standard 90 series are used as a reference
for those states and other countries.
4.2.3. Japan and Korea Regulations
• Japan
The Japan Energy Conservation Center (ECCJ) has published the guidelines “Design and
Construction Guidelines on the Rationalization of the Energy Use for Houses” and
“Criteria for Clients on the Rationalization of Energy Use for Buildings”, which were
reviewed in 1999. Japan is classified into six climate regions. The guideline is divided into
these sub-sections:
- standards related to the heat-insulation performance of building frames: standards
for heat coefficient and standards for heat resistance of heat-insulation materials are given
and illustrated according to the different residential building construction types (wooden,
reinforced concrete and other houses) in this sub-section
- standards for the heat-insulation performance, etc., of openings
- standards for ventilation plans
- standards for heating and cooling and hot water supply plans
- standards for airflow plans

Building Energy Standards 43
Maximum values of heating and cooling loads are also illustrated and their calculation
methods described. For example according to the standard, heating shall be performed by
setting the room temperature at 18°C or higher and the outdoor temperature at 15°C or
below. (ECCJ) For the cooling load calculation, the room temperature is set at 27°C or
below and relative humidity at 60% or below. [26]
• Korea
Korea implemented mandatory building energy standards in June 1992 and referenced
ASHRAE and Japanese building energy standards. [18] Korea is divided into three thermal
regions. The thermal insulation requirements were specified for each region with respect to
building envelopes, thermal transmittance, “U-value” and thickness of the insulation [27].
4.2.4. Other Countries
Nowadays many other countries are becoming aware of the need to set energy efficient
standards after seeing its benefits for the environment, economy and other benefits. In this
sub-section two countries with hot climates, Egypt and Dubai, are shortly examined. Both
countries are situated in North Africa and the Middle East, where the use of air-
conditioning is very important due to high cooling loads.
Especially the preparation and methodology of the energy standards proposal for Egypt,
which was prepared by a team of scientists and researchers who had many years
experience in the development of building energy standards in the USA and other
countries, can be a reference for the countries lying in the same region and for the
countries that don’t have detailed standards. The preparation process includes surveys of
existing buildings physical and energy use and the use of computer simulations to analyze
building energy performance. A key component of the development of these codes was the
use of the DOE-2 hourly energy program. The information obtained from a survey of
building energy use is very useful for defining prototypical buildings for use in computer
analysis. In the conclusion a very detailed standard for Egypt is proposed [28].
The municipality of Dubai has developed the “Regulations of Technical specifications for
Thermal Insulation Systems and Control of Energy Consumption for Air-conditioned
Buildings in the Emirate of Dubai”, which became mandatory in 2003. It is adopted from

Building Energy Standards 44
the ASHRAE standards, since ASHRAE is often used as a reference. This regulation
contains three chapters, chapter one defines requirements of building envelope elements
(roof, wall, glass openings.), the calculation of heat load and the design of air-conditioning
systems. Chapter two includes specifications of thermal insulation materials and their
installation. Chapter three gives general information about the regulations. In defining
requirements for the building envelope, the overall transmission coefficient value “U” and,
in addition, for glass openings the shading coefficient “SC” was used. The thermal
transmittance U-value should not exceed the values shown in Table 4.6. Dry bulb
temperature, wet bulb temperature, relative humidity and other variables were indicated for
heating load calculation. [29]
Table 4.6: Building envelope requirements for Dubai
Building Elements
Maximum transmission coefficient (U-W/m²K)
Shading Coefficient (SC)
Roof 0.44 -
Wall 0.57 -
Windows 3.28 0.4

Building Energy Standards 45
4.3. Conclusions and Discussions
Having a brief review of energy standards of the different countries from different regions
in the world, the impact of building energy standards on energy consumption can be
judged from their experience of standards over several years. Some research findings and
figures for energy consumption in buildings show that building energy standards are an
essential part of the energy saving issue. For instance the EU investigation into the
implementation of a common building code for Europe in 2000 indicates that if the Danish
building codes had been adopted to all EU member countries as a model, a large amount of
energy could have been saved (for some countries more than 50%, such as for Portugal and
Italy which are situated in Mediterranean region) (Figure 4.4) [30].
Figure 4.4: Energy consumption in EU countries after adjusting the Danish regulations as a model. (Source:
http://europa.eu.int/comm/energy/library)
Although Turkey prepared its standards by reviewing European standards, there are some
other standards which can be examined and referenced. Comparing the thermal insulation
standard (TS-825) to some European countries, the thermal transmittance coefficient (U-
value) requirements for new dwellings in TS-825 for building envelope elements are high,
which results in waste of energy. For example in Sweden, Denmark and Germany thermal
transmittance coefficient U-values for exterior walls are 0.18 W/m²K, 0.20 W/m²K and

Building Energy Standards 46
0.35 W/m²K respectively, while they are 0.80 W/m²K for the hottest region and 0.40
W/m²K for the coldest region in Turkey. Similar comparisons for glazing, which is a very
important element of the building envelope, can be a good illustration of seeing the
differences between standards. The thermal transmittance “U value” requirement for
windows is 2.8 W/m²K, while under DIN standards it is just 1.7 W/m²K. Those short
comparisons indicate that the thermal transmittance “U values” of building envelope
elements should be reviewed and updated to reasonable values. In addition, there is no
requirement about cooling loads of buildings in T 825; it gives Pr EN ISO 13791 as a
reference regarding the calculation of cooling energy load, the most important energy
consumption variable for the southeastern and Mediterranean parts of Turkey. An
overview of the regulations in Turkey and the other countries examined is illustrated in
Table 4.7. One of the results of this work indicates that applying insulation leads not only
to a decrease in heating energy decrease but also to a reduction in cooling demand in hot
climates as well.
In standard TS 825, the calculation of degree days, which is used for determining thermal
insulation region classification, was not illustrated. In contrast, the climate classification
method, for example, is explained very detailed in ASHRAE Transactions 4610 and 4611.
Energy conservation and rational energy use are Turkey’s main problem areas for the
household sector. Because of the quality of the dwellings in Turkey, people consume more
energy to reach and maintain the comfort level. In order to minimize the problems in these
areas, the legislation side of those issues should be prepared carefully. In 2005, Turkey
published the “Energy conservation Law” in the light of the “EU Energy Performance of
the Buildings Directive”. After adapting this law, every building will have energy
certification. Private engineering offices determined and controlled by the Energy Ministry
of the country, will be responsible for giving energy certifications. Energy certification will
provide an essential amount of energy savings if the control mechanism of private
engineering offices works properly. This is due to the fact that, if the standards were not
mandatory in Turkey and would not be attached to any penalties, then most of the users
would not be aware of possible savings. On the other hand after some years during the
utilization, due to the energy prices they would face, they would be forced to spend a large
amount of money for renovations. In order to apply the energy certification law, similar
programs in some developed countries should be examined, for instance Energy Star Home

Building Energy Standards 47
(USA), R-2000 Certification (Canada), Klima Haus (Switzerland), Casa Clima (Italy) and
Energie Pass (Germany). Some of those programs are mandatory energy labeling programs
and is expected to be enforced in some of the countries, like Germany and Italy, by 2006.
Energy labels are usually given for industrial products and household appliances to show
their energy efficiency level, but buildings were also classified as products. For instance in
Switzerland they were given European labels from “A” to “G”. Buildings are labeled and
rated according to their annual energy consumption; letters represent each class.
Energy labeling can be utilized for pre-fabricated (factory made) buildings elements, such
as wall, roof and window by treating those elements as factory made products. Labeling
may be prepared in terms of thermal transmittance “U values”.
Even if Turkey has a thermal regulation standard, new standards can be developed by
using energy simulation tools for different representative buildings of the country in
different climates. This different process in preparing new energy codes can give more
significant and detailed results that are close to reality. One of the samples is the Egypt
energy code proposal. In developing energy codes for this country energy simulation tools
were used by experienced researchers. This standard developing process can be run
following these steps:
• new climate classification, more detailed variables, the ASHRAE standard for climate
classification can be a reference,
• energy survey of buildings; this step is based on the information regarding energy use in
buildings (shape, orientation, climate zone, number of residences, heating cooling
equipment, structure, insulation status, etc)
• utilization of energy simulation tools; after collecting of the data from the surveys a
simulation process close to reality could be achieved by using competitive simulation
programs
• having the simulation results, the public should be informed with respect to rational
energy utilization, energy conservation and the standards for a trail period
• Turkish regulations mostly advocate administrative regulations; methods should also be
investigated and examined

Building Energy Standards 48
Table 4.7: Overview of the building energy regulations in selected countries
Opaque Heating Cooling Total Energy DemandU Value SC (Shading Coefficient) SHGC (g-Value) U Value Qh Qc QT
Turkey X X XGermany X X XUnited Kingdom X X XSweden X X XDenmark X XNorway X XJapan X X X XKorea X XUSA X X X X X XUAE (Dubai) X X X
Building Envelope ElementsTransparent Countries
Building Energy Demand
.

Description of Model building systems 49
5. Prefabricated Residential Building Systems in Some Developed
Countries and Description of Selected Residential Building Systems in
Turkey
Two different types of housing construction systems were selected for simulation purposes.
One is a traditional system, which represents most of the dwellings in Turkey and has a
high amount of energy saving potential if it is properly constructed or renovated. The
second consists of , three pre-fabricated housing systems, chosen as the representatives of
new generation housing systems, which are going to dominate building systems in the
future because of their advantages with respect to time, economy and flexibility. Each
system utilizes different building materials. These three systems are:
- Interlocking brick system,
- Lightweight steel structure system,
- Aerated concrete system.
In this chapter, after explaining pre-fabricated residential building systems, energy efficient
and passive housing approaches in developed countries, the selected systems in Turkey are
evaluated with regards to their structure and materials, which are going to be used as
“reference cases” in simulations. The retrofitted cases of building systems are explained in
the next sub-chapters. For “base case” simulation window types of four systems are
assumed to be single pane.
5.1. Prefabricated Residential Building Technologies, Passive and Energy Efficient
Housing in Developed Countries
5.1.1. Energy Efficient and Passive Housing Approach
Energy efficiency and passive housing are new terms for Turkey, where people generally
look for mechanical solutions for their energy needs. It will be informative to investigate a
passive house in this work for a Turkish energy society in order to introduce passive house
applications in Germany and in Sweden, where climates are colder and the number of
passive houses higher than those of in Turkey. The second reason is to encourage Turkish

Description of Model building systems 50
construction, society and organizations by focusing on Turkey’s passive home design
potential as a result of its climate. A passive house is a house that provides comfortable
indoor climates without using any mechanical heating and cooling.
The definition from the Passive Haus Institute in Germany is;
“Passive houses are buildings, whose yearly heating heat requirement is so small that
without an active heating system can be heated, for example small heating requirement can
be supplied by supply air.”
A passive house is also called as “zero energy house” or as “house without heating”
Passive houses are defined by a standard (functional requirements), not by a building
method.
Criteria for passive houses are defined as follows:
� maximum constant energy load 10 W/m²k
� maximum annual space energy requirement 15 W/m²a
� maximum annual total amount of energy load 42 W/m²a
In addition to the general requirement of energy consumption, envelope thermal
transmittance values for passive houses are also regulated, but these are not mentioned as
mandatory requirements due to the flexibility in architectural design. According to the
Passive Energy Institute in Germany, thermal transmittance values (U value) of opaque
and transparent building envelope elements (windows) should be smaller than 15 W/m²K
and 0.8 W/m²K respectively.
Some of the key elements of passive houses can be classified as follows:
- Super insulation
Passive houses should have effective, continuous insulation within envelope without
thermal bridges

Description of Model building systems 51
- Air tightness
Another essential approach for passive house design is tightness of the building envelope
due to heat loss through air change. In Germany, the requirements for air tightness of
passive houses are defined by the Passive Haus Institute. For passive houses, the value
should be smaller than 0.6h-1.
- Heat recovery from exchange air
- Maximum solar heat gain. [36]
Finally, design should be done carefully in order to receive maximum solar heat during the
winter and to block direct solar heat during the summer, preventing overheating. This is
done by reviewing and determining the amount of heating demand. Thus, the minimization
of heat loss by reducing uncontrolled air change via tight structure and building envelope
enrichment should be considered during the design phase.
5.1.2. Prefabricated Residential Buildings
The construction has become more industrialized year by year due to the importance of
time, economy and quality aspects of buildings. Builders do not desire to be dependent on
weather. Accordingly, most of the construction process has being carried from the
construction site to the factory. The percentage of the factory process (production)
determines pre-fabrication rate of a construction. Building envelope plays an essential role
in estimating energy performance of the buildings; thus, quality and applications of
materials have significant influences. This can be achieved by using industrialized methods
during the production process in a covered area, a factory.
Pre-fabricated homes can be classified into four classes: manufactured homes, factory
made homes, modular homes and panelized homes. Prefabricated construction brings the
following advantages;
- a rational production process, assembly line automation like a commodity (for example:
car production)
- time independency, fast production and installation, weather independency

Description of Model building systems 52
- all elements of the construction system are produced in a covered area along with the
materials used; this results in high quality
- for mass production it is economic
- prefabricated homes require less heat energy due to a high level of insulation applied in
walls and roof
in addition to these advantages in production process, components can be supervised with
regards to energy efficiency and performance. [37]
This section will briefly illustrate different kinds of prefabricated housing techniques,
which represents the last level in prefabricated housing and some advanced housing
techniques, from some countries. Some pre-fabricated housing companies and applications
of panelized systems and unit systems, which represent most of the modern prefabricated
housing around the world, will be described and evaluated in this chapter.
5.1.3. Prefabricated Residential Buildings in Some Developed Countries
The production process of a factory made home is similar to other industrialized goods,
like a car production, which follows a pre-defined production process. A significant part of
new prefabricated housing can be divided into main types: panelized housing and modular
housing.
Prefabricated housing, so-called factory made housing, can be an important way of
producing new temporary and permanent residential buildings, especially for a country like
Turkey, which experiences high temporarily housing demand after natural disasters and
permanent energy efficient housing demand in general. In this section of the work
permanent prefabricated homes in some countries are investigated with respect to their
energy performance, production process and level of prefabrication. These sample systems
are chosen from different regions of the world; Germany, USA, Sweden, Japan and
Canada.

Description of Model building systems 53
5.1.3.1. Germany
In Germany, prefabricated housing builders mainly concentrate on the energy efficiency of
residential buildings.
Company Wolf has a panelized system with wall panels consisting of 28 cm thickness
sizes with thermal transmittance (U-value) of a 0.20 W/m²K. Another prefabricated
building company, HAAS Fertigbau has an envelope system that consists of walls that
have U-values of 0.155 W/m²K, a roof with 0.13 W/m²K and windows with three layer
glazing with U-values of 0.8 W/m²K. Both companies use a panelized system.
Baufritz in Germany developed an ecological external wall panel that consists of wood
shavings as insulation and roof panels as well. This innovative wall system, 40 cm
thickness, has a U value of 0.13 – 0.16 (W/m²K). The panels are carried to the construction
site and assembled there.
A research project from the Technical University of Munich focuses on a prefabricated
building that can be built in 24 hours, thanks to fast connectors developed by a research
team in Germany [40].
One of the interesting housing systems in Germany is the LBS System house which is built
by using prefabricated brick elements and modules. This system uses small traditional
materials like brick but the production process of wall units and modules takes place in
factory not on site. [41]
5.1.3.2. Japan
Japan has one of the most advanced prefabricated home sectors in the world, especially
with respect to the factory production process; they use robots to achieve the most rational,
advanced techniques and apply them to produce panels or units of dwellings:
Sekisiu Corp., is one of the companies, that represents this housing production strategy.
The company has two methods of home construction. Both systems are both made of box-
shaped prefabricated units. The production process is illustrated in Figure 5.1.
One of the systems is called “Unit Housing”, in which living spaces are formed by using
prefabricated unit boxes. The boxes are made of a steel frame structure covered by three

Description of Model building systems 54
kinds of cladding material compound panels of aluminium plate and gypsum boards,
Synthelite (a compound board made of cement and wood chips) and press-attached
porcelain tiles. Both systems have an 80% factory completion ratio. The company has 14
kinds of basic structural units, with cut units, large space units, functional units and over-
hung units: there are more than 80 kinds of units. After transportation of ten to fifteen units
from the factory to the construction site, a crew of six to seven workers and a crane install
the units in approximately four hours.
The units are tested in the factory in an artificial weather room with respect to heat
insulation, sound insulation, floor vibration, sweat resistance and water proof performance.
This advantage indicates a significant quality difference between prefabricated and
traditional construction techniques.

Description of Model building systems 55
a - Assembly line in a factory b - Utilization of the robots in production
c,d - Construction of a Unit box
e – Attaching the wall to unit f – installation of units at site

Description of Model building systems 56
Figure 5.1: Production and installation process of Sekisiu (Japan) home (a – e)
5.1.3.3. Scandinavian, Ireland
Housing companies in Scandinavian countries are renowned as the most energy efficient
and, the prefabricated housing builders are concerned about energy efficient design and
standards, two essential factors of construction because of the climate characteristics in
Scandinavia. This defines Swedish attitude toward a residential building, energy efficiency
is important for consumers as well as builders. The origins of the prefabricated housing
industry, had origins date back to the 18th century, so that this type of housing now
represents 90% percent of the dwellings in Sweden. There are no big quality differences
between manufacturers of homes, since the building regulations and standards are stringent
in the country. The factory production process allows continuity of construction in
Sweden, where the winter lasts six months, which is why duration construction on site is
not possible.
Reviewing some Swedish housing manufacturers, two types of factory made housing
systems are available; panelized and modular systems representing 76% and 24% of
housing construction respectively.
Top Housing AB is a Swedish company that applies international projects. After we
investigated their pre-fabricated home system, it was obvious that the most important
element of the building envelope in Sweden is insulation. The wall and roof insulation
sizes are 12 cm and 14.5 cm respectively, the system has an insulation layer which
separates the foundation and ground floor as well. It helps to protect cold air flow from the
ground.

Description of Model building systems 57
An Irish company, Scandinavian Homes LTD., is a company that combines energy
efficiency, Swedish tradition and factory made housing approaches together. They build
insulation fitted walls and roof for wood frame dwellings.
5.1.3.4. Canada, USA
In Canada and the USA there is a significant number of prefabricated housing companies
representing different kinds of pre-fabrication levels, from big or small modular homes to
panel homes. In the USA some organizations have been working on advanced housing
technologies. One of them is PATH (Partnership for Advancing Technology in Housing), a
public-private organization that aims to accelerate the use of new technology to improve
quality, energy efficiency, durability environmental performance and affordability of
housing in the USA.
Clayton Homes Inc. is a manufacturer of pre-fabricated homes; their home as a single unit
in the factory. For this system, transportation and the distance between factory and
construction site are main issues that must be solved. On the other hand the factory
completion ratio increases the quality of the homes which are built as ENERGY STAR
homes.
Les Industries Bonneville, a Canadian company, produces module boxes and panels, which
are connected on site according to the plans, for instance a one-story house consist of two
units and a two story home has four units.
Another building system, called “Quad-lock System”, is an Insulating Concrete Form
System made of Expanded Polystyrene (EPS) tied by High Density Polyethylene (HDPE)
and developed in Canada. Although the Quad-lock system is not a totally pre-fabricated
system, the energy performance of its building envelope makes the system competitive,
with 3 different structures and “U values” of 0.28 -0.20- 0.15 W/m²K respectively.
5.1.4. Integration of the Renewable Energies to Residential Buildings
After reducing energy use through the application of energy efficient design strategies, the
rest of the energy demand can be provided by renewable energy sources such as solar
panels, photovoltaic and small sized wind tribunes. As explained in the second chapter of
this work, Turkey has the third largest installation of solar water /heat capacity in the

Description of Model building systems 58
world. However, the architectural integration of renewable energies, such as solar panels,
is not successful enough, with regards to solar potential. The next planned work after this
will be the integration of renewable energies to reduce energy use in residential buildings
starting from the design phase. Combining this idea with the pre-fabrication approach will
be the future of home technology, for which construction time, profitability and advanced
passive design strategies are the most important features.
Photovoltaic (PV) integration will be briefly investigated in this subchapter. Roof and
façade integrations represent most of the applications, along with some other solutions of
integration for example: wall and balcony. The integration of PV elements can be divided
into 5 classes:
- applied invisibly
- added to design
- adding to architectural image
- determining architectural image
- leading to a new architectural concept [38]
Some integration samples from different countries are illustrated pictorially. The countries
that don’t have as much solar energy potential as Turkey such as Sweden, Denmark or
Germany, have more PV (photovoltaic) applications than Turkey. Thus the application
pictures of renewable energy elements can give some ideas about architecturally integrated
solar elements and encourage Turkish energy society, who is mostly dependent on fossil
fuel energy sources.

Description of Model building systems 59
Canadian Solar Decathlon house.
Concordia University and Université de Montréal
Roof integration of PV.
University of Michigan, Solar Decathlon house
External envelope integration
University of Maryland, Solar Decathlon houses
The roof elements with the PV-modules have been
prefabricated. The yearly solar electricity output
from the 19 semi-detached houses with PV is
expected to be 48000 kWh. Amersfoort -
Netherland, Artes Architekten & Adviseurs, Jan
Gizezen

Description of Model building systems 60
The PV-lamella system, yearly solar electricity
output of all the PV-systems in the
'Waterwoningen - Gele Lis' sub-project is
expected to be 9600 kWh. Amersfoort –
Netherlands, Atelier Z., Zderek Z.
Solgaarden-Kolding Apartments, Solgaarden -
Kolding , Denmark, Roof- and facade
integration. PV System Power: 107
Architect: Kjaer + Tichter A/S
Breisach, Germany. Single family house, Grid
connected. PV system power 5, 4. Type of
application sunscreens. PV-integration in this
project is facade integration as well as building
element and sunscreen.
Architect: Prof. Thomas Spiegelhalter
Row houses IGA, Stuttgart, Germany and
demonstration houses EXPO 2000, grid-
connected, PV System Power: 5, 3, Type of
application: sunscreens.
Architect: Hegger - Lühnen, Schleiff

Description of Model building systems 61
Roof renovation, Rappaneck, Germany
The PV-system is fitted on the roof, as well as
high efficiency solar thermal collector, covered
with transparent insulation. Transparent insulation
is also used for the façade. Freiburg, Germany,
residential building, PV system power 4.2, type of
application roof, single crystalline silicon
Architect: Hölker + Berghoff, D. Möller
Haus der Zukunft, Wels, Austria, residential
building, grid connected, 3, 47 kWp, facade + roof
application.
Architect: Sture Larsen
Solar low energy house with PV, solar thermal
collectors. Pietarsaari Solar House,
Pietersaari, Finland, residential house, roof
integrated PV, grid-connected, PV system power
2,2 , roof application, amorphous silicon

Description of Model building systems 62
5.2. Prefabricated and Traditional Residential Building Systems in Turkey
The pre-fabricated residential buildings selected for this research are not totally pre-
fabricated (factory made) systems. They are called pre-fabricated systems since the
systems have some factory made components, pre-fabricated wall units, floor units, etc. the
definition of the pre-fabrication level varies according to the system’s construction. Each
selected system represents a unique building envelope alternative (concrete interlocking
bricks, steel skeleton with insulation and aerated concrete blocks).
5.2.1. Interlocking Brick System
The interlocking brick construction system consists of interlocking bricks for external and
internal walls and pre-fabricated pre-stressed concrete hollow core panels for slabs (Figure
5.2).
Interlocking wall blocks, which are used for load-bearing walls and non load-bearing
walls, are made of cement, fly ash and aggregates. They are produced in different size.
Hollow core panels are used for flooring.
Wall units:
a) Load-bearing walls units; consist of concrete masonry blocks.
Size; 19cm thickness, 39cm length, 19cm width
b) Non load-bearing wall units; are used for decorative purposes.
Size; 9cm thickness, 39cm length, 19cm width
Floor units:
a) “Panelton”; is a pre-fabricated pre-stressed concrete hollow core panel. These panels
can also be used as floor or wall panels but in this work, they are used as a floor unit. Size;
15cm thickness, 120cm width and the length of the panels can be determined according to
the project by considering the load-bearing capacity.
In addition to above mentioned units, there are also reinforced horizontal and vertical bond
beams, which are created by using special interlocking brick units as a permanent
formwork. The size of the heat insulation that is used for walls varies between 6cm and
8cm and for the roof 10cm. [31]

Description of Model building systems 63
Figure 5.2: Interlocking brick system, a perspective. (Source: Yapi merkezi)
5.2.2. Lightweight Steel Framed System
The lightweight steel structure system is composed of a steel skeleton, which is constructed
with lightweight cold-formed steel members, covered with OSB panels (Oriented Strand
Board) from the exterior side of the wall and with plaster board from the interior side. The
system is made up of sheets of 4cm polystyrene insulation applied on OSB panels and
16cm mineral wool insulation sandwiched between OSB panels and plaster boards; all
installations are equipped between steel studs and those panels. The roofing structure is
also the same as the wall structure, but with additional sheeting covered as a finishing
layer. The floor structure is steel stud framing, on which OSB panels are layered. As with
the wall wall and roof structure, insulation is placed between the OSB panel flooring and
the plaster board ceiling. (Figure 5.3) The structures of selected building envelope
elements are assumed like in Appendix I. [32]

Description of Model building systems 64
Figure 5.3: The lightweight steel system, a perspective. (Source: Kosk yapi)
5.2.3. Aerated Concrete System
The aerated concrete system is built by using gas concrete (aerated concrete blocks) units
as wall, floor and in some cases roof elements. Since it has in-situ works, like columns,
foundation and beams at the floor level, on top of which floor units are installed, the
system is not totally pre-fabricated. (Figure 5.4) This system is made up of aerated
concrete wall and roof blocks covered with cement mortar from the exterior and gypsum
plaster from the interior face. Flooring consists of aerated concrete units with 15cm
thickness as well. [33]
Figure 5.4: A perspective for the aerated concrete system. (Source: YTONGTURK)

Description of Model building systems 65
5.2.4. Traditional (reinforced concrete) System
The traditional system chosen for simulation represents most of the dwelling structures in
Turkey, the so-called, reinforced concrete structure system. This system consists of hollow
clay brick external and internal walls and the load-bearing skeleton, composed of
reinforced concrete floors, beams and columns. Both the external and internal walls are
covered by cement plaster from both sides. Figure 5.4 illustrates an incomplete reinforced
concrete system with its skeleton and walls but without finishing. The other detail is the
typical detail of the floor and wall connection for the reinforced concrete system.
Significant parts of the reinforced concrete dwellings in Turkey have no insulation. (Figure
5.5)
Figure 5.5: Typical reinforced concrete system in Turkey without plasters.

Description of Model building systems 66
5.3. Conclusion and Recommendations
Energy efficiency and energy conservation are essential problem areas for Turkish housing
stock. The quality of dwellings and their application without standards cause waste of
energy, time, and natural artificial resources. Most of these problems are determined by
their construction methods and materials, which is mainly the traditional construction
(reinforced concrete) system in Turkey. Because of Turkey’s quality housing demand in
the future, pre-fabrication methods can be a solution for building healthy and energy
efficient dwellings in a short amount of time. On the other hand, applications of
prefabricated dwelling constructions are economic for mass housing. The passive housing
approach, which uses natural resources for energy needs, should also be investigated and,
likewise Turkey’s potential analyzed: users of residential or commercial buildings are
likely to use mechanical solutions even for the smallest energy needs without looking for
natural solutions. As we saw in the simulations made for this work, natural solutions, so-
called passive housing strategies reduce energy use dramatically, especially in extreme
climates. Thus, common user ideas should be broken by recognizing these strategies which
can create more economic and healthier living spaces. In addition, some new technologies
like the shading system are equipped with sensors that schedule the shading devices which
work according to (depend on) the solar radiation on the transparent surfaces or indoor
temperature.
Pre-fabricated systems, investigated in this chapter from different developed countries, are
good reference points. For instance, the system from Japan can be one with respect to
production and assembly methods: the other systems, for which the energy efficiency
aspect is most important, such as in Germany and Sweden, are also very competitive
systems regarding their envelope properties, especially for cold climates. These sample
building systems in Germany and Sweden have wall structures that give homes a very
thick insulation layer: the optimum insulation thickness determined for there cities in this
work can be the reference point for Turkey. The prefabricated systems for some countries
and the systems that selected for this work in Turkey can be summarize regarding their
degree of factory completion, energy efficient design, thermal transmittance values and
insulation (Table 5.1).

Description of Model building systems 67
Table 5.1: Properties of the prefabricated building systems for some countries
Countries and Building Systems
Deg
ree
of p
refa
bric
atio
n (F
acto
ry c
ompl
etio
n)
Ene
rgy
effic
ient
des
ign
The
rmal
tran
smitt
ance
"U
" va
lues
(W
all)
[W/m
2 K]
Insu
latio
n
Traditional ─ ─ 1,65 ─ Interlocking Brick 40% X 0,31 X Lightweight 40% X 0,17 X
Turkey
Aerated Concrete 50% ─ 0,87 ─ Germany Panelized 70% X 0,13-0,20 X
Factory made 90% X NA X Panelized 70% X NA X USA, Canada Semi-prefabricated 50% X 0,15-0,28 X Panelized 70% X NA X
Scandinavian Modular 70% X NA X
Japan Factory made 80% X NA X
- Applicability of New Techniques in Turkey (discussion about the economy, climate
and stability)
Applicability of new pre-fabricated systems mentioned in this chapter in Turkey can be
successful, if the public is given information about pre-fabrication. Prefabricated housing
has a negative stigma in the Turkish community due to a lack of information and bad
applications after large earthquakes in Turkey. This introduction of pre-fabricated systems
should include these aspects:
- Pre-fabrication is not always applied for temporary buildings, but also permanent and
high quality buildings. The Izmit earthquake in 1999 was very bad advertisement for
prefabricated homes, since those that were built after the earthquakes as temporary
prefabricated dwellings were of poor quality and had a negative influence on the users
and Turkish public opinion.
- definition of prefabrication,
- energy efficiency, energy efficient pre-fabricated homes

Description of Model building systems 68
- economic efficiency
- technology level for the production process
Regarding integration of renewable energies, in the long term PV applications could also
boom in Turkey like solar thermal panels if the prices of PV are affordable. It is very
essential to investigate profitability of renewable energies in general and PV application
specifically. This may be assessed by either different simulation programs or site
measurements, choosing different climate regions of Turkey as prototypes.
- Some General Proposals of Prefabricated Energy Efficient Residential Buildings
Prefabrication is more open to innovations than traditional systems. Innovative solutions
can be developed to minimize the energy loads of dwellings. For instance portable walls
which work as a thermal mass or include some shading, ventilation ideas, prefabricated
glazing units integrated with factory made panels or units, thick hollow brick wall panels,
through which pipes runs to cool the buildings by circulating ground water and panel
connectors - these are all very important for time saving and flexibility factors of the
building construction.
Portable thermal mass walls: Pre-fabricated mobile thermal mass walls may be applied to
store hot daytime temperature and for cold climates to release stored heat into the room at
night. It can be called as “Mobile Tromble Wall”
Brick blocks for hot dry areas: Hollow brick block elements with a minimum thickness of
40 cm can be used for the building envelope and roof. Hollow brick performs well with
regards to cooling loads. In addition, further cooling can be achieved by running pipes
through these brick blocks through which ground water circulates.
Innovative connectors for panels: Some innovations are being made by different
companies for quick pre-fabricated panel connectors.
New sandwich panels or boxes that contain all services: After assessing the energy
performance of the envelopes, wall or unit elements can be proposed for every climate
type.

Energy Analysis of the Selected Building Systems 69
6. Energy Analysis of The Sample Building Systems in Turkey
6.1. Methods
The dynamic Transient System Simulation program (TRNSYS), which was developed by
University of Wisconsin, is used to simulate and analyze the thermal performance of the
selected residential building systems. TRNSYS is a transient system simulation program
with a modular structure where each component is described and written in FORTRAN
language. Some of the utility programs of TRNSYS are PREBID (building description
program), ISIBAT, TRNSED and TRNSHELL.
PREBID: building envelope definitions (wall, ground, roof, floor structure, orientation of
the envelope and their size), part of the simulation strategies and orientation information,
in short, all building descriptions are defined in this TRNSYS utility program. Firstly, the
(*.BUI) file is one of the components of the building description, in which geometry and
thermal properties of the building are created (TRNSYS Manual). This file is processed by
the program BIDWIN, which uses information in the (*.BUI) file to generate two new
files: (*.BLD) and (*.TRN). (*.BLD) is a file containing geometric information about
building and the (*.TRN) file contains ASHRAE transfer functions for the walls. BIDWIN
generates an information file (*.INF) which indicates inputs and outputs of a multi-zone
building model (TYPE 56).
In the definition of building envelope materials, there is a material library in this multi-
building zone component. New materials can also be defined when the user enters required
values for materials. Ventilation, cooling, heating, infiltration and internal gains (number
and activity of residents, electrical devices, appliances etc) are some of the variables that
can be defined in this program. It takes the multi-zone building description and integrates it
into the ISIBAT program as a component to run the simulation. There are significant
numbers of outputs in PREBID program that are related to energy use, heat gain and loss,
air temperature, relative humidity, etc.
ISIBAT is a general simulation environment program, which houses the TRNSYS
simulation engine and most of the stand-alone utility programs. In this program a graphical

Energy Analysis of the Selected Building Systems 70
interface is created by the user and contains inter-connected components to run the
simulation. Some of those components used in this work are Type 9d (data reader which
contains weather data), Type 16 (solar radiation processor; the orientation information,
latitude and other inputs related to radiation are given in this component), Type 69 (fictive
sky temperature for long-wave radiation exchange), Type 33 (dew point temperature and
relative humidity), Type 56 (multi-zone building); printer and monitor components. More
components can be added according to the simulation features. (Figure 6.1) [34]
Figure 6.1: TRNSYS simulation window interconnected components (ISIBAT)
The weather data are obtained from METEONORM, a meteorological database for energy
applications, which has over 7400 meteorological stations worldwide, including many
cities in Turkey and the cities used for the simulations. METENORM can provide very
detailed hourly (8760 hours in a year) data, from radiation to precipitation values, in
different formats. The TRNSYS weather format is used for the simulation purposes and
includes average data from a span of 10 years on solar radiation (global, beam radiation
and diffuse radiation), relative humidity and ambient temperature.

Energy Analysis of the Selected Building Systems 71
6.2. Climate and Geographical Characteristics of the Selected Cities
Three cities - Antalya, Istanbul, Erzurum – each representing different climate zones in
Turkey, are selected for the energy simulation of sample building systems. The hourly
annual weather data is obtained from the METEONORM program as a component of the
simulations; however, in this sub chapter general climate and geographical characteristics
of the three cities are examined and illustrated graphically [35].
0
5
10
15
20
25
30
35
40
45
Jan Feb Mar Apr May Jun Jul Aug Sep Oct Nov Dec
Tem
pera
ture
[°C
]
0
50
100
150
200
250
Pre
cipi
tatio
n [m
m],
Rel
ativ
e H
umid
ity [%
]
Precipitation Relative HumidityMean Ambient Temperature Minimum Ambient TemperatureMaximum Ambient Temperature
Figure 6.2: Climate characteristics of Antalya
Figure 6.2 above shows maximum, minimum and average ambient temperatures, relative
humidity and precipitation for each month in Antalya. Both the Aegean and Mediterranean
regions of Turkey have a typical Mediterranean climate: mild winters and hot summers.
Antalya’s rainy season is in the winter, from October to April. In the summer rainfall is
quite low in contrast to the winter. The total amount of yearly rainfall reaches 1079 mm.
The average mean temperature during the summer is 28 °C and in winter does not fall
below 10 °C. The maximum temperature can increase to 40°C in the summer, and the
difference between maximum and minimum ambient temperature is approximately 20°C.
Relative humidity is generally around 55% and 60%.
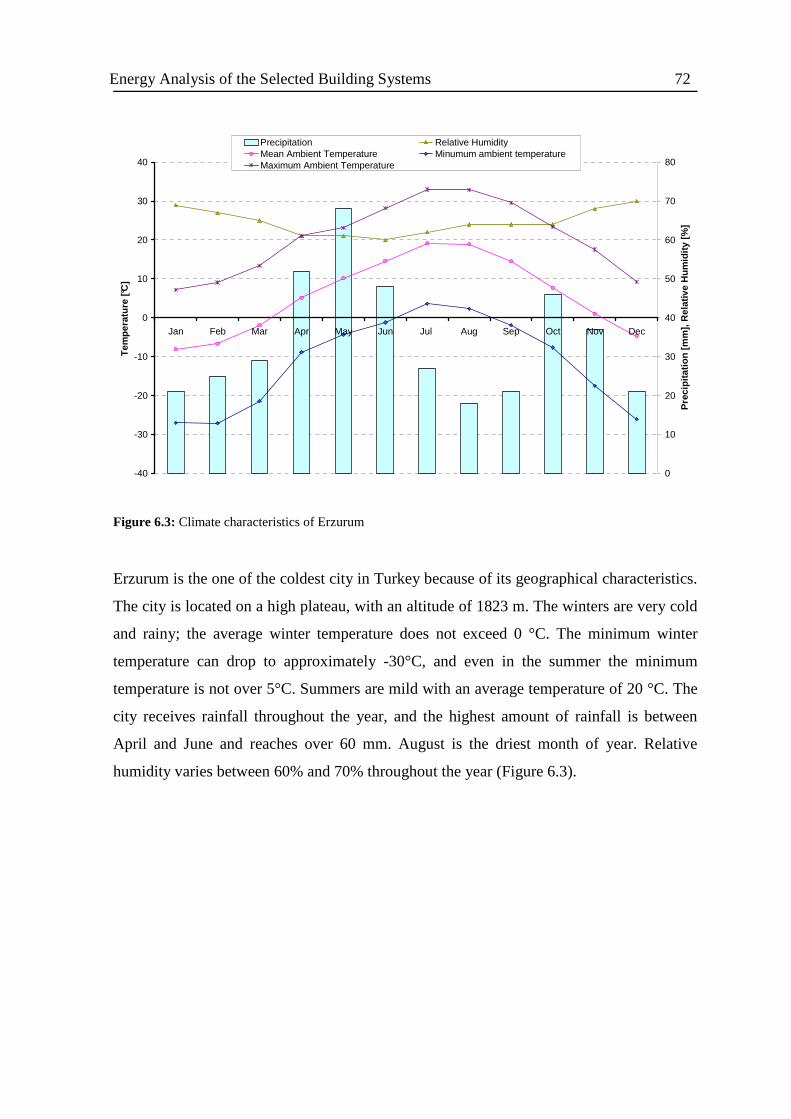
Energy Analysis of the Selected Building Systems 72
-40
-30
-20
-10
0
10
20
30
40
Jan Feb Mar Apr May Jun Jul Aug Sep Oct Nov Dec
Tem
pera
ture
[°C
]
0
10
20
30
40
50
60
70
80
Pre
cipi
tatio
n [m
m],
Rel
ativ
e H
umid
ity [%
]
Precipitation Relative HumidityMean Ambient Temperature Minumum ambient temperatureMaximum Ambient Temperature
Figure 6.3: Climate characteristics of Erzurum
Erzurum is the one of the coldest city in Turkey because of its geographical characteristics.
The city is located on a high plateau, with an altitude of 1823 m. The winters are very cold
and rainy; the average winter temperature does not exceed 0 °C. The minimum winter
temperature can drop to approximately -30°C, and even in the summer the minimum
temperature is not over 5°C. Summers are mild with an average temperature of 20 °C. The
city receives rainfall throughout the year, and the highest amount of rainfall is between
April and June and reaches over 60 mm. August is the driest month of year. Relative
humidity varies between 60% and 70% throughout the year (Figure 6.3).

Energy Analysis of the Selected Building Systems 73
-5
0
5
10
15
20
25
30
35
Jan Feb Mar Apr May Jun Jul Aug Sep Oct Nov Dec
Tem
pera
ture
[°C
]
0
20
40
60
80
100
120
Pre
cipi
tatio
n [m
m],
Rel
ativ
e H
umid
ity [%
]
Precipitation Relative HumidityMean Ambient Temperature Minumum ambient temperatureMaximum Ambient Temperature
Figure 6.4: Climate characteristics of Istanbul
Istanbul receives rainfall mainly in winter but also throughout the year due to its
geographical situation; it is surrounded by three seas and has a Black Sea coast. Generally,
rainfall appears between September and April; the highest amount of rainfall is over 100
mm in the December. The driest season is summer, when monthly mean temperature
doesn’t exceed 25°C, and in winter the temperature is between 5°C-10°C. The difference
between maximum and minimum ambient temperature is nearly 15°C. In winter the
temperature can fall below 0°C but not less than -5°C. In addition, the climate is also
influenced by the city’s structure and planning (Figure 6.4).
Table 6.1: Altitude and geographical situation of the cities
Cities
Height above sea level [m]
Latitude Longitude
Antalya 0 36.53 N 30.42 E
Erzurum 1823 39.57 N 41.17 E
Istanbul 2 41.02 N 28.57 E

Energy Analysis of the Selected Building Systems 74
Antalya lies in the Mediterranean region of Turkey and is surrounded by high mountains;
however, the city is situated at an altitude of 0 m. Erzurum is situated at an altitude of 1823
m at the foot of Palandoken Mountain. The city is the largest city in the eastern Anatolian
Region. Istanbul is one of the most populated cities in Europe, connecting Asia and
Europe. The city is surrounded by the Black Sea and Marmara Sea and has an altitude of 2
m (Table 6.1).
0
20
40
60
80
100
120
140
160
180
200
220
240
Jan Feb Mar Apr May Jun Jul Aug Sep Oct Nov Dec
Glo
bal H
oriz
onta
l Rad
iatio
n [k
Wh/
m²]
Antalya Erzurum Istanbul Dortmund
Figure 6.5: Global horizontal radiation in Antalya, Erzurum, Istanbul and Dortmund
Figure 6.5 above shows solar radiation intensities of the three cities in Turkey and
Dortmund. All cities, including the coldest city in Turkey, have higher solar intensities
than Dortmund. As seen in the graph, Antalya has the highest solar global horizontal
radiation, thus, the primary goal of building design should be to lower solar heat gain,
while using maximum solar heat gain as much as possible in Erzurum is the best solution
for this heating dominated climate. In summer Istanbul has almost the same amount of
solar intensity as Antalya. During the winter solar radiation is almost one-third of that in
the summer for Antalya, however for the other cities Erzurum and Istanbul this ratio
changes to 1/3 and 1/4 respectively.

Energy Analysis of the Selected Building Systems 75
6.3. Building Model
The model project is chosen as a two story multi-family building (Figure 6.5). Each story
is divided into two thermal zones named Room first (RF), Room ground (RGR), Saloon
first (SF), Saloon ground (SGR), due to their orientations, type of use and the amount of
thermal mass internal walls. Both zones are separated by a common load bearing wall and
have different usage: a daytime and a nighttime use. The long surfaces of the model
building are faced northeast and southwest. Floor height is 2.80 m. Total internal wall area
is 165.36 m², mostly within the RF and RGR zones. The dimensional properties of the
model project are given in Table 6.2. Plan and elevations of model building is given in the
Appendix L.
This prototype project is applied for all selected systems in order to accurately compare
their thermal performance. In the simulation process, the materials of the envelope systems
are varied according to the systems.
Figure 6.6: Floor plan of selected building model for simulations (Source: Yapi Merkezi)
N
Zone RF
Zone SF

Energy Analysis of the Selected Building Systems 76
Table 6.2: Some geometrical dimensions of the model building
Floor Area (m²) 157.32
Volume (m³) 440.5
A/V ratio 0.36 External Wall area (m²)-without windows 189.85 o SE Wall 32.88
o SW Wall 63.12
o NE Wall 58.09
o NW Wall 35.76
Internal wall area (m²) 165.36
Window Area (m²) 15.12
o SE Windows 5.76
o SW Windows 0.72
o NE Windows 5.76
o NW Windows 2.88
Wall/Window ratio (%) 7.3
o SE 14.9
o SW 1.12
o NE 9.02
o NW 7.5
Roof Surface Area (m²) 90.06
- NE 45.03
- SW 45.03
6.4. Strategies and Assumptions for the Simulations
Thermal modelings of four residential building systems were based on some assumptions.
Simulations were performed in two phases, “Reference case” and “Improved case”. Firstly,
the reference cases of systems were determined and simulations were carried out. In the
second phase, all energy efficient design strategies and improvements were applied to
compare and see energy saving performance of the systems between the reference case and
the improved energy efficient case. Having the results of both simulation cases, two main
comparisons were made: the cooling and heating energy demand of each building system
in the three cities.
The second comparison between the building systems is to indicate the exact temperature
over 26 °C and for cold climates the exact temperature below 20 °C, along with ambient
temperature, which gave us a picture to evaluate the performance of the building envelope
of each system and the energy efficient design strategies. The design strategies are
investigated one by one in order to show their influence on the energy saving performance

Energy Analysis of the Selected Building Systems 77
of the building systems. The improvements of the systems for each city (climate) differ
with respect to some strategies. For instance, in this work for Istanbul, Erzurum and
Antalya different orientation strategies were used due to their climate characteristics.
Those strategies are shortly defined by the following graphics. The improvements were
applied for both in PREBID and ISIBAT according to the variables.
“Reference case” strategies: Heating and cooling reference temperatures are set at 20°C
and 26°C respectively for all zones. Gains are considered as; four people use the zones in
the given time schedule. The air-change rate is calculated/estimated as hygienic ventilation
of 0.7-h during the day and night, which is calculated according to the DIN 1946-T2 (30 m³
per person). The ASHRAE 2001 fundamentals defined ventilation air requirement for
houses, essentially 035-h with at least 8L/s per occupant.
“Improved case” strategies: For improved cases the nighttime set up heating strategy was
applied during the night between 24:00 and 08:00 hours. The heating temperature was set
at 18°C (night) and 20°C (day), and the cooling reference temperature remained the same
as in the reference case, 26°C. The most important goal of this thesis was to compare
energy performance of the selected building systems. Accordingly due to that reason some
internal gains from appliances, computers etc. that do not have a significant influence on
energy use for such a model are not considered in the simulations.
In the improved case, window sizes are decreased from 1.44 m² to 1.2 m² for Erzurum in
order to minimize heat loss through the transparent openings.
The user schedule is defined equally in both the reference and improved case as:
- for both RF and RGR zones: 4 people between 23:00 and 08:00
- for both SF and SGR zones: 2 people between 08:00 and 23:00

Energy Analysis of the Selected Building Systems 78
0
0.5
1
1.5
2
2.5
3
3.5
4
4.5
5
5.5
0 2 4 6 8 10 12 14 16 18 20 22 24
Hours
Air
chan
ge [h
-1]
Ventilation OFFVentilation ON
Figure 6.7: Ventilation strategy for Antalya in the improved case (Night Ventilation)
As seen in the Figure 6.7 the ventilation strategy for Antalya is set up as night ventilation
to get cool-night ambient air inside by opening and closing the windows. It is assumed that
the windows are opened during the night between 22:00 and 08:00 with an air-change rate
of 5-h, if the room temperature is greater than the ambient temperature and the ambient
temperature is higher than 20°C. In addition, the ventilation rate remains constant during
the day with a rate of 0.7-h to supply hygienic air for residents. As it is illustrated in the
graphic, between 08:00 and 22:00, only a hygienic air-change rate of 0.7-h is applied. The
reason for choosing night ventilation was the high daytime ambient temperatures in
Antalya.
For both of the heating dominated cities, Istanbul and Erzurum, the same ventilation and
infiltration strategies were assumed in the simulations. The strategy was considered as
follows: if the room temperature is greater than the ambient temperature and over 25 °C,
the building is ventilated by half-opened windows with an air change rate of 5-h, otherwise,
just the infiltration rate stays with the value of 0.7-h.

Energy Analysis of the Selected Building Systems 79
0
20
40
60
80
100
120
140
160
180
200
220
240
260
280
0 1 2 3 4 5 6 7 8 9 10 11 12 13 14 15 16 17 18 19 20 21 22 23 24 25 26 27 28 29 30 31 32 33 34 35
Ambient Temperature [°C]
Glo
bal R
adia
tion
[W/m
²]
CLOSE
OPEN
OPEN
CLOSE
OPEN
CLOSE
Figure 6.8: Shading strategy of the improved case for Antalya
In the regions with hot summers, a climate like Antalya and other southern regions,
shading strategy is a very important energy saving element. The strategy chosen for
Antalya depends on global radiation and ambient temperature, a mathematical equation
representing the shading device is set up in the ISIBAT program. Boundary ambient
temperatures were selected as 10° C and 23 °C and their match of global radiation values
of 120 W/m² and 250 W/m² (Figure 6.8). Thus, if ambient temperature is between 0°C and
10 °C and global radiation is more than 250 W/m² the shading device will be closed. In the
simulations that were carried out for Istanbul and Erzurum, no shading devices were
applied because for those climates cooling loads were small in the reference case
simulations.
Figure 32 shows heating and cooling strategies used in simulations for Antalya. Cooling is
going to be applied after the room temperature reaches over 26°C, and heating is activated
when the room temperature is under 18°C between 0:00-8:00 during the nighttime set up;
during the day the heating reference temperature is set up as 20°C (Figure 6.9).

Energy Analysis of the Selected Building Systems 80
10
12
14
16
18
20
22
24
26
28
30
0 2 4 6 8 10 12 14 16 18 20 22 24
Hours
Tem
pera
ture
[°C
]
Cooling On
Cooling Off
Heating Off
Heating On
Figure 6.9: Heating and cooling strategy for Antalya in the improved case (with nighttime set up)
Heating and cooling strategies for Istanbul and Erzurum:
- cooling will be activated when the indoor operative temperature is higher than
26°C,
- the zones will be heated if indoor operative temperature is lower than 18°C
Constructional properties for each system before and after improvements are presented in
Appendix J and K. The criteria for selection of the systems are;
• One of the thesis goals is to analyze energy performance of the prefabricated
residential buildings in Turkey and compare it with reinforced concrete residential
buildings. The yearly housing demand in Turkey is almost 300.000 according to
the government report in 2002. Thus, the country needs fast, economic and energy
efficient housing stock, prefabricated systems can supply these 3 requirements.
Three prefabricated systems have many applications of new housing projects in
Turkey; therefore it will be useful to investigate these systems regarding their
energy consumption. In addition, among the prefabricated residential building
systems these systems share first three places.

Energy Analysis of the Selected Building Systems 81
• A significant number of the residential buildings in Turkey is reinforced concrete
buildings and not insulated. Thus, improvement of the reinforced concrete
residential building systems is an essential task with respect to energy saving and
conservation.

Energy Analysis of the Selected Building Systems 82
6.5. Analysis of the Simulation Results
The simulations of four different residential building systems were performed with respect
to different aspects of energy use and thermal performance:
- Analyzing the results with regard to heating and cooling loads
- Analyzing the results with regard to number of zone temperatures over 26°C and below
20°C
- Analyzing the results with regard to building performance on the hottest day of year
- Analyzing the results with regard to different design strategies
The traditional System, which represents most of the residential buildings in Turkey and is
generally built without insulation, shows the worst performance in both the hot region
(Antalya) and the cold region (Erzurum): especially in Erzurum the heating requirement is
almost two and a half times the maximum requirement in Turkish Standard-825. Other
prefabricated systems perform better than traditional systems before and after the
improvement of the systems.
Primary energy is calculated according to the DIN-4701. It is overall energy, including the
energy used to generate the delivered energy (final energy) and to transport it to a building.
The factor for multiplication with the delivered electricity is based on a country’s energy
mix for generation of electricity. Energy delivered to the building, like gas, oil or other
fuel, electricity, district heat etc. Effective energy is the amount of energy which has to be
provided by the technical systems in order to satisfy the needs of the rooms. [46] (Figure
6.10). The TRNSYS simulation results give building energy use. Primary energy source
for heating is natural gas, for which primary energy factor (fp) is 1.1, and the loss during
the distribution of energy to the building is 15% of delivered energy (final energy).
Primary energy source for cooling is electricity with primary energy factor of 2.9.

Energy Analysis of the Selected Building Systems 83
Figure 6.10: Primary, delivered and effective energy (Source: www.euleb.info)
6.5.1. Analysis of the Results with Regard to Heating and Cooling Energy Loads
In hot climates like Antalya, all systems have significant amounts of cooling loads. The
reference simulation highlighted the interlocking brick system and lightweight steel
skeleton system, which accommodate insulation and show better performance than the
systems without insulation, the aerated concrete system and the traditional system.
Although the most important issue for Antalya is cooling, heating demand for the
traditional system exceeded the maximum required amount mentioned in TS-825 standard
in the reference case simulation. Surprisingly, the lightweight system showed the second
best cooling and heating energy performance after the interlocking system because of its
lower thermal transmittance features, which result in a minimum heat gain and heat loss
(Figure 6.11).

Energy Analysis of the Selected Building Systems 84
45.8
47.8
15.0
9.4
70.0
61.1
18.0
9.7
21.2
44.5
13.1
8.8 32.5
44.7
11.9
6.8
0
20
40
60
80
100
120
140E
nerg
y D
eman
d (P
rimar
y E
nerg
y) [k
Wh/
m².a
]
ReferenceCase
improvedcase
ReferenceCase
improvedcase
ReferenceCase
improvedcase
ReferenceCase
improvedcase
Aerated ConcreteSystem
Traditional System Interlocking Brick System
Leightweight System
Heating Loads [kwh/m²a] Cooling Loads [kwh/m².a]
Max. Heating requirement according to TS-825 (54,68 kWh/m².a)
Figure 6.11: Energy loads (primary energy) in Antalya before and after the improvements
After applying energy efficient strategies - including ventilation, shading, insulation and
different glazing types – the cooling and heating energy demands sank dramatically for all
building systems. Improving reference systems indicated the highest energy use decrease
in the traditional system and the aerated concrete system. The decreases in heating loads,
due to the application of a 5 cm thick insulation in the improved case and some design
strategies, are (from 70 kWh/m².a to 18 kWh/m².a) over 70% in the traditional system and
over 60% in the aerated concrete system, which is under the required load required in the
Turkish standards (54, 68 kWh/m².a). Energy use for the other two pre-fabricated systems,
the interlocking brick and the lightweight system, is reduced by almost 50 % and had 60 %
respectively.
Advanced design strategies are mainly applied to lower cooling demand for Antalya. In
such a climate this is more important than heating demand, which is why design strategies
resulted in large decreases in cooling demand for all systems, especially in traditional
system with more than an 80% decrease. It can be concluded that thermal mass systems
with a small insulation size can perform better performance with regards to cooling and
heating loads without having any improvements. Not only applied design strategies have

Energy Analysis of the Selected Building Systems 85
influence in decreasing energy use, but also thermal transmittance values of the building
envelope limit heat loss and gain. Thus, the lightweight system indicates best performance
even in a hot climate with the help of shading and high daytime ventilation, which blocks
solar heat gain through the windows during the day and exhausts hot air during the night.
114.9
15.0
31.8
6.1
167.6
17.3
53.8
4.6
63.1
18.4
35.1
4.9
74.5
20.2
23.3
7.9
0
20
40
60
80
100
120
140
160
180
200
Ene
rgy
Dem
and
(Prim
ary
Ene
rgy)
[kW
h/m
².a]
ReferenceCase
improvedcase
ReferenceCase
improvedcase
ReferenceCase
improvedcase
ReferenceCase
improvedcase
Aerated ConcreteSystem
Traditional System Interlocking Brick System
Leightweight System
Heating Loads [kwh/m²a] Cooling Loads [kwh/m².a]
Max. Heating requirement according to TS-825 (87,17 kWh/m².a)
Figure 6.12: Energy loads (primary energy) in Istanbul before and after improvements
In moderate climates like Istanbul, due to the cold winters, heating loads are more
important than cooling loads. In the reference case two systems, the interlocking brick and
lightweight steel systems, show the best performances regarding heating energy, thanks to
their insulation. The interlocking brick and the lightweight systems had heating energy
savings of 57% and 68% respectively after modification of the reference building. The
other two systems exceeded the maximum standard value of heating energy demand
mentioned in standard TS-825. In the simulation process, installation of 5 cm insulation for
both the aerated and the traditional systems resulted in a large heating demand decrease
(from 167 kWh /m².a to 53 kWh /m².a). Heating energy savings of 70% for the aerated
system and 67% for the traditional system were achieved. Especially applying small sized
insulation to the aerated concrete resulted in significant energy savings. All systems

Energy Analysis of the Selected Building Systems 86
achieved more than a 50% cooling load decrease; the traditional and interlocking brick
systems had the lowest cooling loads out of the four systems (Figure 6.12).
275.6
5.8
108.0
2.6
395.6
0.8
152.3
1.6
154.7
10.4
111.1
1.8
177.6
13.9
80.7
3.4
0
50
100
150
200
250
300
350
400
Ene
rgy
Dem
and
(Prim
ary
Ene
rgy)
[kW
h/m
².a]
ReferenceCase
improvedcase
ReferenceCase
improvedcase
ReferenceCase
improvedcase
ReferenceCase
improvedcase
Aerated ConcreteSystem
Traditional System Interlocking Brick System
Leightweight System
Heating Loads [kwh/m²a] Cooling Loads [kwh/m².a]
Max. Heating Requirements according to TS-825 (154 kMh/m².a)
Figure 6.13: Energy loads (primary energy) in Erzurum before and after improvements
Erzurum, which is situated at an altitude of 1800 m, has a very cold climate. Accordingly,
almost all systems, with the exception of the interlocking brick system, failed to meet the
standards under the TS-825 heating energy requirement, which was defined for Erzurum in
the reference case. Even in the improved case, the traditional system is close to the
maximum reference heating demand. Although the city is too cold important heating
energy savings are achieved close to 60%, by applying new design strategies; especially
the impact of insulation on heating demand was significantly effective.
Heating loads sank almost to one-third of the reference case demand after improvements
for all systems except the interlocking brick system, in which heating loads decreased just
50 kWh/m²a one-third of the heating load. Insulation for the traditional and aerated
concrete systems has the greatest influence on the minimization of heating demand because
of the climate conditions in Erzurum. Having regarded to very few cooling dominated
days, the lightweight system shows the worst performance with regard to cooling demand.

Energy Analysis of the Selected Building Systems 87
This is a consequence of the transmittance properties of the building envelope, which is not
thermal mass and has the smallest thermal transmittance value out of the four systems.

Energy Analysis of the Selected Building Systems 88
6.5.2. Analysis of the Results with Regard to Zone Temperatures Greater Than 26°C
for Improved Systems
The second general evaluation of these systems was made by comparing the temperatures
that exceeded 26°C for the three climates for cooling load evaluation. The results represent
the temperatures without considering mechanical cooling or heating, so-called, free
running temperatures. In addition, the systems can be compared with respect to
temperature frequency higher than 26°C as a result the capacity of cooling systems can be
deduced from those charts.
050
100150200250300350400450500550600650700750800850900950
1000
>26 >27 >28 >29 >30 >31 >32
Temperature [°C]
Hou
rs
Lightweight-rf Aerated concrete-rf Interlocking brick-rf
Traditional system-rf Ambient Temperature
Figure 6.14: The RF-zone temperatures greater than 26°C in Antalya (after improvements)
In Antalya, the temperature range for the interlocking brick system and the traditional
system, both thermal mass systems, is between 26°C and 29°C. The temperatures generally
concentrated between 26°C and 27°C, which are close to the reference temperature for
cooling. On the other hand the lightweight system and the aerated system have higher
temperatures than those two thermal mass systems. Consequently, those systems need
more cooling energy to reach the comfort level. As we see in the chart, the aerated concrete
and lightweight systems have greater temperature fluctuations between 26°C and 31°C.
The higher the temperature is, the higher the cooling energy it needs. (Figure 6.14)

Energy Analysis of the Selected Building Systems 89
After improvements, the difference between the ambient temperature and the indoor
temperatures for the systems increased all systems showed better performance than in
reference case.
0
50
100
150
200
250
300
>26 >27 >28 >29 >30 >31 >32 >33
Temperature [°C]
Hou
rs
Lw-ant-heat-rf Aerated-ant-heat-rf Int. Brick-ant-heat-rf Ambient Temperature Traditional-heat-rf
Figure 6.15: The RF-zone temperatures greater than 26°C in Erzurum
In Erzurum, the temperatures exceeding 26°C are not as high as in the other cities;
however, the systems do have cooling demands for some days of the year. The lightweight
system shows the worst performance regarding cooling loads in Erzurum, although just
140 hours in a year are over the 26°C reference temperature, while the other systems have
fewer temperatures exceeding 26°C (Figure 6.15). In addition, the number of temperatures
lower than 20°C can give significant information to asses how important the heating needs
are.

Energy Analysis of the Selected Building Systems 90
0
100
200
300
400
500
600
700
800
900
1000
>26 >27 >28 >29 >30 >31 >32
Temperature [°C]
Hou
rs
Lw-ist-heat-rf Aerated-ist-heat-rf Int. Brick-ist-heat-rf Ambient Temperature Traditional-heat-rf
Figure 6.16: The RF-zone temperatures greater than 26°C in Istanbul
Istanbul lies in a moderate climate; differences between systems can be seen more clearly
than that in the hot climates. The fluctuation of temperature does not change itself, but the
temperatures exceeding 26°C are higher in the lightweight and aerated concrete systems
than in the interlocking brick and traditional systems. The temperature range was mainly
situated between 26°C and 28°C for the interlocking brick and traditional systems, while
for the lightweight and aerated systems temperature fluctuates between 26°C and 30°C.
Both the lightweight and aerated concrete systems have higher temperatures than the
interlocking brick and traditional systems they were between 28°C and 30°C. This means
more energy efficient improvements are needed for these systems in order to decrease the
temperature to an adequate level (Figure 6.16).

Energy Analysis of the Selected Building Systems 91
6.5.3. Analysis of the Results with Regard to Zone Temperatures for Improved
Systems on the Hottest Two Days
- Hot Climate (Antalya)
Some of the general simulation results for a hot climate are as follows: the first floor is
warmer than the ground floor. All systems exceeded the cooling reference temperature of
26°C in Antalya due to the high ambient temperature. During the night, temperature
difference between the zones was lower than during the day because of the night
ventilation until 8 o’clock. Consequently, the zone temperatures increased after 8:00 am.
The zone temperatures do not follow the ambient temperature curve thanks to the shading
strategy and the help of the thermal mass internal walls, which had a large influence on
keeping the zone temperatures almost constant throughout the day. The zones that have
more internal walls have a cooler indoor climate than the zones without any internal
partitions.
24
26
28
30
32
34
36
38
40
1 2 3 4 5 6 7 8 9 10 11 1213 14 15 16 17 18 19 20 21 22 23 24 1 2 3 4 5 6 7 8 9 10 11 12 13 14 15 16 17 18 19 2021 22 23 24
Hours (July 21 and 22 )
Tem
pera
ture
[C°]
Traditional-After Improvements Ambient Temp. Aerated-After ImprovementsInt. Brick-After Improvements Lightweight-After Improvements Traditional-ReferenceAerated-Reference Int.Brick-Reference Lightweight-Reference
Cooling >26°C
Figure 6.17: Temperature of the RF-zones (Room first floor) on the hottest day in Antalya for all building
systems
Figure 6.17 illustrates the temperature comparison of the RF-zone (Room first zone)
between the four residential systems on the hottest day of the year and on the following

Energy Analysis of the Selected Building Systems 92
day (July 21 and 22) in Antalya. The interlocking brick and traditional systems reach their
peak temperature value at night; mostly because of the heat storage capacity of the thermal
mass construction. The solution for this problem can be clearly seen in the graphic night
ventilation should be applied after 22:00. to cool down the rooms. During the daytime, the
lightweight system has the highest temperature, followed by the aerated concrete system.
However, the temperature difference between the systems is not as high as that in Istanbul.
The impact of night ventilation on the zone temperature varies between 1°C - 3°C for the
zones with thermal mass internal walls, while it varies between 2°C and 6°C for the zones
without thermal mass internal walls. The maximum daily RF-zone temperatures do not
exceed 30°C. The temperature difference between ambient temperature and the highest
room temperature is approximately 10°C, when the ambient temperature is at the peak
point of the day (14 o’clock).
24
26
28
30
32
34
36
38
40
1 2 3 4 5 6 7 8 9 10 11 1213 14 15 16 17 18 19 20 21 22 23 24 1 2 3 4 5 6 7 8 9 10 11 12 13 14 15 16 17 18 19 2021 22 23
Hours (July 21 and 22 )
Tem
pera
ture
[C°]
Traditional Ambient Temp. Aerated Int. Brick Lightweight
Cooling >26°C
Figure 6.18: Temperature of the SALF-zones (Saloon first floor) on the hottest day in Antalya for all
building systems
Figure 6.18 highlights the temperatures in the SALF-zones, which have no internal thermal
mass partition walls like the RF-zone. Both the “SALF” and “SALGR” zones, which
represent saloon zones in the first floor and ground floor, have higher temperatures than
the room zones the smaller internal thermal mass partition walls lead to the higher daily
temperature.

Energy Analysis of the Selected Building Systems 93
The lightweight system has higher temperatures than the other three systems because the
system can not absorb the heat during the day as much as the thermal mass building
systems. On the other hand it shows better performance at night. It is important to use
heavyweight structures in such hot climates. The daily room temperatures vary between
34°C and 27°C for these two hot days, while during the night all four zone temperatures
are almost equal to the ambient temperature.
The traditional system showed one of the best performances with regards to zone
temperature, which lies 10°C under the ambient temperature. The zone temperatures vary
within the limit of 4°C. The zone temperatures are between 29°C and 26°C, while the
ambient temperature is at the peak point of 40°C at 15 o’clock
The zone temperatures of the aerated concrete system do not exceed 34°C, while the
ambient temperature varies between 40°C and 38°C. As it can clearly be seen, due to the
night ventilation the zone temperatures at night decrease drastically by the ambient
temperature, which is also over 26°C, the cooling reference temperature at that time. The
temperature difference between ambient and zone temperatures fluctuates between 8°C and
10°C.

Energy Analysis of the Selected Building Systems 94
- Moderate Climate (Istanbul)
20
22
24
26
28
30
32
34
1 2 3 4 5 6 7 8 9 10 11 1213 14 15 16 17 18 19 20 21 22 23 24 1 2 3 4 5 6 7 8 9 10 11 12 13 14 15 16 17 18 19 2021 22 23 24
Hours (July 21 and 22 )
Tem
pera
ture
[C°]
Traditional Ambient Temp. Aerated Int. Brick Lightweight
Cooling >26°C
Figure 6.19: Temperature of the RF-zones (Room first floor) on the hottest day in Istanbul for all building
systems
Although in simulations, there is no shading device considered for Istanbul, for some days
it could be considered in order to lower solar heat gain through the windows. The day time
temperatures of zones indicate that the heavyweight structure keeps the rooms cool. On the
other hand, it lets the stored heat out into the rooms in the night, thus, the zone
temperatures are higher than the ambient temperature. The RF-zone temperatures of the
systems between during day and night vary between 3°C-5°C. The night ventilation
strategy is not used for Istanbul, but rather formulated as follows: if the ambient
temperature is lower than the zone temperature and the zone temperature is higher than
25°C, then the zone will be ventilated with 5-h. Thus, the worst case of room temperatures
will be equal to ambient temperature, and it will never be over ambient temperature. In this
moderate climate of Istanbul, the RF-zone temperatures fluctuate in the context of 24°C
and 30°C, while the difference between day and night ambient temperatures is 10°C. RF-
zone temperature fluctuations of the four systems are lightweight 24°C-30°C, aerated

Energy Analysis of the Selected Building Systems 95
concrete 25°C-28°C, interlocking brick 25.5°C-27°C and the traditional system 25°C-
27°C. (Figure 6.19)
20
22
24
26
28
30
32
34
1 2 3 4 5 6 7 8 9 10 11 1213 14 15 16 17 18 19 20 21 22 23 24 1 2 3 4 5 6 7 8 9 10 11 12 13 14 15 16 17 18 19 2021 22 23 24
Hours (July 21 and 22 )
Tem
pera
ture
[C°]
Traditional Ambient Temp. Aerated Int. Brick Lightweight
Cooling >26°C
Figure 6.20: Temperature of the SALF-zones (Room first floor) on the hottest day in Istanbul for all building
systems
The figure represents the hottest day in Istanbul: thus, daytime room temperatures are
closer to the ambient temperature. Even if the lightweight structure does not have a large
thermal capacity the zones RF and RGR have more internal partitions On these hottest
days, the minimum night ventilation can help to provide more comfortable indoor spaces
as seen in the graph. However, it is normally not necessary to use night ventilation in
Istanbul.
The temperature difference between day and night fluctuates between 10°C and 8°C, the
SALF-zone temperatures vary within the limits of 3°C and 7°C, generally below the
cooling reference temperature of 26°C. The highest change is seen in the lightweight
system.
The figure demonstrates how the reinforced concrete building can maintain comfortable
indoor temperatures in Istanbul. In the morning and at night, the zone temperatures are

Energy Analysis of the Selected Building Systems 96
lower than 26°C due to night ventilation. In the hot daytime, the windows are closed to
prevent hot ambient air from entering the rooms. In addition, with the help of thermal mass
walls the daily temperatures of the zones are approximately 2°C lower than the ambient
temperature (Figure 6.20).
- Cold Climate (Erzurum)
12
14
16
18
20
22
24
26
28
30
32
34
1 2 3 4 5 6 7 8 9 10 11 1213 14 15 16 17 18 19 20 21 22 23 24 1 2 3 4 5 6 7 8 9 10 11 12 13 14 15 16 17 18 19 2021 22 23 24
Hours (July 21 and 22 )
Tem
pera
ture
[C°]
Traditional Ambient Temp. Aerated Int. Brick Leightweight
Cooling >26°C
Figure 6.21: Temperature of the RF-zones (Room first floor) on the hottest day in Erzurum for all building
systems
The RF zone temperatures of all systems in Erzurum show a constant trend during the two
hottest days of the year. Despite that Erzurum has a large temperature difference between
night and day, which can reach a difference of 20°C for some days, even on the hottest
day. At night the room temperatures are under the cooling reference temperature, 26°C,
determined for the simulations. Both the traditional system and the interlocking brick
system show better performances than the aerated concrete and lightweight systems with
regards to room temperature. The zone temperatures of both thermal mass systems do not
exceed 26°C, while those of the aerated concrete and lightweight systems are over 26°C,
except during the night. The ventilation rate of 1-h eliminated the disadvantage of the
thermal mass systems at night. (Figure 6.21)

Energy Analysis of the Selected Building Systems 97
12
14
16
18
20
22
24
26
28
30
32
34
1 2 3 4 5 6 7 8 9 10 11 1213 14 15 16 17 18 19 20 21 22 23 24 1 2 3 4 5 6 7 8 9 10 11 12 13 14 15 16 17 18 19 2021 22 23 24
Hours (July 21 and 22 )
Tem
pera
ture
[C°]
Traditional Ambient Temp. Aerated Int. Brick Leightweight
Cooling >26°C
Figure 6.22: Temperature of the SALF-zones (Room first floor) on the hottest day in Erzurum for all
building systems
Figure 6.25 indicates the SALF-zone temperatures of the selected building systems for
Erzurum. The zone temperatures are generally under the cooling reference temperature of
26°C, even on this warmest day, on which ambient temperature decreases by
approximately 12 °C against morning at 4:00. Nevertheless, the lightweight system has
higher temperatures than the other systems. During the day the zones that have no internal
walls have higher temperatures than those with thermal mass internal partitions. Although
some days at night the ambient temperature can get as low as 12°C, the zone temperatures
do not fall below 24°C, thanks to the insulated envelopes of the building system and the
lowrate of ventilation.

Energy Analysis of the Selected Building Systems 98
6.5.4. Analysis of the Results with Regard to Different Design Strategies for Improved
Systems
6.5.4.1. Ventilation
Ventilation strategy is one of the critical elements of the building energy use because of
heat gain and loss through the air change. In this section, the influence of five air change
rates (between 0-h and 5-h) on cooling loads are investigated for 4 buildings systems. The
natural ventilation is applied by controlling the windows. The hygienic ventilation rate of
0.7-h, which was calculated according to the DIN 1946, is used for the cold and moderate
climates in order to provide a minimum healthy, clean and comfortable atmosphere for the
occupants. On the other hand for the hot climate, high night ventilation rate of 5-h is used
to exhaust warm indoor temperature through the cool night ambient temperature. In
addition, the hygienic ventilation rate of 0.7-h is used during the day to minimize influence
of warm ambient daily temperature. The natural ventilation depends on wind speed and the
temperature difference between inside and outside air. The high ventilation rates can be
achieved by using cross ventilation. Following air-change rates can be given as rough
calculations [45]:
Table 6.3: Types of window openings and their air-change rates
Types of window openings Air-change rate [-h]
Closed windows and doors 0 - 0.5
Tilted windows 0.3 - 1.5
Half-opened windows 5.0 - 10.0
Completely opened windows 10.0 - 15.0
Oppositely located windows up to 40.0

Energy Analysis of the Selected Building Systems 99
6
8
10
12
14
16
18
20
22
24
26
0 1 2 3 4 5 6
Ventilation Rates [1/h]
Coo
ling
Load
s [k
Wh/
m².
a]Aerated Concrete Interlock. Brick Lighweight Traditional
Figure 6.23: Influence of night ventilation on cooling loads (Primary Eenergy) for Antalya
The graphic shows the influence of the six different air-change values, from 0-h to 5-h on
cooling loads of the four different systems in Antalya. The ventilation strategy is shown in
this chapter graphically and can be summarized accordingly during the day (between 8:00
and 22:00) windows are closed, with a minimum hygienic air change value of 0.7-h and
during the night (between 22:00 and 8:00) windows are opened to reach a maximum air
change of 5-h. As seen in the graph increasing the air-change values results in significant
reductions in the cooling loads of the four different construction systems in Antalya. The
interlocking brick system and the traditional system indicate the best performances, with
70% and 60% of reductions in cooling loads when just hygienic air-change is applied and a
5-h air-change value, which eliminates the disadvantage of the thermal mass structure
during the night.
When applying just the hygienic air-change, the lightweight system has the lowest cooling
load out of the four systems. Other heavyweight systems store more heat during the day
than the lightweight building, and they let out the stored heat into the living spaces at night.
Thus, if enough ventilation is not applied to sweep the hot air out of living spaces, they
will be overheated even at night. Consequently greater air-change rates are applied; this

Energy Analysis of the Selected Building Systems 100
resulted in a high cooling load difference between the interlocking brick and the
lightweight structure, which is almost equal in the case of 5-h air-change. Out of six
different air-change rates, the significant improvement can be succeeded by applying 1-h.
Cooling loads of the interlocking brick system drop from 24 kWh /m²a to almost 14 kWh
/m².a, which is already a 60% of decrease, for the lightweight system from 17.4 kWh /m².a
to almost 10 kWh /m².a, for the traditional system from 25 kWh /m²a to 15 kWh /m²a and
for the aerated concrete system from 23 kWh /m²a to 9 kWh /m²a. In addition to these
results, optimum air-change rates for those four systems can be determined by examining
the graphic above for Antalya. It can be concluded that air-change values greater than 3-h
not have large influences on the cooling loads. Thus, the ventilation rates can be
determined between 3-h and 4-h for traditional and aerated concrete buildings, 4-h and 5-h for
interlocking brick and lightweight buildings (Figure 6.23).
4
6
8
10
12
14
16
18
0 1 2 3 4 5 6
Ventilation Rates [1/h]
Coo
ling
Load
s [k
Wh/
m².
a]
Aerated Concrete Interlock. Brick Lighweight Traditional
Figure 6.24: Influence of ventilation on cooling loads (Primary Energy) for Istanbul
Figure 6.24 above highlights the performance of the four different systems with regard to
different ventilation rates in the moderate climate. The ventilation strategy in Istanbul can
be defined shortly as follows if room temperature is over 25°C windows will be opened

Energy Analysis of the Selected Building Systems 101
with 5-h air-change and will decrease from 25°C, if room temperature drops under 22°C the
ventilation will be off and only hygienic ventilation will be applied.
Traditional building has the lowest cooling load out of the four different building
constructions, which ranked after the in the following order: interlocking brick, aerated
concrete and lightweight buildings. In such a moderate climate, application of the high air-
change values can result in an increase in the cooling demand. As seen in the graphic after
applying 4-h the cooling loads increase slightly. This can be caused by a high air-change of
5-h, at which point the temperature fluctuation can be very high, thus, the ambient
temperature can increase over the duration of an hour.
The graphic clearly indicates that the interlocking brick building can perform well, if it is
supported by sufficient ventilation, which is not more than 4-h in this moderate climate.
The cooling loads of the lightweight building decreases sharply from 17 kWh/m².a to 10
kWh/m²a, representing 75 % of the total decrease, if only 1-h air-change value applied. In
contrast, the air-change rates, higher than 1-h, do not greatly reduce the cooling loads. The
air-change values more than 4-h are also not adequate ventilation for aerated concrete.
Optimum air-change rates can be proposed as 2-h for the lightweight building systems and
3-h for the rest of the building systems.

Energy Analysis of the Selected Building Systems 102
6.5.4.2. Glazing Variables
8.8
12.7
7.6
14.9
7.6
13.1
8.1
11.7
6.8
13.9
6.8
11.9
29.8
17.8
20.1
18.5
14.9
9.4
17
9.4
15
23.3
11.3
23.8
11.4
9.59.610.6
13.3
26.9
10.4
13
0
5
10
15
20
25
30
35
Cooling Loads Heating Loads Cooling Loads Heating Loads Cooling Loads Heating Loads Cooling Loads Heating Loads
Single Glazing Double Glazing Triple Glazing Double Low-e Glazing
Hea
ting
and
Coo
ling
Load
s [k
Wh/
m².
a]
Interlocking brick Lightweight (OSB) Traditional (R.Conc.) Aerated Concrete
Figure 6.25: Heating-cooling energy (Primary Energy) performance of different glazing types for Antalya
Figure 6.25 shows the performance of four glazing types, including single glazing, double
glazing, triple glazing and double low-e glazing for each building system in a hot climate
region Antalya, with respect to heating and cooling loads. The simulated glazing types
have the thermal transmittance “U-value” and solar heat gain coefficient values “g-value”
as following:
Single glazing U-value: 5.8 W/m².K, g-value: 0.87
Double glazing U-value: 2.7 W/m².K, g-value: 0.777
Triple Glazing U-value: 1.8 W/m².K, g-value: 0.7
Double low-e U-value: 1.7 W/m².K, g-value: 0.597
Since the main concern is to reduce cooling loads in such a climate, the ranking of the
glazing types from best to worst regarding cooling demand will be triple glazing, double
low-e glazing, double glazing and single glazing respectively for all building types. On the
other hand, when using triple glazing, the heating loads decrease in comparison to the

Energy Analysis of the Selected Building Systems 103
single glazing case, but they have a higher heating energy use than the case of installing
double glazing and double low-e glazing. Due to the solar thermal transmittance “g” value
of 0.77, the building with double glazing shows one of the best cooling performances. The
building with single glazing has the worst performance with regards to both cooling and
heating loads with its higher “g-value” of 0.87; it describes a percent of transmitted solar
heat gain through the windows and a higher “U-value” of 5.8 W/m²K. Consequently, when
using single pane we have more overheated and more heating dominated thermal zones.
Double low-e glazing is ideal for such cooling dominated climates because of its lower
solar heat gain coefficient “g-value” of 0.59, compared to the four other glazing types.
Improving glazing types from single pane to the others resulted in high decreases in both
the heating and cooling demand of the buildings in Antalya. If the lightweight building is
protected against daytime solar radiation by means of different design strategies, it
represents one of the best performances in Antalya. Once the system receives solar heat
gain it is difficult to release this hot air without the help of shading and special windows.
50.7
7.9
32.7
4.8
38.2
4.9
35.1
12.5
21.5
8.4
26.2
7.9
23.3
67.1
48.9
55.652.7
6 6.1
12
40.2
17.2
4.64.66.6
9.9
29.6
34.731.8
48.2
8.6
12.4
0
10
20
30
40
50
60
70
80
Cooling Loads Heating Loads Cooling Loads Heating Loads Cooling Loads Heating Loads Cooling Loads Heating Loads
Single Glazing Double Glazing Triple Glazing Double Low-e Glazing
Hea
ting
and
Coo
ling
Load
s [k
Wh/
m².
a]
Interlocking brick Lightweight (OSB) Traditional (R.Conc.) Aerated Concrete
Figure 6.26: Heating-cooling energy (Primary Energy) performance of different glazing types for Istanbul
Double glazing with a “U-value” of 2.7 W/m².K and “g-value” of 0.777 has the lowest
heating loads for all building types in the moderate climate, Istanbul. However cooling

Energy Analysis of the Selected Building Systems 104
load performance of this glazing type represents the third out of four glazing types due to
its higher “U-value” and “g-value”, which means the temperature flow between outside-
inside is higher, and it has more solar heat gain through the windows . Triple glazing and
double low-e glazing keep the buildings cooler than the other window types mostly due to
their lower “g”-values of 0.7 and 0.597 respectively. In addition smaller thermal
transmittance values of both glazing types keeps the indoor environment warmer than that
in double glazing.
The lightweight building with double glazing performs better than other glazing types with
regards to heating loads but has the second worst cooling performance. Traditional
building has the highest heating demand for all types of glazing, while it performs best in
cooling demand (Figure 6.26).
148.7
2.4
145.8
1.8
118.7
1.8
111.1
4.5
80.7
3.2
88.5
3.4
80.7
184.7
145.8
155.8
147.8146.9
2.6 2.6
108
2.9
120.9
6.1 1.51.52.22.9
115.6
107.6
3.75.2
0
20
40
60
80
100
120
140
160
180
200
Cooling Loads Heating Loads Cooling Loads Heating Loads Cooling Loads Heating Loads Cooling Loads Heating Loads
Single Glazing Double Glazing Triple Glazing Double Low-e Glazing
Hea
ting
and
Coo
ling
Load
s [k
Wh/
m².a
]
Interlocking brick Lightweight (OSB) Traditional (R.Conc.) Aerated Concrete
Figure 6.27: Heating-cooling energy (Primary Energy) performance of different glazing types for Erzurum
In Erzurum, where the buildings have almost no cooling demand due to its extreme cold
climate, the main concern is to heat the building and keep the heated air in the living
spaces with minimum hygienic ventilation. The glazing types with lower thermal
transmittance values and a higher solar heat gain coefficient can be ideal for such climates,
because of getting as much as solar heat gain even in summer and keeping the heat loss

Energy Analysis of the Selected Building Systems 105
lower through the windows. The lightweight building performed better than the other three
building types with respect to heating load largely due to its insulation thickness of almost
20 cm. Double glazing and double low-e glazing show nearly the same heating
performance for each building system. Nevertheless double low-e glazing reduces cooling
loads by more than 50% (Figure 6.27).
6.5.4.3. Thermal Mass Internal Walls
AeratedSystem Interlocking
Brick LightweightSystem Traditional
System
10.5
9.49
7.67.6
6.8
11.1
9.7
0
2
4
6
8
10
12
Coo
ling
Ene
rgy
[kW
h/m
².a]
No internall wall With internall wall
Figure 6.28: Influence of thermal mass internal walls on cooling energy loads (Primary Energy) in Antalya
There are no large temperature differences between day and night temperatures in Antalya,
Thus, the systems with thermal mass internal walls with high heat storage capacity can
overheat the room during the nighttime in the summer: however, it cools the room by
emitting coming solar radiation during the day. As illustrated in Figure 6.28 thermal mass
internal walls of the traditional, interlocking brick and aerated concrete buildings have a
greater influence than the lightweight structure in Antalya when using maximum night
ventilation in order to exhaust as much as released heat from the thermal mass walls. The
traditional and interlocking brick systems show the two best two performances, with a
reduction of 1.4 kWh/m²a cooling energy load, followed by the aerated concrete and
lightweight systems, with a reduction of 1kWh/m²a and 0.8 kWh/m²a respectively. In the

Energy Analysis of the Selected Building Systems 106
winter thermal mass walls reduce heating loads unless the daytime temperatures are not
extremely cold (Figure 6.28).
AeratedSystem Interlocking
Brick LightweightSystem Traditional
System
6.6
6.1
5.3
4.9
8.6
7.9
5.4
4.6
0
1
2
3
4
5
6
7
8
9
Coo
ling
Ene
rgy
[kW
h/m
².a]
No internall wall With internall wall
Figure 6.29: Influence of thermal mass internal walls on cooling energy loads (Primary Energy) in Istanbul
As indicated in Figure 6.29, the cooling energy demand of the four structures decreases
slightly. Thus, in moderate climates the heat storage capacity of walls does not play an
essential role as it does in hot climates due to lower solar heat gains. Nevertheless, only the
influence of internal partition walls is simulated in order to see its impact on energy use.
Since the thermal mass walls are cooler, the heat is absorbed and conducted into these
materials. If thermal mass walls are warmer than the temperature of the surrounding
environment, it releases heat into the surroundings. Erzurum has extremely cold winters
and cool summers: in addition, night temperatures even in summer do not exceede 15°C.
Thus, thermal mass internal walls emit the heat from the surrounding area and decrease the
room temperature.

Energy Analysis of the Selected Building Systems 107
6.5.4.4. Shading
AeratedSystem Interlocking
Brick LightweightSystem Traditional
System
16.2
9.4
12.1
7.6
12.8
6.8
16.3
9.7
0
2
4
6
8
10
12
14
16
18
Coo
ling
Ene
rgy
[kW
h/m
².a]
No Shading Shading with 0.85
Figure 6.30: Influence of shading on cooling loads (Primary Energy) of the four systems in Antalya
Figure 6.29 displays the shading performances of the four different systems on cooling
demand in a hot climate. The shading strategy is described according to the global solar
radiation and ambient temperature. The shading factor is defined as the ratio of the non-
transparent area of shading element to the whole transparent area. It is assumed to be 85%
in the simulations. The transparent openings with shading result in 45% cooling savings
compared to those without shading elements. The biggest percentage of saving is seen for
the lightweight building out of the four systems, because non-thermal mass walls do not
emit heat during the day as much as thermal mass walls, which let out emitted heat into the
living space at night and, thus, increase cooling loads. The low thermal transmittance value
of the lightweight building is another reason for lower cooling demand when using a
shading element.

Energy Analysis of the Selected Building Systems 108
6.5.4.5. Orientation
-8
-7
-6
-5
-4
-3
-2
-1
0
1
2
3
4
5
6
7
8
0° 45° 90° 135° 180° 225° 270° 315°
Orientation Variables
Cha
nge
in C
oolin
g Lo
ads
[%]
Reference Orientation
SE
SWNE
NW
Room-F
Saloon-F
0°
270°
180°
90°
SE E N N NW W SW S
Figure 6.31: Influence of orientation variables for the traditional system in Antalya
The model building is situated as it is illustrated in Figure 6.31, with long external surfaces
that face northeast (NE) and southwest (SW), and short building surfaces that face
southeast (SE) and northwest (NW). The reference surface is southeast (SE) representing
0°in the graphic, and the model building is rotated every 45° counter-clockwise. The figure
above shows the influence percentage of each orientation variable on cooling loads for
Antalya from 0° to 315°. The greatest cooling energy saving can be made by rotating the
model building 45° counter-clockwise. The reasons are that the southwest (SW) surface
has no windows, and the short building surfaces face east and west. Thus, west and east
surfaces of the building do not receive high solar radiation. The SW wall emits solar heat
during the day, which keeps the indoor climate cool. The worst orientation variables are
when the building is rotated 180°, 225° and 270°, due to higher solar heat gain from the
large surfaces and windows.
In the improved case of simulations for Istanbul and Erzurum, the model building is
rotated 225°, which gives it lowest heating demand according to the simulations and

Energy Analysis of the Selected Building Systems 109
allows it to receive as much solar heat gain as possible, even sometimes in the summer for
Erzurum.
6.5.4.6. Insulation
Insulation variables were simulated just for the traditional building, which represents a
significant share of the residential building constructions in Turkey. The lightweight and
interlocking brick systems have insulation in the wall and floors. Thus, insulation variables
are not examined for these systems.
0
5
10
15
20
25
30
35
40
45
50
0 1 2 3 4 5 6 7 8 9 10 11 12 13 14 15 16 17
Insulation Thickness [cm]
Hea
ting
and
Coo
ling
Load
s [k
Wh/
m²a
]
Heating Loads Cooling Loads
Figure 6.32: Influence of insulation thickness on heating and cooling loads (Primary Energy) for the
Traditional System in Antalya
Figure 6.32 shows the influence of different insulation thicknesses on the heating and
cooling demand for traditional building in hot climates. In other regions (temperate and
cold regions), insulation was a very important element of energy savings since it decreased
the heating energy demand, but it has no influence on the cooling energy demand in
heating dominated regions. On the other hand, as seen in the chart, a small amount of
insulation has a large influence on the cooling energy demand in hot climates. For instance,

Energy Analysis of the Selected Building Systems 110
we applied just 2 cm of insulation to the external walls of the model building, and as a
result we saved almost 50% of cooling loads.
An insulation thickness of more than 2 cm does not have a big impact on the cooling
demand. It can be concluded that the small amount of insulation keeps the cool air within
the building, and the external insulation prevents and lowers the heat gain through the
walls into the building. The conclusion can be made for heating loads as well, but the
difference is that insulation thickness of 8 cm can be beneficial to take heating loads down.
Heating loads are reduced by more than 60 % by using 8 cm insulation for the external
walls. A similar attempt to decreasing the cooling demand by combining a minimum
internal heat gain and insulation use in warm climates is the ECOFYS report created for
the European Insulation Manufacturers Association. The report concluded that a
combination of lowering internal loads and improving insulation can save 85% of the
cooling demand for a residential building sample in Madrid [42].
100
125
150
175
200
225
250
275
300
325
0 1 2 3 4 5 6 7 8 9 10 11 12 13 14 15 16 17
Insulation Thickness [cm]
Hea
ting
Ene
rgy
Load
s [k
Wh/
m²a
]
Heating Loads
Figure 6.33: Influence of insulation thickness on heating energy load (Primary Energy) for the traditional
System in Erzurum
It is clear that insulation plays an essential role in decreasing the heating demand of a
building situated in a cold climate zone. Figure 6.33 above indicates the simulation result

Energy Analysis of the Selected Building Systems 111
with different insulation thicknesses and their impacts on the heating demand Erzurum.
Due to the cold climate in Erzurum, even 15 cm of insulation reduces the yearly heating
demand of the city drastically, from 300 kWh/ m².a to almost 120 kWh/ m².a; more than
50% saving is achieved. It shows us that in such cold climate zones the thicknesses of the
walls should be greater than 20 cm with insulation in order to drop the energy demand to
reasonable values by enriching the building envelope and, thus, minimizing heat loss
0
10
20
30
40
50
60
70
80
90
100
110
120
130
0 2 4 6 8 10 12 14 16 18
Insulation Thickness [cm]
Hea
ting
and
Coo
ling
Load
s [k
Wh/
m²a
]
Heating Loads Cooling Loads
Figure 6.34: Influence of insulation thickness on heating and cooling loads (Primary Energy) for the
Traditional System in Istanbul
The simulation results for Istanbul conclude that applying insulation can only have an
influence on the heating demand and very little influence on the cooling demand for such
temperate climates. The graph indicates an almost constant cooling energy demand when
the thickness of the insulation is increased, while heating energy demand sinks by 40 kWh
/m².a. In other words, even if there is some cooling demand in temperate climates, the
thickness of the insulation does not have a big influence on it. Installing even 2 cm
insulation only has a very small affect on cooling demand (Figure 6.34).

Energy Analysis of the Selected Building Systems 112
- Economic Profitability of the Insulation for the Reinforced Concrete System
To increase insulation thickness results in heating and cooling energy reduction. On the
other hand, the initial costs of buildings will rise. Thus, an evaluation of the long-term
payback period for different insulation thicknesses becomes a significant task. The actual
cash value method (Barwert Method) is used in order to analyze the economic efficiency of
different insulation thicknesses for Traditional building. Shortly, the actual value of
investment after 50 years is monitored for each insulation thickness applied to external
walls. Heating energy loads and cooling energy loads are taken into account in order to
calculate the actual cash values of different insulation thicknesses. The yearly inflation rate
is considered to be 5%. The initial costs of applying different insulation thicknesses are
obtained from different companies and construction costs are determined by the
construction ministry. The natural gas price is taken from the Istanbul Municipality gas
company (IGDAS) tariffs 0.023 €/kWh as of 2005 and the electricity price 0.075 €/kWh,
which is taken from the Turkish electricity distribution company (TEDAS) tariffs, as of
2005.
-5000
-2500
0
2500
5000
7500
10000
12500
15000
17500
20000
22500
25000
1 3 5 7 9 11 13 15 17 19 21 23 25 27 29 31 33 35 37 39 41 43 45 47 49
Year
Act
ual C
ash
Val
ue (
Bar
wer
tbila
nz)
[€]
Insulation-2cm Insulation-4cm Insulation-6cm Insulation-8cmInsulation-10 cm Insulation-12 cm Insulation-14 cm Insulation-16 cm
Figure 6.35: Insulation investment and payback period for the traditional system in Antalya
The graph indicates that the payback years buildings with different insulation thicknesses
in Antalya vary between 7 and 8 years. An investment between 2000 € and 2500 € for

Energy Analysis of the Selected Building Systems 113
external wall insulation of the simulated building model will bring 17500 € and 22500 €
profit after 50 years mostly because of the cooling demand. Taking the graph into
consideration, some assumptions can be made regarding the optimum thickness of the
insulation for this climate. As seen in the graphic, after 50 years there is no much
difference between the actual values of investment for the building in Antalya. Thus, even
applying a small amount of insulation to external walls will be enough (Figure 6.35).
-5000
-2500
0
2500
5000
7500
10000
12500
15000
17500
20000
22500
25000
1 3 5 7 9 11 13 15 17 19 21 23 25 27 29 31 33 35 37 39 41 43 45 47 49
Year
Act
ual C
ash
Val
ue (
Bar
wer
tbila
nz)
[€]
Insulation-2cm Insulation-4cm Insulation-6cm Insulation-8cmInsulation-10 cm Insulation-12 cm Insulation-14 cm Insulation-16 cm
Figure 6.36: Insulation investment and payback period for the traditional system in Istanbul
Actual cash values of applying different insulation thicknesses for external walls in
Istanbul differ in Antalya. The payback time varies between 8 and 10 years. After 50 years
the differences between actual values of investments vary much more than in Antalya.
Employing 2 cm insulation for external walls reflects the worst profit in comparison with
other variables of insulation thickness regarding payback time and actual value of
investment. Six thousand euros are gained just by increasing the insulation thickness to 4
cm. It can be estimated that the insulation between 6cm and 8 cm is an optimal thickness
for such moderate climates (Figure 6.36).

Energy Analysis of the Selected Building Systems 114
-5000
0
5000
10000
15000
20000
25000
30000
35000
40000
45000
50000
1 3 5 7 9 11 13 15 17 19 21 23 25 27 29 31 33 35 37 39 41 43 45 47 49
Year
Act
ual C
ash
Val
ue (
Bar
wer
tbila
nz)
[€]
Insulation-2cm Insulation-4cm Insulation-6cm Insulation-8cmInsulation-10 cm Insulation-12 cm Insulation-14 cm Insulation-16 cm
Figure 6.37: Insulation investment and payback period for the traditional system in Erzurum
Due to its extreme cold weather, applying insulation to a building in Erzurum is the most
profitable improvement among the other strategies. Even applying 2 cm insulation is as
profitable as applying 16 cm insulation in the moderate climate of Istanbul. The differences
between actual values of investments after 50 years are very large. For instance, investing
in the installation of 2 cm thickness after 50 years is 26000 €, while that of 16 cm
insulation increases by 46000 €. Thus, payback years for these different insulation
thickness applications is reduced by 3-4 years, which is mainly influenced by the heating
loads (Figure 6.37).

Energy Analysis of the Selected Building Systems 115
6.6. Summary of simulation results
Cold climate Temperate Climate Hot climate
� Insulation is the most important element, for cold climate, optimal insulation thickness varies between 10 cm and 14 cm.
� Economic profitability of insulation thickness over 8 cm is very high because of huge heating energy decreases.
� Small ventilation rates of 1-h, more compact structure.
� Lightweight materials for daily heat gain, heavy structure for nightly heat gain. The systems with good insulation features perform better.
� Glazing with smaller thermal transmittance “U-value” and higher solar heat gain “g-value”.
� Orientation east, west large surfaces for heat gain.
� Optimum ventilation rates varies for the selected building systems between 2-4
h
� Insulation thickness can be optimized as 6-8 cm.
� Heating is main concern, but also a part of summer overheating problems can be seen
� Aerated concrete system shows the best performance regarding heating energy demand
� Shading can be considered for several days in summer.
� Shading is very effective in order to balance daytime room temperature
� Maximum night ventilation decreases room temperature during the night.
� Thermal mass materials to cool indoor environment, traditional and interlocking block performed better regarding cooling demand.
� Insulation thickness of 2 cm is enough for such climates
� Orientation east, west short surfaces with minimum windows
� Glazing with small thermal transmittance “U-value” and solar heat gain “g-value”

Conclusion 116
7. Conclusions and recommendations
The thesis illustrated that Turkish residential building stock may attain great energy saving
performance just by applying advanced design strategies. In addition to these strategies, as
a future research work, renewable energy integration should be investigated. No
mechanical solutions, except the integration of solar and PV panels, are suggested as a
renewable energy solution to energy demands. The conclusions and discussions addition to
Chapter 4 and Chapter 5 can be summarized as follows:
• The new climate classification done according to the ASHRAE transactions 4610-4611
showed that a precise classification is needed and degree day method can be used for
estimating energy needs of each city. The relation between energy consumption and
climate analysis through the degree day method can give some information of estimating
energy consumption in the pre design phase. Although in this work we selected just three
cities and four building systems, more cities, respectively climate zones can be
investigated by energy institutions in Turkey in order to create a reference for architects
and homeowners.
• Turkish energy standards should be updated after careful examination of the other
standards in the World. Thermal transmittance values of the building components should
be reviewed and updated. The preparation of the standards can be made by using new
scientific methods, for instance; utilization of the simulation programs which is briefly
explained in the Chapter. 4.
• After simulating the four different construction systems in three cities from different
regions, improvements of the systems and application of new energy strategies save large
amount of energy between 50-80% with respect to heating and cooling energy. The
energy simulation of some residential buildings helped to optimize energy design
strategies of each city we selected. This optimization should be made by Turkish energy,
institutions regarding ventilation rate, insulation thickness, type of glazing, orientation of
building, construction system, shading element and other variables, after defining
residential building types in Turkey with the help of real measurements and simulation
tools.

Conclusion 117
Applying energy efficient design strategies is the first step of energy efficient building;
second step can be integration of the renewable energies to building envelope. Thus, future
works will focus on integration of the renewable energy sources. Especially solar energy
integration both in terms of photovoltaic and solar thermal applications should be carefully
examined. In addition, because of Turkey’s large housing demand, the need for energy
efficient, economic and permanent residential buildings can be supplied by prefabricated
buildings. In the future renewable energy integrated prefabricated building systems will
dominate residential building sector.

118
Literatures and list of references
[1] Ministry of Energy and Natural Resources in Turkey, www.menr.gov.tr
[2] Evrendilek F., Ertekin C., Assessing the potential of renewable energy sources in
Turkey, 2003
[3] General Directorate of Electrical Power Resources Survey and Development
Administration, Solar energy in Turkey, www.eie.gov.tr
[4] Martinot Eric, the Worldwatch Institute, REN21 Renewable Energy Policy
Network, Renewables 2005 Global Status Report, 2005, Washington
[5] The Critical importance of Building Insulation for the Environment, EURIMA
(European Insulation Manufacturers), 2004, Brussels
[6] Houghton J.T., Ding Y., D.J.Griggs, Climate Change 2001: The scientific Basis,
Intergovernmental Panel on Climate Change 2001, Cambridge University Press,
USA-New York
[7] Olgyay V., Design with climate, Van Nostrand Reinhold, 1992, New York
[8] Fuoching, Amin Fritz, Ünal Öner, Klassifizierung von Klimazonen bezüglich der
Wasserdampfdiffusionsbelastung von Außenbauteilen in tropischen und
subtropischen Klimadaten, Diplomarbeit, August 2002, Dortmund
[9] Ghaiaus Cristian, Allard Francis, Natural Ventilation in the urban environment,
2005, London
[10] Matzarakis, A. and Balafoutis C., Heating degree-days over Greece as an index of
energy consumption, International Journal of Climatology, 2004
[11] BURAK S. Zinet, Country Baseline Studies Mediterranean Region; Water
Wetlands and Climate change, Turkey Baseline Report on Climate Change
Mediterranean Regional Roundtable, December 10 /11, 2002, Athens, Greece.

119
[12] Turkish State Meteorological Service, www.meteor.gov.tr.
[13] Briggs Robert S., P.E. Robert G. Lucas, Taylor Z.Todd, ASHRAE Transactions:
Research 4610 and 4611, Climate Classification for Building Energy Codes and
Standards: Part 1- Development Process, Part 2-Zone Definitions, Maps and
Comparisons, 2003
[14] Eichhammer Wolfgang, Best Available Technologies in Housing, German Case
Study, MURE II P r o j e c t, 2000, Karlsruhe
[15] The Deringer Group, www.deringergroup.com
[16] MVV consultants and engineers, Energy efficiency needs assessment in Turkey,
Improvement of energy efficiency in Turkey, April 2004, Ankara
[17] Standard TS-825, Thermal insulation in buildings, 1998/2001, Ankara
[18] Hui, C. M, Energy Performance of Air-conditioned Buildings in Hong Kong, PhD
Thesis, City University of Hong Kong, 1996, Hong Kong
[19] Wouter P., Ventilation Information Paper no: 9, AIVC-Air Infiltration and
Ventilation Centre, Energy performance regulations, December 2004
[20] Directive 2002/91/EC of the European Parliament and of the Council of 16
December on the “Energy performance of buildings”, January 2003
[21] ISES (International solar energy institute), “Energy efficiency policy for household
in Germany”, http://www.ises.org/sepconew/Pages/EE_Policy_in_Germany/2.html
[22] Energieeinsparverordnung – EnEV, 2001
[23] Swedish Building regulations-BBR, 2002, Boverket
[24] The UK. building regulations, Conservation of fuel and power in dwellings, 2000-
London
[25] ASHRAE Standard 90.2-2001, Energy-efficient design of low rise buildings, 2004,
Atlanta

120
[26] ECCJ (Energy Conservation Center Japan), www.eccj.or.jp/law
[27] Korean Heat Insulation Ordinance
[28] Huang J., Deringer J., Krarti M., Masud J., The development of residential and
commercial building energy standards for Egypt, Energy Conservation in Buildings
Workshop, December 2003, Kuwait
[29] Regulations of Technical Specifications for Thermal Insulation Systems and
Control of Energy Consumption for Air-conditioned Buildings in the Emirate of
Dubai, November 2001, Dubai
[30] Janssen, Rod- Towards energy efficient buildings in Europe-London, UK, June
2004
[31] Yapi Merkezi, www.yapimerkezi.com.tr
[32] Eston, www.estonvilla.com
[33] Ytong Turk, www.ytong.com.tr
[34] Klein S.A., Duffie J.A. , TRNSYS – A Transient System Simulation Program,
Solar Energy Laboratory University of Wisconsin – Madison, February 2000
[35] Meteotest, www.meteonorm.ch
[36] Passive House Institute, www.passiv.de
[37] Schreibmayer Peter, Architektur aus der Fabrik,Springer Verlag, Wien,2002
[38] Ir. Tjerk H. Reijenga, Bear Architekten, PV in Architecture, Gouda - 2002
[39] Szokolay S.V, Mahyew A, Koenigsberger O.H, Ingersoll T.G, Manual of the
tropical housing and building, part1 climatic design, Longman, Hong Kong -1974
[40] Prochiner F., Walczyk R., Hartmann D., Innovative Plug-In Connection – the Key
Technology for Prefabricated Housing, DETAIL 2001-4, S 701-707

121
[41] Sahner G., Different Forms of the Construction for a Modular Unit Building
System. DETAIL 2001-4, S 690-695
[42] ECOFYS Gmbh Report for EURIMA & EuroACE, Mitigation of Co2 – Emissions
From the Building Stock 2004, Cologne
[43] Özkan E., Altun C., Ünlü T. A., Sahal N., “Mevcut Konutlarin Rehabilitasyonunda
Yapi Dis Kabugunun Enerji Etkin Yenilenerek Gelistirilmesi” , TUBITAK Project,
Project No: TUBITAK, INTAG/TOKI 223, Istanbul-March 1997
[44] Köppen W., Grundriß der Klimakunde, de Gruyter, Berlin 1931
[45] Schramek Ernst-Rudolf, Taschenbuch für Heizung + Klimatechnik 94/95,
1995,Oldenburg
[46] EULEB (European High Quality Low energy Buildings) web page ,
www.learn.londonmet.ac.uk/packages/euleb

122
List of tables
Table 2.1 Energy sources of Turkey . . . . . . . . . . . . . . . . . . . . . . . . . . . . . . . . . . . . . 11
Table 2.2 Turkey’s monthly solar energy and sunshine duration . . . . . . . . . . . . . . . 13
Table 4.1 “U” values for building envelope in TS-825 Standard . . . . . . . . . . . . . . . . 35
Table 4.2 Heating energy demands for each region according to
TS 825 for smallest and biggest rate of A/V rate . . . . . . . . . . . . . . . . . . . 35
Table 4.3 Maximum values of the heat transition coefficients during first renovation,
replacement and renewal of construction units in DIN. . . . . . . . . . . . . . . 38
Table 4.4 Maximum “U” values defined in Swedish standards
and Norwegian standards . . . . . . . . . . . . . . . . . . . . . . . . . . . . . . . . . . . . . 39
Table 4.5 Maximum “U” values defined in Danish standards . . . . . . . . . . . . . . . . . . 40
Table 4.6 Building envelope requirements for Dubai . . . . . . . . . . . . . . . . . . . . . . . . . 44
Table 4.7 Overview of the building energy regulations in selected countries . . . . . . 48
Table 5.1 Properties of the prefabricated building systems for some countries . . . . . 67
Table 6.1 Altitude and geographical situation of the cities . . . . . . . . . . . . . . . . . . . . .73
Table 6.2 Some geometrical dimensions of Model building . . . . . . . . . . . . . . . . . . . 76
Table 6.3 Types of windows openings and their air-change rates . . . . . . . . . . . . . . . 98

123
List of figures
Figure 2.1 Turkey’s location between Europe and Asia . . . . . . . . . . . . . . . . . . . . . . 8
Figure 2.2 Geographical map of Turkey . . . . . . . . . . . . . . . . . . . . . . . . . . . . . . . . . . 9
Figure 2.3 Energy production and consumption in Turkey . . . . . . . . . . . . . . . . . . . . 10
Figure 2.4 Turkey’s win direction . . . . . . . . . . . . . . . . . . . . . . . . . . . . . . . . . . . . . . . .12
Figure 2.5 Share of Existing Solar Hot Water/Heating capacity in the World . . . . . 14
Figure 2.6 Sunshine duration hours of Turkey . . . . . . . . . . . . . . . . . . . . . . . . . . . . . 15
Figure 2.7 Total CO2 Emissions per year from dwellings . . . . . . . . . . . . . . . . . . . . . 16
Figure 3.1 Heating and cooling degree days of selected cities . . . . . . . . . . . . . . . . . 20
Figure 3.2a The relation between cooling energy demand and degree days . . . . . . . . 21
Figure 3.2b The relation between heating energy demand and degree days . . . . . . . . 22
Figure 3.3 World Climate zones. . . . . . . . . . . . . . . . . . . . . . . . . . . . . . . . . . . . . . . . 23
Figure 3.4 Classification of climate zones in Turkey according to
Aydeniz formula . . . . . . . . . . . . . . . . . . . . . . . . . . . . . . . . . . . . . . . . . . . . 27
Figure 3.5 ASHRAE climate classification of three selected
cities with some European cities . . . . . . . . . . . . . . . . . . . . . . . . . . . . . . . . 29
Figure 3.6 New climate classification according to the ASHRAE . . . . . . . . . . . . . . 30
Figure 4.1 Impact of thermal building code improvement between
1975 and 2000 in Germany . . . . . . . . . . . . . . . . . . . . . . . . . . . . . . . . . . . . 32
Figure 4.2 Status of building Standards in the World . . . . . . . . . . . . . . . . . . . . . . . . 33

124
Figure 4.3 Maximum U-values using elemental method in UK standard . . . . . . . . . 41
Figure 4.4 Energy consumption in EU countries after
adjusting Danish Regulation as a model . . . . . . . . . . . . . . . . . . . . . . . . . . 45
Figure 5.1 Production and installation process of
Sekisiu (Japan) home . . . . . . . . . . . . . . . . . . . . . . . . . . . . . . . . . . . . . . . . 56
Figure 5.2 Interlocking brick system, a perspective . . . . . . . . . . . . . . . . . . . . . . . . . . 63
Figure 5.3 Lightweight steel system, a perspective. . . . . . . . . . . . . . . . . . . . . . . . . . 64
Figure 5.4 Aerated Concrete system, a perspective . . . . . . . . . . . . . . . . . . . . . . . . . . 64
Figure 5.5 Traditional system . . . . . . . . . . . . . . . . . . . . . . . . . . . . . . . . . . . . . . . . . . . 65
Figure 6.1 TRNSYS simulation window interconnected components . . . . . . . . . . . 70
Figure 6.2 Climate characteristics of Antalya . . . . . . . . . . . . . . . . . . . . . . . . . . . . . . 71
Figure 6.3 Climate characteristics of Erzurum . . . . . . . . . . . . . . . . . . . . . . . . . . . . . 72
Figure 6.4 Climate characteristics of Istanbul . . . . . . . . . . . . . . . . . . . . . . . . . . . . . . 73
Figure 6.5 Global horizontal radiation in Antalya, Erzurum,
Istanbul and Dortmund . . . . . . . . . . . . . . . . . . . . . . . . . . . . . . . . . . . . . . . 74
Figure 6.6 The Selected building model for simulations . . . . . . . . . . . . . . . . . . . . . . 75
Figure 6.7 Ventilation and Infiltration strategy for Antalya
in improved model case (Night Ventilation) . . . . . . . . . . . . . . . . . . . . . . 78
Figure 6.8 Shading strategy of improved case for Antalya . . . . . . . . . . . . . . . . . . . . 79
Figure 6.9 Heating and cooling strategy for Antalya in improved case . . . . . . . . . . . 80
Figure 6.10 Primary, delivered and effective energy . . . . . . . . . . . . . . . . . . . . . . . . . . 83
Figure 6.11 Energy loads (Primary energy) in Antalya
before and after improvements . . . . . . . . . . . . . . . . . . . . . . . . . . . . . . . . . 84

125
Figure 6.12 Energy loads (primary energy) in Istanbul
before and after improvements . . . . . . . . . . . . . . . . . . . . . . . . . . . . . . . . 85
Figure 6.13 Energy loads (primary energy) in Erzurum
before and after improvements . . . . . . . . . . . . . . . . . . . . . . . . . . . . . . . . . 86
Figure 6.14 The RF-zone temperatures bigger than 26°C in Antalya . . . . . . . . . . . . . 88
Figure 6.15 The RF-zone temperatures bigger than 26°C in Erzurum . . . . . . . . . . . . 89
Figure 6.16 The RF-zone temperatures bigger than 26°C in Istanbul . . . . . . . . . . . . . 90
Figure 6.17 Temperature of the RF-zones (Room first floor)
on hottest day in Antalya for all building systems . . . . . . . . . . . . . . . . . 91
Figure 6.18 Temperature of the SALF-zones (Saloon first floor)
on hottest day in Antalya for all building systems . . . . . . . . . . . . . . . . . . 92
Figure 6.19 Temperature of the RF-zones (Room first floor)
on the hottest day in Istanbul for all building systems . . . . . . . . . . . . . . . 94
Figure 6.20 Temperature of the SALF-zones (Room first floor)
on the hottest day in Istanbul for all building systems . . . . . . . . . . . . . . . 95
Figure 6.21 Temperature of the RF-zones (Room first floor)
on the hottest day in Erzurum for all building systems . . . . . . . . . . . . . . 96
Figure 6.22 Temperature of the SALF-zones (Room first floor)
on the hottest day in Erzurum for all building systems . . . . . . . . . . . . . . 97
Figure 6.23 Influence of night ventilation on cooling loads for Antalya . . . . . . . . . . 99
Figure 6.24 Influence of ventilation on cooling loads for Istanbul . . . . . . . . . . . . . . .100
Figure 6.25 Heating-cooling energy (Primary Energy) performance of
different glazing types for Antalya. . . . . . . . . . . . . . . . . . . . . . . . . . . . . 102
Figure 6.26 Heating-cooling energy (Primary Energy) performance of
different glazing types for Istanbul . . . . . . . . . . . . . . . . . . . . . . . . . . . . . 103

126
Figure 6.27 Heating-cooling energy (Primary Energy) performance of
different glazing types for Erzurum . . . . . . . . . . . . . . . . . . . . . . . . . . . . 104
Figure 6.28 Influence of thermal mass internal walls on cooling energy loads
(Primary Energy) in Antalya . . . . . . . . . . . . . . . . . . . . . . . . . . . . . . . . . . 105
Figure 6.29 Influence of thermal mass internal walls on cooling energy loads
(Primary Energy) in Istanbul . . . . . . . . . . . . . . . . . . . . . . . . . . . . . . . . . 106
Figure 6.30 Influence of Shading on cooling loads (Primary Energy)
of four systems in Antalya . . . . . . . . . . . . . . . . . . . . . . . . . . . . . . . . . . . .107
Figure 6.31 Influence of Orientation Variables
for Traditional System in Antalya . . . . . . . . . . . . . . . . . . . . . . . . . . . . . .108
Figure 6.32 Influence of insulation thickness on heating and cooling loads
(Primary Energy) for Traditional System in Antalya. . . . . . . . . . . . . . . .109
Figure 6.33 Influence of insulation thickness on heating energy loads
(Primary Energy) for Traditional System in Erzurum . . . . . . . . . . . . . . 110
Figure 6.34 Influence of insulation thickness on heating and cooling loads
(Primary Energy) for Traditional System in Istanbul. . . . . . . . . . . . . . . .111
Figure 6.35 Insulation investment and pay back period
for traditional system in Antalya . . . . . . . . . . . . . . . . . . . . . . . . . . . . . . .112
Figure 6.36 Insulation investment and pay back period
for traditional system in Istanbul . . . . . . . . . . . . . . . . . . . . . . . . . . . . . . .113
Figure 6.37 Insulation investment and pay back period
for traditional system in Erzurum . . . . . . . . . . . . . . . . . . . . . . . . . . . . . . 114

127
Acknowledgements
It is pleasure to thank many people for their contribution during the preparation of this
thesis.
First and foremost I would like to express my gratitude to my supervisor Prof. Dr. -Ing
Helmut F. O. Mueller for his assistance, providing encouragement, giving excellent ideas
and very constructive criticism. He helped me not only in supervising this thesis but also in
the great effort to find financial support for my work and life as well. I would have been
lost without his assistance and encouragement.
I wish also to express my sincere appreciation to my co-supervisor Dr. AbuBakr Bahaj,
head of sustainable energy research group in Southampton University, for his contribution.
I can not escape mentioning Prof. Ergin Arioglu, head of the R&D department of Yapi
Merkezi in Istanbul, who provided me with some useful information about their
construction systems and his former research.
I am grateful to my former colleagues: Marcus Oetzel, who introduced me to TRNSYS,
and Dr. Ssengoba Kasule, who helped me in different ways in this work and introduced me
to life in Germany when I was new. I am indebted to Kamugisha AW Byabato, Jörg
Schlenger, Oliver Klein, Lars Knabben, other colleague and student assistants for helping
me in different ways.
Special thanks to my friend Murat Vurmaz, for his computer assistance and material
support. I do not want to pass without mentioning Laura Hope, who helped me in
correcting the thesis grammatically.
Lastly, and most importantly, I would like to thank my parents Resmiye and Mahmut H.
Esiyok, for their support and encouragement, which played an essential role in finalizing
this work. To my brother and his family, Resber, Feryat and Hevgin Esiyok: please accept
my appreciation for all kinds of support.
Other individuals, who are not mentioned here: I greatly appreciate them helping whenever
I needed assistance.

Appendix A: The classification used for TS-825 standard

Appendix B: Climate classification methods used for ASHRAE standards. First step;
Definition of the main zones
A. Major Climate Type Definitions (1) I. Marine (C) Definition - Locations meeting the following criteria:
• mean temperature of coldest month between –3ºC (27ºF) and 18ºC (65ºF)(2) AND
• warmest month mean < 22ºC (72ºF)(3) AND
• at least four months with mean temperatures over 10ºC (50ºF)(4) AND • dry season in summer(5). The dry season in summer criterion is met when the month with the heaviest rainfall in the colder season has at least three times as much precipitation as the month in the warmer season with the least precipitation. The colder season is October, November, December, January, February, and March in the Northern Hemisphere and April, May, June, July, August, and September in the Southern Hemisphere. All other months are considered the warmer season, in their respective hemispheres.
II. Dry (B) Definition (SI) - Locations meeting the following criteria: Not Marine and
Pcm < 2.0 × ( TC + 7) where:
Pcm = annual precipitation in cm
TC = annual mean temperature in degrees Celsius III. Humid (A) Definition (SI) - Locations meeting the following criteria: Not Marine and
Pcm ≥ 2.0 × ( TC + 7) Notes:
1. Humid, dry, and marine zone definitions are based on Strahler 1963, Plate 2, except as noted.
2. These criteria are necessary to exclude Köppen’s (D) “snow” climates and (A) “tropical” climates.
3. This criterion excludes the (a) “hot in summer” climates, such as the South-eastern and Midwestern United States. 4. This criterion excludes some marine climates in high latitude locations, such as Alaska, Iceland, and Northern Norway, from special treatment as marine climates. 5. This “dry season in summer” definition is from Köppen 1931 (German text), p.129. The authors were unable to find in this text quantitative definitions for “colder season” and “warmer season,” only an acknowledgement of the inherent difficulty in defining these seasons in a way that is effective for all world climates. The month-based definitions were created by the authors to make the climate definitions complete and computable. Under the variants of the Köppen system reviewed for this work, the dry in summer criterion was part of the Cs (Mediterranean) but not the Cb (Marine, Cool Summer) subdivision. We included it in the general Marine zone definition for use in the United States because dry summers are a characteristic attribute of the Pacific marine climates that we felt were necessary to recognize in the classification. It was also in excluding isolated locations in other parts of the country from meeting the Marine zone criteria. Specifically, sites at higher elevations in the Southern Appalachian Mountains (such as Asheville, NC) and medium elevations in the South-western United States (such as Albuquerque, NM) otherwise marginally met the marine criteria. Outside of the United States, such as in Northern Europe where marine influences extend far inland and summers are not as dry, this criterion may not be useful and could be dropped.

Appendix C: Climate classification methods used for ASHRAE standards. Second step;
Thermal zone definition
Zone No.
Climate Zone Name and Type 2
Thermal Criteria (1.3.8) Köppen Class. 5
1A Very Hot – Humid 5000 < CDD10ºC Aw
1B7 Very Hot – Dry 5000 < CDD10ºC BWh 2A Hot – Humid 3500 < CDD10ºC = 5000 Caf 2B Hot – Dry 3500 < CDD10ºC = 5000 BWh 3A Warm – Humid 2500 < CDD10ºC = 3500 Caf 3B Warm – Dry 2500 < CDD10ºC = 3500 BSk/BWh/H 3C Warm – Marine HDD18ºC = 2000 Cs
CDD10ºC = 2500 AND
HDD18ºC = 3000
4C Mixed – Marine 2000 < HDD18ºC = 3000 Cb 5A Cool – Humid 3000 < HDD18ºC = 4000 Daf 5B Cool – Dry 3000 < HDD18ºC = 4000 BSk/H
5C7 Cool – Marine 3000 < HDD18ºC = 4000 Cfb 6A Cold – Humid 4000 < HDD18ºC = 5000 Daf/Dbf 6B Cold – Dry 4000 < HDD18ºC = 5000 BSk/H 7 Very Cold 5000 < HDD18ºC = 7000 Dbf 8 Subarctic 7000 < HDD18ºC Dcf
Semiarid Middle Latitude/Highlands Humid Continental (Cool Summer)
Subarctic
Humid Continental (Warm Summer) Semiarid Middle Latitude/Highlands
Marine (Cool Summer) Humid Continental (Warm Summer/Cool Summer)
Arid Subtropical Humid Subtropical (Warm Summer)
Semiarid Middle Latitude/Arid Subtropical/Highlands Dry Summer Subtropical (Mediterranean)
Köppen Classification Description 6
Tropical Wet-and-Dry Tropical Desert
Humid Subtropical (Warm Summer)
4B Mixed – Dry CDD10ºC = 2500 ANDHDD18ºC = 3000
B. Thermal Zone Definitions
4A Mixed – Humid
Notes:1. Column 1 contains alphanumeric designations for each zone. These designations are intended for use when the zones are referenced in the code. The numeric part of the designation relates to the thermal properties of the zone. The letter part indicates the major climatic group to which the zone belongs; A indicates humid, B indicates dry, and C indicates marine. The climatic group designation was dropped for Zones 7 and 8 because we did not anticipate any building design criteria sensitive to the humid/dry/marine distinction in very cold climates. Zones 1B and 5C have been defined but are not used for the United States. Zone 6C (Marine and HDD18ºC > 4000 (HDD65ºF > 7200) might appear to be necessary for consistency. However, very few locations in the world are both as mild as is required by the Marine zone definition and as cold as necessary to accumulate that many heating degree days. In addition, such sites do not appear climatically very different from sites in Zone 6A, which is where they are assigned in the absence of a Zone 6C.. 2. Column 2 contains a descriptive name for each climate zone and the major climate type from Table 2A. The names can be used in place of the alphanumeric designations wherever a more descriptive designation is appropriate. 3. Column 3 contains definitions for the zone divisions based on degree-day cooling and/or heating criteria. The humid/dry/marine divisions must be determined first beforethese criteria are applied. The definitions in Table 2A and 2B contain logic capable of assigning a zone designation to any location with the necessary climate data anywherein the world. However, the work to develop this classification focused on the 50 United States. Application of the classification to locations outside of the United States is untested. 4. Column 4 contains the name of a SAMSON station found to best represent the climate zone as a whole. See Section 4.3 for an explanation of how the representativecities were selected. 5. Column 5 lists the abbreviations for the climate groups based on a simplified version of the Köppen system (Finch et al. 1957). (see Figures 1 and 2). This informationrelates the climate zones to a widely-used world classification system, and may facilitate application outside of the United States. 6. Column 6 contains a verbal description derived from Köppen’s work that serves to explain the two- and three-letter codes in the previous column. 7. Zones 1B and 5C do not occur in the United States, and no representative cities were selected for these zones due to data limitations. Climates meeting the listed criteria doexits in such locations as Saudi Arabia; British Columbia, Canada; and Northern Europe. 8. SI to I-P Conversions:
2500 CDD10ºC = 4500 CDD50ºF 3000 HDD18ºC = 5400 HDD65ºF 3500 CDD10ºC = 6300 CDD50ºF 4000 HDD18ºC = 7200 HDD65ºF 5000 CDD10ºC = 9000 CDD50ºF 5000 HDD18ºC = 9000 HDD65ºF 2000 HDD18ºC = 3600 HDD65ºF 7000 HDD18ºC = 12600 HDD65ºF
Caf/Daf
BSk/BWh/H
Humid Subtropical/Humid Continental (Warm Summer)
Semiarid Middle Latitude/Arid Subtropical/Highlands
Marine (Cool Summer)

Appendix D: Sun path (Stereographic) diagram of Erzurum
Appendix E: Sun path (Stereographic) diagram of Antalya

Appendix F: Sun path (Stereographic) diagram of Istanbul

Appendix G: Maximum values of yearly primary energy consumption and specific transmission heat losses
According to ENEV (Energiesparverordnung) – (Translated from ENEV)
A/V e
Ratio
Annual Primary Energy Consumption Specifically, transmission heat losses related heat-transferring encompassing area
Qp in kWh/(m².a) related to the floor area Qp in kWh/(m³.a) related to the heated volume
HT in W/(m²K)
Residential buildings (except the buildings defined by Column 3)
Residential buildings with predominant electrical water heating systems
Other buildings
Non-Residential buildings with the surface/windows area of ≤30% and residential buildings
Non-Residential buildings with the surface/windows area of >30%
1 2 3 4 5 6 ≤ 0.2 66.00 +2600/100+AN) 88.00 14.72 1.05 1.55
0.3 73.53 +2600/100+AN) 95.53 17.13 0.80 1.15
0.4 81.06 +2600/100+AN) 103.06 19.54 0.68 0.95
0.5 88.58 +2600/100+AN) 110.58 21.95 0.60 0.83
0.6 96.11 +2600/100+AN) 118.11 24.36 0.55 0.75
0.7 103.64 +2600/100+AN) 125.64 26.77 0.51 0.69
0.8 111.17 +2600/100+AN) 133.17 29.18 0.49 0.65
0.9 118.70 +2600/100+AN) 140.70 31.59 0.47 0.62
1 126.23 +2600/100+AN) 148.23 34.00 0.45 0.59
≥1.05 130.00 +2600/100+AN) 152 35.4 0.44 0.58
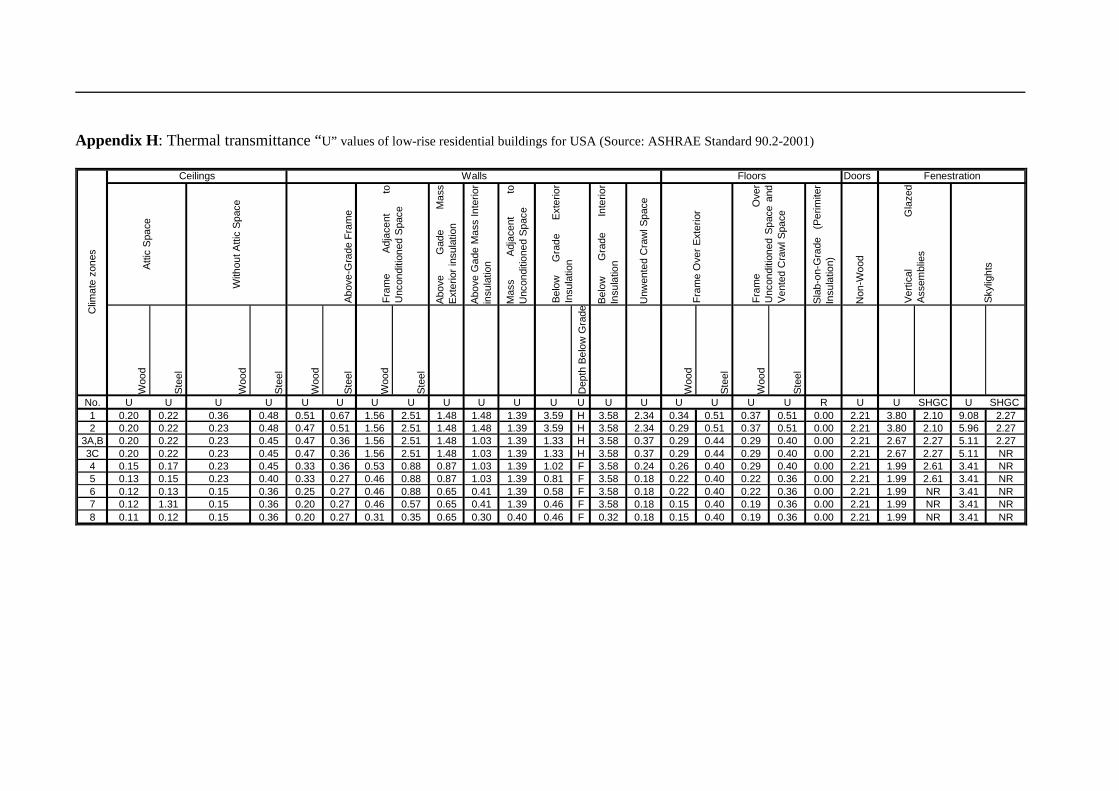
Appendix H: Thermal transmittance “U” values of low-rise residential buildings for USA (Source: ASHRAE Standard 90.2-2001)
Doors
Abo
veG
ade
Mas
sE
xter
ior
insu
latio
n
Abo
veG
ade
Mas
sIn
terio
rin
sula
tion
Mas
sA
djac
ent
toU
ncon
ditio
ned
Spa
ce
Bel
owG
rade
Inte
rior
Insu
latio
n
Unw
ente
d C
raw
l Spa
ce
Sla
b-on
-Gra
de(P
erim
iter
Insu
latio
n)
Non
-Woo
d
Woo
d
Ste
el
Woo
d
Ste
el
Woo
d
Ste
el
Woo
d
Ste
el
Dep
th B
elow
Gra
de
Woo
d
Ste
el
Woo
d
Ste
el
No. U U U U U U U U U U U U U U U U U U U R U U SHGC U SHGC 1 0.20 0.22 0.36 0.48 0.51 0.67 1.56 2.51 1.48 1.48 1.39 3.59 H 3.58 2.34 0.34 0.51 0.37 0.51 0.00 2.21 3.80 2.10 9.08 2.272 0.20 0.22 0.23 0.48 0.47 0.51 1.56 2.51 1.48 1.48 1.39 3.59 H 3.58 2.34 0.29 0.51 0.37 0.51 0.00 2.21 3.80 2.10 5.96 2.27
3A,B 0.20 0.22 0.23 0.45 0.47 0.36 1.56 2.51 1.48 1.03 1.39 1.33 H 3.58 0.37 0.29 0.44 0.29 0.40 0.00 2.21 2.67 2.27 5.11 2.273C 0.20 0.22 0.23 0.45 0.47 0.36 1.56 2.51 1.48 1.03 1.39 1.33 H 3.58 0.37 0.29 0.44 0.29 0.40 0.00 2.21 2.67 2.27 5.11 NR4 0.15 0.17 0.23 0.45 0.33 0.36 0.53 0.88 0.87 1.03 1.39 1.02 F 3.58 0.24 0.26 0.40 0.29 0.40 0.00 2.21 1.99 2.61 3.41 NR5 0.13 0.15 0.23 0.40 0.33 0.27 0.46 0.88 0.87 1.03 1.39 0.81 F 3.58 0.18 0.22 0.40 0.22 0.36 0.00 2.21 1.99 2.61 3.41 NR6 0.12 0.13 0.15 0.36 0.25 0.27 0.46 0.88 0.65 0.41 1.39 0.58 F 3.58 0.18 0.22 0.40 0.22 0.36 0.00 2.21 1.99 NR 3.41 NR7 0.12 1.31 0.15 0.36 0.20 0.27 0.46 0.57 0.65 0.41 1.39 0.46 F 3.58 0.18 0.15 0.40 0.19 0.36 0.00 2.21 1.99 NR 3.41 NR8 0.11 0.12 0.15 0.36 0.20 0.27 0.31 0.35 0.65 0.30 0.40 0.46 F 0.32 0.18 0.15 0.40 0.19 0.36 0.00 2.21 1.99 NR 3.41 NR
Clim
ate
zone
s
Bel
owG
rade
Ext
erio
rIn
sula
tion
Sky
light
s
Ceilings
Atti
c S
pace
With
out A
ttic
Spa
ce
Walls
Abo
ve-G
rade
Fra
me
Fra
me
Adj
acen
tto
Unc
ondi
tione
d S
pace
Floors
Fra
me
Ove
r E
xter
ior
Fra
me
Ove
rU
ncon
ditio
ned
Spa
cean
dV
ente
d C
raw
l Spa
ce
Ver
tical
Gla
zed
Ass
embl
ies
Fenestration

Appendix J: Constructional properties of the simulated systems after improvements
U-value
[W/m².K]
U-value
[W/m².K]
U-value
[W/m².K]
U-value
[W/m².K]
U-value
[W/m².K]
U-value
[W/m².K]Gypsum Plaster 1 cm Gypsum Plaster 1 cm Particle Board 2 cm Gypsum Plaster 1 cm Plywood 1 cm Gypsum Plaster 1 cmHollow Brick 19 cm Concrete Floor Panel 15 cm Cement Mortar 2 cm Concrete Floor Panel 15 cm Mineral Wool 8 cm Hollow Brick 10 cmPolystren 8 cm Cement Mortar 2 cm Polystren 5 cm Plywood 1 cm Gypsum Plaster 0.5 cmAir Space Particle Board 2 cm Cement Mortar 5 cm Bitumen Sealing 0.5 cmHollow Brick 10 cm Purnice Gravel 5 cm Roof Tile 5 cmGypsum Plaster 1 cm Gypsum Plaster 1 cm Particle Board 2 cm Gypsum Plaster 1 cm OSB Board 1.3 cm Gypsum Plaster 1 cm
OSB Board 1.3 cm Plaster Board 1.8 cm Polystren 5 cm Plaster Plate 1.3 cm Insulation 8 cm Mineral Wool 8 cmMineral Wool 16 cm Mineral Wool 8 cm Cement Mortar 5 cm Minerall Wool 8 cm OSB Board 1.1 cm Plywood 1,3 cmPlaster Board 1.1 cm OSB Board 1.3 cm Purnice Gravel 5 cm OSB Panel 1.3 cm Bitumen Sealing 0.5 cm Gypsum Plaster 1 cmPolystren 4 cm Particle Board Floor 2 cm Roof tile 5 cmCement Mortar 3 cmGypsum Plaster 1 cm Gypsum Plaster 2 cm Particle Board 2 cm Gypsum Plaster 2 cm Plywood 1 cm Gypsum Plaster 2 cmAerated Conc. Block 20 cm Aerated Conc. Block 15 cm Cement Mortar 2 cm Aerated Conc. Block 15 cm Mineral Wool 8 cm Aerated Conc. Block 10 cmPolystren 5 cm Cement Mortar 2cm Polystren 5 cm Plywood 1 cm Gypsum Plaster 2 cmCement Mortar 3 cm Particle Board 2 cm Cement Mortar 5 cm Bitumen Sealing 0.5 cm cm
Purnice Gravel 5 cm Roof Tile 5 cm cmCement Mortar 2 cm Cement Mortar 2 cm Particle Board 2 cm Cement Mortar 2 cm Plywood 1 cm Cement Mortar 2 cmLight Hollow Brick 20 cm Concrete Floor 12 cm Cement Mortar 2 cm Concrete Floor 12cm Mineral Wool 8 cm Light Hollow Brick 10 cmPolystren 5 cm Cement Mortar 2 cm Polystren 5 cm Cement Mortar 2 cm Plywood 1 cm Cement Mortar 2 cmCement Mortar 3 cm Particle Board 2 cm Cement Mortar 5 cm Bitumen Sealing 0.5 cm
Purnice Gravel 5 cm Roof Tile 5 cm
3.8 0.41 2.1Traditional System 0.41 1.38 0.39
0.47
Aerated Concrete 0.35 0.72 0.39 1.09 0.4 1.35
Lightweight Steel 0.17 0.37 0.37
First Floor Ceiling Roof Floor Structure Ground Structure
Materials
0.45 0.45
2.3 0.4 3.4
Construction Types
Wall Structure
Interlocking Brick 0.31 1.1 0.39
CONSTRUCTIONS OF SIMULATED BUILDINGS AFTER IMPROVEM ENTS
MaterialsMaterials Materials Materials Materials
Internal Wall

Appendix K: Constructional properties of the simulated systems before improvements
U-value [W/m².K]
U-value [W/m².K]
U-value [W/m².K]
U-value [W/m².K]
U-value [W/m².K]
U-value [W/m².K]
Gypsum Plaster 1 cm Gypsum Plaster 1 cm Particle Board 2 cm Gypsum Plaster 1 cm Plywood 1 cm Gypsum Plaster 1 cmHollow Brick 19 cm Concrete Floor Panel 15 cm Cement Mortar 5 cm Concrete Floor Panel 15 cm Bitumen Sealing 0.5 cm Hollow Brick 10 cmPolystren 8 cm Cement Mortar 2 cm Purnice Gravel 5 cm Roof Tile 5 cm Gypsum Plaster 0.5 cmAir Space Particle Board 2 cmHollow Brick 10 cmGypsum Plaster 1 cm Gypsum Plaster 1 cm Particle Board 2 cm Gypsum Plaster 1 cm OSB Board 1.3 cm Gypsum Plaster 1 cmOSB Board 1.3 cm Plaster Board 1.8 cm Cement Mortar 5 cm Plaster Plate 1.3 cm Insulation 8 cm Mineral Wool 8 cmMineral Wool 16 cm Mineral Wool 8 cm Purnice Gravel 5 cm Minerall Wool 8 cm OSB Board 1.1 cm Plywood 1,3 cmPlaster Board 1.1 cm OSB Board 1.3 cm OSB Panel 1.3 cm Bitumen Sealing 0.5 cm Gypsum Plaster 1 cmPolystren 4 cm Particle Board Floor 2 cm Roof tile 5 cmCement Mortar 3 cmGypsum Plaster 1 cm Gypsum Plaster 2 cm Particle Board 2 cm Gypsum Plaster 2 cm Plywood 1 cm Gypsum Plaster 2 cmAerated Conc. Block 20 cm Aerated Conc. Block 15 cm Cement Mortar 5 cm Aerated Conc. Block 15 cm Bitumen Sealing 0.5 cm Aerated Conc. Block 10 cmCement Mortar 3 cm Cement Mortar 2cm Purnice Gravel 5 cm Roof Tile 5 cm Gypsum Plaster 2 cm
Particle Board 2 cm
Cement Mortar 2 cm Cement Mortar 2 cm Particle Board 2 cm Cement Mortar 2 cm Plywood 1 cm Cement Mortar 2 cmLight Hollow Brick 20 cm Concrete Floor 12 cm Cement Mortar 5 cm Concrete Floor 12cm Bitumen Sealing 0.5 cm Light Hollow Brick 10 cmCement Mortar 3 cm Cement Mortar 2 cm Purnice Gravel 5 cm Cement Mortar 2 cm Roof Tile 5 cm Cement Mortar 2 cm
Particle Board 2 cm
1.09 0.4 1.35
Traditional System 1.65 1.38 1.08 3.8 2.6 2.1
Aerated Concrete 0.87 0.72 1.08
2.3 0.4 3.4
Lightweight Steel 0.17 0.37 1.08 0.45 0.45 0.47
Interlocking Brick 0.31 1.1 1.08
Materials Materials Materials Materials
CONSTRUCTIONS OF SIMULATED BUILDINGS BEFORE IMPROVE MENTS
Construction Types Wall Structure Floor Structure Ground Structure First Floor Ceiling Roof Internal Wall
Materials Materials

Appendix L: Plan and elevations of the model building

Curriculum Vitae :
Name Umit Esiyok
Date of birth 19 January 1976
Place of birth Elazig, Turkey
Education
Since 2003 PHD at the University of Dortmund
1996 - 2000 MSc Arch. Degree: Istanbul Technical University, Turkey
1992 - 1996 Bachelor Degree in Architecture, University of Trakya, Turkey
1986 - 1992 High School, Yeni Levent High School
Work Experience
April 2006 – Sept 2006 HPP architects, Duseldorf, Germany
Since 2004 As a research assistant for different projects and lectures at University of Dortmund, Chair for environmental Architecture.
July 1998 – June 1999 Morrison Construction Services in Istanbul, Renovation of US Consulate, Turkey
June 1997 – Sept. 1997 Yapi Organizasyon Ltd.