energy efficiency in the lebanese industrial...
TRANSCRIPT

Energy Efficiency in the Lebanese Industrial Sector
A Guideline Report
July 2016

AuthorMr. Ronald Diab, Energy Efficiency Group (EEG)
Main ReviewersMr. Nader Hajj ShehadeMs. Jessica Obeid
Contributing ReviewersMr. Hassan HarajliMs. Carla Nassab
Copyright © UNDP / CEDRO – 2016Reproduction is authorized provided the source is acknowledged and provided reproduction is not sold. The United Nations Development Programme (UNDP) is the UN’s principle provider of development, advice advocacy and grant support. With some 170 country offices, it has long enjoyed the trust and confidence of government and NGOs in many parts of the developing as well as the developed world. It is typically regarded as a partner rather than as an adversary, and its commitment to universal presence proved especially useful in post – conflict situation and with states that have been otherwise isolated from international community.
For further informationUnited Nations Development Programme, http://www.lb.undp.org/CEDRO, http://www.cedro-undp.org/
Note: The information contained within this document has been developed within a specific scope, and might be updated in the future.
AcknowledgmentsThe United Nations Development Programme (UNDP) would like to thank the European Union for the grant that established and enabled the work of CEDRO 4. CEDRO would also like to thank all its partners including the Ministry of Energy and Water, the Ministry of Industry, the Council of Development and Reconstruction, the Lebanese Center for Energy Conservation (LCEC), and all other institutions that work closely with this project.
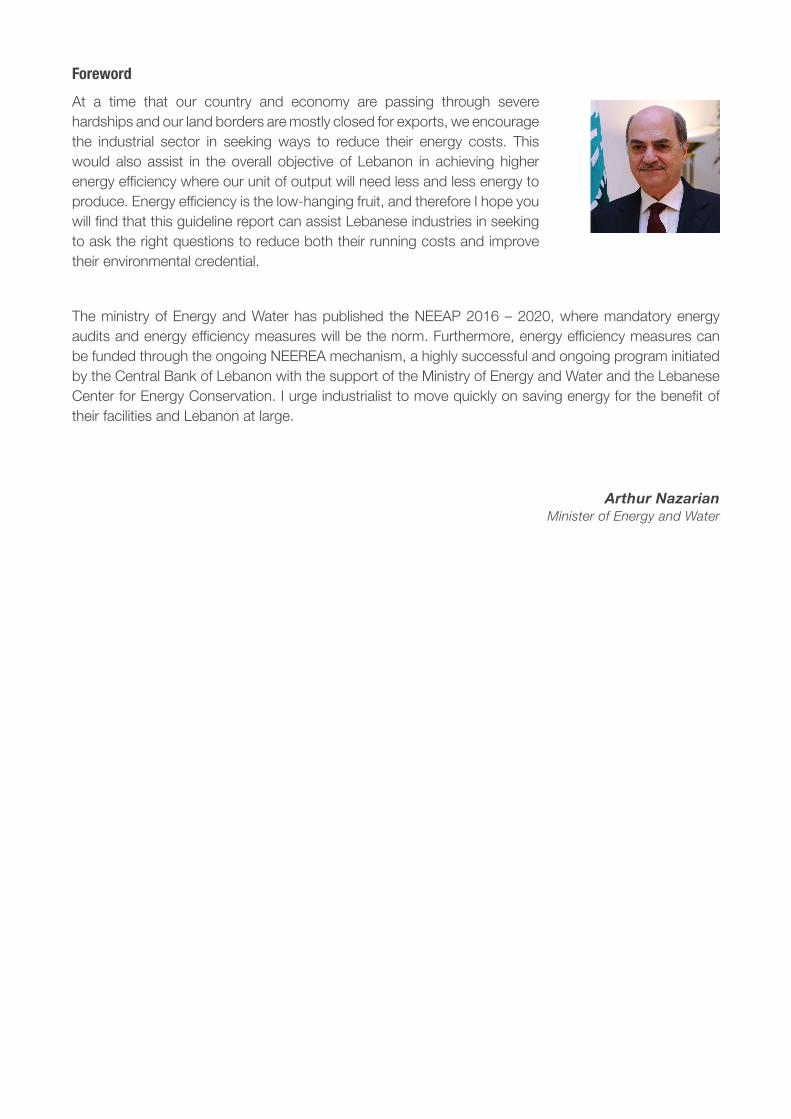
ForewordAt a time that our country and economy are passing through severe hardships and our land borders are mostly closed for exports, we encourage the industrial sector in seeking ways to reduce their energy costs. This would also assist in the overall objective of Lebanon in achieving higher energy efficiency where our unit of output will need less and less energy to produce. Energy efficiency is the low-hanging fruit, and therefore I hope you will find that this guideline report can assist Lebanese industries in seeking to ask the right questions to reduce both their running costs and improve their environmental credential.
The ministry of Energy and Water has published the NEEAP 2016 – 2020, where mandatory energy audits and energy efficiency measures will be the norm. Furthermore, energy efficiency measures can be funded through the ongoing NEEREA mechanism, a highly successful and ongoing program initiated by the Central Bank of Lebanon with the support of the Ministry of Energy and Water and the Lebanese Center for Energy Conservation. I urge industrialist to move quickly on saving energy for the benefit of their facilities and Lebanon at large.
Arthur NazarianMinister of Energy and Water

ForewordEnergy is an integral part of modern industry. The increasing use of energy in the global industrial sector during the last decades caused real threats to the environment. Decision makers and scientists are looking for alternatives for fossil fuel as sources of clean energy.
The cost of securing energy in Lebanon is the highest when compared to other countries in the Middle East region. Most of these countries subsidize their energy consumption. The cost of energy usually constitutes a major portion of the final costs of industrial products. This fact makes Lebanese industrialists, who pay more for energy, at a disadvantage compared to their competitors.
The newly discovered offshore oil and gas reserves are very promising for the Lebanese economy, especially the industrial sector. Nevertheless, seeking energy efficiency and more sustainable sources of energy should not be overlooked. The Ministry of Industry has marked these sources, such as wind and solar energy, as major pillars within the Ministry’s vision for a sustainable industrial sector. The Ministry will support all initiatives which aim to fulfil this target.
Hussein el-Hajj HassanMinister of Industry

ForewordEnergy efficiency counts among the most important mitigation measures of Lebanon’s Nationally Determined Contribution (under the United Nations Framework Convention on Climate Change) that were presented at the COP21 Conference in Paris last December. This ambitious programme undoubtedly placed Lebanon in the group of countries that contributed the most to reach a first-ever universal, legally binding global climate deal covering all countries. This must be applauded, in particular considering the difficult situation that Lebanon has been facing for more than 4 years.
A couple of months before the Paris Declaration, the UN General Assembly adopted an ambitious and comprehensive sustainable development agenda, with 17 Sustainable Development Goals (SDG’s) that seek to systematically integrate and balance economic, social and environmental objectives. By adopting this agenda, world leaders have committed to put environmental sustainability at the heart of their policies, plans and programmes. In line with these ambitions, the European Union intends to play a central role into the sustainable development agenda, thereby honouring its obligation - under the EU Treaty - to “mainstream environmental integration with a view to promoting sustainable development”.
In October 2014, EU Member States agreed on updated headline targets for the EU framework on climate and energy for 2030. These include: a cut in greenhouse gas emissions by at least 40% by 2030 compared to 1990 levels; an EU-wide binding target for renewable energy of at least 27%; and an indicative energy efficiency target of at least 27%.
Considering these milestones achieved in New York and Paris, the EU’s commitment from 2013 to spend at least 20% of its entire 2014-2020’s budget on climate change-related projects and policies looked almost like we had a crystal ball looking into the future! Our commitment represents €180 billion in climate spending in all major EU policy areas over the 7 years in the EU and all over the world, and in particular in its neighbourhood area.
At the same time in this part of the Mediterranean, Lebanon had started reviewing its National Energy Efficiency Action Plan (NEEAP) for 2011-2015, which is now completed and updated into a NEEAP 2016-2020: An impressive achievement! The National Renewable Energy Action Plan is on its way: this is very good news indeed. Lebanon has completed its first photovoltaic farm by the Beirut River and is now working on a second one at the Zahrani refinery facilities. Solar water heaters are gradually being disseminated all over the country, energy efficiency solutions are being multiplied thanks to the efficient and attractive National Energy Efficiency and Renewable Energy Action (NEEREA) mechanism managed by the Central Bank of Lebanon…
Undoubtedly, renewable energy and energy efficiency make a lot of sense in a country where energy supply represents a real daily challenge for the citizens as well as for the economy. This is why initiatives contributing to energy savings and the generation of electricity from renewable energy sources are so important. They help to reduce the burden and must be embraced.

This national dynamics has been fostered during the past years by committed actors across the board, that is the Lebanese authorities and in particular the Ministry of Energy and Water, civil society organisations, the private sector, the donor community and UN Agencies. The impressive work done by the Lebanese Centre for Energy Conservation must be highlighted too.
Also, we as the European Union are proud of all the achieved results in the framework of our projects in the energy sector in Lebanon. In particular the CEDRO IV project which is making steady progress towards developing creative and innovative energy schemes on both municipal and industrial levels, thanks to the excellent work of the UNDP-led CEDRO team. The two studies published today on “Energy Efficiency in the Industrial Sector in Lebanon” and “Solar Photovoltaic Hybrid Power Plants for Large Institutions” are a witness of the powerful contribution of Lebanese expertise for the development of its own country.
These initiatives are done in close complementarity with other EU-funded projects, like for instance the support to the National Energy Efficiency scheme (NEEREA), where more than 100 Lebanese Small and Medium-sized Enterprises have initiated energy saving actions (€12.2 million in grants have been awarded). Some Lebanese municipalities have also benefitted from technical support to develop their first Sustainable Energy Action Plan, better known as SEAP. The EU-funded CESMED and SUDEP projects have worked to this end and are currently financing a large part of the identified actions within the SEAP.
These several promising projects under implementation across the country inspire us all. But some adjustments are needed to Lebanon’s legislative framework regarding energy efficiency and renewable energy. Furthermore, there is a need for a stronger institutional setting that would foster investments and upgrade existing infrastructures. These improvements would certainly stimulate the private sector’s interest and attract national and international investors, for example through innovative financing schemes including public-private partnerships. The European Union encourages Lebanese authorities to double their efforts on these important matters, and reiterates its readiness to accompany these endeavours.
Lebanon and the European Union enjoy a very strong partnership. The European Union is keen on providing the most appropriate support to contribute to Lebanon’s energy autonomy and to provide an uninterrupted energy supply for all citizens at an affordable price. I hope that the current European Energy Strategy could serve as a “benchmark” for the energy sector perspectives here in Lebanon. For instance, just like many EU Member States, Lebanon could envisage improving its proper targets for 2020 as regards renewable energy, energy efficiency and the fight against greenhouse gas emissions. By doing so, future generations in Lebanon will benefit from the level of ambition and “energy” that is yielded through bringing forward the responsible and sustainable use of natural resources.
Ambassador Christina LassenHead of the Delegation of the European Union to Lebanon

ForewordThe United Nations Development Programme has been working since 2002 to assist the Lebanese government and the various sectors in Lebanon to increase access to sustainable energy by promoting both energy conservation and renewable energy generation. One of the sectors targeted in this report and by the CEDRO project is the industrial one given its importance for the country in terms of job creation and economic impact. The industrial sector employs approximately 20% of the Lebanese work force and constitutes 7.5% of national GDP.
Assisting in reducing the financial burdens on industries when it comes to their energy use through better energy management is one approach to reducing financial costs to industries. To this end, we hope that you will find this Guideline Report on Energy Management in the Industrial Sector useful in communicating ways where small investments will lead to overall significant economic savings that undoubtedly support in protecting industries against fuel price rises in the future.
Philippe LazzariniUNDP Resident Representative

Ener
gy E
ffici
ency
in th
e Le
bane
se In
dust
rial S
ecto
r
i
Executive Summary
Energy always holds that special place in the balance sheet of industrial facilities and large service institutions. Often, energy alone constitutes more than 30% of the expenses recorded at the end of an institution’s fiscal year.
With focus on the industrial sector, where the market is very competitive and only those who are able to reduce their cost per produced unit are able to maintain a strong market position, considering energy efficiency and implementing energy conservation measures are as important as product quality and the supply chain.
Being able to reduce energy costs by one US Cent per kWh could end up saving on manufacturing costs by 0.95 US Dollars to make a typical one-liter plastic bottle, cap, and packaging. On the other hand, reducing energy consumption by a mere 20% would lead to a reduction of 2.5 US Dollars on the manufacturing cost to make a typical one-liter plastic bottle, cap, and packaging. This reduced cost gives the manufacturer a competitive advantage in a market where every reduction in costs makes a difference.
The first step towards adopting an energy efficient manufacturing and processing approach is by conducting an energy audit. An energy audit is an advanced technical and financial study performed by qualified energy auditors and specialized engineers to assess the energy performance of the facility and quantify the energy usage at the site, highlight areas for potential savings and give the data from which performance indicators can be derived.
The energy audit is designed to determine where, when, why and how energy is being used. As a result, a set of recommendations known as Energy Efficiency Measures (EEMs) are identified, which lead to energy conservation and cost reduction.
As part of the European Union funded UNDP-CEDRO IV project activities, five energy audits were performed on three industries, one university campus and a mixed-use facility, to help them better manage their energy flow and reduce their production expenses.
The results led to impressive cost savings reaching 53% in some facilities, split between electrical energy and thermal energy savings. With an average potential of cost saving exceeding 39%, savings ranged between 22% and 55%.
Energy efficiency had the largest impact on process and industrial refrigeration in industrial and mixed-use facilities, while impacting HVAC the most in service facilities.
This variation is led by the varying energy consumption density between the different types of facilities, with some focusing on industrial activities while others more focused on services as shown in Figure E1. Figure E1 presents the energy consumption breakdown in different facilities classified by type, with IND indicating an industrial facility, MUF indicating a mixed-use facility, and EDU indicating an educational facility.

Energy Efficiency in the Lebanese Industrial Sector
ii
Based on the assessments of these facilities, several energy efficiency measures have been identified, measures that can also be applicable to other similar facilities across Lebanon, and accordingly, the set of EEMs developed hereafter are generally applicable to the Lebanese industry sector. A set of EEMs covering major categories such as monitoring and energy management, compressed air systems, steam systems, and heat recovery are analyzed, presenting technical and financial details for each measure in these categories.
EEMs vary in terms of investment requirements, saving potential and payback period, ranging from low and no cost investments to heavy investment solutions. These are outlined in Table E1.
Figure E1. Breakdown of energy use per category in the five audited sites

Ener
gy E
ffici
ency
in th
e Le
bane
se In
dust
rial S
ecto
r
iii
Tabl
e E1
. EEM
s fo
r Ind
ustri
al F
acilit
ies
(inve
stm
ent,
savi
ng, p
ayba
ck p
erio
d)
CAT
EGO
RYEE
MD
ESC
RIP
TIO
NIN
VEST
MEN
T (R
ANG
E)SA
VIN
G
(%)
ON
1PB
P (Y
RS)
MO
NIT
OR
ING
&
ENER
GY
MAN
AGEM
ENT
Ener
gy M
eter
ing
& C
ontro
lEn
ergy
mon
itorin
g sy
stem
for o
ptim
ized
ener
gy u
tiliza
tion
(Ent
erpr
ise e
nerg
y m
anag
emen
t, SC
ADA,
etc
.)$1
0,00
0 –
$50,
000+
5% –
35%
EN2
Peak
Hou
rs
Man
agem
ent
Load
shi
fts a
nd e
nerg
y ge
nera
tion
sour
ce o
ptim
izat
ion
base
d on
fuel
pric
es a
nd ta
riff s
truct
ure
appl
ied
at th
e fa
cilit
y$0
1%EE
0
CO
MPR
ESSE
D
AIR
SYS
TEM
Syst
em
Opt
imiza
tion
Follo
win
g pr
oper
mai
nten
ance
pra
ctic
es, a
nd p
rope
rly
sizin
g th
e sy
stem
. In
addi
tion
to im
plem
entin
g of
goo
d ho
usek
eepi
ng m
easu
res
$0 –
$10
,000
Up to
10%
EE<2
Leak
age
Prev
entio
n
Avoi
ding
leak
ages
and
trea
tmen
t of d
amag
ed p
ipes
, ac
cess
orie
s, e
lbow
s, a
nd o
ther
leak
ing
item
s th
at le
ad to
w
astin
g co
mpr
esse
d ai
r$0
– $
5,00
0Up
to 5
%EE
<1
Tem
pera
ture
O
ptim
izatio
n
Relo
catin
g th
e ai
r com
pres
sor o
r ins
tallin
g a
pipi
ng
exte
nsio
n th
at a
llow
s th
e in
let o
f out
door
air
to th
e ai
r co
mpr
esso
r$0
– $
500
1% –
3%
EE<1
Pres
sure
Re
duct
ion
Redu
ctio
n of
set
pre
ssur
e to
the
low
est p
ossib
le v
alue
. C
ould
be
appl
ied
at th
e po
int o
f usa
ge o
r at t
he a
ir co
mpr
esso
r poi
nt$0
1% –
3%
EE0
STEA
M
SYST
EM
Com
bust
ion
Opt
imiza
tion
Opt
imizi
ng c
ombu
stio
n effi
cien
cy b
y fu
el to
air
ratio
co
ntro
l and
oxy
gen
trim
min
g, a
void
ing
loss
es a
nd
redu
cing
fuel
con
sum
ptio
n$5
00 –
$10
,000
2% –
5%
TH<3
Con
dens
ate
Retu
rn
Thro
ugh
a co
nden
sate
reco
very
sys
tem
that
reco
vers
co
nden
sate
from
ste
am in
stal
latio
ns in
ord
er to
max
imize
th
eir o
vera
ll ene
rgy
effici
ency
~ $1
00,0
003%
–10
%TH
3
1 EN
: Tot
al En
ergy
; EL:
Elec
trical
Ener
gy; T
H: T
herm
al En
ergy

Energy Efficiency in the Lebanese Industrial Sector
iv
CAT
EGO
RYEE
MD
ESC
RIP
TIO
NIN
VEST
MEN
T (R
ANG
E)SA
VIN
G
(%)
ON
1PB
P (Y
RS)
STEA
M
SYST
EM
Blow
dow
n St
eam
Rec
over
y
Reco
verin
g en
ergy
from
blo
wdo
wn
stea
m a
nd re
ducin
g en
ergy
loss
es c
ause
d by
this
nece
ssar
y m
ainte
nanc
e m
easu
re~
$5,0
00~
2%TH
<3
Ther
mal
In
sula
tion
Impr
ovin
g in
sula
tion
cond
ition
s to
all
stea
m n
etw
ork
elem
ents
as
wel
l as
boile
rs a
nd h
ot m
ediu
ms.
Thi
s im
prov
emen
t als
o in
clud
es p
rope
r mai
nten
ance
pr
actic
es
$500
– $
5,00
01%
–5
%TH
~1
Stea
m T
raps
M
anag
emen
t
Man
agem
ent o
f ste
am tr
aps
incl
udin
g m
aint
enan
ce,
care
, cle
anin
g, a
nd re
plac
emen
t if t
he it
em is
tota
lly
dam
aged
< $1
5,00
01%
– 2
%TH
<1
Stea
m L
eaka
ge
Repa
ir
Avoi
ding
leak
ages
and
trea
tmen
t of d
amag
ed p
ipes
, ac
cess
orie
s, e
lbow
s, a
nd o
ther
leak
ing
item
s th
at le
ad
to w
astin
g st
eam
$0 –
$3,
000
5% –
10%
TH<2
HEA
T R
ECO
VERY
Econ
omize
rFl
ue g
as e
at re
cove
ry th
roug
h th
e us
e of
an
econ
omiz
er th
at re
uses
the
exha
ust g
as a
nd u
ses
it in
a
heat
exc
hang
er
$15,
000
– $4
0,00
01%
– 5
%TH
<3
Exha
ust G
as
Boile
r
Hea
t rec
over
y fro
m a
gen
erat
or’s
exh
aust
con
nect
ing
it to
a s
ingl
e un
it ca
lled
exha
ust g
as b
oile
r tha
t ge
nera
tes
ther
mal
ene
rgy
for w
ater
hea
ting
$200
,000
–
$500
,000
5% –
15%
TH3
– 7
Hea
t Exc
hang
er
– Ja
cket
Wat
er
Hea
t rec
over
y fro
m g
ener
ator
exh
aust
by
the
inst
alla
tion
of a
hea
t exc
hang
er o
n th
e en
gine
s ja
cket
w
ater
coo
lant
to p
rodu
ce h
ot w
ater
$20,
000
– $1
20,0
001%
– 1
5%TH
1 –
5
Abso
rptio
n C
hille
r
Hea
t rec
over
y fro
m g
ener
ator
exh
aust
to b
e us
ed in
an
abso
rptio
n ch
iller t
o ge
nera
te c
hille
d w
ater
and
sav
e on
ele
ctric
ity e
xpen
ses
$200
,000
–
$500
,000
5% –
15%
TL~5

Ener
gy E
ffici
ency
in th
e Le
bane
se In
dust
rial S
ecto
r
v
Table E1 shows the potential savings for various energy efficiency measures. These can be considerable, promising to lift the energy performance of the facility and reduce its energy costs. This is achievable through a major milestone to begin with; the energy audit.
With local companies and consultants performing energy audits for more than 10 years now, and with a suitable financing scheme in place, it is currently the right time for industries and large facilities to consider carrying out their first energy audit study. The energy audit study will cause an eventual evolution in the operating expenses of the facility and eventually give a competitive edge, leading to a relatively more profitable operation and a more attractive product.

Energy Efficiency in the Lebanese Industrial Sector
vi
Table of Contents
Executive Summary. . . . . . . . . . . . . . . . . . . . . . . . . . . . . . . . . . . . . . . . . . . . . . . . . . . . . . . . . . . . . . . . . . . . . . . . . . . . . . . . . . . . . . . . . i
Table of Contents. . . . . . . . . . . . . . . . . . . . . . . . . . . . . . . . . . . . . . . . . . . . . . . . . . . . . . . . . . . . . . . . . . . . . . . . . . . . . . . . . . . . . . . . . .vi
List of Tables. . . . . . . . . . . . . . . . . . . . . . . . . . . . . . . . . . . . . . . . . . . . . . . . . . . . . . . . . . . . . . . . . . . . . . . . . . . . . . . . . . . . . . . . . . . . . .viii
List of Figures. . . . . . . . . . . . . . . . . . . . . . . . . . . . . . . . . . . . . . . . . . . . . . . . . . . . . . . . . . . . . . . . . . . . . . . . . . . . . . . . . . . . . . . . . . . . .viii
List of Abbreviations & Acronyms. . . . . . . . . . . . . . . . . . . . . . . . . . . . . . . . . . . . . . . . . . . . . . . . . . . . . . . . . . . . . . . . . . . . . . . . .x
Introduction & Background. . . . . . . . . . . . . . . . . . . . . . . . . . . . . . . . . . . . . . . . . . . . . . . . . . . . . . . . . . . . . . . . . . . . . . . . . . . . . . . .1
What is an energy audit?. . . . . . . . . . . . . . . . . . . . . . . . . . . . . . . . . . . . . . . . . . . . . . . . . . . . . . . . . . . . . . . . . . . . . . . . . . . . . . . . . .1
Industrial Energy Audit. . . . . . . . . . . . . . . . . . . . . . . . . . . . . . . . . . . . . . . . . . . . . . . . . . . . . . . . . . . . . . . . . . . . . . . . . . . . . . . . . . .1
Commercial & Institutional Energy Audit:. . . . . . . . . . . . . . . . . . . . . . . . . . . . . . . . . . . . . . . . . . . . . . . . . . . . . . . . . . . . . . . . .5
Level 1 – Walk-Through Survey. . . . . . . . . . . . . . . . . . . . . . . . . . . . . . . . . . . . . . . . . . . . . . . . . . . . . . . . . . . . . . . . . . . . . . . . . . . .5
Level 2 – Energy Survey and Analysis. . . . . . . . . . . . . . . . . . . . . . . . . . . . . . . . . . . . . . . . . . . . . . . . . . . . . . . . . . . . . . . . . . . .5
Level 3 – Detailed Analysis of Capital-Intensive Modifications. . . . . . . . . . . . . . . . . . . . . . . . . . . . . . . . . . . . . . . . . .5
The Case Study Energy Audits. . . . . . . . . . . . . . . . . . . . . . . . . . . . . . . . . . . . . . . . . . . . . . . . . . . . . . . . . . . . . . . . . . . . . . . . . . . .6
Introduction to Undertaken Energy Audits. . . . . . . . . . . . . . . . . . . . . . . . . . . . . . . . . . . . . . . . . . . . . . . . . . . . . . . . . . . . . . . .6
The Sites. . . . . . . . . . . . . . . . . . . . . . . . . . . . . . . . . . . . . . . . . . . . . . . . . . . . . . . . . . . . . . . . . . . . . . . . . . . . . . . . . . . . . . . . . . . . . . . . . . .7
Obstacles to Overcome. . . . . . . . . . . . . . . . . . . . . . . . . . . . . . . . . . . . . . . . . . . . . . . . . . . . . . . . . . . . . . . . . . . . . . . . . . . . . . . . . . .7
Key Findings. . . . . . . . . . . . . . . . . . . . . . . . . . . . . . . . . . . . . . . . . . . . . . . . . . . . . . . . . . . . . . . . . . . . . . . . . . . . . . . . . . . . . . . . . . . . . .10
Energy Balance Analysis. . . . . . . . . . . . . . . . . . . . . . . . . . . . . . . . . . . . . . . . . . . . . . . . . . . . . . . . . . . . . . . . . . . . . . . . . . . . . . . . .10
Energy Balance Findings. . . . . . . . . . . . . . . . . . . . . . . . . . . . . . . . . . . . . . . . . . . . . . . . . . . . . . . . . . . . . . . . . . . . . . . . . . . . . . . . .10
Industrial facilities. . . . . . . . . . . . . . . . . . . . . . . . . . . . . . . . . . . . . . . . . . . . . . . . . . . . . . . . . . . . . . . . . . . . . . . . . . . . . . . . . . . . . . . .10
Mixed Use Facility. . . . . . . . . . . . . . . . . . . . . . . . . . . . . . . . . . . . . . . . . . . . . . . . . . . . . . . . . . . . . . . . . . . . . . . . . . . . . . . . . . . . . . . .12
Educational Facility. . . . . . . . . . . . . . . . . . . . . . . . . . . . . . . . . . . . . . . . . . . . . . . . . . . . . . . . . . . . . . . . . . . . . . . . . . . . . . . . . . . . . .13
Total facilities comparison. . . . . . . . . . . . . . . . . . . . . . . . . . . . . . . . . . . . . . . . . . . . . . . . . . . . . . . . . . . . . . . . . . . . . . . . . . . . . . .14
Energy Saving Potential. . . . . . . . . . . . . . . . . . . . . . . . . . . . . . . . . . . . . . . . . . . . . . . . . . . . . . . . . . . . . . . . . . . . . . . . . . . . . . . . .16
Energy Efficiency Measures. . . . . . . . . . . . . . . . . . . . . . . . . . . . . . . . . . . . . . . . . . . . . . . . . . . . . . . . . . . . . . . . . . . . . . . . . . . . .18
Monitoring and Energy Management. . . . . . . . . . . . . . . . . . . . . . . . . . . . . . . . . . . . . . . . . . . . . . . . . . . . . . . . . . . . . . . . . . .18
Energy Metering and Control. . . . . . . . . . . . . . . . . . . . . . . . . . . . . . . . . . . . . . . . . . . . . . . . . . . . . . . . . . . . . . . . . . . . . . . . . . . .18
Peak Hours Management. . . . . . . . . . . . . . . . . . . . . . . . . . . . . . . . . . . . . . . . . . . . . . . . . . . . . . . . . . . . . . . . . . . . . . . . . . . . . . .24
Summary of Monitoring and Energy Management EEMs. . . . . . . . . . . . . . . . . . . . . . . . . . . . . . . . . . . . . . . . . . . . .26
Compressed Air System. . . . . . . . . . . . . . . . . . . . . . . . . . . . . . . . . . . . . . . . . . . . . . . . . . . . . . . . . . . . . . . . . . . . . . . . . . . . . .27
System Optimization. . . . . . . . . . . . . . . . . . . . . . . . . . . . . . . . . . . . . . . . . . . . . . . . . . . . . . . . . . . . . . . . . . . . . . . . . . . . . . . . .27
Leakage Prevention. . . . . . . . . . . . . . . . . . . . . . . . . . . . . . . . . . . . . . . . . . . . . . . . . . . . . . . . . . . . . . . . . . . . . . . . . . . . . . . . . . . . .29
Temperature Optimization. . . . . . . . . . . . . . . . . . . . . . . . . . . . . . . . . . . . . . . . . . . . . . . . . . . . . . . . . . . . . . . . . . . . . . . . . . . .31
Pressure Reduction. . . . . . . . . . . . . . . . . . . . . . . . . . . . . . . . . . . . . . . . . . . . . . . . . . . . . . . . . . . . . . . . . . . . . . . . . . . . . . . . . . .32
Summary of Compressed Air EEMs. . . . . . . . . . . . . . . . . . . . . . . . . . . . . . . . . . . . . . . . . . . . . . . . . . . . . . . . . . . . . . . . . . .36
Steam System. . . . . . . . . . . . . . . . . . . . . . . . . . . . . . . . . . . . . . . . . . . . . . . . . . . . . . . . . . . . . . . . . . . . . . . . . . . . . . . . . . . . . . . . . . .37

Ener
gy E
ffici
ency
in th
e Le
bane
se In
dust
rial S
ecto
r
vii
Identifying Energy Saving Opportunities. . . . . . . . . . . . . . . . . . . . . . . . . . . . . . . . . . . . . . . . . . . . . . . . . . . . . . . . . . . . . .37
Combustion Efficiency Improvement. . . . . . . . . . . . . . . . . . . . . . . . . . . . . . . . . . . . . . . . . . . . . . . . . . . . . . . . . . . . . . . . . . .40
Estimating Savings from O2 Trim. . . . . . . . . . . . . . . . . . . . . . . . . . . . . . . . . . . . . . . . . . . . . . . . . . . . . . . . . . . . . . . . . . . . . . . .43
Condensate Return. . . . . . . . . . . . . . . . . . . . . . . . . . . . . . . . . . . . . . . . . . . . . . . . . . . . . . . . . . . . . . . . . . . . . . . . . . . . . . . . . . . . .43
Blowdown Steam Recovery. . . . . . . . . . . . . . . . . . . . . . . . . . . . . . . . . . . . . . . . . . . . . . . . . . . . . . . . . . . . . . . . . . . . . . . . . . .45
Thermal Insulation. . . . . . . . . . . . . . . . . . . . . . . . . . . . . . . . . . . . . . . . . . . . . . . . . . . . . . . . . . . . . . . . . . . . . . . . . . . . . . . . . . . . . . .46
Steam traps Management. . . . . . . . . . . . . . . . . . . . . . . . . . . . . . . . . . . . . . . . . . . . . . . . . . . . . . . . . . . . . . . . . . . . . . . . . . . . . . .49
Steam Leakage Repair. . . . . . . . . . . . . . . . . . . . . . . . . . . . . . . . . . . . . . . . . . . . . . . . . . . . . . . . . . . . . . . . . . . . . . . . . . . . . . . . . .51
Summary of Steam System EEMs. . . . . . . . . . . . . . . . . . . . . . . . . . . . . . . . . . . . . . . . . . . . . . . . . . . . . . . . . . . . . . . . . . . . . .53
Heat Recovery. . . . . . . . . . . . . . . . . . . . . . . . . . . . . . . . . . . . . . . . . . . . . . . . . . . . . . . . . . . . . . . . . . . . . . . . . . . . . . . . . . . . . . . . . . . .54
Heat Recovery from Boiler – Economizer. . . . . . . . . . . . . . . . . . . . . . . . . . . . . . . . . . . . . . . . . . . . . . . . . . . . . . . . . . . . .54
Heat Recovery from Generator – Exhaust Gas Boiler. . . . . . . . . . . . . . . . . . . . . . . . . . . . . . . . . . . . . . . . . . . . . .56
Heat Recovery from Generator – Jacket Water. . . . . . . . . . . . . . . . . . . . . . . . . . . . . . . . . . . . . . . . . . . . . . . . . . . . . . .58
Heat Recovery from Generator – Absorption Chiller. . . . . . . . . . . . . . . . . . . . . . . . . . . . . . . . . . . . . . . . . . . . . . . . . . . .59
Summary of Heat Recovery EEMs. . . . . . . . . . . . . . . . . . . . . . . . . . . . . . . . . . . . . . . . . . . . . . . . . . . . . . . . . . . . . . . . . . . . . .61
Getting an Energy Audit. . . . . . . . . . . . . . . . . . . . . . . . . . . . . . . . . . . . . . . . . . . . . . . . . . . . . . . . . . . . . . . . . . . . . . . . . . . . . . . . . .62
The Need for an Energy Audit. . . . . . . . . . . . . . . . . . . . . . . . . . . . . . . . . . . . . . . . . . . . . . . . . . . . . . . . . . . . . . . . . . . . . . . . . . .62
Preparing for the Energy Audit. . . . . . . . . . . . . . . . . . . . . . . . . . . . . . . . . . . . . . . . . . . . . . . . . . . . . . . . . . . . . . . . . . . . . . . . . . .62
Finding and Selecting an Energy Auditor. . . . . . . . . . . . . . . . . . . . . . . . . . . . . . . . . . . . . . . . . . . . . . . . . . . . . . . . . . . . . . . .62
The Fees. . . . . . . . . . . . . . . . . . . . . . . . . . . . . . . . . . . . . . . . . . . . . . . . . . . . . . . . . . . . . . . . . . . . . . . . . . . . . . . . . . . . . . . . . . . . . . . . . .62
Access to Finance. . . . . . . . . . . . . . . . . . . . . . . . . . . . . . . . . . . . . . . . . . . . . . . . . . . . . . . . . . . . . . . . . . . . . . . . . . . . . . . . . . . . . . . .62
Bibliography. . . . . . . . . . . . . . . . . . . . . . . . . . . . . . . . . . . . . . . . . . . . . . . . . . . . . . . . . . . . . . . . . . . . . . . . . . . . . . . . . . . . . . . . . . . . . .63

Energy Efficiency in the Lebanese Industrial Sector
viii
List of Tables
Table 1: Relationships of ASHRAE Energy Audit Levels 1, 2, and 3. . . . . . . . . . . . . . . . . . . . . . . . . . . . . . . . . . .6
Table 2: Electrical load and energy breakdown in the 3 industrial facilities. . . . . . . . . . . . . . . . . . . . . . . . . . .11
Table 3: Electrical load and energy breakdown in the Mixed Use Facility. . . . . . . . . . . . . . . . . . . . . . . . . . . . .12
Table 4: Electrical load and energy breakdown in the Educational Facility. . . . . . . . . . . . . . . . . . . . . . . . . . .13
Table 5: EDL industrial tariff. . . . . . . . . . . . . . . . . . . . . . . . . . . . . . . . . . . . . . . . . . . . . . . . . . . . . . . . . . . . . . . . . . . . . . . . . . . . . .24
Table 6: Effect of intake air temperature on the air compressor consumption (Rabadia 2015). . . . . . .31
Table 7: Air inlet filter pressure drop and air compressor consumption (Rabadia 2015). . . . . . . . . . . . .32
Table 8: Heat losses from horizontal pipes with ambient temperature. . . . . . . . . . . . . . . . . . . . . . . . . . . . . . . .48
Table 9: Steam leak flow at 8 bars (Steam Main 2016). . . . . . . . . . . . . . . . . . . . . . . . . . . . . . . . . . . . . . . . . . . . . . . . .52
List of Figures
Figure 1: Flowchart of a Preliminary Energy Audit (Morvay 2008). . . . . . . . . . . . . . . . . . . . . . . . . . . . . . . . . . . . . . . . .2
Figure 2: Flowchart of a Detailed Energy Audit (Morvay 2008). . . . . . . . . . . . . . . . . . . . . . . . . . . . . . . . . . . . . . . . . . . .3
Figure 3: 10 Steps for a Detailed Energy Audit. . . . . . . . . . . . . . . . . . . . . . . . . . . . . . . . . . . . . . . . . . . . . . . . . . . . . . . . . . . .4
Figure 4: Average electrical load (Left) and energy (right) breakdown for the industries. . . . . . . . . . . . . . . . .11
Figure 5: Electrical load (Left) and energy (right) breakdown for the Mixed Use Facility. . . . . . . . . . . . . . . . .12
Figure 6: Electrical load (Left) and energy (right) breakdown for the Educational Facility. . . . . . . . . . . . . . . .13
Figure 7: Electrical energy supply by source for the five sites. . . . . . . . . . . . . . . . . . . . . . . . . . . . . . . . . . . . . . . . . . . .14
Figure 8: Energy consumption by type for the five sites. . . . . . . . . . . . . . . . . . . . . . . . . . . . . . . . . . . . . . . . . . . . . . . . . .14
Figure 9: Electrical energy load breakdown for the five sites. . . . . . . . . . . . . . . . . . . . . . . . . . . . . . . . . . . . . . . . . . . . .15
Figure 10: Electrical energy consumption breakdown for the five sites. . . . . . . . . . . . . . . . . . . . . . . . . . . . . . . . . .15
Figure 11: Electrical energy cost saving potential. . . . . . . . . . . . . . . . . . . . . . . . . . . . . . . . . . . . . . . . . . . . . . . . . . . . . . . . .16
Figure 12: Thermal energy cost saving potential. . . . . . . . . . . . . . . . . . . . . . . . . . . . . . . . . . . . . . . . . . . . . . . . . . . . . . . . .16
Figure 13: Total energy cost saving potential. . . . . . . . . . . . . . . . . . . . . . . . . . . . . . . . . . . . . . . . . . . . . . . . . . . . . . . . . . . . .17
Figure 14: Energy information system architecture (Courtesy: Schneider Electric). . . . . . . . . . . . . . . . . . . . . . .18
Figure 15: Plant’s metering and targeting (The Graph is not zero based and not to scale). . . . . . . . . . . . . .19
Figure 16: SCADA Screen Snapshot. . . . . . . . . . . . . . . . . . . . . . . . . . . . . . . . . . . . . . . . . . . . . . . . . . . . . . . . . . . . . . . . . . . . .22
Figure 17: Variation of the generators kWh cost related to diesel cost. . . . . . . . . . . . . . . . . . . . . . . . . . . . . . . . . . .24
Figure 18: Typical compressed air system components and network. . . . . . . . . . . . . . . . . . . . . . . . . . . . . . . . . . . .27
Figure 19: Compressed air system and network energy flow diagram. . . . . . . . . . . . . . . . . . . . . . . . . . . . . . . . . . .27
Figure 20: Effect of leakage on power consumption at a system pressure of 7 bar(e).. . . . . . . . . . . . . . . . .30

ix
Ener
gy E
ffici
ency
in th
e Le
bane
se In
dust
rial S
ecto
r
Figure 21: Relation between excess pressure and excess power. . . . . . . . . . . . . . . . . . . . . . . . . . . . . . . . . . . . . . . .34
Figure 22: Typical steam network with recovery. . . . . . . . . . . . . . . . . . . . . . . . . . . . . . . . . . . . . . . . . . . . . . . . . . . . . . . . . .37
Figure 23: Optimal excess air zone in a combustion process. . . . . . . . . . . . . . . . . . . . . . . . . . . . . . . . . . . . . . . . . . . .40
Figure 24: Continuous & portable flue gas and emission analyzers. . . . . . . . . . . . . . . . . . . . . . . . . . . . . . . . . . . . . .41
Figure 25: Relationship of CO in flue gas and oxygen level. . . . . . . . . . . . . . . . . . . . . . . . . . . . . . . . . . . . . . . . . . . . . . .42
Figure 26: Hays Cleveland’s O2 trim system installed on two boilers. . . . . . . . . . . . . . . . . . . . . . . . . . . . . . . . . . . . .42
Figure 27: Condensate piping connection (Spirac Sarco 2016). . . . . . . . . . . . . . . . . . . . . . . . . . . . . . . . . . . . . . . . . .44
Figure 28: Boiler blowdown system. . . . . . . . . . . . . . . . . . . . . . . . . . . . . . . . . . . . . . . . . . . . . . . . . . . . . . . . . . . . . . . . . . . . . . .45
Figure 29: blowdown and heat recovery. . . . . . . . . . . . . . . . . . . . . . . . . . . . . . . . . . . . . . . . . . . . . . . . . . . . . . . . . . . . . . . . . .46
Figure 30: Example of poor insulation in steam pipes. . . . . . . . . . . . . . . . . . . . . . . . . . . . . . . . . . . . . . . . . . . . . . . . . . . .47
Figure 31: Fiberglass insulation material and well-insulated steam systems. . . . . . . . . . . . . . . . . . . . . . . . . . . . .47
Figure 32: Automated Steam Trap system Example (courtesy: Armstrong). . . . . . . . . . . . . . . . . . . . . . . . . . . . . .50
Figure 33: Relationship between steam pressure and steam losses. . . . . . . . . . . . . . . . . . . . . . . . . . . . . . . . . . . . .51
Figure 34: Steam leakage examples. . . . . . . . . . . . . . . . . . . . . . . . . . . . . . . . . . . . . . . . . . . . . . . . . . . . . . . . . . . . . . . . . . . . . .52
Figure 35: Steam leakage rate as compared to steam pressure. . . . . . . . . . . . . . . . . . . . . . . . . . . . . . . . . . . . . . . . .52
Figure 36: Steam boiler energy balance scheme. . . . . . . . . . . . . . . . . . . . . . . . . . . . . . . . . . . . . . . . . . . . . . . . . . . . . . . . .54
Figure 37: Steam boiler economizer installation. . . . . . . . . . . . . . . . . . . . . . . . . . . . . . . . . . . . . . . . . . . . . . . . . . . . . . . . . .55
Figure 38: Cogeneration/CHP Energy Diagram v/s conventional systems. . . . . . . . . . . . . . . . . . . . . . . . . . . . . . .56
Figure 39: Exhaust gas boiler. . . . . . . . . . . . . . . . . . . . . . . . . . . . . . . . . . . . . . . . . . . . . . . . . . . . . . . . . . . . . . . . . . . . . . . . . . . . . .57
Figure 40: Clayton R System- Operational scheme. . . . . . . . . . . . . . . . . . . . . . . . . . . . . . . . . . . . . . . . . . . . . . . . . . . . . .58
Figure 41: Heat exchanger network drawing (left); Type of heat exchanger (right). . . . . . . . . . . . . . . . . . . . . . . . . . . . . .59
Figure 42: CRM (left); ARP (right) systems. . . . . . . . . . . . . . . . . . . . . . . . . . . . . . . . . . . . . . . . . . . . . . . . . . . . . . . . . . . . . . . .60
Figure 43: Sample drawing of an ARP on 1000kVA generator. . . . . . . . . . . . . . . . . . . . . . . . . . . . . . . . . . . . . . . . . . .60

Energy Efficiency in the Lebanese Industrial Sector
List of Abbreviations & Acronyms
°C Degree Celsius ARP Absorption Refrigeration PlantBTU British Thermal UnitCEDRO Country Energy Efficiency and Renewable Energy Demonstration Project for the Recovery of LebanonCHP Combined Heat and PowerCRM Compression Refrigeration MachineDEA Detailed Energy AuditDOE Department of EnergyEDL Electricité du LibanEDU Educational Facility EEG Energy Efficiency GroupEEM Energy Efficiency MeasureEGB Exhaust Gas BoilerESCO Energy Service Company h HourHFO Heavy Fuel OilHVAC Heating Ventilation and Air ConditioningIND Industrial FacilityIPCC Intergovernmental Panel on Climate Changekg KilogramkVA Kilo-Volt AmperekW Kilo-wattkW Kilo-WattkWh Kilo-watt Hourl/s Liter per secondLBP Lebanese PoundsLCCA Life-Cycle Cost Analysism3 Cubic metermin Minutemm Millimetermm WC mm Water ColumnMUF Mixed Use FacilityO&M Operation and MaintenancePEA Preliminary Energy AuditSCADA Supervisory Control And Data AcquisitionUNDP United Nations Development ProgrammeUV Ultraviolent
x

Ener
gy E
ffici
ency
in th
e Le
bane
se In
dust
rial S
ecto
r
1
Introduction & Background
Increased efficiency in the utilization of energy resources would ensure the reliability of domestic energy supply, enhance the competitiveness of Lebanese industries and large facilities, and reduce greenhouse gas emissions. Given the strong link between energy, economic growth, and the environment, the development and implementation of Energy Management Programs at national levels achieves considerable advantages that include:
• Economic development: Efficient energy end-use and demand side management leads to a reduction in required generation growth rate, which is significant to economic development
• Sustainability of national energy supply: Efficient electricity production, distribution, and use would contribute to the country’s energy security through sustainability of its domestic supplies
• Environmental protection: Reducing energy consumption in addition to expanding the use of cleaner energy systems and technologies reduces the threat of adverse environmental and health-related impacts
As part of UNDP’s CEDRO IV project, five energy audits were conducted on three industries, one university campus and a mixed-use facility. The audits provide an adequate baseline to understand the current opportunities in and barriers to advancing this field in Lebanon.
This report is intended to be a guideline for industries and large facilities on efficient use of resources and effective energy management in production processes. This type of energy management and efficient use of resources is done through presenting real-life cases from Lebanon and disseminating key results and findings of these audits along with providing general coverage for the best locally adapted EEMs (Energy efficiency Measures) in these sectors.
What is an energy audit?The starting point from where a comprehensive energy management program may be developed is an energy audit, which quantifies the energy usage at a site, highlights areas for potential savings and gives the data from which performance indicators can be derived.
In short, the energy audit is designed to determine where, when, why and how energy is being used. This information shall then be used to identify opportunities to improve efficiency, decrease energy costs and reduce greenhouse gas emissions that contribute to climate change. Energy audits can also verify the effectiveness of Energy Efficiency Measures (EEMs) after they have been implemented.
Industrial and commercial energy audits are very similar in the process. However, some differences lie in the areas on which the auditor focuses.
Industrial Energy AuditAn Industrial energy audit is an important foundation towards the implementation of an energy management program.
Typically, in most industries the three top operating expenses are often found to be energy – whether it is electrical or thermal – labor, and materials. Clearly, the energy side is the one that provides the highest flexibility and is the best option to optimize.
An effective energy audit enables owners and managing teams to better understand the ways energy is being used in their industry and locate areas where waste may occur and where improvements can be done.

Energy Efficiency in the Lebanese Industrial Sector
2
The main objective of an industrial energy audit is to find methods to reduce energy consumption per unit of product output or to lower the operating costs. The energy audit provides a benchmark, or reference point for management and assessment of energy use across an organization; it also provides the basis for ensuring more effective use of energy.The industrial energy audit is performed following the steps below:
• Step 1: Understanding the industrial operations• Step 2: Undertaking a Preliminary Energy Audit (PEA) • Step 3: Identifying the preliminary Energy Efficiency Measures• Step 4: Undertaking the Detailed Energy Audit (DEA) including:
I. Preparation of measurements plansII. Detailed analysis of existing energy end uses III. Development of all Energy Efficiency Measures with their technical background, savings calculations and financial analysisIV. Preparation and presentation of the DEA report including the Action Plans
A PEA is essentially a data gathering exercise that aims to develop an understanding of how energy is used in a factory, and to layout the groundwork for a detailed energy audit (DEA) implementation. It starts by gathering all the utilities’ accounting details and building a baseline energy consumption; then it delimits key areas and processes where energy cost savings are possible, identifying the quick wins (Low cost/No Cost savings) and finally paves the way for the DEA in terms of additional requirements and planning.
The figure below provides a flowchart that includes the key steps and data to be gathered during the PEA:
Figure 1: Flowchart of a Preliminary Energy Audit (Morvay 2008)
A Detailed Energy Audit aims at establishing actual energy performance of the various end-users and processes of a plant, and it also aims at providing a comprehensive implementation plan for an energy efficiency program. It offers an approximate estimate of energy savings and cost, accounting for the energy use of major equipment, including energy cost saving calculations and project cost.

3
Ener
gy E
ffici
ency
in th
e Le
bane
se In
dust
rial S
ecto
r
The DEA includes a specific metering campaign, which is done according to a carefully prepared measurement plan. The measuring results are analyzed in order to establish energy balances, specify performance improvement measures and carry out an economic and financial analysis of performance improvement projects.
The figure below provides a flowchart depicting the DEA steps and tasks:
Combining all the steps into one comprehensive plan will lead to the below simplified process for undertaking an Industrial Energy Audit.
Figure 2: Flowchart of a Detailed Energy Audit (Morvay 2008)

4
Energy Efficiency in the Lebanese Industrial Sector
Figure 3: 10 Steps for a Detailed Energy Audit

5
Ener
gy E
ffici
ency
in th
e Le
bane
se In
dust
rial S
ecto
r
Commercial & Institutional Energy Audit: A commercial building energy analysis can generally be classified into the following three levels of effort:
• Level-1: Walk-Through Analysis• Level-2: Energy Survey Analysis• Level-3: Detailed Analysis of Capital Intensive Modifications
Level 1 – Walk-Through SurveyFirst, the building’s energy cost and efficiency are assessed by analyzing energy bills compiled in the PEA and conducting a brief on-site survey of the building. A Level-1 energy survey identifies low-cost/no-cost measures to improve energy efficiency and provides a listing of potential capital improvements that merit further consideration.
Because calculations at this level are minimal, savings and costs are approximate. A Level-1 analysis is applicable when the goal is to establish the general energy savings potential of a building or to establish which buildings in a certain portfolio have the greatest potential savings.
Level-1 results can be used to develop a priority list in order to conduct Level-2 and Level-3 audits.
Level 2 – Energy Survey and AnalysisA Level-2 audit involves a more detailed building survey, including energy consumption and peak demand analysis. In this level, a breakdown of energy end uses within the building is developed.
A Level-2 energy analysis identifies and provides the savings and cost analysis of all practical energy efficiency measures (EEMs) that meet the owner/operator’s constraints and economic criteria, along with proposed changes to the operation and maintenance (O&M) procedures. sIt may also provide a listing of potential capital-intensive improvements that require more thorough data collection and engineering analysis as well as an assessment of potential costs and savings.
This level of analysis provides adequate information for the owner/operator to act upon recommendations for most buildings and for most measures.
Level 3 – Detailed Analysis of Capital-Intensive ModificationsThe third level of engineering analysis focuses on potential capital-intensive projects identified during a Level-2 analysis. It requires a more detailed field data gathering as well as more rigorous engineering and economic analysis, often including modeling (simulation) of the annual energy performance of the building and vendor pricing. This level provides detailed project costs and savings calculations with a high level of confidence adequate for major capital investment decisions.
It often goes beyond the economic analysis of a Level-2 audit and uses a comprehensive life-cycle cost analysis (LCCA) as a decision-making tool.

6
Energy Efficiency in the Lebanese Industrial Sector
Table 1: Relationships of ASHRAE Energy Audit Levels 1, 2, and 3
PEA Level-1 Level-2 Level-3
Calculate kBtu/sf √ √ √ √
Compare to Similar √ √ √ √
Rough costs and savings for EEMs
x √ √ √
Identify capital projects
x √ √ √
End-use breakdown
x x √ √
Detailed analysis x x √ √
Cost & savings for EEMs
x x √ √
O&M changes x x √ √
Refined analysis x x x √
Additional measurements
x x x √
Hourly simulation x x x √
The Case Study Energy Audits
Introduction to Undertaken Energy Audits In its effort to improve demand side management and promote the effective use of renewable energy systems, the Country Energy Efficiency and Renewable Energy Demonstration Project for the Recovery of Lebanon (CEDRO) is collaborating with the private sector to perform energy audits on selected facilities to better manage energy flows and eventually reach a better-optimized solar PV solution that fits the exact needs of the facility and meets the basic demand on electricity. In this regard, facilities that were identified as eligible sites for Solar PV co-financing as part of the CEDRO renewable energy support program, were also selected to undertake an energy audit that helps facility owners understand energy flows and better manage their energy consumption.

7
Ener
gy E
ffici
ency
in th
e Le
bane
se In
dust
rial S
ecto
r
The SitesIn 2014, Energy Efficiency Group (EEG), and ESCO operating in Lebanon, the Middle East, and South Asia, was contracted to undertake comprehensive energy audits of five large-scale facilities in Lebanon. The five facilities are categorized as follows:
• Industrial facility – Quantity: 3;• Mixed-use facility – Quantity: 1; and• Academic facility – Quantity: 1.
Considering these facilities’ large scale and their numerous electromechanical systems, the selected sites, together, make up a rich energy audit reference covering energy efficiency measures ranging from simple lighting retrofit, to building envelope enhancement, process optimization, heat recovery, and many others.
The analysis is presented for each of the above categories and analyzed separately. The industrial facilities are in the food and beverage sector and the carton production sector. They are referred to as IND-1, IND-2, and IND-3.
The mixed-use facility (MUF) consists of large cold storage rooms, a dairy plant, a nursery and a youth club. The educational facility (EDU) is a university in the region of Mount Lebanon.
The five energy audits were conducted in the period between September 2014 and January 2015 each conducted over a two months period. The energy audit period starts with project initiation, data collection, measurement, technical analysis, and is concluded with a presentation of the results to the beneficiary.
Obstacles to Overcome With an energy audit heavily reliant on historic information and data availability, it is very common to face information-related issues and obstacles that could cause some delays or reduce the level of accuracy.
While completing the energy audits for the five sites, a set of obstacles faced the energy audit team, with some being typical and common to all the facilities, and others being site-specific.
Key obstacles identified are:
i. Lack of Historical Energy BaselineThe lack of a proper and comprehensive energy baseline is a common obstacle in many facilities, including the five included in this case study. This obstacle persists due to the following reasons:
EDL bills: The methodology and process of EDL billing are usually found to create a number of challenges, mainly caused by the fact that in many cases bills do not follow any calendar month; the bills sometimes cover 30 days, and they sometimes cover 35 days. Even when covering a period of 30 days, it might not be covering a month by itself, but a period from, for example, April 10 to May 10.
On another note, EDL bills are not always accurate on a monthly basis – a total reconciliation between the meters’ final KWh and the aggregate of the monthly billed ones is sometimes done by EDL at the end of the year and potentially readjustments are done in the last month of the yearly period.Last but not least, EDL bills are sometimes presented lagging at least eight months from the times of the audit. This was a common situation in most sites in this case study.On Site Power Plants: EDL is metered; private generation is rarely metered. The only monitoring and records available for generators is usually the amount of fuel purchased (not consumed), which rarely

8
Energy Efficiency in the Lebanese Industrial Sector
differentiates between fuel consumption for private generation and that for thermal energy. The five facilities in this case study had a record of all the fuel quantities purchased during any calendar month, but it was rather difficult to obtain an accurate value of the fuel (whether diesel or HFO) consumed by the generators during the same month. This difficulty is due to the absence of diesel flow meters that could be used for accurate monitoring and trending. In addition, most properties did not have accurate energy consumption (KWh) readings from both EDL and generators’ in general, including the selected energy baseline period.
Thermal Energy: The issue of metering applies to boilers the same way it applies to generators. It is uncommon to find a facility with metered fuel consumption or thermal energy units. Sites that have thermal energy usage in the form of Hot Water/Steam productions or furnaces do have a track record of all their fuel purchases for any given function but not the fuel consumed, nor any energy production (BTU...).
The above shortfalls affect the Utilities Accounting and the Energy Baseline build up, but do not pose an impossibility of completing the energy audit. These shortfalls are usually overcome by working on an estimation based on the following parameters:
• Onsite power recording during the energy audit• Generators’ energy consumption based on the Liters/KWh as per the related datasheet and
estimated average generators’ loading• Thermal energy calculation based on the fuel type used, the calorific content and the estimated
efficiency of the production unit - hot water/steam boilers, furnaces...
With these criteria in mind, it is a fact that poor historical energy baseline can be a barrier during the implementation of many EEMs, but detailed estimates and thorough engineering calculations could help overcome this issue. Nevertheless, since a detailed energy consumption comparative analysis may be difficult to achieve in some cases, it could negatively affect the accuracy and reliability of some EEM’s implementation.
ii. Information Unavailability: Information availability is a key factor to the success of an energy audit, with barriers related to lack of information or unreliability of available information strongly affecting the progress of the energy audit.
Since the energy auditor’s job is to focus on energy systems and energy flow, it is a waste of time to focus on preparing an inventory list, or drawing a process line from scratch. Lack of information might lead to inaccurate numbers and, of course, a delay in the energy audit process.
The major issues related to information availability in this case study are:
• In certain cases, a comprehensive and up-to-date inventory list of installed equipment was found to be either unavailable or obsolete. While load inventory may be part of the energy auditing work, it is practically impossible to tackle an industrial facility accurately without the assistance of the plant’s technical management in terms of providing a preliminary list of equipment - especially when it comes to all the non-visible equipment or if it is part of a larger production line.
• In some cases, whenever a production line or area has recently been built or added, the related technical information was readily available. However, the difficulty lies when the auditing needs to tackle legacy equipment and machineries.

9
Ener
gy E
ffici
ency
in th
e Le
bane
se In
dust
rial S
ecto
r
Nevertheless, the auditor’s job is to double check and verify information provided, but as a matter of fact, the accuracy of the energy audit depends on the value of the information gathered in the field especially those related to connected loads and their specific operational profile. Variations and inaccuracy in this information, if not spotted by the auditor, would lead to an inaccurate energy balance which affects the feasibility analysis of a large number of the recommended Energy Efficiency Measures, especially when quantifying the energy saving and corresponding cost reduction.
During the energy audit, the auditing team ensures minding the gap of all missing information through real time measurements and an in-depth physical inspection.
iii. Management Focus – PrioritizationAn energy audit is not a mere technical survey to be completed, and it should primarily be a top management focus. In fact, it is widely seen that the most successful energy management programs occur when energy auditing is a key initiative lead from management. In the current CEDRO-driven energy auditing processes, the management of every facility was positively assisting and supporting the project; however, this cooperation is not always true for every other facility, where energy auditing is still not perceived as a tool to provide a clear road map of energy cost reductions, but rather as pure technical work limited to technical personnel.
Management cooperation and understanding the importance of the energy audit to measure, manage, and monitor the facility’s energy flow is an important factor to the success of the energy audit in terms of execution and impact.

10
Energy Efficiency in the Lebanese Industrial Sector
Key Findings
The energy audit is performed to achieve two major outputs that are both of great importance to the facility and the facility owner. The first is a detailed overview of the energy balance and energy flows in the facility, assessing the different end-use categories and reaching an energy baseline defined in terms of power load and energy consumption.
The second major outcome of the energy audit is its potential energy savings and the achievable energy consumption reduction, which are represented in a set of EEMs targeting the different categories previously identified. The EEMs cover a wide range of systems with a wide range of investment levels.
Energy Balance Analysis After the detailed utilities’ costs analysis leading to the energy baseline, the audit tackles the energy balance of the facility. In this part, an energy simulation of the connected loads is completed based on the given production and operational data and is then totally reconciled with real energy consumption and billing as found in the energy baseline.
The energy balance results in a breakdown of the installed power and energy consumption among the key energy end users (primarily electrical loads). It serves as a key energy management dashboard that would ensure the proposed EEMs are not over or underestimated in terms of shares from the total energy consumption.
Similar to most large-scale facilities and institutions, all the facilities in this case study had more than one energy source; they were mainly electrical energy supplied through EDL, privately owned and operated generators, and thermal energy driven by diesel oil or Heavy Fuel Oil (HFO). The quantity and consumption volume of these sources varies among the different facilities and categories, depending on the production type and facilities’ characteristics.
Starting with electrical energy, end-use is analyzed and studied for a baseline year categorizing electricity consumers into six major electricity categories, namely:
• Lighting: Including all lighting fixtures both indoor and outdoor• HVAC: Including all space cooling and ventilation systems• Processes: All motors and loads related to the production lines and processes• Industrial refrigeration: Including cold rooms and industrial cooling systems• Compressed air: Including all onsite air compressors• Miscellaneous: Covering all remaining loads, mainly resistive and minor loads
Energy Balance Findings
Industrial facilities The electrical power load and energy consumption for the three industrial facilities showed relatively similar profiles, where process and industrial cooling were the major consumers. However, HVAC was concluded to be a low electricity consumer due to the negligible need for heating and cooling in industrial facilities.
In terms of connected load, process electrical load had the highest average share with 49% when considering the three facilities together. Process ranked as the highest load for two out of three facilities, while it ranked second in the third facility. Industrial cooling and compressed air followed with a clear variation, however, between the three facilities mainly for industrial cooling, for an obvious fact that one of the facilities relies heavily on refrigerated rooms.

11
Ener
gy E
ffici
ency
in th
e Le
bane
se In
dust
rial S
ecto
r
Converting the connected load to electricity consumption is dependent on the operating hours, which is a major contributor to the rapid increase of lighting share from an average of 0.76% of the connected load to 6.69% of the electricity consumed. This rate ranks it third when considering electricity consumption. Industrial cooling and Process applications remain the largest electricity consumer; however, there is a bigger share for industrial cooling due to higher operational hours.
Table 2: Electrical load and energy breakdown in the 3 industrial facilities
KW Shares %
Project Lighting Ind. Cooling HVAC Process Compressed
Air Misc.
IND-1 3.8% 3.2% 0.0% 62.2% 21.0% 9.8%IND-2 2.8% 15.1% 0.9% 52.9% 11.2% 17.1%IND-3 2.3% 36.7% 3.9% 35.8% 15.0% 6.2%
Average 2.9% 20.0% 1.8% 49.0% 15.0% 11.4%St. Deviation 0.76% 16.98% 2.04% 13.39% 4.94% 5.55%
KW Shares %
Project Lighting Ind. Cooling HVAC Process Compressed
Air Misc.
IND-1 16.9% 1.4% 0.0% 61.9% 13.2% 6.6%IND-2 6.9% 46.0% 4.2% 23.4% 3.6% 15.9%IND-3 4.2% 34.1% 1.4% 37.6% 14.5% 8.2%TOTAL 7.7% 34.1% 2.5% 35.0% 9.1% 11.5%
St. Deviation 6.69% 23.09% 2.14% 19.47% 5.95% 4.97%
Figure 4: Average electrical load (Left) and energy (right) breakdown for the industries

12
Energy Efficiency in the Lebanese Industrial Sector
Mixed Use FacilityThe mixed use facility included a variety of operations; the largest one being an industrial cold storage facility along with a dairy production facility and a small kindergarten.
The electrical power load and energy consumption for MUF showed relatively coherent shares with industrial cooling, process and HVAC being the major consumers. Air compressors were concluded to be a low electricity consumer due to the unimportant need for such facilities.
In terms of connected load, industrial cooling electrical load had the highest average share with 51%, while Process and HVAC followed with 21% and 17% respectively.
Converting the connected load to electricity consumption is dependent on the operating *hours, which is a major contributor to the increase of lighting share from an 8% of the connected load to 12% of the electricity consumed and the drop of HVAC from 17% to 8%. In terms of electoral energy consumed, industrial cooling’s share was as high as 73%, while lighting ranked second followed by HVAC and Process.
Table 3: Electrical load and energy breakdown in the Mixed Use Facility
Figure 5: Electrical load (Left) and energy (right) breakdown for the Mixed Use Facility
KW Shares %
Project Lighting Ind. Cooling HVAC Process Compressed
Air Misc.
MUF 8% 51% 17% 21% 2% 1%
KW Shares %
Project Lighting Ind. Cooling HVAC Process Compressed
Air Misc.
MUF 12% 73% 8% 7% 1% 0%

13
Ener
gy E
ffici
ency
in th
e Le
bane
se In
dust
rial S
ecto
r
Educational FacilityThe educational facility is a typical multi-building campus covering a large number of faculties, administrative areas, dormitories and sports fields.
The contrasts with industrial facilities are clear, since the key energy end users in such a facility typically comprise HVAC systems and lighting. The shares of both the electrical load and electricity consumption of the different energy end-use categories are found below. HVAC is found to represent 70% of the installed power and 62% of the annual energy consumption, while lighting loads represent 18% and 28%, respectively.
The electrical power load and energy consumption for EDU showed relatively coherent shares with HVAC being the major energy consumer, followed by lighting and leaving minor shares for motors and miscellaneous loads. Industrial cooling and compressed air are not available in this type of facility.
In terms of connected load, HVAC electrical load had the highest average share with 70%, while lighting follows with 18%. Converting the connected load to electricity consumption is dependent on the operating hours, which is a major contributor to the increase of lighting share from an 18% of the connected load to 28% of the electricity consumed, giving it the second rank after HVAC whose share dropped from 70% to 62%.
Table 4: Electrical load and energy breakdown in the Educational Facility
Figure 6: Electrical load (Left) and energy (right) breakdown for the Educational Facility
KW Shares %
Project Lighting Ind. Cooling HVAC Process Compressed
Air Misc.
EDU 18% 0% 70% 6% 0% 6%
KW Shares %
Project Lighting Ind. Cooling HVAC Process Compressed
Air Misc.
EDU 28% 0% 62% 6% 0% 4%

14
Energy Efficiency in the Lebanese Industrial Sector
Total facilities comparison Energy supply varies among facilities, with some relying heavily on private generators, while others use them only during power outages. Due to several possible reasons, among which might be insufficient power load supply, or the urgent need for uninterruptible power supply especially for some industrial machines, IND-2 consumes more than 95% of its electrical energy from private generators, which is a unique case when compared to the other facilities that have shares ranging between 35% and 50%.
As for type of energy comparing thermal to electrical, the share ranges from 23% to 86% for electrical versus thermal, staying in the range of 23% to 42% for the industrial facilities, but jumping to more than 80% for the mixed use facility.
These facilities require thermal energy in the form of steam and/or hot water, which are produced by various boilers using either diesel or HFO.
Figure 7: Electrical energy supply by source for the five sites
Figure 8: Energy consumption by type for the five sites

15
Ener
gy E
ffici
ency
in th
e Le
bane
se In
dust
rial S
ecto
r
Comparing electrical load and energy shares of the different categories for the various sites shows that a large share of the processes-related loads are clearly visible in the three industrial sites, as well as the noticeable usage of compressed air systems. In these facilities the space cooling/HVAC loads are minimal, which contrasts with the educational facility where HVAC and lighting loads represent more than 80% of the total electrical energy consumed.
Figure 9: Electrical energy load breakdown for the five sites
Figure 10: Electrical energy consumption breakdown for the five sites

16
Energy Efficiency in the Lebanese Industrial Sector
Energy Saving PotentialThe energy audits at the five facilities resulted in remarkable energy saving potential, ranging from a minimum of 22% for IND-3 facility to as much as 53% for IND-1 facility. This difference is understandable due to the fact that the industrial facility IND-3 has a very specific operation with high dependence on industrial cooling that constitutes around 34% of the electricity consumption.
In terms of electrical energy savings, savings varied from as low as 4% in one of the industries to around 40% in another. This is a typical example showing the differences between industrial facilities depending on the existing infrastructure, production type and energy supply.
As for thermal energy saving, the share increases to almost 60% for one of the industries, and by a significant amount for the others. The great saving potential is noticeable in thermal energy systems.
Figure 11: Electrical energy cost saving potential
Figure 12: Thermal energy cost saving potential

17
Ener
gy E
ffici
ency
in th
e Le
bane
se In
dust
rial S
ecto
r
Combining both the electrical and thermal energy cost savings would lead to the total energy cost savings achieved in each facility. Total savings varied from around 20% of the costs up to nearly 55%.
The results clearly signify the importance of energy conservation in these sectors, with a possibility of cutting energy costs by half in certain cases.
Figure 13: Total energy cost saving potential

18
Energy Efficiency in the Lebanese Industrial Sector
Energy Efficiency Measures
Energy Efficiency Measures should generally overlook the electrical and thermal loads while also looking at the energy production/supply/purchase optimization, focusing on industrial process and high load operations.
Thinking of the industrial sector, energy conservation related to motor systems, steam systems, compressed-air systems, pumps, and fan systems are very common. This track of thought leads to a saving potential for two major reasons. The first reason is the high energy cost corresponding to these operations and the second is the criticality of these loads to the performance of the industrial facility. These are so-called “cross-cutting” technologies. In addition, each industrial sub-sector has its own unique production technologies and processes. Energy-efficiency improvement opportunities can be found in both cross-cutting as well as industry-specific areas. Since there are many industrial sectors with numerous types of technologies and machinery, it is beyond the scope of this guidebook to discuss in detail the energy-efficiency opportunities for each technology, system, or industry.
On the other hand, mixed use and educational facilities are similar to industrial facilities in one aspect, but different in others. In such facilities other loads like lighting, HVAC and other operational loads are essential.
When these facilities are tackled from different aspects and they are thoroughly studied, a breadth of measures arise that could be perceived as potentially applicable to similar facilities across Lebanon, and accordingly, the set of EEMs developed hereafter are generally applicable to the Lebanese industrial sector. However, the following measures have been excluded from the report:
• Lighting retrofit schemes which have been covered in a variety of other reports and which are applicable to all facilities, including industries, and which provide high financial savings
• Renewable Energy Technologies since they are mostly covered by studies and reports undertaken by CEDRO
• Power Factor Correction, which is well adopted within Lebanese industries
The covered measures focused on the below load categories/management:
• Monitoring and Energy Management• Compressed Air Systems• Steam Systems• Heat Recovery
Finally, it should be stressed that facility operators should optimize their internal loads through the application of an overall energy management program, prior to seeking an alternative energy source.
Monitoring and Energy Management
Energy Metering and Control
IntroductionEnergy metering employs a set of meters, sensors, and monitoring devices to collect data related to energy consumption in a process, a production line, a specific line, or the facility as a whole.
Collecting data helps facility operators set targets, performance indicators, and helps produce regular monitoring reports.

19
Ener
gy E
ffici
ency
in th
e Le
bane
se In
dust
rial S
ecto
r
The details and complexities of the system design depends on the facility itself, the architectural build-up, and the control method in place.
A common solution is Enterprise Energy Management, which delivers all the information and control a facility operator needs, making it fast and easy to manage complex power supplies and building operations. ApplicationAcross most of the industrial and large scale facilities in Lebanon, poor metering and lack of accurate energy information are observed, making the installation of networked metering systems with host software a priority in the overall energy management program.
A sample scheme of an Energy Information Management system showing all the components, connections and networking is presented in the following figure.
Figure 14: Energy information system architecture (Courtesy: Schneider Electric)

20
Energy Efficiency in the Lebanese Industrial Sector
Depending on the nature of the facility and the level of details required, the metering system covers a hierarchy of information related to energy use with levels such as the following:
i. Plant Level: Information is derived from the main distribution panels including both the utility (EDL) and generators consumption. ii. Plant Department Level: Information is taken in comparative energy consumption data for a group of electrical loads combined into processes or departments that could also be ultimately correlated with plant use and production data.
iii. System Level: Performance data is determined from sub-metering data, subjected to regression analysis against key independent variables. Examples are boiler plants, compressed air systems or refrigeration plants.
iv. Equipment Level: Information can be derived from nameplate data, run-time and schedule information, and sub-metered data on specific energy consuming equipment such as a chiller, for instance, or an individual large air compressor.
Ultimately, a plant will need to build a metering and targeting program whereby its detailed metering practices are benchmarked to specific targets that are set based on the planned energy efficiency improvements.
The chart below is an example of a chart that showcases various parameters. The important point to be noted here is that all of these data are useful since they can all be processed to yield information about facility performance.
The Enterprise Energy Management system runs 24 hours a day, 7 days a week, monitoring energy assets and infrastructure, and tracking costs by building, tenant or Process.
Enterprise Energy Management is a key element of a comprehensive strategic energy management process that enables and sustains opportunities for increased profitability, maximized property values, and offers you uptime guarantees.
Using a standard web browser, the EEM system instantly translates energy usage into financial data and key performance indicators, and analyzes:
• Utility tariffs• Equipment Operations• Power Quality• Maintenance
Figure 15: Plant’s metering and targeting (The Graph is not zero based and not to scale)

21
Ener
gy E
ffici
ency
in th
e Le
bane
se In
dust
rial S
ecto
r
AdvantagesGoing by the saying “You can’t manage what you don’t measure,” energy monitoring and metering is a vital step towards effective energy management in multi-operation facilities, allowing day-to-day monitoring of the energy performance of processes, machines, operations, and the facility as a whole.
Many manufacturers and facility operators underestimate variable energy costs and how to strategically manage these costs. This underestimation is usually due to the fact that energy costs aren’t tracked to specific manufacturing lines, equipment, or products (e.g., which line consumes more energy, and why?).
As operators gain insights into their energy usage, they get a clearer idea about where and why energy is consumed, and eventually on how effective this consumption is. However, that knowledge can only be gained through close monitoring of the energy usage at specific locations within the facility, and assessing the reason why this amount of energy is used at that location (i.e., what is the energy draw related to specific products). Measurements also help realize how energy-improvement efforts impact consumption by product, line, or machinery.
It’s a major step forward for a facility to recognize plant-level energy consumption, and the way changing combinations of products, lines, and machines can boost plant performance and profitability. A dedicated energy strategy can drive a facility to achieve aggressive targets — and deliver meaningful bottom-line results.
The Next Level: SCADA SCADA refers to “Supervisory Control and Data Acquisition.” The major aim of a SCADA system is to acquire data from remote devices such as valves, pumps, transmitters, etc. and provide overall remote control through a SCADA Host software platform. This provides process control locally so that these devices turn on and off at the right time, supporting the control strategy and a remote method of capturing data and events (alarms) for monitoring these processes.
SCADA Host platforms also provide functions for graphical displays, alarming, trending and historical storage of data.A SCADA system usually consists of the following subsystems:
• A human–machine interface or HMI: It is the apparatus or device that presents processed data to a human operator, and through this data, the human operator monitors and controls the process.
• A supervisory (computer) system: It gathers (acquires) data on the process and sending commands (control) to the process.
• Remote terminal units (RTUs): It connects to sensors in the process, converts sensor signals to digital data and sends digital data to the supervisory system.
• Programmable logic controller (PLCs): It is used as a field device because it is more economical, versatile, flexible, and configurable than special-purpose RTUs.
• Communication infrastructure: It connects the supervisory system to the remote terminal units.• Various process and analytical instrumentation.

22
Energy Efficiency in the Lebanese Industrial Sector
Typically, a SCADA system will automate much of the control process so that plant operators can focus on other tasks. The system gives the operator flexibility to remotely control the equipment where desired. SCADA systems are also installed to collect and store information for reporting, troubleshooting, maintenance indications, and much more.
There are a number of advantages to having a SCADA system installed:
• Ability to significantly reduce operating costs and to improve the efficiency of the plants’ assets, while improving system performance and reliability. SCADA systems are equipped to make immediate corrections in the operational system, so they can increase the life-period of equipment and save on the need for costly repairs.
• Costly after-hours alarm call-outs can often be avoided since a SCADA system would indicate the nature and degree of a problem.
• Since data is continuously recorded, operators do not have to manually read and record meter readings on a daily basis.
• Operators do not have to keep track of hundreds of log sheets since data recorded on the SCADA system can be downloaded and accessed at their convenience.
• SCADA systems can often be accessed remotely through an internet connection on a computer or laptop, and even a cell phone or a tablet.
• The auto-generated reporting system ensures compliance with regulatory principles and tracking KPIs.
• Most mid- to large-scale industries can benefit from a SCADA system, which could also have a fully integrated energy metering, and dashboard system as covered in the previous section.
Figure 16: SCADA Screen Snapshot

23
Ener
gy E
ffici
ency
in th
e Le
bane
se In
dust
rial S
ecto
r
Financial AnalysisSignificant savings can result from proactively aggregating, monitoring, and analyzing energy data. New and improved software and technologies are available to accomplish this goal.
For example, energy meters provide an enormous wealth of energy data. But since the vast majority of these meters do not communicate together, most of this data is lost. An easy way to fix this loss is to establish a communication and visualization system to link these meters, using existing Ethernet and routers to bring this data to the forefront via an energy management dashboard that allows the user to see where energy is being used, where it’s being wasted, and where efficiency needs to be improved, remotely.
A proper energy management and monitoring system could save 5% going up to more than 30%, depending on the current situation of the facility and the operational profile. Enterprise Energy Management systems were proposed at three of the audited facilities, and reported to be able to achieve an energy cost reduction of 32.8%. The cost of such a system ranges between $10,000 and $20,000 for a typical facility of this size.
Several indicators are used to estimate the impact of this measure. These indicators include:
• Equipment kWh/ton: Defined as the energy required when the optimum amount of equipment is operating at design efficiency.
• System kWh/ton: Defined as the energy required when the operator and machine influences are included – this sytem takes into account operational techniques and maintenance practices.
• Actual kWh/ton: Energy use, taking into account any responses of the operators and supervisors to variations and external influences and the time lag in responding.
• The return on investment of an energy management and monitoring system would vary based on the complexity of the system and the effectiveness of systems in place. The payback period would range between one and three years.
Why look back?
The energy used by any industry varies with production processes, volumes, and inputs. Determining the relationship of energy use to key performance indicators will allow manufacturers to determine:
• Whether their current energy use is better or worse than before;• Trends in energy consumption that reflect seasonal, weekly, and other operating
patterns;• How much their future energy use is likely to vary if they change aspects of their
business; • Specific areas of wasted energy;• Comparisons with other businesses with similar characteristics. This
“benchmarking” process will provide valuable indications of the effectiveness of the operations as well as the energy use;
• How the business reacted to changes in the past;• How to develop performance targets for an energy management program.

24
Energy Efficiency in the Lebanese Industrial Sector
Peak Hours Management
IntroductionPeak hour management is a methodology used by the facility owner allowing the switch from one source of energy to another based on the spot cost of electricity. This includes switching from EDL to generator and vice versa based on the cost of diesel and the tariff structure.
Peak hour management also includes load shaving during peak billing hours. EDL has different tariff structures and billing methods, among which what is known as the industrial tariff (aka triple tariff). This normally applies to large institutions that have their own EDL substations. There are approximately three to four hours every day whereby the KWh is charged at a rate of 320 LBP/kWh ($0.2133), known as peak tariff. The time changes from winter to summer.
Table 5: EDL industrial tariff
ApplicationEvery plant should calculate the average cost per KWh of running the generators, either through written datasheets or through metering, if available.
Accordingly, if the average cost per KWh is found to be lower than $0.21, then operating on the onsite power plant becomes viable. As the cost of diesel drops, the related cost per KWh drops as well and the savings from running generators at peak hours increase.
The chart below shows an example depicting the relationship between the fuel consumed by a 630 KVA engine at 60% load across various diesel costs.
Period Tariff (LBP) Summer (from April 1 till September 30)
Winter(from October 1 till March 30)
Night 80 00:00 – 07:00 00:00 – 07:00Day 112 07:00 – 18:30 07:00 – 16:30Peak 320 18:30 – 21:30 16:30 – 20:30 Day 112 21:30 – 23:00 20:30 – 23:00
Night 80 23:00 – 24:00 23:00 – 24:00
Figure 17: Variation of the generators kWh cost related to diesel cost

25
Ener
gy E
ffici
ency
in th
e Le
bane
se In
dust
rial S
ecto
r
In this example, the generators’ KWh cost of $0.2133, which is leveled with the EDL peak tariff, is reached when the diesel cost is $14.23 per 20 liters (21,350 LBP). A 10% average charge is added to the diesel cost per KWh in order to cover the maintenance and depreciation charges of the generators.
AdvantagesProperly managing peak hour operation and keeping track of energy generation cost from different sources allows end users to optimize energy costs and always switch to the cheapest source of energy.
Financial AnalysisEnergy saving is directly related to the applied hours of load shift, with dependence on diesel prices and generators’ efficiency.The latter is the only factor that varies from one facility to another depending on the situation of the generators, their performance, and their age.
In the example mentioned above, at the current diesel price of around $8/20 liters, the cost per kWh for generator electricity is $0.1145, compared to $0.2133 for EDL peak hours. This difference leads to a saving of around $0.1 per kWh. If implemented over a period of one year, assuming the diesel price remains constant, and assuming an average hourly consumption of 275 kWh, the savings would reach $351,351 per year.
In one of the selected sites, the cost saving was reported to reach 1.81% of the total electricity bill.Billing details for industrial tariff facilities are clearly presented in the EDL bill delivered by the end of the billing period. Details provide a split of electricity consumed at each tariff period, showing the kWh consumed during day, night, and shift periods, with the respective fees.
This display gives facility operators the ability to monitor peak period electricity consumption on a monthly basis, and therefore helps keep track of the peak time management action should it be implemented.With no investment needed for this action, the measure pays back immediately.
Task rescheduling – Night Shift Operation
Compared to other institutional tariff systems, the industrial night tariff is considered the lowest kWh rate billed by EDL, at only 80LBP/kWh, equivalent to $0.05. This “night tariff” is very attractive in terms of energy cost and any process or night shift that can make use of these eight hours will provide direct cost savings for the industry.
In a plant where industrial processes are independent of each other, it may be possible to schedule some tasks or processes to a different shift, away from the more expensive electrical time of day. These can include pre-cooling or any preparation.

26
Energy Efficiency in the Lebanese Industrial Sector
Summary of Monitoring and Energy Management EEMs
CATEGORY EEM DESCRIPTION INVESTMENT (RANGE)
SAVING (%) ON2 PBP
(YRS)
MONITORING & ENERGY
MANAGEMENT
Energy Metering &
Control
Energy monitoring system for optimized energy
utilization (Enterprise energy management, SCADA, etc...)
$10,000 – $50,000+
5% – 35% EN 2
Peak Hours Management
Load shifts and energy generation source
optimization based on fuel prices and tariff structure
applied at the facility
$0 1% EE 0
2 EN: Total Energy; EL: Electrical Energy; TH: Thermal Energy

27
Ener
gy E
ffici
ency
in th
e Le
bane
se In
dust
rial S
ecto
r
Compressed Air System
System Optimization
IntroductionCompressed air is sometimes regarded as the fourth utility after electricity, water and gas; however, it is usually an expensive resource for a business. Producing compressed air requires more than 10 units of electrical power to provide 1 equivalent unit of compressed air. This ratio means that a small decrease in compressed air usage can result in significant electricity savings. The key components of a compressed air plant are seen in the figure below.
Although air is free, the generation and distribution of compressed air is expensive and requires a huge amount of energy. Compressed air is an inefficient medium where around 85% of the electrical energy used to produce it is converted into heat and only the remainder is converted into pneumatic energy.
Application Electrical costs generally account for about 75% of the total costs of a compressed air system; the remaining 25% is accounted for by capital expenditure and maintenance costs.
While the pure efficiency of a compressed air production system is 10%, the total compressed air infrastructure in a plant will typically have a net efficiency closer to 6.5%, which can be seen below in the energy flow diagram.
Figure 18: Typical compressed air system components and network
Figure 19: Compressed air system and network energy flow diagram

28
Energy Efficiency in the Lebanese Industrial Sector
In the above energy flow, the set of losses occur in the following sections and parts:
• Motor Losses – Heat created due to conversion from electric to mechanical power• Compressor Losses – Thermodynamic inefficiencies of the particular compressor• Heat rejected from air cooler• Losses in treatment – including oil separation, filtration and drying• Distribution system pressure drops – Losses related to pressure drops due to elbows,
connections and piping• Distribution system leaks – Losses due to leaks across all the system from the production
point to the end user one• End-use pressure drops for low pressure use – Losses introduced by Pressure Reducing
Valves at end use points
In order to improve the performance of the compressed air system, the facility operator should follow a phased approach as follows:
1. Maintenance Practices
Ensure maintenance is done according to the highest standard.During plant maintenance, it is recommended to perform a comprehensive leakage analysis. There are a multitude of methodologies to uncover leakages. An efficient and thorough leakage analysis would necessitate an ultrasonic detector be put in place.
Once the leakages are uncovered and treated promptly and maintenance is done on all package parts, it is advised to perform adequate monitoring of the total air and pressure demand on the end use equipment from one side and on the compressed air packages on the other side. At that level, it would be important to uncover the ranking of the air compressor per efficiency (kWh/m3) and then build a cascade control system taking into account the findings and placing the most efficient compressors in the lead.
2. Determine compressed air needs
• Check if compressed air is needed for every current end use, and if it can be replaced by another energy form such as simple blowers or cooling.
• Undertake a full inventory of the whole compressed air system in terms of:- Flow requirement (cfm) - Pressure requirement- Quality (temperature, moisture content, oil content, etc.)- Point(s) in the distribution system
• Undertake a compressed air utilization mapping in terms of end-uses and time of use• Analyze plant’s growth in compressed air usage with plant management in order to
validate if the growth is coming from additional needs or from leaks.
3. Implement low cost/no cost measures
• Implement an awareness program for compressed air management across the plant• Eliminate compressed air leaks (discussed further in a separate section)• Eliminate unnecessary uses• Minimize compressed air production’s pressure as much as possible (discussed further
in a separate section)

29
Ener
gy E
ffici
ency
in th
e Le
bane
se In
dust
rial S
ecto
r
• Minimize/Avoid pressure reduction at point of end-use. Alternatively, segregate large low-pressure uses and provide dedicated low pressure supply – Either a dedicated compressed air unit or high pressure blowers
• Segregate end-uses based on the appropriate quality requirement (temperature, moisture and oil content, etc...)
• Ensure that controls for treatment (drying) are not set lower than required• Inspect and ensure that the demand for air is matched by the appropriate online
compressor capacity (if not VFD driven).• Implement compressors’ sequencing strategy to ensure that unit with best capacity
control follows the load. • Ensure that idling compressors shut down promptly.• Ensure that inlet air temperature is as cool and dry as possible use outside air during
cold seasons.• Ensure that inlet filters are clean with minimal pressure drop.• Ensure that filtration and treatment equipment impose minimal pressure drop.• Ensure that line sizing is appropriate to flows to minimize pressure drop.• Ensure good piping practices to avoid excessive pressure drops at T connections,
elbows, unions and other fittings.
4. Implement measures with mid/larger investments
• Implement a comprehensive compressed air plant’s management system including metering and control of all key parameters and sections
• Install waste heat recovery systems on current air-cooled or water-cooled air compressors• Retrofit old compressors by new VFD driven ones and potentially with integrated heat recovery
AdvantagesCompressed air systems provide substantial energy efficiency improvements and the key process is to perform a comprehensive existing energy use assessment at every part of the related infrastructure.
Improving the compressed air system would not only reduce energy consumption at the facility, but it will also eliminate the need for larger air compressors in case of demand increase.
Financial AnalysisDepending on the compressed air system in place, its applications, and mode of use, the energy savings for system optimization could reach up to 10% of compressed air energy consumption. The payback period is in less than a year in most situations.
Leakage Prevention
IntroductionIn most installations there are some degrees of leakages that represent a pure loss and must therefore be minimized. Frequently, leakage can amount to 10-15% of the produced compressed air flow.
ApplicationTypically, leaks can be detected by one of the below methods:
1. Listening – Best done at nighttime or when production is stopped. Make sure the compressor is running normally, walk around the facility’s compressed air infrastructure from the production section to the end-uses section and detect leakages by listening to the noises (typically hissing noise).

30
Energy Efficiency in the Lebanese Industrial Sector
2. Using Ultrasonic leak detection equipment that will allow the detection of compressed air leaks effectively, even in a noisy environment.
AdvantagesProactive leak detection and repair can reduce leaks to less than 10% of compressor output. In addition to being a source of wasted energy, leaks can also contribute to other operating losses and is a cause of a drop in system pressure.
Financial AnalysisLowering the pressure by only 0.3 bar reduces leakage by 4%. If the leakage in a 100 m3/min installation is 12% and the pressure is reduced by 0.3 bar, this represents a saving of approximately 3 kW.
Investment needed for this measure is minimal, while the impact it leaves is huge. Savings could reach more than 5% of the air compressor energy consumption, paying back the invested money in a month or two.
Figure 20: Effect of leakage on power consumption at a system pressure of 7 bar(e).
Calculation Compressed Air Leakage
Calculating and quantifying leaks can easily be done on air compressors that use start/stop controls. This method involves starting the compressor when there are no demands on the system (when all the air-operated end-use equipment is turned off). A number of measurements are taken to determine the average time it takes to load and unload the compressor. The compressor will load and unload because the air leaks will cause the compressor to cycle on and off as the pressure drops from air escaping through the leaks.
Total leakage (percentage) can be calculated as follows:
Leakage (%) = [ (T x 100) / (T + t) ]
Where: T = on - load time (minutes)t = off - load time (minutes)
Leakage is expressed in percentage of compressor capacity loss. Conventionally, it is considered that the percentage lost due to leakage should be less than 10% to consider the system a well-maintained one. In contrast, poorly maintained systems can have losses as high as 20-30%.
*Source: DOE 1998

31
Ener
gy E
ffici
ency
in th
e Le
bane
se In
dust
rial S
ecto
r
Temperature Optimization
IntroductionAir compressors’ location and the relative quality of air drawn have a major impact on the quantity of energy consumed. The performance improves if the dry air at the compressor intake is cooler and cleaner to a certain extent.
As a matter of fact, the reduction of the inlet air temperature goes to reducing the amount of energy needed for the compressor to process. Often, it is possible to reduce the inlet air temperature by taking suction from exterior air outside the building.
ApplicationIndoor air compressors are normally surrounded by high temperature air, resulting from the operation of the air compressor itself. The surrounding air is where the air compressor usually withdraws its inlet air.
Changing the location of the air compressor or just the inlet air source would reduce the energy needed by the air compressor to achieve the required conditions. This change could include the installation of an extension pipe through which inlet air is brought in from the outdoor environment to the air compressor.
AdvantagesWhen considering locating or relocating air compressors, there are two key parameters to look for:
1. Optimize Cool air intake: As a rule of thumb “Every 4°C rise in inlet air temperature results in higher energy consumption by 1% to achieve equivalent output (Rabadia 2015).” Hence, cool air intake leads to a more efficient compression.
Table 6: Effect of intake air temperature on the air compressor consumption (Rabadia 2015)
2. Ensure dust free air intake: Dust in suction air causes excessive wear of moving parts and results in malfunctioning of the valves due to abrasion. Suitable air filters should be provided at the suction side. Air filters should have a high dust separation capacity, low-pressure drops and robust design to avoid frequent cleaning and replacement.
Inlet Temperature (°C) Relative Air Delivery (%) Power Saved (%)
10 102 1.415.5 100 021.1 98.1 -1.326.6 96.3 -2.532.2 94.1 -437.7 92.8 -543.3 91.2 -5.8

32
Energy Efficiency in the Lebanese Industrial Sector
Table 7: Air inlet filter pressure drop and air compressor consumption (Rabadia 2015)
Air filters should be selected based on the compressor type and installed as close to the compressor as possible. As a rule of thumb “For every 250 mm WC improvement in pressure drop values across the suction path due to choked filters etc., the compressor power consumption increases by about 2% for the same output (Rabadia 2015).” Hence, it is advisable to clean inlet air filters at regular intervals to minimize pressure drops.
It is also very important to ensure the ventilation of the room is adequately designed and installed.
Financial AnalysisRelocating the air compressor costs close to nil and adding an inlet pipe extension requires a minimal investment, but these could both lead to a saving of 1% to 3% of compressed air cost, with an immediate or a very short payback period.Relocating the air compressor in one of the industries of this case study led to a reduction of 0.09% of the facility’s total electricity consumption.
Pressure Reduction
IntroductionThe higher the compressed air pressure need, the more energy is drawn. However, it is not always possible to modify compression pressure.
Despite this adverse economic effect, increasing compressor pressure is a commonly used method for overcoming pressure drops caused by an under-dimensioned piping system or clogged filters.
In an installation fitted with several filters, especially if they have been operational for a long period of time without being replaced, the pressure drop can be significantly higher and therefore very costly if unattended for long periods of time.
Pressure reduction could be applied on two locations, the first is the point of usage and the second is at the air compressor.
Pressure drop across air filter
(mm WC3)
Increase in power consumption
(%)
0 0
200 1.6
400 3.2
600 4.7
800 7.0
3 mm water Column

33
Ener
gy E
ffici
ency
in th
e Le
bane
se In
dust
rial S
ecto
r
ApplicationReducing compressed air pressure can only be done after performing a detailed analysis of the system requirements and pressure needs at the facility.
Making sure all leakages are mitigated, pressure reduction can be performed at the following levels:
1. At point of usage A large number of plants use a single common compressed air distribution system to supply their end-use applications. In this case, the whole system is designed to maintain a pressure that is high enough to satisfy the equipment requiring the highest pressure (regardless if the majority of the equipment might require a much lower pressure).
A higher pressure than required would cause unregulated compressed air equipment in the plant to use a higher amount of air. This also increases the power required by the air compressor by 1% for every 0.14 bar in higher pressure.
Usually, most equipment may operate at a lower pressure than the one used in the identification of new equipment requiring compressed air. It is possible to operate a lower required pressure: minimizing the system pressure requirements in general. It is usually also possible to replace existing equipment for lower pressure operation by replacing non-optimal components.
Once retrofits are done on existing equipment, it is often possible to reduce the main air supply pressure to determine the minimum pressure where the equipment will operate efficiently.
For equipment that can’t be optimized, it is possible to segregate equipment into a separate system, so that most of the compressed air system can be operated at a lower pressure.
The portion requiring higher pressure could then be supplied by a dedicated- compressor air system, or by a booster compressor drawing air from the lower pressure system.
The accuracy of the minimum desired pressure at the point of use should be maintained. Fluctuating system pressure can cause production quality problems such as torque variations of tools and inconsistent paint spray.
Pressures that are higher than necessary can be caused by compressor control problems and can boost end-use air flows by causing artificial demand. Artificial demand occurs because unregulated end-uses use more air at higher pressure.
2. At the air compressorsReal savings will not be realized unless the discharge pressure at the compressors can be reduced.A common rule of thumb for a typical compressed air system is: the energy requirement of the compressors is reduced by 1% for every 0.14 bar decrease in system pressure. In some cases, due to undersized piping, some of these savings may be lost due to increased velocity at the lower pressure, through dryers, filters, and piping.
Some air compressors have to be procured with a pressure rating substantially higher than required at the points of use. Running the compressors at an elevated pressure may compensate for pressure drop across filters and dryers and negate any restriction in the distribution piping and valves; but to save energy the control pressure set points and their operating band should be set as low as is considered practical, not to the maximum allowable.

34
Energy Efficiency in the Lebanese Industrial Sector
The pressure drop across individual components and sections of the distribution system should be measured to determine if they are within acceptable limits. These pressure drops force higher compressor discharge pressures to compensate. Corrective action should be taken where indicated. This corrective action may include changing types or sizes of pipes, valves, dryers or filters. The pressure drop from the compressor discharge to the points of use should not exceed 10% of the compressor discharge pressure.
AdvantagesThe working pressure directly affects the power requirement. Higher pressure signifies higher energy consumption: on average 8% more power for 1 bar higher pressure. Increasing the working pressure to compensate for a pressure drop always results in impaired operating economy.
In many installations, it is not possible to implement large pressure reductions, but the use of modern regulation equipment allows the pressure to be realistically lowered by 0.5 bar. This drop leads to a small percentage of power savings.
This drop may seem insignificant, but considering that the total efficiency of the installation is increased by an equivalent degree, the value of this pressure reduction in terms of actual savings is more readily obvious.
Financial AnalysisThe figure below shows that excess power requirement is a result of over-pressurizing to compensate for pressure drops. For a 300 l/s compressor, raising the working pressure by 1 bar means 6 kW higher power consumption. At 4,000 operating hours/year this represents 24,000 kWh/year or $2,880/year (at an average of $0.12/Kwh)
Figure 21: Relation between excess pressure and excess power
Pressure optimization is a low or no cost measure that leads to immediate savings with an immediate or an extremely short payback period.

35
Ener
gy E
ffici
ency
in th
e Le
bane
se In
dust
rial S
ecto
r
Rules of Thumb
RELATING DISCHARGE PRESSURE TO ENERGY CONSUMPTIONFor systems in the 6.89 bars range, for every 0.14 bar increase in discharge pressure, energy consumption will increase by approximately 1% at full output flow (check performance curves for centrifugal and two-stage lubricant-injected rotary screw compressors).
There is also another penalty for higher-than-needed pressure. Raising the compressor discharge pressure increases the demand of every unregulated usage, including leaks and open blowing. Although it varies by plant, unregulated usage is commonly as high as 30-50% of air demand. For systems in the 6.89 bars range with 30-50% unregulated usage, a 0.14 bar increase in header pressure will increase energy consumption by about another 0.6-1.0% because of the additional unregulated air being consumed (in the worst-case scenario, the extra flow could cause another compressor to start).
The combined effect results in a total increase in energy consumption of about 1.6-2% for every 0.14 bar increase in discharge pressure for a system in the 6.89 bars range with 30-50% unregulated usage.
*Source: Planet Services 2015
Air Compressors with VFD
When there are strong variations in load and/or ambient temperatures there will be large swings in compressor load and efficiency. In these cases, installing a VFD (Variable Frequency Drive) or retrofitting one of the existing air compressors unit with a VFD driven one may result in attractive payback periods.
VFDs can be used to control the operation of positive displacement air compressors, such as a rotary screw and reciprocating machines. These present a constant torque load and VFDs become viable when the average loading is around 75% of capacity or less. The actual level of savings is dependent on the control regime of the compressor plant; for example, in a compressor operating at 50% capacity, energy savings would be 38% compared with modulating control and 20% compared with ON-OFF only control.
Some existing compressors are not compatible with VFD controls and could be damaged if retrofitted with VFD control; the compressor manufacturer should always be consulted when considering retrofitting VFDs.
Dynamic (centrifugal) compressors use a rotating disk or impeller in shaped housing to force the gas to the rim of the impeller, increasing the velocity of the gas. The most common way to control the capacity of centrifugal compressors is to modulate inlet guide vanes; however, it is less efficient at part load. VFDs can be used to successfully control their output with greater efficiency.

36
Energy Efficiency in the Lebanese Industrial Sector
Summary of Compressed Air EEMs
CATEGORY EEM DESCRIPTION INVESTMENT (RANGE)
SAVING (%) ON4 PBP
(YRS)
COMPRESSED AIR SYSTEM
System Optimization
Following proper maintenance practices, and properly sizing the system. In addition to implementing
of good housekeeping measures
$0 – $10,000 Up to 10% EE <2
Leakage Prevention
Avoiding leakages and treatment of damaged
pipes, accessories, elbows, and other leaking items that lead to wasting
compressed air
$0 – $5,000 Up to 5% EE <1
Temperature Optimization
Relocating the air compressor or installing a
piping extension that allows the inlet of outdoor air to the
air compressor
$0 – $500 1% – 3% EE <1
Pressure Reduction
Reduction of set pressure to the lowest possible value.
Could be applied at the point of usage or at the air
compressor point
$0 1% – 3% EE 0
4 EN: Total Energy; EL: Electrical Energy; TH: Thermal Energy

37
Ener
gy E
ffici
ency
in th
e Le
bane
se In
dust
rial S
ecto
r
Steam System
Steam systems account for a large share of the total energy used in large-scale applications, especially industrial. Looking back at the case studies presented in this report, the industrial facilities had thermal energy shares in excess of 40% and up to 75% of the total energy costs. These systems can be indispensable in delivering the energy needed for process heating, pressure control, mechanical drives, separation of components, and production of hot water for process reactions.
Combustion processes in equipment such as boilers depend primarily on the effective mix of fuel and air in a well-calculated ratio of amounts to ensure a complete combustion and an adequate heat transfer area to get the heat from the hot products of combustion to the process fluids. Steam systems as depicted below include the generation units (steam boilers), distribution components, and end-use equipment and recovery components.
When steam systems are more efficient, the energy bill could be reduced substantially along with reducing the related environmental emissions. According to the U.S. Department of Energy, a typical industrial facility that conducts a steam system assessment will identify potential steam system energy use and cost savings that range from 10% to 15% per year.
Considering the large share of thermal energy in many industrial sites, as confirmed by CEDRO’s energy audits, the savings potential would have a substantial impact on their financial and environmental performance.
Identifying Energy Saving Opportunities
In analyzing the opportunities for improving the energy efficiency of steam systems, a systems’ approach in which both steam demand (i.e., end-uses) and steam supply systems are optimized, is essential.
In addition, while boilers are typically rated for a particular maximum or predetermined thermal output, a boiler commonly operates for most of its life at some fraction of that output, or at partial load. The efficiency of a boiler varies significantly with load. Consequently, it is important to evaluate boiler plant performance and efficiency over the range of actual or partial loads that the boiler experiences.
Figure 22: Typical steam network with recovery

38
Energy Efficiency in the Lebanese Industrial Sector
Energy savings in steam systems can be realized in every section of the installations, which can be seen below in the summary tables:
At Generation LevelThe boiler energy efficiency measures presented below focus primarily on improved process control, reduced heat loss, and improved heat recovery. In addition to the measures below, it is important to note that when new boiler systems are needed, ideally, they should be designed and installed in a custom configuration that meets the needs of a particular plant.
Efficiency Measure Impact Description
Improve combustion efficiency & minimize excess air
Reduces the amount of heat lost up the stack, allowing more of the fuel energy to be transferred to the steam
Clean boiler heat transfer surface
Ensures effective heat transfer from the combustion gases to the steam
Maintain high feedwater temperature High Feedwater temperature drives out dissolved oxygen
Size feedwater tank correctly
As a rule of thumb, feedwater tank should be sized to be 1.5 times the peak steam demand
Avoid oversizing the boiler Oversizing leads to frequent On-Off cycles in a boiler which lowers boiler efficiency
Monitor boiler parameters Continuous monitoring of boiler parameters for optimized boiler efficiency
Burner retrofit Typically, after 10 to 15 years of service, a burner loses effectiveness and sees its efficiency plummets
Optimize condensate recovery
Recovers thermal energy in the condensate and reduces amount of make-up water, thus saving energy and chemical treatment
Use high-pressure condensate to make low pressure steam
Exploits the available energy in the returning condensate
Install heat recovery equipment (feedwater economizers/combustion air preheaters, blowdown heat recovery)
Recovers available heat and transfers it back to the system by preheating feedwater or combustion air.Similarly apart from controlling blowdown, heat can be recovered from blowdown

39
Ener
gy E
ffici
ency
in th
e Le
bane
se In
dust
rial S
ecto
r
At Distribution LevelEnergy efficiency improvements to steam distribution systems are primarily focused on reducing heat losses throughout the system and recovering useful heat from the system wherever feasible. The following measures are some of the most significant opportunities for saving energy in industrial steam distribution systems.
At Process/End-Use Equipment
Efficiency Measure Impact Description
Eliminate air from steam systems
Eliminate air from steam systems to ensure effective heating and thus fuel savings
Adequate drainage of steam lines To remove condensate for effective heat transfer, avoid water hammer
Insulate steam and condensate return piping
Uninsulated steam distribution and condensate return lines are constant source of wasted energy.
Repair steam leaks Stop waste, increase savings
Implement effective steam – trap maintenance program
Reduces passage of live steam into condensate system &promotes efficient operation of end-use heat transfer equipment
Isolate steam from unused lines Minimize avoidable loss of steam due to radiation and leaks
Efficiency Measure Impact Description
Use steam at lower pressures Using steam at the lowest possible pressure for indirect heat exchange reduces the steam required
Precise temperature control Temperature overshoots lead to excess steam consumption
Insulate all process tanks Reduce the energy loss through tank surfaces
Ensuring quiet operation of steam injector Control noise level produced by steam injector
Drying CylindersVenting air through drying cylinders can reduce steam consumption. Converting group steam trapping to individual trapping
Heat Exchanger efficiency Proper condensate removal system & flow control of steam based on parameters such as temperature, etc.
Increasing heat transfer in coil type heat exchange Heat emission rate can be increase by forced convection
Steam load balancing Steam load can be balanced by either shutting of steam to non-critical applications or the use of steam accumulator
Auditing of streamline accessories
Regular energy auditing of streamline accessories will provide aid in taking corrective action in order to minimize steam consumption
Correct positioning of steam & condensate connections
Correct positioning of steam inlet and condensate outlet will ensure efficiency of all process equipment

40
Energy Efficiency in the Lebanese Industrial Sector
Combustion Efficiency Improvement
IntroductionIn practice combustion efficiency is thought of as the total energy contained per liters of fuel minus the energy carried away by the hot flue gases exiting through the stack.
While combustion efficiency is only one variable in the overall boiler efficiency calculation, it is the one that provides the most effective way to reduce wasted fuel.
There are two main measures whereby a boiler’s combustion efficiency is improved: The first is air-to-fuel ratio adjustment, and the second is oxygen trimming. Both contribute to remarkable improvement in combustion efficiency and, consequently, reduction in fuel consumption per energy production unit.
Application
1. Air/Fuel adjustmentIn a combustion process, the combustion chamber is supplied with excess air, which increases the amount of oxygen to the combustion. When fuel and oxygen from the air are in perfect balance, the combustion is said to be stoichiometric, indicating optimal combustion air fuel ratio.
There are two ways of optimizing the fuel:air ratio: The first is through manual boiler tune-up, while the second is through the installation of integrated combustion automation.
i. Manual Tune Up A good tune up using precision test equipment can detect and correct excess air losses, smoking unburned fuel losses, fire side fouling, and high stack temperature.
By using real time instruments to measure flue gas oxygen, carbon monoxide, carbon dioxide, combustibles and temperatures, the current state of boiler operation can be diagnosed. These findings can be used to restore the boiler in its normal efficiency operating condition. This allows the control system and burner to be adjusted and repaired for optimum performance with immediate feedback on results.
Figure 23: Optimal excess air zone in a combustion process

41
Ener
gy E
ffici
ency
in th
e Le
bane
se In
dust
rial S
ecto
r
When a tune up is completed, there should be a good record of a boiler’s excess air and efficiently across the load range for managing boiler operations.
Periodic check-ups should often be done where boiler efficiency would fall by over 5% within approximately six months.
ii. Integrated burner controller It is a microprocessor-based flame safeguard and it is has a parallel positioning combustion control built into the package. The flame safeguard portion of the control provides the proper burner sequencing, ignition timing, and flame monitoring protection on automatically ignited oil, gas, and combination fuel burners using infra-red, ultra-violet, or ultra-violet self-checking scanners.
Typically, a control of up to four channels (2 air, 2 fuel) using independent servo-motors allows precise positioning, accurate to 0.1°. The controller provides two fuel profiles per channel, with up to 24 positions per profile. The servo-motors position and speed are checked via feedback potentiometers to verify proper operation.
From the controller, position signals are issued to the air and oil servo motors to obtain the desired firing rate with optimum firing efficiency all along the modulation curve, which induces the significant savings on fuel consumption. The savings achieved can exceed 10%.
2. Oxygen TrimCombustion requires an optimized volume of oxygen for the best performance. Too much or too little air quantity can cause undesirable results; the first leads to poor efficiency, while the second results in carbon monoxide formation.When burners are manually tuned on a periodic basis, they are typically adjusted to about 3% excess oxygen, which corresponds to about 15% excess air. From an efficiency point of view, the excess oxygen means there is more air in the combustion stream than there needs to be. That air also contains moisture, which is heated and then lost up the stack. The amount of excess oxygen is directly proportional to the efficiency lost. In other words, 3% excess is equivalent to a 3% efficiency drop.
Figure 24: Continuous & portable flue gas and emission analyzers

42
Energy Efficiency in the Lebanese Industrial Sector
Figure 25: Relationship of CO in flue gas and oxygen level
Figure 26: Hays Cleveland’s O2 trim system installed on two boilers
While one can monitor and adjust the burner on a daily basis, manual monitoring is not a practical solution, and the alternative is to install an Oxygen Trim System.
The following figure shows an Oxygen Trim System installed in Cleveland with an additional SCADA system included in the common control cabinet.
AdvantagesThe importance of excess air is, therefore, clear, making it extremely undesirable to operate a burner with less than stoichiometric combustion air. Not only is this likely to result in the release of smoke, but it will significantly reduce the energy released by the fuel.
If a burner is operated with a deficiency of air, carbon monoxide and hydrogen will appear in the products of combustion as a result of incomplete combustion. Anything more than a few hundred parts per million of combustibles in the flue gas indicates inefficient burner operation.
An Oxygen Trim System continuously monitors the flue gas and adjusts the burner air supply. It includes an electronic sensor, which is normally inserted into the boiler flue, near the boiler, ahead of dampers or other sources of air leakage into the boiler or flue. This sensor is connected to a control panel that measures oxygen and sends a signal to a control damper on the burner air supply.

43
Ener
gy E
ffici
ency
in th
e Le
bane
se In
dust
rial S
ecto
r
Financial AnalysisCombustion efficiency improvement could lead to reduced fuel consumption for the same energy produced, leading to a reduction in thermal energy bills by somewhere between 2% and 5%.
Condensate Return
IntroductionSteam contains two types of energy: latent and sensible. When steam is supplied to a process application (heat exchanger, etc...), the steam vapor releases the latent energy to the process fluid and condenses to a liquid condensate. The condensate retains the sensible energy the steam had and can have as much as 16% of the total energy in the steam vapor. Condensate Recovery Systems are specifically designed equipment to recover condensate from steam installations in order to maximize their overall energy efficiency.
ApplicationUsually, condensate return is one of the highest return on investments where it not only it saves on the fuel consumption, but it also saves on boiler treatment chemicals.While condensate return is an obvious measure, many industrial plants are still wasting it or are still losing part of its thermal energy because of un-insulated tanks, condensate pipes, valves and fittings. The best practice for condensate systems is to insulate any device in the condensate system to prevent such losses.
Condensate Recovery Systems equipment are considered to include the following:
• Condensate Recovery Vessels: These are designed to handle hot condensate, which is commonly returned for use as boiler feed water.
• Steam Traps: These are devices that allow the discharge of condensate without the release of steam from steam lines in a steam and condensate system.
• Deaeration Tanks: These tanks remove oxygen and other dissolved gases from steam boiler feed water to reduce corrosion and improve efficiency in the steam system.
Estimating Savings from O2 Trim
Fuel Savings = 1.0 - (Starting Efficiency / Ending Efficiency)
For Example: 4.5% Excess Oxygen reduced to 2.0%
1.0 - (0.7972 / 0.8308) = 0.04044 = 4.04%
NOTE: Because some boilers operate with a very high percentage of excess oxygen, it is common for the first year savings to be substantially higher. However, much of that savings can be attributed to a more reasonable manual tuning of the boiler, and not necessarily from the installation of an automatic O2 control system. Well-tuned boilers can expect savings of 2 - 4%.
*Source: Boiler Consortium 2014

44
Energy Efficiency in the Lebanese Industrial Sector
Figure 27: Condensate piping connection (Spirac Sarco 2016)
AdvantagesRecycling hot condensate for reuse as boiler feed water is an important way to maintain the efficiency of the system. The energy used to heat cold make-up water is a major part of the heat delivered for use by the steam system.
Financial AnalysisDetailed calculation of condensate recovery at one of the industrial sites showed a potential saving of 8% of the thermal energy consumption at the facility. With an investment of almost $100,000, the system pays back the investment in 2.9 years, saving tremendous amounts of fuel on the facility.
Below is an illustration of the potential savings of a 20,000 kg/hr., 10 bars steam system with no condensate returned to the boiler plant:
Savings Calculation Example
Below is the basic data for the sample calculation, which represents a typical operating steam system.
Average steam flow (kg per hr) 20,000Unloaded fuel cost ($ per MBTU) 15.3Operation (hr/yr) 8,760Operating steam pressure (bars) 10Steam temperature (°C) 186Steam total energy (hg) BTU/kg 2,634.75Make-up water temperature (ºC) 13Make-up water BTU content (hm) BTU/kg 50.71Condensate return temperature (ºC) 100Returned condensate energy (hc) BTU/kg 397.56Benchmark fraction of condensate returned (decimal percent) 0.90

45
Ener
gy E
ffici
ency
in th
e Le
bane
se In
dust
rial S
ecto
r
Figure 28: Boiler blowdown system
To determine potential energy losses per year, based on zero condensate returned to the boiler point, follow the calculation below:
1. (hc – hm) = energy loss per kg of condensate2. (397.56 – 50.71) = 346.85 BTU per kg of condensate3. 20,000 kg of steam = 20,000 lbs. of condensate (90% return) = 18,000 kg4. 18,000 kg x 346.85 BTU per kg = 6,243,200 BTU/hr.5. 6.243 x $ 15.3 = $95.52/hr.6. $95.52 x 8,760 hours per year = $836,737/yr.
The potential savings is based on the energy required to elevate the make-up water to that of the condensate being returned. The calculation does not take into account the savings from chemicals, and water. It also does not consider the effect of bringing condensate back at higher pressures, resulting in greater savings. The above calculation assumes no condensate is being returned to the boiler, but most industrial plants return at least a small percentage of condensate. Each plant should evaluate the cost of failing to return condensate and set forth a roadmap for returning condensate.
Blowdown Steam Recovery
IntroductionAs make-up water is added to the boiler to compensate for the process water losses, the relative amounts of minerals and chemicals increases or accumulates in the boiler drum. For large boilers with long operating hours with considerable make-up water, the minerals can accumulate and completely clog the boiler in a few days. One obvious way to combat this accumulation of minerals is to improve the quality of the incoming water via filtration while removing the remaining minerals through some of the steam energy called blowdown.
Boiler contaminants tend to accumulate at the bottom of the drum (mud) and some float on the top of the water level (scum).When blowdown is a necessary action that needs to be taken, the recovery of steam is a potential measure that would reduce energy loss caused by system blowdown.
ApplicationA bottom blowdown is a method where an amount of steam is used to partially stir up the bottom mud and then a valve on the bottom of the drum is opened and the muddy water is blown out to the drain. Automatic controls can operate these valve systems by monitoring the drum water conductivity.

46
Energy Efficiency in the Lebanese Industrial Sector
Regardless of the method of controlling the top and bottom blowdown, considerable energy is lost down the drain when blowdown occurs. Depending on the local water quality, blowdown can be between 1-10% of the total steam production. This percentage is a significant amount of steam and energy since blowdown is essentially live steam and hot water being sent down the drain.
Recovering heat from blowdown is an effective waste to reduce energy consumption at the facility. As the blowdown steam and water leave the drum, they pass through a heat exchanger to capture some portion of the thermal energy that would otherwise go to waste. This waste heat can be used to preheat the incoming make-up water. This loop is a feedback loop that brings thermal energy back into the boiler system. By raising the make-up water temperature, direct energy savings will occur due to the avoided fuel consumed to raise the water temperature.
Figure 29: Blowdown and heat recovery
AdvantagesRecovering blowdown steam reduces the demand for heating by reclaiming some of the wasted heat as part of this preventive maintenance action.
Recovered energy can be used as a preheating source for make-up water when needed.
Financial AnalysisThe implementation of a blowdown heat recovery system requires minimal investment. This value varies based on technology details and complexities.
In general, such a system could reduce thermal energy consumption by at least 2%, paying back the investment in a matter of a few years.
Thermal Insulation
IntroductionUn-insulated steam distribution and condensate return lines are a constant source of wasted energy. Insulation can typically reduce energy losses by 90% and help ensure proper steam pressure at plant equipment. Any surface over 45°C should be insulated, including:
• steam lines and hot water pipes• condensate return lines and collection vessels• boilers• deaerator• blowdown vessels used for heat recovery• every valve, fitting and controls where practical

47
Ener
gy E
ffici
ency
in th
e Le
bane
se In
dust
rial S
ecto
r
ApplicationGenerally, it is rare to find un-insulated pipes, but it is common to find poorly insulated pipes and vessels. Insulation must be in good condition to be effective. Wet insulation is worse than no insulation.
Insulation used for boilers and pipes offal under these general types:
• high density fiberglass shaped for pipes or flat sections• blankets or bats of fiberglass or mineral wool• molded, fire brick, pre-cast or cast-in-place• spray-on ceramic• spray-on foam (more common in cold applications than hot)
The insulation is generally covered with some sort of metal, plastic, paper, etc., to protect it from light impact damage, UV exposure and moisture.
Figure 30: Example of poor insulation in steam pipes
Figure 31: Fiberglass insulation material and well-insulated steam systems

48
Energy Efficiency in the Lebanese Industrial Sector
Insulation maintenanceInsulation frequently becomes damaged or is removed and never replaced during steam system repair. Damaged or wet insulation should be repaired or immediately replaced to avoid compromising the insulating value. Eliminate sources of moisture prior to insulation replacement. Causes of wet insulation include leaking valves, external pipe leaks, tube leaks, or leaks from adjacent equipment.
It is often found that after heat distribution systems have undergone some form of repair, the insulation is not replaced. In addition, some types of insulation can become brittle or rot over time. As a result, a regular inspection and maintenance system for insulation can also save energy. Implementing an insulation maintenance program has payback periods of less than one year in several industrial plants.
AdvantagesCompared to un-insulated pipes:Each un-insulated bare flange is equivalent to 0.3 meters of un-insulated pipes with the same size.Each un-insulated valve is equivalent to 1.5 meters of un-insulated pipes with the same size.From the length and number of flange and valve, the estimation of heat loss from different pipes can be made using the above table.
Financial AnalysisNetwork efficiency is an important factor in thermal energy consumption, especially pipe insulation, valves and hot surfaces. The heat losses from un-insulated horizontal pipes with ambient temperatures ranging from 10 – 21°C are described in the table below.
Table 8: Heat losses from horizontal pipes with ambient temperature
Temp. Diff.
Steam to Air °C
15mm 20mm 25mm 32mm 40mm 50mm 65mm 80mm 100mm 150mm
W/m56 54 65 79 103 108 132 155 188 233 32467 68 82 100 122 136 168 198 236 296 41078 83 100 122 149 166 203 241 298 360 50089 99 120 146 179 205 246 289 346 434 601100 116 140 169 208 234 285 337 400 501 696111 134 164 198 241 271 334 392 469 598 816125 159 191 233 285 321 394 464 555 698 969139 184 224 272 333 373 458 540 622 815 1133153 210 255 312 382 429 528 623 747 939 1305167 241 292 357 437 489 602 713 838 1093 1492180 274 329 408 494 556 676 808 959 1190 1660194 309 372 461 566 634 758 909 1080 1303 1852
Proper insulation of the steam network and its components has a very rapid payback period estimated to be less than one year in most cases. In MUF site, thermal insulation required an investment of only $800, leading to saving 3% of energy required for steam generation. The payback period was one year.

49
Ener
gy E
ffici
ency
in th
e Le
bane
se In
dust
rial S
ecto
r
Steam traps Management
IntroductionThe purpose of a Steam Trap is to keep steam in the system while removing condensate (water) and air. Air can reduce the heat transfer ability of steam and cause corrosion.
Condensate / Water substantially reduces heat transfer and, consequently, the ability of a steam device to do work. A damaged steam trap allows steam to blow-through along with the condensate; this loss of steam can represent a substantial energy loss.
In fact, failed traps waste fuel, reduce efficiency, increase production costs and compromise the overall integrity of the steam and condensate systems.
A basic component of all industrial energy audits in plants with steam is a stream trap inspection and repair/replacement program.
ApplicationMost traps fail in the open mode. When these trap failures occur at times, a boiler may begin to work harder to produce the necessary energy to perform a task, which, in turn, can create high back pressure to the condensate system. This high back pressure inhibits the discharge capacities of some traps, which may be beyond their rating, and cause a system inefficiency. While most traps operate with back pressure, they do so only at a percentage of their rating, affecting everything down the line of the failed trap. Steam quality and product is affected.
A closed trap produces condensate back-up into the steam space. The equipment will not produce the intended heat. For instance, if there are four coils in a dryer and only three are operating, it will take longer for the dryer to dry a product, which will have a negative effect on production.
Excluding design problems, two of the most common causes of trap failure are oversizing and dirt. Oversizing causes traps to work too hard. In some cases, this overload can result in blowing of live steam. For instance, an inverted bucket trap can lose its prime due to an abrupt change in pressure. This loss will cause the bucket to sink, forcing the valve open.
Dirt is always being created in a steam system. Excessive build-up can cause plugging or prevent a valve from closing. Dirt is generally produced from pipe scale or from over-treating chemicals in a boiler.
When steam traps cause a back-up of condensate in a steam main, the condensate is carried along with the steam. It lowers steam quality and increases the potential for water hammer. Not only will energy be wasted, equipment can be destroyed.
Before testing a steam trap, one should be familiar with the particular function, review typical types of traps and know the various pressures within the system. This knowledge can help avoid misdiagnosis and allow proper interpretation of trap conditions.
There are three main categories of online trap inspection: visual, thermal and acoustic.
1. Visual inspection Visual inspection depends on a release valve situated downstream of certain traps. An inspector opens these valves and looks to see if the trap is discharging condensate or steam. Thermal inspection relies on upstream/downstream temperature variations in a trap. It includes pyrometry, infrared, heat bands (wrapped around a trap, they change color as temperature increases), and heat sticks (which melt at various temperatures).

50
Energy Efficiency in the Lebanese Industrial Sector
Acoustic techniques require an inspector to listen to and detect steam trap operations and malfunction. This method included various forms of listening devices such as doctors’ stethoscopes, screwdrivers, mechanical stethoscopes and ultrasonic detection instruments.
The ideal listening device will allow users to listen to the sounds of steam trap operations while ignoring most ambient pipe sounds. This is where ultrasonic listening devices excel. Since they are sensitive to high frequency (short wave) signals, they tend to ignore most stray pipe signals. Also, they are very directional in their pick-up. For this reason, they will allow users to hear and see on meters the exact operations of steam traps.
2. Ultrasonic detectors They usually have a stethoscope module, which contains an ultrasonic transducer attached to a metal rod that acts as a “wave guide.” The wave guide is touched on the downstream side of a trap to determine trap condition such as mechanical movements or steam and condensate flow. Most ultrasonic detectors amplify the signals and translate them into the audible range where they are heard through headphones or seen as intensity increments on a meter. Some include frequency tuning to allow users to tune into desired trap sounds.
3. Automated Trap MonitoringSteam traps that fail to open cause a loss of performance and energy. However, when steam traps fail to close, they can cause worse problems. Not only will the equipment flood with condensate and stop working, in cold climates during the winter season, the equipment could freeze. Frozen coils and equipment can lead to broken coils and equipment.Steam traps can be monitored “manually” with periodic inspections. However, even an “aggressive” program may only check each trap once or twice per year. Paybacks on failed steam trap replacement are often measured in months. The faster a failed trap is discovered the quicker it can be replaced/repaired. Automated monitoring with instant failure reporting minimizes the discovery time and eliminates the labor required to manually check the traps.
Figure 32: Automated Steam Trap system Example (courtesy: Armstrong)

51
Ener
gy E
ffici
ency
in th
e Le
bane
se In
dust
rial S
ecto
r
Figure 33: Relationship between steam pressure and steam losses
AdvantagesThe graph below shows the relationship between steam pressure and steam losses. As mechanical trap sizes increase, the inherent steam losses from fully open traps do not increase in a linear fashion; they increase logarithmically.
Financial AnalysisSteam traps maintenance is a low cost measure that requires regular inspection and cleaning of steam traps. It is rare that this measure requires additional investment. Savings caused by proper steam trap maintenance could reach as much as 2% of thermal energy consumption.
Steam Leakage Repair
IntroductionSimilar to steam traps, steam distribution piping networks often have leaks that can go undetected without a regular inspection and maintenance program. The U.S. DOE estimates that repairing leaks in an industrial steam distribution system will lead to energy savings of around 5% to 10% (U.S. DOE 2006d). At a Land O’Lakes dairy facility in Tulare, California, the U.S. DOE estimated that natural gas savings of $18,000 per year could be realized by implementing a steam leak maintenance program (U.S. DOE 2005b). Additionally, regular inspection and leak repair can reduce the likelihood of major system leaks, which can be very costly to repair.
ApplicationRepairing leaking components of the steam contribution network can be done by good housekeeping measures and sometimes requires replacing the leaking items in the case where they are damaged.
It is essential to perform regular checkups on the steam network to make sure no steam is being wasted.
AdvantagesSteam leaks have multiple negative effects on steam-based plant operations, including energy losses, increased emissions, and loss of reliability, production issues, and safety.
Leaks in a steam system can contribute to significant energy losses in the plant’s operations. In fact, due to the high cost of these energy losses, the correction of steam leaks offers very lucrative paybacks.

52
Energy Efficiency in the Lebanese Industrial Sector
Figure 34: Steam leakage examples
Figure 35: Steam leakage rate as compared to steam pressure
The figure below shows the steam leakage rate at different steam pressure and different hole sizes.
This measures requires no or low investment, with preventive maintenance playing a major role. Savings are impressive and payback is extremely low, if not immediate.
Financial AnalysisIn the boilers’ room, steam leakages were visually seen from the manifold valves. The table below shows the leakage rate at 8 bar steam pressure for different hole sizes.
Table 9: Steam leak flow at 8 bars (Steam Main 2016)
Hole Size (mm)
Estimated steam leak flow (kg/h)
1 22 103 224 395 606 877 1188 1559 19610 242

53
Ener
gy E
ffici
ency
in th
e Le
bane
se In
dust
rial S
ecto
r
Summary of Steam System EEMs
CATEGORY EEM DESCRIPTION INVESTMENT (RANGE)
SAVING (%) ON5 PBP
(YRS)
STEAM SYSTEM
Combustion Optimization
Optimizing combustion efficiency by fuel to air
ratio control and oxygen trimming, avoiding
losses and reducing fuel consumption
$500 – $10,000 2% – 5% TH <3
Condensate Return
Through a condensate recovery system that recovers condensate
from steam installations in order to maximize their overall energy efficiency
~ $100,000 3% –10 % TH 3
Blowdown Steam
Recovery
Recovering energy from blowdown steam and
reducing energy losses caused by this necessary
maintenance measure
~ $5,000 ~ 2% TH <3
Thermal Insulation
Improving insulation conditions to all steam network elements as
well as boilers and hot mediums. This improvement
also includes proper maintenance practices
$500 – $5,000 1% –5 % TH ~1
Steam Traps Management
Management of steam traps including maintenance, care, cleaning, and replacement if the item is totally damaged
< $15,000 1% – 2% TH <1
Steam Leakage Repair
Avoiding leakages and treatment of damaged
pipes, accessories, elbows, and other leaking items that
lead to wasting steam
$0 – $3,000 5% – 10% TH <2
5 EN: Total Energy; EL: Electrical Energy; TH: Thermal Energy

54
Energy Efficiency in the Lebanese Industrial Sector
Heat Recovery
Recovered waste energy can be utilized in different applications, from air compressors, to power generators, boilers and others. Recovered wasted heat can be used in one of two main applications:
1. Heating AirPackaged Air Cooled rotary screw compressors, which are mostly used in Lebanese industries, are very amenable to heat recovery for air heating and for any potential hot air uses. Ambient atmospheric air is heated by passing it across the system’s after-cooler and lubricant cooler, where it extracts heat from both the compressed air and the lubricant that is used to lubricate and cool the compressor.
Since packaged compressors are typically enclosed in cabinets and already include heat exchangers and fans, the only system modifications needed are the addition of ducting and another fan to handle the duct loading and to eliminate any back pressure on the compressor cooling fan. These heat recovery systems can be modulated with a simple thermostatically controlled hinged vent.
Hot air can be used for space heating, industrial drying, preheating aspirated air for oil burners, or any other application requiring warm air.
2. Heating WaterUsing a heat exchanger, it is also possible to extract waste heat from the lubricant coolers found in packaged water, cooled reciprocating, or rotary screw compressors to then produce hot water. Depending on their design, heat exchangers can produce non-potable (gray) or potable water. When hot water is not required, the lubricant is routed to the standard lubricant cooler.
Hot water can be used in central heating or boiler systems, industrial cleaning processes, plating operations, heat pumps, laundries, or any other application where hot water is required. Heat exchangers also offer an opportunity to produce hot air and hot water, and allow the operator some ability to vary the hot air to hot water ratio.
Heat Recovery from Boiler – Economizer
IntroductionA fuel driven boiler loses about 18-22% of the fuel energy in the exhaust stack. This is an invariable result of the combustion process. If some of the waste heat is captured before it escapes, it would improve the overall efficiency of the boiler, and as a result, save energy costs.
Figure 36: Steam boiler energy balance scheme

55
Ener
gy E
ffici
ency
in th
e Le
bane
se In
dust
rial S
ecto
r
ApplicationEnergy embedded in steam boiler flue gas can be captured using a special tool called an economizer. An economizer is a heat exchanger that is placed into the boiler exhaust stream and used to recover heat into the boiler “make-up” water. Clearly, the hotter you can get the water coming into the boiler, the lower the fuel consumption. Basically, the economizer is using energy that is already paid for to provide input energy into the boiler.
The volume of make-up water to be added is related to the processes that are using steam. For example, food processes typically lose water (moisture added in the product) and therefore tend to add considerable fresh water as make-up to the boiler. Make-up water has an average temperature of 22°C and will need to be heated up to 200°C. An economizer will be able to raise the temperature to about 70°C, which will provide a good shoot up and the related energy savings from the avoided thermal energy used.
AdvantagesAs the economizer removes heat energy from the exhaust stack, the temperature of the exhaust is lowered which would seem to be a non-issue except for one possible side effect: If the exhaust gases are cooled too much, acids can precipitate out of the exhaust and can cause corrosion problems for the economizer and flue. Typically, flue gases condensate acids at about 115°C, which usually sets the lower temperature range for economizer operations.
The amount of energy the economizer can recover depends on several factors such as flue exhaust temperature, flue gas flow rate, and temperature of the make-up water. Very high exhaust temperatures such as 350°C will help the economizer to recover considerable heat energy but may be a sign of other serious problems such as soot or scale build-up on heating tubes. Typically, economizers on a healthy boiler will be operating with flue temperatures in the 200-260°C range. Economizers are sized for the volume of flue gas, its temperature, the maximum pressure drop allowed through the stack, what kind of fuel is used in the boiler, and how much energy needs to be recovered.
Financial Analysis Savings potential is a function of recovered heat, based on existing stack temperature, required volume of make-up water, and number of operation hours. A generally accepted rule of thumb is that about 5% of boiler input capacity can be recovered with a properly sized economizer. The lower the amount of condensate return, the higher the volume of make-up water and the higher savings potential.
Figure 37: Steam boiler economizer installation

56
Energy Efficiency in the Lebanese Industrial Sector
Savings Calculation Example
Consider a 4,905kW (500 HP) boiler with a diesel input of 5,861.4 kW.
5,861.4 KW x 5% = 293 kW (100% Load Factor)
293 kW / (0.093 kW per liter of 93°C water) = 3,150 liters per Hour
(293kW / 80% efficiency) = ~34m3 x $0.247 per m3 Natural Gas = $8.40 per Hour Value
Savings is reduced by 50% for a 50% Load Factor, etc.
*Source: Boiler Consortium 2012
Heat Recovery from Generator – Exhaust Gas Boiler
IntroductionCHP (Combined Heat and Power) is the simultaneous utilization of heat and power from a single fuel or energy source, at or close to the point of use. An optimal CHP system will be designed to meet the heat demand of the energy user – whether at building, industry or city-wide levels – since it costs less to transport surplus electricity than surplus heat from a CHP plant. Accordingly, CHP can be viewed primarily as a source of heat, with electricity as a by-product.
CHP can take on many forms and encompass a range of technologies, but will always be based upon an efficient, integrated system that combines electricity production and a heat recovery system. By using the heat output from the electricity production for heating or industrial applications, CHP plants generally convert 75-80% of the fuel source into useful energy, while the most modern CHP plants reach efficiencies of 90% or more (IPCC, 2007). CHP plants also reduce network losses because they are located near the end user.
CHP plants consist of four basic elements: a prime mover (engine or drive system), an electricity generator, a heat recovery system, and a control system. The prime mover, while driving the electricity generator, creates usable heat that can be recovered. The type of application, prime mover and fuel used generally classifies CHP units.
Figure 38: Cogeneration/CHP Energy Diagram v/s conventional systems

57
Ener
gy E
ffici
ency
in th
e Le
bane
se In
dust
rial S
ecto
r
ApplicationWhenever a plant has a combined need of steam and an electrical demand higher than 1,000 KW, this solution is very attractive.It is clear that the financial viability of the project is directly related to the total electrical demand combined with a relatively continuous steam demand and at least two shifts of operation per day.
An EGB consists of a number of sections. Each section contains usually four to six spirally wound “pancakes.” The sections are stacked between inlet and outlet cones to provide efficient gas flow, heat transfer, and steam or hot water production.
The very common and most applicable design of EGB follows the Clayton Model. The Clayton EGB’s system is compact and provides an excellent working efficiency.
The Clayton model is explained in the following figure, showing how the Feed-water for the exhaust gas boiler is prepared in a feed-water tank. This vessel can be atmospheric or, in case of a de-aerator, it is pressurized. The feed-water tank is often referred to as a “hot-well.” In the feed-water tank, fresh make-up water and condensate coming back from the installation are blended. The water in the tank is preheated in a controlled way by steam injection in order to drive out oxygen and non-condensate gases in a natural way. The water preheating temperature is 95°C. In the same tank, chemicals for water treatment are added to the feed-water. A pump takes water from the feed-water tank to the separator/accumulator. The separator/accumulator is a vessel under steam pressure with controlled water levels. The vessel has two basic functions: separation of the steam and water mixture coming from the exhaust gas boiler and preheating of the water going to the exhaust gas boiler. The Clayton water pump takes water from the separator/accumulator and feeds it to the exhaust gas boiler. This quantity of recirculation water is about twice the steam production of the exhaust gas boiler at full load. The mixture of steam and water coming out of the exhaust gas boiler is going to the separator/accumulator. A system of fixed vanes mounted inside the vessel takes care of the separation of steam and water. The separated water, however, is at steam saturation temperature and mixes in the vessel with the in-coming water from the feed-water tank. In this way, the water at the bottom of the accumulation has a temperature in between the steam temperature and the temperature of the water in the feed-water tank. The system assures that the water going to the exhaust gas boiler is well above the acid dew-point of the exhaust gases, thus protecting the boiler tubes against outside corrosion.
The installation of the EGBs requires 70m2 in the generators area. On the other hand, the system will comprise the EGB and all the auxiliaries for controlling the exhaust gases and steam flows.
Figure 39: Exhaust gas boiler

58
Energy Efficiency in the Lebanese Industrial Sector
Figure 40: Clayton R System- Operational scheme
AdvantagesEGB allows recovering waste energy and converting it into heat. This process leads to a massive reduction in thermal energy demand and also helps cleaning up stack gas. The exhaust gas boiler is a compact unit that does not require complicated configuration. The boiler is already equipped with an inlet pipe where stack gas enters, and an exhaust where leftovers exit.
Financial Analysis The price of an exhaust gas boiler varies depending on the size and application itself, but normally falls in the range between $150,000 and $350,000.
The savings can reach more than 20% of thermal energy consumption, with a payback period that does not exceed eight years.Considering a typical application observed in various case studies, an EGB designed to work with two generators with a total capacity of 1,300 kVA costs around $250,000 but pays back the investment in less than four years by saving 7.7% of the thermal energy consumption at the facility. A larger system designed for a generator capacity of 3,000 kVA costs more than $400,000, paying back the investment in less than seven years by reducing thermal energy consumption at the facility by more than 20%.
Heat Recovery from Generator – Jacket Water
IntroductionThe electrical power generation has an efficiency of only up to 40% in electrical generators; the remaining are pure losses mainly in the form of exhaust gases and radiator/jacket cooling. Recuperated heat from the exhaust gases directly produce the hot water that can be used.
By installing one heat exchanger on one of the generators, the exhaust gas goes through the heat exchanger and heats up the water in the storage tank to a certain temperature during generator operation. The figure below shows a sample drawing and the type of heat exchanger that can be used to produce hot water.
ApplicationEngine Jacket Water/Radiator provides another source of potential waste heat recovery albeit at a lower recuperation gradient compared to the exhaust gases. This present measure covers the installation of a heat exchanger on the engine’s jacket water coolant to produce hot water.
By using the heat rejected by the coolant from one generator, hot water can be produced. The system will comprise the heat exchanger and all the control auxiliaries.

59
Ener
gy E
ffici
ency
in th
e Le
bane
se In
dust
rial S
ecto
r
Financial Analysis Observations were recorded in four of the five sites studied in this case study. The conclusions vary from one site to another when comparing payback periods; however, the period was always below five years.
The investment size depends on the system itself and the amount of heat that will be recovered, ranging from $20,000 to around $100,000, saving somewhere between 1% and 13% of the thermal energy consumption at the facility.
These savings lead to a very attractive payback period starting at 1.3 years for one site and then going up to 4.63 years in the worst-case scenario.
Heat Recovery from Generator – Absorption Chiller
IntroductionAn absorption refrigeration system differs from a vapor compression refrigeration system due to the utilization of a thermal energy source instead of electric energy. In the absorption refrigeration system, two working fluids are used: a refrigerant and an absorbent. In the absorption refrigeration plant (ARP) Ammonia is used as a refrigerant, water as an absorbent, and it produces coolness for industrial applications at temperatures as low as -60°C.
ApplicationIn a cooling machine the refrigerant evaporates at a low temperature and low pressure. Vapor is extracted from the evaporator, then transformed to a higher pressure and liquefied in the condenser.
In a compression refrigeration machine (CRM), a mechanical compressor is used to take the refrigerant vapor from the lower evaporation pressure to the higher condensation pressure. The condensation heat produced in the condenser is dissipated by means of a cooling tower, while the evaporator produces the refrigeration capacity, taking heat at a low temperature.
In Absorption Refrigeration Plants (ARP), this process is realized by means of a solution circuit, which serves as a thermal compressor. A liquid absorbent dissolves the refrigerant vapor. This liquid is pumped to a high-pressure level in the de-sorber or generator, where the refrigerant is separated again from the liquid solution. This separation is accomplished by heating up the solution to the boiling point so that the refrigerant evaporates out of the solution. This heating can be accomplished by waste heat, steam or by a gas or oil burner. The ammonia vapor is subsequently liquefied in the condenser. The condensation heat, as well as the absorption heat, has to be dissipated to the ambience.
Figure 41: Heat exchanger network drawing (left); Type of heat exchanger (right)

60
Energy Efficiency in the Lebanese Industrial Sector
Figure 42: CRM (left); ARP (right) systems
Figure 43: Sample drawing of an ARP on 1,000 kVA generator
The main difference between a compression and an absorption cycle is that the former needs mechanical energy as a driving energy for the compressor, while the latter needs thermal energy for the de-sorber and only a small amount (2% of the driving energy) of electricity for the liquid pump.
Because most of the components of an ARP are heat exchangers, the plants are very robust and are not susceptible to wear and tear. ARPs need very little maintenance. Only the liquid pumps and the pneumatic valves consist of moving components that are susceptible to wear and tear. Maintenance is an easy task and no specialists are required.
Each 1,000 kVA generator can be equipped with an ARP of a capacity of 150 tons of refrigeration.
Financial AnalysisIn this case study, studies were conducted on one of the largest industrial facilities in Lebanon. Its heat recovery absorption chiller system resulted in very attractive savings, paying back an investment of almost $400,000 in 5.49 years, a saving estimated at 13.7%.

61
Ener
gy E
ffici
ency
in th
e Le
bane
se In
dust
rial S
ecto
r
Summary of Heat Recovery EEMs
CATEGORY EEM DESCRIPTION INVESTMENT (RANGE)
SAVING (%) ON6 PBP
(YRS)
HEAT RECOVERY
Economizer
Flue gas heat recovery through the use of an
economizer that reuses the exhaust gas and uses it in a
heat exchanger
$15,000 – $40,000 1% – 5% TH <3
Exhaust Gas Boiler
Heat recovery from generator exhaust
connecting it to a single unit called exhaust gas boiler that generates
thermal energy for water heating
$200,000 – $500,000
5% – 15% TH 3 – 7
Heat Exchanger – Jacket
Water
Heat recovery from generator exhaust by
the installation of a heat exchanger on the engines
jacket water coolant to produce hot water
$20,000 – $120,000
1% – 15% TH 1 – 5
Absorption Chiller
Heat recovery from generator exhaust to be used in an absorption
chiller to generate chilled water and save on
electricity expenses
$200,000 – $500,000
5% – 15% TL ~5
6 EN: Total Energy; EL: Electrical Energy; TH: Thermal Energy

62
Energy Efficiency in the Lebanese Industrial Sector
Getting an Energy Audit
The Need for an Energy AuditIf the facility is not getting its energy for free, and it has an electricity bill at the end of the year that drains out its cash, then it needs an energy audit. Additionally, it is essential that the facility owner understand what an energy audit does and how it can help the facility operate more efficiently and reduce unnecessary expenses.
The level of details and comprehensiveness of the energy audit shall be decided on based on the facility needs and type of operation. The technical manager would be the best person to advise on this matter, keeping in mind the different types of energy audits presented under the introduction chapter of this report.
Preparing for the Energy AuditBefore proceeding with an energy audit, it is essential to first, be prepared. The facility operator needs to make sure to have all technical drawings and design material ready, as well as energy billing details over the past three years.
It is also essential to decide on the period during which the energy audit is to be performed. This period could later be discussed with the energy auditor after the auditor has been hired.
Consequently, an energy audit focal point should be appointed. This focal point is an employee, preferably a technician, at the facility who will support the energy audit company during the data collection, surveying, and technical assessment phases.
Finding and Selecting an Energy AuditorThere are a reasonable number of energy audit companies and consultants in Lebanon offering energy audits and energy consultancies. The level of expertise is advanced and their reliability is well recognized.
However, it is recommended to select an auditor with previous experience in the sector of interest, and specifically in similar operations. During the negotiation phase, the facility owner can ask for references and similar projects conducted by the energy auditor.
Interested parties can always contact CEDRO offices to inquire about energy audit companies and obtain a list of qualified energy auditors in Lebanon.
The FeesAn energy audit conducted by a qualified and experienced energy auditor can cost somewhere between $5,000 and $20,000, based on the size of the facility, as well as the level of complexity of the mechanical and electrical systems in place.The facility owner pays the fees based on the payment mode agreed upon with the energy auditor.
Access to FinanceThe National Energy Efficiency and Renewable Energy Action (NEEREA) is an attractive financing scheme, financed by the Central Bank of Lebanon, offering soft loans to renewable energy and energy efficiency implementations. These loans can have a payback period of 10 years with interests as low as 1%.
NEEREA does not finance an energy audit study unless some energy saving measures are implemented. Having done so, the facility owner can apply to a NEEREA loan through local banks, providing a technical and financial feasibility study that has to be prepared by a qualified consultant (who could be the energy auditor as well). The study will be submitted to the local bank and then transferred to the Central Bank of Lebanon for approval.
For more details about this financing scheme, you can access the NEEREA website: http://lcec.org.lb/en/NEEREA/AboutUs

63
Ener
gy E
ffici
ency
in th
e Le
bane
se In
dust
rial S
ecto
r
Bibliography
Atlas Copco. (2015). Atlas Copco Compressed Air Manual. Retrieved from http://www.atlascopco.com/Images/Compressed_Air_Manual_tcm44-1249312.pdf
Boiler Consortium. (2012). Economizers. Retrieved May 20, 2016, from http://cleanboiler.org/learn-about/boiler-efficiency-improvement/efficiency-index/economizers/
Boiler Consortium. (2014). Oxygen Control. Retrieved May 20, 2016, from http://cleanboiler.org/learn-about/boiler-efficiency-improvement/efficiency-index/oxygen-control/
DOE. (1998). Improving Compressed Air System Performance - A Sourcebook for Industry (Factsheet 7). Department of Energy.
Morvay, Z. K., & Gvozdenac, D. D. (2008). Applied industrial energy and environmental management. Chichester, West Sussex, U.K.: Wiley.
Plant Services. (2015). Compressed Air Efficiency. Retrieved May 20, 2016, from http://www.plantservices.com/
Rabadia, C., & Motwani, K. (2015). Energy Saving Opportunities in Pumps and Compressors. Ijraset, 3(VIII). Retrieved from http://www.ijraset.com/fileserve.php?FID=3215
Spirac Sarco (2016) Condensate removal from plant. (n.d.). Retrieved May 20, 2016, from http://www.spiraxsarco.com/
Steam Main (2016) Steam leaking from a hole estimator:. (n.d.). Retrieved May 20, 2016, from http://steammain.com/Steam-leaking-from-hole-estimator

64
Energy Efficiency in the Lebanese Industrial Sector