energy efficiency market report capturing the multiple ... · energy efficiency savings in iea-11...
TRANSCRIPT

© OECD/IEA 2014© OECD/IEA 2014
Energy Efficiency Market Report
Capturing the Multiple Benefits of Energy Efficiency
Samuel Thomas Energy Efficiency and Environment Division, IEA

© OECD/IEA 2014
0
10
20
30
40
50
60
2011 2020 2030 2040 2050
Nuclear 7%
Renewables 30%
End-use fuel switching 9%
CCS 14%
End-use fuel and electricityefficiency 38%
Gt CO2
Power generation efficiency and fuel switching 2%
Portfolio of actions to reduce energy sector emissions

© OECD/IEA 2014
0
10
20
30
40
50
60
2011 2020 2030 2040 2050
End-use fuel and electricityefficiency 38%
Gt CO2
Portfolio of actions to reduce energy sector emissions
EE provides largest contribution to abatement
Power generation efficiency and fuel switching 2%
© OECD/IEA 2014
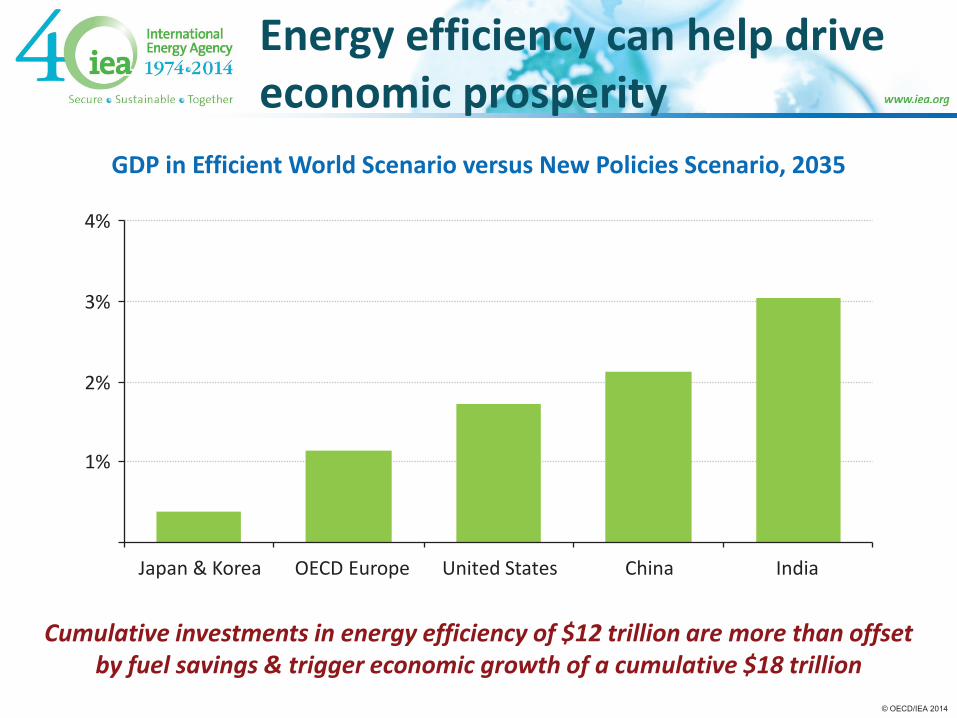
Energy efficiency can help drive economic prosperity
Cumulative investments in energy efficiency of $12 trillion are more than offset by fuel savings & trigger economic growth of a cumulative $18 trillion
GDP in Efficient World Scenario versus New Policies Scenario, 2035
1%
2%
3%
4%
Japan & Korea OECD Europe United States China India
© OECD/IEA 2014
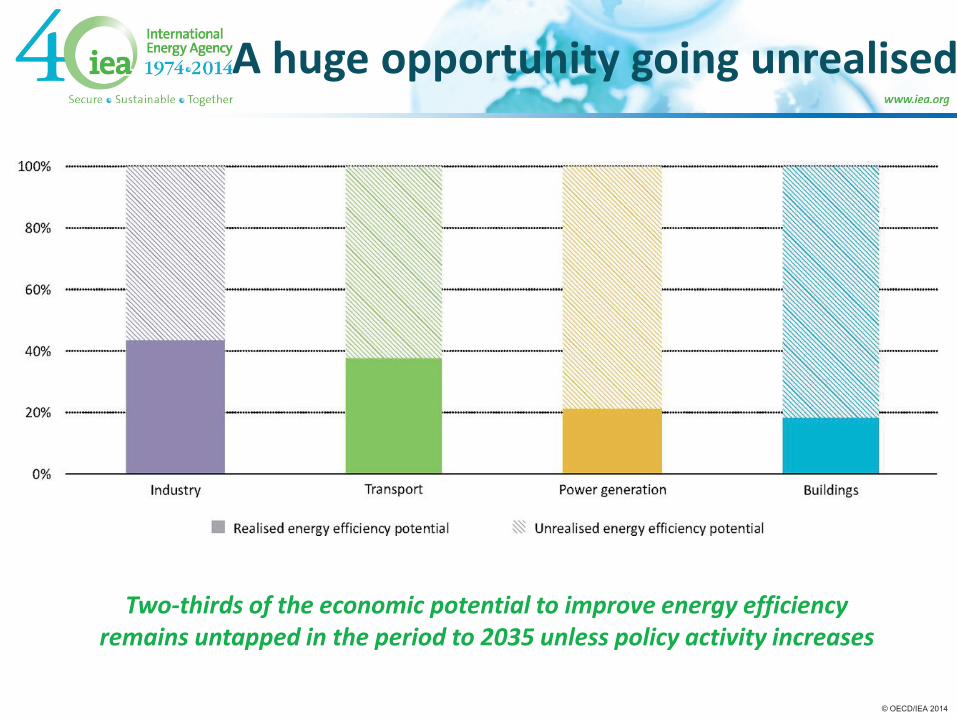
A huge opportunity going unrealised
Two-thirds of the economic potential to improve energy efficiency remains untapped in the period to 2035 unless policy activity increases

© OECD/IEA 2014
Impact of supply- and demand-side improvement on US import needs
Source: WEO 2012
0
2
4
6
8
10
2011 2015 2020 2025 2030 2035
mb/d
Demand-side efficiency
Biofuels use in transport
Natural gas use in transport
Increased oil supply
Reductions due to:
2011 net oil import level
Projected net imports

© OECD/IEA 2014
IEA fuel market reports

© OECD/IEA 2014
Energy Efficiency Market Report
© OECD/IEA 2014
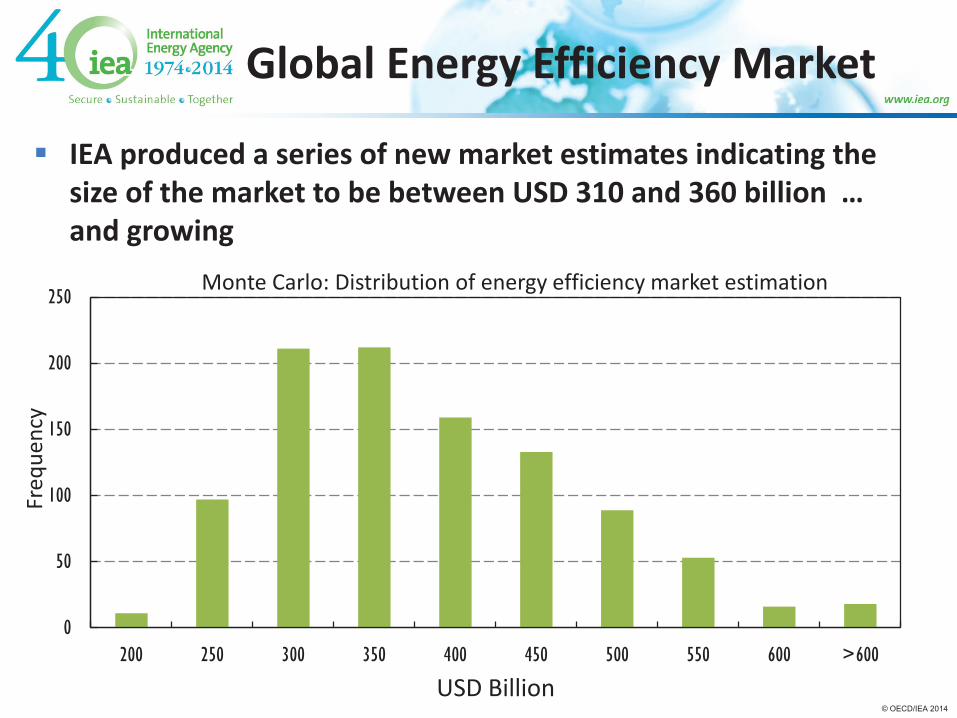
Global Energy Efficiency Market
IEA produced a series of new market estimates indicating the size of the market to be between USD 310 and 360 billion … and growing
0
50
100
150
200
250
200 250 300 350 400 450 500 550 600 >600
Freq
uenc
y
USD Billion
Monte Carlo: Distribution of energy efficiency market estimation

© OECD/IEA 2014
0
100
200
300
400
500
600
700
Upstream oil and gas *
Coal, oil and gas electricity generation ***
Renewable electricity
generation **
Energy efficiency
R
s
USD
bill
ion
Estimated range of USD 147 to 300 billion
EE vs other supply (2011)
IEA EEMR 2013
(2012)Sources: BNEF, IEA

© OECD/IEA 2014
0
500
1 000
1 500
2 000
2 500
3 000
3 500
4 000
1973 1975 1977 1979 1981 1983 1985 1987 1989 1991 1993 1995 1997 1999 2001 2003 2005 2007 2009 2011
Mtoe
SavingsOil
Gas
Coal
ElectricityOther
TFC
Energy efficiency: still the ‘first fuel’
Supplied (1336 Mtoe) more in 2011 to meet energy service demand than oil (1200 Mtoe), electricity (552 Mtoe), natural gas (509 Mtoe) in IEA-11*
*IEA-11: Australia, Denmark, Finland, France, Germany, Italy, Japan, Netherlands, Sweden, United Kingdom, United States

© OECD/IEA 2014
Energy efficiency savings in IEA-11 countries rival TFC of major energy consuming countries and regions (e.g., EE improvements
over the last 4 decades saved more energy in 2011 than TFC in EU)
EE: an invisible power-house
0
200
400
600
800
1 000
1 200
1 400
1 600
1 800
Energy efficiencysavings of 11 IEA
member countries
Asia (excludingChina)
China EU United States
Mto
e
TFC

© OECD/IEA 2014
How different factors are affecting energy demand over time
Energy efficiency has been the prime mover to reduce energy demand (TFC) – IEA-18*
85%
90%
95%
100%
105%
110%
115%
2001 2003 2005 2007 2009 2011
2001
= 1
Decomposition of Total Final Consumption by factor and isolated impact of each factor on energy demand (compared to 2001)
Economic andpopulation growth
Structural change
TFC
Changing efficiency
*IEA-18: Australia, Denmark, Finland, France, Germany, Italy, Japan, Netherlands, Sweden, United Kingdom, United States + Austria, Canada, Czech Republic, Korea, New Zealand, Spain, Switzerland.

© OECD/IEA 2014
Vehicle fuel economy standards (VFE) affect 70% of global new vehicle fleet (50 million vehicles in 2011)
Transport: EE market driven by VFE standards
Source: Global fuel economy initiative

© OECD/IEA 2014
Energy Performance Contracting market size in selected countries
ESCOs: a USD 30 billion market globally, and growing
Country Estimated market size (USD) Number of ESCOs or projects
China 12 billion .. United States 6.50 billion > 500 projects Germany 4.5 billion 500-550 ESCOs France 4.3 billion 350 ESCOs Italy 670 million 50-100 ESCOs United Kingdom 540 million 30-50 ESCOs Spain 450 million 20-60 ESCOs Canada 420 million .. Korea 330 million > 1 400 projects Denmark 195 million 15-20 ESCOs Croatia 140 million 10 ESCOs Russia 140 million 30-100 ESCOs Ukraine 140 million 30 ESCOs Japan 140 million 50 projects Total 30 Billion >1100 ESCOs
© OECD/IEA 2014
Reaching out

© OECD/IEA 2014
EE generates multiple benefits

© OECD/IEA 2014
Energy Efficiency Warmth as Medicine
Carefully executed energy efficiency can deliver USD 99 billon in annual savings for Europe’s public health sector by 2020

© OECD/IEA 2014
Boosting industrial productivity
Competitiveness Ability to enter new markets; reduced production costs etc.
Production Capacity utilisation; improved product quality etc.
Operations and maintenance
Improved operation; reduced need for maintenance etc.
Working environment Site environmental quality; worker health and safety etc.
Environment Air pollution; solid waste; wastewater; reduced input materials etc.
Generating strategic value for businesses

© OECD/IEA 2014
Optimizing energy delivery
Benefits for utilities: in resource constrained operating context Benefits for consumers/indirect benefits for utilities: increased
affordability reduces customer default and associated costs
Supporting a changing business model

© OECD/IEA 2014
Overarching macroeconomic impacts
Moving away from the traditional view that economic performance is always linked to increased energy consumption
– the reverse can also be true!

© OECD/IEA 2014
Balancing public budgets
Investment effects Energy savings effects
Integrating multiple benefits into the calculation can more than double the return on public investment in energy efficiency
