energy - dedeweben.dede.go.th/webmax/sites/default/files/factsq1_2014.pdf · renewable energy 10.4%...
TRANSCRIPT

1Energy in Thailand : Facts & Figures Q1/2014
EnergyEnergyEnergyEnergyEnergyEnergyEnergyEnergyEnergyEnergyEnergyFacts & Figures Q
1/2014
EnergyEnergyEnergyEnergyEnergyEnergyEnergyEnergyEnergyEnergyEnergyEnergyEnergyEnergyEnergyEnergyEnergyEnergyEnergyEnergyEnergyEnergyEnergy in Thailand :EnergyPrimary Energy SupplyFinal Energy ConsumptionAlternative and Renewable EnergyGreen ElectricityBioenergyBiofuelsEnergy Efficiency

Energy in Thailand :Facts & Figures Primary Energy Supply 1
Final Energy Consumption 2
Alternative and 3
Renewable Energy
Green Electricity 4
Bioenergy 6
Biofuels 7
Energy Efficiency 8
Contents
In the first quarter of 2014, alternative
energy consumption in Thailand was 2,133
ktoe, grew by 10.9% compared to the first
quarter of 2013.
This was particularly due to an increase
in the consumption of biomass and solar
power production as well as biofuels uses
in transportation sector.
As a result of the Thai Government‘s
policy on energy efficiency, especially
Thailand’s National Energy Conservation
Program, energy intensity (EI) in the first
quarter of 2014 was 14.80 ktoe/thousand
million baht, decreased from the base year
(2010) 3.8%.

1Energy in Thailand : Facts & Figures Q1/2014
Primary Energy Supply : Facts & FiguresPrimary Energy Supply Q
1/2014
unit : ktoe
Primary Energy Supply1/
Domestic Production
Imports ExportsStock
changeTotal
Coal & Its Products 1,133 3,129 - 6,228 10,490
Crude oil & NGL 1,663 10,289 193 1,128 12,887
Condensate 1,113 318 - (287) 1,144
Natural Gas 9,192 1,947 - - 11,139
Petroleum products - 1,046 3,017 (3,474) (5,445)
Electricity - 233 40 - 193
Renewable Energy 2,153 - - (30) 2,123
Traditional Renewable Energy2/ 2,507 26 6 - 2,527
Biofuels 446 - - (9) 437
Total 18,207 16,988 3,256 3,556 35,495
Primary Energy Supply 35,495ktoe
- Coal & Its Products
- Renewable Energy
- Traditional Renewable Energy
- Net Petroleum Products Imports
- Net Electricity Imports
Traditional Renewable Energy(Fuel wood, Paddy Husk)
Power Plants
Other Conversion
Coal & Its Products, NG. , Renewable Energy
NG. Processing Plants
Crude oil, Condensate, Biofuels
Energy Transformation 3/
14,152 ktoe
Natural GasPetroleum Refineries
3/ Including own uses and losses.
4/ Non Energy Uses are used as raw material for Petrochemical Industries.
Non-Energy Uses4/ 2,393 ktoe
- Natural Gas
- Petroleum Products
- Electricity
- Traditional Renewable Energy (charcoal)
Final Energy Consumption 18,950 ktoe
1/ Primary Energy Supply is domestic production, plus imports, less exports and plus/less stock change.
2/ Comprising of Hydro, Solar, Wind and Geothermal.
2 Energy in Thailand : Facts & Figures Q1/2014
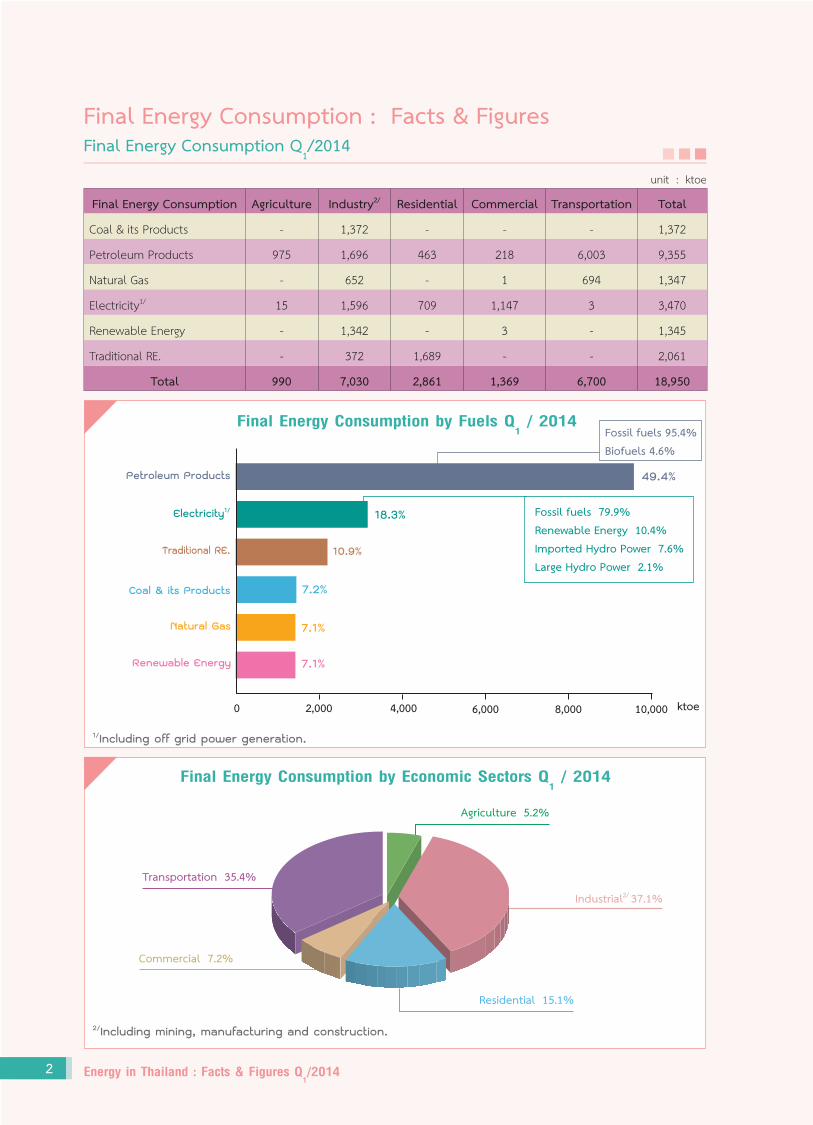
Final Energy Consumption : Facts & FiguresFinal Energy Consumption Q
1/2014
Final Energy Consumption Agriculture Industry2/ Residential Commercial Transportation Total
Coal & its Products - 1,372 - - - 1,372
Petroleum Products 975 1,696 463 218 6,003 9,355
Natural Gas - 652 - 1 694 1,347
Electricity1/ 15 1,596 709 1,147 3 3,470
Renewable Energy - 1,342 - 3 - 1,345
Traditional RE. - 372 1,689 - - 2,061
Total 990 7,030 2,861 1,369 6,700 18,950
Final Energy Consumption by Fuels Q1 / 2014
Final Energy Consumption by Economic Sectors Q1 / 2014
2/Including mining, manufacturing and construction.
1/Including off grid power generation.
49.4%
18.3%
10.9%
7.1%
7.2%
7.1%
Petroleum Products
Electricity1/
Traditional RE.
Coal & its Products
Natural Gas
Renewable Energy
unit : ktoe
Agriculture 5.2%
Industrial2/ 37.1%
0 2,000 4,000 6,000 8,000 10,000 ktoe
Residential 15.1%
Commercial 7.2%
Fossil fuels 95.4% Biofuels 4.6%
Fossil fuels 79.9% Renewable Energy 10.4%Imported Hydro Power 7.6% Large Hydro Power 2.1%
Transportation 35.4%
3Energy in Thailand : Facts & Figures Q1/2014
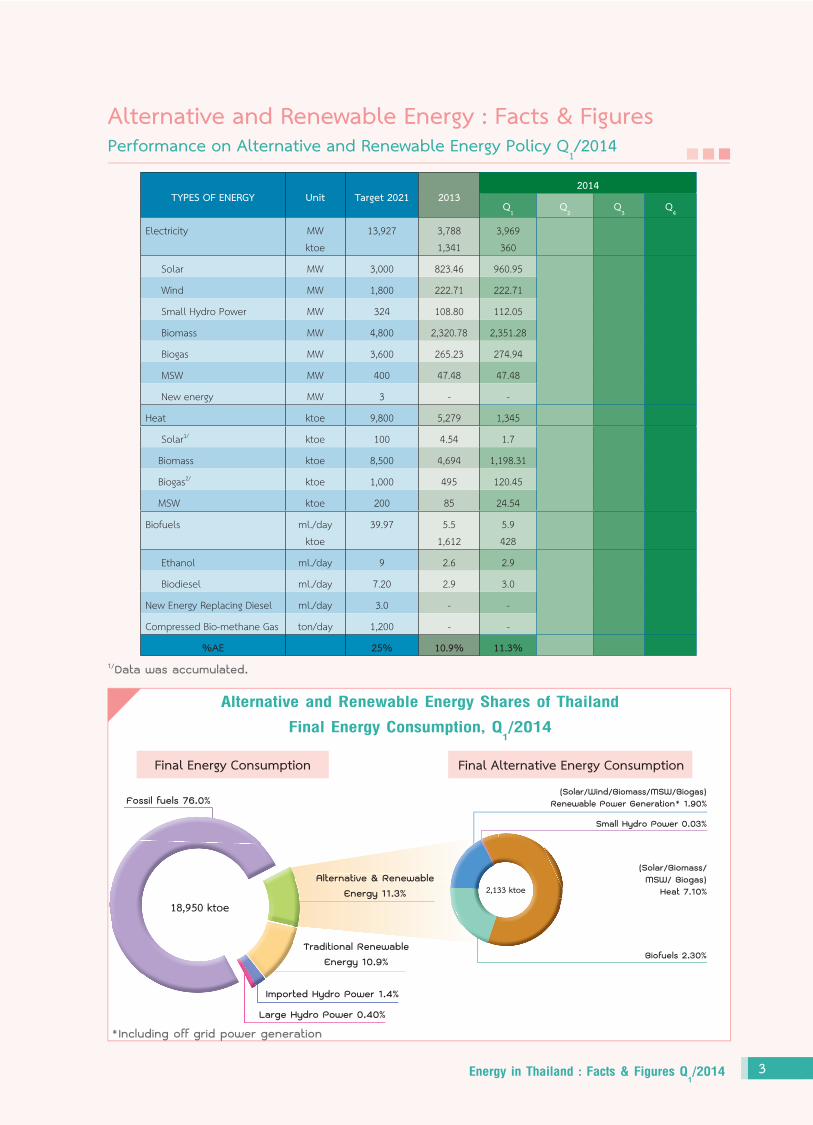
Alternative and Renewable Energy : Facts & FiguresPerformance on Alternative and Renewable Energy Policy Q
1/2014
18,950 ktoe
Biofuels 2.30%
Fossil fuels 76.0%
Small Hydro Power 0.03%
(Solar/Biomass/MSW/ Biogas)
Heat 7.10%
Final Energy Consumption Final Alternative Energy Consumption
TYPES OF ENERGY Unit Target 2021 20132014
Q1
Q2
Q3
Q4
Electricity MWktoe
13,927 3,7881,341
3,969360
Solar MW 3,000 823.46 960.95
Wind MW 1,800 222.71 222.71
Small Hydro Power MW 324 108.80 112.05
Biomass MW 4,800 2,320.78 2,351.28
Biogas MW 3,600 265.23 274.94
MSW MW 400 47.48 47.48
New energy MW 3 - -
Heat ktoe 9,800 5,279 1,345
Solar1/ ktoe 100 4.54 1.7
Biomass ktoe 8,500 4,694 1,198.31
Biogas2/ ktoe 1,000 495 120.45
MSW ktoe 200 85 24.54
Biofuels ml./dayktoe
39.97 5.51,612
5.9428
Ethanol ml./day 9 2.6 2.9
Biodiesel ml./day 7.20 2.9 3.0
New Energy Replacing Diesel ml./day 3.0 - -
Compressed Bio-methane Gas ton/day 1,200 - -
%AE 25% 10.9% 11.3%1/Data was accumulated.
Imported Hydro Power 1.4%
Large Hydro Power 0.40%
Alternative and Renewable Energy Shares of Thailand
Final Energy Consumption, Q1/2014
*Including off grid power generation
Traditional Renewable Energy 10.9%
(Solar/Wind/Biomass/MSW/Biogas)Renewable Power Generation* 1.90%
Alternative & Renewable Energy 11.3% 2,133 ktoe

4 Energy in Thailand : Facts & Figures Q1/2014
The installed capacity of renewable energy in Q1 / 2014 was 3,969 MW, accounting for 12.2% of
total power capacity in Thailand.
Green Electricity : Facts & FiguresGreen Electricity Q
1/2014
Install capacity of renewable power generation1/
2,500
2,000
1,500
1,000
500
0
MW
Biogas275 MSW
47
Solar961
Wind223
Small Hydro Power112
Biomass2,351
1/Including off grid power generation.(only Renewable)2/Data was accumulated.
Alternative Energy 12.2%
Types of Energy
2013 2014
MW2/ ktoeQ
1Q
2Q
3Q
4
MW2/ ktoe MW2/ ktoe MW2/ ktoe MW2/ ktoe
Solar 823.46 92 960.95 27
Wind 222.71 26 222.71 6
Small Hydro Power 108.80 28 112.05 7
Biomass 2,320.78 1,039 2,351.28 281
Biogas 265.23 131 274.94 33
MSW 47.48 25 47.48 6
Total 3,788 1,341 3,969 360
Fossil fuels74.7%
Imported Hydro Power 6.5%
Large Hydro Power 10.5%
Biogas 7.0%
MSW 1.2%
Solar 24.2%
Wind 5.6%
Small Hydro Power 2.8%
Fossil Fuela 70.8%
Q1/2014
Biomass59.2%

5Energy in Thailand : Facts & Figures Q1/2014
แผนที่แสดงที่ตั้งโรงไฟฟ้าพลังงานทดแทนในประเทศไทยMAP OF RENEWABLE ENERGY POWER PLANT IN THAILAND
5

6 Energy in Thailand : Facts & Figures Q1/2014
Heat consumption from renewable energy
Heat consumption from renewable energy in Q1/2014 has reached 1,345 ktoe, accounting for 22%
of total heat consumption in Thailand.
Bioenergy : Facts & FiguresBioenergy Q
1/2014
1,800
1,600
1,400
1,200
1,000
800
600
400
200
0
ktoe
Biogas120
MSW 25
Solar2
Biomass1,198
Q1/2014
Biogas 9.0%
MSW 1.8%Solar 0.1%
1/Data was accumulated.2/Data was revised.
Types of Energy
2013 2014
physical unit
ktoe
Q1
Q2
Q3
Q4
physicalunit
ktoe physical unit
ktoe physical unit
ktoe physical unit
ktoe
Solar1/ (GJ) 191,788 4.54 71,814 1.7
Biomass (103 tons)
20,997 4,694 5,672 1,198.31
Biogas2/ (m3) 1,422,607,973 495 2,873,956 120.45
MSW (103 tons)
740 85 214 24.54
Total 5,279 1,345
Renewable Energy 22.0%
Traditional Renewable Energy 33.7%
Fossil fuels44.3%
Biomass 89.1%

7Energy in Thailand : Facts & Figures Q1/2014
Biofuels consumption in Q1/2014 reached 5.9 million litres/day, accounting for 7.3% of Gasohol
and High Speed Diesel (HSD) consumption in Q1/2014.
million litres/day
Biofuels : Facts & FiguresBiofuels Q
1/2014
Types of Energy
2013 2014
million litres/day
ktoe
Q1
Q2
Q3
Q4
million litres/day
ktoe million litres/day
ktoe million litres/day
ktoe million litres/day
ktoe
Ethanol 2.6 707 2.9 196
Biodiesel 2.9 905 3.0 232
Tatal 5.5 1,612 5.9 428
Q1/2014
Gasohol and High Speed Diesel (HSD) consumption in Q1/2014
1
Gasoline 18.0 Ethanol 2.9
Gasohol 20.9 ml/day
Diesel 57.2
High Speed Diesel (HSD) 60.2 ml/day
Biodiesel 3.0

8 Energy in Thailand : Facts & Figures Q1/2014
Energy Efficiency : Facts & FiguresPerformance on Energy Efficiency Measures Q
1/2014
* Final Energy Consumption ** Source : NESDB
ü reduce energy consumption 3.2%.
ü save over 16 thousand million Baht in energy imports.
ü reduce co2 2.0 million tons.
Energy Efficiency Results in Q1/2014

9Energy in Thailand : Facts & Figures Q1/2014
This report is published by
Alternative Energy and Efficiency Information Center
Department of Alternative Energy Development and Efficiency,
Ministry of Energy
17 Rama I Road, Kasatsuk Bridge,
Pathumwan, Bangkok 10330
THAILAND
Tel. +66 2222 4102-9
Ext. 1155, 1202, 1279, 1519
Tel./Fax. +66 2221 1475
+66 2221 6724
E-mail Address : [email protected]

10 Energy in Thailand : Facts & Figures Q1/2014
www.dede.go.th
This Product aims to solve global warming problem by selecting environment friendly raw
material with decrease CO2 e 0.32 kg emission