energy improvements of mondi dynäs paper mill697077/fulltext01.pdfgadar hussein master of science...
TRANSCRIPT

Umeå University, 2014
Institute of Applied Physics and Electronics
Energy efficiency improvements of Mondi Dynäs paper mill
A survey of steam and condensate with improvement measures for increased condensate recovery
Gadar Hussein
Master of Science in Engineering – Energy Engineering, 30 credits
Serial Nr: EN1331

i
Abstract
This thesis has been performed at Mondi kraft pulp and paper mill located in Sweden,
Kramfors Dynäs due to the low return rate of condensate. Currently, the return rate is only at
65 - 75 %. This is problematic as the demineralization process is operating on full capacity
and thus requires a reduced make-up water need. The production of demineralized water is
an expensive process due to large requirements of chemicals and pump-energy, but also due
to the cost of raw water and maintenance. Therefore the purpose of the work was to
investigate the possibility to increase the condensate return rate and thus reduce the need of
make-up water. The investigation was performed during normal production rates to simplify
the interpretations. The steam and condensate system was mapped and extracted flows were
identified, measured and marked on map. The extracted flows were investigated in more
detail and characterized as either consumed in a process or lost to sewer or atmosphere. In
the work, both minor and major improvements were investigated. Minor improvements are
accomplished with small intervention measures and could be done with small or no
investments costs. Major improvements require large investments costs and further
investigations.
Six different processes were found to constitute the total production of make-up water. These
are the free blowing of excess steam, soot blowing steam, paper machine 6, de-aerating
process in the feed water tanks, digester process and steam- & condensate leaks along the
pipe network. Improvements with the category of minor were found to reduce steam and
condensate consumption by 22 - 23 ton/h. This implies a reduction by 30 - 32 % of the added
make-up water, including an annual financial benefit of 3,3 - 3,9 MSEK. Additionally
0,41 - 0,82 MSEK could be gained annually by improving the insulation on the cylinder dryer
heads. The make-up water would be further reduced if insulation jackets and inspection
programs were implemented on equipments along the steam lines. Two major improvements
are recommended. The first major improvement involves elimination of the free blowing of
excess steam. This could be accomplished by drying the bark before combustion. The added
make-up water would be reduced by 25 % and with the possibility to sell the dried bark
during low steam production. The second major improvement involves the digester process,
where the consumptions of medium pressure steam could be reduced by replacing steam
with liquor-steam from the strong liquor accumulator. Medium pressure steam could instead
be converted into electricity by the turbine.
Keywords: Steam and condensate, increased condensate return, improvements measure, pulp & paper
mill

ii
Sammanfattning
Detta examensarbete har utförts vid Mondi kraft massa- och pappersbruk i Sverige, Kramfors
Dynäs med anledning av den låga återföringsgraden av kondensatet. För närvarande är
återföringsgraden endast 65-75 %. Detta är problematiskt eftersom avsaltningsprocessen
arbetar på full kapacitet och kräver därför ett minskat behov av spädvatten. Produktionen av
avmineraliserat vatten är en kostsam process på grund av behovet av stora mängder
kemikalier och pump - energi, men också på grund av kostnaderna för råvattnet och
underhåll. Syftet med arbetet var därför att undersöka möjligheten att öka
kondensatåterflödet och därmed minska behovet av spädvatten. Undersökningen
genomfördes under normala produktionstakter för att förenkla tolkningen. Ångan och
kondensatsystemet kartlades och de extraherade flöden identifierades, mättes och noterades
i flödeskartan. Extraherade flöden undersöktes mer i detalj och karakteriserades om de
antingen konsumeras i en process eller förloras till avlopp eller atmosfär.
Förbättringsåtgärder för ett minskat behov av spädvatten delades in i huvudkategorier små
och stora förbättringar. Små förbättringar kan åstadkommas med mindre
interventionsåtgärder och kan göras med små eller inga investeringskostnader. Stora
förbättringar kräver stora investeringskostnader och ytterligare undersökningar.
Sex olika processer befanns utgöra den totala produktionen av spädvattnet. Dessa är
friblåsandet av överskottsångan, sotblåsningsångan, pappersmaskin 6, avluftningsprocessen
i matarvattentankarna, kokeriprocessen och ång- & kondensatläckor längs ledningsnätet.
Förbättringar med kategorin mindre befanns minska ång- och kondensatförbrukningen med
22 - 23 ton/h. Detta innebär en minskning med 30 - 32 % av det tillsatta spädvattnet,
inklusive en årlig ekonomisk fördel av 3,3 - 3,9 miljoner kronor. Dessutom kan 0,41 - 0,82
miljoner kronor vinnas varje år genom att förbättra isoleringen på torkcylindrarnas gavlar.
Spädvattenbehovet skulle minskas ytterligare om isoleringsjackor och inspektionsprogram
genomfördes på utrustningar längs ångledningar. Två stora förbättringar rekommenderas.
Den första stora förbättringen innebär eliminering av friblåsandet av överskottsångan. Detta
kan åstadkommas genom torkning av bark före förbränningen. Det tillsatta spädvattnet
skulle minskas med 25 %, med dessutom möjligheten att sälja den torkade barken under låg
ångproduktion. Den andra stora förbättringen gäller kokeriprocessen, där konsumtionen av
medeltrycksångan kan elimineras genom att ersätta ångan med lutångan från
starklutsackumulatorn. Mellantrycksångan kan istället omvandlas till el i turbinen.
Nyckelord: Ånga och kondensat, ökad kondensatåterföring, förbättringsåtgärder, massa och
pappersbruk

iii
Preface
This thesis was conducted as a final part of my civil engineering program in energy
engineering at Umeå University with the extent of 30 credits. The work was performed on
behalf of Mondi Dynäs AB in Kramfors municipality.

iv
Acknowledgements
I take this opportunity to express my gratitude to the following people who helped me
along my work:
My supervisor Per-Ola Bylund at Mondi Dynäs, who has been an brilliant supervisor and
always taken time to guide me through different processes in the mill and answered all my
questions whenever asked.
My supervisor Jonathan Fagerström at the department for applied physics and electronics
at Umeå University, for his excellent feedbacks and support on my thesis.
I would also like to express my gratitude to all co-workers at the technical department for a
great time together and Mondi Dynäs for giving me the opportunity to perform this thesis.
My fellow students Mathias Rönnberg & Mika Tuomikoski, for a great time together
during our studies.
Finally an honorable mention goes to my family, most of all to these members
Saffin Hussein, Nazek & Karwan Said and Mattin Hussein, without them I wouldn't have
this diploma.
January 2014
Gadar Hussein

v
1 Table of contents
1 Introduction ........................................................................................................................... 1
2 Method ................................................................................................................................... 2
3 Theory .................................................................................................................................... 3
3.1 Flash steam .................................................................................................................. 3
3.2 Heat transfer ................................................................................................................ 3
3.3 Steam system ............................................................................................................... 4
3.4 Condensate system ....................................................................................................... 6
3.5 Free blowing of excess steam ....................................................................................... 6
4 Results & Discussion ............................................................................................................. 8
4.1 De-aerator .................................................................................................................. 10
4.2 Paper machines (PM) .................................................................................................. 12
4.3 S&C pipeline system .................................................................................................... 14
4.4 Free blowing of excess steam ...................................................................................... 17
4.5 Soot blowers ................................................................................................................ 17
4.6 Digester process .......................................................................................................... 17
4.7 The blowdown condensate .......................................................................................... 17
4.8 Extraction of S&C from its loop .................................................................................. 18
4.9 Minor Improvements ................................................................................................. 20
4.9.1 Feed water system ............................................................................................ 20
4.9.2 PM-Condensate tanks ....................................................................................... 23
4.9.3 PM-Dryer section .............................................................................................. 23
4.9.4 S&C pipeline system ......................................................................................... 24
4.10 Major improvements .................................................................................................. 26
4.10.1 Digester process ................................................................................................ 26
4.10.2 The free blowing of excess steam ..................................................................... 26
4.11 Additional Improvement ........................................................................................... 27
4.12 Financials ................................................................................................................... 28
5 Conclusion ........................................................................................................................... 30

vi
6 References ............................................................................................................................ 31
7 Appendix .............................................................................................................................. 32
7.1 Tables ......................................................................................................................... 32
7.2 Figures ........................................................................................................................ 34
vii
Nomenclatures
phase In-text explanation:

viii
List of Figures
Figure 1: Time dependent variation of steam production and consumption in four different processes
in the paper mill.
Figure 2: A macro schematic overview of steam and condensate loop system during a normal
production rate
Figure 3: Drainage pipe flushing condensate produced in the de-aerator into the sewer
Figure 4: De-aerating valve of bark boiler and gas boiler feed tank that was unintentionally left
open.
Figure 5: Condensate loss from drainage line of 20-ci058 in paper machine 6
Figure 6: Condensate loss from drainage line of 20-ci054 in paper machine 6
Figure 7: Condensate drainage pipe being left open in paper machine 5
Figure 8: Drainage from the Zickesch -valve 06-PC130 (Pressure Controller)
Figure 9: Drainage of HP and LP line from steam traps (near feed pumps of bark boiler)
Figure 10: Closed drainage valves of bark boiler water
Figure 11: Steam trap line and drainage valves of paper machine 5 LP-steam pipe
Figure 12: A sketch representing heating of the make-up water in the feed water system by direct
steam injection.
Figure 13: Principal image of the ProSonic heater
Figure 14: J-Series Jet Sparger - Tank Mount On/Off Operation
Figure 15: Temperature variation of the make-up water by injection of steam
Figure 16: Insulating jacket on valves
Figure 17: Un-isolated pipe section after a repair in paper machine 5
Figure 18: Un-isolated steam trap and valve section
Figure 19: Steam leakage in the causticising process, near the gate to the bark boiler
Figure 20: Leakage from LP-steam line in paper machine 5
Figure 21: Flash steam from drainage lines and steam traps in paper machine 6
Figure 22: Possible flash steam being lost from steam traps in paper machine 5
Figure 23: Condensate quality measurement in paper machine 6
Figure 24: Drainage valve of 20-Ci054 in paper machine 6
Figure 25: Leakage of condensate from valve
Figure 26: Preheating of heavy oil in bark boiler – condensate to sewer
List of Tables
Table 1: Quantities of S&C extracted from its loop
Table 2: Potentially improvement processes with “smaller” engagements
Table 3: Average flows and total quantities during August
Table 4: Extraction flows and other
1
1 Introduction
Mondi Dynäs AB is an unbleached Kraft pulp and paper industry located in Kramfors,
Sweden and was established in 1884 and acquired by Mondi in 2000. The plant produces
260 000 tons of Sack Kraft Paper and Specialty Kraft Paper each year. An industry such as
Mondi Dynäs, involves numerous of processes where great amounts of energy are required.
Steam is the primary energy carrier and is the essential utilization media in several processes.
From a total of three steam generators, the steam production annually reaches about
1 150 GWh and is used in chemical pulping, paper and pulp drying, black liquor evaporation
and other operations.
The pulp and paper industry in general is characterized by its large demand of electricity and
heat - making it the fourth largest industrial energy user in the world (International Energy
Agency, 2007). Two major challenges for the pulp and paper industry are increasing energy
prices and reduced carbon dioxide emissions (International Energy Agency, 2008).
Furthermore, constant energy efficiency improvements are needed to stay competitive in the
pulp and paper industry.
The topic of this paper is thus the return rate of steam and condensate (S&C) throughout the
plant. The return rate of condensate is currently at a very low level since only 65-75 % of total
produced steam is recovered as condensate. This implies that at least same amount of
demineralized1 water as un-recovered condensate has to be added to complete the S&C loop.
The demineralization process is currently operating at maximum capacity and hence, no
additional condensate losses can be replaced. Like in any other pulp and paper industry, the
production of demineralized water is an expensive process due to large requirements of
chemicals and pump-energy, but also due to the cost of raw water and maintenance.
Furthermore, as condensate is lost, more energy and consequently more fuel is needed to
heat the freshly added demineralized water. As fuel costs continue to rise, it’s thus imperative
to focus on recovering condensate to achieve a good return rate and keep energy costs down.
A rough approximation is that each produced cubic meters of demineralized water costs 10
SEK for Mondi Dynäs and a financial benefit of returning one cubic meters of condensate is a
gain of 20 SEK (Bylund, 2013). Furthermore the cost of raw water is somewhere 1,4 SEK/m³
(Bylund, 2013). Therefore, the purpose of the present work was to study the possibility of an
increased return rate of condensate. This was done by investigating the processes that extract
steam and/or condensate from the loop system.
1 Demineralized water is used in S&C system to prevent coatings on fragile equipments.

2
2 Method
Return rates and mass flows rates of larger processes was monitored in the ‘distributed
control system’ (DCS) or calculated by data collected in PI-system2. With help of these
systems a mass balance was evaluated. The collected values from these systems were average
flows during august 2013, as it was a normal production rate month with few variations in
steam production. To have a visual perception of the condensate return rates in a given
process, a flow chart of the whole S&C loop system was made with different thickness of the
flow lines in and out of the each process. This simplified the work as it was clearer which
process extracted the most S&C from the loop system. As the chart was partially complete, a
more detailed in field investigation was performed, with the prioritization of processes with
the lowest return rates. As a possible condensate loss was found in a process, a sample was
taken and hardness-tested in the laboratory. A low/no hardness value means that it is pure
condensate with no mineral contaminations. A volume flow measurement was then
performed by a beaker and a timer. This method is not that accurate but should still be a
good way to approximate the flows and should also not affect other calculations. The location
and volume flow were noted in the updated flow chart. These field tests were only made
during normal productions rate so they can be correlated as much as possible with values
from august. Measured data regularly contain errors, especially data from flow sensors
(Laukkanen & Launonen, 2008). However, many flow sensors are regularly calibrated in the
mill and the most important flows have always been validated in co-operation with skilled
personnel. Improvement measures are divided into two categories based on the magnitude of
the interventions. Minor improvements are the smaller intervention measures with small or
no investments costs, while major improvements are the opposites. The suggestions for
improvement measures are based on interviews with skilled co-workers and technical reports
as well as scientific reports. Used application during the work where e!Sankey for making the
flow chart, ABB’s DCS & the PI-system for gathering of data and office suite for the
calculations and presentation of the results.
2 An Excel add-in information system, which collects data from sensors in the mill

3
3 Theory
This chapter describes two fundamental thermodynamic relations between steam &
condensate and how it is produced and utilized in the mill.
3.1 Flash steam
Steam is easily controlled in a given process by the relationship between its saturation
temperature and pressure. Saturated water or condensate is steam that had been condensed
during release of its latent energy. At atmospheric pressure steam condenses to water at
100°C, but in other circumstances where the pressure is above the saturation point, the steam
can condense into water with a much higher temperature due to the relation between
pressure and temperature. However if that is the case and condensate exist in a vessel with a
higher pressure than atmospheric, whenever there is a sudden decrease of the saturation
pressure, e.g. leakage from a vessel or condensate pipe system, flash steam will be produced.
This phenomenon often occurs over valves where there is a pressure drop or in accumulator
tanks. The amount of produced flash steam ( ) from total water ( ) is described with
equation 1 (Spirax Sarco, 2007).
(
)
(1)
3.2 Heat transfer
Heat transfer is the energy transferred from one equilibrium state to another as a result of
temperature difference. Heat can be transferred in three modes; conduction, convection and
radiation while convection and conduction in a heat exchanger usually occurs within each
fluid and through the wall separating the two fluids respectively. In heat transfer with mixed
fluids only convection mode occurs. The relation as steam is being injected and mixed with
for example cold make-up water can be described with equation 2 (Spirax Sarco, 2007).
To make the calculation simply we assume that the specific thermal capacity (Cp) of the
product is exact the same as the cold make-up water and that there are no heat losses during
the mixture.
( ) (2)

4
3.3 Steam system
Steam is the most widely used energy carrier in processing plants for conveying heat over
distances. Without any expensive circulating pumps, steam is distributed by itself along a line
due to pressure drop. In Mondi Dynäs steam is utilized primarily for two reasons;
To produce electric power in the back pressure turbine
To supply heat for heating processes
The produced steam is distributed in various processes throughout the mill. Because there
are different heat demanding systems in the mill there are thus different pressurized steam
lines. The steam lines3 are; high-high pressure (HHP-steam, 70bar), high pressure (HP-
steam, 40bar), middle pressure (MP-steam, 11bar) and low pressure (LP-steam, 4bar).
These lines are coming from three steam producers, which each work separately and
independently of each other.
The recovery boiler (RB) is the largest steam producer in the mill and uses black liquor as
fuel. The produced smelt when black liquor is burned is dissolved in weak white liquor to
produce green liquor. The green liquor is then converted to white liquor in the white liquor
preparation process. White liquor is a valuable and essential substance due to its pH-value
and must be recovered to be used in the process of digestion of wood chips. The produced
HHP-steam from the RB is first used in a back-pressure turbine for production of electricity.
After the steam has been expanded to MP-steam and LP-steam - quantities of steam in both
pressure lines are distributed in the steam network for process heating.
The current turbine has a certain thermodynamic requirement for the inlet steam properties.
The maximum steam inflow capacity of the turbine at the moment is 171 tons/hour, but it will
be increased to 195 tons/hour in the upcoming ‘turbine boost’ project. If more steam is being
produced in the RB than the maximum inflow of the turbine, the excess steam will pass the
turbine and enter the HP-steam line. As the HP-steam line connects the RB, bark boiler (BB)
and the accumulator tank, the steam flow can go in both directions. If there is an excess
production of steam in the RB, a quantity of steam will be consumed for sootblowing of the
RB boiler tubes, while the rest will be accumulated in the steam accumulator tank together
with produced HP-steam from the BB. If there is no, or only small amounts of excess steam
passing the turbine, steam from the BB will always be utilized for sootblowing. If there is an
3 In reality the pressure lines are somewhere around 65 bars, 36,5 bars , 9,5 bars and 3,5
bars respectively due to variation in electric production in the turbine.

5
excess production of steam in the BB, this will also be accumulated in the steam accumulator
tank.
The BB is the second largest steam producer in the mill, where bark is mostly combusted to
produce HP-steam. The bark comes for the most part from de-barking process, but in cases
of low reserves, wood chips are sometimes burned. The BB is an integrated bark and oil
burner for which the oil burning is used during high production rates and during startups of
the boiler. The oil burners start to distribute oil in the combustion chamber at a required
steam production rate, somewhere around 30-35 tons/h or during boiler startups. This is
because of the high moisture content of the bark (58-60 %). The produced HP-steam is
consumed for sootblowing of the recovery boiler tubes and some steam is stored in the steam
accumulator tank for usage during higher steam demanding periods in the digester process.
The BB operates as a buffer to the RB during high production rates when the steam from the
RB is not sufficient.
The third boiler of Mondi Dynäs is the non-condensable Gas Boiler (GB), where extracted
gases from the digester process and the evaporation process are burned to produce MP-
steam. The evaporated steam/gas mixture from the evaporation process is sent to a stripper
which separates and extracts the inert gases to be burned in the GB to produce MP-steam.

6
3.4 Condensate system
The idea of the condensate system is simple. As the steam passes through the system to
various steam users, it changes state to condensate as it releases its energy (sensible &
latent). From each sub-processes, some of the condensed steam is recovered in condensate
recovering vessels within the process, e.g. in the PM. These vessels are in turn connected to a
main collecting condensate tank, the ‘condensate recovery tank’ (06-Ci011). The recovered
condensate is sent to a larger ‘condensate tank’ (26-CI015) so it can be distributed to the feed
water tanks for further generation of steam and to complete the S&C loop.
If steam is being utilized directly (consumed) in a process, no condensate will be recovered.
However, if the steam is being utilized indirectly (used) in a heat exchanger, the condensate
may be recovered and sent to the ‘condensate recovery tank’. The lost quantity of S&C will be
added from the demineralization plant and is called make-up water.
3.5 Free blowing of excess steam
Due to high moisture content in the bark, the burning of bark must start with heavy oil
during startups. As the BB reaches a minimum level where bark burns constantly by itself,
the oil burners are shutdown. It is difficult for the BB to lower the combustion rate below this
level (without oil burning) and is thus forced to keep the bark burning to prevent boiler
shutdowns. This means that large amounts of bark must be burned to keep up the fire. As a
result of more energy is transferred to the boiling tubes, consequently more mass rates of
feed water must be sent to cool these tubes and therefore produces equal amount of steam.
So the steam production in BB is limited under a certain rate and can only be increased above
this point with current bark.
Figure 1 shows trends in four processes during a normal production rate. These are steam
production in bark boiler, steam used in digester process, quantity of free blown steam
(LP-steam) and accumulator level.

7
Figure 1. Time dependent variation of steam production and consumption in four different processes in the paper mill.
Clearly there is an excess steam being free blown during times when the demands of steam to
the digesters are minimized (dale). This is because the produced steam from the BB is
enough to satisfy the digesters and to charge the accumulator tank.
As there is a higher requirement of steam (peak) in digester, steam from the accumulator as
well as the produced steam from BB is used. At the end of the bigger peak (beginning of the
lower peak) discharging of steam from the accumulator is stopped (reduced in pressure),
instead it is recharged for next higher peak (increased in pressure). When the accumulator is
full (82 %4) the excess steam being produced from now on is blown out until the upcoming
higher peak and so on. The accumulator plays therefore an important role when there are
variations in the production rate, but due to its low steam storage capacity it cannot always
handle high production rates well enough and needs to be recharged quickly. After full charge
the excess steam has to be released into the atmosphere, leading to high steam losses.
4 The space above the water level is for charging the accumulator with pressurized steam
0
10
20
30
40
50
60
70
80
90
22:48 00:00 01:12 02:24 03:36 04:48 06:00 07:12 08:24
Ste
am [
ton
/h]/
Acc
um
ula
tor
leve
l [%
]
Time
15 per. glid. med.(Accumulator level)
2 per. glid. med.(Steam to digerster)
15 per. glid. med.(Free blow ofsteam)
15 per. glid. med.(Steam prod. In BB)

8
4 Results & Discussion
Figure 2 illustrates a sankey mass flow chart based on collected and calculated data in table 3
and 4 in appendix. The chart describes both production and consumption of steam
throughout the plant. The flow lines are colored differently based on steam pressure and
physical state. The lowest flow rates (<0,3 ton/h) are colored black. Processes that extract
steam or condensate from the loop system are drawn with a line to the sewer and atmosphere
indicator, (Y) and (//) respectively. The chart gives an overview of the current situation and
can be used as a platform for further analysis and improvements of the S&C loop system, or
in education purposes.
The total average recovering rate of condensate was 129,5 ton/h and about 73 ton/h was
additionally produced in the demineralization process for the make-up of the extracted S&C.
The largest contributors to this high make-up water were the free blowing of excess steam,
sootblowers, PM6, de-aerating process of RB and BB & GB feed tanks, digester process and
the leakages in the S&C network flow. The five first processes accounted for 26,3 %, 16,6 %,
15,6 %, 13,3 % and 8,4 % of the make-up water. The sixth is a bit harder to quantify but
should be more than 9 %. These six processes together stands for about 31 % of total loop
flow, i.e. condensate return plus make-up water.

9
Figure 2. A macro schematic overview of steam and condensate loop system during a normal production rate

10
4.1 De-aerator
This is the fourth largest contributor to the S&C extraction. Within the feed water system the
losses of condensate occur as the make-up water is heated with the released de-aerator gases.
There is no measurement unit of the vented flow from the de-aerator exhaust pipe. Based on
the incoming flow quantities and outgoing quantities of the feed tank, this vented flow can be
evaluated. The difference between these flows from the BB & GB feed tank was determined to
7,2 ton/h while for the RB feed tank it was 2,5 ton/h.
The exhaust de-aerator pipe of the RB feed tank can be seen and measured in field as the
condensed vented mixture from make-up water pre-heater is connected directly to the sewer
as shown in figure 3.
Figure 3. Drainage pipe flushing condensate produced in the de-aerator into the sewer

11
During the investigation of the S&C loop system, the de-aerating venting flow of BB & GB
feed water tank seemed very high. The high flow rate couldn’t be verified by the operators,
because there is no measuring flow indicator and due to the difficulty of seeing the flow. The
de-aerator venting pipe of BB & GB feed tank is connected to the chimney, making it difficult
to measure the exhaust flow, compared to the de-aerator pipe of RB feed tank. After a further
inspection of this venting pipe, it seemed that the regulating exhaust flow valve showed in
figure 4 was fully open and there where loud noises coming from the pipe. This indicated that
the flow sensors were working properly and large venting flows were lost from the S&C loop
system. This valve was probably forgotten during a maintenance stop.
Figure 4. De-aerating valve of bark boiler and gas boiler feed tank that was unintentionally left open.

12
4.2 Paper machines (PM)
This is the third largest contributor to the S&C extraction. About 48,3 ton/h of steam was
used within PM6 and only 36,9 ton/h of condensate was recovered. The return rate of
condensate was thus about 76 %. Most of the condensate loss was due to bad operation
between the condensate collecting tanks in steam groups (drying section) and the main
condensate collecting vessel 20-Ci058. The vessel produces large amounts of flash steam
since various condensate lines are connected to it. The flash steam is sent to a heat exchanger
(VVX003) for cooling with cold raw water so it can be returned to the condensate system.
During the investigation, the heat exchanger was damaged and raw water was leaking into
the condensate tank and making it contaminated. Contamination of condensate or steam for
that matter can affect the operation of the equipments along the loop system due to the
possibility of increased coating. To prevent the contamination, the heat exchanger flash
steam pipeline was closed and the drainage line of 20-Ci058 was open to the sewer, see figure
5. The largest estimated condensate loss from the 20-Ci058 was measured to 5 m³/h. This
flow varies considerably depending on the paper production.
Figure 5. Condensate loss from drainage line of 20-ci058 in paper machine 6
Additional variable drainage flow is from the condensate collecting tank, 20-Ci054. This tank
collects the produced condensate in the drying cylinders so it can be transported to the 20-
Ci058. As there is variation in paper production (50 gram, 80 gram etc.) in the paper
machine there is thus variation in pressure in the drying cylinders. Low production causes a
low differential pressure over the cylinder which makes it hard to blow out the condensate.
To make up for this, the flash steam is sent to the VVX002 which in turn gives large
quantities of condensate to the 20-Ci054. During the measuring day, the condensate pump
motor was malfunctioning and couldn’t pump back condensate to the 20-Ci058. This

13
condensate was instead sent directly to the sewer with a volume flow of 3,6 m³/h, see figure
6.
Figure 6. Condensate loss from drainage line of 20-ci054 in paper machine 6
Another valuable loss occurs in the Aquatrol system within the PM’s. Aquatrol system is used
to set a uniform moisture profile of the paper sheet between the dryer groups. The water in
Aquatrol has to be clean to prevent clogging of spraying nozzles. For such reason, about 1
m³/h (Bylund, 2013) of demineralized water and 1,8 m³/h (Bylund, 2013) of pure condensate
is utilized in the PM5 & PM6 respectively. Other locations within the PM’s where smaller
quantity of condensate are lost is at the drainage pipe of the PM5 condensate tank, 21-Ci054
and from steam traps, leaking/open drainage valves, steam leaks in pipelines etc.
Approximately 1 m³/h was measured from 21-Ci054, while no other losses in field could be
measured from the steam pipe network. In total, PM5 and PM6 lost condensate at an average
rate of 2 ton/h and 10,4 ton/h respectively according to field measurements while the PI
sensors showed losses of 3,2 ton/h from PM5 and 11,4 ton/h for PM6. Assuming that the
collected values from PI sensors were correct, it means that the un-measured
condensate/steam losses in field represents 1,2 ton/h and 1 ton/h in PM5 and PM6
respectively. These losses could be related to the above mentioned smaller losses. Pictures
from such losses are presented in chapter 7.2 in appendix. If 10,4 ton/h of condensate was
recovered in PM6, the returning rate would increase from 39,9 ton/h to 47,3 ton/h. This
means that PM6 would have a returning rate around 97,5 %, compared to the current 76 %.

14
4.3 S&C pipeline system
The losses from these sources were most difficult to quantify. There are several steam traps
and drainage valves throughout the S&C loop system. Drainage valves are used to drain the
condensate from the steam network during startup of the steam line system. Steam traps on
the other hand are used to collect condensate from the pipelines upon cooling of pipes and
valves due to thermal losses (e.g. heat radiation). Many of these are not reconnected to the
condensate return line as they are assumed to constitute small losses. Occasionally drainage
valves of this type might be left open after the startup. One such valve line can be seen in
figure 7.
Figure 7. Condensate drainage pipe being left open in paper machine 5
Figure 8 and 9 are two of the larger un-reconnected drainage lines which release large
quantities of flash steam at startup as well as during steam production. The fact that the
drainage valve shown in figure 8 is at the lowest point of the steam distribution network area,
makes this line a significant source of condensate loss.
Figure 8. Drainage from the Zickesch -valve 06-PC130 (Pressure Controller)
15
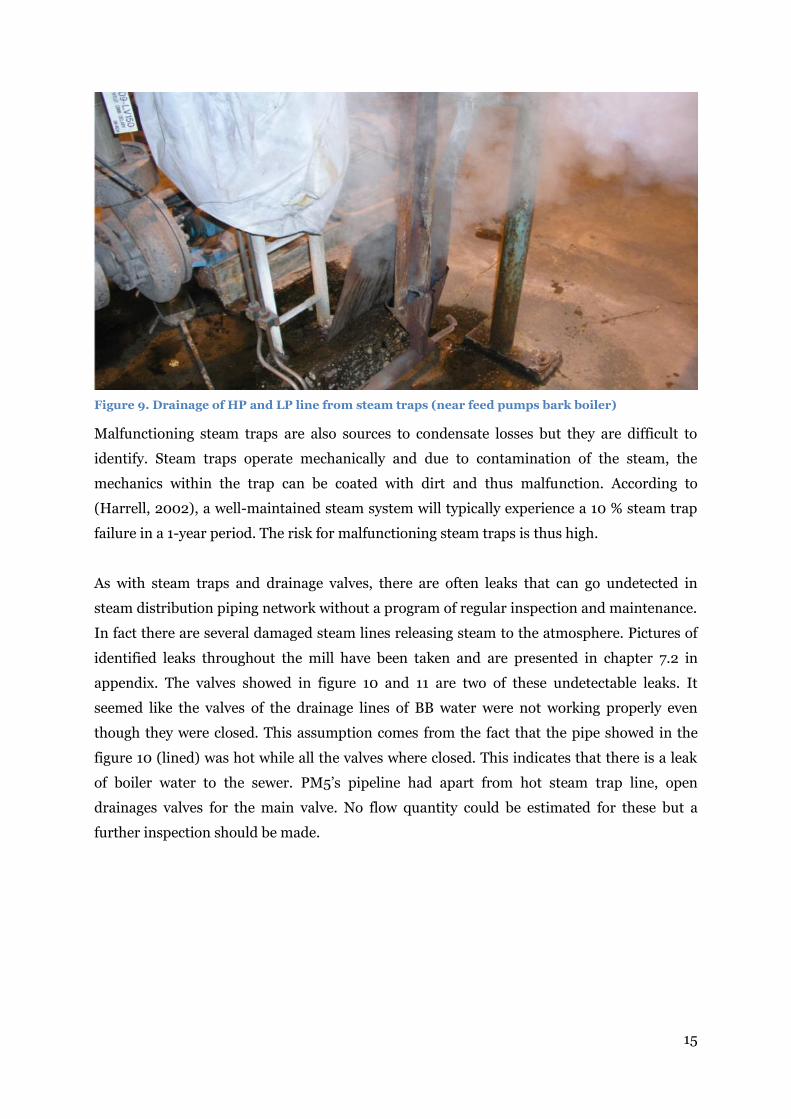
Figure 9. Drainage of HP and LP line from steam traps (near feed pumps bark boiler)
Malfunctioning steam traps are also sources to condensate losses but they are difficult to
identify. Steam traps operate mechanically and due to contamination of the steam, the
mechanics within the trap can be coated with dirt and thus malfunction. According to
(Harrell, 2002), a well-maintained steam system will typically experience a 10 % steam trap
failure in a 1-year period. The risk for malfunctioning steam traps is thus high.
As with steam traps and drainage valves, there are often leaks that can go undetected in
steam distribution piping network without a program of regular inspection and maintenance.
In fact there are several damaged steam lines releasing steam to the atmosphere. Pictures of
identified leaks throughout the mill have been taken and are presented in chapter 7.2 in
appendix. The valves showed in figure 10 and 11 are two of these undetectable leaks. It
seemed like the valves of the drainage lines of BB water were not working properly even
though they were closed. This assumption comes from the fact that the pipe showed in the
figure 10 (lined) was hot while all the valves where closed. This indicates that there is a leak
of boiler water to the sewer. PM5’s pipeline had apart from hot steam trap line, open
drainages valves for the main valve. No flow quantity could be estimated for these but a
further inspection should be made.

16
Figure 10. Closed drainage valves of bark boiler water
Figure 11. Steam trap line and drainage valves of paper machine 5 LP-steam pipe

17
4.4 Free blowing of excess steam
The largest loss from the S&C loop system is the excess steam being free blown due to
overproduction of steam in the BB. This loss is a result of high moisture content of the bark
but also due to the variation of steam requirements in the digester process. The free blown
excess steam cannot be prevented and thus the bark burners are forced to keep up and
running to feed steam to digesters whenever needed and to charge the accumulator tank
during low demand. When the accumulator tank is fully charged, the rest is free blown as
described previously. This free blown steam reached an average flow of 18,5 ton/h of LP-
steam.
4.5 Soot blowers
The second largest extraction from the S&C loop system are the soot blowers. During the
investigation period the soot blowers consumed 12,1 ton/h of HP-steam. This HP-steam
cannot be prevented as regular blowing of steam on boiler tubes is necessary to keep a good
heat transfer to the boiler water and to prevent boiler tube breakdowns.
4.6 Digester process
Fifth largest extraction from the S&C loop system is the digester process. This process
consumed about 6,1 ton/h of MP-steam for pre-heating the chips. This process requires MP-
steam consumption to pre-heat and impregnate the chips properly.
4.7 The blowdown condensate
The blowdown condensate (BDC)5 sources of the boilers were not mentioned previously as
one of the six largest contributors to production of make-up water. However these were
necessary to quantify as they extract condensate and thus affects the mass balance. The flow
extraction from the boilers were about 2 tons/h for RB and 0,5 ton/h for BB. The RB BDC
occurs continuously and is transferred to an expansion vessel so a quantity of pure steam can
be recovered through the flashing process. Equation (1) showed that only 35 % was recovered
as flash steam into the feed water tank from a pressure of 75 bars to 2 bars. The rest was
drained as condensate into the sewer with a saturation temperature of about 120°C and with
a flow rate of approximately 1,3 tons/h. No boiler condensate is recovered for the BB but
potentially it can recover 25 % as flash steam.
5 The blowdown condensate is the blown condensate from the bottom of the boiler dome

18
4.8 Extraction of S&C from its loop
Table 1 summarizes the located processes that extract condensate or steam from the loop
system. The flow rates are either collected from the PI-system or approximated from field
measurements6.
Table 1. Quantities of steam and condensate extracted from its loop
Location Process Media Measuring7 Flow
[ton/h]
Fraction of demin. W.
~ [%]
Steam network Excess steam LP-Steam 06-FI129 18,5 25
RB house (chap 4.5)
Soot blowers HP-steam 26-FI304 26-FI305
12,1 16,6
Feed water system
(chap 4.1)
Exhaust flow of BB & GB feed water tank de-
aerator Steam Calculation 7,2
9,9
S&C distribution pipeline network
(chap 4.3)
Un-closed drainage valves, leaking steam traps, leaking S&C lines, condensate quality measurements, etc.
S&C Calculation 6,8
9,3
Digester house (chap 4.6)
Pre-heating of chips MP-Steam Calculation 6,1 9,2
PM6 (chap 4.2)
Cistern - 20-Ci058 Condensate Beaker & timer
5 6,8
Cistern - 20-Ci054 Condensate Beaker & timer
3,6 4,9
Feed water system
(chap 4.1)
Exhaust flow of RB feed water tank de-aerator
Condensate Calculation 2,5 3,4
RB house Splitting + burned thick
liquor heating Steam 06-FI140 2,4
3,3
PM6 (chap 4.2)
Aquatrol sprayers Condensate Measured 1,8 2,5
RB house (chap 4.7)
RB BDC Condensate Calculation 1,3 1,8
PM5 (chap 4.2)
Aquatrol sprayers Demin. water Measured 1 1,4
Cistern - 21-Ci054 Condensate Beaker & timer
1 1,4
Caustici. process Causticising process MP-Steam 02-FI108 0,9 1,2 S&C distribution pipeline network
Excess steam MP-Steam 06-FI149 0,7 1
BB house (chap 4.3)
Drainage in HP & LP line Condensate Assumption 0,7 1
BB house BB BDC Condensate 06-FC341 0,5 0,7 RB house Preheat of black liquor Condensate 26-FI230 0,3 0,4
Digester house Resin boiling process MP-Steam 16-FI135 0,3 0,4 Evaporator
house Flash steam, effect 1 to 2
Flash steam Calculation 0,2 0,3
BB house – Ci011 Leakage from valve
06-v195 Condensate
Beaker & timer
0,1 0,1
Summation ~73 100
6 The density of condensate is assumed to be 1 ton/m³
7 FI and FC is a tag name in PI-system for Flow Indicator and Flow Controller

19
A mass flow of 73 ton/h of make-up water was added into the loop system, but only 66,2
ton/h was identified as extracted during the investigation. 6,8 ton/h of steam/condensate
could therefore not be identified and was thus assumed to constitute of various leaks in the
steam piping network, e.g. un-closed drainage valves, leaking steam traps, leaking
steam/condensate lines, condensate quality measurements, etc.
20
4.9 Minor Improvements
This chapter proposes some possible minor intervention measures that could increase the
return rate of condensate and/or decreases the production of demineralized water.
4.9.1 Feed water system
De-aerator venting flow in the feed water system is crucial to have a good quality of the feed
water to the boilers. The venting flow for the BB & GB feed tank was estimated to 7,2 ton/h.
This flow can be reduced to about 1,5 ton/h without risking a bad water quality. This is
because the incoming condensate from the condensate tank 26-Ci015 is already being de-
aerated before it is sent to this feed tank and there is thus no need for higher venting flows.
To prevent the current high venting flow of the BB & GB feed water tank and hence save 5,7
ton/h, a dimensioned orifice plate should be mounted in the pipe, likewise the RB feed tank.
After the installation of the plate, the regulation of the vented flow would no longer be an
issue as it would flow constantly. The expensive demounted valve should be stored in the
stock to be used in another project.
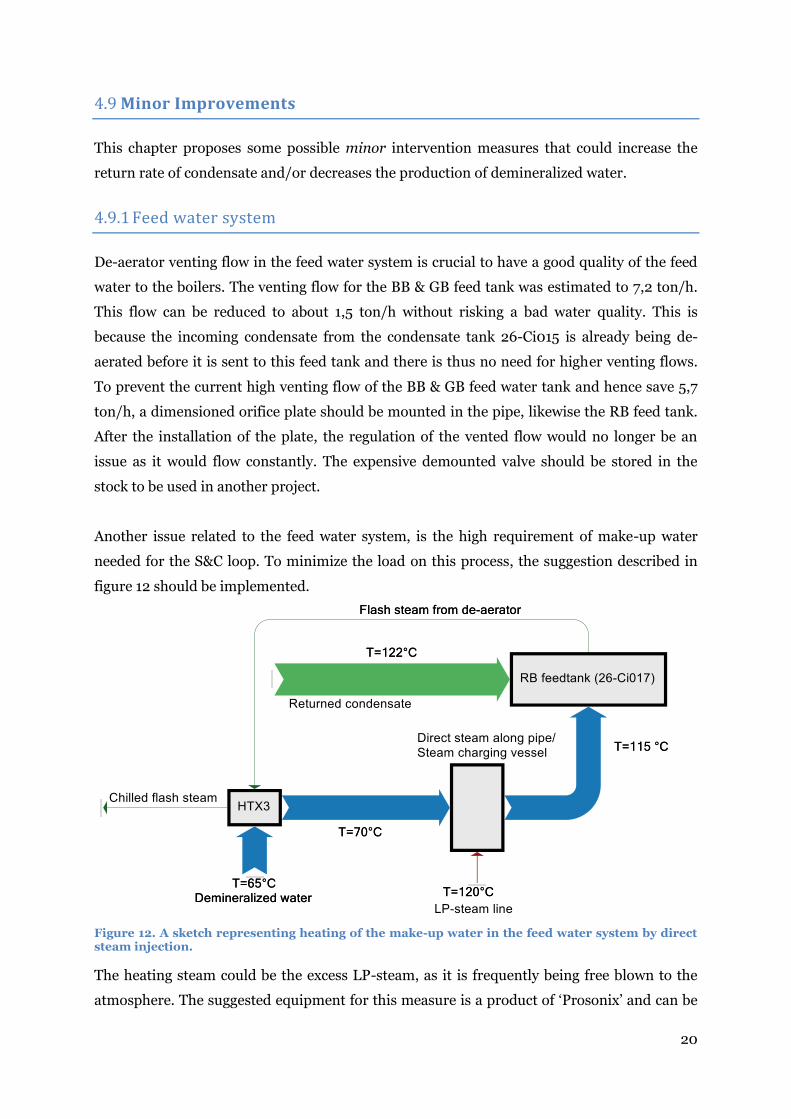
Another issue related to the feed water system, is the high requirement of make-up water
needed for the S&C loop. To minimize the load on this process, the suggestion described in
figure 12 should be implemented.
Figure 12. A sketch representing heating of the make-up water in the feed water system by direct steam injection.
The heating steam could be the excess LP-steam, as it is frequently being free blown to the
atmosphere. The suggested equipment for this measure is a product of ‘Prosonix’ and can be

21
seen from figure 13 for the case of injecting the steam directly along the pipe or in figure 14
for the case of injecting it in a vessel.
Figure 13. Principal image of the ProSonic heater (Pro Sonix, 2014).
Figure 14. J-Series Jet Sparger - Tank Mount On/Off Operation (Pro Sonix, 2014)
22
The ‘Jet sparger’ could be mounted in a separate implemented charging vessel or be
mounting directly on the feed water tank. The first suggestion is to be preferred as the make-
up water is much colder and thus has more tendency to absorb the energy from the LP-steam.
This improvement is relatively cheap since no heat exchangers are needed.
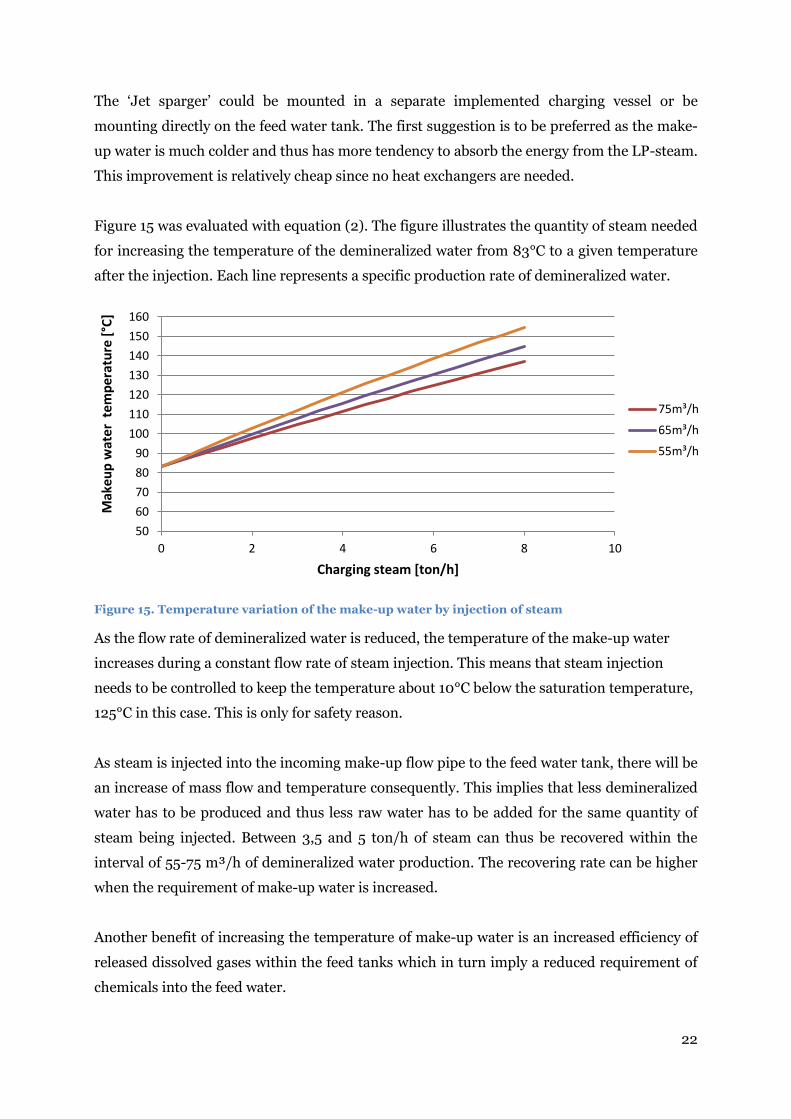
Figure 15 was evaluated with equation (2). The figure illustrates the quantity of steam needed
for increasing the temperature of the demineralized water from 83°C to a given temperature
after the injection. Each line represents a specific production rate of demineralized water.
Figure 15. Temperature variation of the make-up water by injection of steam
As the flow rate of demineralized water is reduced, the temperature of the make-up water
increases during a constant flow rate of steam injection. This means that steam injection
needs to be controlled to keep the temperature about 10°C below the saturation temperature,
125°C in this case. This is only for safety reason.
As steam is injected into the incoming make-up flow pipe to the feed water tank, there will be
an increase of mass flow and temperature consequently. This implies that less demineralized
water has to be produced and thus less raw water has to be added for the same quantity of
steam being injected. Between 3,5 and 5 ton/h of steam can thus be recovered within the
interval of 55-75 m³/h of demineralized water production. The recovering rate can be higher
when the requirement of make-up water is increased.
Another benefit of increasing the temperature of make-up water is an increased efficiency of
released dissolved gases within the feed tanks which in turn imply a reduced requirement of
chemicals into the feed water.
50
60
70
80
90
100
110
120
130
140
150
160
0 2 4 6 8 10
Mak
eup
wat
er t
em
per
atu
re [
°C]
Charging steam [ton/h]
75m³/h
65m³/h
55m³/h

23
4.9.2 PM-Condensate tanks
The lost condensate from the 20-Ci058 and 20- Ci054 can be eliminated simply by investing
or repairing the VVX003 for Ci058 and by investing in a new pumping motor for the Ci054.
The condensate recovery in PM6 would then be increased with 8,6 ton/h (up to 90 % of
consumed steam). Further, regular inspections of the steam and condensate piping should be
performed to prevent mistakes with open valves.
4.9.3 PM-Dryer section
Yankee dryer head insulation
Installing insulations on the Yankee cylinder dryers head can reduce the steam use by 4-8 %
(Metso Paper Inc., 2009). This implies a MP-steam reduction from 34 to 32,6-31,3 ton/h for
PM6 and a LP-steam reduction from 26 to 25-23,9 ton/h for PM5. The insulation reduces
the heat losses from the cylinders and therefore spares more heat for drying of the paper.
The reduced MP-steam in PM6 could instead be converted to electricity in turbine.
Uniform profile controlling
A uniform paper sheet profile is controlled by Aquatrol sprayers which uses demineralized
water in the PM5 and pure condensate in PM6. The use of expensive condensate and
demineralized water can be replaced by filtering hot waste water from e.g. flash steam cooling
heat exchangers in respective PM’s.
Instead of controlling a uniform sheet profile by moistening, infrared drying can be used to
dry the paper sheet accurately and uniformly. The benefit of infrared drying would be a
reduced steam usage in the drying cylinders because the added moistening water is
eliminated and needs no longer to be evaporated.
The salient feature of introducing these measures is that the condensate and demineralized
water consumption would be eliminated, leading to a reduced production of demineralized
water with a rate of 1,8 and 1 ton/h respectively. The infrared technology would reduce the
load even more due to a minimized usage of drying steam, but then the disadvantage would
be an increased electricity use.
24
4.9.4 S&C pipeline system
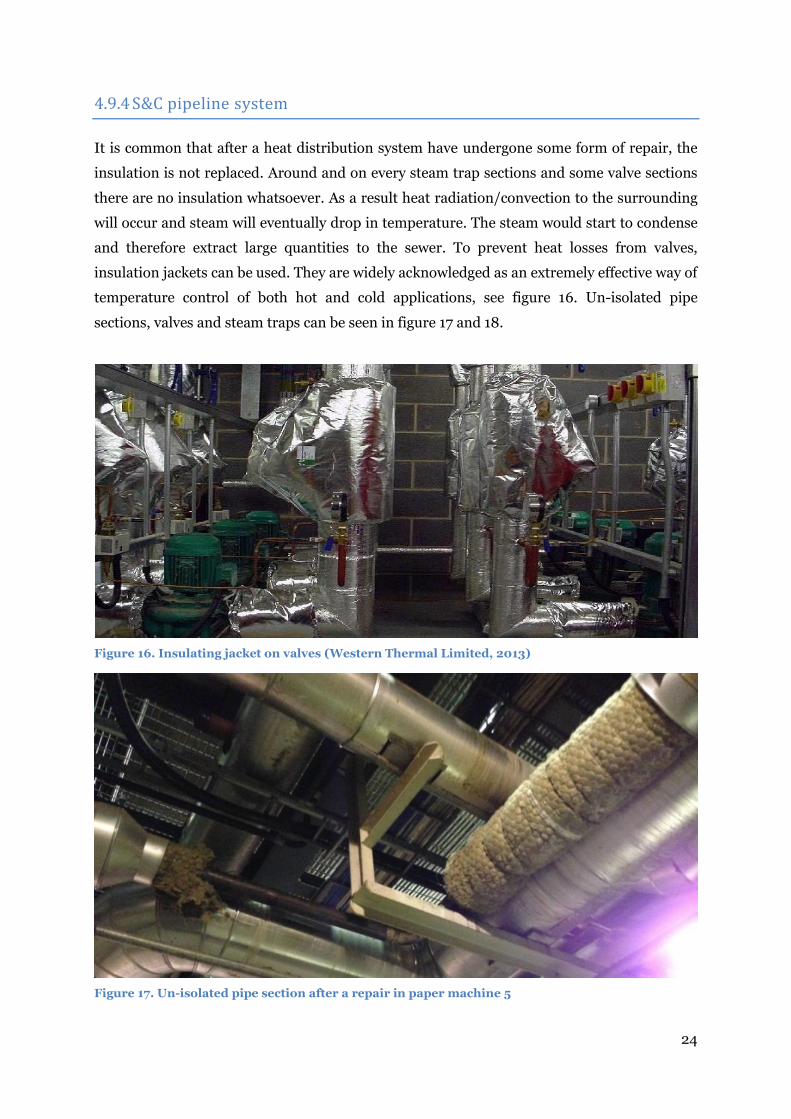
It is common that after a heat distribution system have undergone some form of repair, the
insulation is not replaced. Around and on every steam trap sections and some valve sections
there are no insulation whatsoever. As a result heat radiation/convection to the surrounding
will occur and steam will eventually drop in temperature. The steam would start to condense
and therefore extract large quantities to the sewer. To prevent heat losses from valves,
insulation jackets can be used. They are widely acknowledged as an extremely effective way of
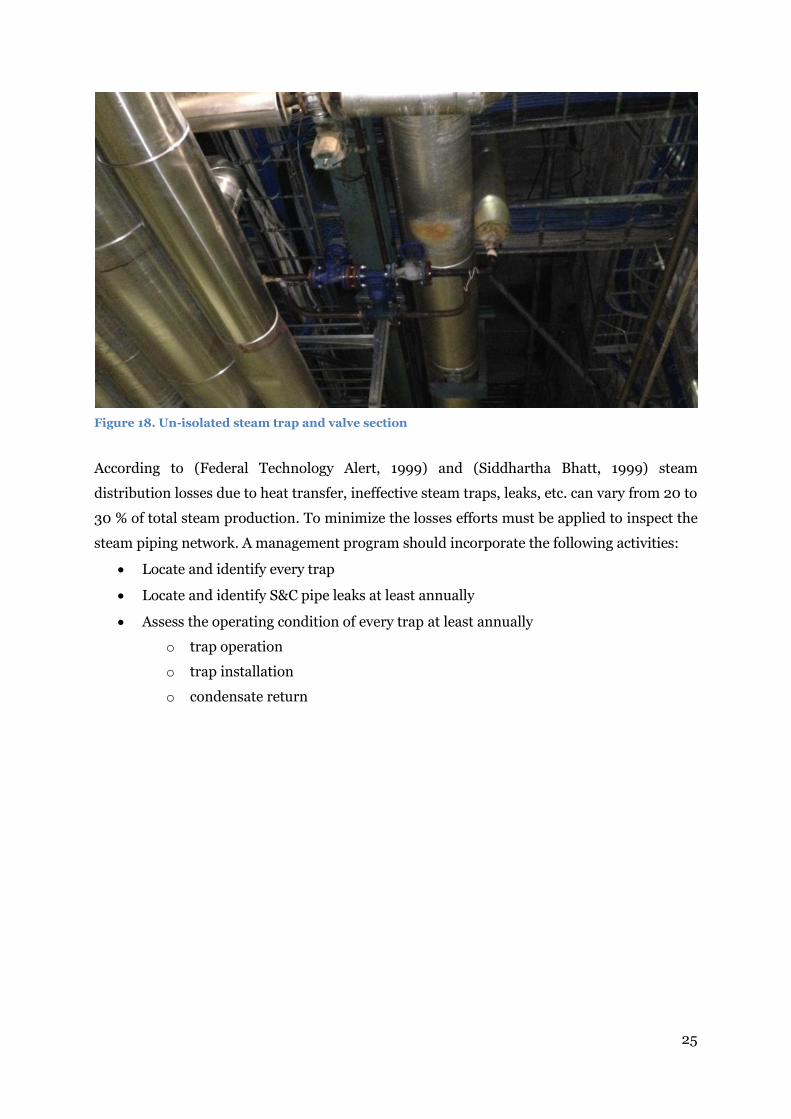
temperature control of both hot and cold applications, see figure 16. Un-isolated pipe
sections, valves and steam traps can be seen in figure 17 and 18.
Figure 16. Insulating jacket on valves (Western Thermal Limited, 2013)
Figure 17. Un-isolated pipe section after a repair in paper machine 5
25
Figure 18. Un-isolated steam trap and valve section
According to (Federal Technology Alert, 1999) and (Siddhartha Bhatt, 1999) steam
distribution losses due to heat transfer, ineffective steam traps, leaks, etc. can vary from 20 to
30 % of total steam production. To minimize the losses efforts must be applied to inspect the
steam piping network. A management program should incorporate the following activities:
Locate and identify every trap
Locate and identify S&C pipe leaks at least annually
Assess the operating condition of every trap at least annually
o trap operation
o trap installation
o condensate return

26
4.10 Major improvements
This chapter proposes two major intervention measures that could increase the return rate of
condensate and/or decreases the production of demineralized water.
4.10.1 Digester process
The returning rate of condensate in the digester process is around 78 %. MP-steam is
consumed in this process during the first stage to preheat the chips. This steam can’t be
recovered as it is being directly consumed in the process. To increase the return rate, the
process of preheating the chips must be changed. The produced flash liquor steam in the
strong liquor accumulator could replace the MP-steam. However the flashed liquor steam is
not enough to satisfy the digesters. A heat exchanger must be implemented in order to
produce the right amount of liquor steam. The current MP-steam could be replaced with the
excess LP-steam for use in the heat exchanger. The produced condensate in the heat
exchanger could then be recovered and returned into the loop system once again. In fact, a
bigger accumulator tank might also produce the quantity needed, as the evaporation area for
the flashing process is increased. This improvement measure could possibly reduce the added
make-up water by 8 %. In fact, this quantity of reduced MP-steam could instead be converted
into electricity in turbine.
4.10.2 The free blowing of excess steam
The blowing of excess steam on the other hand can simply be prevented by drying the bark
before burning it in the BB. The BB would then lower the burning rates without considering
boiler shutdowns. The steam production could then be regulated depending on the steam
needed in the digester process and in the steam accumulator tank. An investment of a bark
dryer would thus eliminate the free blowing of excess steam and reduce the added make-up
water by 25 %, with the possibility to sell the bark during low steam production.

27
4.11 Additional Improvement
By improving the heat integration with retrofitted heat exchangers, a total steam reduction of
15-25 % can be achieved (Lutz, 2008) (Bengtsson, Nordman, & Berntsson, 2002) (Fouche &
Banerjee, 2004). Retrofitted heat exchangers can be improved to use less steam by the
approach of pinch analysis. The main idea is to maximize process-to-process heat recovery
and reduce the external utility loads.
28
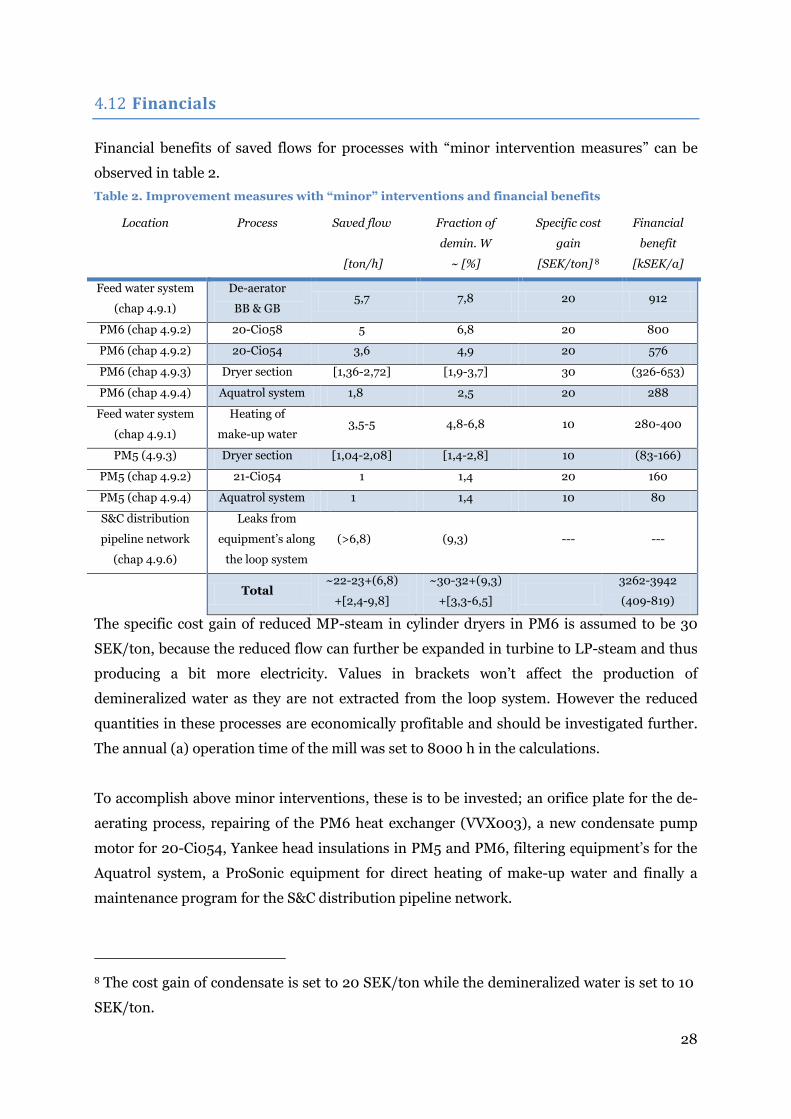
4.12 Financials
Financial benefits of saved flows for processes with “minor intervention measures” can be
observed in table 2.
Table 2. Improvement measures with “minor” interventions and financial benefits
Location Process Saved flow
[ton/h]
Fraction of
demin. W
~ [%]
Specific cost
gain
[SEK/ton] 8
Financial
benefit
[kSEK/a]
Feed water system
(chap 4.9.1)
De-aerator
BB & GB 5,7 7,8 20 912
PM6 (chap 4.9.2) 20-Ci058 5 6,8 20 800
PM6 (chap 4.9.2) 20-Ci054 3,6 4,9 20 576
PM6 (chap 4.9.3) Dryer section [1,36-2,72] [1,9-3,7] 30 (326-653)
PM6 (chap 4.9.4) Aquatrol system 1,8 2,5 20 288
Feed water system
(chap 4.9.1)
Heating of
make-up water 3,5-5 4,8-6,8 10 280-400
PM5 (4.9.3) Dryer section [1,04-2,08] [1,4-2,8] 10 (83-166)
PM5 (chap 4.9.2) 21-Ci054 1 1,4 20 160
PM5 (chap 4.9.4) Aquatrol system 1 1,4 10 80
S&C distribution
pipeline network
(chap 4.9.6)
Leaks from
equipment’s along
the loop system
(>6,8) (9,3) --- ---
Total
~22-23+(6,8)
+[2,4-9,8]
~30-32+(9,3)
+[3,3-6,5]
3262-3942
(409-819)
The specific cost gain of reduced MP-steam in cylinder dryers in PM6 is assumed to be 30
SEK/ton, because the reduced flow can further be expanded in turbine to LP-steam and thus
producing a bit more electricity. Values in brackets won’t affect the production of
demineralized water as they are not extracted from the loop system. However the reduced
quantities in these processes are economically profitable and should be investigated further.
The annual (a) operation time of the mill was set to 8000 h in the calculations.
To accomplish above minor interventions, these is to be invested; an orifice plate for the de-
aerating process, repairing of the PM6 heat exchanger (VVX003), a new condensate pump
motor for 20-Ci054, Yankee head insulations in PM5 and PM6, filtering equipment’s for the
Aquatrol system, a ProSonic equipment for direct heating of make-up water and finally a
maintenance program for the S&C distribution pipeline network.
8 The cost gain of condensate is set to 20 SEK/ton while the demineralized water is set to 10
SEK/ton.

29
With some larger intervention measures the extraction of free blowing excess steam and the
digester process steam can be prevented. Investment of a bark dryer should be economically
profitable as the excess steam could be eliminated and bark could possibly be sold (Bylund,
2013). A modification of the digester process is a huge intervention though and a further
investigation for such measure should be considered in future process upgrade. This might be
profitable because the eliminated MP-steam consumption could instead be converted into
electricity in turbine.
30
5 Conclusion
The topic of this paper was to investigate the possibility to increase the return rate of valuable
steam and condensate, in addition to reduce the load on the demineralization plant.
Extractions in investigated processes were either defined as lost or consumed. Consumed
quantities are needed in a process and cannot be recovered without any modification, while
lost flows are related to defect or improper functions or equipments. A flow chart was made
to visualize the process and extractions of steam and condensate.
Two of the largest processes which extracted steam from the loop system were the free
blowing of excess steam and the soot blowing steam. The extraction flows were 18,5 ton/h of
LP-steam and 12,1 ton/h of HP-steam respectively. These together stands for about 42 % of
water produced in the demineralization process. Consumed soot blowing steam cannot be
prevented as it is essential to maintain a good boiler condition. However, the intervention
measure for preventing free blowing of excess steam is possible by investing a bark dryer.
This improvement measure is in the major category and thus requires large and expensive
plant modifications. However this should be economically profitable as the load on the
demineralization plant could be reduced by 25 %, with the possibly to sell the dried bark
during low steam production. The digester process is the fifth largest contributor to the
extraction of steam in the loop system. Preventing the MP-steam consumption in this process
requires similarly large intervention measures. This improvement suggestion should be
considered in future process upgrades as it might be profitable because the replaced MP-
steam could instead be converted into electricity in turbine. Improvements with minor
interventions and investments costs were found to reduce steam and condensate
consumption by 22 - 23 ton/h. This implies a reduction by 30 - 32 % of water produced in
demineralization process, including an annual financial benefit of 3,3 - 3,9 MSEK.
Additionally 0,41 - 0,82 MSEK could be gained annually by improving the insulation on the
paper dryers. The load on the demineralization process would be further reduced if insulation
jackets were implemented on equipment’s along the steam lines. Inspection programs for the
S&C pipeline system should also be implemented for maintaining the best operation of the
S&C equipment’s and to aim for the highest possible return rates. Furthermore, the largest
drainage lines should be considered to be connected to the condensate return lines.

31
6 References
Bengtsson, C., Nordman, R., & Berntsson, T. (2002). Utilization of excess heat in the pulp
and paper industry––a case study of technical and economic opportunities.
Chalmers University of Technology, Department of Heat and Power Technology.
Göteborg, Sweden: Sevier, Applied Thermal Engineering.
Bylund, P.-O. (2013). Steam & Condensate system. Mondi Dynäs.
Federal Technology Alert. (1999). Steam Trap Performance Assessment, Advanced
technologies for evaluating the performance of steam. Richland, Washington:
DOE/EE-0193.
Fouche, E., & Banerjee, S. (2004). Improving energy efficiency in the forest products
industry. France: TAPPI, Norcross, GA, ETATS-UNIS (2002) (Revue).
Harrell, G. (2002). Steam System Survey Guide. Oak Ridge, Tennessee: The University of
Tennessee - Energy, Environment and Resources Center.
International Energy Agency. (2007). Tracking Industrial Energy Efficiency and CO2
Emissions. Stedi Media.
International Energy Agency. (2008). World Energy Outlook 2008. Paris: OECD/IEA.
Laukkanen, V., & Launonen, U. (2008). Onsite quality assurance of large flow and energy
measurements in paper and pulp mills. Rororua, New Zealand: Appita , Carlton, VIC.
Lutz, E. (2008). Identification and analysis of energy saving projects in a kraft mill.
Canada: Pulp and Paper Canada.
Metso Paper Inc. (2009). Yankee dryer head insulation. Retrieved December 20, 2013, from
Metso: http://www.metso.com/pulpandpaper/MPwTissue.nsf/WebWID/WTB-
091009-2256F-5F267/$File/Yankee%20dryer%20head%20insultation.pdf
Pro Sonix. (2014). Pro Sonix - Solution at the speed of sound. Retrieved 01 08, 2014, from
http://www.pro-sonix.com
Siddhartha Bhatt, M. (1999). Energy audit case studies I - steam systems. Trivandrum,
India: Elsevier, Applied Thermal Engineering.
Spirax Sarco. (2007). The steam and condensate loop - An engineer's best practice guide for
saving energy. Gloucestershire: Spirax-Sarco Limited.
Western Thermal Limited. (2013). Retrieved 12 20, 2013, from Jackets & Valve Covers:
http://www.western-thermal.co.uk/services/insulation-jackets-valve-
covers?eb7d00bf6a8d969ff914f21200fd7ad6=qgkxnrnalxzof

32
7 Appendix
7.1 Tables
Table 3. Average flows and total quantities during August
2013-08-01
Description Tag name
Recovery boilerFlow
[t/h]Total [ton]
Enthalpy
[MJ/ton]
Energy
[GJ]
Representation in
the loop
4bar steam to feed tank (26-Ci017) D1-06-FI137.BER:VAL 0,8 628 2 738 1 719 0,4%
Makeup water to feed tank (26-Ci017) D1-26-FI466.GIV:VAL 72,9 54 243 1 353 73 411 36,0%
Condensate to feed tank (26-Ci017) D1-26-FI465.GIV:VAL 89,0 66 247 505 33 455 44,0%
Feedwater to boiler D1-26-FI224.BER:VAL 160,3 119 288 505 60 241 79,2%
BDC to expansion vessel D1-26-FI251.GIV:VAL 1,6 1 216 709 862 0,8%
Total steam produced in RB D1-26-FITOT.BER:VAL 158,4 117 846 3 262 384 414 78,2%
Turbine 0
65bar steam to turbine D1-26-FI310.BER:VAL 151,3 112 542 3 262 367 111
11bar steam from turbine D1-06-FI150.BER:VAL 67,4 50 134 2 802 140 475 33,3%
4bar steam from turbine D1-06-FI127.BER:VAL 83,9 62 408 2 740 170 999 41,4%
Bark- & Gas Boiler 0
4bar steam to feed tank (26-Ci010) D1-12-FI104.GIV:VAL 0,0 32 2 740 89
Makeup water to feed tank (26-Ci010) Difference inbetween 0,1 100 1 353 136 0,1%
Condensate + makeup to feed tank (26-Ci010) D1-12-FI103.GIV:VAL 38,4 28 543 505 14 414 18,9%
Bark boiler 0 0,0%
Feedwater to BB D1-06-FC148:VAL 25,0 18 586 505 9 386
BDC to sewer D1-06-FC341:VAL 0,5 406 1 080 439 0,3%
Total steam produced in BB D1-06-FI101.BER:VAL 23,1 17 150 2 800 48 021 11,4%
Gas boiler 0
Feedwater to GB D1-06-FI283.GIV:VAL 0,9978 30,93084 505 16
Total steam produced in GB D1-06-FI240.GIV:VAL 1,8 57 2 790 158 0,9%
Soot blowing & Accumulation 0
RB sootblowing, sea side D1-26-FI304.BER:VAL 5,9 4 356 2 805 12 218
RB sootblowing, land side D1-26-FI305.BER:VAL 6,3 4 680 2 805 13 129
Total to sootblowing Sum from above 12,1 9 036 2 805 25 347 6,0%
Steam past turbine D1-26-FC301:VAL 19,9 14 805 3 260 48 266
Steam from BB + Steam past turbine D1-06-FI138.BER:VAL 43,0 31 956 21,2%
Total steam to accumulator Difference inbetween 7,7 5 730 2 805 16 073 3,8%
Middle pressure line 60 810 0
PM6 D1-20-FI100.BER:VAL 48,3 35 960 2 802 100 760 23,9%
Digester plant D1-28-FC277:VAL 28,1 20 920 2 802 58 619 13,9%
Causticising plant D1-02-FI108.GIV:VAL 0,9 647 2 802 1 813 0,4%
Splitting + burned thick liquor heating D1-06-FI140.GIV:VAL 2,4 1 784 2 802 4 999 1,2%
Blow out excess steam D1-06-FI149.GIV:VAL 0,7 493 2 802 1 381 0,3%
Clupak PM5 D1-21-FI101.GIV:VAL 1,0 759 2 802 2 128 0,5%
CI028 for heating D1-14-FI290.GIV:VAL 0,0 0 0 0
Resin boiling plant ( Harts kokeri) D1-16-FI135.GIV:VAL 0,3 246 2 802 688 0,2%
Low presure line 85 970
Effect #1 D1-09-FI100.BER:VAL 35,2 26 183 2 740 71 742 17,4%
PM5 - Drying cylinders, steam box… D1-21-FI102.GIV:VAL 26,1 19 428 2 740 53 234
PM5 - drying hood, office D1-21-FI290.GIV:VAL 1,1 795 2 740 2 178
Total LP-steam to PM5 Summation 27,2 20 223 2 740 55 412 13,4%
Stripper D1-09-FC341:VAL 6,2 4 635 2 740 12 701 3,1%
4bar steam to feed tank (RB) D1-06-FI137.BER:VAL 0,8 628 2 740 1 720 0,4%
4bar steam to feed tank (BB & GB) D1-12-FI104.GIV:VAL 0,0 32 2 740 89 0,0%
Blow out of excess steam D1-06-FI129.BER:VAL 18,5 13 785 2 746 37 853 9,1%
Debarking plant for heating D1-01-FI180.GIV:VAL 0,0 0 0 0
6bar steam for liquour preheating D1-26-FI230.GIV:VAL 0,3 260 2 763 719 0,2%
Recovered condensate
PM6 D1-20-FI114.GIV:VAL 36,9 27 459 482 13 235 18,2%
PM5 D1-21-FI245.GIV:VAL 24,6 18 275 470 8 582 12,1%
Effect 1 D1-09-FI119.GIV:VAL 35,0 26 037 470 12 227 17,3%
Digester D1-28-FI282.FLÖDE:VAL 22,0 16 373 719 11 769 10,9%
Stripper D1-09-FI266.GIV:VAL 6,2 4 635 470 2 177 3,1%
Total recovered condensate D1-26-FI461.GIV:VAL 129,5 96 338 505 48 650 63,9%
Average
2013-09-01

33
Table 4. Extraction flows and other
Other
Leakage from HP-network D1-06-FI184.BER:VAL 2,5 1 897 0 1,3%
Demineralized water produced D1-26-FI437.GIV:VAL 73,0 54 344 0 36,1%
Total to PM5 - Inclusive clupac steam D1-21-FI241.BER:VAL 27,7 20 642 2 750 56 764 13,7%
Total LP-steam preheating Summation 0,3 260 2 740 713 0,2%
Total MP-steam preheating Summation 3,6 2 677 2 802 7 501 1,8%
Injection water from BB & GB feed tank D1-06-FI146.GIV:VAL 4,5 3 358 0 2,2%
Steam cooling water from BB & GB feed tank D1-06-FI144.GIV:VAL 0 0,01
Raw water (40°C & cold) intake for
demineralizationD1-26-FI391.IND:VAL 103,4 76 931
From Accumulaotr to LP-line Diff./Digester-to Acc.
Extraction from the S&C loop 51 539
PM6 Sewer 11,4 8 501 505 4 293 5,6%
PM5 Sewer 3,2 2 367 505 1 195 1,6%
Digester plant Process 6,1 4 548 2 802 12 742 3,0%
Causticising plant Process 0,9 647 2 802 1 813 0,4%
Resin boiling Process 0,3 246 2 802 688 0,2%
Ci028 heating Process 0,0 0 2 802 0
Debarking plant Sewer 0,0 0 505 0
Sootblowing To atmosphere 12,1 9 036 2 805 25 347 6,0%
De-aerating RB feed tank To atmosphere 2,5 1 830 2 740 5 014 1,2%
De-aerating BB & GB feed tank To atmosphere 7,2 6 600 2 740 18 085 3,6%
Excess steam To atmosphere 19,2 14 278 2 740 39 120 9,5%
RB BDC 20% flash steam recovered 1,3 790 709 560 0,6%
BB & GB BDC sewer 0,5 406 1 080 439 0,3%
Total LP-steam preheating Sewer 0,3 260 2 740 713 0,2%
Total MP-steam preheating Sewer 2,7 2 030 2 802 5 687 1,3%
Flash steam from condensate tank (effect 1) to
effect 2Process 0,2 146 0,1%
Total reported extraction from the S&C loop 68,1 49 249

34
7.2 Figures
Figure 19. Steam leakage in the causticising process, near the gate to the bark boiler
Figure 20. Leakage from LP-steam line in paper machine 5
Figure 21. Flash steam from drainage lines and steam traps in paper machine 6

35
Figure 22. Possible flash steam being lost from steam traps in paper machine 5
Figure 23. Condensate quality measurement in paper machine 6
Figure 24. Drainage valve of 20-Ci054 in paper machine 6

36
Figure 25. Leakage of condensate from valve
Figure 26. Preheating of heavy oil in bark boiler – condensate to sewer