energy loss of 18 kev electrons in gaseous t and quench condensed d films
TRANSCRIPT
Eur. Phys. J. D 10, 39–52 (2000) THE EUROPEANPHYSICAL JOURNAL Dc©
EDP SciencesSocieta Italiana di FisicaSpringer-Verlag 2000
Energy loss of 18 keV electrons in gaseous T2
and quench condensed D2 films
V.N. Aseev1, A.I. Belesev1, A.I. Berlev1, E.V. Geraskin1, O.V. Kazachenko1, Yu.E. Kuznetsov1, V.M. Lobashev1,R.P. Ostroumov1, N.A. Titov1, S.V. Zadorozhny1, Yu.I. Zakharov1, J. Bonn2, B. Bornschein2, L. Bornschein2,E.W. Otten2, M. Przyrembel2, Ch. Weinheimer2,a, and A. Saenz3,b
1 Institute for Nuclear Research, Academy of Sciences of Russia, 60th October Anniversary Prospect 7a,117312 Moscow, Russia
2 Institute of Physics, Joh. Gutenberg University, 55099 Mainz, Germany3 Max-Planck-Institute for Quantum Optics, Theory Group, 85748 Garching, Germany
Received 24 August 1999
Abstract. Measurements of the energy loss of fast electrons at an energy of 18 keV have been performedon molecules of hydrogen isotopes, gaseous T2 and frozen D2. Whereas in the case of gaseous T2 thevalues of total inelastic cross-section (σtot, gaseous = (3.40 ± 0.07)× 10−18 cm2 for E = 18.6 keV), averageenergy loss (εgaseous = (29.9± 1.0) eV) and peak position of the energy loss spectra (ε1, gaseous = 12.6 eV)agree well with the expectations, the corresponding values for quench condensed D2 differ significantlyfrom the ones for gaseous T2. We observe a significant lower total inelastic cross-section (σtot, solid =(2.98±0.16)×10−18 cm2, for E = 18.6 keV) larger average energy loss (εsolid = (34.4±3.0) eV) and higherpeak position (ε1, solid = (14.1+0.7
−0.6) eV). These differences may be interpreted in terms of changes of thefinal state spectrum. A CI calculation for a D2 cluster shows indeed a clear shift of the excited states inagreement with the observation.
PACS. 34.80.Gs Molecular excitation and ionization by electron impact – 78.90.+t Other topics in opticalproperties, condensed matter spectroscopy and other interactions of particles and radiation with condensedmatter
1 Introduction
Interaction of electrons with molecular hydrogen is a clas-sical task of fundamental physics. In spite of significantefforts, a comprehensive solution of this problem has notyet been achieved. In particular, precise knowledge of thetotal and differential inelastic cross-section of multi keVelectrons interacting with molecules of hydrogen isotopesis of great importance for astrophysics, plasmaphysics andsome domains of nuclear physics. In this paper we reporton measurements of the inelastic cross-section of electronsscattered at an energy of around 18 keV from moleculartritium and deuterium in gaseous and solid state, respec-tively. These data are of crucial importance for a precisionanalysis of measurements of the β spectrum of moleculartritium in search for a non zero rest mass of the elec-tron antineutrino emitted simultaneously. Apart from thisproblem they are of self-contained value as stated above.
Besides measurements with low energetic electronsin the eV or few keV range in the past two measure-ments of the differential inelastic cross-section of ener-
a e-mail: [email protected] e-mail: [email protected]
getic (25 keV) electrons on H2 have been reported, one forsmall scattering angles θ ≈ 0.01◦ [1] the other in the range1◦ ≤ θ ≤ 10◦ [2]. Neither of them covers the full angularrange of the inelastic cross-section. Earlier measured en-ergy loss spectra for solid molecular hydrogen gave hintsto differ from that in the gaseous phase by a shift ofabout 1 eV towards higher energy losses [3,4]. Investiga-tions of the photoabsorption of VUV photons in films ofsolid molecular hydrogen or deuterium [5,6] show signif-icantly different spectra compared to the one in gaseousmolecular hydrogen. Although these spectra of solid filmsare not fully understood they exhibit structures in the14–20 eV range which have no parentage in the electronicexcitations of the isolated molecule.
The two experiments at Troitsk and Mainz presentedhere have been performed with spectrometers which alsoserved for the precision measurements of the β spectrumfrom T2 [7,8]. Both follow the same spectroscopic prin-ciple, namely, magnetic adiabatic collimation followed byan electrostatic filter (MAC E filter) which shall be ex-plained here in brief: electrons emerging isotropically witha broad spectrum from some source or target region withina strong magnetic field BS of order 1 T are guided alongthe field lines into a low field BA ≤ 1 mT which leads into
40 The European Physical Journal D
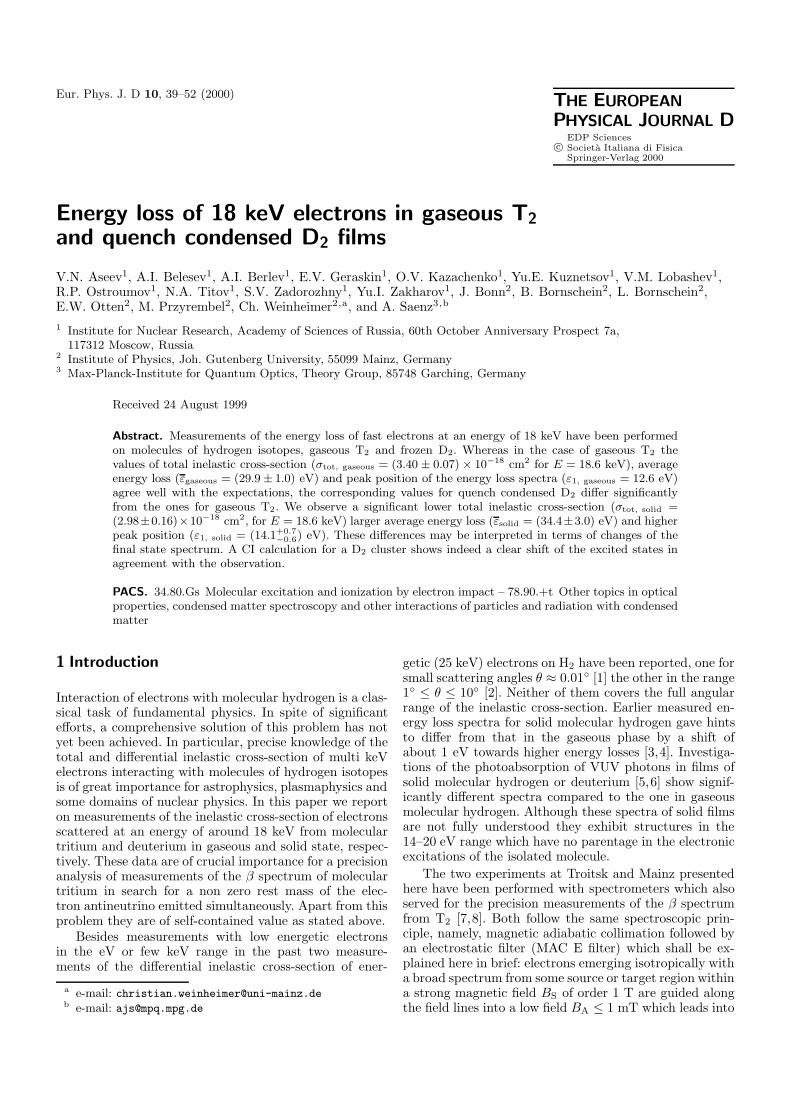
Fig. 1. Principle of a MAC E filter.
an electrostatic analysing potential U (see Fig. 1). Thosewith a longitudinal energy E‖ ≥ qU pass the barrier andare collimated magnetically by the field BD onto a solidstate detector. The extraordinary sharpness of the filterstems from the adiabatic transformation of the transverseenergy E⊥ of the cyclotron motion into longitudinal en-ergy E‖ along the field lines on the way into the BA region.Only E‖ is analysed by the electrostatic potential. A mag-netic mirror (pinch) between source and analysing regionwith a field BM > BS limits the solid angle accepted fromthe source or target region to a maximum polar angle
ϑS,max = arcsin(√BS/BM). (1)
The transmission function of the filter for monoenergeticelectrons with starting angle θ < ϑS,max from an isotropicsource of energy E rises from zero to one within a relativeenergy interval ∆E with
∆E/E = BA/BM. (2)
It is given as a function of U by
T (E, qU) =
0, E − qU < 0(1−
√1− E − qU
E
BS
BA
)(
1−√
1− ∆E
E
BS
BA
) , 0 ≤ E − qU ≤ ∆E
1, E − qU > ∆E.
(3)
Hence, the signal rate R is the integral of the transmittedpart of the spectrum S
R(qU) =∫ ∞qU
S(E)T (E, qU)dE. (4)
The main difference between the two set-ups regards theT2 source: Troitsk is using a long tube with gaseousT2, whereas Mainz has chosen a solid T2 film, quench-condensed on a graphite substrate. In spite of the weakmolecular van der Waals potential between hydrogen mo-lecules, this difference in phase may be accompanied by
some change of the energy loss spectrum of traversingelectrons. Therefore, it has to be measured in both phasesseparately. In Sections 2 and 3 we describe the measure-ments of the energy loss spectrum of fast electrons in thegaseous phase at Troitsk and in the solid phase at Mainz,respectively. Section 4 deals with a theoretical calculation,performed at MPQ (Garching), treating the difference be-tween the energy loss spectra in gaseous and solid T2.
2 Study of inelastic scattering of electronsfrom gaseous tritium
2.1 Experimental set-up
The objective of this experiment is a measurement of theintegral spectrum of energy losses for 18.6 keV electronspassing a gaseous T2 target. As mentioned above it hasbeen carried out at the “Troitsk ν mass set-up” whichrepresents an integral electrostatic spectrometer with adi-abatic magnetic collimation and a windowless gaseous T2
source [7]. The field maximum BM in the pinch is in therange of 6 T to 8 T, the field minimum BA in the analysingregion is chosen between 1.2 mT and 1.6 mT, providingan energy filter width ∆E = 3.5 eV at the given elec-tron energy. The fields are produced by superconductingsolenoids. Particular coils shape the field transition intothe analysing region of the filter. A cylindrical electrodein the center provides an analysing potential U with a con-stant top (∆U/U ≤ 2 × 10⁻⁵) over the full cross-sectionof its analysing plane.
To the side of the source the strong pinch field trans-forms smoothly into the weaker field 4–5 T via severalbents which allow to block the T2 gas from the spectrom-eter by differential pumping and LHe-cooled cryotraps.The main part of the T2 gas is contained in a 3 m longtube cooled down to 27 K in the field BS = 0.8 T. Thegas is fed into the center of the tube and pumped outat both ends through narrower tubes, 0.8 m long and re-duced by a factor of 6 in cross-section. Consequently, thefield has to be raised there by the same factor up to 5 Tin order to still contain the same magnetic flux tube asthe wider central section. Note, that the electrons are fi-nally guided within this flux tube from the source to thedetector. The T2 density decreases linearly along these dif-ferential pumping tubes by a factor of roughly 100. TheT2 gas is recycled to the inlet after recompression andpurification.
All the magnetic and electric fields of the set-up areadjusted to preserve adiabaticity of electron motion. Thedetector thus counts only electrons moving inside that sec-tor of the magnetic flux tube which crosses the detectorarea. The flux tube is adjusted as not to touch any wallsin the source (besides its rear part, obviously) nor in thespectrometer, and it provides (besides the broadening dueto the cyclotron radius) a strict point to point image fromthe rear of the source to the detector. From this mag-netic optics one derives the luminosity of the spectrometer,
V.N. Aseev et al.: Energy loss of 18 keV electrons in gaseous T2 and quench condensed D2 films 41
5
124 3
10
11 9
7
8
6
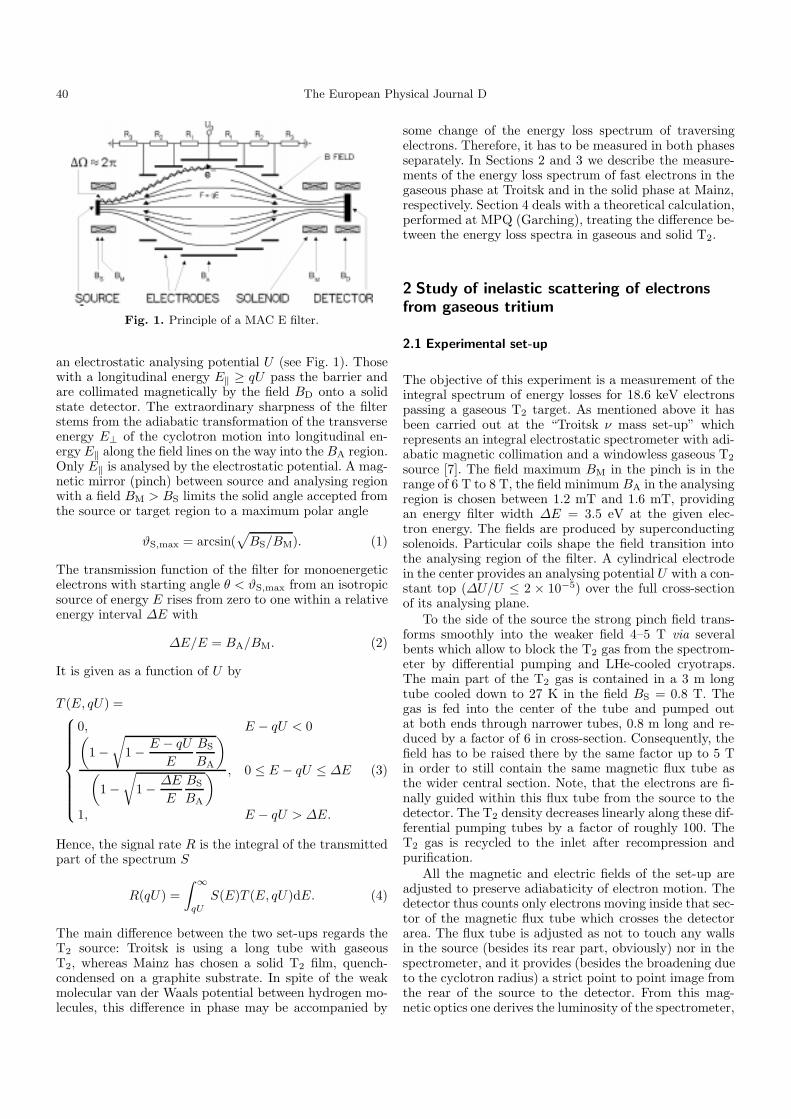
Fig. 2. Monochromatic electron source of Troitsk setup.1: Quartz tip with gold film, 2: nose of the electrode, 3: tubelightguide, 4: insulator, 5: ultraviolet lamp, 6: electron gun,7: deflection magnet, 8: focusing short solenoids, 9: solenoidsof the transport channel, 10: mercury diffusion pump, 11: mon-itor detector.
defined as the cross-section of the sourceAS times the solidangle of the analysed particle beam to be
L = AS(1− cosϑS,max)/2
= AS(1−√
1− BS/BM)/2. (5)
In order to measure the energy loss spectrum in the T2
gas, a monochromatic electron beam is fed from the rearinto the T2 source via a 1 m long and 1 cm wide transportchannel, kept in a guiding field of only 30 mT. The adia-batic transition into the much higher source field blows upthe solid angle of the injected electron beam to more then2π (i.e., the major part of the beam is reflected). There-fore the angular distribution of the beam inside the T2
target is almost isotropic with an accuracy of about 20%.This facilitates the calculation of the average path lengthof the electrons spiralling through the target. The electrongun is at 18 kV to 19 kV negative potential. Electrons areemitted by photo effect from a thin, transparent gold film(30 µg/cm2) on a quartz window placed at the tip of thecathode (see Fig. 2). It is illuminated from the rear withultraviolet light through a light pipe. The emittance ofthe gun is determined by the size and curvature of thecathode tip. It has been chosen such as not to touch thewalls of the transport channel to the source which isthe narrowest part in the whole beam optics consideringits low guiding field. Thus, the electron beam does notsuffer any scattering besides from the tritium gas.
Focusing of the electron beam onto the entrance ofthe transport channel is provided by two short solenoidswith a 30◦ bent provided by a transverse magnetic fieldin between. A diffusion pump at the place of the deflec-tion magnet (7 in Fig. 2) provides a further suppressionof tritium pressure by a factor of 100 with respect to thefirst pumping port at the end of the source. Previously,the electron gun was placed right there at a pressure ofaround 2× 10⁻⁵ torr. It caused a large contamination byelectrons emitted from the cathode by ion bombardment.These electrons had a much larger energy spread of about10 eV and occurred frequently as multi-electron events.
In the present configuration this fraction is decreased tothe percent level. Moreover, the deflection magnet pre-vents electrons from being temporarily trapped betweenthe tip of the cathode and the magnetic pinch. This ef-fect provoked multiple passage of electrons through thetarget before passing the pinch and thus distorted the en-ergy spectrum. With reversed field this magnet is usedin addition to deflect β particles emerging from the T2
source onto a detector in the second arm of the deflec-tion unit (see Fig. 2). In this mode it serves for moni-toring the source intensity in the course of measuring theβ spectrum.
The energy spread of photo electrons emitted from thegun is given by the difference Eγ −W , where Eγ is theeffective short wave length limit of the photons set bythe spectra of lamp emission and window transmission,respectively. W is the work function of gold (4.3 eV). Inaddition, the emission spectrum is softened by relaxationof the photo electrons within the gold film. Combiningboth spectral factors, one estimates an effective emissionwidth of the gun of 0.5 eV for a mercury lamp and 0.7 eVfor a deuterium lamp. The latter was preferred in all mea-surements for its better stability.
2.2 Measurements and analysis of the data
Measurements of the transmission spectrum of electronsthrough the T2 source were performed with fixed initialelectron energy E well above the endpoint of the tritiumβ spectrum at E0 = 18.570 keV. The spectrometer po-tential was scanned from a value slightly above the gunpotential into the tritium β spectrum down to 18.4 keV.At each voltage step the signal was measured for 5 to 10 s.The direction of scanning was changed periodically. Thefollowing measuring modes were performed sequentially:
mode 1: N1 counts collected with tritium in the sourceand the deuterium lamp on;
mode 2: N2 counts collected with tritium and lamp off;mode 3: N3 counts collected without tritium and lamp on;mode 4: N4 counts collected without tritium and lamp
off.
The count rate of electrons from the electron gun wasclose to 8 kHz. After each set of these 4 scans, the trans-port channel was closed by a valve and the β count rate ina reference point at 18.0 keV was measured as well as themass spectrum of the source. All data were corrected fordead time (4%). This procedure was repeated 6 to 8 times.Then the measurements were repeated at a different den-sity and tritium content of the source. The difference spec-trum N1−N2 represents the integral spectrum of electronsemitted by the gun and transmitted through the tritiumtarget as function of the filter potential U . The differenceN3 − N4 serves for normalising the electron beam inten-sity at empty source corrected for background. The slopeof this spectrum at the transmission point was used as anexperimental resolution function, being a convolution ofthe spectrometer resolution function (3), with the energy

42 The European Physical Journal D
18400 18500 186000.0
0.2
0.4
0.6
0.8
1.0
Tra
nsm
ittan
ce
Spectrometer voltage, V
18590 18600 18610 18620 18630 18640
0.6
0.7
0.8
0.9
1.0
1 2 3 4
Fig. 3. Electron transmission spectra measured with Troitsksetup. 1: Transmission spectrum without tritium, 2–4: spectraat various density and tritium percentage.
18300 18400 18500 18600 187000
2000
4000
6000
8000
Cou
nt r
ate,
Hz
Spectrometer voltage, V
18690 18700 18710 18720
3000
4000
5000
6000
7000
Fig. 4. Integral electron transmission spectrum measured withTroitsk setup with finer point density compared to Figure 3.
and angular distribution of the gun. The spectra of inte-gral energy losses are shown in Figures 3 and 4. All curvesshow very clearly a distinct shoulder which separates elec-trons having passed the source without losses from thosewhich underwent inelastic scattering. The no-hit transmis-sion coefficient is determined at the shoulder as
K = (N1 −N2)/(N3 −N4) = exp(−µσtot). (6)
Here σtot is the total inelastic cross-section, µ = ρl isthe effective column density of the tritium gas, correctedfor the spiral roundabout of the electron track throughthe gas. One thus obtains σtot = − ln(K)/µ. The preciseknowledge of the luminosity L of equation (5) as well as astrict fulfilment of the adiabaticity allows to calculate theaverage column density of hydrogen isotopes in the tubefrom a measurement of the β count rate in the referencepoint and of the isotopic composition of the gas as mea-sured by the mass spectrometer. At that point it should bementioned that the efficiency of the β detector amounts topractically 100% since electrons which are backscattered
Table 1. Results of total inelastic cross-section measurementsof 18.6 keV electrons in gaseous T2.
M [s−1] T% [%] ln(K) σtot
[10−18 cm2]
1 347.1±2.1 75.1±1.1 0.126±0.001 3.45±0.09
2 595.2±1.7 67.0±1.0 0.243±0.002 3.35±0.07
3 774.2±1.5 70.7±1.1 0.290±0.02 3.34±0.06
4 808.5±1.7 47.2±1.0 0.438 ±0.07 3.43±0.06
average 3.40±0.07
from its surface with some energy loss are repelled by theelectric field back onto the detector until they have lost allof their energy to the detector. The total column densityof hydrogen molecules is then given by
µ = M [2CδT%Ltot]−1. (7)
Here M is the β count rate at the reference point qUmon =18.0 keV, C = ln(2)T−1
1/2 = 1.79 × 10⁻⁹ s−1 is thedecay probability of tritium per unit time, taking intoaccount the final states, δ = (35/16)0.84
∑i Vi[(E0,i −
qUmon)/E0,i]3 is the ratio of counting rate at referencepoint (qUmon) to total rate in the spectrum, obtained byintegration of a classical Fermi spectrum. The sum runsover all final states i of the daughter molecule (T3He+),E0i is the β endpoint energy of the ith final state, Vi itspopulation probability. The factor 0.84 stems from theFermi function. T% is the isotopic tritium abundance inthe source. Ltot is the total luminosity (compare Eq. (5))which is used instead of L in the case of a complex sourcegeometry.
In calculating Ltot we have to take into account thata certain fraction of the source strength is contained inthe two differential pumping tubes of total length 1.6 mwhere the field is 5 T as compared to 0.8 T in the 3 mlong main source tube. According to equation (5) thisfraction contributes with a larger solid angle to the lu-minosity. Taking into account that the density in the firstamounts in average to 0.5 of the maximal value, we thusobtain Ltot = 0.79L0.8T + 0.21L5T. Corrections for thespiral roundabout of the track of gun electrons throughthe source were calculated with the same weights andamounted to 1.067. The statistical error was of order2 × 10−3. The scatter of data was dominated by fluc-tuations of the lamp intensity and errors of mass spec-trometry (2%). Correction to M due to selfabsorptionwas introduced in first order approximation and amountedto 1–3%.
Typical results obtained at different values of gas den-sity and tritium content are given in Table 1. For the totalinelastic cross-section of 18.6 keV electrons scattered frommolecular tritium and integrated up to a maximum energyloss of 200 eV, we obtain the final experimental results ofTable 1.
The final result σtot = (3.40 ± 0.07) × 10−18 cm2 isin good agreement with the theoretical value of 3.456 ×10⁻¹⁸ cm2 [9]. The contribution to σtot of scattering events
V.N. Aseev et al.: Energy loss of 18 keV electrons in gaseous T2 and quench condensed D2 films 43
0 10 20 30 40 50 60 70 80 90 1000.00
0.05
0.10
0.15
0.20
Am
plitu
de, a
.u.
Energy Loss, eV
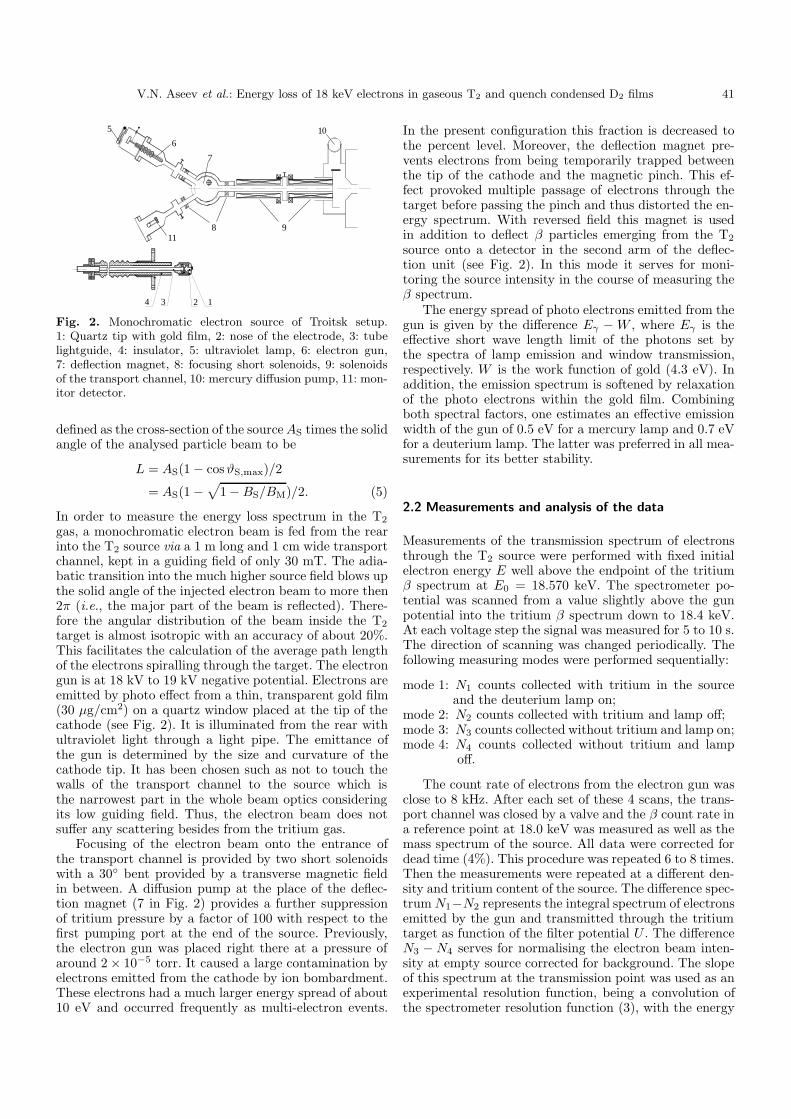
Fig. 5. The fitted energy loss spectrum for single scattering.
with energy losses higher than 200 eV are negligible withinpresent errors.
2.3 The energy loss spectrum
Integral spectra of electrons transmitted through thegaseous target of molecular hydrogen are shown inFigures 3 and 4 as function of the lower integration limitwhich is the filter potential qU . Differentiation of the spec-tra would yield directly the original energy loss spectrumas function of the energy loss ε, but meets significantdifficulties due to the discontinuity of the derivative at3 points. Therefore, we were forced to parameterise theshape of the energy loss spectrum, in accordance with thewidely adopted practise, and then to fit it to the experi-mental integral spectrum. In former papers [7,10] the en-ergy loss spectrum had been modelled by two Lorentzians:one for the excitation of bound electronic states up tothe ionisation energy of 15.45 eV and the second one forthe continuum. Whereas the Lorentzian meets the correctasymptotic ε−2 dependence for ionisation, we found thata Gaussian provides a better fit for the excitation spec-trum since it allows for a much sharper bent at the exci-tation threshold (see Fig. 5). Thus the shape of the energyloss spectrum for a single scattering within the target wastaken as:
f(ε) =
A1 exp
(−2(ε− ε1)2
w21
)for ε < εc
A2w2
2
w22 + 4(ε− ε2)2
for ε ≥ εc.(8)
The function f(ε) is normalised and describes the shapeof the inelastic cross-section:∫ E/2
0
f(ε)dε = 1 (9)
dσdε
= σtotf(ε). (10)
The parameters A1,2, ε1,2, w1,2 are the fit parame-ters describing amplitude, central position and width of
the Gaussian and Lorentzian, respectively. The matchingpoint εc is chosen by the fit in such a way that for thefitted couple of amplitudes A1 and A2 both parts of theenergy loss function have a smooth connection at ε = εc.The unphysical kink of the model spectrum at the match-ing point has little effect in practice since it is washed out– like any other spectral fine detail – by convolution withthe transmission function (3) (compare also the analysiswith other trial functions in Sect. 3.2). Satisfactory fitscould be achieved with ε1 = 12.6 eV within a range ofabout ±0.3 eV. Therefore ε1 was fixed to 12.6 eV for thefits. Note, however, that this fixing suppresses the correla-tion between the fit parameters and hence of the fit errorsby parts.
Finally, we have to include multiple scattering eventsin the function fitting the signal R(qU) of equation (4) bymodifying the transmission function which then reads
T ′(E, qU) =∫ E/2
0
T (E − ε, qU)
×(P0δ(ε) + P1f(ε) + P2(f ⊗ f)(ε) + . . .
)dε. (11)
Here Pi is the probability of an electron scattering i times;it is given by a Poisson distribution Pi = K(lnK)i/n!with K being the no-hit transmission coefficient1 ofequation (6). The folding symbol (f ⊗ f)(ε) stands for∫ E/2
0 f(ε − ε′)f(ε′)dε′. Multiple scattering was includedup to the 4th order. The fit was performed with the helpof the MINUIT program [13]. The input errors of the ex-perimental transmission signal were determined from thefluctuation of individual scattering points from the fittedcurve at energy losses above 150 eV where the signal be-comes practically flat. Results are presented in Table 2 forthe four sets of data, given in Table 1. The correspondingenergy loss function is shown in Figure 5.
The ratio of the excitation to the ionisation fractionof the total cross-section proved to be 51/49. This resultbarely depends on our particular choice of the model func-tions but can be read more or less directly from the inte-gral spectra of energy losses in Figures 3 and 4, which passthe 50% level just at the ionisation threshold. The resultis at variance with the usually adopted value of 40/60,but is in agreement with the measurement of the totalionisation cross-section of 18.6 keV electrons reported inreference [11]. The mean energy loss per inelastic collisionhas been derived from this measurement to be
ε = (29.9± 1.0) eV, (12)
which agrees with the expectation of reference [12]. Fi-nally we mention that the fit result of the Lorentzianamplitude meets asymptotically the corresponding in-elastic cross-section of quasi free nonrelativistic Møllerscattering [14]
dσdε≈ πe4
Eε2(13)
quite precisely.1 A detailed averaging of all different path lengths turned
out to make only a negligible effect.

44 The European Physical Journal D
Table 2. Results of fitting the parameters of the energy loss spectrum in gaseous T2.
Parameters 1 2 3 4 average
A1 [1/eV] 0.204±0.001 0.204±0.001 0.204±0.001 0.204±0.001 0.204 ± 0.001
w1 [eV] 1.87±0.02 1.83±0.04 1.83±0.03 1.78±0.05 1.85 ± 0.02
ε1 [eV] 12.6 12.6 12.6 12.6 12.6
A2 [1/eV] 0.0542±0.0005 0.0561±0.0005 0.0561±0.0007 0.0563±0.0005 0.0556 ± 0.0003
w2 [eV] 11.5±0.5 12.1±0.2 12.8±0.1 12.5±0.1 12.5 ± 0.1
ε2 [eV] 14.45±0.04 14.34±0.05 14.30±0.03 14.29±0.06 14.30 ± 0.02
χ2/d.o.f. 18.0/21 22.3/21 20.9/21 34.2/35
3 Energy loss measurement in quenchcondensed D2 films
3.1 Experimental set-up
The energy loss of electrons in solid deuterium was deter-mined using the set-up of the Mainz Neutrino Mass Ex-periment, an integral electrostatic spectrometer with adia-batic magnetic collimation [15] similar to the Troitsk setupbut using a solid T2 source instead, quench-condensed on ahighly oriented pyrolytic graphite substrate [8]. The fieldmaximum BM in the pinch is 2.2 T, the field minimumBA in the analysing region is 0.5 mT, providing a filterwidth of ∆E = 4.4 eV at the given energy according equa-tion (2). The source was placed in a field of BS = 1.1 T,thus limiting the maximum starting angle accepted by thespectrometer to ϑS,max = 45◦. The fields are produced bysuperconducting solenoids. A system of 27 cylindrical elec-trodes provides an analysing potential U with a constanttop in the center of ∆U/U ≤ 2× 10⁻⁵ over the full cross-section of its analysing plane.
3.2 Measurements and analysis of the data
Due to the presence of the substrate we cannot performa transmission experiment with an electron gun but haveto choose a radioactive source instead, namely K conver-sion electrons from 83mKr. The energy of the K32 conver-sion line (EK32 = 17.82 keV, with a Lorentzian width ofΓK32 = 2.83 eV (FWHM) [16]) meets the region of interestaround the endpoint E0 = 18.57 keV of tritium β decay.The sublimation characteristics of Kr and D2 allows toprepare in situ a 83mKr/ D2 sandwich by quench conden-sation [17]. The 83mKr gas is collected from the decay ofa 83Rb source [18]. The 83mKr halflife of 1.83 h allowsmeasurements with reasonable statistics without riskinglongterm contamination of the apparatus. After purifica-tion by a cryotrap the 83mKr gas was condensed on the1.8 K cold graphite substrate (HOPG) as sub monolayerwith a typical activity of 10 kBq. An absorber layer of D2
was then quench condensed on top of the krypton. TheD2 coverage µ, i.e. the product of the film thickness dand its molecular density ρ, was measured by laser ellip-sometry with a resolution of 4–8%. This relatively largeuncertainty was mainly due to imperfect flatness of the
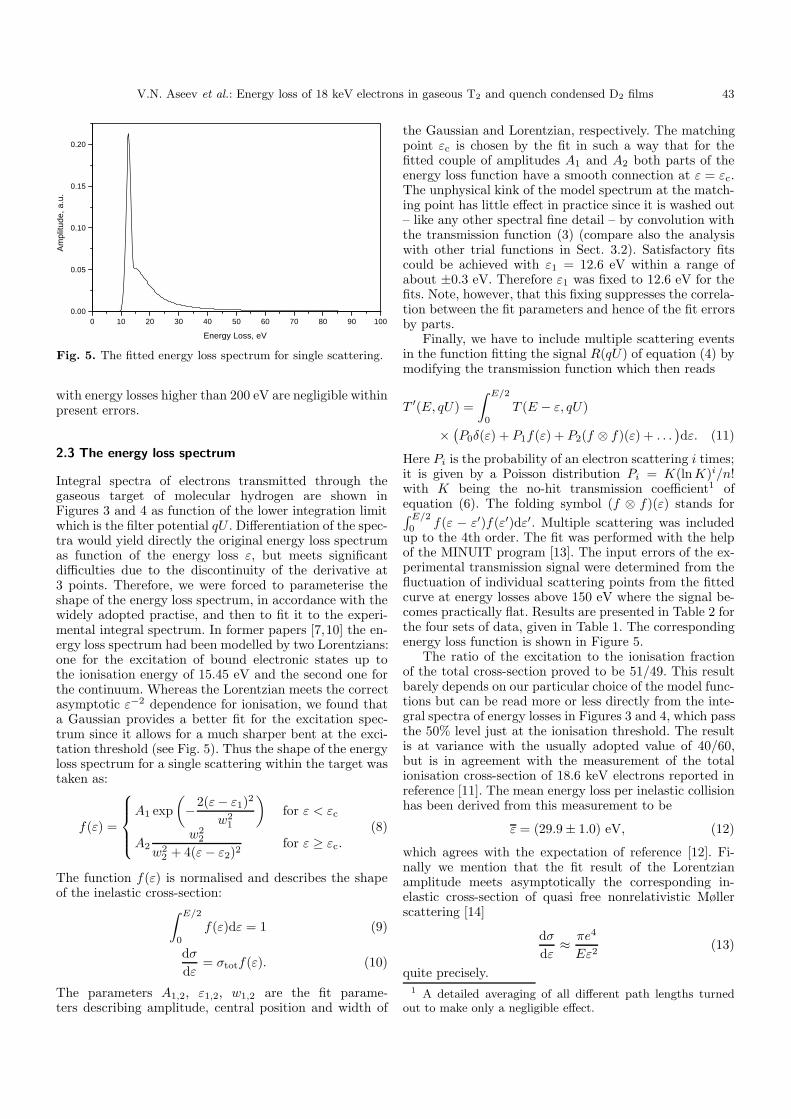
Fig. 6. Mainz integral energy spectra of electrons from a 83mKrK32 conversion source covered by various D2 absorbers (seeTab. 3). Open circles: 3.9 A−2, filled squares: 7.7 A−2, opensquares: 14.3 A−2, filled circles: no coverage. The lines showfits to the data using the energy loss function given by equa-tion (15). The spectra are normalised to equal K32 conversionline intensity.
substrate and reproducibility of the measurement. The el-lipsometry showed that our quench condensed D2 filmswere not closely packed. The measurement of the op-tical refraction index gave n(D2) = 1.1415 ± 0.0020 atλ = 632 nm, from which a density of ρ = 2.70× 10²²/cm3
can be calculated by Clausius Mosotti’s law. This value is11% smaller than expected for a closely packed D2 crystal(ρ = 3.02 × 10²²/cm3). The same holds for the T2 filmsused in our β decay measurements [8]. The D2 coveragewas varied for the different measurements between 4 and14 molecules per A2, a measurement without D2 coveragewas carried out as reference.
Integral energy spectra of transmitted conversion elec-trons are shown in Figure 6 for the different sandwiches.The K32 conversion line appears as a step at E =17.825 keV. Electrons which have lost energy are shiftedtowards lower energies. However, the reference spectrumwithout D2 coverage already exhibits a complex structure
V.N. Aseev et al.: Energy loss of 18 keV electrons in gaseous T2 and quench condensed D2 films 45
of low energy satellites due to electron shake on/off inKr. This drawback inhibits an analytic description of thereference spectrum and hence the deconvolution of theD2 energy loss function. Therefore, the measured refer-ence spectrum R(qU), which also includes the convolutionwith the spectrometer transmission function was taken asinput for fitting the normalised D2 energy loss functionf(ε) = (1/σtot)(dσ/dε). It describes the shape of a singleinelastic scattering process (see Eqs. (9, 10)). The evalua-tion of the reference spectrum in between measured pointswas done by linear interpolation. As in Section 2.3 (com-pare Eq. (11)) multiple scattering was taken into accountup to the 3rd order by multiple convolution of f(ε). Thisprocedure yields the fit function R′(qU), which addition-ally includes the parameters a and b for normalising thesignal and background rates of different runs:
R′(qU) = a
∫ E/2
0
R(qU + ε)
×(P0δ(ε) + P1f(ε) + P2(f ⊗ f)(ε) + . . .
)dε + b. (14)
The multiple scattering probabilities Pi were calculatedfor a given value of the total inelastic cross-section σtot
assuming a Poisson distribution for the scattering pro-cesses averaged over all possible paths through the ab-sorber. This average was calculated for a homogeneous D2
film2 considering that the electrons were emitted isotrop-ically up to a maximum angle ϑS,max. While the inputparameters µ and ϑS,max are known, σtot was fitted to thedata. Additional fit parameters were the normalising con-stants a and b, and an energy shift. This shift compensatessmall high voltage drifts between measurements as well asa shift of the order of 0.2 eV due to the polarisation en-ergy of the 83Kr+ daughter ion due to the coverage withthe D2 film.
For the energy loss function f(ε) we tried, similar toSection 2.3, different trial functions which consist of a peakrepresenting electronic excitations of D2, and a smoothlyconnected tail describing ionisation. As peak functionsGaussians and Lorentzians of various widths were tested,as tail functions truncated Lorentzians and hyperbola ofdifferent exponents. These trial functions serve for a phe-nomenological description of the energy loss function inthe relevant region up to energy losses of about 100 eV, towhich our measurements were sensitive. Beyond, the inte-gral spectra merge apparently for all D2 coverages into theuncovered one, telling that σtot is practically exhausted bythis interval within the experimental precision (see Fig. 6)To avoid the introduction of a systematic error in the av-erage energy loss ε by using a wrong asymptotic tail, weconnected the trial functions for energy losses ε larger than100 eV to the differential Møller scattering (13). The best
2 We also have investigated the case that the thickness isnot completely homogeneous but has some residual roughnessdue the quench condensation process. Modelling this effect byvarying locally the thickness of the D2 absorber by a Poissondistribution of the number of monolayers does not change themultiple scattering probabilities Pi and the fit results signifi-cantly.
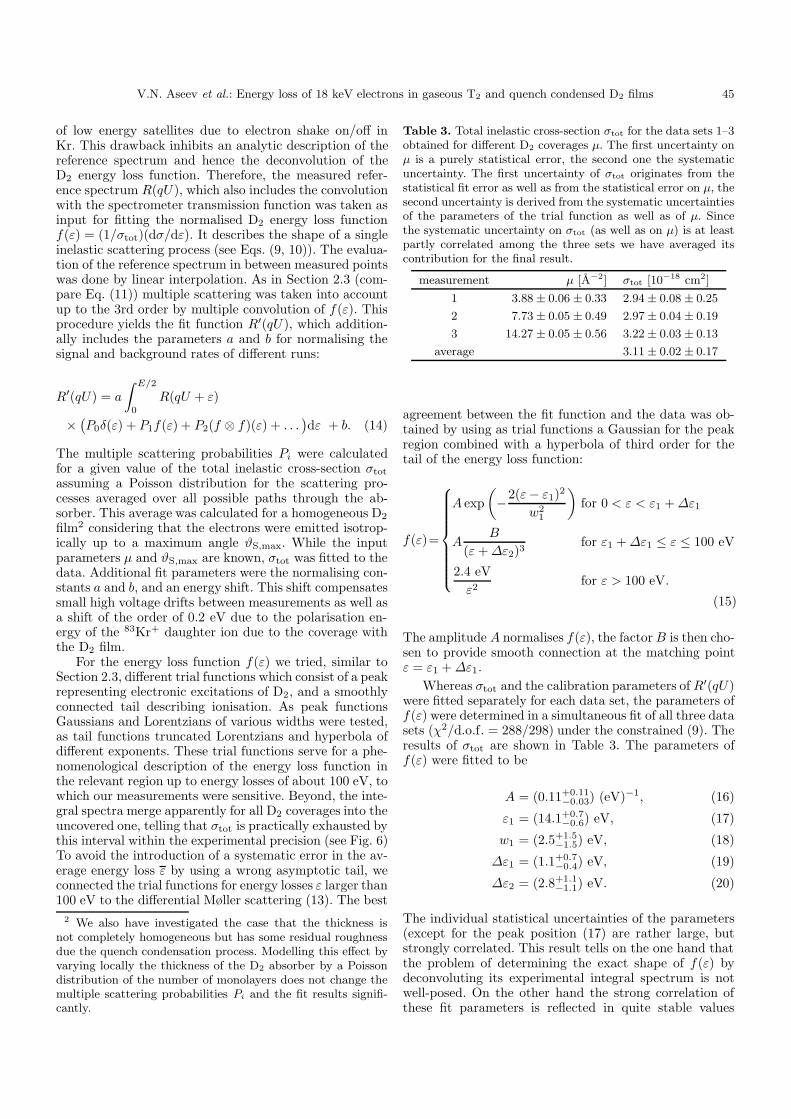
Table 3. Total inelastic cross-section σtot for the data sets 1–3obtained for different D2 coverages µ. The first uncertainty onµ is a purely statistical error, the second one the systematicuncertainty. The first uncertainty of σtot originates from thestatistical fit error as well as from the statistical error on µ, thesecond uncertainty is derived from the systematic uncertaintiesof the parameters of the trial function as well as of µ. Sincethe systematic uncertainty on σtot (as well as on µ) is at leastpartly correlated among the three sets we have averaged itscontribution for the final result.
measurement µ [A−2] σtot [10−18 cm2]
1 3.88± 0.06 ± 0.33 2.94± 0.08 ± 0.25
2 7.73± 0.05 ± 0.49 2.97± 0.04 ± 0.19
3 14.27 ± 0.05 ± 0.56 3.22± 0.03 ± 0.13
average 3.11± 0.02 ± 0.17
agreement between the fit function and the data was ob-tained by using as trial functions a Gaussian for the peakregion combined with a hyperbola of third order for thetail of the energy loss function:
f(ε)=
A exp(−2(ε− ε1)2
w21
)for 0 < ε < ε1 +∆ε1
AB
(ε+∆ε2)3for ε1 +∆ε1 ≤ ε ≤ 100 eV
2.4 eVε2
for ε > 100 eV.
(15)
The amplitude A normalises f(ε), the factorB is then cho-sen to provide smooth connection at the matching pointε = ε1 +∆ε1.
Whereas σtot and the calibration parameters of R′(qU)were fitted separately for each data set, the parameters off(ε) were determined in a simultaneous fit of all three datasets (χ2/d.o.f. = 288/298) under the constrained (9). Theresults of σtot are shown in Table 3. The parameters off(ε) were fitted to be
A = (0.11+0.11−0.03) (eV)−1, (16)
ε1 = (14.1+0.7−0.6) eV, (17)
w1 = (2.5+1.5−1.5) eV, (18)
∆ε1 = (1.1+0.7−0.4) eV, (19)
∆ε2 = (2.8+1.1−1.1) eV. (20)
The individual statistical uncertainties of the parameters(except for the peak position (17) are rather large, butstrongly correlated. This result tells on the one hand thatthe problem of determining the exact shape of f(ε) bydeconvoluting its experimental integral spectrum is notwell-posed. On the other hand the strong correlation ofthese fit parameters is reflected in quite stable values
46 The European Physical Journal D
of σtot (compare Tab. 3) as well as of the mean energyloss3
ε =∫ E/2
0
f(ε)εdε = (34.4± 0.4± 3.0) eV. (21)
That our problem is well-posed with respect to extract thetwo integral quantities is supported by the fact, that bothare stable against exchanging our best trial function (15)by other reasonable trial functions which were mentionedabove including the one used in the analysis of scatteringfrom a gaseous target (but with different parameters A1,2,ε1,2, w1,2 than those of Tab. 2).
The energy loss function f(ε) derived here can be di-rectly applied to calculate the energy loss of electrons fromthe endpoint region of tritium β decay within the source[8], the value of σtot has to be slightly rescaled for this pur-pose from Ee = 17.82 keV to Ee = 18.6 keV by a simple1/Ee law [9] giving
σtot(18.6) = (2.98± 0.02± 0.16)× 10−18 cm2
(for Ee = 18.6 keV). (22)
If we compare the energy loss for gaseous T2 with the onefor quench condensed D2 we observe two major differences.1. The peak position ε1 of f(ε) for quench condensed D2
appears at a significantly higher ε value. The shift be-tween the respective values (see Tab. 2 and Eq. (15)) is1.5+0.8−0.7 eV. Although for the measurement with quench
condensed D2 the peak position ε1 and peak width w1
are not well determined but strongly correlated witheach other we can get a reliable value for the shift ofthe peak position4 when we compare the peak posi-tions at equal width of w1 = 1.85 eV. Then the peakposition for quench condensed D2 is ε1
′ = 14.0 eV, theshift compared to Table 2 is still 1.4 eV.The shift is also stable when we exchange our besttrial function (15) by other reasonable trial functionsmentioned above. The values for the shift obtainedhere are in good agreement with the shifts observedin references [3,4] (compare Tab. 4).
2. The total inelastic cross-section σtot for solid D2 isfound to be (13± 5)% smaller than for gaseous molec-ular hydrogen. This difference is also stable againstvariations of f(ε) within the given limits.
3. The shift in the peak energy loss is reflected again inthe even stronger shift of the mean energy loss per in-elastic collision ∆ε = (4.5±3.2) eV. The number is lessprecise than that of the peak shift, but still significant.This shift is only partially due to the shift of the peak.The main contribution comes from a higher fraction ofthe tail of the energy loss function (see Fig. 7).
3 The main uncertainty of ε comes from its dependence onthe choice of the limit above which the quasielastic Møller scat-tering was used to describe f(ε).
4 A comparison using the energy loss function f(ε) obtainedfor gaseous T2 also for quench condensed D2 is not possible,since equation (8) using the parameters of Table 2 does not fitour data for quench condensed D2 even when allowing for ashift of the whole function.
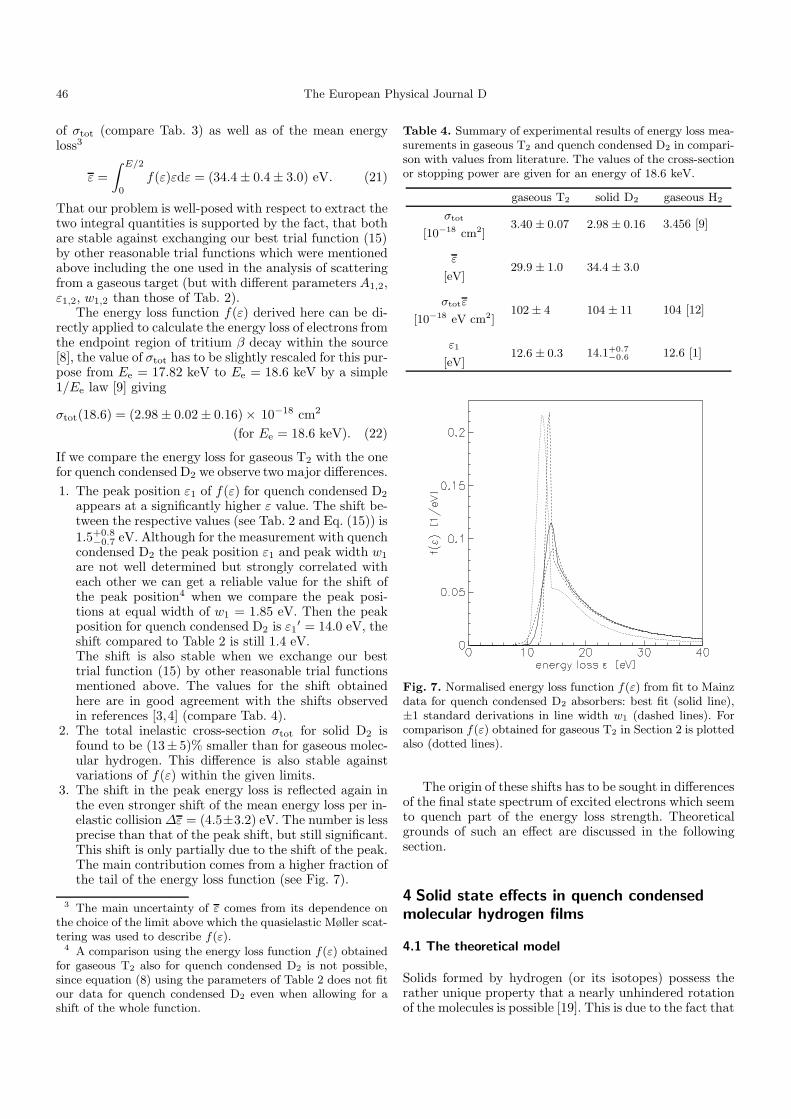
Table 4. Summary of experimental results of energy loss mea-surements in gaseous T2 and quench condensed D2 in compari-son with values from literature. The values of the cross-sectionor stopping power are given for an energy of 18.6 keV.
gaseous T2 solid D2 gaseous H2
σtot3.40 ± 0.07 2.98 ± 0.16 3.456 [9]
[10−18 cm2]
ε29.9 ± 1.0 34.4 ± 3.0
[eV]
σtotε102± 4 104 ± 11 104 [12]
[10−18 eV cm2]
ε112.6 ± 0.3 14.1+0.7
−0.6 12.6 [1][eV]
Fig. 7. Normalised energy loss function f(ε) from fit to Mainzdata for quench condensed D2 absorbers: best fit (solid line),±1 standard derivations in line width w1 (dashed lines). Forcomparison f(ε) obtained for gaseous T2 in Section 2 is plottedalso (dotted lines).
The origin of these shifts has to be sought in differencesof the final state spectrum of excited electrons which seemto quench part of the energy loss strength. Theoreticalgrounds of such an effect are discussed in the followingsection.
4 Solid state effects in quench condensedmolecular hydrogen films
4.1 The theoretical model
Solids formed by hydrogen (or its isotopes) possess therather unique property that a nearly unhindered rotationof the molecules is possible [19]. This is due to the fact that

V.N. Aseev et al.: Energy loss of 18 keV electrons in gaseous T2 and quench condensed D2 films 47
the molecules in the crystal are bound to each other bylong range forces that are comparatively weak and nearlyisotropic. This property is accompanied by a rather largeintermolecular distance compared to the intramolecularone. As a consequence, the hydrogen molecules in the solidbehave very similar to free molecules in gas phase, as is re-flected in the rotational spectrum which is nearly identicalfor the gas and the condensed phase.
On the other hand, photoabsorption studies as wellas the present energy loss study indicate a comparativelypronounced change of the spectra when going from thegas phase to the solid. One possible explanation for thisobservation has been proposed by Ruckman and Moorein [4]. Since the interaction of the ground state wavefunc-tions between adjacent hydrogen molecules is very smalldue to the large intermolecular distance, a solid formed byhydrogen molecules (all being in their ground state) be-haves nearly as an array of free molecules. However, due tothe larger spatial extent of the wavefunction especially ofelectronically excited hydrogen molecules the (electronic)excitation spectrum will change when going from the gasphase to the solid state. This phenomenon may be under-stood as a confinement of the excited state wavefunctionby the neighbour molecules due to repulsive electrostaticinteraction and Pauli blocking. Within this picture the ex-citation of a molecule within the solid may approximatelybe viewed as a transition to an excited molecular statethat is however confined by the surrounding.
In order to investigate the appropriateness of thismodel the following approach has been chosen for obtain-ing a semi-quantitative description of the process. Basedon a configuration-interaction (CI) method the lowestelectronic states of a hydrogen molecule have been inves-tigated. The calculation has been performed for a single(free) molecule and for a molecule surrounded by a cloudof neighbour molecules. A full CI calculation of the com-plete cluster would however yield the excitation energiesof all interacting molecules, and thus it would e.g. givedifferent energies for the central molecule than for theouter molecules, since they experience different surround-ings due to the finite cluster size. This is correct for amodel describing such a cluster, but it is not senseful forthe present purpose of modelling the excitation of a singlemolecule in a solid.
In the present model this problem was avoided in thefollowing way. In a first step the Hartree-Fock orbitalshave been evaluated separately for the shell of surround-ing molecules and the central molecule. Then a CI cal-culation of the whole system has been performed in thebasis of two-electron configurations formed with the aidof the doubly-filled (closed-shell) Hartree-Fock orbitals ofthe surrounding and all (occupied and virtual) Hartree-Fock orbitals of the central molecule. In this CI calcula-tion the orbitals of the surrounding molecules were frozen,i.e. they were left unchanged and their occupation numberwas fixed. In this way the central molecule is described ina complete way, only limited by the finite basis set used,while the surrounding is described on the level of a staticHartree-Fock approximation. Thus only the modification
of the wavefunctions of the central molecule by the sur-rounding is taken into account, but the polarisation of thesurrounding by the central molecule (and its feedback onthe wavefunction of the central molecule) is completelyneglected.
It may be emphasised that the wavefunctions of thesurrounding had been calculated without the central mo-lecule and thus there has been even no polarisation of thesurrounding wavefunctions by the ground state wavefunc-tion of the central molecule. The advantage of this fact isthat all wavefunctions of the central molecule are treatedon the same level of approximation. Finally, it may benoted that due to the static approximation for the sur-rounding one should expect that the employed model over-estimates the confinement effects.
4.2 Computational details
All calculations have been performed with the aid of thequantum-chemistry code GAMESS [20]. This code allowsto perform ab initio calculations within a basis of Carte-sian Gaussians. For describing the surrounding hydrogenmolecules a so-called 6-311G basis set consisting out of5 s-type Gaussians (where three of them are contracted toone basis function) centered at every hydrogen atom hasbeen used. In the case of the central molecule 10 s-typeGaussians with even-tempered exponents in the range1398.0a−2
0 to 0.03a−20 and 9 p-type Gaussians (of px, py,
and pz type) with even-tempered exponents in the range400.0a−2
0 to 0.02a−20 have been placed on every hydrogen
atom.While the Hartree-Fock energy of a single surrounding
molecule is of moderate quality (−30.69 eV compared tothe Hartree-Fock limit of −30.85 eV, both at the internu-clear distance R = 1.40a0), the ground state energy of thecentral molecule is of good accuracy (−30.84 eV on theHartree-Fock level and −31.89 eV on the CI level com-pared to −31.96 eV obtained in the most accurate calcu-lation). The quality of the description of the surroundingmolecules could be improved by adding so-called polar-isation functions of p-type symmetry (allowing a betterdescription of the chemical bond), but this is computa-tionally very costly (in fact doubling the number of basisfunctions) and seemed not to be necessary considering theadopted model where the surrounding molecules are notpolarised by the central molecule. In the case of the cen-tral molecule Gaussians of higher angular momenta wouldhave to be included in order to achieve improved angu-lar correlation and thus energies that are even closer tothe best theoretical ones. Again, such improvements werejudged to be computationally too expensive regarding theoverall simplicity of the model to be worthwhile the ef-forts.
Since electronic excitations should be fast on thetime-scale of nuclear motion, one may assume verticaltransitions, i.e. transitions at constant internuclear dis-tance. In the present calculations the internuclear distanceR = 1.43a0 has been adopted for the central and thesurrounding molecules. This value is the average mean
48 The European Physical Journal D
internuclear distance of D2 and T2. In order to test thedependence of the results on this parameter, calculationshave also been performed using in some cases R = 1.30and 1.50a0 for the central molecule.
The geometry of solid hydrogen at low temperaturesis rather complicated, since a number of phase transitionshas been observed [19]. While for extremely low temper-atures a spin-ordered structure has been predicted andobserved, solid hydrogen at about 5 K prefers the hcpstructure. Condensed films or solid hydrogen at temper-ature around 2 K seem however to form an fcc lattice.In the present calculation the fcc structure was adopted.Thus the central hydrogen molecule is surrounded by12 next neighbour molecules. The second coordinationshell contains then 6 further molecules. From the densityρ = 3.02× 10²²/cm3 (compare Sect. 3.2) one can deducethe unit cell constant a = 9.65a0.
Due to the nearly free rotation of the the H2 moleculesin the solid one has an infinite number of possible orien-tations of the surrounding molecules to each other andto the central molecule. A complete calculation would re-quire to calculate the spectra for a sufficient number oforientations and to perform an adequate averaging. In thepresent calculation only three rather extreme cases (withcomparatively high ordering) have been considered thatall had the advantage of preserving overall C4v symmetrywhich reduced the computation time.
In the case of the first geometry (cluster I) all mole-cules are oriented parallel to the same axis. Clusters II andIII have been obtained from cluster I by a rotation of thesurrounding molecules (keeping the center of mass of eachmolecule fixed). In cluster II the molecular axis of eachsurrounding molecule points towards the central molecule,while in cluster III the molecular axis of each surroundingmolecule is perpendicular to the line connecting the centerof mass of the central molecule with the one of that sur-rounding molecule. A complete calculation may then e.g.be denoted as II’(1.43/9.65). Here II refers to cluster II,the single prime indicates that one shell of surroundingmolecules has been included, 1.43 is the internuclear dis-tance of the central molecule (in a0), and 9.65 is the lengtha of the cubic unit cell (in a0).
4.3 Results
Seven electronically excited states (three of them beingdoubly degenerate Π states) have been considered in thiswork. They are the energetically lowest lying states ob-tained with the adopted basis set. In order to allow anestimate of the accuracy of the present calculation (withrespect to the treatment of the central molecule), the cal-culated transition energies with respect to the electronicground state are compared to literature values in Ta-ble 5 for the internuclear distance R = 1.40a0. (An ex-ception is the H 1Σ+
g state where only literature values atR = 1.50a0 were available.) The agreement is very satis-factory, except for the D 1Π state. In this case the resultindicates that the calculated wavefunction and energy cor-responds more to a pseudo state that is a mixture of the
correct D 1Π state and some Rydberg states of the samesymmetry, the latter not being explicitly represented bythe adopted basis set.
In order to simulate D2 and T2, the remaining en-tries of Table 5 correspond to the internuclear distanceR = 1.43a0. If the central molecule is surrounded by oneshell of next neighbours (I’, II’, or III’), all excitation en-ergies are shifted to higher values. Since the ground stateis shifted by less than 0.03 eV for all three clusters, thelarge energy shifts of up to 2.46 eV that are found for theexcitation energies are evidently due to a comparativelystrong and repulsive interaction of the excited central mo-lecule and its neighbours. This repulsive interaction is ofdifferent strength for different final states, and it dependson the cluster geometry. As one would expect from a sim-ple confinement argument, the largest shifts are found forcluster II, where the distance between the central moleculeand the closest lying atoms is smallest. However, in thecase of the B 1Σ+
u and C 1Πu states the energy shifts arevery similar for all three clusters, indicating that a morecomplex mechanism is responsible for the energy shift.
Adding the second shell of neighbour molecules leadsto a further, but smaller shift of the excitation energies formost of the states. Again the B 1Σ+
u and C 1Πu states areexceptions, since they are nearly unaffected by the sec-ond shell. In some cases the excitation energy is in factslightly decreased. The two states are accompanied by theI 1Πg state that also does not show a further increase ofthe excitation energy when adding the second shell. The(small) decrease in excitation energy again indicates that amore complicated interaction than pure electron-electronrepulsion or Pauli blocking takes place, this effect beinghowever evidently smaller than the repulsive interaction.It may also be noted that the ground state energy is nearlyunaffected by adding the second shell of surrounding mo-lecules, as one would expect.
In principle, more and more shells of surrounding mole-cules would have to be added until complete convergence isreached. For reasons of computation time, the present cal-culation was however limited to two shells, since it seemsevident that the main features of the solid surroundingshould be visible from the results obtained with these twoshells. Another question is of course, how much the presentresults depend on the accuracy of the wavefunctions usedin the description of the surrounding molecules. In orderto allow an estimate of this effect, in Table 5 the results ob-tained with a much poorer basis set than the one adoptedin the remaining calculations is also given. In this case, de-noted by I ′′, a so-called STO-3G basis set is adopted forthe surrounding molecules. This basis set contains only asingle s-type basis function that is formed by three (con-tracted) Gaussians and yields a Hartree-Fock ground stateenergy of −30.39 eV. As can be seen from Table 5, the re-sults are very similar to the corresponding ones obtainedwith the much better quality basis set adopted in the re-maining calculations. However, the predicted energy shiftsare consistently larger, if calculated with the poorer basis.This result confirms that the overall results presented inthis work should be rather converged with respect to the

V.N. Aseev et al.: Energy loss of 18 keV electrons in gaseous T2 and quench condensed D2 films 49
Table 5. Excitation energies Eexc (in eV) and oscillator strength values f (in parenthesis) for an H2 molecule that is eitherfree or surrounded by different H2 clusters. (See text for a definition of the symbols denoting the different clusters.)
System B 1Σ+u E,F 1Σ+
g C 1Πu B′ 1Σ+u H 1Σ+
g I 1Πg D 1Πu
H2 (R = 1.40a0) 12.75 [21] 13.13 [22] 13.22 [21] 14.85 [21] 14.60 [22]∗ 14.92 [23] 14.99 [21]
this work 12.71 13.16 13.24 14.99 14.61∗ 14.96 16.07
H2 (R = 1.43) 12.57 13.06 13.13 14.86 14.87 14.84 15.95
(0.309) (0.168) (0.090) (0.194)
I’(1.43/9.65) 13.37 15.15 14.44 15.27 15.65 16.34 16.74
(0.450) (0.338) (0.002) (0.024)
II’(1.43/9.65) 13.34 15.52 14.47 15.61 15.86 16.71 16.99
(0.451) (0.347) (0.002) (0.016)
III’(1.43/9.65) 13.33 15.06 14.44 15.17 15.52 16.24 16.56
(0.446) (0.332) (0.001) (0.030)
I”(1.43/9.65) 13.35 15.54 14.46 15.84 16.58 16.27 17.59
(0.448) (0.344) (0.005) (0.019)
II”(1.43/9.65) 13.33 15.71 14.48 16.23 16.97 16.71 17.84
(0.450) (0.350) (0.006) (0.014)
III”(1.43/9.65) 13.31 15.52 14.46 15.72 16.38 16.17 17.40
(0.444) (0.341) (0.004) (0.023)
I”(1.43/9.25) 13.49 16.07 14.65 15.76 16.78 16.12 17.51
(0.463) (0.362) (0.008) (0.007)
I”(1.43/9.45) 13.42 15.81 14.55 15.80 16.67 16.20 17.55
(0.455) (0.353) (0.007) (0.012)
I”(1.43/9.85) 13.28 15.30 14.37 15.88 16.49 16.34 17.62
(0.440) (0.335) (0.004) (0.027)
I”(1.43/10.05) 13.22 15.07 14.28 15.93 16.41 16.40 17.64
(0.432) (0.327) (0.003) (0.036)
I”(1.43/12.00) 12.82 13.73 13.68 16.22 15.77 16.25 17.35
(0.371) (0.257) (0.008) (0.114)
I”(1.43/15.00) 12.62 13.17 13.28 15.71 15.27 15.50 16.48
(0.327) (0.199) (0.103) (0.171)
I”(1.43/20.00) 12.58 13.06 13.14 15.00 14.94 14.93 16.00
(0.310) (0.171) (0.099) (0.192)
I”(1.43/30.00) 12.57 13.06 13.13 14.86 14.87 14.84 15.95
(0.309) (0.168) (0.090) (0.194)
I ′′(1.43/9.65) 13.40 15.69 14.51 15.89 16.73 16.41 17.78
(0.449) (0.345) (0.005) (0.017)∗ The values are given for the internuclear distance R = 1.50a0.
basis set used for describing the surrounding molecules.However, it indicates also that the shape of the surround-ing wavefunctions is important, and a very simple modelthat e.g. assumes the environment to consist out of non-interacting hydrogen atoms will only give a very crudeestimate of the solid state effects.
Since the exact molecular geometry of the quench con-densed D2 films is not known and since the hydrogen mo-lecules are even in the solid not fixed in space, it was feltimportant to investigate the influence that the averagedistance between the central molecule and its surround-
ing has on the results5. This was done by calculating theexcitation energies as a function of the length of the unitcell parameter a. In Table 5 the results are given for clus-ter I” as an representative example. From the results itmay be concluded that an error in the average distancewill affect the numbers itself, but the basic effect is in-dependent of the exact value of the average intermolecu-lar distance. In most cases it is observed that a decrease
5 It may be noted that for the different hydrogen isotopes(assuming a closely-packed fcc crystal) the unit cell parametersa are 10.12a0 (H2), 9.65a0 (D2), and 9.45a0 (T2), respectively.
50 The European Physical Journal D
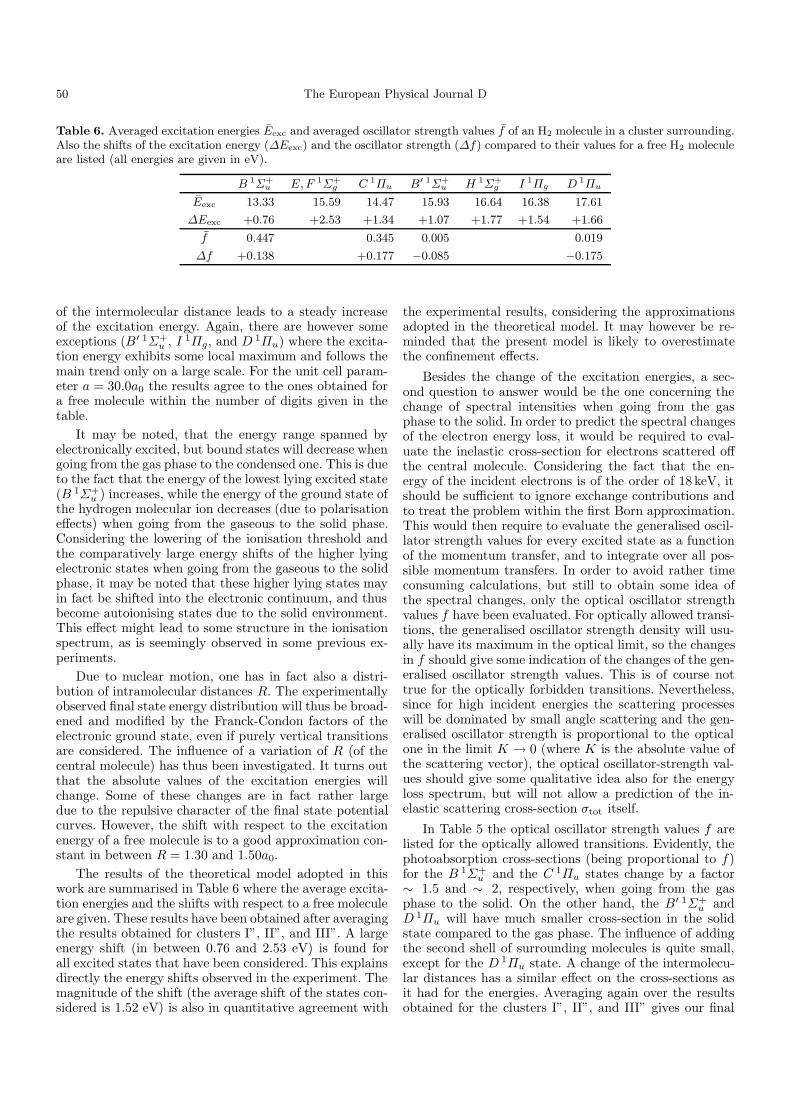
Table 6. Averaged excitation energies Eexc and averaged oscillator strength values f of an H2 molecule in a cluster surrounding.Also the shifts of the excitation energy (∆Eexc) and the oscillator strength (∆f) compared to their values for a free H2 moleculeare listed (all energies are given in eV).
B 1Σ+u E,F 1Σ+
g C 1Πu B′ 1Σ+u H 1Σ+
g I 1Πg D 1Πu
Eexc 13.33 15.59 14.47 15.93 16.64 16.38 17.61
∆Eexc +0.76 +2.53 +1.34 +1.07 +1.77 +1.54 +1.66
f 0.447 0.345 0.005 0.019
∆f +0.138 +0.177 −0.085 −0.175
of the intermolecular distance leads to a steady increaseof the excitation energy. Again, there are however someexceptions (B′ 1Σ+
u , I 1Πg, and D 1Πu) where the excita-tion energy exhibits some local maximum and follows themain trend only on a large scale. For the unit cell param-eter a = 30.0a0 the results agree to the ones obtained fora free molecule within the number of digits given in thetable.
It may be noted, that the energy range spanned byelectronically excited, but bound states will decrease whengoing from the gas phase to the condensed one. This is dueto the fact that the energy of the lowest lying excited state(B 1Σ+
u ) increases, while the energy of the ground state ofthe hydrogen molecular ion decreases (due to polarisationeffects) when going from the gaseous to the solid phase.Considering the lowering of the ionisation threshold andthe comparatively large energy shifts of the higher lyingelectronic states when going from the gaseous to the solidphase, it may be noted that these higher lying states mayin fact be shifted into the electronic continuum, and thusbecome autoionising states due to the solid environment.This effect might lead to some structure in the ionisationspectrum, as is seemingly observed in some previous ex-periments.
Due to nuclear motion, one has in fact also a distri-bution of intramolecular distances R. The experimentallyobserved final state energy distribution will thus be broad-ened and modified by the Franck-Condon factors of theelectronic ground state, even if purely vertical transitionsare considered. The influence of a variation of R (of thecentral molecule) has thus been investigated. It turns outthat the absolute values of the excitation energies willchange. Some of these changes are in fact rather largedue to the repulsive character of the final state potentialcurves. However, the shift with respect to the excitationenergy of a free molecule is to a good approximation con-stant in between R = 1.30 and 1.50a0.
The results of the theoretical model adopted in thiswork are summarised in Table 6 where the average excita-tion energies and the shifts with respect to a free moleculeare given. These results have been obtained after averagingthe results obtained for clusters I”, II”, and III”. A largeenergy shift (in between 0.76 and 2.53 eV) is found forall excited states that have been considered. This explainsdirectly the energy shifts observed in the experiment. Themagnitude of the shift (the average shift of the states con-sidered is 1.52 eV) is also in quantitative agreement with
the experimental results, considering the approximationsadopted in the theoretical model. It may however be re-minded that the present model is likely to overestimatethe confinement effects.
Besides the change of the excitation energies, a sec-ond question to answer would be the one concerning thechange of spectral intensities when going from the gasphase to the solid. In order to predict the spectral changesof the electron energy loss, it would be required to eval-uate the inelastic cross-section for electrons scattered offthe central molecule. Considering the fact that the en-ergy of the incident electrons is of the order of 18 keV, itshould be sufficient to ignore exchange contributions andto treat the problem within the first Born approximation.This would then require to evaluate the generalised oscil-lator strength values for every excited state as a functionof the momentum transfer, and to integrate over all pos-sible momentum transfers. In order to avoid rather timeconsuming calculations, but still to obtain some idea ofthe spectral changes, only the optical oscillator strengthvalues f have been evaluated. For optically allowed transi-tions, the generalised oscillator strength density will usu-ally have its maximum in the optical limit, so the changesin f should give some indication of the changes of the gen-eralised oscillator strength values. This is of course nottrue for the optically forbidden transitions. Nevertheless,since for high incident energies the scattering processeswill be dominated by small angle scattering and the gen-eralised oscillator strength is proportional to the opticalone in the limit K → 0 (where K is the absolute value ofthe scattering vector), the optical oscillator-strength val-ues should give some qualitative idea also for the energyloss spectrum, but will not allow a prediction of the in-elastic scattering cross-section σtot itself.
In Table 5 the optical oscillator strength values f arelisted for the optically allowed transitions. Evidently, thephotoabsorption cross-sections (being proportional to f)for the B 1Σ+
u and the C 1Πu states change by a factor∼ 1.5 and ∼ 2, respectively, when going from the gasphase to the solid. On the other hand, the B′ 1Σ+
u andD 1Πu will have much smaller cross-section in the solidstate compared to the gas phase. The influence of addingthe second shell of surrounding molecules is quite small,except for the D 1Πu state. A change of the intermolecu-lar distances has a similar effect on the cross-sections asit had for the energies. Averaging again over the resultsobtained for the clusters I”, II”, and III” gives our final
V.N. Aseev et al.: Energy loss of 18 keV electrons in gaseous T2 and quench condensed D2 films 51
estimate listed in Table 6. In contrast to the energy shift,the shifts of the oscillator strength values are partly posi-tive, partly negative. This has to be the case, since withinthe presently adopted model the Thomas-Kuhn sum ruleshould be fulfilled, i.e. the sum over all values of f shouldbe equal to 2 (the number of active electrons). Althoughfour values of f are not very representative, the resultsseem again to support the confinement idea, since thehigher lying and spatially more extended states loose exci-tation probability which in turn is transfered to the lowerlying, spatially less extended states. Since the shifts for theexplicitly considered states add up to a positive number,the sum rule predicts that the even higher lying excitedstates (including the electronic continuum) will (in total)loose transition probability.
Due to the broadening by rovibrational motion, thetransitions to higher lying electronic bound states can-not easily be distinguished from ionisation in simple pho-toabsorption or energy loss spectra, especially if not veryhigh resolution is achieved. It is very likely, that in a typ-ical photoabsorption spectrum on gaseous hydrogen onlythe B 1Σ+
u and the C 1Πu (in energy loss spectra also theE,F 1Σ+
g ) states may clearly be recognisable as electronicexcitations (and should correspond to the peak of the en-ergy loss function (8) at ε1 in Sect. 2). According to thepresent theoretical model these states will gain transitionprobability when going to the solid phase, but both theE,F 1Σ+
g and the C 1Πu will be shifted to rather high en-ergies. Considering additionally that the ionisation thresh-old itself is shifted to lower energies in the solid comparedto the gas, it is likely that basically only the B 1Σ+
u maycontribute to what is designated as excitation peak, whileall others merge into the electronic continuum. This fact(together with the shift of excited states over the ionisa-tion threshold) would explain the enhanced relative ioni-sation observed in the experiments on solid D2 (Sect. 3)compared to the one found for gaseous T2 (Sect. 2) asis visible from Figure 7. Of course, more elaborate calcu-lations and experiments with higher resolution would berequired in order to allow a direct comparison betweentheoretical and the experimental energy loss spectrum.
In conclusion, the present theoretical model predictsthat the edge of photon absorption or energy loss will beshifted to larger excitation energies (by about 0.76 eV).The mean excitation energy of the bound states consid-ered will even be shifted by about 1.52 eV. At least in thecase of photoabsorption, but most likely also in the energyloss spectrum, the energetically low lying states will gaintransition probability, while the higher lying states (in-cluding the electronic continuum) loose transition prob-ability. These results agrees well with the experimentalobservation that the excitation spectrum is different forgaseous and solid hydrogen and exhibits a higher thresh-old, although the ground state molecules in the solid be-have nearly as they would be free even in the condensedphase. The results also confirm that this effect is basicallydue to a kind of confinement of the wavefunctions of theexcited molecule by the surrounding. This spatial limita-tion caused by electrostatic repulsion and Pauli blocking
will energetically disfavour spatially extended states of thecentral molecule. While this seems to be the basic effect,the present investigation indicates also, that there existsome (though minor) deviations from this simplified modelthat should be due to the more complicated quantum me-chanical interaction between the central molecule and itssurrounding. A model aiming for a fully quantitative de-scription will thus have to include those effects, which isonly partly done in the present model where the surround-ing has been described within a static approximation. Inaddition, the computation has to include a larger range ofexcitation energies (including the non-resonant ionisation)and should be extended beyond the optical limit (K → 0),if theoretical predictions regarding the total inelastic elec-tron impact cross-section σtot should become possible.
5 Conclusion
Measurements of the energy loss of fast electrons at anenergy of 18 keV have been performed on molecules ofhydrogen isotopes, gaseous T2 and frozen D2.
In the case of gaseous T2 the total inelastic cross-section, integrated over all scattering angles and energylosses has been found to be σtot, gaseous = (3.40± 0.07)×10−18 cm2 in agreement with theory [9]. The mean energyloss in gaseous T2 has been measured to be εgaseous =(29.9 ± 1.0) eV. The product σtotε is in agreement withestablished stopping power values [12]. The shape of theenergy loss spectrum is well described by a Gaussian cen-tered at 12.6 eV, which is smoothly connected to an ap-propriate tail function. The peak position coincides withthe first electronic excitation band of molecular hydrogen.
In contrast to the overall agreement of our resultswith the expectations for gaseous T2 the energy loss of18 keV electrons in quench condensed D2 exhibits sig-nificant differences. The total inelastic cross-section hasbeen found to be σtot, solid = (2.98 ± 0.16) × 10−18 cm2
which is reduced by 13% compared to the value for gaseousT2. The average energy loss in quench condensed D2,εsolid = (34.4±3.0) eV, is 4.5 eV above the correspondingvalue of gaseous T2. Using a similar parametrisation of theenergy loss function as for gaseous T2 gives a significantshift in the peak position, ε1, solid = 14.1+0.7
−0.6 eV, towardshigher energy losses. All these effects may be interpretedin terms of changes in the final states spectrum.
To this end CI calculations within a molecular clusterhave been performed. They show indeed that the excitedstates of the central molecule are shifted up by an aver-age of about 1.52 eV, whereas the molecular ground stateremains basically unaffected. These calculations also in-dicate a change of the individual transition probabilitieswhen going from the gaseous to the solid state.
By the help of these results we are now in the posi-tion to calculate safely the energy loss in gaseous or solidT2 sources, whose β decay spectrum serves for the deter-mination of the rest mass of the neutrino to the presentsensitivity limit of 2 eV/c2 [7,8].
However, there remain residual uncertainties with re-spect to the detailed shape of the energy loss spectrum.
52 The European Physical Journal D
This is inherent to our experimental method of measur-ing integral energy loss spectra by MAC-E-filters. Theplanned new generation of tritium β spectrometers of thistype [24,25] will overcome this problem by having the op-tion of a non-integrating mode.
We would like to thank P. Leiderer for helpful discussions.This work was partially supported by grant INTAS-RFBR 95-0819 and by the Deutsche Forschungsgemeinschaft under con-tract Ot33/13. We would like to thank the ISOLDE collab-oration/CERN for kindly providing the 83Rb source. One ofthe authors (V.L.) is indebted to the Alexander-v-HumboldtFoundation for the Research grant.
References
1. J. Geiger, Z. Phys. 181, 413 (1964).2. R. Ulsh et al., J. Chem. Phys. 60, 103 (1973).3. L. Schmidt, Phys. Lett. A 36, 87 (1971).4. M.W. Ruckman, J.F. Moore, Phys. Rev. B 47, 8407
(1993).5. A. Gedanken et al., J. Chem. Phys. 59, 2752 (1973).6. K. Inoue et al., Solid State Commun. 30, 627 (1979).
7. V.M. Lobashev et al., Phys. Lett. B 460, 227 (1999), andreferences therein.
8. Ch. Weinheimer et al., Phys. Lett. B 460, 219 (1999), andreferences therein.
9. J.W. Liu, Phys. Rev. A 7, 1 (1973).10. Ch. Weinheimer et al., Phys. Lett. B 300, 210 (1993).11. B.L. Schram et al., Physica 31, 1 (1965).12. L. Pages et al., Atomic Data 4, 1 (1972).13. CERN Library Long Writeup D506, vers. 92.1 of March
199214. V.B. Berestetskii et al., Landau and Lifshitz: Course of
Theoretical Physics/Quantum Electrodynamics, 2nd edn.(Pergamon Press, New York, 1982).
15. A. Picard et al., Nucl. Instrum. Meth. B 63, 345 (1992).16. A. Picard et al., Z. Phys. A 342, 71 (1992).17. M. Przyrembel, doctoral thesis, Mainz university, 1995.18. The mother isotop Rb-83 was kindly provided by the
ISOLDE collaboration/CERN.19. I.F. Silvera, Rev. Mod. Phys. 52, 393 (1980).20. M.W. Schmidt et al., J. Comp. Chem. 14, 1347 (1993).21. L. Wolniewicz, K. Dressler, J. Chem. Phys. 88, 3861
(1988).22. J.W. Liu, S. Hagstrom, Phys. Rev. A 48, 166 (1993).23. W. Ko los, J. Rychlewski, J. Mol. Spectrosc. 66, 428 (1977).24. J. Bonn et al., Nucl. Instrum. Meth. A 421, 256 (1999).25. V.M. Lobashev, Prog. Part. Nucl. Phys. 40, 337 (1998).