energy neighborhoods and dc reduction a bem fidelity...
TRANSCRIPT

Copyright © 2013 Georgia Tech
A US perspective on energy flexibility:
Energy Neighborhoods and DC reduction
A BEM fidelity perspective
Godfried AugenbroeSchool of Architecture, Georgia Institute of Technology, Atlanta. USA

Energy n’hoods

BEM: Scale and scope

BEM: Scale and scope

Overview of some efforts in our lab
1. Chicago lab retrofit2. A campus model3. Microgrid optimization4. The London Westminster model5. The Manhattan model6. Resilient communities with multi-layered intelligence

1. Chicago Loop retrofit

Aggregate-level
Model base
Individual -level
Calibration Process
Policy & Scenario Evaluation( Normative Model)
Retrofit Decisions(Calibrated Normative Model)
F
Finance Tool
F
Scenarios
F
ECMs Database
F
“Policy and Planning”
“Owner & financing”
Heo Y.S., G. Augenbroe, D. Graziano, R.T. Muehleisen, L. Guzowski (2015). Scalable methodology for large scale building energy improvement: Relevance of calibration in model-based retrofit analysis. Building and Environment 87, 342-350

2. Campus network
Lee, sang Hoon (2012). Campus scale energy planning and management. PhD thesis Ga Tech.
Graph of:• Nodes: energy consumers
and suppliers• Arcs: exchange/sharing
modes

Lee, sang Hoon (2012). Campus scale energy planning and management. PhD thesis Ga tech.

3. Microgrid optimization
Overview of the integrated optimization framework. DEA searches the decision variablespace of the demand model, which interacts with the supply model through six exchange variables.A decision maker defines the weather, grid outage and EEMS scenario.
DER-CAM
Michael Street (2016), Integrated performance based design of communities and distributed generation. PhD Dissertation Georgia Tech, 2016.

4. London Westminster: 1000+
• EECi project at Un. Cambridge: Combined building and traffic emission model in urban canopy dispersion model

• Urban heat island (UHI) effect: larger ambient temperature fluctuations in urban area
• UHI model used, following Sun and Augenbroe (2014): ▫ The Town Energy Budget (TEB) model (Masson
2000) ▫ The Interaction Soil–Biosphere–Atmosphere (ISBA)
model (Noilhan and Planton 1989; Noilhan and Mahfouf 1996)
Detailed GIS morphology
Urban parameters
• Urban canyon height
• Urban canyon aspect ratio
• Coverage of vegetation area
• Coverage of built area
TEB-ISBA UHI model
Simplified into
Feed into
Energy model
Boundary condition
of
• Individual building geometry
• Calculated hourly actual ambient temperature
• Adjusted energy consumption under UHI effect
5. Very large scale urban models 10,000
Quan, S.J., Li, Q., Augenbroe, G., Brown, J., & Yang, P.-J. (2015). Urban Data and Building Energy Modeling: A GIS-Based Urban Building Energy Modeling System Using the Urban-EPC Engine (Ch 24). In S. Geertman, J. FerreiraJoseph, R. Goodspeed, & J. Stillwell (Eds.), Planning Support Systems and Smart Cities SE - 24 (pp. 447–469).

• Temporal and spatial characteristics of urban-scale building energy
Above: monthly total building energy consumption of ManhattanRight: spatial building total energy consumption across Manhattan
Urban outcomes

6. Connected, resilient communities
Gustavo Carneiro (2017), Integration of buildings and DER in neighborhood energy models Georgia Tech PhD thesis

The consensus road forward
Step 1: Automatic generation of synthetic environments from - GIS- BIM- Census (PUMS)- Other…..
Step 2: Population of building energy models
Step 3: Add urban climate parameters
Step 4: Add “light touch”” calibration based on smart meter data
One question is usually avoided!

The unanswered question
What model fidelity is adequate for the individual building nodes?
Typical choices:• Statistical (Regression, Surrogate, Gaussian Process)• Reduced order (aggregate model with zonal mass-nodes): EPC• Fully dynamic, from retail (IES, EnergyPlus) to customized• Research (Modelica)
Ramifications:- How to handle p2p dynamics (co-simulation)- At what scale does the individual still matter
Obviously “it all depends what you want to achieve”!

The question is relevant
Modeling effort
Error(Model
Discrepancy)
“Lazy modeling leads to oversizing”
“Over-engineered models have no pay back”
Reducedorder
ModelicaEnergyPlus
Question: How does urban scale modeling amplify these issues?

Let’s address this question in a study
Goal of study: Select optimal set of measures that reduce electricity costFOR ONE BUILDING AT A TIME• With special attention on: demand charges (DC)• In different DC rate structures (by local utilities)
Yuna Zhang, Optimal strategies for demand charge reduction by commercial building operators. PhD dissertation Georgia Tech, June 2017

Building Model
Building Type Office Hospital Retail
Floor Area 3000 m2 3000 m2 3000 m2
Load Duration Curve
Application cases
Peak Demand
Total Floor Area
HospitalBuildingOfficeBuildingRetail Building

Methods To Reduce Demand Charges
Dem
and
Load Shifting
Peak Shaving
Energy Efficiency
Peak Hours
No Action
Hour
Renewable Energy
0 4 8 12 16 20 24

EEM and EFM (parameterizations)
Goal: select EEM+EFM set with highest NPV• For given building type in given location• Under given specific electricity rate structure
Building ParametersValue
Cost Min Max
Energy Efficiency Intervention (EEM)
Infiltration Rate(m3/h/m2) 0.2 0.8 $4-$10/m
Wall Insulation Thickness (mm) 0 100 $10-$17/m2
Emissivity of Roof 0.4 0.9 $10-$22/m2
Solar Reduction Factor 0.8 1 $45-$65/each window
Window SHGC 0.25 0.8 $450-$650/each window
Energy FlexibilityIntervention (EFM)
Temperature Control 0 2.5 Productivity loss
Lighting Dimmer 0 30 $300/each dimmer
Voltage Throttling 0 1 Productivity loss
Schedule Adjustment 0 1 $0
Area of the PV System (m2) 0 200 $520 per m2

Deterministic Optimization
Building Energy Model
EPC
Energy Cost
Demand Charge Cost
Investment Cost
P1: Energy Efficiency
Intervention
P2: Flexible Building Load
Control
P3: Renewable Energy
TechOPT:Minimize NPC Parameter Space
Optimal Mix
Different Building TypesOffice
HospitalMall
Different Rate Structure
Georgia Power,Pacific Gas and
Eclectic Company,Southern California
Edison
Other costs
?

Five electricity rate structures (cases)

Some results
$0
$5,000
$10,000
$15,000
$20,000
$25,000
$30,000
$35,000
$0
$50,000
$100,000
$150,000
$200,000
$250,000
1 2 3 4 5
Investment Annual Demand Charge Savings
$0
$5,000
$10,000
$15,000
$20,000
$25,000
$30,000
$110,000
$112,000
$114,000
$116,000
$118,000
$120,000
1 2 3 4 5
Investment Annual Demand Charge Savings
$0
$5,000
$10,000
$15,000
$20,000
$25,000
$30,000
$35,000
$100,000
$150,000
$200,000
$250,000
$300,000
$350,000
$400,000
1 2 3 4 5
Investment Annual Demand Charge Savings
$0$100,000$200,000$300,000$400,000$500,000$600,000$700,000$800,000$900,000
$1,000,000
1 2 3 4 5
NPV
Some inspections and consequences
How do we know whether the results are valid?
Will a higher fidelity model lead to different optimal sets of measures??
One answer: rebuild the model with a higher fidelity tool and compare
Better answer: test the influence of the model discrepancy on outcomes.
Even better answer: test the influence of the model discrepancy on decisions.
This requires:
• Develop risk criteria in the decision making; develop the measures• Determine how model discrepancy affects risk measures
Consequence: we need to recognize uncertainties in parameters AND model
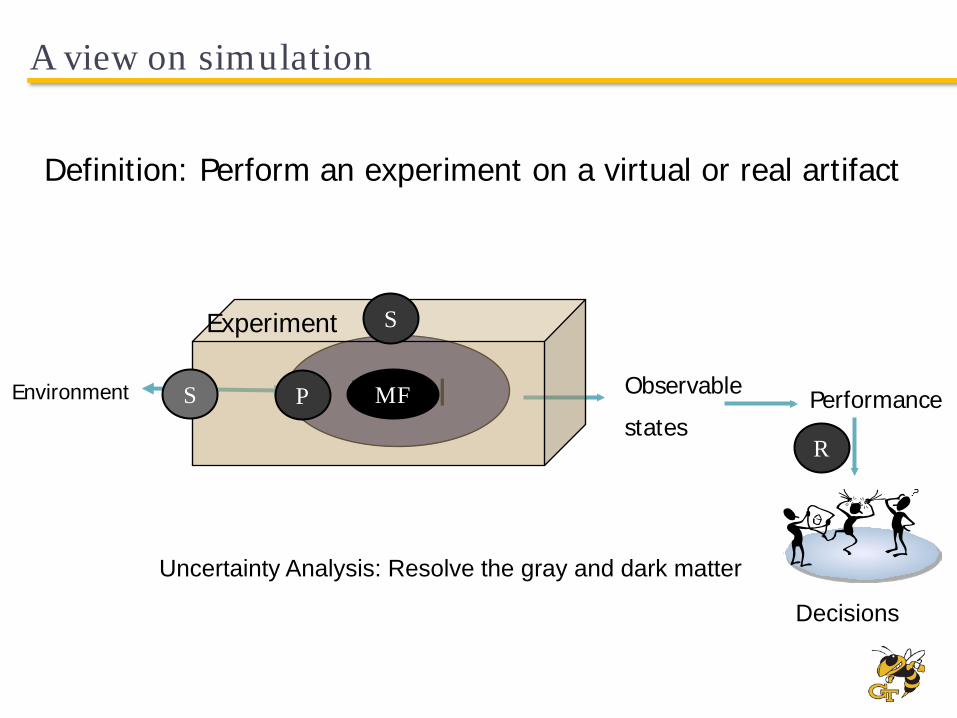
A view on simulation
Definition: Perform an experiment on a virtual or real artifact
Observable states
PerformanceModelEnvironment
Experiment
R
S
MFPS
Uncertainty Analysis: Resolve the gray and dark matter
Decisions

Parameter and Scenario uncertainties
Uncertainty Parameter Range
Energy Model Parameter
U-value of Wall -10% ~ +10%
U-value of Window -10% ~ +10%
Infiltration Rate -10% ~ +10%
Scenario ParametersOccupancy Density -20% ~ +20%
Appliance Density -20% ~ +20%
Cost Factors
Productivity Loss Bivariate Kernel Density
Product Cost -10% ~ +10%
Future Demand Charge Rate -2% ~ +2%

UA and SA of Peak Demand
5.0% 90.0% 5.0%
182.3 228.2
170
180
190
200
210
220
230
240
250
0.000
0.005
0.010
0.015
0.020
0.025
0.030
Peak Demand
Peak Demand
Minimum 170.226Maximum 246.089
Mean 204.617Std Dev 14.356Values 500
@RISK Course VersionGeorgia Institute of Technology
186.18 223.27
194.97 215.36
197.07 209.54
199.50 209.74
199.33 207.38
200.96 208.59
201.32 208.85
201.24 208.15
204.42 204.82
185
190
195
200
205
210
215
220
225
Peak Demand
Voltage Reduction
Infiltration rate
Lighting Dimmer
Emissivity of Roof
Wall Insulation thickness
PV Area
Temperature control
Solar Reduction Factor
Window SHGC
Peak DemandInputs Ranked By Effect on Output Mean
@RISK Course VersionGeorgia Institute of Technology
Baseline = 204.617
Uncertainty analysis

Uncertainty analysis of NPV
NPV results of optimal EEM and EFM under uncertainty for the office building
case 5

Stochastic Optimization
Building Energy Model
EPC
P1 , P2, P3
Energy Cost
Demand Charge Cost
Investment Cost
Stochastic Optimization
Different Rate Structure
Georgia Power,Pacific Gas and
Eclectic Company,Southern California
Edison
Different Building TypesOffice
HospitalMall
Optimal Mix
UncertaintyRepository
Productivity LossCost of Products
Change in Demand Charge rates
Other costs

Optimization criteria
(1) 𝛉𝛉∗= arg maxθ∈Θ
E NPV 𝛉𝛉, 𝛏𝛏
(2)𝛉𝛉∗ = arg max𝜃𝜃∈Θ
𝐸𝐸 𝑁𝑁𝑁𝑁𝑁𝑁 𝜽𝜽, 𝝃𝝃 & 𝜎𝜎 𝑁𝑁𝑁𝑁𝑁𝑁 𝜽𝜽, 𝝃𝝃 ≤ 𝑁𝑁𝑙𝑙𝑙𝑙𝑙𝑙𝑙𝑙𝑙𝑙
(3)𝛉𝛉∗ = argmax𝜃𝜃∈Θ
𝑁𝑁𝑁𝑁𝑁𝑁 𝜽𝜽, 𝝃𝝃 & 𝑁𝑁𝑃𝑃𝑃𝑃𝑃𝑃 𝑁𝑁𝑁𝑁𝑁𝑁 𝜽𝜽, 𝝃𝝃 ≥ 𝑁𝑁𝑙𝑙𝑙𝑙𝑙𝑙𝑙𝑙𝑙𝑙 > 𝑁𝑁𝑃𝑃𝑃𝑃𝑃𝑃𝑙𝑙𝑙𝑙𝑙𝑙𝑙𝑙𝑙𝑙
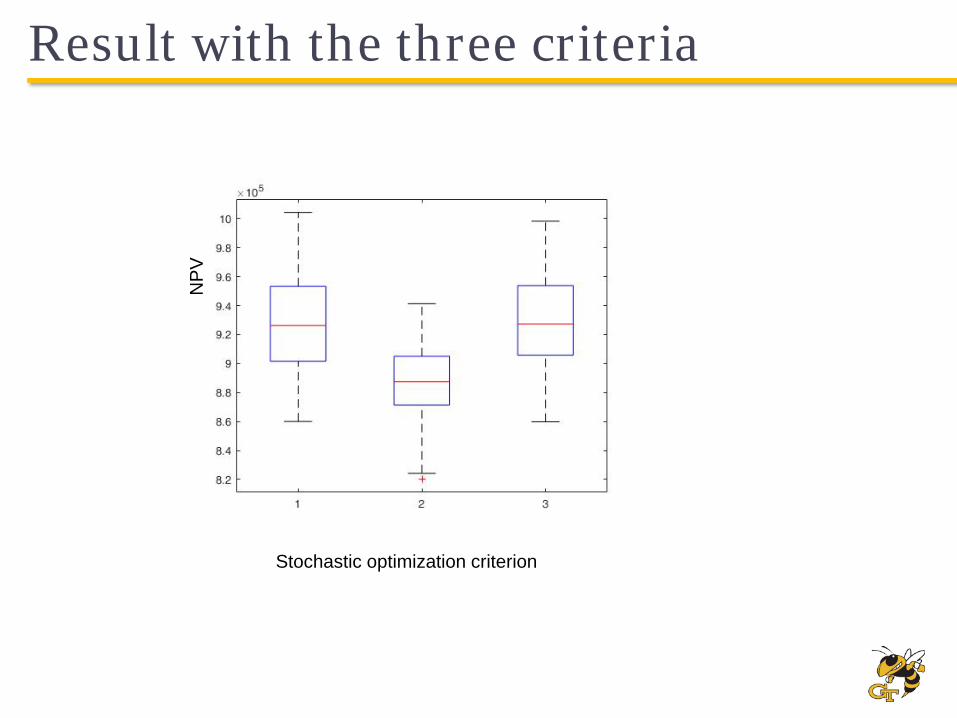
Result with the three criteria
Stochastic optimization criterion
NPV

Back to the major questionHow do we validate the building energy model (for our research purpose)?
• Focus on MFU• Relate to other relevant uncertainties
Validity question: will stakeholder decisions be influenced by model fidelity, i.e. do the risk measures change such that stakeholder will make other decision.
In our case we proceed as follows to answer this question:• We start from the low fidelity tool• Quantify MFU by comparing to high fidelity model: “delta” in power(t)• Develop a statistical model of delta (time series) and add to our model• Redo the stochastic optimization• Inspect the impact on the relevant risk measures

The result for delta(t)
Delta [kW] between EPC and EnergyPlus
Time series fit of delta (t)
Two steps:Step 1: without tuning deltaStep 2: after tuning deltaC

Repeat stochastic optimizationFindings: • With delta, in some cases different optimum• With deltaC, in all cases same optimum (when using criterion 1)
Distribution with delta=0(original case)
Distribution with delta
Distribution with deltaC

Impact of delta on risk measuresQuestion: will the added delta lead to rejecting an optimum set that was acceptable Example criterion 3: P(NPV > 0.9M) > .8
31.0% 69.0%
0.9000 +∞
0.75
0.80
0.85
0.90
0.95
1.00
1.05
1.10
1.15
Values in Millions ($)
0.0
0.1
0.2
0.3
0.4
0.5
0.6
0.7
0.8
0.9
1.0
Value
s x 10
^-5
NPV
NPV
Minimum $777,228.45Maximum $1,101,163.36
Mean $927,996.48Std Dev $65,738.34Values 100
@RISK Course VersionGeorgia Institute of Technology
21.0% 79.0%
0.9000 +∞
0.84
0.86
0.88
0.90
0.92
0.94
0.96
0.98 1.00
Values in Millions ($)
0.0
0.2
0.4
0.6
0.8
1.0
1.2
1.4
Valu
es x
10^
-5
NPV
NPV
Minimum $854,027.43Maximum $998,495.46
Mean $927,711.41Std Dev $33,411.67Values 100
@RISK Course VersionGeorgia Institute of Technology
Passes
Does not pass; P = 0.69
Almost passes: P =0.79
What does it all mean?
Work is continuing:• SA used to rank delta and deltaC against other uncertainties• Apply to more cases; draw general conclusions
For now the conclusions are:- Our reduced-order model is valid for power studies- Some fine tuning is sometimes necessary
We will apply the same technique to multi building nodes (each has its own delta)
Since the reduced order tool is simple but adequate, we are developing a do-it-yourself tool for building operators (totally Excel based)

General conclusions
Many urban energy model developments choose a BEM based on a hunch rather than on inspection of validity
Many current neighborhood energy models are over-engineered
If less is known about the buildings, the role of MFU becomes less important (rather self evident but now quantifiable)
The introduction of risk measures is necessary to conduct validity tests
The DC reduction optimization can be packaged as a DIY tool


Uncertainty Analysis
Parameter UQ Repository
Simulation Engine
0
0
0
P, S
Major development
gbXML schema extension: gbXML_uq
MF
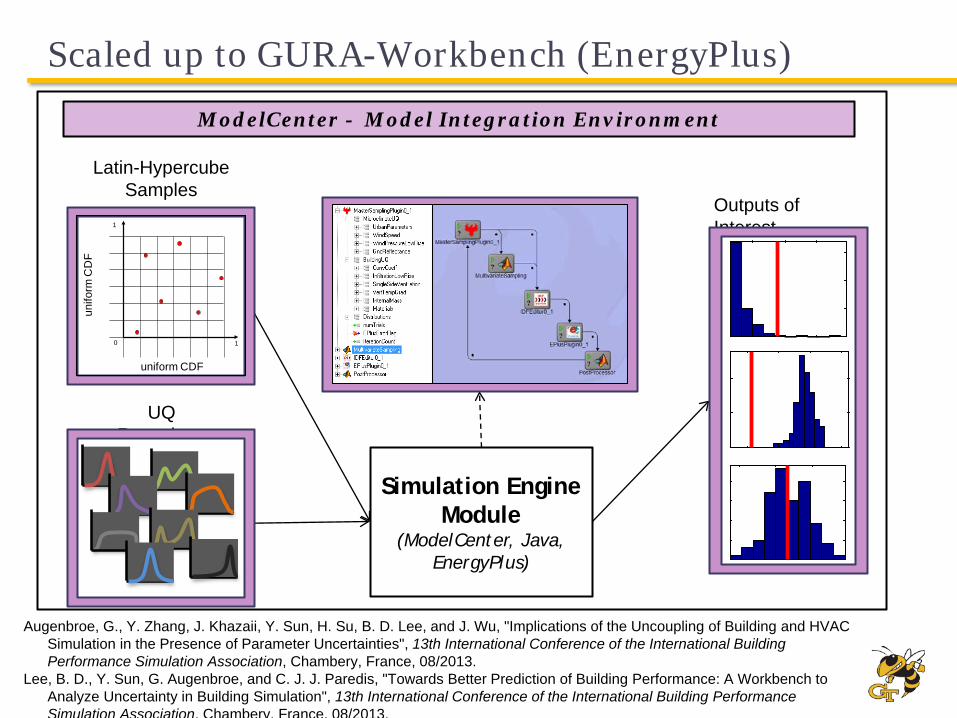
ModelCenter - Model Integration Environment
Scaled up to GURA-Workbench (EnergyPlus)
Latin-Hypercube Samples
UQ Repository
Outputs of Interest
Simulation Engine Module
(ModelCenter, Java, EnergyPlus)
uniform CDF
unifo
rm C
DF
0 1
1
0
0
0
Augenbroe, G., Y. Zhang, J. Khazaii, Y. Sun, H. Su, B. D. Lee, and J. Wu, "Implications of the Uncoupling of Building and HVAC Simulation in the Presence of Parameter Uncertainties", 13th International Conference of the International Building Performance Simulation Association, Chambery, France, 08/2013.
Lee, B. D., Y. Sun, G. Augenbroe, and C. J. J. Paredis, "Towards Better Prediction of Building Performance: A Workbench to Analyze Uncertainty in Building Simulation", 13th International Conference of the International Building Performance Simulation Association, Chambery, France, 08/2013.