energy policies of iea countries 2003 -- 2003 reviewlibrary.umac.mo/ebooks/b1362247x.pdf · and...
TRANSCRIPT

Energy Policies of IEA Countries
-:HSTCQE=UVY]UU:
(61 2003 13 1 P1) €120ISBN 92-64-01480-2
2003 Review
This volume contains an analysis of developments in energy policiesand markets in the Member countries of the International Energy Agency.
It includes:
■ Summaries of the in-depth reviews of Austria, Hungary, Italy, Ireland,Japan and Switzerland conducted from October 2002 to June 2003.The full reviews are published separately.
■ Short reviews of policy developments in Australia, Belgium,Czech Republic, New Zealand, Norway, Spain, and Turkey.
■ Energy balances and key statistical data for all Member countries.
■ Key energy statistics since 1973.
The overview section examines trends in energy markets, including ananalysis of recent trends in energy demand, supply and the fuel prices.
It highlights key issues related to energy security, which remainsa major government preoccupation. It examines Member countries’
progress in energy market reform, their actions to meet the Kyotogreenhouse gas emissions targets, their policies on energy
efficiency and energy R&D. It contains a short studyof developments in non-Member countries, including China,
India, Southeast Asia, Latin America, Russia, Central andSouth-eastern Europe and Saudi Arabia.
En
erg
y Po
licies o
fIE
A C
ountries
20
03
Review
I N T E R N AT I O N A L E N E R G Y A G E N C Y
Energy Policiesof IEA Countries
2003 Review
Comp 4bis 20/11/03 16:58 Page 1

I N T E R N AT I O N A L E N E R G Y A G E N C Y
Energy Policiesof IEA Countries
2003 Review
001-Intro 2/12/03 10:59 Page 1
© OECD/IEA, 2003
Applications for permission to reproduce or translate all or part of this publication should be made to: Head of Publications Service, OECD
2, rue André-Pascal, 75775 Paris Cedex 16, France.
INTERNATIONAL ENERGY AGENCY9, rue de la Fédération,
75739 Paris Cedex 15, France
The International Energy Agency (IEA) is anautonomous body which was established in November1974 within the framework of the Organisation forEconomic Co-operation and Development (OECD) toimplement an international energy programme.
It carries out a comprehensive programme of energy co-operation among twenty-six* of the OECD’s thirtymember countries. The basic aims of the IEA are:
• to maintain and improve systems for coping with oilsupply disruptions;
• to promote rational energy policies in a globalcontext through co-operative relations with non-member countries, industry and internationalorganisations;
• to operate a permanent information system on theinternational oil market;
• to improve the world’s energy supply and demandstructure by developing alternative energy sourcesand increasing the efficiency of energy use;
• to assist in the integration of environmental andenergy policies.
* IEA member countries: Australia, Austria, Belgium,Canada, the Czech Republic, Denmark, Finland, France,Germany, Greece, Hungary, Ireland, Italy, Japan, the Republicof Korea, Luxembourg, the Netherlands, New Zealand,Norway, Portugal, Spain, Sweden, Switzerland, Turkey, theUnited Kingdom, the United States. The EuropeanCommission also takes part in the work of the IEA.
ORGANISATION FOR ECONOMIC CO-OPERATION
AND DEVELOPMENT
Pursuant to Article 1 of the Convention signed in Parison 14th December 1960, and which came into forceon 30th September 1961, the Organisation forEconomic Co-operation and Development (OECD) shallpromote policies designed:
• to achieve the highest sustainable economic growthand employment and a rising standard of living inmember countries, while maintaining financialstability, and thus to contribute to the developmentof the world economy;
• to contribute to sound economic expansion inmember as well as non-member countries in theprocess of economic development; and
• to contribute to the expansion of world trade on amultilateral, non-discriminatory basis in accordancewith international obligations.
The original member countries of the OECD are Austria,Belgium, Canada, Denmark, France, Germany, Greece,Iceland, Ireland, Italy, Luxembourg, the Netherlands,Norway, Portugal, Spain, Sweden, Switzerland, Turkey, theUnited Kingdom and the United States. The followingcountries became members subsequently throughaccession at the dates indicated hereafter: Japan (28th April 1964), Finland (28th January 1969), Australia(7th June 1971), New Zealand (29th May 1973), Mexico (18th May 1994), the Czech Republic (21st December 1995), Hungary (7th May 1996), Poland (22nd November 1996), the Republic of Korea(12th December 1996) and Slovakia (28th September2000). The Commission of the European Communitiestakes part in the work of the OECD (Article 13 of the OECDConvention).
001-Intro 2/12/03 10:59 Page 2

FOREWORD
Reviewing the energy policies of member countries is a central activity of theInternational Energy Agency. Regular reviews have contributed substantiallyover the years to policy-making at the national level.
Each member country is reviewed in depth every four years. This book containssummaries of reviews of Austria, Hungary, Ireland, Italy, Japan and Switzerlandconducted from October 2002 to June 2003. Shorter standard reviews are alsoincluded covering seven other member countries: Australia, Belgium, the CzechRepublic, New Zealand, Norway, Spain and Turkey.
An overview focuses on recent developments in the energy market and inenergy policies. The subjects highlighted this year include energy security, theprogress of member countries in regulatory reform, their actions to meet theKyoto greenhouse gas emission targets, their policies on energy efficiency andenergy R&D as well as developments in major non-member countries. Keystatistical information is also included.
Claude MandilExecutive Director
3
001-Intro 2/12/03 10:59 Page 3

001-Intro 2/12/03 10:59 Page 4

ACKNOWLEDGEMENTS
Much of the information in this report is drawn from in-depth reviews conductedby representatives of IEA member countries and members of the IEA Secretariat.The information contained in this publication is the best available as of September2003 and is subject to change. The desk officer listed in each team wasresponsible for managing the review and was principal author of the report, whichhas also been published in a separate volume and appears in summary form here.The desk officers also wrote the shorter standard reviews included here.
Jun Arima supervised preparations for this book and wrote the chapters onmarket trends and energy security. Many members of the IEA staff contributedto this book. Major contributions came from Antoine Halff, Lawrence Eagles(oil market trend), Fatih Birol, Gordon Duffus (energy security) Doug Cooke,Peter Fraser (electricity), Sylvie Cornot-Gandolphe (gas), John Cameron (coal),Jonathan Pershing, Kristi Varangu, Nicolas Lefevre (environment), MitsuhideHoshino (R&D), Alan Meier (efficiency), Xavier Chen (China), Ladan Mahboobi(India), Brett Jacobs (South-East Asia), Sylvie D’Apote, Anouk Honore (LatinAmerica), Emmanuel Bergasse (Central and South-eastern Europe), IsabelleMurray (Russia), Dunia Chalabi (Saudi Arabia). Karen Treanton, Toril Ekelandand Pierpaolo Cazzola (key statistics and indicators), Monica Petit (figures),Marilyn Ferris and Sandra Martin (editing).
2002–2003 IN-DEPTH REVIEWS
AustriaAlthough the in-depth review for Austria was conducted in the 2001-2002 reviewcycle, the timing of its publication meant that the summary of conclusions wasunable to appear in Energy Policies of IEA Countries – 2002 Review.
Team Leader: José Carvalho-Netto (Portugal). Team members: Louis Meuric(France), Kaj Stærkind (Denmark), Franz Söldner (EC), Jun Arima (IEA), ShigetakaSeki (IEA), Jonathan Coony (IEA).
FinlandAt the time of publication this report is under preparation. The summary ofconclusions and recommendations will be included in the 2004 edition.
HungaryTeam Leader: John Havard (United Kingdom). Team members: Helen Gratsia(Greece), Karina Veum (Norway), Timo Haapalehto (NEA), Olivier Appert (IEA),Alain Bilot (IEA), Pierre Audinet (IEA).
5
001-Intro 2/12/03 10:59 Page 5

Ireland
Team Leader: Michael Lear (New Zealand). Team members: Stephanie Bauer(Germany), Pekka Tervo (Finland), Johannes Maters (EC), Jun Arima (IEA),Jonathan Coony (IEA).
Italy
Team Leader: Didier Houssin (France). Team members: Jeroen Brinkhoff (theNetherlands), Kjetil Wilhelmsen (Norway), Wolfgang Langen (Germany),Johannes Maters (EC), Jun Arima (IEA), Sylvie Cornot-Gandolphe (IEA), PierreAudinet (IEA).
Japan
Team Leader: Hartmut Schneider (Germany). Team members: Samuel Baldwin(United States), Jordi Dolader i Clara (Spain), Alan Heyes (United Kingdom),Helen Ratcliffe (Australia), Peter Wilmer (NEA), Olivier Appert (IEA), RichardBaron (IEA), Lea Gynther (IEA).
Switzerland
Team Leader: Kazuyuki Katayama (Japan). Team members: Timo Ritonummi(Finland), Margrethe Slinde (Norway), Rober-Rush Price (NEA), Jonathan Pershing(IEA), Jun Arima (IEA), Lea Gynther (IEA).
STANDARD REVIEWS
Australia: Pierre Audinet; Belgium: Lea Gynther; Czech Republic: EmmanuelBergasse; New Zealand: Jonathan Coony; Norway: Jonathan Coony; Spain: LeaGynther; Turkey: Pierre Audinet.
6
ACKNOWLEDGEMENTS Energy Policies of IEA Countries
001-Intro 2/12/03 10:59 Page 6
TABLE OF CONTENTS
FOREWORD . . . . . . . . . . . . . . . . . . . . . . . . . . . . . . . . . . . . . . . . . . 3
ACKNOWLEDGEMENTS . . . . . . . . . . . . . . . . . . . . . . . . . . . . . . . . 5
OVERVIEW OF ENERGY POLICY ANDMARKET DEVELOPMENTS . . . . . . . . . . . . . . . . . . . . . . . 11
INTRODUCTION . . . . . . . . . . . . . . . . . . . . . . . . . . . . . . . . . . . 13
MARKET TRENDS . . . . . . . . . . . . . . . . . . . . . . . . . . . . . . . . . . 17Energy Demand: OECD . . . . . . . . . . . . . . . . . . . . . . . . . . . . . . . . . . . . . . 17Energy Consumption by Sector: OECD . . . . . . . . . . . . . . . . . . . . . . . . 23World Energy Production . . . . . . . . . . . . . . . . . . . . . . . . . . . . . . . . . . . . 28Energy Prices . . . . . . . . . . . . . . . . . . . . . . . . . . . . . . . . . . . . . . . . . . . . . . . 33Energy Intensity and CO2 Emissions . . . . . . . . . . . . . . . . . . . . . . . . . . . 47
ENERGY SECURITY . . . . . . . . . . . . . . . . . . . . . . . . . . . . . . . . . 55Near Term Risks . . . . . . . . . . . . . . . . . . . . . . . . . . . . . . . . . . . . . . . . . . . . . 55New Dimension of Energy Security . . . . . . . . . . . . . . . . . . . . . . . . . . . . 57Global Challenges for Energy Security . . . . . . . . . . . . . . . . . . . . . . . . . 61
ENERGY MARKET REFORM . . . . . . . . . . . . . . . . . . . . . . . . . 69Electricity . . . . . . . . . . . . . . . . . . . . . . . . . . . . . . . . . . . . . . . . . . . . . . . . . . . 69Gas . . . . . . . . . . . . . . . . . . . . . . . . . . . . . . . . . . . . . . . . . . . . . . . . . . . . . . . . 79Coal . . . . . . . . . . . . . . . . . . . . . . . . . . . . . . . . . . . . . . . . . . . . . . . . . . . . . . . 85
CLIMATE CHANGE AND SUSTAINABLE DEVELOPMENT . . 89Climate Change . . . . . . . . . . . . . . . . . . . . . . . . . . . . . . . . . . . . . . . . . . . . . 89Sustainable Development . . . . . . . . . . . . . . . . . . . . . . . . . . . . . . . . . . . . 98
ENERGY EFFICIENCY . . . . . . . . . . . . . . . . . . . . . . . . . . . . . . . 105General Trends in Efficiency Policies . . . . . . . . . . . . . . . . . . . . . . . . . . . 105Minimum Efficiency Regulations . . . . . . . . . . . . . . . . . . . . . . . . . . . . . . 106Voluntary Efficiency Programmes . . . . . . . . . . . . . . . . . . . . . . . . . . . . . . 109
TECHNOLOGY AND RESEARCH AND DEVELOPMENT POLICY . . . . . . . . . . . . . . . . . . . . . . . 111Critical Role of Energy Technology . . . . . . . . . . . . . . . . . . . . . . . . . . . . 111R&D Funding Challenge . . . . . . . . . . . . . . . . . . . . . . . . . . . . . . . . . . . . . 111Promising Areas for Clean Technology Development . . . . . . . . . . . . 112
7
PART 1
001-Intro 2/12/03 10:59 Page 7
The Role of the IEA to Promote Collaborative Efforts . . . . . . . . . . . . . 114Recent Trends in Member Countries’ Energy R&D Policies . . . . . . . . 117
ENERGY POLICIES IN NON-MEMBER COUNTRIES . . . . . 121China . . . . . . . . . . . . . . . . . . . . . . . . . . . . . . . . . . . . . . . . . . . . . . . . . . . . . . 121India . . . . . . . . . . . . . . . . . . . . . . . . . . . . . . . . . . . . . . . . . . . . . . . . . . . . . . . 123South-east Asia . . . . . . . . . . . . . . . . . . . . . . . . . . . . . . . . . . . . . . . . . . . . . . 124South America . . . . . . . . . . . . . . . . . . . . . . . . . . . . . . . . . . . . . . . . . . . . . . 126Russia . . . . . . . . . . . . . . . . . . . . . . . . . . . . . . . . . . . . . . . . . . . . . . . . . . . . . . 130Central and South-eastern Europe . . . . . . . . . . . . . . . . . . . . . . . . . . . . . 133Middle East . . . . . . . . . . . . . . . . . . . . . . . . . . . . . . . . . . . . . . . . . . . . . . . . . 136
THE COUNTRY REPORTS . . . . . . . . . . . . . . . . . . . . . . . . 139
IN-DEPTH REVIEWS: SUMMARIES . . . . . . . . . . . . . . . . . . . . 141Austria . . . . . . . . . . . . . . . . . . . . . . . . . . . . . . . . . . . . . . . . . . . . . . . . . . . . . 143Hungary . . . . . . . . . . . . . . . . . . . . . . . . . . . . . . . . . . . . . . . . . . . . . . . . . . . 151Ireland . . . . . . . . . . . . . . . . . . . . . . . . . . . . . . . . . . . . . . . . . . . . . . . . . . . . . 159Italy . . . . . . . . . . . . . . . . . . . . . . . . . . . . . . . . . . . . . . . . . . . . . . . . . . . . . . . . 169Japan . . . . . . . . . . . . . . . . . . . . . . . . . . . . . . . . . . . . . . . . . . . . . . . . . . . . . . 177Switzerland . . . . . . . . . . . . . . . . . . . . . . . . . . . . . . . . . . . . . . . . . . . . . . . . . 185
STANDARD REVIEWS . . . . . . . . . . . . . . . . . . . . . . . . . . . . . . 191Australia . . . . . . . . . . . . . . . . . . . . . . . . . . . . . . . . . . . . . . . . . . . . . . . . . . . . 193Belgium . . . . . . . . . . . . . . . . . . . . . . . . . . . . . . . . . . . . . . . . . . . . . . . . . . . . 203Czech Republic . . . . . . . . . . . . . . . . . . . . . . . . . . . . . . . . . . . . . . . . . . . . . 215New Zealand . . . . . . . . . . . . . . . . . . . . . . . . . . . . . . . . . . . . . . . . . . . . . . . 223Norway . . . . . . . . . . . . . . . . . . . . . . . . . . . . . . . . . . . . . . . . . . . . . . . . . . . . 235Spain . . . . . . . . . . . . . . . . . . . . . . . . . . . . . . . . . . . . . . . . . . . . . . . . . . . . . . 245Turkey . . . . . . . . . . . . . . . . . . . . . . . . . . . . . . . . . . . . . . . . . . . . . . . . . . . . . 253
ENERGY BALANCES AND KEY STATISTICAL DATAOF IEA COUNTRIES . . . . . . . . . . . . . . . . . . . . . . . . . . . . . . . . 261
ANNEX A: Energy Balances and Key Statistical Data Tables . . 367
ANNEX B: Government Energy R&D Budgets . . . . . . . . . . . . . 393
ANNEX C: International Energy Agency “Shared Goals” . . . . 419
ANNEX D: Communique . . . . . . . . . . . . . . . . . . . . . . . . . . . . . . . 421
ANNEX E: Measurement of Financial Support for Coal Production . . . . . . . . . . . . . . . . . . . . . . . . . . 425
ANNEX F: Glossary and List of Abbreviations . . . . . . . . . . . . . . 429
ANNEX G: Footnotes to Energy Balances and Key Statistical Data . . . . . . . . . . . . . . . . . . . . . . . . . . . . . . 433
8
TABLE OF CONTENTS Energy Policies of IEA Countries
PART 2
001-Intro 2/12/03 10:59 Page 8

Tables and Figures (Part 1)
TABLES
1. Total Primary Energy Supply in OECD Regions . . . . . . . . . . . . . . . . . . . . . 172. Total Final Consumption in OECD Regions . . . . . . . . . . . . . . . . . . . . . . . . 233. Electricity Consumption . . . . . . . . . . . . . . . . . . . . . . . . . . . . . . . . . . . . . . . . . . . . . 244. Electricity Generation by Source, 1992 and 2002 . . . . . . . . . . . . . . . . . 325. Quarterly Natural Gas Price Indices . . . . . . . . . . . . . . . . . . . . . . . . . . . . . . . . 406. Quarterly Steam Coal Price Indices . . . . . . . . . . . . . . . . . . . . . . . . . . . . . . . . . 437. Quarterly Electricity Price Indices . . . . . . . . . . . . . . . . . . . . . . . . . . . . . . . . . . . 458. Energy-related CO2 Emissions in IEA Countries . . . . . . . . . . . . . . . . . . . . 499. Electricity Market Reform Progress in EU Countries . . . . . . . . . . . . . . . . 71
10. Status of US Natural Gas Industry Restructuring at the Retail Level, by State, as of December 2002 . . . . . . . . . . . . . . . . . . . . . . . . . . . . . . 80
11. Natural Gas Market Reform Progress in EU Countries . . . . . . . . . . . . . . 8312. Major Product Areas Covered by Energy Star in Different Countries
as of 2003 . . . . . . . . . . . . . . . . . . . . . . . . . . . . . . . . . . . . . . . . . . . . . . . . . . . . . . . . . . . 110
FIGURES
1. Total Primary Energy Supply in OECD Countries, 1973 to 2002 . . 182. Oil Demand in OECD Countries by Region, 1973 to 2002 . . . . . . . . 193. Consumption of Oil Products by Sector in IEA Countries,
1973 to 2001 . . . . . . . . . . . . . . . . . . . . . . . . . . . . . . . . . . . . . . . . . . . . . . . . . . . . . . . 214. Natural Gas Demand in OECD Countries by Region,
1973 to 2002 . . . . . . . . . . . . . . . . . . . . . . . . . . . . . . . . . . . . . . . . . . . . . . . . . . . . . . . 215. Coal Demand in OECD Countries by Region, 1973 to 2002 . . . . . . 226. Electricity Demand (Final Consumption) in OECD Countries
by Region, 1973 to 2001 . . . . . . . . . . . . . . . . . . . . . . . . . . . . . . . . . . . . . . . . . . . 247. Total Final Consumption in OECD Countries by Source,
1973 to 2001 . . . . . . . . . . . . . . . . . . . . . . . . . . . . . . . . . . . . . . . . . . . . . . . . . . . . . . . 258. Final Consumption by Sector and by Source in OECD Countries,
1973 to 2001 . . . . . . . . . . . . . . . . . . . . . . . . . . . . . . . . . . . . . . . . . . . . . . . . . . . . . . . 279. World Oil Production, 1990 to 2002 . . . . . . . . . . . . . . . . . . . . . . . . . . . . . . . 29
10. World Natural Gas Production, 1990 to 2002 . . . . . . . . . . . . . . . . . . . . . 3011. World Coal Production, 1973 to 2002 . . . . . . . . . . . . . . . . . . . . . . . . . . . . . 3112. OECD Electricity Supply by Source, 1973 to 2002 . . . . . . . . . . . . . . . . 3313. Crude Oil Prices, 1972 to 2003 . . . . . . . . . . . . . . . . . . . . . . . . . . . . . . . . . . . . 3414. Indexed Fuel Prices, First Quarter 1999 to First Quarter 2003 . . . . 3415. Gasoline Price Trends in Selected IEA Countries,
January 1999 to April 2003 . . . . . . . . . . . . . . . . . . . . . . . . . . . . . . . . . . . . . . . 3516. OECD Unleaded Gasoline Prices and Taxes, First Quarter 2003 . . 3617. OECD Automotive Diesel Prices and Taxes, First Quarter 2003 . . . 37
9
Energy Policies of IEA Countries TABLE OF CONTENTS
001-Intro 2/12/03 10:59 Page 9

18. Diesel Price Trends in Selected IEA Countries, January 1999 to April 2003 . . . . . . . . . . . . . . . . . . . . . . . . . . . . . . . . . . . . . . . . 39
19. Space Heating Oil Price Trends in Selected IEA Countries, January 1999 to April 2003 . . . . . . . . . . . . . . . . . . . . . . . . . . . . . . . . . . . . . . . . 39
20. Gas and LNG Import Prices in the European Union, Japan and the United States, January 1999 to December 2002 . . . . . . . . 41
21. End-use Prices by OECD Region, First Quarter 1999 to First Quarter 2003 . . . . . . . . . . . . . . . . . . . . . . . . . . . . . . . . . . . . . . . . . . . . . . . 41
22. Gas Prices in IEA Countries, 2002 . . . . . . . . . . . . . . . . . . . . . . . . . . . . . . . . . 4223. End-use Coal Prices by OECD Region, First Quarter 1999
to First Quarter 2003 . . . . . . . . . . . . . . . . . . . . . . . . . . . . . . . . . . . . . . . . . . . . . . . 4424. Steam Coal Prices in IEA Countries, 2002 . . . . . . . . . . . . . . . . . . . . . . . . . 4425. End-use Electricity Prices by Region, First Quarter 1999
to First Quarter 2003 . . . . . . . . . . . . . . . . . . . . . . . . . . . . . . . . . . . . . . . . . . . . . . . 4526. Electricity Prices in IEA Countries, 2002 . . . . . . . . . . . . . . . . . . . . . . . . . . . 4627. Energy Intensity in Selected IEA Countries, 1973 to 2001 . . . . . . . . 4728. CO2 Emissions per GDP by Sector in IEA Countries, 2001 . . . . . . . . . 5029. CO2 Emissions per Capita by Fuel in IEA Countries, 2001 . . . . . . . . 5130. Energy-related CO2 Emissions by Sector in Selected IEA Countries,
1990 to 2001 . . . . . . . . . . . . . . . . . . . . . . . . . . . . . . . . . . . . . . . . . . . . . . . . . . . . . . . 5231. Total Primary Energy Supply in IEA Countries, 2002 . . . . . . . . . . . . . . 5432. Examples of Major Oil Supply Disruptions . . . . . . . . . . . . . . . . . . . . . . . . . 5633. Reserve Margins in IEA Countries, 2000 . . . . . . . . . . . . . . . . . . . . . . . . . . . 5834. World Power Generation Investment, 2000 to 2030 . . . . . . . . . . . . . . 6235. Status of State Electric Industry Restructuring Activity,
February 2003 . . . . . . . . . . . . . . . . . . . . . . . . . . . . . . . . . . . . . . . . . . . . . . . . . . . . . . 7436. Average Energy Use of Refrigerators in the United States,
1960 to 2005 . . . . . . . . . . . . . . . . . . . . . . . . . . . . . . . . . . . . . . . . . . . . . . . . . . . . . . . 10737. Fleet Average Fuel Economy of Cars and Personal Light Trucks
in Selected IEA Countries . . . . . . . . . . . . . . . . . . . . . . . . . . . . . . . . . . . . . . . . . . . 10838. Government Energy R&D Budgets in IEA Countries, 1974 to 2001 . . 112
10
TABLE OF CONTENTS Energy Policies of IEA Countries
001-Intro 2/12/03 10:59 Page 10

PART 1
OVERVIEW OF ENERGY POLICYAND MARKET DEVELOPMENTS
001-Intro 2/12/03 10:59 Page 11

001-Intro 2/12/03 10:59 Page 12

INTRODUCTION
From 2002 to early 2003, energy security continued to be of great importanceamong energy policy-makers influenced by the imminent concerns in the oilmarket. In January 2003, OECD crude oil stocks fell below the lower part of the five-year forecast. A strike in Venezuela, starting in December 2002,reduced production and effectively closed the ports, causing exports to falldramatically. Unrest in Nigeria and wide anticipation of war in Iraq caused greatconcern for a potentially broader disruption among oil producers in the Gulf. Inaddition, unusually cold weather in the northern hemisphere and increasedimport of heavy oil in Japan due to the temporary outage of 17 nuclear unitstightened the oil supply demand situation.
The IEA monitored the market situation very closely, providing regular updatesto its member countries. On the eve of the outbreak of hostilities in Iraq inFebruary, the IEA circulated an update on the oil market situation andconcluded that if oil producers increased their production, the market would beadequately supplied. Throughout this period, the IEA was in close consultationwith its member countries, the industry, major oil-producing countries, inparticular the Organization of Petroleum Exporting Countries (OPEC) and majornon-member consuming countries, notably China. IEA member countries did notrelease their stocks, totalling several years’ worth of Iraqi exports, but stoodready to respond promptly and massively if necessary. The market recognisedthis and consequently there was no price spike or supply disruption. As oil supplywas secured, the consumers’ sense of vulnerability diminished. In short, theemergency preparedness of the IEA was very effective.
However, energy security challenges which energy policy-makers need toconfront are not limited to near-term risks related to oil. Growing gas demandand rising import dependency in most IEA countries mean that security of gassupply is also important. In addition to these external developments, aninternal dimension of energy security has also risen in conjunction with marketreform in the gas and electricity sector.
During the 1990s, there was hope that the liberalised gas and electricitymarkets would automatically provide security of gas and electricity supply.While the markets can give the right investment signals to generators that leadto timely investment, the California energy crisis showed that power marketsare not able to ensure automatically security of supply. The blackout in theUnited States and Canada in August 2003 raised concerns about theadequacy of investment in the reliability of electricity networks. The heat wavein Northern Europe in August 2003 tested system limits. The reformed gasmarkets may not value security of supply either. With unbundling of gassupplies and transportation activities, investment – in particular in transitpipelines – may not correspond to the necessity. With market liberalisation and
1
13
001-Intro 2/12/03 10:59 Page 13

cost minimisation efforts, diversity of gas supplies may not be a company objective.Substantial investment which is necessary to develop new gas supplies and todeliver it to the market may be hindered because of regulatory uncertainty.
In this respect, the government needs to monitor the gas and electricity sectorperformance through enhanced dialogue between governments and allmarket participants. It is essential for energy markets to deliver efficient pricesignals and for related regulatory arrangements to allow an efficient responseto investment needs. Where market responses are slow or inadequate, some formof safety net may be needed to address reliability requirements. Developmentand diffusion of cleaner technologies for energy supply and end-use is essential.For example, renewable energy technologies can further diversify the energysupply mix and new technologies such as hydrogen and carbon capture andstorage can change the nature of future energy systems. This will substantiallyenhance long-term energy security as well as address environmental protectionand economic efficiency.
Energy security issues are a global challenge and cannot be addressed only byIEA member countries. Between now and 2030, more than 60% of theincrease in world primary energy demand is expected to come from developingcountries. Under an increasingly global energy system, meeting these energysecurity objectives will be possible only if it applies to IEA member and non-member countries alike. According to the World Energy Outlook 2002, theglobal energy resource base is large enough to meet the world’s growingdemand during the next three decades. However, the necessary investment ismassive and the bulk of it will be needed in developing countries and transitioneconomies. The World Energy Investment Outlook 2003 identified more thanUS$ 16 trillion needs to be invested to meet projected growth in energydemand. Sound macroeconomic management, removal of market barriers,establishment of a transparent, efficient and stable institutional and regulatoryframeworks and good governance are indispensable to facilitate such investment.The growing energy demand from non-IEA member countries also suggests thecritical importance of outreach and collaboration on energy crisis managementinvolving major energy producers and suppliers. A broader dialogue betweenoil and gas producers and consumers at all levels is also essential for globalenergy security. The Eighth International Energy Forum (IEF), held in Osaka inSeptember 2002, has made a substantial contribution towards this. Diffusionof technology to developing countries will also be critical.
All of these energy security challenges, namely near-term risk, new dimensionsof energy security and global challenges, dominated discussions at the IEAMinisterial meeting in April 2003. Ministers reaffirmed their readiness tocombat any disruption of oil supplies, including the judicious use ofemergency oil stocks, demand restraint and other response measures. They alsocommitted themselves to addressing longer-term energy security challengesthrough diversifying energy type, source and route and achieving greaterenergy efficiency. To this end, they emphasised the role of energy technology
14
INTRODUCTION Overview of Energy Policy and Market Developments
001-Intro 2/12/03 10:59 Page 14

development, demonstration and deployment as well as international technologycollaboration in such fields as energy efficiency, hydrogen and cleantechnologies with low pollution and carbon emissions. Noting an increasingreliance on natural gas in the energy mix and a growing import dependenceon natural gas, they instructed the Secretariat to assess gas security issues andidentify strategies, including securing diverse gas sources and routes as wellas technology development. In this respect, the importance of collaborationbetween government and industry has been emphasised. Furthermore, ministerscommitted themselves to strengthen the policy framework permitting marketsto meet global energy investment and trade needs and to promote anenvironment that will attract private investment. They also affirmed theincreasing importance of non-member countries in world energy markets,welcomed an improved dialogue between producers and consumers andurged the acceleration of energy security co-operation with non-membercountries, especially those critical to the global energy balance, recognisingthat security can only be assured through a more global framework.
In 2002, there was mixed progress in electricity market reform. Reformscontinued to advance in IEA Europe. With the amendment of the ElectricityDirective and a proposed regulation on cross-border electricity exchanges, allconsumers in the European Union will be eligible to choose suppliers by 2007.The EU directive also envisages legal unbundling of a transmission systemoperator by 2004 and unbundling of a distribution system operator by 2007.Implementation of these measures could lead to the development of theworld’s largest integrated electricity market. On the other hand, progress in theUnited States remained subdued following California’s experience and thesubsequent concerns about risk management due to the Enron failure. InCanada, the Ontario government decided to re-regulate prices, reversing themarket reform introduced in May 2002. In Australia, the Council of AustralianGovernments issued a report calling for swift reforms in the electricity and gasmarkets. Japan decided to expand the market opening to 63% by April 2005.
Market competition in the gas sector continued to spread in the EuropeanUnion with the amendment of the Gas Directive, making all consumerseligible to choose suppliers by 2007. Japan decided to expand the contestablemarket to 44% by April 2005. On the other hand, there is a more cautiousassessment of gas market liberalisation in the United States owing to deterioratingfinancial conditions of some market participants and shaken confidence in themarkets. Only two states changed their retail unbundling status in 2002.
A the time when this book was written, the near-term future of the internationalclimate change process remains uncertain. While 108 countries ratified the KyotoProtocol by May 2003, its threshold for the entry into force has not yet been met.The US and Australia have announced their intention to remain outside theProtocol, and Russia, of which ratification is necessary for the entry into force ofthe Protocol, has not yet taken a formal decision. Despite such uncertainty, thosecountries that have ratified the Protocol have taken significant steps over several
15
Overview of Energy Policy and Market Developments INTRODUCTION
001-Intro 2/12/03 10:59 Page 15

years to implement the agreement by various policies such as fiscal measures,regulatory instruments, voluntary agreements, tradable permits and RD&D. Inparticular, it is noteworthy that the European Union (EU) reached a politicalagreement on an EU-wide emissions trading scheme to be operative by 2005 andwhich will have a profound impact on the energy sector.
2002 was a significant milestone for multilateral discussions on sustainabledevelopment with the World Summit for Sustainable Development (WSSD),held from 26 August to 4 September 2002 in Johannesburg. Recognising thatenergy would play an important role in the Summit, the IEA contributedsubstantially throughout the WSSD preparatory process with the release of abrochure entitled Towards Solutions: Sustainable Development in the EnergySector. The Plan of Implementation agreed at WSSD contains many referencesto energy, such as energy diversification, improved access to energy, energyeducation, producer-consumer dialogue and partnership with the privatesector, most of which are consistent with the common position of IEA membercountries in the above-mentioned brochure. At the Summit, some 300 “Type2”activities, namely, voluntary partnerships among UN agencies, governments,industry, intergovernmental and non-governmental organisations, were announced,of which energy activities represent a significant number.
Most IEA member countries regard energy efficiency as one of the key policytools to achieve greenhouse gas (GHG) reduction targets as well as energysecurity. These goals sometimes run counter to other policies such as de-regulation in the energy market which transfers responsibility for energyefficiency to consumers. However, the energy crisis in several countries such asNew Zealand and California forced governments to reconsider their energyefficiency role and other forms of managing and forecasting energy demand.In 2003, IEA countries employed methods to promote energy efficiency,including adjusting energy prices, establishing financial instruments toencourage the use of efficient products and practices, mandating minimumefficiency levels and creating voluntary programmes.
Despite the critical role played by energy technologies, government energyR&D budgets have been pursuing a declining trend and industrial R&Dinvestments have become increasingly short-term owing to market liberalisation.Greater and sustained commitment is needed for energy R&D, in particular forpromising areas such as renewables, fossil fuels, hydrogen, nuclear, end-useand system optimisation. From 2002 to 2003, several IEA member countrieslaunched new initiatives, in co-operation with the IEA, in such fields as CO2
capture and storage, hydrogen and linkages between basic science and futureenergy technologies.
There have been various developments in major non-OECD countries in termsof energy security and energy market reform. This book contains a shortintroduction to such developments in China, India, South-East Asia, LatinAmerica, Russia, Central and South-eastern Europe, and Saudi Arabia.
16
INTRODUCTION Overview of Energy Policy and Market Developments
001-Intro 2/12/03 10:59 Page 16

MARKET TRENDS1
ENERGY DEMAND: OECD
After its initial decline in 2001 since 1990, total primary energy supply (TPES)of OECD countries further declined to 5 321 million tonnes of oil equivalent(Mtoe) in 2002, down by 0.2% from the previous year, reflecting a delay inthe recovery of the global economy. TPES decreased by 0.7% in OECD Europe
2
17
1. Owing to the availability of statistics, the sections on energy consumption and CO2 emissions onlypresent 2001 data.
Table 1
Total Primary Energy Supply in OECD Regions(Mtoe)
1990 2000 2001 20021
TPES TOTAL
Total OECD 4 517 5 316 5 333 5 321
North America 2 261 2 705 2 682 2 678
Europe 1 625 1 768 1 802 1 789
Pacific 631 843 849 854
OIL
Total OECD 1 901 2 166 2 177 2 153
North America 931 1 072 1 085 1 070
Europe 631 685 696 682
Pacific 340 408 397 401
GAS
Total OECD 840 1 154 1 135 1 158
North America 517 657 623 638
Europe 258 390 403 410
Pacific 65 107 109 110
COAL
Total OECD 1 058 1 088 1 107 1 101
North America 486 580 583 578
Europe 436 325 324 320
Pacific 136 184 200 203
1. Preliminary data.
Source: Energy Balances of OECD Countries, IEA/OECD Paris, 2003.
017-Markets Trends 2/12/03 10:50 Page 17
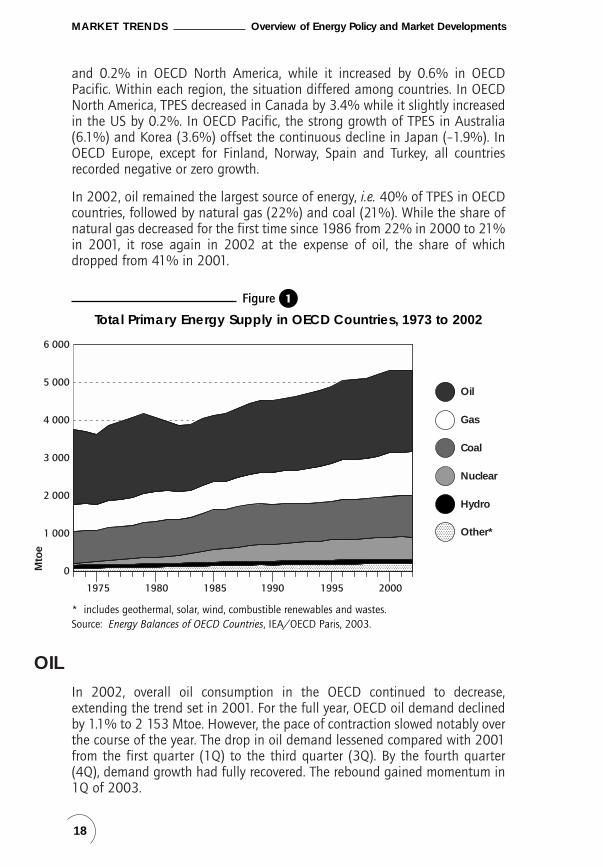
and 0.2% in OECD North America, while it increased by 0.6% in OECDPacific. Within each region, the situation differed among countries. In OECDNorth America, TPES decreased in Canada by 3.4% while it slightly increasedin the US by 0.2%. In OECD Pacific, the strong growth of TPES in Australia(6.1%) and Korea (3.6%) offset the continuous decline in Japan (–1.9%). InOECD Europe, except for Finland, Norway, Spain and Turkey, all countriesrecorded negative or zero growth.
In 2002, oil remained the largest source of energy, i.e. 40% of TPES in OECDcountries, followed by natural gas (22%) and coal (21%). While the share ofnatural gas decreased for the first time since 1986 from 22% in 2000 to 21%in 2001, it rose again in 2002 at the expense of oil, the share of whichdropped from 41% in 2001.
OIL
In 2002, overall oil consumption in the OECD continued to decrease,extending the trend set in 2001. For the full year, OECD oil demand declinedby 1.1% to 2 153 Mtoe. However, the pace of contraction slowed notably overthe course of the year. The drop in oil demand lessened compared with 2001from the first quarter (1Q) to the third quarter (3Q). By the fourth quarter(4Q), demand growth had fully recovered. The rebound gained momentum in1Q of 2003.
18
MARKET TRENDS Overview of Energy Policy and Market Developments
0
1 000
2 000
3 000
4 000
5 000
6 000
1975 1980 1985 1990 1995 2000
Mto
e
Oil
Gas
Coal
Nuclear
Hydro
Other*
* includes geothermal, solar, wind, combustible renewables and wastes.Source: Energy Balances of OECD Countries, IEA/OECD Paris, 2003.
Figure 1
Total Primary Energy Supply in OECD Countries, 1973 to 2002
017-Markets Trends 2/12/03 10:50 Page 18

The decrease in 2002 partly reflected delays in the long-awaited recovery ofthe global economy. Throughout 2002, expectations of economic recoverywere reportedly toned down and postponed. Weather factors also came intoplay with exceptionally mild temperatures in the winter of 2001-2002 acrossthe Northern Hemisphere, further depressing demand. The following year,weather patterns shifted into reverse, with North America, Europe and Asia allsuffering from colder-than-normal temperatures. As OECD economies remainedsluggish through mid-2003, the contrast in temperatures was the main factorbehind the dramatic recovery in winter oil demand.
Fuel switching to oil in Asia and North America compounded the effect of theweather. In the US, low natural gas supplies caused a winter rally in naturalgas prices, boosting demand for residual fuel oil and heating oil from powergenerators and industrial users. In Japan, safety issues surrounding nuclearpower generators of the boiling water reactor type caused a massive shortfallin nuclear power generation output, boosting utility demand for residual fueloil and crude oil for direct burn used as boiler fuel in thermal power plants. Incontrast, fuel switching to gas by electric utilities in France, Italy, Portugal andSpain undermined European oil demand. Those diverging dynamics are fullyreflected in the sharply contrasting pace of oil demand growth across theOECD. Whereas OECD European oil demand decreased in all quarters of2002, North American demand started recovering in 2Q and picked upmomentum in the second half of the year. Demand in the OECD Pacific regionfell in 1Q and 2Q, stayed roughly level in 3Q and peaked in 4Q. The contrast
19
Overview of Energy Policy and Market Developments MARKET TRENDS
0
500
1 000
1 500
2 000
2 500
1975 1980 1985 1990 1995 2000
Mto
e
OECDEurope
OECDTotal
OECDPacific
OECDNorth America
Source: Energy Balances of OECD Countries, IEA/OECD Paris, 2003.
Figure 2
Oil Demand in OECD Countries by Region, 1973 to 2002
017-Markets Trends 2/12/03 10:50 Page 19

continued in 1Q of 2003, with consumption soaring in OECD North Americaand OECD Pacific, but inching marginally lower in OECD Europe.
However, it is important to note that the increase in consumption in overallOECD demand in late 2002 to early 2003 appears largely to reflect one-offand temporary factors rather than lasting shifts affecting the structure of themarket. A return to more normal weather patterns would significantly curbdemand growth in the winter of 2003-2004. Assuming that Japaneseconcerns about nuclear safety will eventually be put to rest, full reactivationof the country’s nuclear power generating capacity will cause oil demand fromthe country’s utility sector to switch back to the previous declining pattern.Rising liquefied natural gas (LNG) output in the Asia-Pacific region will alsolikely boost natural gas consumption at the expense of oil. Falling NorthAmerican natural gas output may provide more lasting support to regional oildemand from the utility and industrial sectors. However, declines in NorthAmerican gas output are expected to be at least partly offset by increases inlocal LNG supply and capacity expansions at US LNG import terminals.
Furthermore, recent shifts in the market’s structure are more likely to curb oildemand growth than to boost it. Steep drops in air travel demand causedsuccessively by the economic downturn of 2001, the terrorist attacks of Septemberthat year, the Iraq war and the severe acute respiratory syndrome (SARS)epidemic of 2003, will likely result in permanent demand losses following cutsin airline fleets and steep efficiency gains resulting from the permanentretirement of older, less efficient aircraft. In Europe, increases in natural gas-fired power generating capacity will permanently trim residual fuel oildemand, while the continued dieselisation of the economic fleet will alsoresult in substantial efficiency gains.
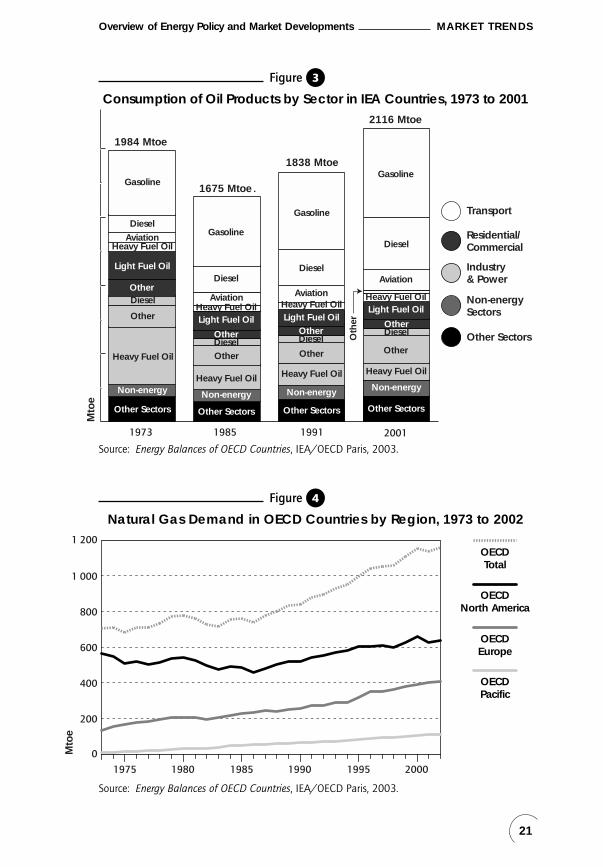
GAS
In 2002, natural gas demand in OECD countries was 1 158 Mtoe, up by 2%from 2001 after its first decrease in 2001 since 1987. This is due to the trendin OECD North America where gas consumption sharply decreased by 5.2%in 2001 and increased again by 2.4% in 2002. In the US, unusually coldweather boosted gas demand by household and commercial users whilecontinuing high gas prices curbed gas demand by industrial customers. Someindustrial plants, in particular aluminium producers, chose to close down theiractivity in view of the high costs of gas feedstock. Gas consumption in the USelectricity sector continued to increase as new gas-fired power plants were put on stream as well as limited fuel switching possibilities because ofenvironmental constraints.
Gas consumption in OECD Europe increased by 1.7% while it was much moremarginal compared with the steady growth over previous years. This marginal
20
MARKET TRENDS Overview of Energy Policy and Market Developments
017-Markets Trends 2/12/03 10:50 Page 20
21
Overview of Energy Policy and Market Developments MARKET TRENDS
Mto
e
1973 1985 1991 2001
Gasoline
Other Sectors
Other
Other
Light Fuel Oil
Non-energy
Diesel
Heavy Fuel Oil
Heavy Fuel OilAviation
DieselGasoline
Other Sectors
Other
Other
Light Fuel Oil
Non-energy
Diesel
Heavy Fuel Oil
Heavy Fuel OilAviation
Diesel
Gasoline
Other Sectors
Other
Other
Light Fuel Oil
Non-energy
Diesel
Heavy Fuel Oil
Heavy Fuel OilAviation
Diesel
Gasoline
Other Sectors
Other
Other
Light Fuel Oil
Non-energy
Diesel
Heavy Fuel Oil
Heavy Fuel Oil
Aviation
Diesel
1984 Mtoe
1675 Mtoe
1838 Mtoe
2116 Mtoe
Transport
Residential/Commercial
Industry& Power
Non-energySectors
Other SectorsOth
er
Source: Energy Balances of OECD Countries, IEA/OECD Paris, 2003.
Figure 3
Consumption of Oil Products by Sector in IEA Countries, 1973 to 2001
0
200
400
600
800
1 000
1 200
Mto
e
1975 1980 1985 1990 1995 2000
OECDEurope
OECDTotal
OECDPacific
OECDNorth America
Source: Energy Balances of OECD Countries, IEA/OECD Paris, 2003.
Figure 4
Natural Gas Demand in OECD Countries by Region, 1973 to 2002
017-Markets Trends 2/12/03 10:50 Page 21

increase was due to extremely warm weather conditions and the pooreconomic situation which influenced gas sales to industry and powergeneration. The rate of growth differed between countries with negative tomodest growth recorded in a few major gas-consuming countries, such as Italy,Germany, the Netherlands and the United Kingdom, while other markets, suchas Portugal, Spain and Turkey, saw above-average growth.
OECD Pacific gas demand showed a growth of 0.9%. The situation differedwidely between Australia and Korea which increased their gas consumption,and Japan, where gas demand decreased owing to the continuing economicslow-down.
COAL
In 2002, coal demand in OECD countries was 1 101 Mtoe, down by 0.5% from2001 after an increase of 1.7% from 2000. This reversal is mainly attributedto the development in OECD North America where coal demand decreased by0.9% in 2002. A decrease of 3.8% in coal power generation in the US led thistrend. Coal demand in OECD Europe continuously decreased by 1.2% as aresult of pressure from the European Union to reduce subsidies for domesticcoal production and for consumers, increased environmental awareness andgrowing natural gas penetration. Coal demand in OECD Pacific increased by1.5%, led by Australia. In Japan, while coal demand increased in the power
22
MARKET TRENDS Overview of Energy Policy and Market Developments
0
200
400
600
800
1 000
1 200
Mto
e
1975 1980 1985 1990 1995 2000
OECDEurope
OECDTotal
OECDPacific
OECDNorth America
Source: Energy Balances of OECD Countries, IEA/OECD Paris, 2003.
Figure 5
Coal Demand in OECD Countries by Region, 1973 to 2002
017-Markets Trends 2/12/03 10:50 Page 22

sector owing to the outage of nuclear power plants, it was offset by thedecrease in the industrial sector which made Japanese coal demand stablecompared to the previous year.
ENERGY CONSUMPTION BY SECTOR: OECD
In 2001, total final consumption (TFC) in OECD countries was 3 657 Mtoe,0.6% down from 2000. This is the first decline since 1990 and can beattributed to various factors, not least the economic slow-down in the US andglobal economies, warm weather, volatile energy prices and the terroristattacks of 11 September. On the other hand, TFC increased by 18% over its1990 level.
23
Overview of Energy Policy and Market Developments MARKET TRENDS
Table 2
Total Final Consumption in OECD Regions(Mtoe)
1990 1999 2000 2001
TFC TOTAL
Total OECD 3 106 3 564 3 677 3 657
North America 1 533 1 770 1 858 1 819
Europe 1 148 1 248 1 260 1 279
Pacific 425 546 560 559
INDUSTRY
Total OECD 1 085 1 198 1 260 1 225
North America 478 549 596 574
Europe 421 415 432 424
Pacific 187 233 232 227
RESIDENTIAL/COMMERCIAL
Total OECD 1 033 1 164 1 196 1 209
North America 478 532 561 545
Europe 432 473 466 492
Pacific 123 160 169 172
TRANSPORT
Total OECD 988 1 203 1 221 1 223
North America 578 689 701 700
Europe 295 360 362 363
Pacific 115 154 158 160
Source: Energy Balances of OECD Countries, IEA/OECD Paris, 2003.
017-Markets Trends 2/12/03 10:50 Page 23
Petroleum products accounted for the largest share in TFC (53%), followed bygas (20%), electricity (19%) and coal (3%). From 2000 to 2001, the share ofoil slightly increased from 52% to 53% at the expense of natural gas. This ismainly due to the sharp decrease in natural gas consumption in OECD NorthAmerica by 7.3% as a result of a price hike at the beginning of 2001. Thisshows a clear contrast with OECD Pacific and OECD Europe where natural gasconsumption increased by 3.3%.
24
MARKET TRENDS Overview of Energy Policy and Market Developments
OECDEurope
OECDTotal
OECDPacific
OECDNorth America
1975 1980 1985 1990 1995 2000
0
200
400
600
800
Mto
e
Source: Energy Balances of OECD Countries, IEA/OECD Paris, 2003.
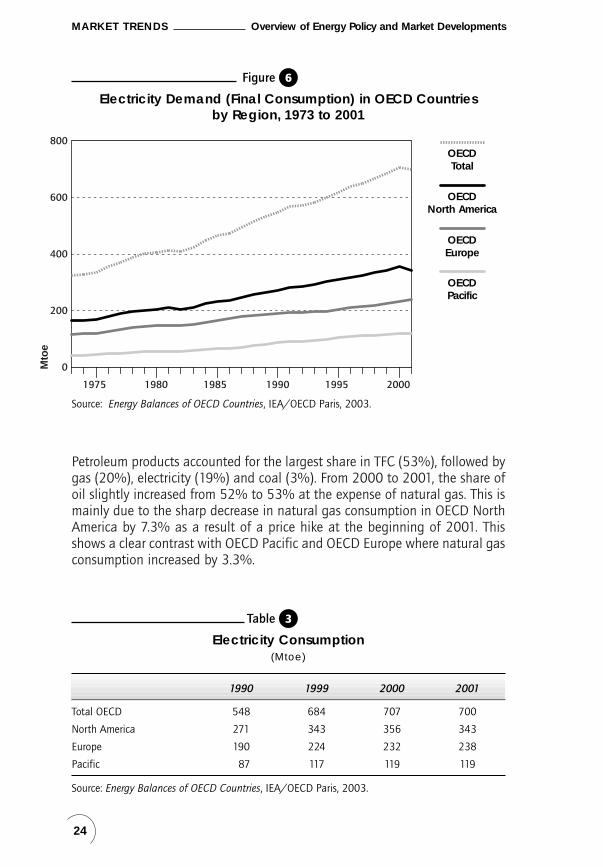
Figure 6
Electricity Demand (Final Consumption) in OECD Countries by Region, 1973 to 2001
Table 3
Electricity Consumption(Mtoe)
1990 1999 2000 2001
Total OECD 548 684 707 700
North America 271 343 356 343
Europe 190 224 232 238
Pacific 87 117 119 119
Source: Energy Balances of OECD Countries, IEA/OECD Paris, 2003.
017-Markets Trends 2/12/03 10:50 Page 24

Electricity consumption in OECD countries was 700 Mtoe, down by 1% from2000. This trend is most apparent in OECD North America where electricityconsumption decreased by 3.7% during this period mainly as a result of theelectricity crisis in California. On the other hand, electricity consumptionincreased by 2.6% in OECD Europe and remained stable in OECD Pacific.North America accounted for 49% of total OECD electricity consumption,followed by Europe (34%) and Pacific (17%).
As a consequence, TFC in OECD North America decreased by 2.1%, while itincreased in OECD Europe by 1.5%. TFC in OECD Pacific remained almostunchanged.
INDUSTRY SECTORIn 2001, OECD energy consumption in the industry sector was 1 225 Mtoe,decreasing by 3% from 2000. In particular, the decrease in OECD NorthAmerica was sharper (–3.7%) than those of OECD Europe (–2.0%) and OECDPacific (–2.1%). This clearly reflects the economic slow-down in the US andglobal economies as well as the terrorist attacks of 11 September and volatileenergy prices. In the mid-term, between 1990 and 2001, consumption growthwas stronger in OECD Pacific (21%) and OECD North America (20%),compared with OECD Europe (7.1%).
25
Overview of Energy Policy and Market Developments MARKET TRENDS
Oil
Gas
Coal
Electricity
Other*
1975 1980 1985 1990 1995 2000
0
1 000
2 000
3 000
4 000
Mto
e
* includes geothermal, solar, wind, combustible renewables and wastes.Source: Energy Balances of OECD Countries, IEA/OECD Paris, 2003.
Figure 7
Total Final Consumption in OECD Countries by Source, 1973 to 2001
017-Markets Trends 2/12/03 10:50 Page 25

From 2000 to 2001, gas and electricity consumption dropped by 6.8% and2.9% respectively, led by a sharp decrease in OECD North America by 11%and 5.6%. This is a clear contrast with OECD Europe and OECD Pacific wheregas and electricity consumption remained almost stable. Coal consumptionalso dropped by 4.4%, but this trend was mainly led by a sharp decrease inOECD Europe of 11%. Coal consumption in OECD North America and OECDPacific was stable.
In 2001, the industry sector accounted for 41% of total consumption in OECDPacific, 33% in OECD Europe and 32% in OECD North America.
In 2001, petroleum products accounted for 38% of industrial energyconsumption followed by natural gas (24%), electricity (22%) and coal(8.8%). However, the structure of energy use differed between regions. InOECD North America, the share of petroleum products was the largest (35%),followed by gas (29%), electricity (20%) and coal (5.9%). OECD Europe hasa similar structure with petroleum products (35%), gas (26%), electricity(24%) and coal (9.9%). On the other hand, in OECD Pacific, the share ofpetroleum products was much higher (50%), followed by electricity (23%),coal (14%) and gas (9.7%).
RESIDENTIAL/COMMERCIAL SECTOR
In 2001, energy consumption in the residential/commercial sector in OECDcountries was 1 209 Mtoe, up by 1.1% from 2000. However, the developmentfrom 2000 to 2001 differed substantially by region.
In OECD North America, energy consumption in this sector decreased by 2.7%while OECD Europe and OECD Pacific experienced an increase of 5.6% and1.3% respectively. Most of the decrease in OECD North America was observedin gas (4.4%) and electricity (2.8%) owing to the price hike of natural gas andthe Californian power crisis.
From 1990 to 2001, consumption growth was much stronger in OECD Pacific(40%) than in OECD North America (14%) and OECD Europe (14%).
In 2001, the residential/commercial sector accounted for 38% of total finalconsumption in OECD Europe, 31% in OECD Pacific and 30% in OECD NorthAmerica.
Fuel use structure also differed considerably between regions. In 2001, theshare of petroleum products in OECD Pacific was the largest (44%), followedby electricity (38%) and gas (14%). On the other hand, electricity accountedfor the largest share in OECD North America (41%), followed by gas (38%)and petroleum products (16%). In OECD Europe, gas held the largest share(33%), followed by electricity (27%) and petroleum products (24%).
26
MARKET TRENDS Overview of Energy Policy and Market Developments
017-Markets Trends 2/12/03 10:50 Page 26

27
Overview of Energy Policy and Market Developments MARKET TRENDS
Oil
Gas
Coal
Electricity
Other*
Oil
Gas
Coal
Electricity
Other*
Oil
Gas
Coal**
Electricity
0
200
400
600
800
1 000
1 200
1 400
Mto
e
0
200
400
600
800
1 000
1 200
1 400
1975 1980 1985 1990 1995 2000
1975 1980 1985 1990 1995 2000
1975 1980 1985 1990 1995 2000
Mto
e
0
200
400
600
800
1 000
1 200
1 400
Mto
e
Transport Sector
Residential/Commercial Sector
Industry Sector
** includes geothermal, solar, wind, combustible renewables and wastes.** negligible.Source: Energy Balances of OECD Countries, IEA/OECD Paris, 2003.
Figure 8
Final Consumption by Sector and by Source in OECD Countries,1973 to 2001
017-Markets Trends 2/12/03 10:50 Page 27

28
MARKET TRENDS Overview of Energy Policy and Market Developments
TRANSPORT SECTOR
In 2001, TFC in the OECD transport sector was 1 223 Mtoe, almost the samelevel as in 2000, a clear contrast with the robust growth since 1991.
In the mid-term, between 1990 and 2001, the growth of consumption wasstrongest in OECD Pacific (39%), followed by OECD Europe (23%) and OECDNorth America (21%).
OECD North America accounted for 57% of the OECD’s total transportdemand, followed by OECD Europe (30%) and OECD Pacific (13%). However,transport demand in OECD North America slightly decreased from 2000 to2001, the first decrease since 1991, while those in OECD Europe and OECDPacific slightly increased. In OECD North America, demand for jet fuelplummeted after 11 September, offsetting the demand increase of gasoline,fuelled by strong sales of sports utility vehicles and a switch from air to roadtransport.
The share of oil has remained at 97% and gas and electricity shares werestable at 1.7% and 0.7% respectively. Penetration of natural gas wasstrongest in OECD North America at 2.9%, while very weak in other OECDregions at 0.2%. On the other hand, OECD Europe and OECD Pacific hadelectricity shares of 1.7% and 1.3% respectively, while OECD North Americahad only 0.1%.
WORLD ENERGY PRODUCTION
OIL
World oil production totalled 76.5 million barrels per day (mb/d) in 2002,0.2% lower than in 2001. However, non-OPEC production was 1.37 mb/dhigher in that year, the sharpest annual increase since the mid-1980s. By farthe largest contribution to higher non-OPEC supply was that from the formerSoviet Union (FSU) which was 811 thousand barrels a day (kb/d), or 9.5%higher than in 2001, with Russia contributing 644 kb/d of the increase.Production from North America was 209 kb/d (1.5%) higher, largely due toincreased Canadian offshore east coast production and higher synthetic crudeoil supply. African production was up by 217 kb/d (7.8%) with a significantincrease due to higher Angolan production. Both China and Latin Americarecorded gains of around 100 kb/d, representing increases of 2.8% and 3.1%respectively. In the case of Latin America, a sharply higher output from thedeep water in Brazil offset production losses elsewhere. On top of these non-OPEC increases, the combined output of OPEC natural gas liquids (NGLs),condensates and non-conventional crude was up by 373 kb/d, or 12%, comparedto 2001. Set against these increases, however, were reductions in supply in theNorth Sea, OECD Pacific and non-OPEC Middle East.
017-Markets Trends 2/12/03 10:50 Page 28

The most significant supply reduction in 2002 was the 1.9 mb/d fall seen inOPEC crude oil production. The 2002 average production of an estimated25.1 mb/d was the Organization’s lowest annual level since 1994. The reductionin OPEC supply was in part the result of a succession of quota reductions madeover the course of the previous year and also disrupted Iraqi supplies. Thetarget production level for OPEC-10 (excluding Iraq) of 21.7 mb/d for January2002 remained in force, at least on paper, throughout the year, with anincrease to 23 mb/d only being agreed in December 2002 in light of a supplydisruption in Venezuela. OPEC production hit a low of 23.6 mb/d in April2002, coinciding with a sharper drop in Iraqi production. Iraqi production andexports remained constrained through 3Q, but total OPEC supply recoveredfrom this April low to average 25.3 mb/d by July and 26.5 mb/d by November.
In 2002, the Middle East accounted for 29% of world production followed byOECD North America (19%), FSU (13%), Africa (11%), Asia (9.4%), LatinAmerica (9.1%) and OECD Europe (8.8%).
GAS
World production of gas grew moderately to 2 618 billion cubic metres (bcm),up 0.9% over 2001, a lower growth than in previous years. Russia and the UScontinue to be the largest producing countries in the world, accounting forabout one-quarter each of global gas production.
29
Overview of Energy Policy and Market Developments MARKET TRENDS
Middle East
Non-OECDEurope
Former USSR
Asia
Latin America
Africa
OECD Europe
OECD Pacific
OECD NorthAmerica 0
10 000
20 000
30 000
40 000
50 000
60 000
70 000
80 000
1990 1992 1994 1996 1998 2000 2002
Mill
ion
bar
rels
per
day
Source: Oil Market Report, IEA.
Figure 9
World Oil Production, 1990 to 2002
017-Markets Trends 2/12/03 10:50 Page 29
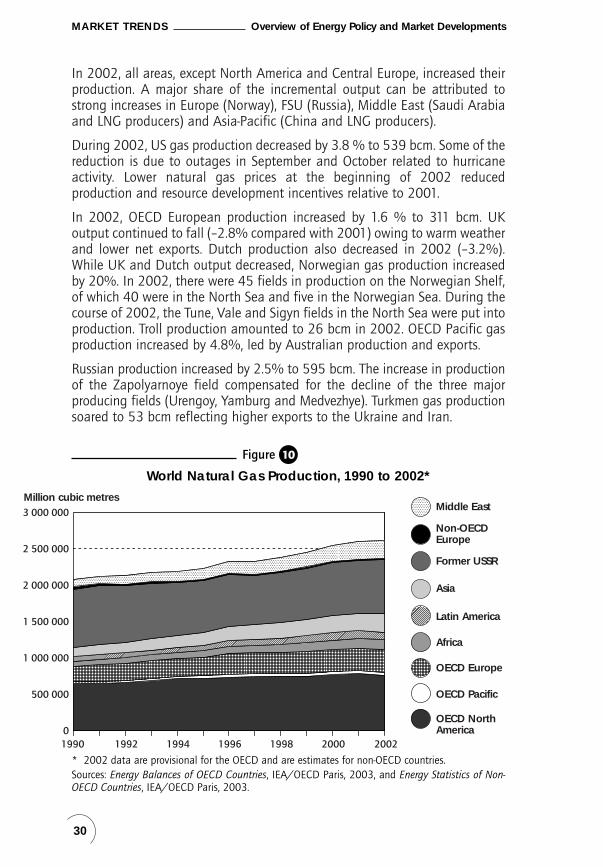
In 2002, all areas, except North America and Central Europe, increased theirproduction. A major share of the incremental output can be attributed tostrong increases in Europe (Norway), FSU (Russia), Middle East (Saudi Arabiaand LNG producers) and Asia-Pacific (China and LNG producers).
During 2002, US gas production decreased by 3.8 % to 539 bcm. Some of thereduction is due to outages in September and October related to hurricaneactivity. Lower natural gas prices at the beginning of 2002 reducedproduction and resource development incentives relative to 2001.
In 2002, OECD European production increased by 1.6 % to 311 bcm. UKoutput continued to fall (–2.8% compared with 2001) owing to warm weatherand lower net exports. Dutch production also decreased in 2002 (–3.2%).While UK and Dutch output decreased, Norwegian gas production increasedby 20%. In 2002, there were 45 fields in production on the Norwegian Shelf,of which 40 were in the North Sea and five in the Norwegian Sea. During thecourse of 2002, the Tune, Vale and Sigyn fields in the North Sea were put intoproduction. Troll production amounted to 26 bcm in 2002. OECD Pacific gasproduction increased by 4.8%, led by Australian production and exports.
Russian production increased by 2.5% to 595 bcm. The increase in productionof the Zapolyarnoye field compensated for the decline of the three majorproducing fields (Urengoy, Yamburg and Medvezhye). Turkmen gas productionsoared to 53 bcm reflecting higher exports to the Ukraine and Iran.
30
MARKET TRENDS Overview of Energy Policy and Market Developments
Middle East
Non-OECDEurope
Former USSR
Asia
Latin America
Africa
OECD Europe
OECD Pacific
OECD NorthAmerica
1990 1992 1994 1996 1998 2000 20020
500 000
1 000 000
1 500 000
2 000 000
2 500 000
3 000 000Million cubic metres
* 2002 data are provisional for the OECD and are estimates for non-OECD countries.Sources: Energy Balances of OECD Countries, IEA/OECD Paris, 2003, and Energy Statistics of Non-OECD Countries, IEA/OECD Paris, 2003.
Figure 10
World Natural Gas Production, 1990 to 2002*
Tho
usa
nd
ton
nes
017-Markets Trends 2/12/03 10:50 Page 30

Asia-Pacific, China, Indonesia and Malaysia saw gas production increase. Inresponse to growing LNG exports and domestic demand, gas production in theMiddle East also increased by 3.8%. In particular, production in Saudi Arabiaincreased with the addition of new non-associated gas wells to the Master GasSystem.
In 2002, OECD North America accounted for 29% of world natural gasproduction, followed by the FSU (28%), OECD Europe (12%), Middle East (9.6%)and Asia (8.4%).
COALIn 2001, world coal production was 4 713 million tonnes (Mt), up 0.3% from2001. Chinese coal production surged by 4.6%, becoming the second-largestcoal exporter. This is a clear contrast with the successive years of productiondecline from 1996 to 2000 due to the restructuring of local coal industries.Excluding China, world coal production decreased by 8.5%. Production in theFSU fell by 3.4%, while it grew from 1999 to 2001 after a continuous declinesince 1990. While coal production in OECD North America increased by 4.7%in 2001, it decreased again by 3.4% in 2002. Coal production in OECD Europecontinued to decrease by 2.4%. Coal production in OECD Pacific increased by3.1%, led by Australia.
31
Overview of Energy Policy and Market Developments MARKET TRENDS
Middle East**
Non-OECDEurope
Former USSR
Asia
Latin America
Africa
OECD Europe
OECD Pacific
OECD NorthAmerica0
500 000
1 000 000
1 500 000
2 000 000
2 500 000
3 000 000
3 500 000
4 000 000
4 500 000
5 000 000
1990 1992 1994 1996 1998 2000 2002
Tho
usa
nd
to
nn
es
** 2002 data are provisional for the OECD and are estimates for non-OECD countries.** negligible.Sources: Energy Balances of OECD Countries, IEA/OECD Paris, 2003, and Energy Statistics of Non-OECD Countries, IEA/OECD Paris, 2003.
Figure 11
World Coal Production, 1973 to 2002*
017-Markets Trends 2/12/03 10:50 Page 31

In 2002, Asia accounted for 39% of world coal production followed by OECDNorth America (23%), OECD Europe (13%) and the FSU (8.6%).
ELECTRICITY: OECD
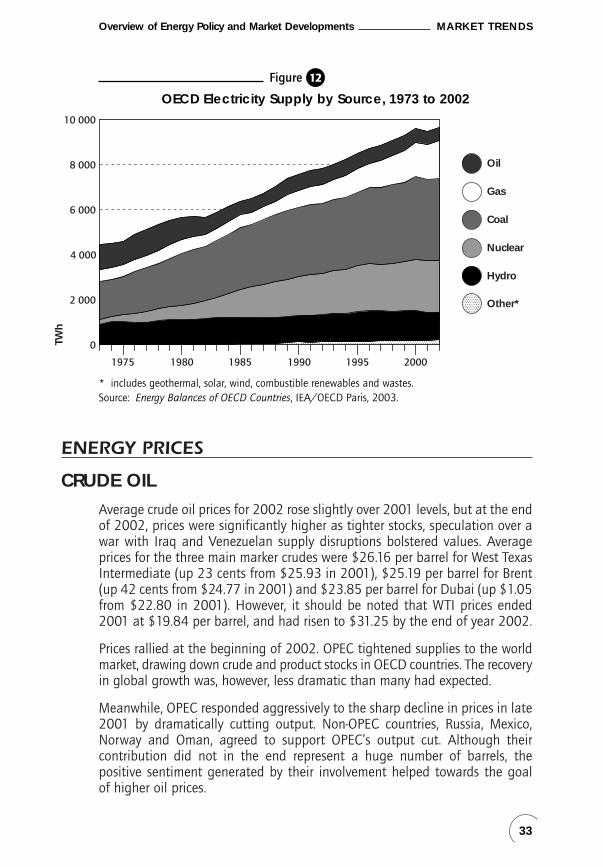
In 2002, electricity generation in OECD countries was 9 658 TWh, up by 1.7%from 2001 despite the slight decrease of TPES during the same period. Gas,oil and coal-fired generation rose by 7.4%, 1.8% and 0.9% respectively.Nuclear power also increased by 0.2%. In Japan, nuclear power generationdropped by 2.4% after the outage of nuclear power plants as a consequenceof data falsification problems. Because of the shortfall of nuclear powergeneration, oil, coal and gas power generation in Japan increased by 7.7%,3.6% and 2.4% respectively. Electricity generation from hydropower decreasedby 1.6%, mainly because of dry weather conditions in Nordic countries. Althoughelectricity generated from other renewables grew substantially by 13%, its shareis still marginal at 2.5%.
Shares in electricity generation in OECD countries were as follows: coal 38%,nuclear 24%, gas 18%, hydro 13% and oil 6%.
In the last decade, the share of gas in OECD electricity generation sharplyincreased at the expense of coal and oil. This trend is apparent in OECDEurope, particularly in the UK and Italy. Dependence on coal in the US andGermany is still much higher than the OECD average.
32
MARKET TRENDS Overview of Energy Policy and Market Developments
1992
2002
1992
2002
1992
2002
1992
2002
1992
2002
1992
2002
France Germany Italy Japan United United Kingdom States
Coal 38 28 305 302 25 41 138 284 194 126 1 741 1 971
Oil 9 8 13 6 116 76 251 154 30 6 107 97
Gas 3 17 33 56 35 109 175 250 13 150 427 716
Nuclear 338 437 159 165 – - 223 295 77 88 656 823
Hydro 69 61 17 23 42 40 83 80 5 5 254 248
Comb. Renewables 2 4 6 28 4 10 19 23 1 7 86 93
1. Preliminary data.
Source: Energy Balances of OECD Countries, IEA/OECD Paris, 2003.
Table 4
Electricity Generation by Source, 1992 and 20021
(TWh)
017-Markets Trends 2/12/03 10:50 Page 32
ENERGY PRICES
CRUDE OIL
Average crude oil prices for 2002 rose slightly over 2001 levels, but at the endof 2002, prices were significantly higher as tighter stocks, speculation over awar with Iraq and Venezuelan supply disruptions bolstered values. Averageprices for the three main marker crudes were $26.16 per barrel for West TexasIntermediate (up 23 cents from $25.93 in 2001), $25.19 per barrel for Brent(up 42 cents from $24.77 in 2001) and $23.85 per barrel for Dubai (up $1.05from $22.80 in 2001). However, it should be noted that WTI prices ended2001 at $19.84 per barrel, and had risen to $31.25 by the end of year 2002.
Prices rallied at the beginning of 2002. OPEC tightened supplies to the worldmarket, drawing down crude and product stocks in OECD countries. The recoveryin global growth was, however, less dramatic than many had expected.
Meanwhile, OPEC responded aggressively to the sharp decline in prices in late2001 by dramatically cutting output. Non-OPEC countries, Russia, Mexico,Norway and Oman, agreed to support OPEC’s output cut. Although theircontribution did not in the end represent a huge number of barrels, thepositive sentiment generated by their involvement helped towards the goal of higher oil prices.
33
Overview of Energy Policy and Market Developments MARKET TRENDS
Oil
Gas
Coal
Nuclear
Hydro
Other*
0
2 000
4 000
6 000
8 000
10 000
1975 1980 1985 1990 1995 2000
TWh
* includes geothermal, solar, wind, combustible renewables and wastes.Source: Energy Balances of OECD Countries, IEA/OECD Paris, 2003.
Figure 12
OECD Electricity Supply by Source, 1973 to 2002
017-Markets Trends 2/12/03 10:50 Page 33
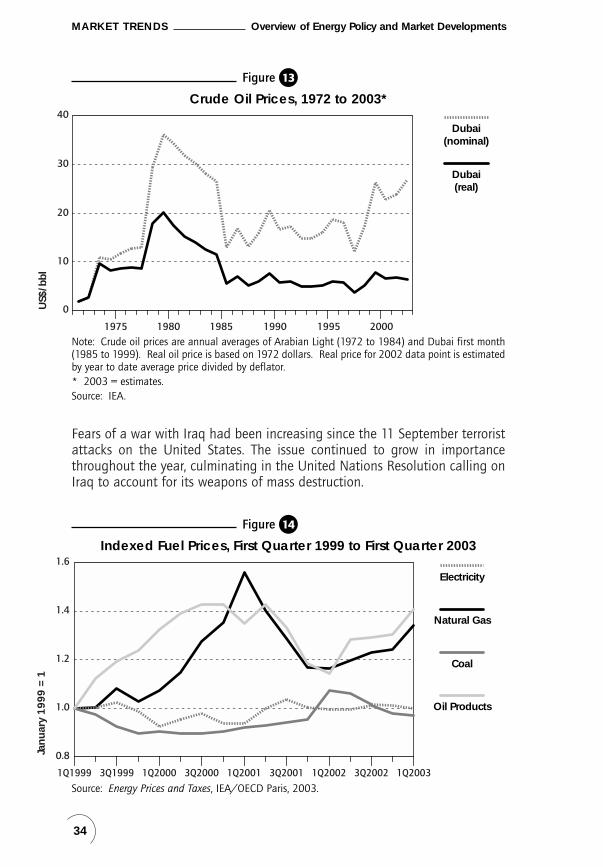
Fears of a war with Iraq had been increasing since the 11 September terroristattacks on the United States. The issue continued to grow in importancethroughout the year, culminating in the United Nations Resolution calling onIraq to account for its weapons of mass destruction.
34
MARKET TRENDS Overview of Energy Policy and Market Developments
0
10
20
30
40
US$
/bbl
Dubai(nominal)
Dubai(real)
1975 1980 1985 1990 1995 2000
Note: Crude oil prices are annual averages of Arabian Light (1972 to 1984) and Dubai first month(1985 to 1999). Real oil price is based on 1972 dollars. Real price for 2002 data point is estimatedby year to date average price divided by deflator.* 2003 = estimates.Source: IEA.
Figure 13
Crude Oil Prices, 1972 to 2003*
0.8
1.0
1.2
1.4
1.6
1Q1999 3Q1999 1Q2000 3Q2000 1Q2001 3Q2001 1Q2002 3Q2002 1Q2003
Jan
uar
y 1
99
9 =
1
Coal
Electricity
Oil Products
Natural Gas
Source: Energy Prices and Taxes, IEA/OECD Paris, 2003.
Figure 14
Indexed Fuel Prices, First Quarter 1999 to First Quarter 2003
017-Markets Trends 2/12/03 10:50 Page 34

Shortly after the UN weapons inspectors had resumed their work in Iraq,opponents of the Venezuelan President Hugo Chavez organised a generalstrike. Venezuela’s domestic oil production fell from around 2 655 mb/d inNovember to 0.7 mb/d by the end of 2002, removing supplies to the USmarket in the middle of a harsh winter.
GASOLINE
In 2002, gasoline prices broadly followed crude oil prices, but with someregional variations. Average gasoline prices fell by 8.1 cents per barrel inEurope and by 69 cents per barrel in the US. They were, however, $1.32higher in the Singapore region. The US and European markets werecharacterised by the absence of the spikes and volatility that had been seenin the previous two years. Part of this was due to the Bush Administrationeasing environmental restrictions to reduce the threat of a crisis in the latesummer of 1991 and to the fact that refiners had enjoyed a further year toput in place their new blend reformulated gasoline production facilities.Perhaps more important was the improvement in crude oil supplies in late2001 which allowed refiners to replenish gasoline stocks in the first quarterof the year. There was, therefore, less concern over a pre-summer gasolinesupply squeeze.
35
Overview of Energy Policy and Market Developments MARKET TRENDS
France
United Kingdom
Japan
United States
Germany
Canada
0.8
1.0
1.2
1.4
1.6
1.8
Jan99 May99 Sep99 Jan00 May00 Sep00 Jan01 May01 Sep01 Jan02 May02 Sep02 Jan03
Jan
uar
y 1
99
9 =
1
Source: Energy Prices and Taxes, IEA/OECD Paris, 2003.
Figure 15
Gasoline Price Trends in Selected IEA Countries,January 1999 to April 2003
017-Markets Trends 2/12/03 10:50 Page 35

36
MARKET TRENDS Overview of Energy Policy and Market Developments
00.
20.
40.
60.
81
1.2
1.4
US$
/litr
e
21
.7%
U
nite
d S
tate
s3
7.9
% C
anad
a4
9.1
% A
ust
ralia
45
% N
ew Z
eala
nd
57
.6%
Sl
ova
k Re
pu
blic
53
.8%
G
reec
e5
7.2
% Lu
xem
bo
urg
54
.5%
Ja
pan
60
.4%
C
zech
Rep
ub
lic6
2.2
% Po
lan
d6
0.8
% Sp
ain
63
.1%
Ir
elan
d6
2.3
% Sw
itzer
lan
d6
2.1
% A
ust
ria
63
.8%
H
un
gar
y
67
.3%
Po
rtu
gal
67
.8%
B
elg
ium
68
.4%
Tu
rkey
68
.7%
Sw
eden
71
.7%
Fr
ance
66
.6%
Ita
ly7
1.9
%
Ger
man
y6
8.2
%
Den
mar
k7
4.4
%
Un
ited
Kin
gd
om
69
.5%
Fi
nla
nd
69
.5%
N
eth
erla
nd
s6
7.5
%
No
rway
Tax
com
po
nen
t
Not
e:da
ta n
ot a
vaila
ble
for K
orea
and
Mex
ico.
Sour
ce:
Ener
gy P
rices
and
Tax
es, I
EA/
OEC
D P
aris
, 200
3.
Figu
re16
OEC
D U
nle
ad
ed
Ga
solin
e P
rice
s a
nd Ta
xes,
Firs
t Qua
rte
r 200
3
017-Markets Trends 2/12/03 10:50 Page 36

37
Overview of Energy Policy and Market Developments MARKET TRENDS
00.
20.
40.
60.
81
1.2
US$
/litr
e
11
.6%
N
ew Z
eala
nd
27
.6%
U
nite
d S
tate
s4
8.4
% A
ust
ralia
44
.7%
Ja
pan 51
.3%
G
reec
e
50
.3%
Lu
xem
bo
urg
52
.5%
Po
lan
d
55
.5%
Po
rtu
gal
56
.2%
Sl
ova
k Re
pu
blic
54
.1%
C
zech
Rep
ub
lic
53
.8%
Sp
ain
57
.3%
B
elg
ium
54
.2%
A
ust
ria
58
.1%
Ir
elan
d
58
.4%
N
eth
erla
nd
s
62
.5%
Fr
ance
53
.9%
Fi
nla
nd
58
.7%
H
un
gar
y
60
.9%
Ita
ly
58
% Sw
eden
64
% G
erm
any
62
.1%
Sw
itzer
lan
d
58
.2%
D
enm
ark
57
.2%
N
orw
ay
73
.1%
U
nite
d
Kin
gd
om
Tax
com
po
nen
t
Not
e:D
ata
not
avai
labl
e fo
r Can
ada,
Kor
ea, M
exic
o an
d Tu
rkey
.So
urce
:En
ergy
Pric
es a
nd T
axes
, IEA
/O
ECD
Par
is, 2
003.
Figu
re17
OEC
D A
uto
mo
bile
Die
sel P
rice
s a
nd Ta
xes,
Firs
t Qua
rte
r 200
3
017-Markets Trends 2/12/03 10:50 Page 37

38
MARKET TRENDS Overview of Energy Policy and Market Developments
A lack of volatility also occurred despite a general backdrop of higher motorgasoline demand in the US. This was partly due to a continued switch awayfrom airline travel after 11 September as well as the continued trend towardslow-efficiency sports utility vehicles. In 2002, in the Far East, average gasolineprices improved, helped by strong regional demand and lower refinery runs inthe region, particularly by Korean refiners.
DIESEL
Average diesel prices were lower in 2002 than in 2001, and followed thegeneral trend in crude oil prices, starting weak, but rising sharply towards theend of the year. Middle distillate inventories in OECD countries (which includeroad diesel and space heating oil) fell sharply in the second half of the yearas low refinery margins, caused by the OPEC output curbs, forced refiners tomaintain refinery throughput at low levels. High natural gas prices continuedto encourage the recent trend to fuel switching, but throughout the year dieseldemand showed only a modest increase of 0.8% in the major economies forwhich data are available. Regionally there was an exceptional 10% jump indemand in Korea, with France, Italy and the UK showing more modest growth.Diesel demand remained level in the US, but fell in Mexico and Japan by2.8% and 2.6% respectively.
SPACE HEATING OIL
Average prices for space heating oil fell sharply in 2002 compared with 2001levels. The relatively mild winter in 2001/02 and the postponement ofconsumer-level restocking in key countries helped to moderate demand in thesummer and most of the second half of the year. Even the impact of a verycold winter in the US in 2002/03 did not really start to take effect until theend of the year as consumer stocks became depleted. In 2002, heating oildemand actually fell by 2% year-on-year in the US. More dramatic demandfalls were seen in France and Germany, with offtake down by 7.8% and 8.9 %respectively, leaving the market with a net 3.5% fall in demand in majoreconomies. The sluggish offtake led to sustained average price falls in nearlyall regions.
NATURAL GAS
In 2002, the average import price decreased in the US to $3.15/millionBritish thermal units (MBtu) (down 29% from $4.43 in 2001). Import prices
017-Markets Trends 2/12/03 10:50 Page 38

39
Overview of Energy Policy and Market Developments MARKET TRENDS
France
United Kingdom
Japan
United States
Germany
Canada
Jan99 May99 Sep99 Jan00 May00 Sep00 Jan01 May01 Sep01 Jan02 May02 Sep02 Jan03
0.8
1.0
1.2
1.4
1.6
1.8
2.0
Jan
uar
y 1
99
9 =
1
Source: Energy Prices and Taxes, IEA/OECD Paris, 2003.
Figure 18
Diesel Price Trends in Selected IEA Countries,January 1999 to April 2003
France
United Kingdom
Japan
United States
Germany
Jan99 May99 Sep99 Jan00 May00 Sep00 Jan01 May01 Sep01 Jan02 May02 Sep02 Jan03
0.5
1.0
1.5
2.0
2.5
3.0
Jan
uar
y 1
99
9 =
1
Source: Energy Prices and Taxes, IEA/OECD Paris, 2003.
Figure 19
Space Heating Oil Price Trends in Selected IEA Countries,January 1999 to April 2003
017-Markets Trends 2/12/03 10:50 Page 39

are based on the evolution of prices on the US spot market (Henry Hub) and therefore reflect its volatility. In 2001, sharp increases were observedowing to local supply and demand conditions. As from 4Q 2001, prices at Henry Hub started to collapse because of a mild winter and economicrecession. From April 2002, there was again an upward trend to US$ 4/MBtuin December 2002 as supply tightened. In 1Q 2003, prices again rosedramatically ($19 in March 2003) and since then have remained at well above historical levels ($5 to $6) as US supply remains tight and storagelevels low.
Import prices in Europe also decreased in 2002 but not as sharply as in theUS. EU gas import prices by pipeline averaged US$ 3/MBtu, compared withan average US$ 3.52/MBtu in 2001, a decrease of 17.3%. This reflects, withan approximately six-month time lag, the movement of gasoil and LSFO prices(to which the price of imported gas is indexed) in European contracts. As gasprices decreased in 2002, gasoil and low sulphur fuel oil (LSFO) prices beganto rise in February/March 2002 and natural gas recovered its competitivenesswith other energies.
In Japan and Korea, imported liquefied natural gas (LNG) prices slightlydecreased in 2002 compared with 2001. In Japan, cif LNG import pricesamounted to US$ 4.32/MBtu on average, compared with US$4.64/MBtu in2001. Prices are based on the Japanese crude cocktail (JCC) and reflect theevolution of JCC with a time lag shorter than the European one. In Korea,imported LNG prices decreased to about US$ 4.3/MBtu in 2002 comparedwith US$4.95/MBtu in 2001.
End-use prices for natural gas in the US increased throughout the year 2002,even though prices increased by 27.6% from 1Q 2002 to 1Q 2003. On theother hand, end-use gas prices in OECD Europe were almost stable during thesame period reflecting long-term contracts. End-use gas prices in OECD Pacificwere also stable.
40
MARKET TRENDS Overview of Energy Policy and Market Developments
Table 5
Quarterly Natural Gas Price Indices
OECD North America Europe Pacific
1Q2002 117.9 121.4 113.9 112.5
1Q2003 135.7 155.0 113.5 113.2
Source: Energy Prices and Taxes, IEA/OECD Paris, 2003.
017-Markets Trends 2/12/03 10:50 Page 40

41
Overview of Energy Policy and Market Developments MARKET TRENDS
Japan(LNG)
European Union*(Natural Gas)
United States(LNG)
0
1
2
3
4
5
6
7
Jan99 Apr99 Jul99 Oct99 Jan00 Apr00 Jul00 Oct00 Jan01 Apr01 Jul01 Oct01 Jan02 Apr02 Jul02 Oct02
US$
/MB
tu
* Average import prices. Calculated average prices may not be comparable from one month to theother owing to differing components.Source: Energy Prices and Taxes, IEA/OECD Paris, 2003.
Figure 20
Gas and LNG Import Prices in the European Union, Japan and the United States, January 1999 to December 2002
Pacific
OECD Total
North America
Europe
80
100
120
140
160
180
200
1Q1999 3Q1999 1Q2000 3Q2000 1Q2001 3Q2001 1Q2002 3Q2002 1Q2003
1Q
19
99
=1
00
Source: Energy Prices and Taxes, IEA/OECD Paris, 2003.
Figure 21
End-use Gas Prices by OECD Region, First Quarter 1999 to First Quarter 2003
017-Markets Trends 2/12/03 10:50 Page 41

42
MARKET TRENDS Overview of Energy Policy and Market Developments
Industry Sector
Household Sector
Note: Tax information not available for the United States. Data not available for Australia, Belgium, Canada, Germany, Greece, Italy, Japan, Korea, Norway and Sweden.
Note: Tax information not available for the United States. Data not available for Australia, Austria, Belgium, Canada, Denmark, Germany, Greece, Italy, Japan, Korea, Luxembourg, Norway and Sweden.
Taxcomponent
Taxcomponent
Portugal
Spain
Czech Republic
Hungary
Switzerland
United Kingdom
United States
Netherlands
Ireland
Turkey
Finland
New Zealand
France
0 50 100 150 200 250 300 350US$/10E7 kcal GCV
Turkey
New Zealand
France
Denmark
Switzerland
Portugal
Czech Republic
Austria
Netherlands
Spain
Finland
Hungary
Luxembourg
United Kingdom
United States
Ireland
0 100 200 300 400 500 600 700 800
US$/10E7 kcal GCV
Source: Energy Prices and Taxes, IEA/OECD Paris, 2003.
Figure 22
Gas Prices in IEA Countries, 2002
017-Markets Trends 2/12/03 10:50 Page 42

COAL
Average steam coal prices in US dollar terms paid by consumers in 2002 fell inboth European and Asian markets. This reflects the downward trend in pricesfor traded coal that set in during 2001, ending the rise which began in 2000.
The data on final consumer prices show a time lag. The real movements in steamcoal prices are better illustrated by the movements in spot market prices.European spot prices increased in 1Q 2001 but then fell steadily, continuing tofall in 2002 so that by mid-2002 spot prices were as low as they were in 1999.They stabilised thereafter, and in the second half of 2002, moved up sharply asutilities bid for supplies in 4Q 2002 and helped on a cif basis by a markedhardening of shipping prices. Sea freight charges initially declined during 2001,easing the cost of imported coal, but then started to rise. Steam coal prices in theAsian spot market continued to rise during 2001 but followed the Europeanmarket down from the end of 2001, and thereafter rose more gently.
Exchange rate movements adversely affected margins for Australian producers,in particular causing several major suppliers to announce production cuts in2003, despite a potentially more favourable outlook for prices.
Coking coal prices are mainly settled in contract negotiations and show a muchmore complicated pattern. Prices for hard coking coal rose in 2001. Early andsmaller settlements in 2002 by Japanese steel companies with Chinese andRussian suppliers showed some price falls, but North American prices in Europeshowed variations with price increases for Canadian supplies to Germany, butelsewhere prices were stable or even reduced. More drawn-out Japanesenegotiations with Australian suppliers resulted in price rises, as well as withCanada – but this was against the background of a Japanese price level set in2001 at a lower level than for later customers. By contrast, Canadian suppliesto Brazil have only retained the price set in 2000 or have dropped.
In early 2001, spot prices for steam coal reached a peak, falling back significantlybefore recovering again in 2002. Coking coal contract prices, which increasedsubstantially for high-quality coals in 2001, show a more varied picture in 2002.Again, high-quality coals have seen some price increases. Trade also increasedover 2001, and stabilised in 2002.
43
Overview of Energy Policy and Market Developments MARKET TRENDS
Table 6
Quarterly Steam Coal Price Indices
OECD North America Europe Pacific
1Q2002 112.5 96.3 114.4 122.5
1Q2003 105.4 95.3 108.2 110.1
Source: Energy Prices and Taxes, IEA/OECD Paris, 2003.
017-Markets Trends 2/12/03 10:50 Page 43

44
MARKET TRENDS Overview of Energy Policy and Market Developments
70
80
90
100
110
120
1Q1999 1Q20033Q1999 1Q2000 3Q2000 1Q2001 3Q2001 1Q2002 3Q2002
1Q
19
99
=1
00
Pacific
OECD Total
North America
Europe
Source: Energy Prices and Taxes, IEA/OECD Paris, 2003.
Figure 23
End-use Coal Prices by OECD Region, First Quarter 1999 to First Quarter 2003
US$/tonne
Industry Sector
Taxcomponent
0 10 20 30 40 50 60 70 80 90 100
Switzerland
Turkey
United Kingdom
Czech Republic
Portugal
Japan
United States
Finland
Note: Brown coal price for the Czech Republic and Turkey. Data not available for Australia, Austria,Belgium, Canada, Denmark, France, Germany, Greece, Hungary, Ireland, Italy, Korea, Luxembourg, the Netherlands, New Zealand, Norway, Spain and Sweden.Source: Energy Prices and Taxes, IEA/OECD Paris, 2003.
Figure 24
Steam Coal Prices in IEA Countries, 2002
017-Markets Trends 2/12/03 10:50 Page 44

ELECTRICITY
Average electricity prices in the OECD area have been on a declining trendthroughout the past decade, but stabilised during the last three years. Higherfuel prices exerted an upward pressure in OECD countries, particularly inthose with growing electricity demand. In OECD North America and OECDPacific, price trends tended to peak in 3Q, reflecting peak summer demand.
45
Overview of Energy Policy and Market Developments MARKET TRENDS
1Q1999 1Q20033Q1999 1Q2000 3Q2000 1Q2001 3Q2001 1Q2002 3Q2002
85
90
95
100
105
110
115
1Q
19
99
=1
00
Pacific
OECD Total
North America
Europe
Source: Energy Prices and Taxes, IEA/OECD Paris, 2003.
Figure 25
End-use Electricity Prices by Region, First Quarter 1999 to First Quarter 2003
Table 7
Quarterly Electricity Price Indices
OECD North America Europe Pacific
1Q2002 92.3 91.0 91.9 96.9
1Q2003 90.5 88.5 90.2 96.4
Source: Energy Prices and Taxes, IEA/OECD Paris, 2003.
017-Markets Trends 2/12/03 10:50 Page 45

46
MARKET TRENDS Overview of Energy Policy and Market Developments
0 0.25
US$/kWh
0 0.11
US$/kWh
Industry Sector
Household Sector
Note: Price excluding tax for the United States. Data not available for Belgium, Canada, Germany, Italy, Japan, Korea, Spain and Sweden.
Note: Price excluding tax for the United States. Data not available for Austria, Belgium, Canada, Germany, Italy, Japan, Korea, Luxembourg, the Netherlands, Norway, Spain and Sweden.
Taxcomponent
Taxcomponent
0.01 0.02 0.03 0.04 0.05 0.06 0.07 0.08 0.09 0.10
0.05 0.10 0.15 0.20
Ireland
Denmark
Portugal
New Zealand
France
Finland
Greece
United States
Czech Republic
Hungary
United Kingdom
Australia
Switzerland
Turkey
Netherlands
United States
United Kingdom
Switzerland
Hungary
Finland
Turkey Ireland
New Zealand Australia
Greece Czech Republic
Norway
France
Austria
Denmark
Luxembourg
Portugal
Source: Energy Prices and Taxes, IEA/OECD Paris, 2003.
Figure 26
Electricity Prices in IEA Countries, 2002
017-Markets Trends 2/12/03 10:50 Page 46
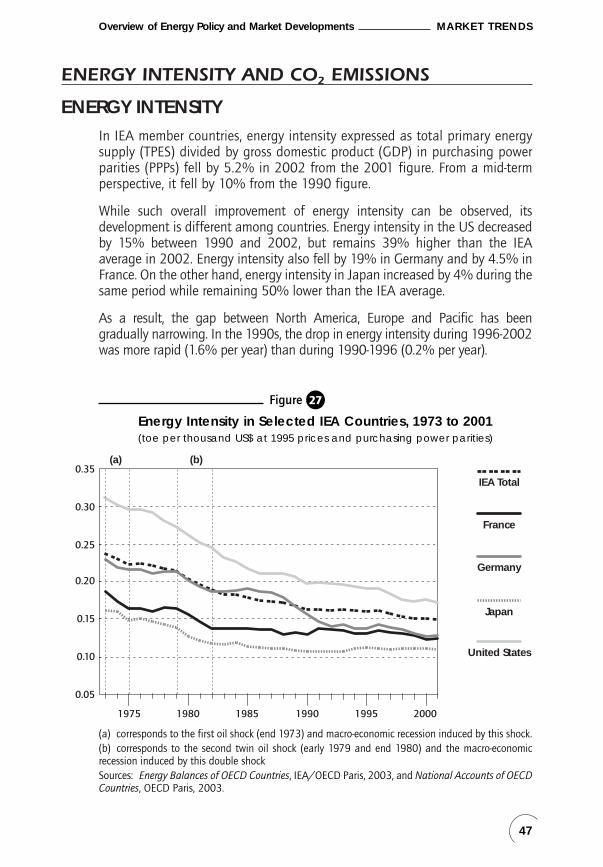
ENERGY INTENSITY AND CO2 EMISSIONS
ENERGY INTENSITY
In IEA member countries, energy intensity expressed as total primary energysupply (TPES) divided by gross domestic product (GDP) in purchasing powerparities (PPPs) fell by 5.2% in 2002 from the 2001 figure. From a mid-termperspective, it fell by 10% from the 1990 figure.
While such overall improvement of energy intensity can be observed, itsdevelopment is different among countries. Energy intensity in the US decreasedby 15% between 1990 and 2002, but remains 39% higher than the IEAaverage in 2002. Energy intensity also fell by 19% in Germany and by 4.5% inFrance. On the other hand, energy intensity in Japan increased by 4% during thesame period while remaining 50% lower than the IEA average.
As a result, the gap between North America, Europe and Pacific has beengradually narrowing. In the 1990s, the drop in energy intensity during 1996-2002was more rapid (1.6% per year) than during 1990-1996 (0.2% per year).
47
Overview of Energy Policy and Market Developments MARKET TRENDS
Germany
(a) (b)
IEA Total
Japan
United States
France
0.05
0.10
0.15
0.20
0.25
0.30
0.35
1975 1980 1985 1990 1995 2000
(a) corresponds to the first oil shock (end 1973) and macro-economic recession induced by this shock.(b) corresponds to the second twin oil shock (early 1979 and end 1980) and the macro-economicrecession induced by this double shockSources: Energy Balances of OECD Countries, IEA/OECD Paris, 2003, and National Accounts of OECDCountries, OECD Paris, 2003.
Figure 27
Energy Intensity in Selected IEA Countries, 1973 to 2001(toe per thousand US$ at 1995 prices and purchasing power parities)
017-Markets Trends 2/12/03 10:50 Page 47

CO2 EMISSIONS
Energy-related CO2 emissions in IEA member countries rose by a little over0.5% in 2001, reaching more than 11.8 billion tonnes, up by 14.5% comparedto 1990 levels. Aggregate emissions for IEA Europe rose by 3% between 1990and 2001, while emissions rose by close to 18% in IEA North America and byover 29% in IEA Pacific over the same period. Increased power generation(CO2 emissions from energy production rose by 23% in North America, 5% inEurope and 43% in the Pacific) and rising demand for road-based transport(CO2 emissions from the transport sector rose by 21% in North America, 19%in Europe and 39% in the Pacific) are the principal reasons for these risingemission trends. The relatively small rise in emissions in Europe is largely dueto significant emission reductions in several European countries as aconsequence of major economic changes that occurred during the 1990s. Thisis notably the case in the Czech Republic, Hungary and Germany. Significantshifts in the power generation fuel mix have also contributed towards areduction in GHG emission levels.
On average, CO2 emissions from the industry sector represent less than 15%of total energy-related emissions of IEA countries. Since 1990, total emissionlevels from the industry sector have declined marginally. Nevertheless, in somecountries, notably Germany and the UK, emissions have dropped significantlyowing to fuel switching to less carbon-intensive fuels as well as to structuralchanges.
The transport sector share of energy-related emissions ranges from as little as12% in the Czech Republic, to over 45% in Sweden. On average, it representsabout 27% of IEA energy-related CO2 emissions. Transport-related emissionshave continuously increased over the past decade. In 2001, emissions from thetransport sector were 13% above 1990 levels, with the US alone accountingfor over 50% of the total share. This trend is expected to continue as demandin the transport sector grows and alternative fuels and vehicles are notexpected to enter the market in the near future.
Energy production is by far the most significant source of energy-related CO2
emissions (over 43%) in most IEA countries. On a country level, this valueranges from over 60% in Australia to less than 7% in Switzerland where fossilfuel plays only a marginal role in heat and power generation. Although thecarbon content per unit of energy produced has remained more or less stableover the past decade, total emissions from energy production have risen byover 25% since 1990 in IEA countries. This is mainly attributable to thebuilding of additional power generating capacity, principally in North Americaand to a lesser extent in the Pacific region.
48
MARKET TRENDS Overview of Energy Policy and Market Developments
(Text continues on page 53.)
017-Markets Trends 2/12/03 10:50 Page 48

49
Overview of Energy Policy and Market Developments MARKET TRENDS
Table 8
Energy-related CO2 Emissions in IEA Countries(Excluding International Marine and Aviation Bunkers)
(million tonnes of CO2)
1990 2001 % change 2010 % change1990-2001 1990-2010
Canada 430 520 20.76 542 25.87United States 4 826 5 673 17.56 6 736 39.59North America 5 256 6 193 17.82 7 278 38.47
Australia 260 370 42.33 390 50.08Japan 1 019 1 132 11.15 .. ..Korea 226 436 92.68 .. ..New Zealand 22 33 47.35 34 51.61Pacific 1 527 1 971 29.06 .. ..
Austria 57 67 17.82 65 15.81Belgium 107 120 11.89 114 7.00Czech Republic 154 119 –22.80 103 –32.93Denmark 51 50 –0.22 64 26.27Finland 55 60 9.55 59 7.24France 353 385 9.12 462 30.96Germany 964 850 –11.82 839 –13.03Greece 71 90 27.73 118 67.50Hungary 71 56 –20.12 58 –17.33Ireland 30 43 42.47 46 51.02Italy 400 425 6.30 429 7.12Luxembourg 10 8 –19.68 8 –21.59Netherlands 157 177 12.94 169 7.80Norway 29 38 32.95 .. ..Portugal 40 59 49.08 60 51.91Spain 207 286 38.30 337 63.15Sweden 51 48 –6.10 50 –3.21Switzerland 42 44 5.59 43 4.58Turkey 129 188 45.97 406 215.44United Kingdom 560 541 –3.48 538 –4.00
IEA Europe 3 535 3 655 3.38 .. ..
IEA Total 10 318 11 818 14.54 .. ..
Note: "Energy-related CO2 emissions" have been estimated using the IPCC Tier I Sectoral Approach.In accordance with the IPCC methodology, emissons from international marine and aviation bunkersare not included in national totals. Projected emissions for oil and gas are derived by calculating theratio of emissions to energy use for 2001 and applying this factor to forecast energy supply. Futurecoal emissions are based on product-specific supply projections and are calculated using the IPCC/OECD emission factors and methodology. Because of differences in methodology and definitions inestimating energy-related CO2 emissions, the IEA statistics and official Norwegian figures differ fromone another. Norway's statistics show that in 1990 energy-related CO2 emissions were 28.4 milliontonnes and in 2001 they were 34.4 million tonnes, for an increase over that time of 21%.
Sources: CO2 Emissions from Fuel Combustion, IEA/OECD Paris, 2003, and country submissions.
017-Markets Trends 2/12/03 10:50 Page 49
50
MARKET TRENDS Overview of Energy Policy and Market Developments
050
010
0015
0020
0025
00
Ind
ust
ry
Resi
den
tial/
Co
mm
erci
al
Tran
spo
rt
Oth
er S
ecto
rs
Ton
nes
of
CO
2 p
er G
DP
Switz
erla
ndLu
xem
bo
urg
Spai
nIr
elan
d
Port
ug
alU
nite
d K
ing
do
m
New
Zea
lan
dG
reec
eU
nite
d S
tate
sKo
rea
Can
ada
Bel
giu
mFi
nla
nd
Net
her
lan
ds
Italy
Ger
man
yA
ust
ria
Den
mar
kFr
ance
No
rway
Jap
anSw
eden
Au
stra
liaTu
rkey
Hu
ng
ary
Cze
ch R
epu
blic
Sour
ces:
Ener
gy B
alan
ces
of O
ECD
Cou
ntrie
s, IE
A/
OEC
D P
aris
, 200
3, a
nd N
atio
nal A
ccou
nts
of O
ECD
Cou
ntrie
s, O
ECD
Par
is, 2
003.
Figu
re28
CO
2Em
issi
ons
pe
r GD
P b
y Se
cto
r in
IEA
Co
untr
ies,
2001
(CO
2e
miss
ion
s/G
DP
usin
g 1
995
pric
es
an
d e
xch
an
ge
rate
s)
017-Markets Trends 2/12/03 10:50 Page 50

51
Overview of Energy Policy and Market Developments MARKET TRENDS
Gre
ece
Au
stria
Italy
Spai
nFr
ance
Switz
erla
nd
No
rway
New
Zea
lan
dJa
pan
Un
ited
Kin
gd
om
Kore
aD
enm
ark
Ger
man
yN
eth
erla
nd
s
Irel
and
Cze
ch R
epu
blic
Fin
lan
dB
elg
ium
Can
ada
Luxe
mb
ou
rgA
ust
ralia
Port
ug
alH
un
gar
y
Turk
eySw
eden
Un
ited
Sta
tes
05
1015
2025
Co
al
Gas
Oil
Ton
nes
of
CO
2 p
er c
apita
Sour
ces:
Ener
gy B
alan
ces
of O
ECD
Cou
ntrie
s, IE
A/
OEC
D P
aris
, 200
3, a
nd N
atio
nal A
ccou
nts
of O
ECD
Cou
ntrie
s, O
ECD
Par
is, 2
003.
Figu
re29
CO
2Em
issi
ons
pe
r Ca
pita
by
Fue
l in
IEA
Co
untr
ies,
2001
017-Markets Trends 2/12/03 10:50 Page 51

52
MARKET TRENDS Overview of Energy Policy and Market Developments
Residential/Commercial Sector
Transport Sector
Other Sectors*
20011990
Japan
United States
IEA Total
France
United Kingdom
Germany
Japan
United States
IEA Total
France
United Kingdom
Germany
Japan
United States
IEA Total
France
United Kingdom
Germany
800
1 000
1200
1 400
1 600
1 800
2 000
2 200
2 400
2 600
20011990
1990 2001
1 000
2 000
3 000
4 000
5 000
6 000
7 000
1991
1991
1991
1992
1992
19
90
=1
00
kg C
02 p
er c
apita
kg C
02 p
er c
apita
1992
1993
1993
1993
1994
1994
1994
1995
1995
1995
1996
1996
1996
1997
1997
1997
1998
1998
1998
1999
1999
1999
2000
2000
2000
80
90
100
110
120
Figure 30
Energy-related CO2 Emissions by Sector in Selected IEA Countries,1990 to 2001
017-Markets Trends 2/12/03 10:50 Page 52

53
Overview of Energy Policy and Market Developments MARKET TRENDS
Emissions from the residential/commercial sector represent approximately8.5% of total energy-related emissions in IEA countries. Per capita emissionsfrom this sector have remained more or less stable since 1990, notwithstandingexpectations that this sector could provide significant scope for reductions.While current and previous policies may be responsible for the lack of growth in the sector, further measures to promote energy efficiency inbuildings and appliances will be necessary to bring about any additionalemission reductions.
Industry Sector
CO2 Emissions per kWh from Electricity and Heat Generation
20011990
Japan
United States
IEA Total
France
United Kingdom
Germany
Japan
United States
IEA Total
France
United Kingdom
Germany
20011990
60
70
80
90
100
110
1991
1991
1992
1992
Gra
mm
es C
O2/k
Wh
19
90
=1
00
1993
1993
1994
1994
1995
1995
1996
1996
1997
1997
1998
1998
1999
1999
2000
2000
0
100
200
300
400
500
600
700
* includes other energy industries, agricultural sector, other non-specified sectors and non-energy usein other sectors.Sources: CO2 Emissions from Fuel Combustion, IEA/OECD Paris, 2003, and National Accounts ofOECD Countries, OECD Paris, 2003.
Figure 30 (continued)
Energy-related CO2 Emissions by Sector in Selected IEA Countries,1990 to 2001
017-Markets Trends 2/12/03 10:50 Page 53
54
MARKET TRENDS Overview of Energy Policy and Market Developments
Swed
enFr
ance
No
rway
Switz
erla
nd
Fin
lan
dN
ew Z
eala
nd
Can
ada
Bel
giu
mA
ust
ria
Jap
anSp
ain
Kore
aH
un
gar
yG
erm
any
Un
ited
Sta
tes
Cze
ch R
epu
blic
Turk
eyD
enm
ark
Port
ug
al
Un
ited
Kin
gd
om
Italy
Au
stra
liaG
reec
eN
eth
erla
nd
sIr
elan
dLu
xem
bo
urg
0%10
%20
%30
%40
%50
%60
%70
%80
%90
%10
0%
Co
al
Oil
Gas
Co
mb
ust
ible
re
new
able
s
Hyd
ro
Nu
clea
r
Oth
er**
**pr
elim
inar
y da
ta.
**in
clud
es g
eoth
erm
al, s
olar
, win
d, a
nd a
mbi
ent
heat
pro
duct
ion.
Sour
ce:
Ener
gy B
alan
ces
of O
ECD
Cou
ntrie
s, IE
A/
OEC
D P
aris
, 200
3.
Figu
re31
Tota
l Prim
ary
Ene
rgy
Sup
ply
in IE
A C
oun
trie
s,20
02*
017-Markets Trends 2/12/03 10:50 Page 54

ENERGY SECURITY
From 2002 to early 2003, energy security continued to be of high importanceamong energy policy-makers inspired by the imminent supply securityconcerns in the oil market due to political, military and social events inproducing countries. At the same time, there is growing recognition thatenergy policy-makers must address a much broader agenda than near-term oilsupply risks. This includes long-term security of oil, gas and electricity suppliesunder the liberalised markets, growing dependence on oil and gas imports,uncertainties about necessary investments to meet projected energy demandand the global dimension of energy security.
NEAR TERM RISKS
THE CHANGING DIMENSIONS OF THE OIL MARKET: TODAY’S RISKS IN A GLOBALISED MARKET
The oil market remains volatile. It faces considerable economic variability aswell as global uncertainty. New dimensions of risk have emerged, includingterrorist attacks and political instabilities as witnessed by the recent supplyinterruptions from Venezuela and Nigeria and the war in Iraq. These risks arecoupled with an oil market which is now global, liberalised and increasinglycompetitive. In this context, industry has had to improve its economicefficiency, including embracing “just in time” type of stockholding practicesand reducing excess capacity. Total OECD oil industry stocks declined in 2002by 155 mb or 6% below end-2001 levels. While reducing costs, this has hadthe negative effect of reducing supply chain flexibility. At the same time, OPECproducers have used supply production quotas to maintain high prices, furtherdiscouraging industry from holding costly stocks above their needs. The marketis fragile and stretched with short-term volatility and significant price spikesoften occurring. OPEC members increased their production responding to therecent disruption of supply from Venezuela and Nigeria and the war in Iraq. Onthe other hand, their effective spare production capacity after the war in Iraqis much lower, which would reduce flexibility in the oil market.
IEA’S RESPONSE TO THE NEW CHALLENGES OF THE OIL MARKET
The IEA’s broad global membership is a key factor in determining its collectiveenergy security as interdependency in the global oil market means thatregional disruptions have a potentially worldwide impact.
3
55
055-Energy Security 2/12/03 10:49 Page 55

As oil markets have evolved and created new challenges since the founding ofthe IEA, the underlying International Energy Program (IEP) Agreement obligationsto share oil in an emergency are now reinforced by frameworks for the flexibleuse of measures which can be readily gauged to particular circumstances. TheIEA has tools to manage short-term oil supply disruptions such as the co-ordinated use of stockdraw, demand restraint measures, fuel switching andsurge oil production. Of these, stockdraw is considered the most effective andrapid measure to cope with severe supply disruptions and IEA countries holdsome 3.6 billion barrels of oil stocks.
The formal sharing system has not been deployed as yet and IEA’s flexibleframework reflects the belief that, under normal circumstances, the marketmechanism is fully capable of determining the most efficient initial physicalreallocation of supplies in any given crisis scenario. Collective action on stocksprovides a strategic safety net to reinforce the market.
IEA member States who are net importers have a treaty obligation to hold90 days of net imports. The twelve member countries holding government/public reserve stocks alone account for nearly 1.3 billion barrels which couldcope with the largest historical supply disruption. Moreover, thesegovernment-controlled stocks are separate from the market and, therefore,could send a powerful signal when released.
56
ENERGY SECURITY Overview of Energy Policy and Market Developments
0 1 2 3 4 5 6
Nov 1956Mar 1957
June 1967Aug 1967
May 1970Jan 1971
Oct 1973Mar 1974
Nov 1978Apr 1979
Oct 1980Jan 1981
Aug 1990Jan 1991
Jun-Jul 2001
Dec 2002
Gross Peak Supply Loss (mb/d)
Suez Crisis
Six-Day War
Libyan Price Controversy
Arab-Israeli War
Iranian Revolution
Iran-Iraq War
Gulf Crisis
Iraqi Oil Export Suspension(Rejection of UNSC R1352)
Venezuelan Strike
Source: IEA.
Figure 32
Examples of Major Oil Supply Disruptions
055-Energy Security 2/12/03 10:49 Page 56
In January 1991, the IEA effectively used co-ordinated stockdraw and othermeasures during the Gulf War. These measures were also used to tailor plansfor a potential disruption response in the wake of the year 2000 roll-over, the11 September terrorist attacks and, most recently, were in place should theneed have arisen in the context of the military intervention in Iraq.
Notably, the IEA’s new decision-making procedures guarantee very rapidassessments and proper consultation with IEA members, the industry andmajor oil-producing countries, and facilitate timely activation of responsemeasures. IEA also contacted and collaborated with non-member consumingcountries, notably China.
Throughout the period of hostilities in Iraq in early 2003, the IEA was ready to actin co-ordination with oil-producing countries, in particular with OPEC countries,and the markets were aware of this. The possible risk of a supply disruption,therefore, was minimised and price spikes and their duration were limited.
NEW DIMENSION OF ENERGY SECURITY
SECURITY OF ELECTRICITY AND GAS SUPPLYSecurity of energy supply concerns of IEA governments were in the pastfocused on protection against the geopolitical risks of oil supply. Solutionswere found by diversifying oil supply sources and the fuel mix into coal,nuclear, gas and renewable energy. With effective options to promote supplysecurity, government policy turned more towards economic efficiency andmarket reform.
Growing gas demand and rising import dependence in most OECD countriesmeans that gas supply security is increasingly becoming a concern. Whereasgas reserves are sufficient to cover the expected increase in demand, consumingcountries will have to import gas that may not be geographically diversifiedand may be located in politically unstable regions. These factors raisetraditional energy security concerns. Supply concerns do not stop at the borderbut extend down to final consumers. In addition to these external developments,an internal dimension of energy security has arisen in conjunction with marketreform in the gas and electricity industries.
All recent electricity and gas reforms are based on the introduction of third-party access (TPA) to networks and the liberalisation of some activities. TPAestablishes an obligation for an operator of an electrical or gas network toprovide access to users of that network. Liberalisation allows for competitionin the generation and retailing of electricity or in the production and transmissionof gas. During the 1990s, the hope was that liberalised electricity and gas marketswould automatically ensure security of gas and electricity supply all the wayto the final consumer. The reality is more complex.
57
Overview of Energy Policy and Market Developments ENERGY SECURITY
055-Energy Security 2/12/03 10:49 Page 57

A key sign of an efficiently functioning electricity supply industry, relativelycapital-intensive, is an efficient allocation of capital. A recent IEA publication,Security of Supply in Electricity Markets: Evidence and Policy Issues, examinedthe question of the adequacy of investment levels in seven reformed markets.Its main conclusions are as follows:
● Substantial investment has taken place in OECD electricity markets.
● Reserve margins have fallen generally, consistent with the improvement ofallocative efficiency.
● Investment in new capacity favoured the most economic option; natural gas,where this was available, but also coal, where this option was less expensive.
● It was too early to conclude whether investment in electricity generationwould mimic “boom and bust” cycles observed in other industries.
● Markets may increase flexibility on the demand side (e.g. through load-shifting or distributed generation) which would reduce the size of reservecapacity required.
58
ENERGY SECURITY Overview of Energy Policy and Market Developments
0
0.05
0.10
0.15
0.20
0.25
0.30
0.35
0.40
0.45
Rese
rve
Mar
gin
(%
)
Au
stra
lia
Den
mar
k
Fin
lan
d
Fran
ce
Ger
man
y
Gre
ece
Hu
ng
ary
Irel
and
Italy
Jap
an
Kore
a
New
Zea
lan
d
No
rway
Pola
nd
Swed
en
Switz
erla
nd
Un
ited
Kin
gd
om
Un
ited
Sta
tes
Source: Security of Supply in Electricity Markets: Evidence and Policy Issues, IEA/OECD Paris, 2002.
Figure 33
Reserve Margins in IEA Countries, 2000
055-Energy Security 2/12/03 10:49 Page 58

The results of the study suggest that markets can give the right investment signalsto generators and lead to timely investment. It is equally clear from the evidencepresented in that report that adequate investment cannot be taken for granted.
As events in California showed, market reform is not always well designed andreformed markets will not automatically ensure security of supply. Certain recentdevelopments underline concerns about security of supply:
● In the Nordic electricity market, supplies have been very tight this winterowing to a lack of rainfall. As a consequence, winter prices were more thandouble normal levels. Power shortfalls were averted through a combinationof substantial imports of electricity into the Nordic region and conservationby consumers in response to increased prices.
● In New Zealand, a second drought in three years has led to higher powerprices during April-June 2003 and concerns about shortages. While shortageswere averted thanks to a conservation programme and additional rainfall,the government has promised policy changes to avoid future power shortagesduring low rainfall years.
● In Italy, hotter weather and growing electricity demand for air-conditioningcaused an electricity supply shortage in June 2003. To cope with this, thegovernment lifted emission restrictions so that old power plants could bebrought back into service. A major blackout occurred in September 2003.
● In Japan, the shutdown of 17 nuclear power plants of the Tokyo ElectricPower Company raised the threat of severe power shortages in the Tokyoarea in the summer of 2003. Shortages were averted because of unusuallycool summer weather.
● In the US and Canada, the largest blackout occurred in August 2003taking 61 800 MW off-line and affecting 50 million people. The US andCanadian governments have set up a task force to study the causes of theoutage and what can be done to prevent a recurrence.
● The heat wave in Northern Europe in August 2003 tested system limits assummer electricity demand reached unprecedented levels when at thesame time thermal power plant output (both nuclear and fossil fuel) had tobe curtailed because of the raised temperature of the cooling water.
Additional dimensions of security of energy supply will have to be addressedby policy-makers:
● The price mechanism is now a central tool in ensuring security of supply.With liberalisation, consumers have a choice of supplier and contract type.Some large consumers may opt for contracts related to wholesale or spotprices and they may choose to arrange cover to avoid extremes in prices towhich they would otherwise be exposed.
59
Overview of Energy Policy and Market Developments ENERGY SECURITY
055-Energy Security 2/12/03 10:49 Page 59
● The traditional low rate of return of the gas and electricity sectors, combinedwith increased regulatory uncertainty in many IEA countries, has substantiallylowered the attractiveness of the sector for investors. In particular, it isdifficult to induce construction of larger generation projects with high up-front costs and long-term construction periods, as with nuclear and hydro.
● Different views exist among policy-makers regarding the desirability ofensuring an adequate security of electricity supply through some form of extra payments by users for peaking generating capacity. In the US, such systems have found favour in particular markets and have beensupported by the US Federal Energy Regulatory Commission. However,government reviews of three other established electricity markets(Nordpool, UK, Australia) have all determined that such payments were not needed.
Similarly, transition from de facto monopolies to competition in the gasmarkets has created uncertainties. In the past, in most countries, governmentsdelegated responsibility for security of supply to one single actor, either a defacto monopoly state-owned gas company, or a private company withexclusive concession rights. This entity was responsible for security of gassupply across the whole gas market. With market liberalisation, each supplycompany is only responsible for its own customers and usually to its privateshareholders, focusing on efficiency and profitability. Reformed gas marketsmay not by themselves value security of supply. With the unbundling of gassupply and transportation activities, investment in capacity may no longercorrespond to what is necessary to transport new supplies. Transit pipelinesare a particular issue. With market liberalisation and cost reduction efforts, itis no longer certain that diversification of gas supplies will be a companyobjective. While substantial investment is needed to develop new gas suppliesand to deliver them to the market, regulatory uncertainties of the sector areperceived as an additional risk by investors, making financing of newinvestments more difficult.
THE ROLE OF GOVERNMENTS
Governments can address increasing import dependence on natural gas, aswell as reliability of gas and electricity supplies to the final customer, byarticulating security of supply objectives and clearly defining the role andresponsibilities of market players in meeting those objectives. Gas andelectricity sector performance should be monitored with regard to theseobjectives requiring an increased dialogue between governments and allmarket participants, including companies and consumers and gas exportingcountries. While governments should refrain from reintroducing elements of a planned economy, they should promote market-friendly instruments tominimise security of supply risks.
60
ENERGY SECURITY Overview of Energy Policy and Market Developments
055-Energy Security 2/12/03 10:49 Page 60

Recognising the national/regional level of gas and electricity markets, thedefinition and monitoring of security of gas and electricity supply must firsttake place at the national level, albeit with due concern for the tendency forincreasingly interconnected markets to raise security of supply issues beyondnational boundaries.
It is essential for energy markets to deliver efficient price signals and forrelated regulatory arrangements to allow for an efficient response to meetemerging investment needs. Where market responses are slow or inadequate,it may be necessary for governments to consider some form of “safety net”arrangement to address reliability requirements. The government also needsto ensure that policies encourage investment, where economically andenvironmentally sound, in developing primary indigenous resources.Development and diffusion of cleaner technologies for energy supply and end-use are also essential. For example, new transformative technologies, such ashydrogen and carbon capture and storage, can change the nature of futureenergy systems, and renewable energy technologies can add to the diversityof the energy supply mix. All of these would reduce dependence on suppliesfrom politically unstable regions and help to enhance long-term energy security.
GLOBAL CHALLENGES FOR ENERGY SECURITY
GLOBAL ENERGY TRENDS
In the absence of changes in government or private-sector energy policies,world energy use will increase steadily through 2030 with more than 60% ofthe increase in world primary energy demand coming from developingcountries. Such projected trends carry a number of important implications:
● Global energy trade will expand rapidly, principally because of the mismatchbetween location of demand and that of production. Major oil and gas-consuming countries will see their imports grow substantially, which willincrease interdependence among nations.
● Huge amounts of additional investment from industrialised countries willbe required in developing countries if projected energy demand is to bemet. Timely mobilisation of investments will require the lowering of regulatoryand market barriers and recognition of what will attract additional investmentin the energy sector.
● Trade, investment and other important environmental challenges must be constantly reviewed and assessed if the goals of energy security andsustainability are to be achieved.
It is in this context of an increasingly global energy system that IEA countriesstrive to meet their energy security objectives. Meeting this objective will only
61
Overview of Energy Policy and Market Developments ENERGY SECURITY
055-Energy Security 2/12/03 10:49 Page 61
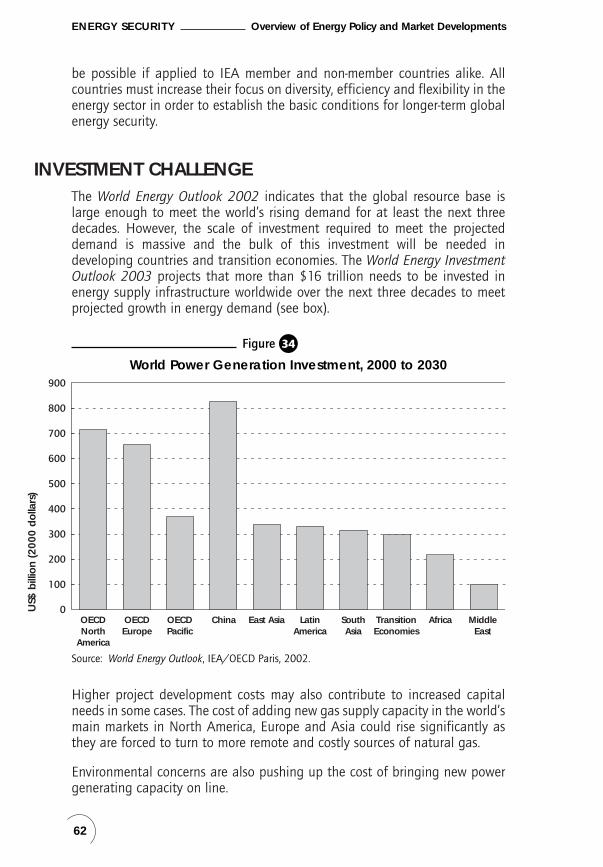
be possible if applied to IEA member and non-member countries alike. Allcountries must increase their focus on diversity, efficiency and flexibility in theenergy sector in order to establish the basic conditions for longer-term globalenergy security.
INVESTMENT CHALLENGEThe World Energy Outlook 2002 indicates that the global resource base islarge enough to meet the world’s rising demand for at least the next threedecades. However, the scale of investment required to meet the projecteddemand is massive and the bulk of this investment will be needed indeveloping countries and transition economies. The World Energy InvestmentOutlook 2003 projects that more than $16 trillion needs to be invested inenergy supply infrastructure worldwide over the next three decades to meetprojected growth in energy demand (see box).
Higher project development costs may also contribute to increased capitalneeds in some cases. The cost of adding new gas supply capacity in the world’smain markets in North America, Europe and Asia could rise significantly asthey are forced to turn to more remote and costly sources of natural gas.
Environmental concerns are also pushing up the cost of bringing new powergenerating capacity on line.
62
ENERGY SECURITY Overview of Energy Policy and Market Developments
0
100
200
300
400
500
600
700
800
900
OECDNorth
America
OECDEurope
OECDPacific
China East Asia LatinAmerica
SouthAsia
TransitionEconomies
Africa MiddleEast
US$
bill
ion
(2
00
0 d
olla
rs)
Source: World Energy Outlook, IEA/OECD Paris, 2002.
Figure 34
World Power Generation Investment, 2000 to 2030
055-Energy Security 2/12/03 10:49 Page 62

63
Overview of Energy Policy and Market Developments ENERGY SECURITY
Global Energy Investment Outlook to 2030The World Energy Investment Outlook identified that more than $16 trillion, or $550 billionper year, needs to be invested in energy supply infrastructure worldwide over the nextthree decades to meet projected energy demand growth. This is equal to around 1% offuture global GDP and 4.5% of total investment on average. The investment will beneeded not only to expand production and transportation capacity but also to replaceexisting and future supply facilities that will become obsolete or retired during theperiod to 2030.● The electricity sector alone will need to spend almost $10 trillion, accounting for 60%
of total energy investment. If those investments in the oil, gas and coal sectors thatare needed to supply fuel to power station are included, the share of electricityreaches more than 70%. As world electricity demand will double by 2030, almost4 700 GW of generating capacity needs to be built, costing $4.1 trillion, butinvestment requirements in transmission and distribution will be even greater, incontrast to past patterns.
● Total investment in the oil and gas sectors will each amount to more than $3 trillion,or 19% of the global energy investment. The projected increase in world oil demandfrom 75 mb/d at present to 120 mb/d in 2030 will require additions of newproduction capacity of 203 mb/d. Bringing all this capacity on stream will entailupstream investment of $2.2 trillion. A further $710 billion will be needed fortankers, pipelines and refineries, while development of non-conventional oil will cost$165 billion.
● The gas industry needs to add a cumulative total of 9 bcm/year of capacity over thenext 30 years. Exploration and development investment will cost $1.7 trillion.Expected increase in inter-regional trade will call for rapid growth in cross-bordersupply infrastructure at the cost of $1.4 trillion.
● Investment requirements in the coal sector will be much smaller, at $400 billion,despite the fact that coal will account for nearly a quarter of world primary energysupply in 2030. Mining will account for 88% of the coal sector’s investmentrequirements.
Almost half of total energy investment, or $7.9 trillion will take place in developingcountries and 10% ($1.7 trillion) in Russia and other transition economies. However,10% of the total investment will be devoted to projects in those regions to export fossilfuels to OECD countries. In the oil sector, more than 30% of the investments will berelated to exports from non-OECD countries to the OECD. The corresponding share willbe 20% for gas and 8% for coal. China alone will need to invest $2.3 trillion (14% ofworld total), 85% of which goes to the electricity sector. Africa has investmentrequirements of $1.2 trillion, slightly exceeding those in the Middle East, underpinnedby the relatively high cost of developing oil and gas and continuing electrification.Nonetheless, energy investment needs will remain greatest in OECD North America.The size of energy investment in the economy varies considerably across regions. It willamount to a mere 0.5% of GDP in the OECD as a whole. It is much larger in non-OECDregions. In Russia, the annual average energy investment requirements will exceed 5%of GDP, and Africa will need to allocate 4% of GDP to energy investment on averageper year.
055-Energy Security 2/12/03 10:49 Page 63

Investing in energy projects can be highly risky because of technical, economicand geopolitical factors. The growing interlinkages between energy projects,such as gas pipelines and power plants, increase these risks. Investment risksare particularly large in politically unstable regions. Returns on investment,therefore, often need to be higher than in other industries to compensate forthis risk. Yet investment returns in the energy sector in recent years have oftenbeen below the average for the rest of industry, as well as more volatile. Thisraises major concerns about whether the required investment in the future willbe forthcoming and, therefore, about long-term energy supply security.
There are concerns about the energy sector’s access to capital. Financialresources will be sufficient on a global level to meet the projected energyinvestment of $16 trillion over the next three decades. However, financialresources are more limited and financial markets are less developed indeveloping countries and transition economies where energy investmentneeds will be larger, both in absolute terms and in relation to the size of theireconomies, than in OECD countries. As a result, there will be a considerableneed for industrialised countries’ financing in the energy sector. This is likelyto be the case, for example, for upstream oil and gas projects in the MiddleEast and Russia which are expected to provide the bulk of additional capacity,even though restrictions on foreign direct investment may persist in somecountries. New power plants and transmission and distribution networks inAfrica, Asia and Latin America, where electricity demand will continue to growvery strongly, will also have to be largely financed by foreign investors.Securing finance will be critical to expanding access to electricity andalleviating poverty in the poorest developing countries.
Mobilising energy investment in a timely fashion will require governments tomake the investment environment more attractive. This is a most pressingchallenge in developing countries and transition economies. Stable and soundmacroeconomic policies that keep down inflation and promote growth in thelong term are fundamental to attracting capital. The removal of marketbarriers and the establishment of a transparent, efficient and stable legal,regulatory and institutional framework are also critical to giving investorsconfidence that contracts will be respected and that investments will be ableto yield predictable and adequate returns. Harmonisation of trade and tariffrules are especially important in the realisation of cross-border pipelineprojects. The freedom to repatriate capital and profits, the protection ofintellectual property and effective policies on corporate governance, are alsoimportant factors affecting investment in the energy supply infrastructure. Thesituation on political governance, corruption, violence and violation of humanrights also has a significant influence on the investment climate. In non-OECDcountries, while financial risks in the export-oriented projects in the hydrocarbonsector may be fewer, it is very likely that the projects to supply domesticmarkets, typically electricity and downstream gas investment, will be the mostdifficult to finance.
64
ENERGY SECURITY Overview of Energy Policy and Market Developments
055-Energy Security 2/12/03 10:49 Page 64

EMERGENCY PREPAREDNESS BY NON-MEMBERS
The fact that the bulk of the increase in world primary energy demand iscoming from non-member developing countries suggests the critical importanceof outreach and collaboration on energy crisis management involving majorenergy producers and consumers. The economies of non-member countries aremore vulnerable to energy supply crisis than those of industrialised countriesowing to the higher share of energy costs in GDP. While several non-membercountries, such as China and ASEAN countries, are beginning to pay moreattention to emergency response measures, including oil stockpiling, there isstill a great lack of vigilance worldwide. All countries need to put somethought into emergency preparedness, either through internal mechanisms orthrough international collaboration to the mutual benefit of all global marketparticipants.
PRODUCER-CONSUMER DIALOGUE
Broadening and deepening the dialogue between oil and gas producers andconsumers at ministerial, experts and bilateral levels will build confidence andimprove mutual understanding of key issues for all participants. The EighthInternational Energy Forum (IEF) held in Osaka in September 2002 made asubstantial contribution to that dialogue.
A total of 65 countries and ten international organisations attended the8th IEF. Twenty-four IEA member countries were represented at this high-levelbiannual ministerial forum. The principal outcomes were:
● An enhancement of mutual understanding and co-operative dialoguebetween energy producing and consuming countries.
● An agreement to meet again in 2004, with the 9th IEF being hosted by theNetherlands and co-hosted by Iran and Norway.
● An agreement to support, in principle, the establishment of a permanentsecretariat for the IEF based in Riyadh.
● An agreement to make the Joint Oil Data Exercise permanent and to considerhow it can be supported in the longer term.
As witnessed in the 8th IEF, a producer-consumer dialogue would entail increasedfocus on a regional dialogue, involving more partners, placing more emphasison energy sources other than oil and gas and addressing some difficult issues liketaxation and diversification. In this context, it would also be possible to exploremethods of deepening interdependence between energy producers andmarkets, producers and international investors, producers and transit providersand industry/market operators (IPE/NYMEX) which provide liquidity neededfor robust markets.
65
Overview of Energy Policy and Market Developments ENERGY SECURITY
055-Energy Security 2/12/03 10:49 Page 65
As seen during the war in Iraq, dialogue with oil-producing countries played acritical role in the effectiveness of emergency response measures. Furthermore, itwill also improve longer-term energy security if interdependence betweenproducers and consumers is maintained and deepened. Dialogue could alsobe expanded to include the broader range of energy infrastructure requirementsworldwide. As mentioned above, there will be stiff competition for capital overthe coming years and the massive investment needed for energy in developingcountries is not likely to happen in the least attractive market for capital.Dialogue could identify partial solutions on difficult issues such asrepatriation of capital, intellectual property, corruption, political governance,bureaucracy and competition, which may not appear central to energysecurity, but will greatly influence the flow of investments into the energyinfrastructure.
TECHNOLOGY DEVELOPMENT AND DIFFUSION
The technology necessary to fuel development in the energy sector is oftennot available in developing countries, yet is critical in assuring secure supply,environmental protection and the alleviation of energy poverty. Both memberand non-member countries can benefit from the development and diffusion ofsuch technologies through the opening of new and profitable markets and theeconomies of scale that can be gained. Specific policies will be required if suchtechnologies are to be successful.
2003 IEA MINISTERIAL MEETING
All challenges related to energy security dominated ministerial meetingdiscussions in April 2003. Ministers reaffirmed their readiness to combat anydisruption of oil supplies, including through judicious use of emergency oilstocks, demand restraint and other response measures. They also committedthemselves to addressing longer-term energy security challenges throughdiversifying energy type, source and route and achieving greater energyefficiency. To this end, they emphasised the role of energy technology development,demonstration and deployment as well as international technology collaborationin such fields as energy efficiency, hydrogen and cleaner technologies withlow pollution and carbon emissions. Noting increasing reliance on natural gasin the energy mix and growing dependence on imported natural gas, Ministersinstructed the Secretariat to assess gas security issues and to identify strategies,including securing diverse gas sources and routes as well as technologydevelopments. The importance of collaboration between government andindustry has been emphasised in this respect. Furthermore, Ministers committedthemselves to strengthening the policy framework permitting markets to meetthe global energy investment and trade needs and to promote an enabling
66
ENERGY SECURITY Overview of Energy Policy and Market Developments
055-Energy Security 2/12/03 10:49 Page 66
environment that will attract private investment. They also affirmed theincreasing importance of non-member countries in world energy markets,welcomed improving dialogue between producers and consumers and urgedthe acceleration of energy security co-operation with non-member countries,especially those critical to a global energy balance, recognising that securitycan only be assured through a more global framework.
67
Overview of Energy Policy and Market Developments ENERGY SECURITY
055-Energy Security 2/12/03 10:49 Page 67

055-Energy Security 2/12/03 10:49 Page 68
ENERGY MARKET REFORM
ELECTRICITY
There has been mixed progress on electricity market reform since last year’sreview. Reforms have continued to advance in IEA Europe, with agreement tomodify the EU Electricity Directive to achieve full market opening by 2007.Progress in IEA North America appears to have slowed, with relatively few USstates pursuing electricity liberalisation and the Ontario government’s decisionto re-regulate prices in its recently deregulated market. Other IEA countrieshave continued to implement agreed reforms, some at a more subdued pacethan others.
IEA EUROPE
EU Electricity Market Policy Developments
An amended electricity directive was passed by the European Parliament andCouncil in June 2003. Under these proposals, all non-household customerswill be eligible to change supplier by 1 July 2004, with all consumers grantedthe freedom to choose suppliers by 1 July 2007. The directive requests legalunbundling of transmission system operators by 2004, and unbundling ofdistribution system operators by 2007. In addition, network access will be onthe basis of published tariffs with the methodology for tariff-setting determinedin advance by national regulatory authorities. From 1 May 2004, ten newcountries will join the EU, increasing the size of the electricity market by280 TWh at 2 655 TWh. A proposed regulation on cross-border electricityexchanges also has the potential to strengthen prospects for the developmentof an integrated European electricity market.
Implementation of these measures, if agreed by EU member States, as well asby new joining countries, could lead to the development of the world’s largestintegrated electricity market.
Progress in Implementing Electricity Market Reform
The EU Commission’s second benchmarking report on the implementation ofthe internal electricity market notes that there has been general progress inmarket opening among EU countries, an improvement in the degree ofunbundling of network operators and greater clarity and transparency inregulation over the past twelve months. In particular, Spain, Denmark andBelgium (Flanders region only) have opened or are expected to open theirmarkets to full competition in 2003. Further measures have been undertaken
4
69
069-Energy Market 2/12/03 10:49 Page 69

to unbundle transmission system operators in several countries, includingItaly, Belgium and the Netherlands. However, unbundling of distributionnetworks has not progressed at a similar pace. Network charges also appearhigh in some countries and there is some evidence that balancingmechanisms may be hindering new entrants’ participation. Wholesale marketconcentration is becoming a bigger issue in most countries. However, a recentdivestment by ENEL has significantly reduced concentration in Italy.
In EU candidate countries, the unbundling of the transmission network hasbeen mainly carried out by legal separation. In the Czech Republic, the Stateacquired 67% of CEPS, the transmission operator, from the power generationcompany CEZ which still owns 32% of CEPS. In Hungary, since February2002, a company was created out of the dominant state-owned electricitysupplier MVM to act as an independent system operator. This company,MAVIR, now operates the transmission grid, of which assets remain theproperty of MVM.
Progress in implementing electricity market reforms is summarised in Table 9.
In January 2003 the temporary mechanism to facilitate cross-border electricitytrade was modified to introduce a single standard export tariff of 50 euro-cents per MWh.
Despite this agreement, there is still limited opportunity for cross-border tradeowing to a lack of infrastructure and a lack of capacity co-ordination. Physicalcross-border trade in electricity in the EU represented only around 9% of totalelectricity consumption in 2002, hardly sufficient to support the emergence ofa competitive internal market. The EU Commission is expected to publish apaper by late 2003 with proposals to improve cross-border flows and toexpedite related investments.
EU States have yet to fully implement the common guidelines on congestionmanagement agreed in September 2001.
United Kingdom: Energy White Paper
On 24 February 2003, the government published a White Paper entitled OurEnergy Future – Creating a Low Carbon Economy. The White Paper provides along-term strategic vision for energy policy. It puts the environment as its mainconcern, while seeking to achieve the joint goals of energy security,competitiveness and addressing fuel poverty.
The White Paper states that liberalised and competitive markets will continueto be a cornerstone of energy policy. However, it notes that where energymarkets are unable to create the right signals, the government will take stepsto create appropriate incentives to encourage commercial responsesconsistent with its strategic policy objectives.
70
ENERGY MARKET REFORM Overview of Energy Policy and Market Developments
069-Energy Market 2/12/03 10:49 Page 70

71
Overview of Energy Policy and Market Developments ENERGY MARKET REFORM
Dec
lare
d M
arke
t La
rge
Elig
ible
Fu
ll M
arke
t U
nbun
dlin
g U
nbun
dlin
g O
peni
ngCu
stom
ers
Swit
ch
Ope
ning
Tran
smis
sion
Dis
trib
utio
n(%
of t
otal
)(%
, 199
8-20
01)
(dat
e)
Aus
tria
100
20-3
020
01Le
gal
Acc
ount
ing
Belg
ium
522-
520
07Le
gal
Lega
l
Den
mar
k10
0>5
020
03Le
gal
Lega
l
Finl
and
100
Unk
now
n19
97O
wne
rshi
pM
anag
emen
t
Fran
ce37
10-2
020
07M
anag
emen
tA
ccou
ntin
g
Ger
man
y10
020
-30
1998
Lega
lA
ccou
ntin
g
Gre
ece
34ni
l20
07Le
gal/
Man
agem
ent
Acc
ount
ing
Irela
nd56
10-2
020
05Le
gal/
Man
agem
ent
Man
agem
ent
Luxe
mbo
urg
5710
-20
2007
Man
agem
ent
Acc
ount
ing
Ital
y70
>50
2007
Ow
ners
hip/
Lega
lLe
gal
Net
herla
nds
6320
-30
2003
Ow
ners
hip
Lega
l
Port
ugal
455-
1020
04Le
gal
Acc
ount
ing
Spai
n10
010
-20
2003
Ow
ners
hip
Lega
l
Swed
en10
0U
nkno
wn
1998
Ow
ners
hip
Lega
l
Uni
ted
King
dom
100
>50
1998
Ow
ners
hip
Lega
l
Sour
ce:
EU C
omm
issi
on.
Tabl
e9
Ele
ctr
icity
Ma
rke
t Re
form
Pro
gre
ss in
EU
Co
untr
ies
(Oc
tob
er
2002
)
069-Energy Market 2/12/03 10:49 Page 71

In particular, the White Paper establishes strengthening the contribution ofenergy efficiency and renewable energy generation as priorities for futureenergy policy. New measures to help achieve these priorities include increasingfunding for renewable capital grants by £60 million, and a commitment toimprove energy efficiency in public-sector buildings and procurement.
The White Paper indicates that the government’s strategic policy directions forenergy will necessitate further significant restructuring of the electricity sector.Some of its key messages in this context are as follows:
● The White Paper notes that national and local electricity grids, meteringsystems and regulatory arrangements will need to be restructured over thenext 20 years to support the emergence of far more renewables and small-scale distributed electricity generation.
● Energy market development will need to be complemented by a planningsystem that is more helpful to infrastructure investment and new electricitygeneration, particularly renewables.
● Coal-fired generation will have an important part to play in wideningenergy diversity provided ways are found to reduce carbon emissions. Thegovernment will continue to support relevant research to develop cleanercoal technologies and for carbon capture and storage.
● The possibility of future new nuclear generation to meet carbon abatementtargets is acknowledged.
Ireland: Proposed Wholesale Electricity Market Arrangements
On 30 April 2003, the Commission for Electricity Regulation published itsproposed decision in relation to Ireland’s electricity market tradingarrangements. This sets out the new wholesale electricity market tradingarrangements and proposes to replace existing transitional arrangementsfrom 2005.
Key elements of the proposal are summarised below:
● Central Market. The wholesale market will be based on a mandatorycentralised pool with electricity bought and sold through the market andsystem operator (ESB National Grid). The spot market will be an energy-onlymarket, with no separate payments. The market clearing price will bedetermined ex ante and on the basis of the locational marginal price (i.e.nodal pricing). An upper and lower value of lost load price cap will applyto spot prices.
● Risk Management. Market participants may enter into bilateral financialhedging arrangements to manage risk exposure to the spot market.
72
ENERGY MARKET REFORM Overview of Energy Policy and Market Developments
069-Energy Market 2/12/03 10:49 Page 72
● Reserve Market. The market and system operator will purchase reservesand may implement spot markets for some reserve products. Generatorsand load may provide reserve.
● Generation Adequacy. A safety net option to fast-track construction of new capacity will be developed to ensure that reliability can be maintainedif required.
● Dominance. Measures will be implemented to mitigate market power.Although the details are yet to be determined, it is likely that a system ofvesting contracts may be imposed on the market and system operator andthat regulatory oversight will continue.
● Spot Market Pricing. Generators will sell electricity to the market andsystem operator on the basis of locational marginal prices, while purchasesfrom the market and system operator will be at a uniform price, regardlessof location, based on a single load-weighted average price.
● Financial Transmission Rights. The commission considers that the marketshould have access to financial transmission rights to hedge locationalmarginal pricing risks. Further consultation will be undertaken on thedetails and timing of implementation.
The final decision was published in July 2003 following a last consultationperiod.
Switzerland: Referendum Rejects Electricity Reform Proposal
In December 2000, the Parliament passed laws to liberalise the electricitymarket. However, at a public referendum held on 22 September 2002, thelegislation was rejected with a 52.6% majority. The government and keystakeholders are currently discussing how to proceed.
IEA NORTH AMERICA
The status of reforms varies by state and province in the US and Canada,ranging from a number of states where markets have been open for severalyears, to others in which reforms are not yet being considered. Reform activityin the US electricity supply industry has remained subdued followingCalifornia’s experience of 2000/01 and the subsequent concerns about riskmanagement in the wake of the Enron failure. Figure 35 indicates that18 states are currently actively pursuing electricity restructuring in the UnitedStates. In Canada, the Ontario provincial government has reversed electricitymarket reforms introduced in May 2002 and reintroduced a regime of regulatedprices for small consumers (discussed below).
73
Overview of Energy Policy and Market Developments ENERGY MARKET REFORM
069-Energy Market 2/12/03 10:49 Page 73
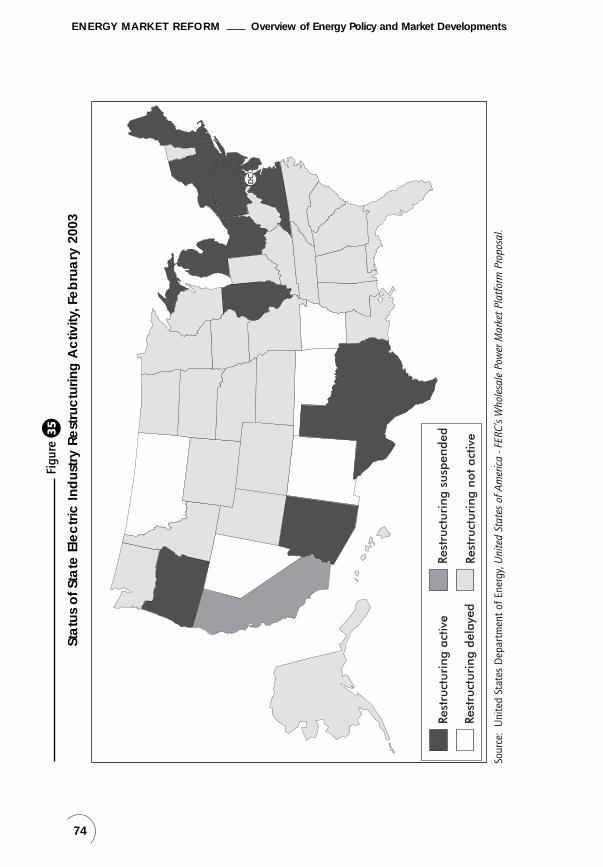
74
ENERGY MARKET REFORM Overview of Energy Policy and Market Developments
Sour
ce:
Uni
ted
Stat
es D
epar
tmen
t of
Ene
rgy,
Uni
ted
Stat
es o
f Am
eric
a - F
ERC’
s W
hole
sale
Pow
er M
arke
t Pla
tfor
m P
ropo
sal.
Figu
re35
Sta
tus
of S
tate
Ele
ctr
ic In
dus
try
Rest
ruc
turin
g A
ctiv
ity,F
eb
rua
ry 2
003
069-Energy Market 2/12/03 10:49 Page 74

The United States’ Wholesale Power Market
In April 2003, the US Federal Energy Regulatory Commission (FERC) issued a White Paper presenting a refined proposal for a wholesale power marketplatform. This proposal builds on earlier proposals for a standard marketdesign (July 2002) and the creation of regional transmission organisations(1999). The proposal also incorporates FERC’s response to comments received.
The Final Rule will focus on the formation of regional transmission organisations(RTOs), ensuring that all RTOs and independent system operators (ISOs) havegood wholesale market rules in place. The Final Rule will permit a degree offlexibility in implementation to accommodate specific regional needs. Keyfeatures of the wholesale power market platform proposal include the following:
● Independent Regional Grid Operation. RTOs will need to be independent,have a regional configuration consistent with efficient market operationand development, possess day-to-day operational authority for thetransmission networks under their control and be responsible for short-termreliability. FERC considers that structural separation of transmission operationfrom other contestable activities will be required to achieve an appropriatedegree of independence. Overarching principles for independent governancewill be included in the final ruling.
● Transmission Planning Process. RTOs and ISOs will be required to producetechnical assessments of the regional grid and to support state sitingauthorities with necessary studies. The Final Rule will require a regionalplanning process to be put in place as soon as practicable.
● Transmission Pricing Policies. Costs associated with existing network assetswill be recovered from consumers through network charges. Network accesscharges should permit customers to have access to a region at a single rate.The form of the access charge submitted for FERC approval may be determinedby regional state committees. RTOs and ISOs should seek to eliminatepayment of multiple access fees across RTO and ISO borders to facilitatetrade and competition. Costs may also be directly assigned and recoveredfrom users on an incremental basis, subject to FERC approval.
● Market Power Mitigation. Mitigation measures must protect against theexercise of market power without suppressing prices below the level necessaryto attract needed investment. RTOs and ISOs must establish an independentmarket monitor to undertake market surveillance. Rules governing marketparticipant conduct and penalties must be developed and should address:physical withholding of supplies; economic withholding of supplies; reportingon generator availability; accuracy of information provided to RTOs or ISOsand an obligation to provide information to independent market monitors; co-operation with market monitoring investigations; and the requirement that all bids designating physical resources are physically feasible. Specific rulesshould be tailored to the needs of each regional market.
75
Overview of Energy Policy and Market Developments ENERGY MARKET REFORM
069-Energy Market 2/12/03 10:49 Page 75

● Spot Markets and Ancillary Services. RTOs and ISOs will be required touse a real-time spot market to resolve energy imbalances. RTOs and ISOswill be responsible for developing detailed market rules to be included inthe report to FERC. RTOs and ISOs will be required to introduce a day-aheadmarket and various ancillary services when the market is ready. Day-aheadmarkets must be designed to work reliably with the related congestionmanagement system.
● Congestion Management. Approaches to manage congestion shouldprotect against market manipulation, promote efficient network use andsupport the use of lowest-cost generation. RTOs and ISOs should introducea transparent market mechanism with efficient price signals to managetransmission congestion within one year of commencing operations. FERC’spreferred approach would involve adoption of locational marginal pricingproviding price signals for market-based resolution of congestion.
● Firm Transmission Rights. RTOs and ISOs that use locational pricing tomanage congestion will be required to make firm financial transmissionrights available to customers. Rights would be allocated according toexisting contracts and service arrangements where this issue has not alreadybeen addressed. FERC will not require RTOs or ISOs to auction rights.
● Resource Adequacy. Minimum levels and the method for delivering resourceadequacy will be determined by states through regional state committees.The approach adopted could draw on a mixture of generation, transmission,energy efficiency and demand response and be implemented by regulation orthrough a market-based approach such as a capacity market.
In May 2003, FERC scheduled a series of regional technical conferences todiscuss possible timetables to address wholesale market design issuescontained in the White Paper. The Final Rule was expected to be published in2003, although the timing may be affected by a Bill currently before the USSenate which proposes to prohibit FERC from making the final ruling until2005.
The US Department of Energy’s report to Congress in May 2003 on FERC’soriginal standard market design proposal suggests that it would save USconsumers over $1 billion in the first six years following implementation. Thebenefits would result primarily from increased trading between regions, withmore seamless grids and open markets enabling lower-cost power generationto displace higher-cost facilities.
Canada: Ontario’s Electricity Market Reform Reversed
In December 2002, the Ontario government passed legislation allowing it todirect key elements of market development and to implement a series of regulatedtariffs up to 2006. The legislation represents the government’s response to
76
ENERGY MARKET REFORM Overview of Energy Policy and Market Developments
069-Energy Market 2/12/03 10:49 Page 76

tight market conditions and higher than expected spot prices which hademerged following the liberalisation of Ontario’s electricity market in May2002. Key elements of the new policy include the following:
● Wholesale electricity prices for all consumers using less than 250 000 kWhper annum are fixed at 4.3 cents/kWh to 2006. This includes eligible customerswho signed supply contracts under previous market arrangements. The fixedprice applies retrospectively. Eligible customers will receive rebates equal toany payments they have made in excess of the fixed tariff since marketopening in May 2002. Arrangements for larger customers are yet to beconfirmed, but the government has stated that such customers would beable to choose between the regulated price and a market price.
● Other charges, including retail electricity tariffs, will be determined by theOntario government rather than the Ontario Energy Board (OEB). Thegovernment has empowered itself to order the OEB to modify any existingrate or licence condition without a public hearing. Proposals to changenetwork-related tariffs and charges, or modify market rules, cannot beimplemented without ministerial approval.
● The wholesale market will continue to operate and clear at the marketdetermined wholesale price. The government will either pay or receive thedifference between the wholesale price and the regulated price.
● Tax breaks will be provided to investors in renewable energy generation,including exemptions from provincial taxes and corporate taxes, waiving of salestaxes on related equipment purchases and a ten-year holiday on property taxes.
IEA ASIA-PACIFICAustralia: Energy Market Review Final Report
On 20 December 2002, the Council of Australian Governments Energy MarketReview delivered its final report entitled Toward a Truly National and EfficientEnergy Market. The review notes that while the reforms of the past decadehave been beneficial, serious deficiencies remain. The review concluded thatthere is a pressing need to achieve a competitive, transparent national marketwhich provides efficient price signals for all market participants. Keyrecommendations relating to electricity market reform include the following:
● Establishment of a National Energy Regulator to encompass the energyregulation roles of the Australian Competition and Consumer Commission(ACCC), the state regulators, the National Electricity Code Administratorand the National Competition Council.
● The independent market and system operator (the National ElectricityMarket Management Company, NEMMCO), to acquire new responsibilities,including facilitating the management process of the electricity code changeand transmission network planning.
77
Overview of Energy Policy and Market Developments ENERGY MARKET REFORM
069-Energy Market 2/12/03 10:49 Page 77

● Replacing existing regional pricing arrangements with locational marginalpricing and overhauling transmission regulation to ensure that networkoperators are more responsive to the needs of the contestable market.
● Restructuring of government-owned generation portfolios to promote moreefficient and sustainable competition across the National Electricity Market(NEM).
● All states and territories to implement customer choice of energy supplierto work towards removing retail price caps and other market distortingarrangements.
● All states and territories to mandate the installation of interval meters.
● NEMMCO to introduce a “pay-as-bid” mechanism for load reduction intodispatch and pool price-setting to encourage demand-side involvement inthe NEM.
Estimates published in the final report suggest that implementation of theproposed reform package could increase real Australian gross domesticproduct (GDP) by approximately $2 billion per annum in 2010 (around 0.5%).Over five years, the increase in GDP is estimated to be in the order of $7 billion.
The Council of Australian Governments is expected to formally respond to thefinal report around late 2003.
New Zealand: New Electricity Commission
In May 2003, the New Zealand government announced the establishment ofan Electricity Commission. The commission is responsible for contracting withelectricity generators to provide reserve power for release during dry years.Contracted reserve power would be withheld from the market during normalyears to minimise distortion of market operation. Consumers are expected toface an additional cost of less than 0.5% per unit of electricity purchased.Sufficient reserve generation is expected to be built up over a three-yearperiod to achieve security of supply for a 1-in-60 dry year event.
The commission’s other responsibilities include:
● Ability to require generators to offer long-term hedging contracts for acertain proportion of their capacity where the commission believes insufficientincentives exist for new generation investment.
● Undertaking forecasting for future electricity supply and demand.
● Establishing methodology to enable investment in the national grid.
● Establishing demand-side energy exchanges to allow consumers to resellcontracted electricity.
78
ENERGY MARKET REFORM Overview of Energy Policy and Market Developments
069-Energy Market 2/12/03 10:49 Page 78

Japan: Electricity Industry Committee Reform Proposals
In February 2003, the Electricity Industry Committee, an advisory body to theMinistry of Economy, Trade and Industry (METI), presented its proposals forchanges in the regulatory regime. Based on these proposals, the governmentdrafted a new law amendment passed in the Diet on June 2003. Proposalsinclude the following:
● Regulation of transmission, system access and operation will be established.Establishing legislative measures for account unbundling and informationfirewalls from April 2005. The regulatory capacities of the METI will bereinforced. A Neutral Transmission System Organisation (NSO), withparticipation from incumbent market players and new entrants, will beestablished to handle electricity transmission issues. The NSO will beappointed and supervised by the government.
● Rules will be established for settlements among utilities to assure impartialityin cost-sharing and cost-recovery. A nationwide power exchange, operating ona voluntary basis and including day-ahead market and forward markets,will be established.
● Nuclear power, hydropower and geothermal energy will benefit from prioritydispatching to the network to promote investment in these technologies.The government will also plan measures to encourage the industry to investin adequate transmission capacities.
● The criteria which METI uses to judge whether transmission charges areappropriate will be clarified.
● Measures will be taken to enable new entrants access to load data possessedand collected by the incumbent utilities to assist them in meeting balancingpower rules and to propose attractive offers for potential new clients withconsideration given to information security.
● A timetable for retail liberalisation will be accelerated with the next step inApril 2004 to high-voltage consumers whose connected load is at least0.5 MW, bringing the market opening to 40%. In April 2005, all high-voltageconsumers would gain eligibility, increasing the market opening to 63% of the total retail market. The final step, full opening to the smallestconsumers, is envisaged but would be subject to further consideration beginningin April 2007.
GASWhile market competition continues to spread in OECD Continental Europe andPacific, a more cautious assessment of gas market liberalisation is taken in the USbecause of deteriorating financial conditions of some market participants andshaken confidence in the markets.
79
Overview of Energy Policy and Market Developments ENERGY MARKET REFORM
069-Energy Market 2/12/03 10:49 Page 79

IEA NORTH AMERICA
The US wholesale gas market is highly competitive. Thousands of producers,independent marketers, pipeline affiliates, local distribution companies (LDCs)and end-users compete to buy and sell gas at the wellhead and at marketcentres, or “hubs” located across the country. In recent years, the retail markethas opened more to competition as various states have initiated retailunbundling programmes to allow residential natural gas users to select theirsuppliers. The nature of these “customer choice” programmes varies widelyfrom state to state. Table 10 provides an overview of the status of therestructuring of the natural gas industry in each state, focusing on theresidential customer class.
In 2002, only two states changed their unbundling status. Michigan is in theprocess of implementing voluntary customer choice programmes virtuallystatewide and Florida approved two experimental pilot programmes forresidential transportation service. Most enrolment increases in 2002 can beattributed to the expansion of existing programmes into new geographicareas or new enrolment caps as part of an approved phase-in to systemwidechoice programmes. Eligibility numbers doubled in Michigan, nearly tripled inVirginia, increased more than fivefold in Wyoming and nearly sevenfold inIllinois.
80
ENERGY MARKET REFORM Overview of Energy Policy and Market Developments
Table 10
Status of US Natural Gas Industry Restructuring at the Retail Level,by State, as of December 2002
Residential Natural Gas StatesRestructuring Status
Statewide unbundling – 100% eligibility DC, NJ, NM, NY, PA, WV
Statewide unbundling – implementation phase CA, CO, GA, MD, MA, MI, OH, VA
Pilot programmes/partial unbundling FL, IL, IN, KY, MT, NE, SD, WY
No unbundling – considering action IA, KS, ME, MN, NV, NH, OK, SC, TX, VT
No unbundling AK, AL, AR, AZ, CT, HI, ID, LA, MS, MO, NC, ND, OR, RI, TN, UT, WA
Pilot programme discontinued DE, WI
Source: EIA website.
069-Energy Market 2/12/03 10:49 Page 80

According to a report by the Federal Energy Regulatory Commission (FERC) 2,the state of competitive natural gas markets is sound and competitive forcescontinue to produce tangible economic benefits for customers. However, thereis a need for vigilant market supervision to ensure competition continues towork in the best interest of customers and market participants. The FERC’sreport cites five main challenges facing today’s wholesale gas markets:
● Deteriorating financial conditions of market participants. Many past leadersof energy trading are either out of business or retrenching and their problemshave also adversely affected other natural gas companies. This serious financialsituation might create delivery problems in the longer term.
● Need for management of credit exposure. Introducing more sophisticatedcredit management approaches in gas markets, including over-the-countercredit clearing, will be critical for the successful control of risks associatedwith volatile gas prices.
● Shaken confidence in price discovery methods. There are increased concernsabout the credibility of published natural gas price indices and, therefore,about the efficiency of gas markets.
● Continuing need for efficient investment in infrastructure. Production hasnot responded in a major way to recent price signals. With gas suppliestight and prices high, more storage and pipelines are needed to operateefficiently.
● Continuing potential for manipulation. The potential for manipulation ofenergy markets remains a concern. Solutions require a commitment to vigilantsupervision.
In order to remove economic and regulatory barriers to the development ofonshore LNG import terminals, FERC adopted a different policy for regulationof new LNG projects where markets are competitive and other specific criteriaare met. Commission-approved cost-based rates or an open access tariff for thenew terminal service are not required. The first project to benefit from the newlegislation will be the Hackberry LNG project in Louisiana if construction andoperation of the terminal are authorised.
IEA PACIFIC
In Japan, the METI plans to continue to liberalise the gas market by increasingthe number of eligible customers. Consumers must currently use over a millioncubic metres a year before they can choose their own supplier, with eligibleusers accounting for 40% of national demand. The intention is to allow the
81
Overview of Energy Policy and Market Developments ENERGY MARKET REFORM
2. 2003 Natural Gas Market Assessment, FERC, January 2003.
069-Energy Market 2/12/03 10:49 Page 81

users of over 0.5 million cubic metres a year, such as large hospitals andhotels, to choose their supplier in the year ending in March 2005, expandingthe contestable market to 44% of total demand. It is intended that the usersof over 0.1 mcm a year will subsequently become eligible in the 2007financial year. The amount of gas sold to customers in these two categorieswould exceed 50% of total annual sales at the top 10 gas utilities. Toencourage new gas providers to enter the liberalised market, all currentproviders would have to allow entrants to use their pipelines. At present, onlythe top four firms are obliged to do so. To ensure fair and transparent third-party access to pipelines, the government proposes accounting separation andinformation firewalls between gas transportation activities and other activitiesof gas utility companies. Market opening for all consumers would bedetermined on the basis of an evaluation of the success in market liberalisationfor larger consumers, the prevailing gas supply situation, the status of marketreform in other energy sectors and international experience in gas marketliberalisation. The METI presented an amendment of the Gas Utility Law tothe Diet (Japanese Parliament) which was passed on 11 June 2003.
The Council of Australian Governments issued a review calling for sweepingreforms in the electricity and gas markets to break down state lines and deliverlower prices. The review found that, although energy reform over the pastdecade has delivered significant benefits, more work must be undertaken tocreate a truly national market. The report recommends a single energy regulatorand emissions trading scheme to be established within three years togetherwith an increase in interstate electricity transmission links.
The New Zealand government is preparing a policy package designed toincrease efficiency and reliability in gas production and transportation, andimprove fairness for gas customers.
IEA EUROPE
Amendment of the EU Gas Directive
On 25 November 2002, a political agreement was reached by the EnergyCouncil in Brussels. It provides for an acceleration in gas and electricity marketopening, establishes provisions on the unbundling of transmission anddistribution operators, public service obligations, regulatory tasks and third-party access to storage. The timetable for market opening follows a two-stepapproach, with deadlines on 1 July 2004 for non-household users and 1 July2007 for household users. This process will take account of a report assessingthe impact of liberalisation to be presented by the European Commission in2006. The agreement provides that gas transmission and distribution systemoperators (TSOs/DSOs) should be independent, in terms of their legal form, fromactivities not related to transmission and distribution respectively. Ministersagreed to create an obligation to implement legal unbundling of transmission
82
ENERGY MARKET REFORM Overview of Energy Policy and Market Developments
069-Energy Market 2/12/03 10:49 Page 82

by July 2004, while distribution will be unbundled by July 2007. This obligationdoes not imply unbundling of ownership in vertically integrated companies.The agreement provides that access to storage, line-pack and ancillary serviceswould be guaranteed and may be negotiated or regulated. The agreement alsoprovides for the establishment of a regulator with ex ante functions (tariffs).Member States shall designate one or more competent bodies with the functionof regulatory authorities. The agreement calls for improved public serviceobligations and requests monitoring of supply security (a balance betweendemand and supply and possible minimum level of investment).
Although the amendments introduced major changes, several EU memberStates already apply the provisions included in the new directive.
Second Benchmarking
The EU published its second benchmarking report on the implementation ofthe internal electricity and gas markets. The European Commission reportclaims that there has been less progress for gas since 2001 than for electricityand finds five significant barriers:
83
Overview of Energy Policy and Market Developments ENERGY MARKET REFORM
Table 11
Natural Gas Market Reform Progress in EU Countries(October 2002)
Declared Large Eligible Unbundling Unbundling Market Customers Transmission Distribution
Opening Switch (% of total) (%, 1998-2001)
Austria 100 <2 Legal Legal
Belgium 59 Unknown Legal Legal
Denmark 35 2-5 Legal Legal
Finland 0 – –
France 20 20-30 Accounting Accounting
Germany 100 <10 Accounting Accounting
Greece 0 – – –
Ireland 82 20-30 Management Management
Italy 100 10-20 Legal Legal
Luxembourg 72 5-10 Accounting Accounting
Netherlands 60 30-50 Management Legal
Portugal 0 –
Spain 100 20-30 Ownership Legal
Sweden 47 <2 Accounting Accounting
United Kingdom 100 >50 Ownership Ownership
Source: EU Commission.
069-Energy Market 2/12/03 10:49 Page 83

● Different rates of market opening among States continue to reduce the scopeof benefits to customers from competition.
● Inappropriate tariff structures and large and unexplained disparities innetwork access tariffs between countries and regions for transportation anddistribution transactions which form a barrier to competition and providerevenue for cross-subsidies.
● Lack of transparency regarding the availability of infrastructure capacity.
● Concentration of gas production and imports in several companies and slowdevelopment of gas trading hubs.
● Balancing regimes which are unnecessarily stringent, being non market-basedand not reflective of the costs incurred.
Proposal for a Directive on Security of Gas Supply
In September 2002, the EU proposed a “Directive on security of gas supply”suggesting measures aimed at ensuring the proper functioning of the EUinternal gas market by safeguarding security of the EU gas supply. Thedirective would complement the new gas directive. Discussions of the proposalwith EU member States continue.
Gas Hubs
Although the development of gas hubs in continental Europe is just beginning,there were important developments in Germany and the Netherlands during2002. On 1 January 2003, Dutch Gas Transport Services (GTS) introduced thetitle transfer facility (TTF) system, a virtual hub for the Dutch market similar tothe National Balancing Point (NBP) in the United Kingdom. Eurohub, theDutch hub operator at Bunde-Oude-Statenzijl-Emden, is likely to merge intothe overall Dutch TTF. Eurohub is more sophisticated and covers all the Dutchborder points. The third hub, MW Europe Hubco, operated by Germany’sRuhrgas and BEB, and Norwegian Statoil, has experienced an increasingnumber of trading transactions during the year allowing publishing priceindices to commence at Bunde.
UK’s Energy White Paper
The UK’s Energy White Paper, published in February 2003, focuses on creatinga low-carbon economy with environment at the centre of the authorities’energy policy. It places greater focus on international aspects of energy policyin addressing climate change, promoting liberalisation and producer/consumerrelations and innovation.
The White Paper recognises that, because of the decline of gas reserves, thecountry will shift from being a net exporter to being, once again, a net
84
ENERGY MARKET REFORM Overview of Energy Policy and Market Developments
069-Energy Market 2/12/03 10:49 Page 84

importer potentially more vulnerable to price fluctuations and interruptions insupply caused by regulatory failures, political instability or conflicts in otherparts of the world. This new situation requires a different approach to gaspolicy, more focused on external relations and substantial investment to buildadditional connections to external supply sources.
COAL
Important changes have occurred in the international coal market over thelast year, most directly concerning non-member countries, but havingimplications for IEA countries. For example, China has emerged as the world’ssecond-largest coal exporter (after Australia) giving added strength to securityof international coal supply and pushing prices down. Competing exportershave responded positively to the competitive challenge of Chinese exports byalso expanding output. Russia’s coal industry reform programme continuesconsistent with reported government policy to free up gas resources for exportto Europe and so contributing to security of European gas supply. On the otherhand, the potential impact of Russia’s policy to free up natural gas for exportthrough the increased domestic use of coal remains to be seen.
Japan and Korea have directly benefited from Chinese exports because of thefreight advantage China has over competing suppliers to these markets, butEurope also benefits because coal from suppliers such as South Africa havelost their market share in Asia, making more coal available to Europeanconsumers. Reliable, low-cost coal imports continue to make inroads intoEuropean markets.
Among IEA countries, Australian producers have not only maintained output,but have also closely matched output with demand, so avoiding price volatilityand providing a more predictable basis for investment. US producers continueto focus interest on the domestic market because of low international prices.In New Zealand, the coal industry is expanding output, helping to offset theimpact of declining gas resources.
GOVERNMENT FINANCIAL SUPPORT FOR COALPRODUCTION
A number of IEA countries give varying degrees of financial and other assistanceto their indigenous coal producers. In most cases, the grounds for support arebased on a pragmatic concern to maintain employment and regional economicactivity. Security of supply and support for industrial development based oncoal-mining technology are emerging as more sophisticated justifications forsupport.
85
Overview of Energy Policy and Market Developments ENERGY MARKET REFORM
069-Energy Market 2/12/03 10:49 Page 85
In 2001, Japan closed its last coal mine, but reopened it in 2002. The lastgovernment-supported coal mine in Canada, on Cape Breton, was also closedalthough Canada continues to be a coal producer. Production is expected tocontinue to be subsidised in the Czech Republic, Turkey and Norway. Thefuture of coal subsidies in EU countries is the principal concern because of thescale of the production involved. Outside the EU, subsidised productionamounts to less than 25 Mt in IEA countries. France, Germany, Spain and theUK continue to provide support for coal production with EU approval andtotal production in these countries is about 85 Mt.
Policy on aid given to European coal has evolved from its original objectives.The 1953 European Coal and Steel Community Treaty ended in June 2002.The main objective of the treaty since the early 1980s has been to ensure thata reduction in production capacity, and resulting unemployment, is carried outin a manner as socially acceptable as possible.
State aid has shifted away from operating aid (i.e. aid to producers that couldimprove their economic viability, or at least reduce their losses) to help reduceproduction or for mine closures.
The outlook in EU countries is for a continuing fall in subsidised production.Coal production in the EU has declined dramatically over the past ten years.Compared with 1992, the year before the current policy framework came intoforce, hard coal production in the EU fell by well over half. France has,proportionately, seen the biggest contraction and the UK has seen the largestabsolute decline.
The policy approach taken in the EU has improved steadily, but the mostrecent changes suggest an unspecified level of subsidised production will bemaintained. For example, the EU requires that all indigenous coal be deliveredto electricity producers at prices equivalent to those from third countries. Aform of competition has, therefore, been possible. From supplying 56% ofinternal consumption in 1992, indigenous coal now only supplies about 30%.
France is on target to end coal production in 2005 and reports suggest that,because of technical mining problems and accumulating losses, productionmay end earlier by mid-2004. In Spain and Germany, average production costsare around three times the world market price and production has beenreduced in line with reductions in aid. German industry is pressing hard for acontinuation of subsidies and reduced reliance on imported coal. Only in theUK are production costs close to the world market price, but a two-year stateaid package of up to £100 million was nonetheless announced for the UKindustry in April 2002.
EU production subsidies are now justified, in part, by the need to continuesupport for social and regional adjustment as coal production is reducedwhere it is uncompetitive. The EC’s Green Paper on Security of Energy Supply
86
ENERGY MARKET REFORM Overview of Energy Policy and Market Developments
069-Energy Market 2/12/03 10:49 Page 86

also envisages keeping open uneconomic collieries to maintain a minimumcoal-producing capability and to retain professional qualifications andtechnical expertise. Aid to production will be replaced by aid to “safeguardresources”. Mines not in this category would be subject to closure by31 December 2007. By 31 December 2006, however, the Commission isrequired to submit revised proposals for the regime to apply from 2008 to2010.
It is clear that, while state aid may have been successful in dealing with socialproblems and in evening out short-term market movements, it has not beensuccessful in providing a long-term economic future for the greater part of theindustry. In practice, almost every time there has been a reduction in state aid,production has been reduced by closing mines rather than any improvementin productivity achieved by reducing costs. The new policy approach runs therisk of establishing an industry with a core of uneconomic mines that havelittle prospect for improvement. Some UK mines approach international costlevels, but the majority will remain overwhelmingly uncompetitive.
Other Major Coal Policy Measures
In Japan, a new coal tax has given rise to uncertainty about governmentintentions. In November 2002, the METI announced a proposal to impose a tax on thermal coal which had previously been tax-free. The new tax willapply from financial year (FY) 2003. The tax rate will be raised gradually from¥ 233 per tonne in 2003 to ¥ 700 per tonne in 2007, i.e. from US$ 1.90 toUS$ 5.70 per tonne. The new tax is reported to be a rearrangement of theenergy tax system as a whole and not intended to reduce the use of thermalcoal in Japan, although this might be expected to result.
87
Overview of Energy Policy and Market Developments ENERGY MARKET REFORM
069-Energy Market 2/12/03 10:49 Page 87

069-Energy Market 2/12/03 10:49 Page 88

CLIMATE CHANGE AND SUSTAINABLE DEVELOPMENT
CLIMATE CHANGE
BACKGROUND
The past few years have seen a significant level of climate change mitigationeffort. A broad range of policies including fiscal measures, tradable permits,voluntary agreements, R&D and outreach and information exchange programmeshave been developed. The trend is increasingly focused on implementation ofpolicies that have been planned since the completion of the negotiations ofthe Kyoto Protocol to the United Nations Framework Convention on ClimateChange (UNFCCC), which are geared to helping countries meet their goals.
However, notwithstanding these efforts, the near-term future of the internationalclimate change process remains uncertain. In spite of the ratification in August2003 by 112 countries, including 31 Annex I countries, the threshold for the entryinto force of the Kyoto Protocol has not yet been met3. Two countries haveannounced their intention to remain outside the agreement, namely the US andAustralia, representing 36.1% and 2.1% of Annex I emissions respectively.Nevertheless, Australia has announced its intention to meet its target in the firstcommitment period. A third country, Russia (representing 17.4% of Annex Iemissions), must ratify if the agreement is to take effect, but has not yet taken aformal decision to do so. This uncertainty is taking a toll on the credibility andmomentum of the process as a whole. Not only will an agreement without the US(the world’s largest emitter of greenhouse gases) inevitably mean lower overallreductions, but its opposition, based on concerns about domestic implementationcosts and the non-participation of developing countries, have led many observersand experts to reconsider the long-term potential of using the Protocol structurewithout significant future modifications.
Despite uncertainty in the international process, those countries that haveratified the Protocol have taken significant steps over the past several yearstowards implementing the agreement. Within the international negotiatingprocess, consensus was reached on key issues, including how to implement theflexible mechanisms (emissions trading, joint implementation and the cleandevelopment mechanism (CDM)), and on methods to account for national
5
89
3. Annex I Parties include both OECD countries and countries with “economies in transition”, that is,the Russian Federation and several other Central and Eastern European countries. The provisions for entryinto force call for 55 countries, including those representing at least 55% of emissions of the Annex Igroup, to ratify before the agreement takes effect. Currently, although more than enough countries haveratified, the Annex I Parties to the Protocol represent only 44.2% of the group’s emissions.
089-Climate Change 2/12/03 10:48 Page 89

emissions and “sinks” in land use, land use change and forestry (LULUCF). InAugust 2002, the Executive Board of the Protocol’s CDM was established andapplications were accepted for accreditation as “operational entities” responsiblefor checking whether projects conform to CDM rules and for validating proposedprojects. The eighth Conference of the Parties (COP8) to the UNFCCC, held inNew Delhi, India in late October 2002, was the first COP meeting held sincethe Kyoto Protocol framework had been finalised. The Delhi Declarationhighlighted the importance of taking steps to address not only mitigation ofclimate change, but also adaptation to its unavoidable effects. The Declarationalso emphasised issues of sustainable development, the focus of the JohannesburgConference in September 2002.
The result of the process to date suggests that, should Russia decide to ratify,implementation of the Protocol may be relatively “on-track”. In fact, while theprojection of future emissions is subject to considerable uncertainty, assumingthat full emissions trading is allowed and that the US remains outside theProtocol, the Annex I Parties would be able to comply with their commitmentsunder Kyoto with only modest additional steps beyond those already taken.
National policies have continued to move forward over the past year. While manyof these have been explicitly taken to meet Kyoto objectives, others are the resultof domestic efforts that are independent of Kyoto. Among these are sub-nationalprogrammes implemented at state level in the US and Australia. Others includeprogrammes likely to continue whether or not the Protocol enters into force, suchas the emissions trading programmes being planned by the EU and the voluntaryprogrammes that are a centre-piece of German and Japanese efforts.
However, while it is still too soon to judge the effectiveness of these efforts,recent announcements by governments suggest that they are still inadequate– either to meet the near-term goals agreed under Kyoto, or the more stringentand longer-term objectives of climate stabilisation that are the basis of theUNFCCC. For example, the European Environment Agency reported that CO2
emissions rose by more than 1.5% between 2000 and 2001 alone, andwithout additional measures would continue to grow 4. Similarly, reports fromCanada suggest that Canadian emissions are growing even more rapidly, withan increase in CO2 of more than 21% since 1990 5.
IMPLICATIONS FOR THE ENERGY SECTORThe implications of climate policy for the energy sector continue to besignificant. The burning of carbon-rich fossil fuels – coal, oil and gas – for theproduction of energy generates over 80% of anthropogenic GHG emissions.
90
CLIMATE CHANGE… Overview of Energy Policy and Market Developments
4. http://reports.eea.eu.int/technical_report_2003_95/en/ECinvUNFCCC2003_15april2003_annex4.zip
5. See http://ghg.unfccc.int/
089-Climate Change 2/12/03 10:48 Page 90

Efforts to mitigate climate change have, therefore, unsurprisingly focused onreducing energy-related emissions. While policies have largely been driven byenvironmental concerns, they can be expected to have increasingly importantimpacts on developments in the energy sector.
Two distinctive policy approaches have been applied: using less energy (i.e.reducing energy intensity) and switching to less carbon-intensive energysources (which itself can be subdivided into switching to low- or zero-emissionenergy sources, and switching from one fossil fuel to another less carbon-intensive fuel 6). Policies and measures to implement both approaches havebeen widely applied in IEA member countries.
A relatively recent addition to the list of policy options has been sequesteringcarbon. Although still at an early stage, coupling the use of conventional fossilfuels with carbon capture and storage technologies is rapidly emerging as anattractive alternative. Various technologies, both pre- and post-combustion, arenow available for CO2 use, separation, transport and underground storage.Although costs remain high, and the long-term environmental consequencesare not entirely certain, the prospects of these technologies are neverthelesspromising.
CLIMATE CHANGE POLICES IN IEA COUNTRIESAlthough the Kyoto Protocol has yet to come into force, IEA member countrieshave nevertheless been very active in developing policies and measures toreduce GHG emissions. In an effort started in 1999, the IEA systematicallyreviews and classifies information on policies and measures taken or plannedto reduce GHG emissions from the energy sector7 offering a continuous follow-up of the climate change mitigation policy-making process. Although thenumber of measures taken or planned in 2002 is smaller than in previousyears, several major policies have nevertheless been implemented.
FISCAL MEASURESFiscal measures are an important component of the policy mix developed byIEA member countries to reduce GHG emissions, representing almost one-thirdof all new measures taken or planned in the past four years. To date, the vast
91
Overview of Energy Policy and Market Developments CLIMATE CHANGE…
6. When energy conversion rates are equal, a shift from coal to oil implies a reduction in emissions of26%, from oil to gas of 23.5%, and from coal to gas of 43% per unit of primary energy. Reductions canbe even greater when considering specific technologies. For example, the advantage of natural gas isincreased by the higher conversion efficiency of combined cycle gas turbine technologies over oil or coal-fired power plants.
7. The database on “Dealing with Climate Change” policies and measures is accessible on http://www.iea.org/envissu/index.htm
089-Climate Change 2/12/03 10:48 Page 91

majority of fiscal measures have been set up to support the development ofemerging low carbon technologies rather than to impose a direct cost on fossilfuel sources.
In 2002, only a small share of all new fiscal measures implemented wereenergy or carbon taxes. These include, for example, the development of a newtax scheme on fossil fuels in Japan under which LNG and LPG taxes would beincreased and a coal tax would be introduced. In Sweden, the carbon dioxidetax rate was raised from SKr 8 530 per tonne to SKr 630 per tonne and theenergy tax on electricity went up by SKr 0.012 per kWh (labour taxes werereduced by a compensatory amount).
As in previous years, the vast majority of fiscal measures taken or planned in2002 have been developed to provide incentives for the deployment of lowcarbon technologies, namely renewable energy sources and energy efficiencyimprovements. These measures usually take the form of grants, preferentialloans or special funds. In the field of renewable energy technologies, Canadaintroduced a new wind power generation incentive in 2002 with the aim ofproducing 1 000 MW of electricity from wind by 2007. South Korea introduceda broad renewable energy subsidy scheme, while the UK launched capitalgrant schemes for several renewable energy technologies. Energy efficiencyimprovements and fuel switching in the transport sector were also supportedthrough government incentives and subsidies. One of the largest programmesadopted was that of Germany which introduced a new Combined Heat andPower (CHP) Law under which bonus payments are offered to CHP operators.The new Intermodal Freight Transport (Marco Polo) financial assistancescheme, developed by the EU, is another that is expected to provide significantincentives to improve transport efficiency. Some countries (e.g. Canada, Franceand Spain) also developed funds for renewables or energy efficiencytechnologies in order to promote market-based approaches to technologydevelopment.
Tax credits, exemptions and reductions also played an important role insupporting clean technologies. France, for example, introduced such taxtreatments in 2002 to promote energy efficiency and the use of renewableenergy-based equipment in the building sector. These tax mechanisms are alsoused in the transport sector to encourage consumers to purchase less carbon-intensive fuels (as was the case in Italy for the tax exemption established forbiodiesel in 2002).
While economic efficiency arguments would support increasing fossil fuelprices as a policy choice to reduce their use, the preference for the developmentof new technologies can be traced to political concerns over the publicacceptability of additional taxes, as well as concerns related to the impact ofprice increases on competitiveness.
92
CLIMATE CHANGE… Overview of Energy Policy and Market Developments
8. For information: 1 SKr (Swedish krona) = 0.11 euro.
089-Climate Change 2/12/03 10:48 Page 92

REGULATORY INSTRUMENTS
Regulatory policies are another important policy tool to reduce GHG emissionsand have been increasingly used by IEA countries over the past couple of years.Although often considered as inflexible, regulatory measures offer a high levelof certainty on the achievement of emissions reductions.
Mandates and standards are often used to promote energy efficiency orrenewable sources of energy. For retail goods, such as motor cars and electricappliances, governments tend to use two approaches to improve energyefficiency. One consists of setting minimum energy efficiency standards thatmust be met in order to sell goods on the domestic market of a country. Sucha scheme was developed in 2002 in New Zealand where minimum energyperformance standards (MEPS) were introduced for household appliances.Another approach is to require the mandatory labelling of the energyperformance of goods. This approach offers more flexibility to themanufacturers as it rests on public awareness to promote energy efficiency.Following an EU directive passed in 2000, such labelling schemes wereintroduced in France and Switzerland in 2002 where new regulations requirethat information on fuel consumption and CO2 emissions of vehicles be madeavailable to potential buyers at car sales points. For household appliances,labelling of electricity consumption has become mandatory in 2002 in severalcountries, including Hungary, Sweden and Turkey, although, compared tominimum efficiency standards, the outcome of such measures is uncertain. Forthis reason, both approaches are often developed jointly, as was the case inNew Zealand where the MEPS has been coupled with a labelling scheme.
Mandates and standards are also extensively used in the building sector. In2002, a new directive came into force at the EU level on the energy performanceof buildings. In Ireland and Japan, regulations were also enforced to reduce theoverall energy requirements of buildings.
2002 also marked the adoption of a number of renewable energy mandates.Minimum mandatory quotas of electricity to be produced from renewablesources were developed in Japan and Belgium, as well as in several states inthe US, including California and Massachusetts. These measures are part of abroader international effort developed over the past few years to supportrenewable energy sources. Similar renewable energy quotas have already beenset in Australia and at the EU level over the past few years.
Regulatory policies form another very important category of regulatoryinstruments, the share of these having increased over the past few years and,in 2002, several major policies were introduced in several IEA membercountries. In Finland, for example, the Parliament decided to approve agovernment decision in favour of the construction of a fifth nuclear powerplant unit. This is the only measure taken or planned in IEA countries in 2002in relation to the construction of a nuclear power plant. The Norwegian
93
Overview of Energy Policy and Market Developments CLIMATE CHANGE…
089-Climate Change 2/12/03 10:48 Page 93

government put forward a strategy in 2002 to increase the use of domesticnatural gas in combination with carbon dioxide capture and storage. This isparticularly significant, as this is one of the first major national proposals touse carbon capture and storage technologies on a large scale. In 2002, theEU also proposed a much-awaited directive on combined heat and power, andJapan and Korea introduced revisions to existing regulations to increase thesupport of energy efficiency measures and the development of renewableenergy sources.
VOLUNTARY AGREEMENTS
Voluntary agreements are commonly introduced as a more co-operative andless rigid way of reducing GHG emissions than regulatory measures. Suchagreements have most frequently been set up with the industry sector. In2002, voluntary measures continued to play an important role in Europe andNorth America, while no new significant voluntary measures were developedin IEA Asian countries. In France, a new voluntary agreement frameworkincludes fines for companies that do not achieve the targets set under thescheme, making it something of a hybrid voluntary/mandatory scheme. In theUS, the government introduced the Climate Leaders Programme, agovernment/industry partnership, which aims to encourage businesses todevelop GHG emissions inventories for their activities and then set long-termemissions reduction goals. Such programmes are likely to play an increasinglyimportant role in the US, where voluntary agreements form a central pillar ofthe US alternative to the Kyoto Protocol presented by the US Administrationin early 2002. The extent of these efforts increased with the introduction ofadditional voluntary programmes in the first half of 2003 and throughplanning for future additional measures.
Because of their non-binding nature, the emissions reduction potential of suchvoluntary agreements is uncertain. Nevertheless, such measures offer a highdegree of flexibility, particularly important to industry sectors exposed tointernational competition. In addition, voluntary agreements can play animportant role in increasing public awareness and stimulating action.
TRADABLE PERMITS
The appropriate use of market instruments has been a central theme ininternational and national debates on strategies to mitigate climate change.Although such measures are recognised for their economic efficiency,countries’ inexperience in using such options to reduce GHG emissions, as wellas the complex framework needed to fully exploit the flexible nature of thesemeasures, have led to a slow start in their use. However, such measures areincreasingly being developed by IEA countries, and 2002 confirmed the
94
CLIMATE CHANGE… Overview of Energy Policy and Market Developments
089-Climate Change 2/12/03 10:48 Page 94

pivotal role market instruments will likely play in climate mitigation strategies, both nationally and internationally. Although most tradable permitmeasures were developed in the EU region over the past four years, in 2002,significant steps were taken in Japan and South Korea to develop market-based instruments.
2002 was a particularly significant year for emissions trading with perhapsthe most far-reaching proposal emerging from the EU. After many years ofconsultation, including the release of a Green Paper in 2000 and a proposeddirective in 2001, in December 2002, the European Council of EnvironmentMinisters reached a political agreement on an EU-wide scheme. Although finalreconciliation remains to be undertaken between the EU Council version andthat of the Parliament, agreement is expected by the end of 2003. Whencompleted, the directive will establish a framework for GHG emission allowancetrading with a system to become operative within the Community by 2005. Inthe interim, countries are actively developing domestic allocation plans which,under the directive’s rules, must be completed by 2004.
While the EU-wide system has been under intense negotiations, a number ofEU member States have simultaneously been developing their own, separate,national programmes. In April 2002, the first domestic CO2 trading schemewas officially launched in the UK. It was set up under a voluntary frameworkboth to enable the business sector to gain practical experience with emissionstrading and to assist in achieving the UK’s Kyoto Protocol target. TheNetherlands is also actively developing its own trading scheme. Outside of theEU, Japan and Korea have both started to plan domestic trading schemes.
In addition to the GHG cap-and-trade schemes mentioned above, two othertypes of tradable permit schemes have been developed to reduce GHGemissions. Tradable renewable energy certificates (TRCs) and project-basedemissions reduction units under the Kyoto Protocol flexible mechanisms– namely the CDM and Joint Implementation (JI) – are receiving increasingpolicy attention.
In 2002, Nordic countries (Denmark, Finland, Iceland, Norway and Sweden)decided to establish a Testing Ground Facility to initiate, develop and carryout projects aimed at reducing carbon dioxide emissions from the energysector in the Baltic Sea region. Japan, Korea and Spain also set up entities in2002 to study the potential of CDM and JI to reduce emissions. Rule-makingfor project-based efforts is still at a very early stage of development. Thus,while these projects may provide significant low-cost emissions reductionopportunities, much will depend on the practicality of the frameworkdeveloped for their use at both the national and international level (the latterlargely depending on ratification of the Kyoto Protocol).
TRC systems are increasingly being used to promote renewable energy sources. Such schemes are based on the combination of a mandatory
95
Overview of Energy Policy and Market Developments CLIMATE CHANGE…
089-Climate Change 2/12/03 10:48 Page 95

renewable energy production target and a tradable renewable energycertificate scheme. Using TRCs, electricity producers have the flexibility tomeet their targets either by generating electricity from renewable energythemselves, or through the purchase of renewable energy certificates fromother producers. In 2002, such schemes were developed in Belgium and Japanand have also been proposed by the Swedish government.
POLICY PROCESSESTogether with fiscal measures, policy processes represent the most broadlyused category of policy instruments. A clear distinction can be made withinpolicy processes between “planning” policies (consultation, strategic planningand institutional development) and “outreach” policies (information disseminationand advisory efforts).
Planning policies are the backbone of GHG mitigation programmes. In thepast few years, all IEA member countries have developed national, regional orsectoral climate change strategies highlighting the fact that climate changeis now higher on the political agenda of all IEA countries as we approach theentry into force of the Kyoto Protocol. These strategic plans set out the co-ordinated set of actions to be implemented to reduce GHG emissions. In 2001alone, 20 IEA countries developed, or were in the process of developing,national, regional or sectoral programmes. In 2002, the number dropped toten, reflecting the imminent end of the planning period and that in the nextfew years the focus will increasingly shift to policy implementation. On anational level, these plans include the US climate change strategy, presentingthe country’s alternative plan to the Kyoto Protocol. Canada also released itsClimate Change Plan to implement its decision to ratify the Kyoto Protocoland meet its Kyoto targets. New Zealand, Japan, Belgium and Italy alsoreleased their climate change strategies in 2002.
Planning policies also often involve the creation of specific institutions for theimplementation of climate change measures. This was the case in Ireland,with the creation of “Sustainable Energy Ireland” to oversee the implementationof measures included in the Sustainable Energy Act passed in 2002. SouthKorea also plans to establish a centre for new and renewable energy developmentand dissemination. At the EU level, the “Intelligent Energy for Europe”programme also foresees the creation of an independent body to manage theprogramme.
Outreach policies aim to inform and advise people or organisations on how toreduce their GHG emissions efficiently. Although an essential aspect of theclimate change mitigation process, apart from the labelling schemesmentioned above (see the Regulatory Instruments section), few new measureswere reported for 2002. Nevertheless, ongoing programmes are still a veryimportant component of climate change mitigation strategies.
96
CLIMATE CHANGE… Overview of Energy Policy and Market Developments
089-Climate Change 2/12/03 10:48 Page 96

RESEARCH, DEVELOPMENT & DEMONSTRATION (RD&D)
Funding for energy research and technology development is anothertraditional area of government intervention. New transformative technologiesoffer promising pathways towards sustainable development. Technologiesalso offer important means to significantly reduce GHG emissions byproviding clean emissions-free energy supply and energy end-use. Althoughmany analytical studies suggest that the private sector is best suited to pursuethe commercial development of technologies, these investments only occur under a specific (and limited) set of market conditions. At an early stage of technological development, risks are high, the payback period ofRD&D investments is undetermined and R&D findings are often difficult to protect. In the case of RD&D for low carbon technology, the currentuncertainties regarding the Kyoto Protocol and potential second andsubsequent commitment period obligations also tend to reduce private-sectorinvolvement. In such a case, government intervention plays an essential rolein filling the RD&D investment gaps by making strategic investments in novel technologies.
In 2002, a few countries, notably the United States, developed new RD&Dschemes, mainly in hydrogen-based technologies. South Korea also establishednew research schemes in renewable energy technologies, energy efficiency andcapture and storage technologies. Canada’s investments in climate changetechnologies are over $1 billion in recent years.
OUTLOOK ON THE FUTURE OF CLIMATE CHANGEMITIGATION
As seen from the variety and stringency of the many measures described above,IEA member countries are active in developing programmes to further reduceGHG emissions. The ratification of the Kyoto Protocol by most IEA countries,coupled with the still increasing trend in national emissions, suggests that morestringent measures will likely be implemented in the near future to reduceemissions still further.
Support for renewable energy technologies and energy efficiency has formedthe bulk of measures taken or planned over the past few years. Conversely,there continues to be relatively limited support for nuclear energy, although itremains attractive from a climate change point of view. Although severalcountries have expanded their nuclear power research programmes, Finland isthe only country which has given the green light for the construction of anuclear plant in 2002. One of the new elements of the policy mix has beenthe introduction of carbon capture and storage technologies as a viableoption for reducing emissions while continuing to rely on a fossil fuel-basedenergy system.
97
Overview of Energy Policy and Market Developments CLIMATE CHANGE…
089-Climate Change 2/12/03 10:48 Page 97

A broad policy mix has been brought to bear on the problem of reducingemissions. Countries, depending on their particular national circumstances,rely to a greater or lesser degree on fiscal measures, regulatory and voluntaryprogrammes, tradable permits, R&D and public outreach. However, it is clearthat no single solution exists to the policy problem – and even countries thathad been reluctant to adopt one or more of these tools are finding themselveswith a portfolio approach in which all are being utilised.
Perhaps the most significant split in the policy arena is a function of the KyotoProtocol. Countries having ratified the Protocol are increasingly introducingregulatory measures and taxes to achieve emissions reductions, whilecountries having withdrawn from the Protocol have placed significantly moreemphasis on approaches with minimum market interference where RD&D andvoluntary agreements play a central role. With current emission trends andforecasts indicating that more action is needed to meet the Kyoto target,further regulatory and fiscal measures, in particular carbon/energy taxes andtradable permits (or emissions trading), will certainly be introduced in thenear future by countries having ratified the Protocol.
The national and international effort to reduce GHG emissions is more than adecade old. The UNFCCC, with its goal of stabilising concentrations and itscommitment to take policies and measures, was adopted in 1992. Whileinternational action continues, including through the negotiation of new rulesto effectively implement the Kyoto Protocol, much of the recent focus hasshifted to national implementation. As is clear from this review, numerous stepshave been taken. However, it also remains clear that these steps have had onlya limited effect on reducing the trends in emissions. The energy sector, at theheart of the climate emissions problem, is thus faced with difficult choices.Decisions will affect national and private investment and will determine howfuture energy services can be provided while limiting emissions.
According to the Intergovernmental Panel on Climate Change, concentrations ofgreenhouse gases in the atmosphere can only be stabilised if emissions areultimately brought to near-zero levels. This, in turn, will require a radicalreshaping of the energy sector. Medium- and long-term policies, only a few ofwhich are on countries’ agendas, will thus be critical to meeting these goals.However, if the level at which concentrations are to stabilise is not unacceptablyhigh, near-term efforts must also be increased. The policies and programmesdescribed here are clearly only a small, albeit critical, step in this larger effort.
SUSTAINABLE DEVELOPMENT
POLICY DIRECTION
2002 was a significant milestone for multilateral discussions on sustainabledevelopment, culminating in the World Summit on Sustainable Development
98
CLIMATE CHANGE… Overview of Energy Policy and Market Developments
089-Climate Change 2/12/03 10:48 Page 98

(WSSD) held from 26 August to 4 September in Johannesburg, South Africa.Energy featured significantly at that meeting and IEA member countriescontributed in many ways to the final outcome.
The Commission for Sustainable Development (CSD), created as a result of the1992 Rio Earth Summit and the main UN body responsible for the WSSD, hasbeen meeting annually since 1993. At its 9th session in 2001, it focused onenergy and transportation issues for the first time. In preparation for thatmeeting, the IEA Governing Board released a statement in which membercountries agreed on a set of nine policy recommendations to help the energysectors of members’ economies make the fullest possible contribution tosustainable development. This consensus statement – elaborating on the IEAShared Goals – was developed as input towards the longer-term World Summitnegotiating process. The final outcome from CSD 9 included many elementsconsistent with the IEA Statement on Sustainable Development, includingrecognising: the centrality of energy in achieving sustainable developmentgoals; wide disparities in energy consumption between countries; challenges ofrealising adequate new financial resources for energy investment; energypolicies supportive of developing countries’ poverty alleviation efforts; andenhancement of national energy markets that promote sustainable development.Governments also agreed to a continuing dialogue on issues relating to energyfor sustainable development within the World Summit process.
Joint workshops between the IEA and the United Nations Environment Programme(UNEP) on energy subsidy reform in 2000 and 2001 were also effective inengaging developing countries in dialogue and policy planning on an issuecentral to both OECD and global agendas.
The energy community of the developed world, represented by IEA membercountries, recognised the important role energy would play at the WorldSummit and in meeting development aspirations. The brochure TowardSolutions: Sustainable Development in the Energy Sector released in May 2002prior to the final preparatory meeting in Bali for the Summit, sets out theircollective views on how sustainable development could be advanced in theenergy sector. This brochure looks at eight key areas where action is neededand prescribes steps in each that can be taken to address the problems.Background documents were also prepared addressing each of the topic areas:
● Energy security.
● Improving energy efficiency.
● Using more renewable energy.
● Making markets work.
● The important role of technology and research.
99
Overview of Energy Policy and Market Developments CLIMATE CHANGE…
089-Climate Change 2/12/03 10:48 Page 99

● Increasing access to energy.
● Sustainable transportation.
● Addressing environment, health and safety concerns.
In May 2001, the UN Secretary-General, Kofi Annan, in an effort to furtherfocus and catalyse WSSD directions, set out five priority areas for action at theWSSD: water and sanitation; energy; health; agricultural productivity;biodiversity and ecosystem management. These became known as the“WEHAB Initiative” with energy again figuring prominently.
Many of the energy elements that were agreed at the fourth and finalpreparatory meeting for the Summit held in Bali, Indonesia (27 May to 7 June2002), closely mirror the recommendations put forward by IEA governmentsin the brochure Toward Solutions. For example, governments agreed to:
● Establish domestic energy efficiency programmes.
● Accelerate development, deployment and dissemination of cleaner energytechnologies.
● Promote increased R&D in various energy technologies.
● Support efforts to improve the functioning and transparency of energymarkets.
● Employ policies to reduce market distortions such as restructuring taxationand phasing out harmful subsidies.
● Develop and disseminate alternative energy technologies with the aim ofgiving a greater share of the energy mix to renewable energies.
There were two formal outcomes from the World Summit – the JohannesburgDeclaration and the Plan of Implementation. Outside formal negotiations, anumber of voluntary initiatives – called Type 2 Outcomes – were also announced.
The Johannesburg Declaration is a four-page document containing theoverarching political commitments reached at Heads of State level. The Plan ofImplementation provides the framework for the realisation of the politicalobjectives, containing 11 chapters. Energy issues gathered considerableattention from the outset of the negotiations. Public focus centred on a fewoutstanding contentious issues from the preparatory meetings, namely, targetsfor renewable energy, phasing out energy subsidies, and energy access. Theseissues were only resolved at the Heads of State level at the very end of theSummit without establishing any quantitative global targets or timetables.Nevertheless, a large number of energy provisions were ultimately agreed. Thereare over 50 paragraphs or sub-paragraphs that contain references to energy,most of which are consistent with, if not identical to, the common positions
100
CLIMATE CHANGE… Overview of Energy Policy and Market Developments
089-Climate Change 2/12/03 10:48 Page 100

adopted by IEA countries in the above-mentioned brochure Toward Solutions. In the Plan of Implementation, governments have also agreed to:
● Diversify energy supply.
● Improve access to modern biomass technologies and fuel wood sources andsupport the transition to cleaner use of gaseous fossil fuels.
● Promote education about available energy sources and technologies.
● Strengthen dialogue forums among regional, national and internationalenergy producers and consumers.
● Develop partnerships with the private sector.
ACTIVITIES
A new and innovative feature of the Summit was the announcement of somethree hundred “Type 2” outcomes: voluntary partnerships among UN agencies,governments, industry, intergovernmental and non-governmental organisations.Energy activities represent a significant number of these, often accompanied byfinancial commitments for their implementation. IEA countries are partners in anumber of these initiatives including:
● EU Energy Partnership, a country-driven initiative with a focus on reducingpoverty through the provision of energy services (700 million euros).
● Global Initiative on Gas Flaring (Norway/World Bank), to reduce flaringand improve access to natural gas.
● Mediterranean Renewable Energy Program (IEA/UNEP/Italy/France), tohelp alleviate poverty by providing modern energy services and to increasethe contribution of renewable energies to help climate change mitigationefforts.
● Energy and Environment Partnership with Central America (Finland/Central American governments), to promote the use of renewable energysources and clean technologies in the region and make energy servicesmore accessible to the poor.
● Renewable Energy and Efficiency Partnership (UK), to acceleratedeployment of renewable energy and energy efficiency systems.
● Renewable Energy-based Rural Electrification Initiative (Japan/Fiji), topromote and develop renewable energy technology appropriate to themarine and tropical environment of the Asia-Pacific region.
● Powering Sustainable Development (US/Australia), to develop national energystrategies, engage the private sector and leverage investment in clean andefficient energy projects.
101
Overview of Energy Policy and Market Developments CLIMATE CHANGE…
089-Climate Change 2/12/03 10:48 Page 101
● Energy Literacy Initiative (Japan/UNEP/World Bank), to promote energyeducation globally and facilitate the appropriate use of energy.
● Fostering Regional Energy Co-operation in APEC: Energy for SustainableDevelopment (Asia-Pacific Economic Co-operation, APEC, countries), topursue new initiatives in APEC to improve regional energy security in theshort and long term, to improve access to energy and examine newtechnical responses to improving the environment and to explore newfinancing mechanisms for infrastructure.
BEYOND JOHANNESBURG
As noted, governments in Johannesburg agreed to undertake a long list ofactions in the energy sector. Although these outcomes are not legally binding– no treaties were signed – a political commitment at the highest level ofgovernment was made to implement these activities. Energy issues wereaccorded recognition as the key to development and poverty alleviation alongwith basic needs such as water and sanitation. There has been some progressin implementing the Summit outcomes, but the energy and sustainabledevelopment issues have not been accorded the level of attention seen in thelead-up to the Summit.
The first meeting of the CSD post-Johannesburg was held in New York from28 April to 9 May 2003. This meeting concluded with the adoption of theCSD’s multi-year programme of work for the period 2004-2017. Each two-year
102
CLIMATE CHANGE… Overview of Energy Policy and Market Developments
The Mediterranean Renewable Energy Program(MEDREP)
The IEA, UNEP and the Italian and French governments are examining asustainable renewable energy market system for the greater Mediterraneanregion. The initiative seeks to remove project, policy and trade barriers andstrengthen the market system within the region. The programme has three mainthemes: 1) tailoring of financial instruments and mechanisms to supportprojects; 2) strengthening of policy frameworks; and 3) building a strongprivate-sector infrastructure. The initiative was launched in June 2002 and isexpected to run to 2010. It has numerical objectives that are to be achieved by2010: 60 million people supplied with new renewable energies in the EuropeanMediterranean countries and 40 million in southern and middle-easternMediterranean countries (www.medre.org).
089-Climate Change 2/12/03 10:48 Page 102

cycle will consist of a review session and a policy session with the objective ofmobilising action. Water, sanitation and human settlements will be thethemes for the first period 2004/05. Energy was seen as the second mostimportant issue (after water) in the discussions at CSD 11. Consequently,energy for sustainable development, along with related issues of industrialdevelopment, air pollution/atmosphere and climate change are to beaddressed in the second cycle (2006/07).
Twenty-one partnership initiatives in energy were announced for the Summitand two have been added since. Of these, 15 have provided formal updatesinforming that they have been initiated with sufficient funds to cover initialplanned activities in 2002-2003. However, most are still seeking additionalfunds to take their partnerships to the end of their planned terms.
Another initiative, launched by the EU at the World Summit, was theformation of a coalition of like-minded countries and regions committed todelivering renewable energy targets and timetables as agreement on thesecould not be reached in the final outcome of the Summit. The coalitionincludes both developed and developing countries from Africa, Latin America,the Caribbean and other non-EU European countries. Although a largenumber of countries joined the initiative post-Johannesburg, since the Summit,there have been no collective announcements from members of the like-minded group on the form their targets and timetables might take. Progressmay be made in advancing discussions among group members at a meetinghosted by Denmark on renewable energies in the summer of 2003 and at aworld conference on renewable energy to be hosted by Germany in June 2004in Bonn.
The OECD, within the context of cross-cutting activities on sustainabledevelopment, has widened the existing peer reviews of economic policyundertaken in the Economic and Development Review Committee to includesustainable development themes. A framework for the reviews was developed,including a relevant set of indicators covering seven themes including GHGemissions and natural resource management. These comprise energyindicators such as the use of renewables in electricity generation, GHGemissions from electricity and reducing emissions of atmospheric pollutants.Economic surveys of member countries began in April 2002 and, as ofSeptember 2003, the Secretariat has prepared draft sustainable developmentsections for 28 member countries. Countries, on the basis of a proposal by theOECD Secretariat, choose three of the seven themes for their own reviews. Ofthe 28 reviews, climate change was the theme chosen by most countries (20),and air pollution was chosen by 15 countries.
The IEA has also been working on producing sustainable developmentindicators to assess energy efficiency developments and CO2 emissions. Based on detailed activity and end-use energy data from IEA statistics and
103
Overview of Energy Policy and Market Developments CLIMATE CHANGE…
089-Climate Change 2/12/03 10:48 Page 103

national sources, a database with information for most IEA countries is beingdeveloped.
IEA Ministers, at their most recent biannual meeting held on 28-29 April2003, reinforced the importance of moving forward from Johannesburg andimplementing the energy commitments made there.
“We acknowledge the importance of, and our commitment to, implementingthe agreements reached at the Johannesburg World Summit on SustainableDevelopment of September 2002. We particularly commit ourselves to enhancethe role of renewables and other lower carbon-emitting sources of energy in theenergy mix, and work to shape a future where basic energy services will beavailable to an increasing number of the world’s citizens. We will continue ourefforts to mitigate the impact of energy use on the global environment, and inparticular on the global climate system, consistent with our efforts under theUN Framework Convention on Climate Change. We will continue to stimulatethe development of new market-oriented instruments essential to reaching oursustainable development goals at lower costs. We also call for the furtherdevelopment of technologies needed to meet these goals, and to this end, withthe help of the Secretariat, call for a review of the focus of our cooperative R&Dprograms in strategic areas. We reaffirm our commitment to promoting asustainable energy future, meeting the social, environmental and economicchallenges this entails.”
104
CLIMATE CHANGE… Overview of Energy Policy and Market Developments
089-Climate Change 2/12/03 10:48 Page 104

ENERGY EFFICIENCY
GENERAL TRENDS IN EFFICIENCY POLICIES
The energy market consists of suppliers and consumers and, for every unit ofenergy supplied to the market, a unit is consumed. In spite of this equality,the overwhelming majority of energy policies are directed towards influencingthe supply side of the market. This asymmetry is not surprising because theenergy supply market generally consists of large, easily identifiable elements.In contrast, the consumption side is extremely diffuse. Policies to influenceenergy consumption are similarly difficult to establish and track because theresults are often obscured by changes in consumer behaviour, quality of life,industrial structure, macroeconomic situation and so forth.
Nevertheless, most IEA countries regard energy efficiency as one of the keypolicy tools to achieve GHG reduction targets as well as energy security. Forexample, a UK White Paper issued in early 2003 assumes that energyefficiency can achieve about half of the GHG reduction targets up to 2020.
This stated goal sometimes runs counter to other policies, such as those togradually liberalise and deregulate the energy markets. Deregulationtypically transfers responsibility for energy efficiency to the consumer andrelies on energy prices as the signal for action. However, the 2003 electricitycrises in New Zealand and Norway, combined with earlier crises in Californiaand elsewhere, have forced governments to reassess their role in energymarkets. These reassessments have led to reconsideration of governmentroles in energy efficiency and other forms of managing and forecasting energydemand. California utilities have recently proposed a major expansion oftheir activities to promote energy efficiency.
The rapid run-up of oil prices, plus the possibility of oil shortages caused bythe events in the Middle East, prompted many governments to implementvarious short-term oil conservation strategies with special emphasis onindustrial consumers. Most of these are expected to ease as oil prices fall andthe likelihood of dislocations and shortages diminish.
Governments have a range of tools available to encourage energyconservation and efficiency, including adjusting energy prices, establishingfinancial instruments to encourage the use of efficient products and practices,mandating minimum efficiency levels, creating voluntary programmes andenergy rationing. In 2003, IEA countries employed all these tools (exceptrationing) to promote energy efficiency. Some of the highlights are describedbelow.
6
105
105-Energy Efficiency 2/12/03 11:18 Page 105

MINIMUM EFFICIENCY REGULATIONS
Minimum efficiency performance standards are a proven strategy to reliablycut energy use at very low costs to the consumer. This mandatory approachhas been used successfully for appliances, office equipment, motor vehiclesand buildings. The standards must be regularly updated if they are to remaineffective. The US has begun its third round of updates for some appliancestandards (see Figure 36 for a demonstration of the long-term impact ofefficiency standards for refrigerators), but most countries remain in their firstor second round.
Energy use of domestic appliances and equipment represents a significantend-use of energy in all IEA countries and large efficiency improvements aretechnically feasible and highly cost-effective. Existing regulations have alreadybeen responsible for huge electricity savings. In the case of refrigerators, newunits complying with the regulations typically consume half as much as thosethey replace.
Similar trajectories in efficiency have occurred for other regulated appliances(such as air-conditioners and washing machines). Further savings are possible as new technologies, such as increased use of sensors combined with microprocessor logic, become more flexible and cheaper. As a result,nearly every country operates some combination of mandatory and voluntaryefficiency programmes applying to the domestic, commercial and transportsectors.
Mandatory efficiency standards were recently broadened or strengthened inJapan, the US and Australia. The Japanese TopRunner standards programmeadded several new products, including gas appliances and transformers. TheTopRunner programme now covers appliances responsible for roughly three-quarters of residential electricity use. It is at present evaluating the impactbefore updating the levels. Both Australia and the US updated standards forseveral of its products in 2003.
Improving the efficiency of new residential and commercial buildings remainsone of the most cost-effective strategies to reduce energy use. However, theyare also among the most difficult to implement owing to the complexity ofconstruction, the large number of groups involved and unique localrequirements. Australia, for example, just completed its first national code. In Germany, the previously separate thermal insulation and heatinginstallation ordinances were integrated in 2003, cutting space heating fornew buildings by roughly 25-30%. The New Energy Conservation Ordinanceprovides the option for an overall optimisation of measures for thermalinsulation on the one hand, and heat unit efficiency on the other. Thisapproach relies on an integrated methodology as required by the EU Directiveon the Energy Performance of Buildings. Meanwhile, the EU has directed allits members to establish building energy rating schemes. Similar programmes
106
ENERGY EFFICIENCY Overview of Energy Policy and Market Developments
105-Energy Efficiency 2/12/03 11:18 Page 106

107
Overview of Energy Policy and Market Developments ENERGY EFFICIENCY
0
200
400
600
800
1000
1200
1400
1600
1800
2000
1960
1965
1970
1975
1980
1985
1990
1995
2000
2005
kWh/annum
19
90
Sta
ndard
(97
6 k
Wh
/a)
19
93
Sta
ndard
(68
6 k
Wh
/a)
20
01
Sta
ndard
(47
6 k
Wh
/a)
Ave
rag
e 1980 m
odel
had
19.6
cu.ft
. of
capac
ity,
use
d 1
278 k
Wh
/a a
nd
use
d
CFC
-blo
wn
foam
insu
latio
n.
By
2001,
a ty
pic
al m
odel
has
20
cu.ft
. of
capac
ity,
feat
ure
s m
ore
th
roug
h-th
e-doo
r se
rvic
es li
ke ic
e an
d w
ater
, use
s ab
out
63%
les
s en
erg
y (4
76 kW
h/a
) th
an th
e 1
98
0 m
od
el an
d u
ses
ozo
ne-
frie
ndly
foam
insu
latio
n.
1972,
first
oil
pric
e sh
ock
s (1
726 k
Wh
/a).
Ave
rag
e 1961 m
od
el h
ad a
ppro
xi-
mat
ely
12 c
u.ft.
of
capac
ity,
use
d
1015 k
Wh
/a a
nd
use
d f
ibre
gla
ss
insu
latio
n.
Not
e:th
e 20
01 s
tand
ard
has
been
in fo
rce
for o
ver t
wo
year
s.So
urce
:Co
ol A
pplia
nces
:Po
licy
Stra
tegi
es fo
r Ene
rgy-
Effic
ient
Hom
es, I
EA/
OEC
D P
aris
, 200
3.
Figu
re36
Ave
rag
e E
nerg
y U
se o
f Re
frig
era
tors
in th
e U
nite
d S
tate
s,19
60 to
200
5(s
hip
me
nt
we
igh
ted
)
105-Energy Efficiency 2/12/03 11:18 Page 107

have recently been established or significantly upgraded in Japan andAustralia. These rating and labelling systems will permit consumers toidentify energy-efficient buildings, governments to establish rational policiesto upgrade efficiency and track progress in energy conservation. Severalcountries are also directing their efforts towards stricter commercial buildingcodes.
Efficiency standards for motor cars are approached differently in each country.Japan’s comprehensive TopRunner programme includes motor vehicles, andrecently imposed stricter standards after the performance of new vehiclesapproached the initial TopRunner levels. In the US, fuel efficiency of new lightduty vehicles fell to a 22-year low with little improvement in fleet efficiencyover the period (see Figure 37). In 2003, however, the US raised efficiencystandards for light trucks by about 10%. In a separate action, Californiasought to indirectly increase efficiency for vehicles sold in the state byregulating vehicle emissions.
Recent technological advances have set the stage for major increases in vehicleefficiencies. Hybrid vehicles have now been demonstrated to be technicallyfeasible and economic in most cases. It is not yet clear if the shift to higher
108
ENERGY EFFICIENCY Overview of Energy Policy and Market Developments
Australia
Sweden
Japan
United States
France
6
8
10
12
14
16
18
20
1970 1975 1980 1985 1990 1995 2000
Fuel
Inte
nsi
ty (
litre
/10
0 k
m)
Source: IEA database.
Figure 37
Fleet Average Fuel Economy of Cars and Personal Light Trucks in Selected IEA Countries
(litres/100 km using gasoline equivalents)
105-Energy Efficiency 2/12/03 11:18 Page 108

efficiency will be implemented through mandatory regulations or a combinationof voluntary measures. The UK has introduced several financial measures thisyear to reduce transportation energy, notably a fee for vehicles entering London,plus restructuring tax incentives to encourage more efficient corporate cars.
VOLUNTARY EFFICIENCY PROGRAMMES
Voluntary programmes continue to play an important role in overallgovernment efficiency policies in nearly all sectors. Voluntary programmestake many forms, from an agreement with an individual company regarding asingle energy-intensive factory, to broad agreements covering dozens of groupsand millions of products. Such agreements can either complement mandatoryprogrammes or operate where regulatory mechanisms are unsuitable. Mostvoluntary programmes are initiated and administered by national governments,although states, cities and utilities can also be responsible. Firms are encouragedto participate by financial incentives (such as the UK’s Carbon Trust) or bypublic recognition, technical assistance with developing competitive efficiencyimprovement strategies and other means of support.
With respect to motor vehicles, European manufacturers have agreed to cutspecific emissions (which translates into fuel efficiency) of new vehicles from185 gCO2/km in 1995 to 140 g/km in 2008. Further negotiations this yearmay result in an even more ambitious target of 120 g/km by 2008.
Voluntary efficiency programmes in the industrial sector have already beenestablished in nearly all IEA countries and most continue to be active. TheUK’s Carbon Trust offers reduced levies on energy prices for its participants,while Australia’s Greenhouse Challenge Programme offers technical adviceand recognition.
Most voluntary programmes are confined to a single country. However, a few,such as Energy Star, Blue Angel and Nordic Swan, operate internationally. Thelargest of these, Energy Star, establishes minimum efficiency specifications forPCs, printers, copiers and other office equipment (see Table 12).
Some voluntary programmes are designed to encourage the production andpurchase of higher efficiency products with the eventual goal of markettransformation. This occurs when manufacturers find it profitable to offermore high-efficiency products and cease production of less efficient ones. Todate, the effectiveness of these programmes is highly variable.
Energy Star will soon require imaging products to meet higher efficiencyspecifications and has begun work on upgrading PC specifications. EnergyStar has also announced its intention to establish specifications for domesticwater heaters. These specifications are likely to encourage manufacturers togreatly increase production of heat pump water heaters, a technology capable
109
Overview of Energy Policy and Market Developments ENERGY EFFICIENCY
105-Energy Efficiency 2/12/03 11:18 Page 109
of reducing electricity consumption by half. Since electricity consumption forwater heating is one of the largest end-uses in many IEA countries, thisprogramme could have a major impact on energy use in the next decade.
IEA member countries have continued their voluntary programmes, oftenupdating them when circumstances warrant it. For example, the EU anddomestic refrigerator manufacturers recently negotiated a voluntaryagreement under which they will ensure that average efficiency would rise tothe “A” level on labels by 2006. This year, Australian manufacturers updatedall their labels (making it more difficult to achieve the highest rating) toreflect the appearance of equipment with higher efficiencies.
Several countries have initiated plans to increase the efficiency oftransformers, from fist-sized units used in small consumer electronics to thoseserving large commercial buildings. Since essentially all electricity flowsthrough a transformer (and often several transformers), the potentialelectricity savings are enormous, even from small increases in efficiencies. Thepolicies have focused on the no-load, part-load and full-load efficiencies.Japan has used a regulatory approach, while the EU and Australia rely onvoluntary programmes, and the US is seeking to use a combination ofapproaches.
110
ENERGY EFFICIENCY Overview of Energy Policy and Market Developments
Table 12
Major Product Areas Covered by Energy Star in Different Countries as of 2003
Major Product Areas United Canada Australia Europe,States and Japan,
New Zealand Taiwan
Office equipment (personal computers, displays, copiers, etc.) X X X X
Consumer electronics (televisions, video cassette players, digital disk players, etc.) X X X
White goods (refrigerators, dishwashers, washing machines, etc.) X X
Heating and cooling equipment (air-conditioners, furnaces, heat pumps, fans, etc.) X X
Building materials (insulation, windows, doors, high albedo roofs, etc.) X X
Homes X
Commercial buildings X
105-Energy Efficiency 2/12/03 11:18 Page 110

TECHNOLOGY AND RESEARCH AND DEVELOPMENT POLICY
CRITICAL ROLE OF ENERGY TECHNOLOGY
If growing worldwide demand for energy services is to be met while enhancingenergy security and stabilising GHG concentration in the atmosphere, theglobal economy, as well as the global energy sector, must be transformed intoone relying extensively on advanced, efficient, low-emissions technologies forenergy supply, transport, storage and use. Therefore, technology research anddevelopment play a critical role in meeting energy policy objectives, namely,energy security, environmental protection and economic growth.
Curbing the upward “business as usual” trend in energy sector GHG emissionsshown in the World Energy Outlook 2002 will require that new transitionaltechnologies (those which integrate and interface with existing technologies) aredeployed quickly so as to capture new capital stock investment as it is made. At thesame time as new transformative technologies (those which will eventuallyreplace existing technologies over the longer term) are being developed, thechallenge is how to deploy these transformative technologies.
R&D FUNDING CHALLENGE
Despite the critical role to be played by energy technologies, the current levelof energy R&D, both in the public and private sectors, is a cause of concern.After a significant increase from the mid-1970s to early 1980s, governmentenergy R&D budgets in IEA countries have declined while there was a slightincrease after 1997.
The government R&D budget for fossil fuels and nuclear fission has seen asignificant drop since the early 1980s, while nuclear fission still has the largestshare. On the other hand, R&D for renewable energy and power and storage,which peaked in the early 1980s followed by a decrease in the mid- to late1980s, has been increasing through the 1990s. Energy conservation R&D hasbeen constantly increasing. Industrial energy R&D investments have becomeincreasingly short-term owing to market liberalisation and intensified competition.
Current levels of energy R&D and the predominantly shorter-term focus arenot adequate given the magnitude of the challenges in terms of climatechange and energy security. A greater and sustained commitment is neededto energy technology R&D and technology demonstration, to the underlyingbasic sciences and to market uptake of new technologies in order to ensurethat low-carbon and low-cost technologies are available when needed.
7
111
111-Technology 2/12/03 11:18 Page 111

PROMISING AREAS FOR CLEAN TECHNOLOGY DEVELOPMENT
Many promising technologies are being developed or available to meet thesechallenges9. A network of energy technology experts from IEA member countriesand the IEA Committee on Energy Research and Technology (CERT) hasidentified technologies that will play a central role in future energy systems.
RENEWABLE ENERGY TECHNOLOGIES
Each IEA country is endowed with different, substantial renewable resourcesand will choose its own mix of renewable energy technologies to support anddevelop. The key to growth in renewables will be the success of current andplanned R&D and diffusion support efforts to reduce costs through “technologylearning” in such areas as solar photovoltaics, solar thermal systems producingpower and/or heat, advanced wind technology, bioenergy systems, geothermalenergy, hydropower, ocean energy and eventually photolytic processes.
112
TECHNOLOGY AND RESEARCH AND DEVELOPMENT POLICY Overview…U
S$ m
illio
n a
t 2
00
1 p
rice
s an
d e
xch
ang
e ra
tes
Fossil Fuels
RenewableEnergy
NuclearFission
NuclearFusion
Powerand Storage
Conservation
Other
01975 2000
2 000
4 000
6 000
8 000
10 000
12 000
14 000
16 000
1980 1985 1990 1995Source: Country submissions.
Figure 38
Government Energy R&D Budgets in IEA Countries, 1974 to 2001
9. In the Communiqué of the IEA Ministerial Meeting in Paris on 28-29 April 2003, the importance oftechnology R&D was significantly emphasised and Ministers agreed to commit themselves to achievinggreater efficiency both through national programmes and through international technology collaboration.Ministers visited with great interest the IEA Technology Fair where many of the Implementing Agreementsdisplayed models, energy technology equipment, on-line information material, publications, posters, etc.
111-Technology 2/12/03 11:18 Page 112

FOSSIL FUEL TECHNOLOGIES
Noting that fossil fuels will continue to dominate the global energy mix up to 2030, technology to switch to less carbon-intensive fossil fuels(particularly natural gas), more efficient fossil-fuel combustion technologies,technology on CO2 separation, capture and storage, would play an importantrole.
HYDROGEN TECHNOLOGIES
As an energy carrier like electricity, hydrogen could play important andwidespread roles in future energy systems such as:
● Fuel for direct combustion.
● Electricity production in fuel cells for both stationary use (power plants,buildings, industry) and transport.
● Electricity storage (hydrogen and electricity can be converted from one tothe other using fuel cells and electrolysers, though with associated losses).
Like electricity, hydrogen can be produced from many sources: fossil fuels withCO2 capture and storage, renewable sources and nuclear power. Dependingon its source, its use can enhance energy security as well as reduce GHGemissions. Used with intermittent renewable energy technologies, it can alsosubstantially expand the use of these technologies.
NUCLEAR TECHNOLOGIES
For countries that choose to use nuclear energy, nuclear fission technologiescould contribute substantially to a low net emission energy system and helpmeet the significant projected growth in world energy demand. Nuclear fissionreactors could serve both for stand-alone electricity generation applicationsand for production of electricity, hydrogen and high-temperature process heat.The size of nuclear fission’s contribution to future energy systems will bedetermined by relative technology costs, public acceptance and progress indealing with radioactive wastes.
Fusion energy could contribute significantly to large-scale electricityproduction during the second half of the 21st century. Major technical progresshas been made in both the physics and the technology of fusion over the pastdecade. The next essential step is the construction of ITER, a 500 MW plantto demonstrate the scientific and technical feasibility of harvesting fusionenergy.
113
Overview… TECHNOLOGY AND RESEARCH AND DEVELOPMENT POLICY
111-Technology 2/12/03 11:18 Page 113

END-USE TECHNOLOGIES
The built environment in the future can revolutionise efficiency in energy usefor services such as heating, lighting and cooling, transforming itself graduallythrough modernisation and new construction. It can shift to renewable or non-carbon sources of energy and power. Future buildings could be sources ofclean electricity, well integrated into a larger, power and resource grid withlocalised energy and environmental management systems and controls.
Transport systems in the latter half of this century could be dominated byvehicles, trains, ships and aircraft with very low CO2 emissions. This scenariocould feature a mix of vehicle types, for example fuel-cell vehicles powered byhydrogen, electric-powered vehicles, vehicles running on biofuels andhydrogen-powered aircraft. The hydrogen, biofuels and electricity used intransport would be produced with near-zero life cycle or well-to-wheel CO2
emissions.
GREATER SYSTEM OPTIMISATION
Future industries and industrial facilities could adopt an increasinglyintegrated system approach featuring:
● Greater use of waste heat and plant-wide optimisation of energy sourcesand sinks.
● On-site generation of electricity with carbon separation and capture.
● Greater process efficiency, making use of revolutionary processes such as hybridprocesses, bioprocesses and electricity-based processes as they emerge fromR&D in areas such as nanotechnologies, micro-manufacturing and bioprocessing.
Advanced industrial processes could also exploit high-speed and high-capacitycomputing, robotics using biological/computer interfaces, artificial intelligence,wireless communications, power electronics and photonics. In the long term,continued R&D could yield increasingly bio-based chemical products.
THE ROLE OF THE IEA TO PROMOTE COLLABORATIVE EFFORTS
With a view to maximising the potential of these promising technologies, theCERT has four expert bodies: the Working Party on Fossil Fuels, the WorkingParty on Renewable Energy Techologies, the Working Party on Energy End-useTechnologies and the Fusion Power Co-ordinating Committee. In addition, thereare three expert groups on electric power technologies, R&D priority-settingand evaluation, and oil and gas.
114
TECHNOLOGY AND RESEARCH AND DEVELOPMENT POLICY Overview…
111-Technology 2/12/03 11:18 Page 114

Furthermore, the IEA provides a framework for collaborative energy research,development and demonstration projects known as Implementing Agreements.At present, there are 41 Implementing Agreements (http://www.iea.org/impagr/imporg/imagpub/Listof.htm). The CERT or the above four workingparties deal with these agreements according to their fields. Recently, theframework of Implementing Agreements was strengthened to permit broaderparticipation of the private sector and non-member countries.
INFORMATION CENTRES● IEA Energy and Environmental Technologies Information Centre (EETIC),
Centre for the Analysis and Dissemination of Demonstrated Energy Technologies(CADDET) and Centre for Greenhouse Gas Technology Information Exchange(GREENTIE).
● IEA Energy Technology Data Exchange (ETDE).
WORKING PARTY ON FOSSIL FUELS● IEA Coal Research (Clean Coal Centre).
● Clean Coal Science.
● Enhanced Recovery of Oil.
● Fluidised Bed Conversion of Fuels Applied to Clean Energy Production.
● Greenhouse Gas R&D Programme.
● Fossil Fuel Multiphase Flow Sciences.
WORKING PARTY ON RENEWABLE ENERGY TECHNOLOGIES
● Bioenergy.
● Geothermal Energy Research and Technology.
● Production and Utilisation of Hydrogen.
● Hydropower Technologies and Programmes.
● Photovoltaic Power System.
● Solar Heating and Cooling Systems.
● Solar Power and Chemical Energy Systems (SolarPACES).
● Wind Turbine Systems.
● Ocean Energy Systems.
115
Overview… TECHNOLOGY AND RESEARCH AND DEVELOPMENT POLICY
111-Technology 2/12/03 11:18 Page 115

WORKING PARTY ON ENERGY END-USE TECHNOLOGIES
● Advanced Fuel Cells.
● Advanced Motor Fuels.
● Energy Conservation in Buildings and Community Systems.
● Energy Conservation and Emissions Reduction in Combustion.
● Energy Technology Systems Analysis (ETSAP).
● Demand Side Management.
● District Heating and Cooling.
● Energy Conservation through Energy Storage.
● Heat Pumping Technologies.
● Energy Conservation in Heat Transfer and Heat Exchangers.
● Advanced Materials for Transportation Applications.
● High-temperature Superconductivity on the Electric Power Sector.
● Hybrid and Electric Vehicle Technologies and Programmes.
● Process Integration Technologies.
● Advanced Energy-Efficient Technologies for the Pulp and Paper Industry.
FUSION POWER CO-ORDINATING COMMITTEE
● ASDEX Upgrade.
● Environmental, Safety and Economic Aspects of Fusion Power.
● Fusion Materials.
● Nuclear Technology of Fusion Reactors.
● Plasma Wall Interaction in Textor.
● Reversed Field Pinches.
● Stellarator Concept.
● Large Tokamak Facilities.
TECHNOLOGY TRANSFER
● Climate Technology Initiative (CTI).
116
TECHNOLOGY AND RESEARCH AND DEVELOPMENT POLICY Overview…
111-Technology 2/12/03 11:18 Page 116

RECENT TRENDS IN MEMBER COUNTRIES’ ENERGY R&D POLICIES
Reflecting the greater recognition of sustainable development from 2002 to2003, several IEA member countries and/or the IEA have begun new initiativesin fields such as CO2 capture and storage, hydrogen, and linkage betweenbasic science and future energy technologies.
CO2 CAPTURE AND STORAGE
Several national and international R&D and demonstration programmes have been active in this area. For example, there are active major nationalprogrammes on CO2 capture and storage in Australia, Canada, Japan, theNetherlands, Norway, the UK, the US and the EU.
IEA activities include the IEA Committee on Energy Research and Technology(CERT), the IEA Working Party on Fossil Fuels (WPFF), several ImplementingAgreements (international collaboration agreements) including theGreenhouse Gas R&D Programme10, the IEA Secretariat and the IEA CoalIndustry Advisory Board. The IEA WPFF has undertaken a major initiative to foster development of CO2 capture and storage technologies and hasapproved the “Zero Emission Technologies Strategy for Fossil Fuels”. Thistimely and important initiative of the WPFF draws together national andinternational programmes on CO2 capture and storage and allows for theirefficient co-ordination. In June 2002, the IEA CERT adopted the Strategy asan activity in line with the CERT Strategic Plan and noted the TechnologyStatus Report (Solution for the 21st Century: Zero Emission Technologies forFossil Fuels, May 2002) produced by the WPFF. The conclusions of this reportinclude the following:
● While many technical and engineering challenges lie ahead, focus shouldbe on reducing costs and developing effective, safe and environmentallysound storage options.
● In addition to addressing these challenges, legal issues must be consideredalong with public health and safety.
● The viability of carbon sequestration as a GHG mitigation strategy hingeson an informed global community that is engaged in an open dialogue onissues both locally and internationally.
117
Overview… TECHNOLOGY AND RESEARCH AND DEVELOPMENT POLICY
10. Members of the Greenhouse Gas R&D Programme include Australia, Belgium, Canada, the Commissionof European Communities, Denmark, Finland, France, Japan, Korea, the Netherlands, New Zealand, Norway,Sweden, Switzerland, the UK, the US, Venezuela and several sponsors: ALSTOM Power Technology, BP,Chevron Texaco, EniTecnologie SpA, EPRI, ExxonMobil, RWE AG, Shell International and TotalFinaELf.
111-Technology 2/12/03 11:18 Page 117
HYDROGEN
Hydrogen energy and fuel cell technology are regarded as key advances thatcan contribute to energy supply security and environmental protection in themid and long term in many IEA countries. The EU has announced a long-term€2 billion programme on renewable and hydrogen technologies under its 6th
Framework Programme. The US recently announced a total of $1.7 billion overthe next five years to develop advanced hydrogen production and storagetechnology, hydrogen-powered fuel cells for stationary and mobileapplications, hydrogen infrastructure and advanced automotive technologies.The Japanese R&D budget for fuel cells and hydrogen has tripled since 1995,reaching $200 million in 2002. Both Japan and the US have developedroadmaps for the introduction and commercialisation of fuel cells andhydrogen technology. For example, Japan has a three-stage scenario, namely,groundwork and technology demonstration (2000-2005), introductory (2005-2010) and diffusion (after 2010). Canada, Italy, the UK and China also haveR&D programmes in place or are expanding their investments. Iceland andSingapore are already committed to introducing hydrogen and fuel cells intheir electricity and end-use sectors.
This emphasis is echoed in the private sector where investments in hydrogentechnology have grown considerably over recent years, leading to technologydevelopment and demonstration projects for hydrogen-powered stationaryand mobile fuel cells, advances in hydrogen production from low-emissionsources such as natural gas and biomass as well as hydrogen fuel cell-poweredvehicles.
The level of investments in technology R&D, infrastructure, codes and standardsrequired for possible transition to the hydrogen economy in the mid to long termcall for enhanced international co-operation. The US recently launched theInternational Partnership for the Hydrogen Economy (IPHE), which will providea mechanism to organise, evaluate and co-ordinate multinational research,development and deployment programmes that advance the transition to aglobal hydrogen economy. Enhancing co-operation on hydrogen and fuel cells(basic materials, clean production, distribution, storage, infrastructure andsafety) is also a key target of the 6th Framework Programme of the EU which alsoestablished a High Level Group (HLG) to advise on such matters.
Within the IEA framework, several Implementing Agreements have been workingon hydrogen-related matters over the past two decades. A leading role is playedby the Implementing Agreements on Production and Utilisation of Hydrogenand Advanced Fuel Cells, while other Implementing Agreements (AdvancedMotor Fuels, Advanced Materials for Transportation Applications, Bioenergy andthe Greenhouse Gas R&D Programme) provide contributions on specific topics.
In response to increased interest, the IEA also organised the workshop “TowardsHydrogen” in Paris on 3 March 2003 to assess hydrogen prospects and R&D
118
TECHNOLOGY AND RESEARCH AND DEVELOPMENT POLICY Overview…
111-Technology 2/12/03 11:18 Page 118

priorities and established the IEA Hydrogen Co-ordination Group, attended by25 countries, to support and enhance co-operation in member countries and make recommendations for specific activities. The key messages from thecurrent activities are:
● Considerable R&D efforts and investments are required to make availablelow-cost hydrogen production, storage and end-use technologies.
● Huge investments in infrastructures are needed to make hydrogen a majorenergy carrier.
● While hydrogen shows great potential, its commercialisation will requiretime, investments and improved co-ordination of international R&D effortsas well as appropriate governmental and industrial energy policies.
LINKAGE BETWEEN BASIC SCIENCE AND FUTURE ENERGY TECHNOLOGY
Advances in basic science are the foundation for progress on innumerableenergy technologies. Creative linkages between basic research and appliedtechnology development will pinpoint these activities. However, insufficientsteps were taken to foster these linkages and the CERT decided to prompt aseries of seminars to explore the linkage between basic research and futureenergy technology.
As a first step, the conference on “Linking Basic Science and the Developmentof New Energy Technologies” was held on 1-2 April 2003 in Paris11. Thisconference focused on advanced computing, biotechnology and materialssciences, including nanotechnology, and also examined the institutionalchallenges. While the borders between basic and applied sciences areincreasingly blurred, the conference identified possible linkages in such areasas:
● Nanotechnology and hydrogen storage, fuel cells.
● Materials science and PV, high-temperature superconductivity.
● Advanced computing, oil and gas exploration and internal combustion.
● Biotechnology and hydrogen production.
119
Overview… TECHNOLOGY AND RESEARCH AND DEVELOPMENT POLICY
11. The conference gathered 41 delegates from 13 countries and the EU. There were 25 speakers fromCanada, France, Italy, Japan, Korea, the Netherlands, Norway, Sweden Switzerland, the UK and the US.The speakers included high-level professionnals such as Professor David King, Chief Scientific Advisor tothe UK government and the Nobel Laureate, Professor Carlo Rubbia, ENEA, Italy.
111-Technology 2/12/03 11:18 Page 119

The conference also identified important factors for creative linkages such as:
● Effective communication among stakeholders, namely, scientists involvedin basic research, technology experts, policy-makers and the private sector(governments can play a useful role in bringing basic researchers andtechnology developers together).
● Global perspectives, including international collaboration and co-ordination.
● Appropriate funding.
● Involvement of different sectors and social science.
● Consideration of market conditions and institutional innovation.
● Science and technology capacity building.
120
TECHNOLOGY AND RESEARCH AND DEVELOPMENT POLICY Overview…
111-Technology 2/12/03 11:18 Page 120

ENERGY POLICIES IN NON-MEMBER COUNTRIES
CHINA
In March 2003, the Chinese Parliament elected a new leadership headed byMr. Hu Jintao (President) and Mr. Wen Jiabao (Prime Minister). Consequently,government structure was also changed.
Responding to critics that China lacked a central energy policy co-ordinatorsince 1992 and recognising that central government needed to streamlineenergy policy responsibilities, the government announced on 26 March 2003the creation of an Energy Bureau within the National Development andReform Commission (NDRC). NDRC was established on the basis of the formerState Development Planning Commission (SDPC) which absorbed part of theabolished State Economic and Trade Commission and State Council’s Office forRestructuring the Economic System.
On 29 December 2002, the Chinese government took a major step inrestructuring the country’s electricity sector by disintegrating the State PowerCorporation which managed almost all the country’s power grid and owned50% of the generation assets. These assets were distributed to other state-owned operators and eleven new or regrouped companies were established.These include: two for the power transmission business, the State Power GridCompany in the north and the China Southern Power Grid Company in thesouth; five in the power generation business, each having less than 20% ofthe market share in all Chinese regions, with the rest owned by independentproducers; and four power-related service companies. The restructuringobjective is to separate the power generation from transmission so thatgenerators can compete against each other to sell their electricity. To overseecompetition and to carry on reform of the power sector, an electricity regulator– the State Electricity Regulatory Commission – was created at the same time.
It remains an important challenge for China to introduce effective competitionamong power generators, all of which are state-owned, with fast-growingdemand, a limited surplus generating capacity, a poorly interconnected powertransmission grid system and lack of experience in power sector regulation.Electricity demand in China is booming, with a growth of 10% in 2002 and17% in the first quarter of 2003. Chronic power supply shortages, thought tobe a thing of the past, re-emerged in a number of provinces.
In the natural gas sector, China signed an interim agreement in July 2002with a Shell-led international consortium to begin construction of the4 000 km West-East Gas Pipeline, designed to bring natural gas from the
8
121
121-Energy Policies 2/12/03 11:16 Page 121

Tarim basin in the country’s far west to Shanghai in the far east at 12 billioncubic metres (bcm) a year. The project is expected to cost US$18 billion, with$6 billion for the pipeline construction alone. The east section of the pipeline,linking the Ordos basin to Shanghai, is expected to be completed in early2004, and the west section a year later. In August 2002, China awardedAustralia with a 25-year LNG supply contract for the country’s first LNG importproject in Guandong province, with a first phase at 3 million tonnes (Mt) peryear, to begin by 2005/06. Gas will come from Australia’s North West Shelf.As part of the deal, the China National Offshore Oil Corporation (CNOOC)acquired a 25% interest in the fifth LNG train in the North West Shelf, whichis to supply the Guangdong terminal. In September 2002, China signed a 25-year sales and purchase agreement with Indonesia to supply up to 2.6 Mtper year of LNG to the country’s second terminal in Fujian. Gas will come fromIndonesia’s Tangguh gas field where CNOOC acquired a 12.5% interest.
These impressive deals clearly demonstrate China’s desire to develop itsnatural gas market, although significant challenges lie ahead. These weredescribed in detail in the IEA’s report Developing China’s Natural Gas Market:the Energy Policy Challenges, released in December 2002. According to thereport, the major challenges facing the Chinese government and all gasmarket participants are the timely development of a downstream gas market,the improvement of local gas distribution, reform of gas pricing policies andthe timely introduction of competition, coupled with a considerable degree ofinvestment protection. Another area to be reconciled is the potential conflictof interests between gas and non-gas fuels among gas-market players andwithin the energy sector as a whole. The report calls upon the Chinesegovernment to meet these complex challenges by developing a strong andcoherent national energy policy for natural gas market development. It alsosuggests the establishment of a specialist energy department within China’scentral administration in recognition of the country’s need for a co-ordinatedenergy policy.
In the oil sector, Chinese sources reported a total net oil import of 71.85 Mtin 2002, up by 10.7% over 2001. Imports met 30% of the country’s oil needsin 2002. Following the country’s 10th Five-Year Plan, the government iscontinuing building up strategic oil reserves. It was reported that four siteshave been selected for the first phase, with a target of 100 million cubicmetres (62 million barrels) of crude oil storage capacity, although no firmschedule is provided. The implementation of the plan for strategic oil reserveswill be one of the main key tasks for the newly established energy bureauwithin the NDRC.
In the coal sector, China produced a record high of 1 390 Mt of coal in 2002,which was 20 Mt higher than the 1996 level. It thus ended the coalproduction decline since 1996. Compared to 2001, Chinese exports of coaldropped while imports surged to 10.8 Mt.
122
ENERGY POLICIES IN NON-MEMBER COUNTRIES Overview…
121-Energy Policies 2/12/03 11:16 Page 122

In August 2002, the Chinese Parliament ratified the Kyoto Protocol. Although,as a developing country, China had made no commitment to reducing GHGemissions under the Kyoto Protocol, its ratification opened the way for theapplication of flexible mechanisms that the Protocol provides, in particularclean development mechanisms. Several initiatives on CDM are under waywith Annex I countries of the Protocol.
INDIA
In recent years, the Indian government took important steps to introducechanges into the electricity sector in order to reform pricing and to put inplace more market-based mechanisms. A key development was the passage ofthe 2001 Electricity Bill in May 2003, which was enacted from 10 June 2002after being signed by the President of India. The new legislation willconsolidate three existing acts: the Indian Electricity Act (1910), the ElectricitySupply Act (1948) and the Electricity Regulatory Commission Act (1998).
The objectives of the new law are to consolidate the legislation relating togeneration, transmission, distribution, trading and use of electricity. It seeks toestablish measures conducive to the development of the electricity industry, topromote competition, to protect consumer interests and to supply electricity toall areas. The new legislation also addresses issues such as rationalisation ofelectricity tariffs, ensuring transparent policies regarding subsidies, promotionof efficient and environmentally benign policies, constitution of regulatorycommissions and establishment of an appellate tribunal.
The new law also redefines the functions and reach of the Central ElectricityAuthority, giving it a statutory basis. A new body, the Central ElectricityRegulatory Commission, will have a similar position. It also makes it mandatoryfor all states to have within six months (if none exists) their own stateregulatory body. In addition, electricity metering will be made mandatory withmore stringent provisions in place, thus making the prevalent problem of thefta criminal offence.
In 2002, the IEA Secretariat produced two publications dedicated to theIndian energy industry: the Coal Industry Advisory Board (CIAB)’s Coal in theEnergy Supply of India and Electricity in India. Both underscore the policy linksbetween sectors and the vital role of coal in Indian energy supply, particularlyas a fuel for power generation. A significant portion of future growth in globalcoal-fired power generation is expected to come from India, making reform ofthe coal and power sectors critical in attracting needed investment and inpromoting economic growth. As a follow-up to these publications, a jointIEA/India Conference on “Coal and Electricity in India” was held in September2003.
123
Overview… ENERGY POLICIES IN NON-MEMBER COUNTRIES
121-Energy Policies 2/12/03 11:16 Page 123

In recent years, India has sought to open the oil sector to private and foreigninvestment in order to increase its oil supply security. In the petroleum sector,the administrative pricing mechanism (APM) which governed the price oftransportation fuels, LPG and kerosene since 1975, was dismantled in April2002. The aim of this policy is to create a competitive market for petroleumproducts and free up the companies from government price controls, allowingthem to move in line with international prices of crude oil. LPG and kerosenewould continue to be subsidised with a fixed government subsidy for anotherthree to five years.
Following deregulation of the oil sector in May 2002, the governmentintroduced the “Petroleum Regulatory Board Bill”. The bill establishes aPetroleum Regulatory Board and seeks to “protect consumer interests byfostering competition and fair trade, preventing profiteering by entities andensuring adequate availability of petroleum products throughout the countryby giving directions to companies”. The bill covers refining, processing, storage,transportation, distribution, marketing and sale of petroleum and petroleumproducts, including natural gas.
India is currently examining the possibility of establishing strategic crude oiland petroleum products reserves to deal with unanticipated supply disruptionsand improve oil security.
The Energy Conservation Act of October 2001 came into effect in 2002. Theact provides for efficient energy use and its conservation. The Bureau ofEnergy Efficiency (BEE) was set up at the beginning of 2002 to co-ordinatewith designated consumers and agencies.
SOUTH-EAST ASIA
ELECTRICITY AND GAS TRADE AND MARKET REFORM
The countries of the Association of South-East Asian Nations (ASEAN) areliberalising their energy supply sectors, albeit at differing pace and withdiffering objectives, including the form and level of government regulationand their regulatory agencies. For reasons of diversification, security andeconomy of supply, and reduction in GHG emissions, ASEAN countries are alsoplanning and developing commercial cross-border electricity and gasinterconnections to link their national grids. The 2002 ASEAN Energy Ministers’Meeting (AMEM) endorsed these two ongoing regional developments, knownas the ASEAN Power Grid and the Trans-ASEAN Gas Pipeline. They also agreedto the establishment of the ASEAN Gas Consultative Council to address barriersto cross-border trade and to study regional regulatory and institutionalframeworks.
124
ENERGY POLICIES IN NON-MEMBER COUNTRIES Overview…
121-Energy Policies 2/12/03 11:16 Page 124
The IEA/ASEAN Electricity and Gas Sectors Reform Workshop, held in Paris inApril 2002, initiated dialogue between the IEA and ASEAN on trade andmarket reform. The workshop examined the restructuring experience of IEAmember countries and where it could contribute to ASEAN restructuringpolicy, notably that of governing legislation, power and gas supply standards,regulatory institutions and cross-border regulatory frameworks.
The IEA has subsequently been invited to provide expert input to the regionon national regulatory models for reforming the electricity and gas sectors.While many ASEAN countries have established regulatory agencies and theiroperating framework, many are also in an evolutionary process. There is ageneral interest to understand models being adopted by their neighbours andinternationally. The IEA and the ASEAN will work closely on understandingthe lessons and evolution of Europe’s electricity and gas markets and theirregulators.
Recognising the regulatory and institutional frameworks necessary forregional gas and electricity trade and in support of the AMEM 2002 decisionon ASEAN regional gas and electricity trade, this project will also focus onregional regulatory frameworks for trade, their evolving functions, managementand structure.
OIL SECURITY AND EMERGENCY PREPAREDNESS
The ASEAN governments recognise the importance of oil security policy andprogrammes to their increasing exposure to supply disruption and pricevolatility.
Thailand and the Philippines are the major non-oil-producing ASEAN members.In August 2002, Thailand’s Energy Policy Office announced it had “… prepared measures to cope with a likely oil shortage and a jump in fuelprices …” including special funds to absorb the impact of oil price hikes andfuel allocation. Similarly, the Philippine Department of Energy announced agovernment and industry National Oil Contingency Plan to create an EnergyContingency Task Force, monitor commercial stocks and ration/allocate fuel.
While government-controlled oil stocks are particularly effective for short-termmarket stabilisation, ASEAN countries do not have such stocks. Some havemandated that stocks should be held by oil producers and importers, but themajority are commercial or operational stocks. ASEAN countries remainconcerned about minimising the cost of stockholding, and various initiativeshave been proposed within ASEAN for joint stockholdings.
Until very recently, regional oil security was an issue of considerable sensitivityamong ASEAN countries, with considerable divergence of views. The 1986ASEAN Petroleum Security Agreement (APSA) is based on oil sharing between
125
Overview… ENERGY POLICIES IN NON-MEMBER COUNTRIES
121-Energy Policies 2/12/03 11:16 Page 125

the “haves” and the “have nots”. However, it appears not to have been operationalisedand is currently under review by the ASEAN Council on Petroleum (ASCOPE).
It is interesting to note that in the recent oil market tightness, the ASEAN oilproducers, Malaysia, Brunei and Indonesia, committed to supply oil to thePhilippines in case of an acute shortage, as provided for under the APSAagreement.
The revised APSA will also encompass medium- to long-term security measures,including diversification of energy sources and trading regional energyresources through links such as the Trans-ASEAN Gas Pipeline and the ASEANPower Grid.
The IEA was invited to provide expert input to the review, and in July 2002,the review framework and recommendations were agreed by the annualASEAN Senior Officials Meeting on Energy (SOME). The review is continuing.
In December 2002, high-level officials of the ASEAN and the IEA met forexpert policy and technical discussions in the ASEAN+3/IEA Joint Workshopsponsored by the Japanese government. The forum focused on broader energyco-operation issues as they impact on energy security.
In September 2003, the ASEAN and the IEA met in Paris for the first time toinitiate a 2003/2004 programme on “ASEAN Oil Security and EmergencyPreparedness”. This focused closely on regional requirements and how theIEA’s unique policy and practical experience may assist in the development ofnational and regional security policy and practice. This includes back-to-backindustry site visits of emergency facilities in France and neighbouringcountries to learn practicalities firsthand.
SOUTH AMERICA
In the last few years, South America has emerged as one of the most attractiveinvestment regions in natural gas exploration and production, pipelines, LNGfacilities and gas-fired power generation. The continent boasts abundant andgrowing natural gas reserves. The need to diversify away from hydropower andoil is driving many countries to promote natural gas, especially in powergeneration. Several cross-border gas pipelines now link gas-rich countries withlarge energy-hungry markets in neighbouring countries. Many more are on thedrawing board.
Most South American countries have carried out substantial reforms of theirgas sectors, often as part of wider economic and institutional reforms.Privatisation of state-controlled utilities and assets and efforts to increasecompetition have successfully attracted many private companies. Stepstowards regional co-operation and integration have not only facilitated cross-
126
ENERGY POLICIES IN NON-MEMBER COUNTRIES Overview…
121-Energy Policies 2/12/03 11:16 Page 126

border energy trade, but have fostered stability and growth throughout theregion, bolstering energy demand growth.
To contribute to such development, the IEA published South American Gas –Daring to Tap the Bounty in February 2003. The following are summaries ofkey countries contained in the publication.
ARGENTINA
Argentina is a net hydrocarbon exporter and has a mature domestic gasmarket. As a leader of the privatisation of state-owned utilities, Argentinaimplemented sweeping changes to its upstream and downstream gas industryin the early 1990s. Since then, growth in domestic gas demand has continuedsteadily. In recent years, the development of a regional gas pipeline networkhas enabled Argentina to increase gas exports to neighbouring countries andArgentine energy companies are looking increasingly to neighbouringMERCOSUR countries and beyond for investment opportunities. At the sametime, many foreign companies have entered the Argentine oil and gas market,attracted by the favourable investment and tax environment and theprospects for regional expansion. The country’s economic and financialdifficulties are severely affecting the gas sector (as well as the rest of theenergy sector). Companies, largely indebted in US dollars on the internationalmarkets, have seen their revenues in pesos devaluated by 400%. The gasdistribution companies, already debilitated by three years of recession andaffected by an increasing incidence of unpaid bills, are accumulating hugedebts which their international mother companies are unwilling to cover. Thesituation is no less difficult in the upstream sector. With the devaluation of thepeso, the wellhead price – which is determined by the spot price in BuenosAires – has been falling drastically, in some cases below production costs.
BOLIVIA
With proven natural gas reserves that grew seven times since 1997, Bolivia isnow the second-largest holder of proven natural gas reserves in South Americaafter Venezuela, but the first in terms of non-associated gas reserves. Bolivia’sgeographical position and abundant gas resources make it ideally placed tobecome South America’s gas hub and play a central role in Southern Coneenergy integration. Thorough reforms in the mid-1990s have transformed thecountry’s energy sector from state-owned monopolies to a predominantly privateindustry. The country’s domestic energy market is small, but the prospect ofsupplying the region’s largest and rapidly growing energy market – Brazil – hasattracted a large number of foreign companies to Bolivia. The issue now facingBolivia is how to monetise its gas reserves. Exports to Argentina and Chile arebeing explored, as well as LNG exports to Mexico and the US.
127
Overview… ENERGY POLICIES IN NON-MEMBER COUNTRIES
121-Energy Policies 2/12/03 11:16 Page 127

BRAZILBrazil is the largest energy market in South America, accounting for 40% of thecontinent’s energy consumption. Historically, natural gas contributed very little toBrazil’s energy mix, although the country has significant hydrocarbon resources.A severe drought-induced power crisis in 2001 exposed the vulnerability of asystem that relies on hydropower for 90% of its electricity supply. The governmentaims to increase the share of natural gas in the energy mix to 12% in 2010, upfrom the current 4%, mostly as a result of new gas-fired generation. The recentopening of the upstream oil and gas sector to foreign investment should boostdomestic natural gas production, but most of Brazil’s natural gas supply isexpected to come from imports. Since 1999, imported gas from Bolivia has beenflowing through the 3 150 km Bolivia-Brazil pipeline, and several other pipelinesare under construction or planned to bring gas from Argentina. However, thedevelopment of the Brazilian natural gas market has been slower than expected.In particular, uncertainties surrounding the structure and regulation of theelectricity market, as well as the inherent complexities of introducing gas-firedpower generation in a hydro-dominated power generation sector, havecontributed to delaying several gigawatts of gas-fired power projects.
VENEZUELAVenezuela, the world’s sixth-largest oil producer, is moving to capitalise on itsenormous natural gas resources. The country holds four trillion cubic metres ofproven gas reserves, the eighth-largest gas reserve in the world and the largestin South America. However, 91% of Venezuela’s current gas reserves areassociated with oil, and much of the gas produced is reinjected into oil wells toboost crude oil production. Hence, gas production is very dependent on OPECproduction quotas. The government is now pushing to develop non-associatedgas reserves and increase the share of gas in the energy balance. The 1999 GasLaw opens the door to private investment in all gas-related activities exceptexploration and production (E&P) of associated gas. The first Venezuelan gas-only E&P licences were granted in June 2001 to private consortia which includefour foreign and two local companies. Despite the undoubtedly large potentialfor natural gas development, investors’ response has been subdued. Concernsremain over the issues of gas pricing, the government’s focus on thedevelopment of local markets rather than exports and, last but not least, thecountry’s current political and economic uncertainties.
MEXICO12
Mexico is the world’s 13th-largest economy, the 5th-largest oil producer and the9th-largest natural gas producer. Despite efforts at diversification, the Mexicaneconomy remains heavily dependent on the national petroleum sector.
128
ENERGY POLICIES IN NON-MEMBER COUNTRIES Overview…
12. The description of Mexico is not given in the South American Gas – Daring to Tap the Bounty.
121-Energy Policies 2/12/03 11:16 Page 128

Oil and gas dominate Mexico’s energy sector. In 2000, oil represented 76% ofenergy production, 62% of total primary energy supply (TPES), 65% of finalenergy consumption (TFC) and 48% of electricity generation. Gas, whichrepresented only 14% of energy production, accounted for 22% of TPES, 11%of TFC, and 20% of power generation. About 5% of primary gas consumptionwas imported from the US in 2000, but this share is expected to rise in thecoming years.
The state-owned oil and gas company Petroleos Mexicanos (Pemex) is the largestcompany in Mexico and the 5th oil-producing company worldwide (and one ofthe most profitable before taxes). Pemex retains exclusive control of natural gasexploration and production, processing and firsthand sales, but the downstreamsegment of the Mexican natural gas industry was liberalised in 1995. Anamendment to the Constitutional Article 27 on Petroleum allowed the privatesector to construct, operate and own natural gas transportation, storage anddistribution systems. The reform also lifted the ban on gas imports and exportsby private companies. Two other pieces of regulation enacted in 1995 definedthe regulatory framework under which Pemex and private parties, both domesticand foreign, can participate in the gas industry and gave the Energy RegulatoryCommission (CRE) responsibility for regulating the natural gas sector.
Gas Natural Mexico, a subsidiary of Repsol-YPF, is the largest natural gasdistributor in Mexico. Despite the entry of a number of large private players innatural gas distribution, Pemex’s exclusive control over gas supply has resulted inthe state-owned company retaining a de facto monopoly over gas transportation.
Mexico has important natural gas resources. At the start of 2001, its provennatural gas reserves stood at 835 bcm, a 2.9% decrease with respect to 2000.In March 2002, Pemex announced the discovery of three new natural gasfields in the state of Veracruz – Lankahuasa, Playuela and Hap, located along the Mexican Gulf. Pemex estimates that these fields could represent upto one-quarter of total Mexican natural gas reserves.
In the year 2002, Mexico produced around 120 mcm/d of natural gas, ofwhich 30% came from non-associated gas wells. The production of non-associated gas has been rising by 8.8% per year between 1992 and 2002,compared to 0.3% per year for associated gas. Despite Mexico’s abundantnatural gas reserves, lack of investment has left the country with insufficientproduction capacity to satisfy its growing consumption. As a result, Mexico hasbecome a net importer of US gas – 16.8 mcm/d in 2002, rising to 18.3 mcm/din the first quarter of 2003.
The Mexican government expects that energy demand will grow at an averageannual rate of 4% between 2001 and 201013. Demand for electricity is
129
Overview… ENERGY POLICIES IN NON-MEMBER COUNTRIES
13. Based on the following assumptions: GDP growth 5.2% per year, population growth 1.2% per year.
121-Energy Policies 2/12/03 11:16 Page 129

expected to grow by 6.3% annually, while gas demand (largely driven byelectricity generation) is projected to increase by 8.1% per year during thesame period, reaching 269 mcm/d in 2010 – from 122 mcm/d in 2000.
With stagnant production, rising demand and import bottlenecks, the countryfaces natural gas supply shortages. In the first six months of 2003, Pemexproduced 108 mcm/d, while the national consumption was 122 mcm/d.According to Raúl Muñoz, Director-General of Pemex, Mexico will need toboost production by 50% as demand surges over the next four years.
To meet this increase in demand will require substantial investments to sustainthe oil and gas reserve level and to expand gas and electricity infrastructure.Mr. Fox’s government is conscious that reforms to increase private participationin the energy sector are essential. Meeting natural gas demand is an integralpart of the country’s overall energy policy. In 2002, the administrationundertook measures to increase domestic production and to facilitate importsfrom diverse foreign suppliers. A mid-term election for Mexico’s Congress tookplace in July 2003. President Fox’s National Action Party (PAN) won only30.5% of the vote, behind the 34.4% earned by the Institutional RevolutionaryParty (PRI). The Party of the Democratic Revolution (PRD) won 20% of thevote. The result of the election will certainly cast a shadow on the country’spolitics for the next three years. President Fox has to face the oppositionagainst his energy reforms from PRI and PRD since they had slowed down theprivatisation process of the electricity and oil sectors in the past three years.
Recently, several foreign companies have proposed building LNG re-gasificationterminals on both coasts of Mexico. The Mexican government is supportive ofthese projects since they would help diversify natural gas imports and reducegas supply risks in the face of a demand expected to grow by 8% a year overthe coming decade. In August 2003, the CRE granted three key permits for theconstruction of LNG terminals by private companies: one plant in the port ofAltamira and two plants in the Ensenada region of northern Baja California.
RUSSIA
Whether Russia will play a significant role as a key oil and gas exporterdepends on the political will to continue implementation of difficult reformsover the next decade to attract the necessary domestic and foreign investmentin order to sustain and increase current production and export capacity. Ifenergy-sector reforms are not made, it is uncertain that the energy sector canmatch increasing domestic energy demand during a period of strong GDPgrowth without significant new improvements in energy efficiency. GDPgrowth in 2002 was slightly above 4% after peaking in 2000 at 9%. Totalinvestment requirements in the energy sector to 2020 are estimated by theRussian Ministry of Energy at between $480 billion and $600 billion.
130
ENERGY POLICIES IN NON-MEMBER COUNTRIES Overview…
121-Energy Policies 2/12/03 11:16 Page 130

ENERGY MARKET REFORM
Getting domestic “prices right” is the critical issue for both the electricity and gassectors restructuring. This will especially ensure that the infrastructure ofelectricity and heating does not further deteriorate. It will also encourage moreenergy efficiency investments and allow Russia to unlock its huge potential forenergy efficiency, which can in time lead to a reduction in domestic energydemand and consequent reduction in supply requirements. Energy efficiencyinvestments are already being made by home-owners and industry, and thisprocess will be given even more impetus if prices truly reflected costs. It wouldalso provide opportunities and incentives for domestic and foreign companies toinvest in the gas sector and in energy efficiency projects in Russia. Energy pricehikes, however, are socially painful and will have to be addressed throughadequate social policies. The experience in recent years shows that, in the shortterm, energy price increases negatively impact Russian industrial productiongrowth. Again, the medium- to long-term solution is not to keep energy pricesartificially low, but to restructure unprofitable enterprises.
Moves in 2002 to restructure the Russian gas sector have been hindered byenergy security risks which could heighten. The Ministry of EconomicDevelopment and Trade (MEDT) is promoting a separation of transportationand dispatch from gas production as the first step to liberalisation. Gazpromis asking for the creation of a domestic gas market without any changes to themonopoly’s structure, accounting for almost 90% of national gas production.It argues that otherwise Russia’s energy supply could be threatened andinvestors driven away. Increasingly, Russian oil companies and independentgas producers are seeking more transparent access to Gazprom pipelines.Proponents of the MEDT strategy for gas sector restructuring and otherpotential gas suppliers within Russia clearly seek to supply export markets.Until domestic prices are increased, it is difficult to break apart the delicatesystem of cross-subsidies (high-value exports for low-value domestic supplies)which Gazprom has worked within for so many years. Given the politicallycharged steps needed for gas sector reform, despite a strengthening domesticdebate, it is unlikely that any reforms will be passed until after the presidentialelections in 2004.
The pace of reform depends to a large degree on future international oilprices. If oil prices remain high over the medium term, there will be littlemotivation to make difficult reform decisions. Market liberalisation will beslow, few changes will be made to the fiscal, legal and/or regulatory regimesand foreign investment will not be considered necessary. Gazprom will retainits monopoly power given that healthy export revenues will limit the need toraise domestic gas prices. There will be little incentive for energy efficiency. Inthis case, Russia could run the risk of facing an energy security risk as energyproduction would be hard-pressed to match growing consumption. All thischanges if oil prices drop over the medium term. Russia then needs to attract
131
Overview… ENERGY POLICIES IN NON-MEMBER COUNTRIES
121-Energy Policies 2/12/03 11:16 Page 131

foreign investment, reform its fiscal regime, increase domestic gas prices (tomatch lost export revenues from lower gas export prices), energy efficiencygains are realised and there are moves for gas sector restructuring. Enhancedco-operation with the IEA and the OECD at a time when Russia isimplementing various key energy sector reforms could encourage thegovernment to take difficult decisions and not make the same mistakes as IEAcountries have in the past.
OIL SECTORDuring the 1980s, Russia was the largest oil producer in the world. WhileRussia almost halved its oil production from 11.4 mb/d in 1988 to 6.0 mb/din 1996, since 1999 it has steadily increased its oil production from 6.1 mb/dto 7.6 mb/d in 2002. Most of this growth has been from reactivating idle wellsand enhancing production at existing fields. It is uncertain how long Russianoil companies will be able to sustain growth rates based on “low-hanging fruit”.In a high oil price environment, the shortcomings of the Russian fiscal structureare not evident. Until recently, the united stance by international majorsinvesting in Russia could be undertaken only with production-sharing agreement(PSA) terms reinforcing the view that the Russian fiscal and legal regime wasnot attractive or stable enough to warrant long-term investments. The recentequity investment by BP to form a new Russian oil company – BP-TNK – followedby Shell stating it is willing to work without a PSA, should bring new impetusto reform the generic fiscal regime along with Russia’s legal and regulatoryregime. In the short to medium term, export capacity constraints are the keyproblems hampering expansion of Russian oil production. Investments face theadded problem of Transneft’s monopoly power and the lack of transparency inthe transportation system, tariff-setting methodology and quality banks. Littlereform is expected before the 2004 presidential elections.
NATURAL GAS SECTORAn estimated one-third of the world’s natural gas reserves remain in Russia’ssuper-giant fields and in smaller fields adjacent to the super-giants, whichensure the availability of future supply. Russia also has a range of opportunitiesto import gas on commercially attractive terms from Central Asian and Caspiancountries through established pipeline networks. On 10 April 2003, Gazpromsigned a long-term agreement with Turkmenistan for gas purchases of 5-6 bcmin 2004, increasing to 70-80 bcm/year by 2009 up to 2028. Prices are set at$44 per thousand cubic metres until 2006, at which time they will berenegotiated. Clearly, this relieves pressure on Gazprom to invest in huge areaswhich are difficult to develop, ensuring supplies for the domestic and exportmarkets. More importantly, this also dampens any momentum for reform andrestructuring of the gas sector and for providing transparent and stable termsfor third-party access to oil companies and independent gas producers.
132
ENERGY POLICIES IN NON-MEMBER COUNTRIES Overview…
121-Energy Policies 2/12/03 11:16 Page 132

ELECTRICITY SECTOREffective implementation of the electricity industry restructuring plan is essentialfor the sector to meet increasing electricity and heat demand. The six lawspassed by the Duma and signed by President Putin in April 2003 are in line withthe approach of many OECD countries in unbundling the electricity sector. It isexpected to facilitate trade among regions and to form a sound basis on whichcompetition and an open electricity market can build. Effective implementationof these laws over a vague timeframe set to 2009 will depend to a large extenton the strength and independence of federal and regional regulatory bodies toensure a competitive “level playing field” for competition in all natural resourcesectors and the electricity and heat industries. Regulatory bodies will need toensure fair third-party access to the grid, transparent tariff-setting based on fullcosts, as well as clear licensing rules for new market players.
ENERGY EFFICIENCY AND THE ENVIRONMENTWith the current outlook for stronger economic growth, more effectiveimplementation and funding for environmental protection will becomepossible. This is critical if the country is to limit the environmental damageinherent in meeting increased energy demand. Under the Kyoto Protocol,Russia has committed itself to stabilise emissions of six GHGs at 1990 levelsby 2008-2012. The fact that GHG emissions are already lower than in 1990has opened opportunities for emissions trading. With the outlook foreconomic growth, the Kyoto mechanisms, known as emissions trading andjoint implementation, could raise revenues and attract investment.
CENTRAL AND SOUTH-EASTERN EUROPE
Preparation for EU membership has continued to largely influence energydevelopments in the region.
The first eight accession countries14 have accelerated their market reforms inview of official membership in May 2004. These countries have largelyachieved the separation of their government’s policy-making process fromregulatory enforcement and service operations. Their energy policies havecontinued to converge with IEA countries, notably in terms of security ofsupply, economic efficiency and environmental protection.
Accession countries have enhanced their security of supply through diversificationof energy import sources and routes, fuel mix diversification, storage andemergency plans. Regulatory reforms have focused on cost-reflective pricing of
133
Overview… ENERGY POLICIES IN NON-MEMBER COUNTRIES
14. The Czech Republic, Estonia, Hungary, Latvia, Lithuania, Poland, Slovakia and Slovenia.
121-Energy Policies 2/12/03 11:16 Page 133

transmission and final products. The opening of the electricity markets tocompetition has been initiated but has remained constrained by the dominanceof monopolies, baseload overcapacity and persistent price distortions.
Despite improvements over the past decade, energy intensity remains muchhigher than the average in Western Europe, which is detrimental to customersby increasing energy prices. Thus, implementing ambitious energy efficiencypolicies will increase competitiveness for business and welfare for households,and shift resources to productive activities at low cost which pay for themselvesover a short period. These policies generate environmental benefits andstimulate new services. However, with the exception of Slovenia, countries of the region have not yet prioritised energy efficiency, nor allocated sufficientresources.
On the other hand, substantial progress has been made in reducing thenegative environmental impact of the energy sector and energy consumption.Measures include closure of the most inefficient units, fuel switching, filteringand tax incentives. The flexible mechanisms developed under the KyotoProtocol have begun to emerge and appear as new opportunities for co-funding investment projects, notably in energy efficiency and renewableenergy. As a prerequisite, countries need to develop procedures andinstitutions to identify priorities and appraise the projects. The Dutch carbon-trading schemes (ERUPT and CERUPT) have been among the most activeprogrammes in the region through joint implementation (12 projects selectedin 2003) and clean development mechanism (eight projects approved).Furthermore, the Prototype Carbon Fund (World Bank) has selected eightprojects in the region.
In Poland, the largest energy-consuming country in the region, the energy mixcontinues to be dominated by coal (two-thirds of supply). In 2002, thegovernment suspended the extension of the restructuring plan of coal-mining,although companies’ deficits increased by one-third in 2002. Natural gasconsumption has developed below expectations, which has led to a reductionin the volume contracted with Gazprom, Poland’s sole supplier. No decisionshave been taken on the construction of supply pipelines from the North Seaor of a transit pipeline (second Yamal branch).
In January 2003, the restructuring of the gas utility gained momentum withthe creation of six regional distribution companies. The initial 33 electricitydistribution companies have been progressively regrouped with the objectiveof forming eight companies. In 2002, RWE purchased a majority stake inStoen, the Warsaw-based electricity generation company. The privatisation ofthe second refinery has not yet been concluded but its eventual integrationwith the dominant company will harm competition. The dominance of long-term electricity contracts in the wholesale market largely prevents an effectiveopening of the market to competition.
134
ENERGY POLICIES IN NON-MEMBER COUNTRIES Overview…
121-Energy Policies 2/12/03 11:16 Page 134

The Slovak energy sector has continued its restructuring. The regulatory bodyhas strengthened its powers and is responsible for pricing. In January 2003,it increased natural gas prices by one-third with the objective of phasing outcross-subsidies by 2005.
Slovnaft, the main oil company, has continued its modernisation and is nowmajority-owned by the Hungarian MOL. In the other sectors, the partialprivatisation process has continued in 2002 after the sale of the gas utilitySPP for revenues, which accounted for 13% of GDP. Regional electricitydistribution companies have been privatised to RWE, EDF and E.On.
Slovenia has strengthened its policies and institutions in view of EUmembership and has made substantial progress on energy security andopening of the electricity market. In Croatia, the newly created regulatorybody has to establish its power vis-à-vis the dominant energy companies. Thepartial privatisation of INA, the oil and gas company, is ongoing and hasattracted increasing interest among international companies. The project toreverse the oil pipeline, Adria-Druzbha, should provide the Russian oilcompanies with more direct access to southern European markets.
In Romania, the electricity and gas sectors have been unbundled and theelectricity market partially opened to competition. Nevertheless, energyreforms still need to gain momentum. Despite overcapacity, the country plansto commission a new nuclear power plant.
The Bulgarian government has continued its plans for energy sector reform. Itlaunched the privatisation of regional electricity and gas distributioncompanies to be followed by thermal power plants. The regulatory authorityhas continued energy price adjustments in preparation for privatisation andmarket opening. The closure of the most unsafe nuclear power units by 2006has been agreed with the EU, and the interruption of electricity exports toTurkey in 2003 may contribute towards a decision on closure.
In other South-eastern European countries, reforms have progressed more slowlybut are expected to gain momentum by mid-2003 when all countries shouldannounce their energy policies (in the framework of the Regional EnergyMarket/Athens process). Governments also need to establish and develop,under good governance principles, effective institutions to implementthorough and sustained regulatory reforms, as well as energy sectorrestructuring, in order to reach market fundamentals. These domestic effortsshould converge in the medium term to effectively and transparently openelectricity markets to domestic and then regional competition. The regionalelectricity market is expected to reduce supply-side costs by 10%, which is lessthan the energy savings on the demand side that are estimated at 30 to 40%of total consumption at low cost.
135
Overview… ENERGY POLICIES IN NON-MEMBER COUNTRIES
121-Energy Policies 2/12/03 11:16 Page 135

Overall, as in other economies in transition during the 1990s, energy demandin south-east Europe is expected to remain level or decrease as a result ofpricing reforms, economic restructuring and energy efficiency improvements.Thus, investment needs in the sector may be limited because of anunfavourable investment climate which will allow these resources to bedirected to other sectors.
MIDDLE EAST
ECONOMIC AND ENERGY POLICY IN THE KINGDOM OF SAUDI ARABIA
With oil and gas supplies from the Middle East region essential to meetingprojected long-term demand and the issue of security of supply becoming evermore relevant, Saudi Arabia’s economic and energy policies demand particularattention. The Kingdom’s position as a leading oil producer and the holder ofthe world’s largest crude oil reserves, together with its importance within theMiddle East and OPEC, makes a brief assessment of the country timely andnecessary.
Despite efforts to diversify, oil export revenues still represent around 80% ofgovernment income and 40% of the national GDP. Structural flaws in theeconomy were exacerbated during the oil price collapse in 1998 as thefundamental problems associated with an extensive welfare system, a bloatedpublic sector, a large, youthful population and high unemployment were allclearly exposed. Since then, the government has begun the process ofpreparing the public for change and has launched its “open door policy”,which involves a series of economic reforms as well as a partial opening of theenergy sector in an effort to spur economic growth and attract internationalinvestment. One of the principal initiatives of the Saudi government has beenthe creation of an attractive investment climate, but there are still somesectors where international investment is prohibited. Although the implementationof the announced reforms has been slow, their introduction represented amajor step in Saudi economic policy. Apart from structural changes in theinvestment process, the following sectors were earmarked for liberalisation:
● Corporatisation of the Saudi Telecommunications Company.
● Opening of the stock market to foreigners to invest through mutual funds.
● Restructuring of the electricity sector.
● Introduction of a real estate law allowing foreigners to own property in theKingdom (except in Mecca and Medinah).
136
ENERGY POLICIES IN NON-MEMBER COUNTRIES Overview…
121-Energy Policies 2/12/03 11:16 Page 136

However, to date reform has been slow and many widely promoted processesof legislation such as a new tax code, new capital markets law, labour law aswell as insurance law have not materialised. Moreover, negotiations on the$25 billion Gas Initiative, which is due to open the Kingdom to selectedinternational energy companies for domestic production and consumption ofnatural gas, collapsed in its integrated form which included power, water andpetrochemical projects in addition to gas exploration and production.
However, some progress was made with Core Venture Three, the third majorgas exploration and production project which covers the 200 000 km2 Rub al-Khali (Empty Quarter) in the south of the Kingdom. The bid for the US$ 5 billionCore Venture Three was originally won by a consortium comprising RoyalDutch/Shell and Total as well as US firm Conoco. However, in July, the Saudigovernment announced that the gas exploration and production project wasto be conducted by Royal Dutch/Shell and Total. Investment for the project isbelieved to be less than US$ 5 billion and limited only to exploration of naturalgas needed as fuel for the Kingdom’s power and petrochemical production.
In addition, no tangible progress has been made on the issue of Saudiaccession to the World Trade Organization (WTO). Privatisation plays a pivotalrole in the government’s long-term strategy to develop the private sector byenhancing the economy’s competitiveness. A ministerial resolution issued in1998 established the general privatisation strategy, driven essentially by theexpansion of investment opportunities in the private sector. Its mainobjectives revolve around increasing the share of the private sector in totalGDP, encouraging international and inward investment, enhancing theeconomy’s competitiveness to WTO requirements and rationalising publicexpenditure. With 260 billion barrels of proven oil reserves and up to 1 trillionbarrels of recoverable oil, Saudi Arabia’s position as the holder of the world’slargest oil reserves remains uncontested. At the 2001 output rate of 8.8 mb/d,Saudi Arabia has a reserve-production ratio of 85 years15. The Kingdom alsoowns 50% of the Neutral Zone, which contains 5 billion barrels of crude oilreserves. Production from the Neutral Zone is equally divided between SaudiArabia and Kuwait.
In terms of energy policy, Saudi Arabia’s oil policy is mainly characterised by:
● Continuing to have the largest oil reserves with production costs among thelowest in the world (officially at $1.50/barrel).
● Maintaining spare oil production capacity.
● Failing to dilute the pivotal role of crude oil in the Saudi economy.
● Preserving a stable political system.
137
Overview… ENERGY POLICIES IN NON-MEMBER COUNTRIES
14. BP Annual Statistics 2002.
121-Energy Policies 2/12/03 11:16 Page 137

Looking to the future, the maintenance of this spare oil production capacity islikely to remain a key element in Saudi oil policy. In this context, however, theissue of investment needs to be addressed as the Saudi government will weighits options of either allowing foreign oil companies into the upstream sectoror retaining Aramco’s monopoly over the hydrocarbon sector and continuingto expand its production capacity.
Whereas upstream oil remains closed to foreign participation, internationalinvestment in the downstream oil sector is encouraged. Among areas ofemphasis are joint ventures in oil refining, petrochemical industries, storage,efficiencies in oil production and refining, improved production of lubricants,engineering and support services, all of which add value and broaden theKingdom’s industrial base.
138
ENERGY POLICIES IN NON-MEMBER COUNTRIES Overview…
121-Energy Policies 2/12/03 11:16 Page 138

PART 2
THE COUNTRY REPORTS
139-In-Depth Reviews 2/12/03 11:15 Page 139

139-In-Depth Reviews 2/12/03 11:15 Page 140

PART 2.1
IN-DEPTH REVIEWS: SUMMARIES
This part contains summaries of the findings and full list of recommendations ofthe 2002/2003 in-depth reviews for the following countries. Austria,reviewed in the 2001/2002 cycle, is included here because the report had notyet been published when the 2002 edition was released. The findings andrecommendations reflect the situation when the report was drafted andfinalised. The full reviews have been published separately.
AUSTRIA
team visit: April 2002; approval at the Standing Group on Long-Term Co-operation (SLT): October 2002
HUNGARY
team visit: October 2002; approval at the SLT: February 2003
IRELAND
team visit: November 2002; approval at the SLT: April 2003
ITALY
team visit: January 2003; approval at the SLT: June 2003
JAPAN
team visit: January 2003; approval at the SLT: June 2003
SWITZERLAND
team visit: November 2002; approval at the SLT: April 2003
139-In-Depth Reviews 2/12/03 11:15 Page 141

139-In-Depth Reviews 2/12/03 11:15 Page 142

AUSTRIA
The two most important developments in the Austrian energy sector since thelast IEA in-depth review are the liberalisation of the electricity and natural gasmarkets, and the current and planned measures to meet emissions reductiontargets under the Kyoto Protocol. Austria’s commendable liberalisation inadvance of European Union deadlines has lowered prices for larger customersbut has had less of an impact for residences. Austria should extendliberalisation’s benefits to all customer classes, particularly through loweringnetwork tariffs and monitoring excessive market concentration. Austria’scommitment under the Kyoto Protocol (13% reduction below 1990 levels)poses challenges, although the completion in 2002 of a comprehensiveclimate strategy is a clear step in the right direction. Immediateimplementation of the measures included therein will help minimise theexpense of emissions reduction. Emissions forecasts and their relatedmacroeconomic projections should be revisited, especially as experience isgained in this area. In addition, international flexible mechanisms should bemore fully incorporated into the core climate change strategy. The countrycontinues to operate without significant energy supply security concerns,aided substantially in this by its extensive international energy trade.
Austria lies at the geographical heart of Europe. It is entirely landlocked with2 562 km of borders shared with eight other countries. The Austriangovernment is a federal system with nine different Länder (or states), withresponsibilities on energy policy shared between the federal and the Ländergovernments. The country has substantial hydropower resources which it hastapped to provide approximately 70% of its electricity needs. Austria also hasdomestic oil and natural gas resources, providing 9% and 23% of thecountry’s demand for these fuels respectively. Oil and gas production fromthese domestic fields has declined over the last 20 years and is expected todecrease further as the fields become depleted.
Austria engages in substantial international energy trade. While it has energyexports, it is a net importer, importing approximately 65% of its total primaryenergy supply (TPES) in 2000. The country imports over 90% of its crude oilneeds, nearly 60% of its diesel fuel and close to 80% of its natural gas needs.Austria is a net exporter of electricity but trade balances vary seasonally asAustria’s hydropower capability fluctuates throughout the year. Thisinternational trade offers the lowest-cost solution to meeting the country’senergy needs as well a viable means of enhancing energy security andrevenue opportunities for the Austrian economy. Such trade will continue andshould be encouraged as liberalisation in the region spreads and the EUenlarges by accepting neighbouring countries.
143
139-In-Depth Reviews 2/12/03 11:15 Page 143

Austria faces no significant energy supply security problems. While its largeimport shares of oil, gas and (seasonally) electricity warrant continued monitoringof this issue, a number of factors combine to protect the country againstenergy shortfalls. These factors include a long history of uninterrupted importsfrom producing countries and the significant transmission/transportationcapabilities between Austria and these producing countries. Austria has alsotaken steps domestically to ensure supply security, including the developmentof large gas storage capabilities, comprehensive emergency responsemeasures for oil and a sizeable reserve margin capacity for electricity. Theelectricity regulator has the mandate to monitor electricity supply security,and forecasts sufficient capacity to meet demand for the next five to sevenyears.
Over the last several years, Austria has worked to liberalise its electricity andnatural gas sectors. On 1 October 2001, all electricity customers were giventhe right to choose their supplier and on 1 October 2002, all natural gascustomers were extended the same right. These market openings are well inadvance of EU directives on the subject, making Austria the fifth EU countryto offer supplier choice to all electricity customers and the third EU country tooffer supplier choice to all natural gas customers.
Austria completed the liberalisation of its electricity sector through anamendment to the Electricity Industry and Organisation Act (EIWOG 2000).This law gave all customers the right to choose their supplier, createdregulated TPA (third-party access) to the networks, established an independentelectricity regulator (the E-Control Commission), and required utilities toseparate their accounts into generation, transmission, distribution andretailing activities. The results of this liberalisation have been mixed and varyby customer class. While larger consumers have enjoyed reduced power prices,smaller customers have seen little or no change to their overall bills1. Less than1% of residential customers have switched suppliers while 20% of largerconsumers have done so. One impediment to residential supplier switching isthe high distribution charges found in Austria. Access charges to the Austriansystem, which account for approximately 35% of the average residential bill,are between 60% and 70% higher than the average of other Europeancountries. High access charges can imply cross-subsidisation, in whichcompanies overcharge for their regulated activities and use the excessrevenues to subsidise competitive activities. While system access charges havealready begun to fall since the market liberalisation, the regulator would liketo realise further reduction of between 20-30% in coming years. This initiativeis commendable and, if such efforts do not succeed in lowering accesscharges, Austria should consider more complete unbundling than the accountunbundling currently in place.
144
In-Depth Reviews: AUSTRIA The Country Reports
1. The approximately 10% reduction in residential bills has been offset by a tax increase of roughly thesame amount that was prompted by budgetary reasons.
139-In-Depth Reviews 2/12/03 11:15 Page 144

The Austrian Gas Act opened 50% of the natural gas sector market (byvolume) in August 2000, the date at which all gas generators and consumerswith an annual consumption of over 25 million cubic metres (mcm) were giventhe right to choose suppliers. From October 2002, all consumers were givensupplier choice. While negotiated TPA was initially used, this was switched toregulated TPA from October 2002. Austria will also establish an independentregulator by expanding the authority of the E-Control Commission. Althoughthese commendable developments establish a solid framework for a successfulliberalised gas sector, certain aspects of the market still threaten to underminethe success of this process. A study commissioned by the EU Directorate-General for Transport and Energy provides some insight into the marketfunctioning thus far. While the study lauded the transparent TPA accessconditions and the unbundling of the main incumbents, it also found thatonly one non-incumbent gas company is competing effectively in Austria andthat customer switch rates were quite low. Difficulties in accessing networkpipelines and long-term take-or-pay contracts were cited as factors for thelimited activity in the liberalised market. The regulator should addressdisputes related to network access and the government should act to increasethe liquidity of natural gas in the market by examing the effects that long-term gas contracts have on supply diversity and competition.
The role of Austrian utilities in the liberalised Central European energyelectricity and gas market is evolving. While significant ownership stakes inthese companies have been privatised in recent years, Austrian law still requiresthat government (at either the federal or the Land level) maintain majorityownership of the major energy utilities. In response to competition broughtabout by liberalisation, a number of incumbent Austrian utilities are formingalliances with one another. Such alliances can bring internal cost savings andhelp defer hostile take-overs by foreign firms, but they also reduce the numberof competing companies. Austria introduced new regulations addressingmarket power which the Cartel Court will use to assess the market dominanceof these allied Austrian companies. This is a positive step towards inhibitingany potential market power concerns that could stifle true competition.
Austria’s most important energy-related environmental issue is its commitmentto the Kyoto Protocol, which was ratified by the Parliament in March 2002.Under the EU’s burden-sharing system, Austria has agreed to reduce itsgreenhouse gas (GHG) emissions by 13% below 1990 levels by the time of thefirst commitment period, 2008-2012. In order to help formulate a policy toreach this target, the federal government has commissioned a study whichprojects GHG emissions forecasts running through the year 2020. This study,Energy Scenarios up to 2020 (Energieszenarien bis 2020), was conducted bythe Austrian Institute for Economic Research (WIFO) on behalf of the FederalMinistry of Economic Affairs and Labour and the Federal Ministry of Agriculture,Forestry, Environment and Water Management. The forecast reached thesurprising conclusion that greater emissions reductions would result in
145
The Country Reports In-Depth Reviews: AUSTRIA
139-In-Depth Reviews 2/12/03 11:15 Page 145

improved macroeconomic conditions. As Austria gains experience in reducingemissions, it should revisit its forecasts in order to assess the validity of thisconclusion and, if necessary, adapt its climate change strategy accordingly inorder to reduce costs across the economy.
Austria has recently finalised the Klimastrategie, a comprehensive plan whichoutlines measures to reduce GHG emissions so as to reach its Kyoto target.The plan was passed by the government on 18 June 2002. The climate changestrategy included therein was developed with the participation of the federaland Länder governments, as well as in consultation with the private sector.Emissions reduction measures were placed into six different categories, withspace heating and transport measures accounting for more than one-half of the total projected emissions cuts. Kyoto flexible mechanisms (JointImplementation, Clean Development Mechanisms and international emissionstrading) have been incorporated into selected areas of the Klimastrategie andare expected to yield emissions reductions of 3 Mt of CO2-equivalent by thetime of the first Kyoto commitment period, 2008-2012. Many of the plans forflexible mechanisms involve new initiatives which will help establish theproper frameworks for such activities. As experience is gained with flexiblemechanisms, Austria could look more closely at the costs and benefits thoseoptions offer, and refine its plans accordingly. In the meantime, Austria shouldproceed as quickly as possible to implement the most cost-effective measuresincluded in the Klimastrategie.
Austrian energy intensity (as measured by TPES over the country’s GDP) isbelow the average for IEA European countries. This is due in part to lowenergy intensity in the transport sector (resulting largely from a high share ofdiesel-fuelled vehicles in the Austrian fleet), an economy dominated byservices rather than large energy-intensive industry, and efforts to reducepublic energy use such as street lighting2. In April 2002, the governmentpublished the Austrian Strategy for Sustainable Development (DieÖsterreichische Strategie zur Nachhaltigen Entwicklung) which establishes thegoal of reducing national energy intensity at a rate of 1% per year beyond theaverage energy intensity improvements seen in the EU from 1990-1997. Thisis a commendable but challenging goal to achieve. Ensuring co-ordinationbetween the many diverse energy efficiency measures and institutions alreadyin place would allow Austria to most effectively make progress towards thistarget. Effective monitoring of policy performance is also essential.
Austria makes substantial use of district heating (DH) and combined heat andpower (CHP) plants. Such facilities provide 12% of the country’s heating and27% of its electricity. These plants are supported by regulations requiringlocal utilities to pay above-market rates for electricity coming from such plants.While CHP does have impressive energy efficiency qualities, many of the
146
In-Depth Reviews: AUSTRIA The Country Reports
2. The low energy intensity is also due to the statistical treatment of Austria’s substantial hydropower.
139-In-Depth Reviews 2/12/03 11:15 Page 146
Austrian CHP systems operate at relatively high costs. Faced with terminationof the current subsidy system at the end of 2004, Austria needs now to debatethe possibilities for other forms of support. These should include a graduallowering of support levels and use of a benchmarking system involvingminimum efficiency standards as ways of maximising CHP contributions tomeeting environmental goals in a cost-effective way.
Austria makes substantial use of renewable resources in the form of largehydropower and biomass which in 2000 provided 12.6% and 10.9% of thecountry’s TPES, respectively. Small hydropower facilities (<10 MW) provided1.3% of the country’s TPES while other renewable energy technologies (solar,wind, geothermal, biomass electricity generation and landfill gas generation)accounted for less than 0.5% combined. Small renewable energy technologies(i.e. excluding large hydropower and biomass) benefit from two separatesupport schemes. One scheme requires that electricity suppliers source aminimum percentage of their electricity from renewable energy technologies.Suppliers must get 8% of their power from small hydro facilities (<10 MW) and1% (increasing to 4% by 2007) from other renewable energy technologies.The second support scheme is the feed-in tariff system. Utilities are obligatedto purchase power from selected renewable energy technologies at above-market tariffs which are determined by the government. These tariffs wereoriginally set by each individual Land, but legislation passed in July 2002transferred this responsibility to the federal government so that now the feed-in tariffs can be made consistent across the country. This move will allowrenewable resources to be used more efficiently around the country, providingthe same level of renewable generation at lower overall cost. Austria couldfurther lower costs by introducing a degression scheme into the feed-in tariffswhereby prices are gradually lowered to provide an incentive for producers toimprove efficiency. The renewables policy should be regularly revisited.
RECOMMENDATIONS
The government of Austria should:
Energy Market and Energy Policy
◗ Continue with the liberalisation of the electricity and natural gas sectors.
◗ Further clarify energy policy objectives in the context of market liberalisation,ensuring that policy tools fit the new policy environment.
◗ Continue the national debate between the desire for large Austrian utilitiesable to fend off hostile take-overs by foreign companies and the marketconcentration issues that such utilities raise.
147
The Country Reports In-Depth Reviews: AUSTRIA
139-In-Depth Reviews 2/12/03 11:15 Page 147

◗ Review energy tax policies to prevent possible market distortion and send theright signals to consumers, taking into account the tax harmonisationefforts at the EU level.
Energy and the Environment
◗ Conduct regular monitoring of the implementation and actual emissionsreductions of the proposed Klimastrategie measures under close co-ordination between relevant ministries and between the public and privatesectors.
◗ Review the GHG emissions forecasts used as the basis for the developmentof climate change policy.
◗ Revisit the cost-effectiveness of various Klimastrategie policies as costexperience is gained through their implementation.
◗ Examine the transport sector to ensure its optimal contribution to overallGHG emissions reduction strategy.
◗ Ensure an appropriate mix of domestic policies and flexible mechanismswith a view towards minimising the economic cost of climate changemitigation policies for the whole economy.
Energy Efficiency
◗ Further improve co-ordination among the many bodies and programmeswhich address energy efficiency in the country.
◗ Institute an effective monitoring scheme for government-sponsored energyefficiency programmes to measure their efficacy in order to both improvethem and ascertain their cost-effectiveness.
◗ Review the support scheme for CHP plants, including its continuation after2004. Maximise CHP’s cost-effective contribution to meeting environmentalgoals through such measures as a gradual lowering of the support levels inaccordance with a benchmarking system which includes minimum efficiencystandards.
Renewable Energy
◗ Explore the most cost-effective measures to achieve the country’s targets forcontributions from renewable resources.
◗ Explore the introduction of a degression scheme for the feed-in tariffs whichlowers prices to consumers, encourages producers to reduce costs andprovides investors with a measure of predictability for their revenue streams.
148
In-Depth Reviews: AUSTRIA The Country Reports
139-In-Depth Reviews 2/12/03 11:15 Page 148

◗ Create a procedure by which renewable energy policies can be regularlyrevisited. This can be done as the costs of the minimum renewablespercentage requirements become clearer.
◗ Weigh the current costs of renewable energy technologies against their respectivelong-term potentials when deciding the level of support each will receive.
◗ Ensure that electricity source labelling requirements provide customers withreliable information on the sources and costs of electricity generation optionsoffered by different suppliers.
Oil
◗ Monitor OMV’s (the largest domestic oil company) self-imposed price limitationon retail sales to ensure that it in no way impedes the current high level ofretail competition by either distorting market prices or discouraging new entrants.
Natural Gas
◗ Ensure that non-discriminatory TPA is provided to the entire pipeline systemand, if necessary, consider requiring the legal unbundling of all pipelineowners or the divestiture of assets to achieve this goal.
◗ Assess whether the development of large supply groups overly concentratesmarket power and, if necessary, consider laws for the Cartel Court to addresssuch market concentration.
◗ Assess the impact of distribution tariffs on effective competition in the gasmarket and review which costs should be recovered through clear,transparent access charges which accurately reflect costs.
◗ Facilitate access to different sources of supply by promoting liquidity in themarket; consider the role a gas-trading hub at Baumgarten could play inincreasing supply liquidity.
Electricity
◗ Monitor and evaluate the performance of the full liberalisation, particularlythe way in which price reductions are spread across customer classes.
◗ Continue to lower system access charges.
◗ Maintain the independence of the electricity regulator.
◗ Consider the option of further unbundling, if account unbundling has notensured transparency, as well as the accurate reflection of costs in thepricing of the network services.
◗ Investigate the consolidation of the numerous distribution operators.
149
The Country Reports In-Depth Reviews: AUSTRIA
139-In-Depth Reviews 2/12/03 11:15 Page 149

◗ Pay special attention to the issue of market power, particularly the definitionof the relevant market in making any assessments.
Energy Research and Development◗ Further clarify the objectives the R&D programmes are designed to meet in
order to accomplish particular energy and environmental policy objectivesand allocate resources appropriately, based on the national goal ofexpanded R&D expenditures.
◗ Enhance monitoring of progress in reaching the energy-related R&D goalsAustria has established.
◗ Review energy R&D priorities in order to maximise the cost-effectiveness offinite government R&D expenditures in relation to mid- to long-term objectivesin the energy sector.
150
In-Depth Reviews: AUSTRIA The Country Reports
139-In-Depth Reviews 2/12/03 11:15 Page 150

HUNGARY
The aim of Hungary’s energy policy is to strike a balance between energysecurity, economic efficiency and environmental protection, in line with theIEA Shared Goals. In 1999, the “Hungarian Energy Policy Principles and theBusiness Model of the Energy Sector” (Resolution 2199/1999 VIII. 6) waspublished. This document promoted the following policy principles andobjectives:
● Creation of an efficient domestic energy market functioning as an integralpart of the single European energy market, but respecting national particularities,serving both economic competition and consumer protection.
● Preservation and augmentation of the security of energy supply.
● Enforcement of environmental protection requirements on both futuredevelopments and existing generating and energy-consuming plants.
● Improvement of public scrutiny and information, democratic control and,for the remaining monopolies, transparent price regulation.
Hungary continued its remarkable progress in energy market liberalisationsince the last in-depth review, creating the conditions for an electricity marketto develop on similar grounds as in other European countries, and paving theway for a natural gas market. A new Electric Power Act was passed inDecember 2001, introducing competition into the restructured power industryand making Hungarian legislation in this area compatible with EU directives.In 2003, the Hungarian electricity retail market will be partially opened tocompetition and then gradually fully opened by the time Hungary is admittedto the EU. A new gas law is being discussed and will probably be approved in2003. This law will pursue the liberalisation of the gas sector, with an initialopening of the gas market to 25% of gas consumption, creating a new gaspricing mechanism and discontinuing the practice of setting prices for gasproduced in Hungary. The government deserves full credit for its determinationto pursue reforms. While the strong driving force in energy policy has clearlybeen the need to conform to the acquis communautaire3 given the prospectof EU accession, it is also a step towards a more efficient energy system.
Despite these positive developments, Hungary faces a number of challenges.In the electricity sector, it needs to ensure that the state electricity generationand grid company (MVM) does not cause market distortions given its importance
151
3. The acquis communautaire is a term used to designate the current state of EU legislation andprocedures.
139-In-Depth Reviews 2/12/03 11:15 Page 151

in the market. In particular, existing long-term contracts of MVM should bemonitored, since the company has access to low cost nuclear facilities,influencing effective competition. The independent system operator (MAVIR)was established in 2002, but the ownership of transmission lines remains withMVM. MAVIR’s responsibilities need to be further strengthened. Capacity andtransmission constraints are also causes of concern. Hungary is likely toencounter capacity constraints around 2005 when some of the old coal-firedplants will be closed in line with EU environmental directives. There could alsobe severe congestion in the interconnection between the Slovak Republic andHungary. The government will need to monitor generation, transmission andinterconnection capacities.
Security of natural gas supply is vital for Hungary given the high share ofnatural gas in the energy mix. It is therefore commendable to strive to openthe Hungarian upstream market to increase indigenous gas production andfacilitate competition. Domestic production prospects could be limited,because of uncertainties concerning the regulation of the natural gas marketgiven the delayed implementation of the proposed Gas Act. The act should beadopted and implemented as quickly as possible. Limited gas-to-gascompetition due to the strong dominance of Russian gas, uncertain future gasdemand given uncertain electricity demand and the oligopolistic structure ofgas distribution companies are fundamental constraints to the developmentof strong and healthy competition in the Hungarian natural gas market. Theappropriate authorities, including the Hungarian Energy Office (MEH), shouldmonitor the development of the gas market, in particular the implication ofexisting take-or-pay (TOP) contracts, limited sources of supply and interactionwith stranded costs as market conditions develop.
While the new legislation has increased MEH’s independence, key pricingdecisions for non-eligible consumers are still a government responsibility.Despite recent efforts for prices better to reflect costs, a policy to keep energyprices low for certain categories of consumers for social reasons still exists.This policy has various harmful effects, such as discouraging energy savingand distorting fuel choices. Furthermore, low prices have discouragedinvestment by domestic energy firms such as MVM and the Hungarian oil andgas company (MOL) because the policy has caused financial losses andrendered economic viability of new investment uncertain. This could haveserious implications for energy security. The government should provide a cleartimetable with milestones for price increases to market levels for gas andelectricity. To avoid possible conflicts of interest, it should give fullresponsibility to the MEH, not only to calculate prices, but also to set them.
As in many other transition countries, Hungary’s energy policy has for a longtime focused on the expansion of energy supply, while paying little attentionto costs and economic efficiency. During the past decade, the governmentincreased its emphasis on the demand side, but its primary focus remains
152
In-Depth Reviews: HUNGARY The Country Reports
139-In-Depth Reviews 2/12/03 11:15 Page 152

largely on the supply side, i.e. securing supply, introducing competition in theenergy markets and diversifying energy sources. Weak emphasis on the energydemand side could be problematic in the future. Final energy consumption hasbeen quite stagnant in past years, largely because of economic restructuring,during which several energy-intensive industries shrunk and less energy-intensive industries emerged and grew. Economic restructuring is likely to slowdown, which will lead to growth in final energy consumption, following agradual increase of GDP per capita. In the future, some specific sectors of theHungarian economy will require more focus on increased energy efficiency, inparticular the building sector, small and medium-sized enterprises and thetransport sector.
Renewable energy potential, though limited, largely remains to be developedin Hungary. Significant near-term potential lies in bioenergy resources andrenewable municipal wastes for electricity and heat production, and ingeothermal energy for heat. However, current grants and funds without cleartechnology or market priority may eventually support technologies that havelittle economic relevance in Hungary. Similarly, the use of a single feed-in tarifffor electricity generated from renewable sources may end up supportingrelatively high-cost renewable energy options while generating rents for lower-cost options. The current policy framework for renewables will need to beimproved to better reflect cost-effectiveness.
RECOMMENDATIONS
The government of Hungary should:
General Energy Policy
◗ Establish an indicative timetable for price increases to market levels for gasand electricity for non-eligible consumers.
◗ Address social hardship through social policy measures, not through energyprices.
◗ Establish a timetable for handing price control responsibilities to the MEH.
◗ Ensure that the Directorate-General for Energy is adequately staffed and hassufficient resources to administer the energy market liberalisation process.
◗ Organise, in a transparent fashion, the contributions of the differentrepresentative bodies of consumers of the network industries (electricity, gas, district heating) to avoid any risk that certain groups of consumerswould have a favoured position in influencing government policy.
153
The Country Reports In-Depth Reviews: HUNGARY
139-In-Depth Reviews 2/12/03 11:15 Page 153

◗ Define a timetable to improve energy quality and reduce technical and non-technical losses.
◗ Devise indicators for monitoring the quality of energy supply (electricity,gas), in co-operation with all the energy stakeholders.
◗ Design and implement a system of improved measures (detection andsanctions or penalties) against electricity pilferage.
Energy Efficiency◗ Continue to strengthen the close co-ordination among all energy efficiency
plans involving national, European and international institutions to makeoptimal use of such expertise and funding.
◗ Provide the Energy Centre with an adequate budget, staff and executivepowers to allow it to fulfil its tasks at both national and international levels.
◗ Investigate through the MEH and the Hungarian Competition Office whetherheat prices are being set on a reasonable cost-reflective basis and, if not, deviseand implement an appropriate solution to avoid price distortions between heatand power that would negatively affect investment in and modernisation ofcombined heat and power (CHP) and district heating systems.
◗ Give priority to strengthening energy efficiency in the building sector throughthe implementation of EU regulations on energy efficiency standards in thehousehold sector, improve and enforce the mandatory thermal insulationstandards and strengthen the programme for retrofitting the energy-inefficient housing stock.
◗ Strengthen energy audits in industry (including small and medium-sizedenterprises), and measures to encourage the audited enterprises to implementrecommended cost-effective measures.
◗ Establish and implement a comprehensive long-term energy efficiencyTransport Plan with clear objectives supported by adequate cost-effectivemeasures and investments funded over the long term to limit the growth ofroad transport. Include measures to stimulate investment in public transport,on driver behaviour (car labelling for example) and on the diffusion ofcleaner fuels and low-emission vehicles.
◗ Strengthen the appropriate measures and capacities to carefully monitorand assess all the energy efficiency programmes and measures, and adjustthem according to the changing economic context.
Energy and the Environment◗ Establish a clear institutional framework for Joint Implementation (JI) projects
to facilitate access of foreign investors and minimise transaction costs.
154
In-Depth Reviews: HUNGARY The Country Reports
139-In-Depth Reviews 2/12/03 11:15 Page 154

Consider whether to use the existing emissions trading surplus under theKyoto Protocol to encourage early investment in JI projects.
◗ Consider broader participation in international emissions trading under theKyoto Protocol and how the government can improve Hungary’s environmentalperformance, e.g. through financing additional projects to reduce greenhousegas emissions.
◗ Define a timetable for joining an emissions trading regime.
◗ Maximise transparency on environmental issues to encourage publicacceptance.
◗ Continue to seek improvements in local pollutant emissions levels.
Renewable Energy
◗ Create a roadmap for renewable energy resource development, highlightingeconomic potential in priority technologies.
◗ Evaluate the added value of expanding technology co-operation through theIEA Implementing Agreements.
◗ Anticipate that the future level of support will gradually decline as viabletechnologies are identified and sustainable markets are developed.
◗ Work towards the introduction and development of market-oriented policyinstruments as the mainstream for cost-effective exploitation of renewables.
Fossil Fuels
Oil
◗ Make sure that the relevant competition authorities continue to monitorwhether oligopoly is developing in the regional market and if there is a needfor regulatory action.
◗ Consider reducing the price distortion created by the relatively high exciseduty on light fuel oil in order to diversify energy supplies for heating.
◗ Ensure the implementation of the law requiring that MOL submit the necessarydata for the reporting requirement under international commitments.
Gas
◗ Adopt the proposed Gas Act as soon as possible to implement a stableregulatory tax and pricing regime as a means to reduce uncertainties for allmarket participants, including domestic gas producers.
155
The Country Reports In-Depth Reviews: HUNGARY
139-In-Depth Reviews 2/12/03 11:15 Page 155

◗ Price all gas in the wholesale market on a market-related basis.
◗ If the government decides to impose an “excess profits tax” to capture, forthe public benefit, excess profits derived from gas production at facilitiesthat have been fully written down, ensure that such a tax only capturesgenuine “excess” profits.
◗ Continue to monitor the effects on competition of existing TOP contracts,limited sources of supply and interaction with stranded costs.
◗ Set up the conditions to facilitate the decision by MOL (or others) to installadditional gas storage facilities, keep this option under review in consultationwith the MEH and allow tariffs to reflect storage costs.
◗ Address the social consequences of bringing gas prices to market-relatedlevels through targeted social policy measures.
◗ Develop a contingency plan for possible supply disruption, to ensure thatappropriate co-ordinated emergency arrangements are put in place to avoidgas supply shortfalls, and for the safe reconnection of consumers in the eventof a gas supply shortfall.
Electricity and Nuclear
Electricity
◗ Give MAVIR more extensive responsibilities in the management and operationof the network and strengthen MAVIR’s responsibilities as an independentsystem operator.
◗ Ensure that balancing services provided by MAVIR are priced on a competitivebasis.
◗ Ensure that appropriate arrangements are made for MAVIR to monitor theadequacy of the transmission network cross-border interconnection capacity.
◗ Monitor the development of competition to avoid excess market power exertedby companies through long-term contracts.
◗ Address the problem of electricity pilferage.
◗ Review the arrangements for price caps as a means of price regulation, ensuringthat social objectives are pursued through means other than energy prices.
◗ Strengthen the MEH’s autonomy in regulating electricity.
Nuclear
◗ Take decisions on the nuclear waste disposal framework as soon as possible,consistent with a full safety assessment.
156
In-Depth Reviews: HUNGARY The Country Reports
139-In-Depth Reviews 2/12/03 11:15 Page 156

◗ Continue to ensure a high level of safety and maintain public confidence innuclear plant operations, by securing the independent position of theHungarian Atomic Energy Authority (HAEA) to regulate nuclear safety.
◗ Take the necessary steps to separate the management of the Public Agencyfor Radioactive Waste Management (PURAM) from HAEA in order to clarifythe relationship between the safety regulator and the licensee.
Research, Development and Demonstration◗ Design and implement a comprehensive energy RD&D strategy integrating
the existing fragmented programmes and clearly setting priorities.
◗ Consider joining IEA Implementing Agreements.
157
The Country Reports In-Depth Reviews: HUNGARY
139-In-Depth Reviews 2/12/03 11:15 Page 157

139-In-Depth Reviews 2/12/03 11:15 Page 158

IRELAND
Since the last IEA in-depth review four years ago, a number of importantdevelopments have taken place in the Irish energy sector. Ireland has initiatedreform of both the electricity and natural gas markets. While work remains tobe done in this process, considerable progress has already been achieved. Thebasic regulatory framework for both markets has been established and anindependent regulatory body has been put in place. In addition, in November2000, Ireland published the National Climate Change Strategy (NCCS),providing a blueprint for the country to meet its Kyoto greenhouse gas targets.The country has begun implementing the policies and measures containedtherein although much work remains to meet the challenging emissionstarget.
Concurrent with these two commendable developments has been a rapidincrease in energy demand resulting from an impressive level of economicgrowth. This high rate of energy demand growth has occasionally strained thecountry’s energy infrastructure and, while these constraints are generallybeing addressed, they increase concerns about the country’s overall energysecurity. These concerns are fuelled in part by the country’s lack of substantialdomestic energy resources and consequent high level of imports. In 2000,only 15% of the country’s energy came from indigenous sources. The country’srelative isolation and lack of extensive international energy connections alsoexacerbate Ireland’s vulnerability to supply disruptions and/or price spikes.
Market reform of the electricity sector began with the Electricity RegulationAct 1999 and was further advanced by the European Communities (InternalMarket in Electricity) Regulations 2000 (S.I. 445 of 2000). Much of theimpetus for this reform came from the need to comply with the EU directiveon the internal market rather than from any parties within Ireland. Currently,all customers with annual capacity greater than 1 GWh per annum are free tochoose their electricity supplier; this covers about 1 600 customers, or 40% ofthe market by volume. All customers, regardless of capacity, are free to sourcetheir power from a supplier who provides electricity from renewable sources orcombined heat and power plants. Ireland envisions 100% market opening by2005. The Commission for Energy Regulation (CER), a legally independentregulator, was established with a mandate to oversee important aspects of themarket reform process. In addition, a transmission system operator has beenestablished to operate and administer the country’s high-voltage transmissionlines. Any eligible party may gain non-discriminatory access to these lines atcost-based rates determined by the CER.
These developments are commendable and the reform process is certainlyheaded in the right direction. Nevertheless, a number of obstacles remain
159
139-In-Depth Reviews 2/12/03 11:15 Page 159

before Ireland can fully benefit from reform of the electricity sector. One majorproblem has been the lack of interest in the Irish market from viable,committed new entrants. While this absence can be ascribed in part to thepoor global investment climate in the private power sector, much of it isrelated to the particular characteristics of the Irish market. For one thing, theIrish market is the smallest in the EU (excepting Luxembourg), making it lessattractive for entry. While Ireland cannot, of course, arbitrarily increase the sizeof its market, it can effectively do so by augmenting connections with othermarkets, primarily Northern Ireland and, perhaps, Wales. Another perceivedimpediment to new entrants is the still dominant role played by theincumbent utility, the Electricity Supply Board. With regard to the company’svertical integration, ESB has assets and operations in the generation anddistribution market segments, subsidiaries which sell to both regulated andunregulated end-users, and ownership of the country’s national transmissiongrid. In addition, it appears that ESB still has some power to influencetransmission system planning. The current arrangement for separation of gridoperation and ownership should be carefully monitored. In terms of horizontalmarket concentration, ESB currently owns between 85 and 90% of the totalnational generating capacity. ESB has stated its commitment to reduce thispercentage to 60% by 2005 but no obligation to do so exists and, in anyevent, such a large market share would still give the company market powerto influence prices to its benefit. The government needs to review ESB’s role inthe liberalised electricity sector to address the impression that the companycould unfairly influence the market to the disadvantage of new entrantcompetitors. In general, the government is encouraged to explicate moreclearly its vision for the ultimate shape of the reformed electricity sector, aslingering uncertainty over the final shape of rules and regulations is alsodeterring new entrant competitors.
While continued improvement of the structure and regulations for a successfullong-term market reform will continue to be important, the most pressing matteris the expected need for new electricity generating capacity in the short term.Since investment in a new generating plant by independent companies has beenbelow expectations, the country could face a generation shortfall in 2005, oreven possibly in 2004. Given the long lead times for developing and buildinglarge power stations, it is unlikely that a fully independent power plant will beon line in time to address this coming need. As a result, the government musttake steps to encourage the required capacity to enter the market in time. It cando so by means of a capacity inducement such as a short-term or partial off-takecontract. Such inducements would ideally bring a non-ESB plant to the marketat a minimal cost to consumers without impeding the long-term development ofa reformed, competitive electricity sector. As a concurrent development, demand-side management of electricity would reduce the need for new capacity.
Reform of the natural gas sector is also moving in the right direction. As of 1 January 2003, all customers with an annual demand greater than
160
In-Depth Reviews: IRELAND The Country Reports
139-In-Depth Reviews 2/12/03 11:15 Page 160
500 000 standard cubic metres were free to choose their own gas supplier.This covers about 250 of the largest gas customers in Ireland, accounting forover 85% of the market by volume. The mandate of the legally independentelectricity regulator has been expanded to include jurisdiction over gas marketreform. In addition, regulated third-party access to the incumbent’s transportationgrid is guaranteed for all eligible customers.
These developments have been too recent to draw any meaningfulconclusions regarding the success of the reform effort in the gas sector. Whilesome of the largest customers are engaging in self-shipping, it remains to beseen whether the small or even mid-size customers will switch suppliers ornegotiate lower rates with the incumbent. There have, however, been somepositive signs that competition is developing. The production from a newdomestic gas field has been sold to a new entrant who will use this gas tocompete in the Irish market, and another domestic gas field is scheduled tocome on-line in 2005, creating further possibilities for competition. Despitethese desirable developments, Ireland’s finite supply sources (gas from theUnited Kingdom and a limited number of domestic sources) make it unlikelythat upstream competition could really give a substantial choice to eligiblecustomers. Nonetheless, this limited upstream and retail competition shouldbe beneficial and Ireland is encouraged to proceed with its reform efforts.
Passage of the country’s National Climate Change Strategy (NCCS) inNovember 2000 was an important step towards addressing the country’sclimate change challenges. Under the EU burden-sharing arrangement in theKyoto Protocol (ratified by the Irish Parliament in May 2002), Ireland mustlimit the net increase of its greenhouse gas (GHG) emissions to 13% above1990 levels by the target period 2008-2012. As of year-end 2000, GHGemissions had already grown to 24% above 1990 levels and are believed tohave grown since that time. Government projections show a 37.3% rise from1990 levels by 2010 under a business-as-usual scenario.
The NCCS was designed as part of a consultative process with government,the private sector and consumer groups, and covers a wide range of emissions-producing sectors. Despite these important consultations, the lack of acomparative analysis of the cost-effectiveness of the different measures in thevarious sectors has made it unclear what the total costs of these measureswould be or even if the least-cost measures are being pursued. One relatedproblem is that no full projection of the economy and expected emissionsreductions has been made that takes into account all the measures proposedin the NCCS. This should be done as soon as possible. The challenge ofmeeting the emissions target with domestic means alone makes it likely thatKyoto flexible mechanisms [emissions trading, Joint Implementation (JI) andClean Development Mechanism (CDM)] will be needed to reach the country’starget. While such mechanisms are discussed in the NCCS as important toolsin reducing emissions, their integration into the overall climate change strategy
161
The Country Reports In-Depth Reviews: IRELAND
139-In-Depth Reviews 2/12/03 11:15 Page 161

is unclear. The manner and extent to which such international approaches toclimate change will be used should be made more explicit, particularly asexperience is gained.
The largest single measure proposed in the NCCS is to either shut down orfuel-switch the coal-fired Moneypoint power generating station. This onemeasure would account for 22% of the total GHG emissions reductionsexpected from NCCS proposals. It is not yet clear whether this measure will infact be enacted, but the government is encouraged to make a decision on thismatter as soon as possible. Not only will closure of the plant require theconstruction of substantial electricity generating capacity to replaceMoneypoint, but if this and other fuel-switching measures in the NCCS areenacted, Ireland could use natural gas to generate up to 80% of all itselectricity by 2010. Such a potential heavy reliance on gas raises energysecurity concerns that will require time to address.
A number of recent developments are impacting on Ireland’s energy security.Continued uncertainty surrounding the reform of the electricity sector hasdeterred investment in power generation, and, as mentioned above, a push toeliminate coal-fired generation out of concern for GHG emissions may producea power sector fuelled 80% by natural gas. In addition, recent economicgrowth has produced a rapid rise in energy demand which, in turn, has placedstrains on the existing infrastructure. These developments, coupled with thecountry’s modest fossil fuel reserves and relative isolation, raise legitimateenergy security concerns that the country should continue to address.
The construction and commissioning of a new subsea natural gas pipelinefrom the UK shows not only the ways in which energy security can beenhanced but also the costs involved with such measures. Faced with anexpected increase in gas demand by winter 2002, the government conducteda vigorous examination of the various options and decided to approveconstruction of a second subsea pipeline linking Irish demand centres with gassupply from the UK. While the added capacity of this second pipeline does infact guarantee that there will be sufficient gas import capacity from the UK,the timing of the project appears to be premature. Gas demand has not risenas expected and the new pipeline is not likely to be required until 2005.However, the cost of the as yet unneeded second subsea pipeline(approximately €300 million) must be recovered now and is currently beingborne by Irish gas consumers. This example shows that while there are in facta number of ways to address energy security concerns, all the availableoptions and their related costs must be considered carefully before beingenacted.
While renewable energy does not currently make a substantial contribution tothe country’s energy mix, there is large potential, particularly in the form ofwind power. Wind power is attractive since it provides emissions-free, domestically-
162
In-Depth Reviews: IRELAND The Country Reports
139-In-Depth Reviews 2/12/03 11:15 Page 162

sourced power, thereby addressing the country’s climate change and energysecurity concerns. Ireland has taken steps to encourage renewables use,primarily through an auction process which offers long-term power purchaseagreements to buy electricity from renewable sources. The country shouldfacilitate the increased penetration of wind into the electricity system byexamining the issues of system frequency stabilisation and back-up power thatarise with substantial wind power use. The country should also ensure that allsupport schemes for renewables are market-based and include properincentives to reduce costs.
Coal and peat play an important role in the country’s energy mix. Together,they account for over 18% of the country’s total primary energy supply (TPES),and over 36% of the country’s electricity generation. While all coal isimported, its supply is considered very secure and hence, along withdomestically-sourced peat, it can contribute to the country’s energy security.Both fuels, however, have the disadvantage of high carbon content withcorrespondingly high CO2 emissions. The role of these fuels in Ireland’s energymix must strike a proper balance between energy security and GHG emissionsmitigation. Although greatly reduced in recent years, peat production is stillsupported by a subsidy ultimately borne by the consumer. The governmentshould strive to achieve the most efficient level of peat production possible inorder to minimise the level of subsidy.
Ireland has improved it energy efficiency dramatically over the last ten yearswith energy intensity falling by one-third from 1989 to 2000. This improvementwas achieved by both government action and a shift in economic activityaway from energy-intensive sectors. Efficiency improvements appear poised tocontinue with a variety of government programmes and initiatives already inplace. Historically, Ireland had very low levels of combined heat and power(CHP) usage, but the government is now trying to encourage its use toimprove overall efficiency. Transport, however, may provide the bestopportunity to improve energy intensity, since an increase in energy use in thissector coincides with the need for a new transportation infrastructure. Thus,the new infrastructure can and should be designed in a way to minimiseenergy use and resulting emissions.
Ireland is taking a more proactive role in energy R&D than in the past. It hasallocated €60 million4 to this area for the 2001-2006 time period. Despitethis commendable increase of resources, national expenditures remain modestby total EU standards. As a result, Ireland would be well served by an activeparticipation in energy R&D activities at the international level, includingparticipation in EU and IEA programmes. In addition, Ireland should try toinvolve the private sector in its R&D activities in order to leverage limitedpublic sector funds and build capacity for R&D within private companies.
163
The Country Reports In-Depth Reviews: IRELAND
4. On average in 2002, €1 = US$ 0.943.
139-In-Depth Reviews 2/12/03 11:15 Page 163

RECOMMENDATIONSThe government of Ireland should:
Energy Market and Energy Policy◗ Develop a long-term strategy for optimal energy supply mix striking an
appropriate balance between energy security and climate change mitigation,noting a rapidly growing share of natural gas in the electricity sector.
◗ Promote international integration in electricity and gas to enhance energysecurity and competition, and facilitate integration with the single EU market.
◗ Continue to undertake energy supply-demand and CO2 emissions projections,noting rapid growth in energy consumption and CO2 emissions.
◗ Pursue social objectives by means other than energy policies, prices andtaxation.
Energy and the Environment◗ Undertake energy and emissions projection and analyses which include the
National Climate Change Strategy (NCCS) policies and measures.
◗ Monitor and evaluate the cost-effectiveness of policies and measures in theNCCS and update it as required to achieve the Kyoto targets in the most cost-effective manner.
◗ Ensure that greenhouse gas mitigation measures cover all energy and non-energy sectors and reflect externalities for each source.
◗ Clarify the use and role of CO2 taxation, emissions trading, Clean DevelopmentMechanism (CDM) and Joint Implementation (JI) in the NCCS.
◗ Develop, with close co-operation among relevant departments, an effectiveframework for negotiated agreements and appropriate monitoring/reportingmechanisms based on experiences gained from pilot agreements.
◗ For the industrial and power generation sectors, clarify the interrelationamongst negotiated agreements, greenhouse gas taxation and emissionstrading, especially in light of the proposed EC directive on emissions trading.
Energy Efficiency◗ Evaluate existing energy efficiency programmes with the aim of strengthening
efforts to improve energy efficiency in a cost-effective manner.
◗ Expand the cost-effective use of pricing and mandatory regulations to promoteenergy efficiency, for example in the transport sector.
164
In-Depth Reviews: IRELAND The Country Reports
139-In-Depth Reviews 2/12/03 11:15 Page 164

◗ Continue to explore cost-effective mechanisms to promote combined heatand power (CHP).
◗ Enhance the public transport infrastructure in co-ordination with demandmanagement measures to curb energy consumption and CO2 emissions fromthe transport sector with close co-operation among the relevant departments.
◗ Explore measures to promote efficient low-CO2 vehicles, particularly in thepublic transport sector.
Natural Gas and Oil
◗ Ensure that the regulatory framework facilitates continued monitoring ofdevelopments in the natural gas market and, where results do not lead toeffective market opening and corresponding competition in the market, workout and adopt the necessary procedures to ameliorate the situation.
◗ Ensure continued adequate transmission capacity and non-discriminatorythird-party access to the transmission grid.
◗ Develop a security of supply policy by defining minimum objectives andresponsibilities of sector participants while allowing individual players themeans to achieve these objectives. The costs of implementing all security ofsupply measures must be weighed against benefits.
◗ Continue to engage in international co-operation, including through the IEA,the Energy Charter, the EU, and the International Energy Forum (IEF), tosupport regional security of gas supply.
◗ Undertake efforts to streamline and shorten planning procedures for domesticexploration and production, including ensuring that the affected regionsunderstand the value of production to the country and to their community.
◗ Review taxation of automotive fuels in light of fuel tourism and the consequentimpact on GHG emissions.
Electricity
◗ Decide as a matter of urgency how best to ensure the construction of newgenerating capacity to meet the imminent supply shortfall. Ensure that thisnext increment of capacity is owned and operated by an independent powerproducer (IPP) to facilitate market competition.
◗ Continue process of strengthening the transmission grid, including aroundthe north-south interconnection.
◗ Develop as a priority a clear vision for the overall market design and structure,with a firm implementation timetable to provide market certainty andencourage investment in new generating capacity.
165
The Country Reports In-Depth Reviews: IRELAND
139-In-Depth Reviews 2/12/03 11:15 Page 165

• Monitor and amend if necessary the current arrangements for separationof the operation and ownership of the grid to ensure that the objectivesof an efficient and secure grid continue to be met.
• Work towards a clear and coherent set of long-term market rules fortrading, including providing for transparent, non-discriminatory market-clearing wholesale prices.
• Consider a means of dispersing control of ESB generation amongcompeting companies, particularly for mid-merit (i.e. price setting) plant.Alternatives for break-up include privatisation, setting up competing state-owned companies (with independent commercial boards), or leasing orauctioning off management rights to individual plants.
◗ Take an early decision on whether the East-West interconnector will beconstructed, taking into account supply security and competition concerns,in order to facilitate decisions on market structure and to provide marketcertainty, especially for new investors.
◗ Continue efforts to develop an all-island electricity market, including byincreasing the usable capacity of the North-South interconnector, in theinterests of security of supply and competition.
◗ Develop a clear policy on security of fuel supplies for electricity generation,including through diversity of fuels, generation technologies and dual-fuelling, to avoid over-dependence on imported gas in the long term.
Renewable Energy◗ Develop a strategy to facilitate the increased penetration of wind power and
other renewables into the national electricity market, taking into accountback-up requirements.
◗ Ensure that any support schemes for renewables are market-based andincorporate proper incentives for further cost reduction.
◗ Continue to explore the potential for development of offshore wind parks,while taking into account the additional cost factors involved with gridinterconnection.
Coal and Peat◗ Evaluate the role of coal in the energy mix, striking a balance between energy
security and greenhouse gas mitigation.
◗ Identify the impact on greenhouse gas emissions of the full cycle of peatproduction and use.
◗ Ensure that Bord na Mona (BNM - the state-owned peat company) continuesto improve peat production efficiency in order to reduce peat subsidies andthe distortive effect this has on the market.
166
In-Depth Reviews: IRELAND The Country Reports
139-In-Depth Reviews 2/12/03 11:15 Page 166

◗ Keep under review the role of peat in the energy supply mix taking intoaccount its contribution to energy security, impacts on the electricity marketand greenhouse gas emissions.
Energy R&D◗ Prioritise activities on a limited number of projects and concentrate resources
on them with a view to meeting national energy policy objectives.
◗ Engage in active participation in R&D activities on the international level,including participation in EU and IEA programmes.
◗ Stimulate co-operation between the public and private sector in R&D areassuch as demonstration projects in the transport sector.
167
The Country Reports In-Depth Reviews: IRELAND
139-In-Depth Reviews 2/12/03 11:15 Page 167

139-In-Depth Reviews 2/12/03 11:15 Page 168

ITALY
Italy’s energy policy is currently driven by market liberalisation, transfer ofrelevant political and administrative decision-making powers to the regionalauthorities, diversification of supply sources, energy security, efficiencyimprovements and environmental protection.
Since the last IEA in-depth review, Italy has made significant progress inimplementing electricity and gas market reforms and in restructuring its energyindustry. The European Commission directives for electricity and gas marketliberalisation have been transposed into legislation. Large state-owned energycompanies began to be privatised and the government reduced its shares inboth ENEL (electricity) and Eni (oil and gas). New institutions, including anenergy sector regulator, are now fully operational, which will ensure a muchmore market-oriented energy economy, in line with the IEA Shared Goals. Italyratified the Kyoto Protocol in June 2002 and on 19 December 2002, releasedthe first national action plan for the reduction of greenhouse gas (GHG)emissions, the Revised Guidelines for National Policies and Measures Regardingthe Reduction of Greenhouse Gas Emissions.
In Italy, as in other IEA member countries, the simultaneous achievement ofenergy security, market liberalisation and climate change mitigation is noteasy given the sometimes contradictory nature of these objectives.Diversification of energy sources is particularly challenging in this respect.Italy’s energy mix is shifting from oil to more use of gas, with little probabilityof rapidly diversifying much further owing to the limited growth of renewableenergy, local resistance to coal and the fact that the nuclear option wasabandoned in 1987. Significant reliance on oil and gas, including from externalsupply sources, raises concerns about security of supply and the risk of highenergy costs.
Timely investment in energy production, transportation and interconnection isessential to secure energy supply and more active competition. Italy’s highlevel of local resistance to new infrastructure is becoming increasingly seriousin the context of the transfer of power to local authorities. Uncertaintiesregarding responsibilities for clearing new energy projects and complexity inthe authorisation procedures are consequences of the legal changes initiatedto enable decentralisation. From April 2002, the government introduced a fasttrack procedure for new electricity generating plants (Sblocca Centrali),thereby streamlining the decision-making process.
Despite Italy’s target to reduce GHG emissions by 6.5% between 1990 and2008-12, energy related CO2 emissions have been constantly growing and in2000 were already 6.5% above the 1990 level. Italy’s carbon intensity measured
169
139-In-Depth Reviews 2/12/03 11:15 Page 169

as CO2 emissions per unit of gross domestic product (GDP) is relatively low,owing to high energy prices, a low energy-intensive industry structure and amild climate. Lower energy prices resulting from market liberalisation andgrowing energy demand in the transport sector could erode this advance. Italyfaces the challenge to define coal’s role in the electricity sector, striking abalance between climate change mitigation, energy security and the urgentneed to reduce power generation costs. The domestic measures considered inthe scenarios of the Inter-Ministerial Committee for Economic Planning (CIPE)deliberation of 19 December 2002, together with the full utilisation of sinksand the Kyoto flexible mechanisms will allow Italy to achieve its GHGemissions reduction target, provided the corresponding projects and fundingare clarified and implemented without delay.
Italy’s energy intensity measured as total primary energy supply (TPES) perunit of GDP remains low. This is commendable, but it is imperative to identifyto what extent it has been achieved as a result of effective energy efficiencypolicy efforts or because of structural changes induced by the economicenvironment and high electricity prices in Italy, and to ensure that all possiblemeasures are implemented to maintain Italy’s advance. In 2001, in additionto the existing efficiency standards, the government introduced and definedfor each year up to 2006, tradable energy saving obligations to be applied toboth electricity and natural gas distributors. Details still need to be finalisedbefore this new scheme becomes fully operational.
Italy is moving away from using fixed feed-in tariffs for renewable energy to amore market-oriented minimum quota obligation scheme with tradable greencertificates. This should increase the amount of renewable energy in a countrywhere, despite its significant potential, renewable energy represented only5.4% of TPES in 2000. While this is a positive step in promoting renewableenergy in a compatible manner with market liberalisation, several challengesand uncertainties need to be addressed to secure its effectiveness. Thegovernment’s intention to monitor this new mechanism is wise.
Italy is highly dependent on external sources for its oil supply. It does have thepotential to increase its domestic oil production; however, demand far exceedspotential supply. The complex administrative procedure required to conductexploration and production investments has led to delays and additional costs forthe expansion of domestic production. Italy has an important role as arefining centre, the first in Europe, selling a large part of its products to othercountries in Europe. The oil market is free and the government is to becommended for its continued efforts to stimulate competition in the markets.After several years’ non-compliance with the International Energy Program(IEP) obligation to hold sufficient strategic oil stocks, the government iscorrecting the situation. Italy has been satisfying the obligation of 90-day netimports equivalent in stocks during the first half of 2003. It now has to ensurea continuous compliance.
170
In-Depth Reviews: ITALY The Country Reports
139-In-Depth Reviews 2/12/03 11:15 Page 170

The Italian gas market has developed rapidly, mainly because of the increaseduse of gas in power generation. Given that this additional gas must beimported, diversification of gas supplies has been an important policyobjective. Italy’s potential as a growing gas market is huge. The reform of thegas market is moving in the right direction. The 2000 Italian decreeimplementing the European Commission (EC) directive on the single market fornatural gas goes far beyond the minimum requirements established by the ECgas directive. The Energy Authority (Autorità per l’Energia Elettrica e il Gas,AEEG) has compiled rules for market opening and established tariffs fortransportation, regasification, storage and distribution. The Energy Authoritypromotes the development of gas trading hubs. This development wouldprovide Italy with the opportunity to improve security of supply and the optionto become a key trading centre for the Mediterranean region. From a legalviewpoint, the Italian market is now fully opened; however, Eni remains in adominant position and barriers still exist for new entrants. Access to externalsupply is difficult for small companies unlike large or international companies.Saturation of the existing import pipelines creates an additional entry barrier.Only competitors with capacities to establish their own import facilities, suchas liquefied natural gas (LNG) terminals, will be able to compete on an equalbasis with Eni. The government needs to encourage investment in LNGterminals and cross-border gas pipelines delivering gas to Italy to secure successof gas market liberalisation and security of supply. Given the potential fordomestic gas extraction and the current decline in domestic production, thenational strategy for gas exploration and production needs to be intensified.However, local authorities strongly oppose the realisation of this objective.
Since the 1999 in-depth review, Italy has continued to liberalise the electricitymarket. ENEL was partially privatised and part of its generating capacity wasdivested to reduce its share in electricity supply to less than 50%, whichenabled new participants to enter the market. In May 2003, the retailelectricity market was liberalised up to 50%, with full liberalisation plannedfor 2007. Production and importation activities were fully liberalised from thebeginning of the reform process in 1999. Transmission networks were legallyunbundled and a transmission system operator (TSO) was established. Amarket operator was created to facilitate the development of the wholesaleelectricity market. These arrangements have led to Italy being considered oneof the EU countries with the most rigorous conditions for network unbundling.Despite recent progress, current developments in the generating capacity mayhinder the achievement of public objectives, such as electricity mixdiversification, unit production cost reduction and sufficient electricity supply.This could occur either because the investment plans do not materialise,making it difficult to secure sufficient supply at a lower unit cost, or becausethey increase the dependency of an even larger portion of the generatingcapacity on natural gas. While the market is developing with new participants,there are still challenges to avoid abuse of dominant position by theincumbent.
171
The Country Reports In-Depth Reviews: ITALY
139-In-Depth Reviews 2/12/03 11:15 Page 171
It is commendable that in 2000 the government, largely in line with theconclusions of the 1998 National Conference on Environment and Energy,shaped a new energy R&D policy under the National Research Programme.This resulted in new research priorities and focus on the public R&D budgetand prepared the way for a reform of the National Agency for NewTechnology, Energy and Environment (ENEA).
RECOMMENDATIONS
The government of Italy should:
General Energy Policy
◗ Strengthen the national energy strategy on the basis of energy supply anddemand scenarios, integrating in a balanced and consistent way the mainpolicy objectives, namely security of supply, reform of the gas and electricitymarkets and climate change mitigation.
◗ Enhance the visibility of the national energy strategy and the disseminationof energy information on the national energy situation and future challengesto the general public.
◗ Co-ordinate with the Ministry of Productive Activities the actions of relevantministries in the implementation of energy policy.
◗ Put more emphasis on achieving energy diversification, especially in theelectricity sector in order to improve security of supply and reduce electricitygeneration cost.
◗ Clarify the respective roles and competences of the regional authorities andthe government in implementing energy policy. Encourage the regionalauthorities to develop regional energy plans consistent with the nationalenergy strategy.
◗ Keep the necessary tools to guarantee that investments needed in energyproduction, transportation and particularly interconnections with Europeanand world markets are achieved in a timely manner and are not subjected toexcessive bureaucratic procedural delays.
◗ Continue the liberalisation of the electricity and gas markets. Ensure thatnewcomers compete on a fair and equal basis with the gas and electricityincumbents. Evaluate the progress of the liberalisation process throughbenchmarking.
◗ Confirm the independence of the Energy Authority.
172
In-Depth Reviews: ITALY The Country Reports
139-In-Depth Reviews 2/12/03 11:15 Page 172

◗ Increase transparency of information on the energy market by circulatingnon-confidential market information to all energy stakeholders.
Energy and the Environment
◗ Implement the national action plan to reduce GHG emissions with least costmeasures in order to fill the remaining gap to achieve the Kyoto target.Monitor the progress in reaching this target. Strengthen co-ordinated effortsfor CO2 emissions mitigation.
◗ Reassess the contribution of voluntary agreements (VAs) to emissions reduction,taking into account the forthcoming EU emissions trading system.
◗ Monitor and analyse the effects on emissions of the planned increase in coaluse for electricity generation, the changes in carbon tax design/structureand the projected end-use energy price changes.
◗ Strengthen the strategy to disseminate energy efficiency technologies andmeasures to small and medium-sized enterprises.
Energy Efficiency
◗ Monitor and evaluate the impact and cost-effectiveness of existing and newenergy efficiency policies with a view to maintaining low energy intensity inthe changing energy market environment.
◗ Promote effective co-ordination between the regional authorities and thegovernment in all areas of energy efficiency. Facilitate sharing of bestpractices among the regional authorities and the government throughinformation dissemination by ENEA.
◗ Integrate energy efficiency objectives in pursuing the transport policy, inareas such as modal shift and transport infrastructure development, throughenhanced co-ordination among relevant ministries (energy, environment,finance and transport).
◗ Accelerate the elimination of old vehicles and promote more efficient low-emission vehicles, in particular trucks, buses and two-wheelers throughregulatory (e.g. periodic inspection) and economic measures (e.g. taxincentives, review of tax exemptions on fuel for commercial transport).
◗ Decrease the share of individual road transport in urban areas throughefforts to boost the quantity and quality of collective transport.
◗ Finalise details of, and implement, the energy efficiency certificate as soon as possible, and review it periodically. Publish information on the results and impacts of the scheme as early as possible to keep energy policy
173
The Country Reports In-Depth Reviews: ITALY
139-In-Depth Reviews 2/12/03 11:15 Page 173

stakeholders, both inside and outside Italy, informed about the unfolding ofthis policy experiment.
◗ Actively participate in co-operation at EU level in setting efficiency performancerequirements for energy labelling and energy performance standards forappliances, equipment and buildings.
Renewable Energy
◗ Increase the share of renewable energy in domestic production to improveenergy security and CO2 mitigation. Increase the renewable energy obligationabove the current level.
◗ Facilitate access to the capital market for renewable energy projects andgreen certificates that will eventually increase the profitability of renewableenergy projects.
◗ Streamline authorisation procedures for setting up renewable energy projects.
◗ Ensure an effective and balanced contribution from all the regional authoritiesto achieve the national renewable energy target, particularly with regard toinforming the general public about the possible use of renewables and accessto stimulation programmes.
◗ Ensure that ENEA provides sufficient information and expertise to the regionalauthorities and the general public about funding possibilities and supportmechanisms.
Oil
◗ Given the potential for extraction of domestic oil resources and the currentdecline in domestic production, enhance and improve the national strategyfor oil exploration and production.
◗ Given the ongoing devolution process of power and the security of supplyconstraints, ensure that the granting of upstream licences for explorationand production does not meet unnecessary obstacles.
◗ Continue to engage in international co-operation with producing and transitingcountries through different global and regional forums to reinforce securityof supply.
◗ Considering the importance of the IEA emergency preparedness mechanism,ensure that the recent improvements to meet the 90-day IEA stock obligationare sufficient to guarantee permanent compliance.
174
In-Depth Reviews: ITALY The Country Reports
139-In-Depth Reviews 2/12/03 11:15 Page 174

Natural Gas
◗ Continue the unbundling of the transportation and supply businesses toensure equality of treatment.
◗ Proceed with gas market liberalisation by defining rapidly clear rules, especiallyfor access to storage (Storage Code), LNG terminals (LNG Code) and distribution(Distribution Code).
◗ Encourage the development of the virtual gas hub (National Balancing Point)to facilitate the exchange of gas between shippers and to foster competition.
◗ Enforce a strict regulatory control to prevent abuse of a dominant marketposition. Preserve the independence of the Energy Authority and streamlinethe decision process inside the Energy Authority to ensure that it producesthe missing codes in the shortest possible time.
◗ Continue to encourage geographical diversification of gas supply.
◗ In the new framework of market liberalisation, update and develop a policyof gas supply security, defining minimum criteria and the responsibilities ofindividual players.
◗ Given the potential for extraction of domestic gas resources and the currentdecline in domestic production, enhance and improve the national strategyfor gas exploration and production.
◗ As a prerequisite for the success of gas market liberalisation and security ofsupply, encourage investments in LNG terminals and cross-border gas pipelinesdelivering gas to Italy. Streamline authorisation procedures for LNG terminalsand pipelines. Encourage investments in storage by providing the appropriatetariff incentives.
◗ Assess the costs and benefits of the strategic storage reserve obligation forshippers importing from non-EU countries and consider if the portfolio offlexible tools could be expanded to allow the same level of security of supplyat a lower cost.
Electricity
◗ Consider the possibility of reopening a public debate on the nuclear energyoption in light of current and future energy policy challenges.
◗ Monitor and publish regularly information on the electricity sector reservemargin and consider additional investment incentives to avoid blackouts inthe coming years. Expand the role of the transmission system operator(GRTN) and of the Energy Authority to support the government in thisrespect.
175
The Country Reports In-Depth Reviews: ITALY
139-In-Depth Reviews 2/12/03 11:15 Page 175

◗ Analyse options to provide incentives in the transmission and distributiontariff to ensure investment in new transmission capacity.
◗ Further streamline authorisation procedures for building electricity infrastructure.
◗ Expand interconnection for electricity imports.
◗ Encourage dissemination of information to local authorities and communitieson electricity projects.
◗ Continue the electricity market liberalisation process, enforcing strict regulatorycontrol to prevent abuse of dominant market position and maintaining theindependence of the Energy Authority.
◗ Enable the power exchange to begin its operations as rapidly as possible,facilitate measures that aim to increase its liquidity and create a surveillancestructure to avoid abuse of market power.
◗ Ensure independence of the power exchange (GME) and the single buyer(AU) from the transmission system operator (GRTN) and monitor the latter’smarket power once it has been privatised and GME and AU are fullyoperational.
◗ Organise the sales of ENEL’s transmission assets to GRTN.
◗ Increase international co-operation in the decommissioning of nuclear powerplants.
Research, Development and Demonstration◗ Continue to provide sustainable budgetary support to energy research and
development (R&D).
◗ Consider making clear priorities in public R&D. Provide special attention toclean coal technology and the improved efficiency of coal combustion.
◗ Improve the co-ordination of research and development projects and thedissemination of their results to the regional authorities.
◗ Urge ENEA to join the IEA Implementing Agreements on solar concentration.
176
In-Depth Reviews: ITALY The Country Reports
139-In-Depth Reviews 2/12/03 11:15 Page 176
JAPAN
Since the last in-depth review in 1999, the major developments in Japan’s energypolicy have been partial liberalisation of the electricity market, new steps in gasmarket liberalisation, the ratification of the Kyoto Protocol and development ofan enhanced policy package to achieve the Kyoto target. However, balancing the “3 Es” (energy security, economic development and environmental sustainability)remains a challenge.
The most recent Long-Term Energy Supply and Demand Outlook up to 2010, whichforms the basis for the government’s policy package to achieve the “3 Es”, waspublished in 2001. It is important that Japan continues to update it with sensitivityanalyses as the first Kyoto commitment period approaches. The timeframe beyond2010 could also be considered in the next review of the Outlook.
ENERGY SECURITY
Japan is making great efforts to ensure security of supply by diversifying itsenergy mix away from oil. Furthermore, oil stocks exceed the IEA stockholdingobligation, many flexibility tools (such as supply diversity and possibilities forfuel-switching) are used for natural gas, and policies to promote nuclear powerand renewables help towards diversification. However, growing oil importdependence from a single area is still a concern. Japan is also encountering newissues of energy security. The disruption in gas supply from Arun (Indonesia)shows a potential security threat as the share of gas is increasing in the fuel mix.The outage of TEPCO nuclear plants is another example. In addition, sharpeningsummer peak demand for electricity may cause a risk in matching demand andsupply. Energy security issues are more critical in Japan than in most IEAcountries owing to its isolated location and limited domestic energy resources.
ENVIRONMENT
In June 2002, Japan ratified the Kyoto Protocol with a commitment to achievea 6% greenhouse gas emissions reduction from 1990 levels by 2008-2012.This is a challenging target since in 1999, emissions were 6.8% above thetarget year levels. The path towards the target has been laid down by thegovernment in the “New Guideline for Measures to Prevent Global Warming”of March 2002.
Japan’s CO2 emissions per capita and per unit of GDP are good compared withthe IEA average and the country has developed an impressive range of policiesto address its rising CO2 emissions from the energy sector. These include the
177
139-In-Depth Reviews 2/12/03 11:15 Page 177

innovative Top-Runner Programme to encourage manufacturers to developmore efficient technologies, energy efficiency labelling, new technologies (e.g.the Home and Business Energy Management Systems), voluntary energyperformance standards for buildings and portfolio standards for renewableenergies. However, some of the measures could be strengthened with energyefficiency labelling extended to a wider range of appliances and energyperformance standards made mandatory for new buildings and extended torefurbishment of existing buildings. One of the key measures is Keidanren’s(Japan Business Federation) Voluntary Action Plan for stabilising industry’semissions by 2010. A major question will be whether the objective will be metif industrial output recovers from the current recession. Nuclear power isimportant to the country’s climate change policy but its increased usedepends on several issues which are discussed below. The recently introducedtax on coal, liquefied natural gas (LNG) and liquefied petroleum gas (LPG),albeit not targeted to lower CO2 emissions and relatively modest, corrects theheavy focus on oil taxes while coal and gas imports have been untaxed up tonow. Since the marginal cost of emissions reduction by domestic means isincreasing, the participation of industry in international emissions trading andother Kyoto mechanisms would be welcome, as it may give access to thecheapest mitigation options available in Kyoto Protocol Parties.
Nuclear power has a central role in Japanese energy policy both in terms ofsecurity of supply and climate change mitigation. Nuclear power is alsobroadly competitive with other electricity generation forms in Japan. Thegovernment’s target is to increase nuclear generation by 30% (equivalent to10-13 new nuclear plants) between 2000 and 2010. This target, however, hasbecome more difficult to reach because of safety-related incidents in recentyears, undermining public confidence and jeopardising energy security aftersignificant plant outages. The first challenge is to restore public confidence.Secondly, since the load factor of Japanese nuclear power plants is muchlower than the best performers in the world, more attention should be givento shortening the statutory and other outage periods and reducing theirfrequency. A third challenge is to ensure the role of nuclear power inliberalised electricity markets, a subject that has not been addressed in therecent debate on further market reform in the electricity sector.
ECONOMIC EFFICIENCY
While energy security and environmental issues have been well addressed inJapan, more needs to be done to improve economic efficiency, includingefficiency in the energy markets and cost-effectiveness of government policies.Japanese energy policy includes a complex web of financial and fiscalincentives to encourage certain energy supplies and end-use technologychoices. It is not clear how well these mechanisms are working individually orcollectively. Japan should develop a comprehensive map of all the various
178
In-Depth Reviews: JAPAN The Country Reports
139-In-Depth Reviews 2/12/03 11:15 Page 178

incentives and disincentives – financial, tax, regulatory, R&D, etc. – to determinethe cost-effectiveness of these measures and rationalise these policy optionsfor maximum impact and leverage.
Despite some recent reductions, energy prices in Japan are still among thehighest within IEA member countries. To increase market efficiency, thegovernment has launched market reform. This process is most advanced in the oilsector which has been fully liberalised. However, the implications have not yetbeen fully ascertained because the industry is still in the middle of restructuringwhich involves closing excess refining capacities and rationalising retailing.
Natural gas market liberalisation started in 1995 and some 39% of themarket is now open. If measured in terms of the market share by new entrants,i.e. 2% of the liberalised market segment in March 2002, little competitionhas emerged. The government has recognised the need for further action tofully capture the potential benefits of market reform and announced newmeasures such as the introduction of regulated third-party access (TPA) to thepipelines and the promotion of negotiated TPA to the LNG terminals. Theseappear helpful but their effectiveness needs to be closely monitored andcorrective measures need to be introduced promptly if competition does notdevelop. Expansion of the domestic gas network is also a challenge to furtherintroduction of natural gas, enhancing security of supply and competition.
Electricity market reform was initiated in March 2000. At present, 30% of themarket has been opened for competition and regulated TPA has beenintroduced. Some price reductions have taken place for both liberalised andcaptive consumers, mainly because of low interest costs, but price positioningdue to market liberalisation may also have had an impact. Because newentrants are having difficulties in entering the market and there is littlerevealed competition between the incumbents, the government hasannounced further steps. Many of the proposed measures, including clearercriteria for TPA tariffs, removal of pancaking5, establishment of nationalpower exchange and relaxation of balancing power rules, can help makemarket access easier, fairer and more transparent. However, the proposal doeslittle to address the fact that the incumbents are very large and powerfulcompanies with significant market powers compared to new entrants. Giventhe slow entry rate, competition between the incumbents has to be fostered.The effectiveness of the planned unbundling arrangements, the “neutraltransmission organisation” and the regulatory institutions should be ensured. Ifcompetition does not develop, stronger measures such as establishing anindependent national transmission system operator should not be precluded.Furthermore, the weak interconnection between most supply regions should bestrengthened to facilitate competition and ensure energy security.
179
The Country Reports In-Depth Reviews: JAPAN
5. Pancaking means that two or more access charges are collected in electricity transactions when twoor more transmission systems are used.
139-In-Depth Reviews 2/12/03 11:15 Page 179

In short, the report suggests that there is room for improved economicefficiency in the whole energy field, provided good measures are taken andimplemented.
RECOMMENDATIONS
The government of Japan should:
General Energy Policy
◗ Develop integrated measures – beyond oil stockpiling – to address the securityof supply issues arising from Japan’s isolated location, high import dependence,electricity transmission bottlenecks and lack of a trunk network for gastransmission.
◗ While recognising energy security is of the utmost importance for Japan,implement further steps in market reform to ensure a level playing field.
◗ Continue to review 2010 projections in the Long-Term Energy Supply andDemand Outlook and carry out sensitivity analyses and consider preparingprojections beyond this time frame.
◗ Evaluate the cost-effectiveness of subsidies, fiscal incentives and R&D insupport of energy policy goals.
◗ Assess the fuel tax revision with a view to clarifying its objectives andensuring their cost-effective achievement.
◗ Ensure the timely availability of good quality statistical information to allinterested parties, including international organisations.
Energy and the Environment
◗ Address foreseeable and unforeseeable changes in reviewing the New Guidelinesof Measures to Prevent Global Warming in 2004.
◗ Continue to monitor the GHG emissions, in particular in the transport andelectricity sectors, and take further action, if necessary, both domesticallyand through the Kyoto flexible mechanisms to close the gap with the Kyototarget.
◗ Continue to closely follow progress under the Keidanren’s “Voluntary ActionPlan on the Environment”. Consider encouraging companies to take furtheractions, including the use of Kyoto mechanisms. Monitor the seemingly risingemissions from businesses outside the Action Plan.
180
In-Depth Reviews: JAPAN The Country Reports
139-In-Depth Reviews 2/12/03 11:15 Page 180

◗ Consider how Japan can take advantage of possible international emissionstrading to ensure cost-effective climate change mitigation and lower adverseeconomic impacts.
◗ Select climate change mitigation measures – including for other GHGs – takinginto account their cost-effectiveness and their contribution to energy security.
Energy Efficiency
◗ Assess the efficacy of combining energy efficiency standards/guidelineswith subsidies.
◗ Strengthen the standards for appliances and vehicles in the Top-RunnerProgramme by:
• Considering other approaches to set new standards, such as minimum life-cycle cost or using the international appliance market to identify the top-runner.
• Making labelling mandatory and extending it to a wider range of products.
• Considering different approaches for vehicles to avoid a shift towardsincreased weight, such as by basing the top-runner on the consumptionof the average fleet or by engine size.
◗ Examine the possibility of introducing mandatory efficiency standards fornew residential and office buildings, intensify the efforts in certification ofnew buildings and develop a certification scheme for existing buildings.
Fossil Fuels
◗ Continue addressing security of fossil fuel supply by encouraging the procurementof fuels from diverse sources and creating favourable international relations.
◗ Ensure consistency with the energy security goals in setting up the new entityreplacing Japan National Oil Corporation.
◗ Evaluate the cost-effectiveness of Japan National Oil Corporation’soperations and take this into account in establishing its successor whichshould also function consistently with the competitive energy markets.
◗ Ensure real competition in the petroleum market and see to it that consolidationand mergers will not hamper it.
◗ Facilitate further restructuring of refining and retailing sectors to improveefficiency.
◗ Encourage the commercial demonstration and deployment of advanced coalpower plants that have higher efficiency and lower GHG emissions.
◗ Stimulate the development of trunk pipelines for natural gas.
181
The Country Reports In-Depth Reviews: JAPAN
139-In-Depth Reviews 2/12/03 11:15 Page 181

◗ Introduce account unbundling between pipeline transmission/distributionof gas and other activities of gas companies.
◗ Reduce regulatory barriers for new entrants to acquire customers in franchisedareas.
◗ Follow closely the effectiveness of efforts to promote third-party access toLNG terminals. If the measures are not adequate to ensure effectivecompetition, consider implementing TPA obligation.
New and Renewable Energy Sources
◗ Review in due time the implementation of the renewable portfolio standard toascertain its effectiveness and what further measures may need to be taken.
◗ Taking account of their potential energy security and GHG benefits, ensurerenewables have access to the grid as envisioned for nuclear power.
Nuclear Power
◗ Address safety-related shortcomings, paying particular attention to ensurethe effective working of the Nuclear and Industrial Safety Agency and thenew organisation, Japan Nuclear Energy Safety Organisation.
◗ Work to restore public confidence in nuclear energy, especially by addressingthe political tensions between national and local governments.
◗ Maintain efforts to improve nuclear plant availability, particularly of theboiling water reactor tranche.
◗ Clarify the role of nuclear power in the liberalised market and the respectiveresponsibilities of government and industry in meeting its back-end costs.
◗ Pursue the ultimate disposal of high-level radioactive waste, seeking appropriatesites through enhancing acceptance of its nuclear policy.
Electricity
◗ Promote pricing mechanisms and other demand measures which help moderatepeak loads.
◗ Ensure an effective level of unbundling to facilitate fair and effective competition.As a first step, immediately implement the account unbundling and“information firewalls” for separation of transmission from generation andretail activities to level the playing field between incumbents and new entrants.If fair and effective competition does not emerge, the government should notpreclude establishing a single independent transmission system operator tomanage the national network.
182
In-Depth Reviews: JAPAN The Country Reports
139-In-Depth Reviews 2/12/03 11:15 Page 182

◗ Strengthen the regulatory framework with emphasis on an ex ante basis.Ensure the independence of the regulatory authority from industry and theindustry development activities of METI, and as a second step, assess thebenefits of creating a regulator completely independent from the Ministry ofEconomy, Trade and Industry (METI).
◗ Foster the strengthening of an inter-regional transmission grid in a cost-effective way, particularly between the two frequency areas, to improve securityof supply and facilitate effective competition. Improve the possibilities foraccess to interconnections by measures such as auctioning the capacities.
Research and Development◗ Continue to pursue a balanced portfolio of R&D with due attention to adequate
support for long-term R&D.
◗ Seek an increasing cost-sharing from industries where possible, especially whenthey benefit from successful R&D.
183
The Country Reports In-Depth Reviews: JAPAN
139-In-Depth Reviews 2/12/03 11:15 Page 183

139-In-Depth Reviews 2/12/03 11:15 Page 184

SWITZERLAND
The Energy 2000 Action Programme (Energy 2000) was the core of Swissenergy policy in the 1990s. It is succeeded by the SwissEnergy Programme(SwissEnergy) for the period 2001 to 2010. Energy 2000 had concreteobjectives for electricity and fossil fuel consumption, increasing the use of non-hydro renewables and hydropower as well as upgrading the capacity ofnuclear power plants. The totality of the Energy 2000 objectives were notachieved principally owing to inadequate funding, lack of energy efficiencyregulation, excessive reliance on voluntary measures that were inadequatelytaken by industry and the cantons’ different degrees of implementation offederal energy efficiency recommendations. Performance and cost-benefit ofthe Energy 2000 policies and measures were carefully monitored and theexperience gained was transferred to SwissEnergy, as demonstrated by thereallocation of certain resources. Additional reallocation may be requiredbetween renewables and energy efficiency programmes and measures. Giventhat the cantons have an important role in implementing SwissEnergy,
Disclaimer
This report is based on the IEA review team visit to Switzerland that took placein November 2002. It was drafted prior to the results of the 18 May 2003public vote on popular initiatives on nuclear power and the publication of thegovernment’s plans for electricity market reform.On 18 May 2003, the general public rejected both the Moratorium Plusinitiative with a 58.4% majority and the Power without Atoms initiative witha 66.3% majority. Consequently, the nuclear energy law can now beimplemented, which implies further operation of existing nuclear plants aslong as security allows and submission of new plants to public vote if areferendum is requested.On 7 March 2003, the government announced plans to introduce a new lawto reform the electricity market. In April 2003, it established a commissionwith representatives from all interest groups to plan the new law. This lawshould enter into force by mid-2007 at the latest.In May 2003, the government proposed a plan to reduce the federal budgetdeficit, which would involve cutting the total budget of SwissEnergy. Thegovernment considers that this cut could be compensated by implementingnew regulations or by imposing an energy tax, the revenue of which would beearmarked for SwissEnergy.
185
139-In-Depth Reviews 2/12/03 11:15 Page 185

particularly in the building sector, results of the cost-benefit analysis of differentpolicies and measures as well as “best practices” should be widely shared and,where possible, harmonised between the cantons.
Security of supply is important for Switzerland, which is a landlocked countrylacking fossil fuel resources. The government has a robust programme toensure oil supply security, including its full compliance with the IEA 90-dayobligation of net oil imports. Natural gas supply security is enhanced throughthe large number of interruptible contracts and compulsory stocks of heatingoil, which are additional to the international stockholding obligations.
Within the IEA’s 3 Es (Energy security, Economic development and Environmentalsustainability), environmental issues are the priority of Swiss energy policy.Switzerland principally envisages to use actions implemented in the energysector to achieve its Kyoto target of a reduction of greenhouse gas (GHG)emissions by 8% below 1990 levels by 2008 to 2012. SwissEnergy calls for a10% reduction in carbon dioxide (CO2) emissions below 1990 levels throughreductions of consumption of combustibles by 15% and motor fuels by 8%. Avariety of measures are proposed to meet these targets, including thedevelopment of voluntary commitments (VCs) and voluntary agreements (VAs)with industry and the imposition of a CO2 “incentive” tax should other measuresfail to bring about adequate reductions. Other measures include promotionalactivities and information dissemination programmes for industry, as well asregulations and standards for buildings, vehicles and electrical appliances.
Despite considerable efforts, the policies and measures still do not seem to beadequate to meet the Kyoto target or the more stringent national target for CO2
reductions; according to IEA statistics, Swiss energy-related CO2 emissionsincreased by 5.6% during 1990 to 2001. This issue may be better addressed ifand when the CO2 “incentive” tax is imposed but work needs to proceed promptlyif this instrument is to be available in the near term. The government shouldfurther develop emissions trading and other flexible mechanisms given theirpotential economic benefits, even if these are only intended as supplementaryand back-stop alternatives to domestic reductions. In this context, considerationmight be given to whether a portion of the tax revenues could be devoted topurchasing GHG emissions permits from the international market.
Energy pricing and taxation needs to be reviewed. Swiss heating oil prices areamong the lowest in OECD member countries, partly because of the very lowshare of taxes by international comparison. This encourages neither energysaving nor the use of alternative energies with lower CO2 emissions. Gasolineprices in Switzerland are lower than in neighbouring countries, leading to some“fuel tourism”. On the other hand, natural gas prices for all consumers areamong the highest in IEA member countries owing to rough topography, smallmarket size, low connection density and the fragmented market structure. Thisdiscourages market penetration of natural gas. Electricity prices in Switzerland,particularly for small and medium-sized enterprises, are higher than European
186
In-Depth Reviews: SWITZERLAND The Country Reports
139-In-Depth Reviews 2/12/03 11:15 Page 186

averages. This is partly explained by the taxes and charges set by the cantonsand municipalities. Concerns exist regarding the efficiency of the operation ofmany publicly-owned small utilities and the profits they secure for their owners.The current price-setting mechanisms lack transparency and enable cross-subsidies from one consumer group to another. Some electricity is supplied free ofcharge or at low charge to local authorities, therefore jeopardising energy efficiency.
In 2001, nuclear power accounted for 25% of Switzerland’s energy supply and38% of power generation. In March 2003, the Federal Parliament endorsed anew Nuclear Energy Act that updates the current law from 1959. The law will domuch to clarify the future role of nuclear energy in Switzerland. For economic,energy security and climate change mitigation reasons, the nuclear option shouldbe kept open. Switzerland has interim storage of nuclear waste from nuclearenergy production in Zwilag, with sufficient capacity for the expected lives of thecurrent operating fleet; however disposal options still need to be defined. In2002, voters in Nidwalden rejected the siting of an underground laboratory forthe disposal of low- and intermediate-level nuclear waste. Despite this setback thegovernment needs to continue to develop solutions.
A special feature of the Swiss political system is that citizens can approvelegislation through referendums. Given the far-reaching impact of thereferendums, it is vital that citizens are adequately informed on policy issuesand the consequences of their votes. A public referendum on the ElectricityMarket Law (EML) was held in September 2002. The law proposal wasrejected despite a broad political consensus. The government and marketplayers are currently debating how the electricity market could develop; at thetime of the IEA review team visit, no clear path had emerged. While respectingthe results of the EML vote, the government should continue to incitecompetition in the market. An initial step could focus on allowing competitionin the wholesale market by permitting the largest consumers and distributioncompanies to choose their suppliers. An independent regulator and anindependent transmission system operator (TSO) should be established. TheTSO could enable greater efficiency in the management of the transmissionsystem and in cross-border trade and transit. Effective unbundling is necessaryto ensure transparent and non-discriminatory third party access (TPA).
The government also initiated legislation for gas market reform but the projectwas abandoned following the results of the public referendum on the EML.The gas industry is currently defining how to enable access within the presentlegislation, which allows negotiated TPA to high-pressure networks. This iscommendable, but the government should step up its activities in monitoringthe market and settling disputes in order to ensure transparent, fair and fastnetwork access for both incumbents and new entrants. Routes to appealshould be defined and the decisions should come into force immediately inorder to avoid incumbents delaying network access, for example by enteringinto lengthy court processes.
187
The Country Reports In-Depth Reviews: SWITZERLAND
139-In-Depth Reviews 2/12/03 11:15 Page 187

RECOMMENDATIONS
The government of Switzerland should:
General Energy Policy
◗ Ensure a better balance in the overall energy policy by emphasising economicefficiency.
◗ Optimise the overall effect of the energy programmes and the use of resources by:
• Developing programmes to assess the costs, benefits and “best practices”of energy policy implementation among and within the cantons;
• Continuing the vigorous monitoring and cost-benefit assessment activitiesat federal level;
• Reallocating resources to the most cost-effective policies and measures; and
• Continuing to support the harmonisation of the cantons’ energy andenvironmental programmes.
◗ Increase focus on pricing and taxation as energy policy tools in order tointernalise the externalities and promote economic and energy efficiency.
◗ Increase public awareness of the consequences of energy-related popularinitiatives and law proposals by analysing their potential impacts andcommunicate these to the general public.
◗ Develop and regularly update energy and CO2 projections and scenarios forall sectors and fuels.
Energy and the Environment
◗ Take additional action to meet the GHG emissions reduction targets.
◗ Review energy-related climate change mitigation policies with a view tobalancing efforts as the current focus on energy efficiency and renewablesmay not prove to be the most cost-effective solution.
◗ Develop implementation plans for the CO2 “incentive” tax and emissionstrading.
◗ Evaluate the effectiveness of VAs and VCs and envisage the possibility toextend them to all energy-intensive sectors, including oil refineries.
◗ Develop additional support programmes for the cantons to assist them in settingand implementing vehicle taxes that are proportional to CO2 emissions, andfederal programmes to support the innovative use of cleaner fuels in thetransport sector.
188
In-Depth Reviews: SWITZERLAND The Country Reports
139-In-Depth Reviews 2/12/03 11:15 Page 188

Energy Efficiency
◗ Ensure clear allocation of responsibilities between the Confederation, thecantons and the various energy agencies. Aim to harmonise policies andmeasures by strengthening their collaboration.
◗ Continue and increase work on energy efficiency in buildings through:
• Increasing energy efficiency in buildings in co-operation with the cantons;
• Developing and disseminating building sector and space heatingstatistics; and
• Encouraging individual metering of heating and hot water in existingbuildings.
◗ Diversify energies for space heating.
◗ Intensify co-operation with consumer groups and environmental andbusiness associations, including dissemination of information activities and planning and implementing labelling schemes and performancestandards for appliances.
◗ Work to further engage financing institutions in the development of incentivesfor purchases and upgrades that improve energy-efficient infrastructure andequipment.
Fossil Fuels
◗ Use taxation of heating fuels as a tool to improve energy efficiency and addressclimate change.
◗ Link proposals for tax incentives to promote diesel fuel to further reductionsin non-carbon emissions.
◗ Encourage industry to develop a natural gas infrastructure for gas use in thetransport sector.
◗ Monitor pricing mechanisms at the natural gas distribution level to ensuretransparency, cost-reflectiveness and non-discrimination.
◗ Encourage competition and induce efficiency in the gas market by:
• Urging simple, fast and fair TPA to the networks as well as transparentand non-discriminatory rules for access and tariffs;
• Providing resources to monitor the gas markets and settle disputes;
• Ensuring that captive consumers also benefit from efficiency gains; and
• Promoting the continuing depolitisation of the management of the gasutilities.
189
The Country Reports In-Depth Reviews: SWITZERLAND
139-In-Depth Reviews 2/12/03 11:15 Page 189

Renewables
◗ Continue to assess the cost-benefit of the renewables programmes, includingsubsidies, R&D and external costs, and ensure that the results are reflectedin the allocation of financial resources. In particular, re-examine the cost-effectiveness of the solar energy programme and consider increasing resourcesfor more cost-effective programmes, such as biomass and waste.
◗ Improve the framework of promoting renewables. Explore possibilities tointroduce portfolio standards with tradable renewable energy certificatesand review the feed-in tariff scheme.
Nuclear Power
◗ Maintain the nuclear option.
◗ Ensure that the general public is fully aware of the potential impacts of thenuclear initiatives and the draft nuclear law.
◗ Continue to take actions to develop safe radioactive waste repositories.
◗ Take actions to maintain sufficient levels of technological competence.
Electricity and Heat
◗ Ensure that adequate resources are devoted to price monitoring and protectingconsumers from abusive electricity prices. Raise local authorities’ awarenessof economic, energy efficiency and environmental benefits of cost-reflectiveelectricity pricing. Encourage them to phase out free electricity supplies topublic consumers.
◗ After careful analysis of the vote on Electricity Market Law, continue effortsto introduce competition in electricity markets. Establish a nationaltransmission system operator and a regulator, define the rules for TPA andallow market access for domestic and foreign suppliers, distribution companiesand large consumers.
◗ Improve the possibilities for transmission network access by auctioning thecapacities. Until a legal framework for market reform is in place, encourageindustries to implement improvements.
◗ Study the economic potential for combined heat and power generation bothin industry and space heating.
Research and Development
◗ Continue planning to facilitate the integration and alignment of near-termactivities and long-term R&D objectives
190
In-Depth Reviews: SWITZERLAND The Country Reports
139-In-Depth Reviews 2/12/03 11:15 Page 190

PART 2.2
STANDARD REVIEWS
This part contains the 2002/2003 standard reviews for the following sevencountries, updating the situation since these countries underwent the in-depthreviews of the 2000/2001 review cycle. The report reflects the situation whenthey were drafted from July to September 2003.
AUSTRALIA
BELGIUM
CZECH REPUBLIC
NEW ZEALAND
NORWAY
SPAIN
TURKEY
191-Standard Reviews 2/12/03 11:14 Page 191

191-Standard Reviews 2/12/03 11:14 Page 192

AUSTRALIA
GENERAL ENERGY POLICY
Energy is a shared responsibility among the federal, state and territory governments.On 8 June 2001, the Council of Australian Governments (COAG) agreed toestablish a national energy policy framework to guide future energy policydecision-making by jurisdictions and to provide increased policy certainty forenergy users and investors. The objectives of the national energy policy are asfollows:
● To encourage efficient provision of reliable, competitively-priced energyservices, underpinning wealth and job creation and improved quality of life,taking into account the needs of regional, rural and remote areas.
● To encourage responsible development of Australia’s energy resources,technology and expertise, their efficient use by industries and householdsand their exploitation in export markets.
● To mitigate local and global environmental impacts, notably greenhouseimpacts, of energy production, transformation, supply and use.
COAG called for the following priority actions to support the energy policyobjectives:
● The establishment of the Ministerial Council on Energy (MCE), which isresponsible for national leadership and overseeing the continued developmentof national energy policy. The MCE’s first meeting took place on 7 December2001.
● That the 2001 National Electricity Market (NEM) Ministers’ Forum giveurgent attention to the technical NEM issues, including impediments toinvestment in interconnection, transmission pricing and market behaviour.
● The commissioning of a high-level independent strategic review of medium-to longer-term energy market directions, the COAG Energy Market Review(Parer Review). The Parer Review panel delivered its final report, Towards aTruly National and Efficient Energy Market in late 2002.
The key findings of the Parer Review are:
● The energy sector governance arrangements are confusing, there is excessiveregulation and perceptions of conflicting interests.
● There is insufficient generator competition to allow Australia’s gross poolsystem to work as intended.
193
191-Standard Reviews 2/12/03 11:14 Page 193

● Electricity transmission investment and operation is flawed. The current divisionby region does not reflect market needs.
● The financial contracts market is extremely illiquid, in part reflecting largeregulatory uncertainty.
● There are many impediments to demand side playing its true role in themarket.
● There is insufficient competition in the east coast gas market, and too muchuncertainty surrounding the new pipeline development.
● Greenhouse responses so far are ad hoc, have created uncertainty, andhave been poorly targeted.
● The NEM is currently disadvantaging some regions.
In August 2003, the MCE agreed on a comprehensive reform programme thatis expected to clear the way for new investment in the national energy market.COAG is considering the reform programme, which includes recommendationsin the following areas:
● Governance: improving the national energy policy framework.
● Regulation: reducing the barriers to competitive markets, by possibly establishinga national energy regulator to cover not only electricity but also gas.
● Transmission: facilitating new investment.
● User participation: improving demand-side participation in the market.
● Natural gas: increasing gas penetration in the energy market.
● Greenhouse gas emissions: address greenhouse gas (GHG) emissions fromthe energy sector on a national basis.
The MCE will implement a comprehensive work plan involving the federal,state and territory governments.
ENERGY SUPPLY AND DEMAND
Australia’s total primary energy suppy (TPES) grew by 2.3% per year from1990 to 2000 and by more than 5% per annum from 2000, to reach123 Mtoe in 2002. Coal had a leading role in 2002 with almost 48% ofTPES, while oil represented 29%, gas 18% and renewables close to 6%.
Australia remains a major energy producer. In 2002, total energy productionreached 259 Mtoe, from 158 Mtoe in 1990. Australia’s net exports more than
194
Standard Reviews: AUSTRALIA The Country Reports
191-Standard Reviews 2/12/03 11:14 Page 194

doubled from 65 Mtoe in 1990 to 134 Mtoe in 2000, with coal and gasrepresenting 92% and 6% respectively of the energy exports 1.
Since 1990, total final consumption of energy (TFC) grew by 25% to reach72 Mtoe in 2000. TFC is shared between the industry and transport sectors(approximately 39% each), with the remainder being spread among the othersectors.
ENERGY EFFICIENCY
In 2002, the MCE established the Energy Efficiency and Greenhouse WorkingGroup, with representatives from all jurisdictions, to develop national measuresto increase energy efficiency through the development of a National Frameworkfor Energy Efficiency. A final strategy for the National Framework is expectedin early 2004.
In January 2002, the Motor Vehicle Environment Council, in consultation with the Federal Department of Transport and Regional Services, released a proposal for an Australian internet-based “green vehicles” guide to beavailable in 2003. A mandatory, model-specific fuel consumption labellingscheme for new passenger cars commenced in January 2001. The scheme willbe expanded to include a wider range of vehicles by 2003. The revised labelwill also show how much carbon dioxide (CO2) is emitted by each vehicle. Thefederal government has undertaken to develop options for challenging butrealistic fuel efficiency targets for government car fleets from 2003. A numberof states have introduced energy efficiency initiatives, either efficiency andemissions reduction targets or procurement of hybrid fuel vehicles.
In November 2002, the MCE released Australia’s ten-year strategy to addressstandby power. The initiative was supported by a new call for specific measuresmade at the June 2003 MCE meeting.
A 2003 study of the Australian Bureau of Agricultural and ResourceEconomics (ABARE) demonstrated that real energy intensity reduced by 6%between 1973 and 1974 and between 2000 and 2001 owing to efficiencygains resulting from fuel mix changes. Other apparent gains in the energyintensity of the economy are linked to changes in GDP structure rather thanefficiency gains.
Mandatory energy efficiency measures for houses were introduced in theBuilding Code of Australia on 1 January 2003.
195
The Country Reports Standard Reviews: AUSTRALIA
1. Australia also exports significant quantities of uranium, which are not accounted for in theInternational Energy Agency’s calculation of primary energy exports.
191-Standard Reviews 2/12/03 11:14 Page 195

ENERGY AND THE ENVIRONMENT
Australia does not intend to ratify the Kyoto Protocol. However, it aims to meetthe Kyoto target to limit emissions to 108% of 1990 levels of its greenhousegas emissions. In 2000, Australia’s total GHG emissions were 553 Mt of CO2
equivalent, 6.3% above the 1990 level [calculated using the United NationsFramework Convention on Climate Change (UNFCCC) methodology]. The IEAestimates that CO2 emissions from energy combustion, which account for two-thirds of Australia’s total GHG emissions, were 27% above the 1990 level in2000 and 42% above the 1990 level in 2001, with 369 Mt of CO2.
In August 2002, the federal government announced it was developing aforward strategy on climate change, focusing on a 20 to 30-year time horizon.In 2002, Australia and the United States established a Climate ActionPartnership. In July 2002, 19 projects were announced under the partnership.Australia has implemented a climate change partnership with New Zealandand is looking to strengthen bilateral co-operation on practical responses toclimate change with other countries.
The following existing programmes and initiatives adopted by the federalgovernment are projected to contribute to a reduction of 59 Mt of CO2
equivalent per year until 2010:
● The Mandatory Renewable Energy Target (MRET) – creating a national renewableenergy market, including tradable Renewable Energy Certificates.
● The introduction of minimum energy performance standards for domesticappliances and commercial and industrial equipments.
● The introduction of energy efficiency standards for residential and commercialbuildings.
● The Greenhouse Gas Abatement Programme (GGAP) – since 1999, the federalgovernment allocates grants on a tender basis to support large emissionabatement projects that would not otherwise have been cost-effective.
● The voluntary Greenhouse Challenge Programme – an eight-year-oldvoluntary agreement with more than 800 member companies andorganisations.
● The Greenhouse Friendly Programme – certifies products or services withGHG emissions that have been fully offset by GHG abatement activities.
● The Cities for Climate Protection Programme – over 150 councils involved.
● The Generator Efficiency Standards (GES) – a measure that applies to new,existing and significantly refurbished electricity generating plants withgenerating capacity superior to 30 MW.
196
Standard Reviews: AUSTRALIA The Country Reports
191-Standard Reviews 2/12/03 11:14 Page 196
OIL
Australia’s oil production grew by 1 Mtoe from 2000 to reach 34 Mtoe in2002. Australia still exports crude oil (approximately 20 Mtoe in 2001),principally to Japan and the US, while importing a slightly greater quantity,mainly from Brunei, Indonesia, Saudi Arabia and the United Arab Emirates.
The majority of Australia’s petroleum potential is thought to exist in offshorebasins. In 2002, there was a decline in important exploration activities, suchas seismic surveying and well drilling, in these basins compared to 2001.However, there was a small increase in the drilling of development wells. Thenumber of new exploration permits awarded increased during 2002, reflectinga continued interest in frontier exploration areas and in the more maturepetroleum exploration areas. The government expects an increase inexploration work in coming years, particularly in the Otway basin off Victoriaand Tasmania and the Perth basin off Western Australia.
The 2003 release of offshore petroleum acreage was announced on 25 March2003 and will remain open to bidding for six to twelve months, depending onthe area. The next release is planned for March 2004.
NATURAL GAS
In 2002, Australia’s natural gas production reached 31 Mtoe and is expectedto continue to grow significantly in the future. One-third of the production isexported, principally to Japan in the form of liquefied natural gas (LNG).
In addition to existing policies, the federal government launched the LNG ActionAgenda on 10 October 2000. The Action Agenda identified the following sevenkey issues, which need to be addressed to make Australia the preferred LNGsupplier for new demand (mainly in Asia: Korea, Japan, China, and Chinese Taipei):
● Clarification of greenhouse policy.
● Customs and import arrangements.
● Taxation arrangements.
● Australian industry participation.
● Streamlined project approval processes.
● Effective industry/government marketing.
● Resolution of uncertainties related to the Timor Gap Zone of Co-operation.
197
The Country Reports Standard Reviews: AUSTRALIA
191-Standard Reviews 2/12/03 11:14 Page 197

The accomplishments of the LNG Action Agenda include clarification ofgreenhouse policy, new statutory effective life caps for pipeline, clarificationof the definition of oil and gas assets that could benefit from tax depreciationand the legal simplification for major LNG projects. The North West Shelf JointVenture’s decision in early 2002 to construct the fourth LNG train is inaccordance with the LNG Action Agenda. This A$ 1.6 billion project will, atfull capacity of 4.2 Mt per year, increase Australia’s LNG exports to nearly12 Mt per year. Construction of a new pipeline to bring gas onshore at theBurrup Peninsula began in early 2003. The China LNG deal is also expectedto underwrite the construction of a fifth LNG train on the North West Shelf.
In June 2003, the Bayu Undan Joint Venture announced the construction ofa A$ 1.5 billion LNG plant near Darwin that will supply 3.0 Mt per year ofLNG to Japan for 17 years from 2006. The Bayu Undan field, in the Timor Sea,is within the Joint Petroleum Development Area (JPDA). The field contains gasreserves of approximately 100 bcm and liquids (condensate and LPG) reservesof approximately 400 million barrels. Other projects currently underconsideration include the Sunrise gas field in the JPDA and the Gorgon gasfields off the coast of Western Australia. Both these projects are currentlylooking at potential markets and development scenarios.
South-eastern Australia is also experiencing significant new development withprojects such as the Patricia Baleen and the Yolla fields in the Bass Strait, theMinerva, Geographe and Thylacine fields in the Otway basin and the Sole gasfield in the Gippsland basin. The new 732 km pipeline across the Bass Straitand to Tasmania was completed in early September 2002, and has started totransport natural gas from Victoria’s Longford plant to Tasmania.
The Productivity Commission, the federal governments’ principal review andadvisory body on microeconomic policy and regulation, was asked by thegovernment to review the Gas Access Regime for natural gas pipelines. Thereview began in June 2003 and will be completed in June 2004. The primaryobjective of the review is to examine the extent to which current gas accessarrangements balance the interests of relevant parties, provide a frameworkthat enables efficient investment in new pipeline and network infrastructuresand can assist in facilitating a competitive market for natural gas.
COAL
Coal is an essential component of Australia’s energy production. In 2002, itrepresented nearly 187 Mtoe, more than 70% of Australia’s total energyproduction. Exports account for 75% of production. The principal exportmarkets are Japan, Korea, Chinese Taipei, India and the United Kingdom.
The federal government withdrew from the Joint Coal Board and transferredthe responsibility for workers compensation insurance to the New South Wales
198
Standard Reviews: AUSTRALIA The Country Reports
191-Standard Reviews 2/12/03 11:14 Page 198

(NSW) government in 2002. This brought NSW in line with all other states,which have always had sole responsibility for managing this issue. The NSWgovernment has established a limited liability company, Coal Services, ownedby coal industry employers and employees, to manage the former functions ofthe Joint Coal Board.
The federal government’s competition policy reform is improving businesscompetitiveness, in particular through the introduction of regulations on third-party access to coal rail freight. State governments in Queensland and NSWhave embraced these changes, which have resulted in significant reductions in rail freight rates (25% in Queensland and over 50% in NSW since1995/1996). These reductions have been achieved through increasedefficiency and volume benefits in rail operations and the removal of the hidden royalty component in the rail freight rate. Further reductions incoal rail freight rates are anticipated once real third-party competitioncommences.
ELECTRICITY
Between 2000 and 2002, following sustained economic growth, Australia’sgross electricity generation grew at a strong 5% rate. Seventy-eight per centof the electricity was produced using coal. This share is expected to declinegradually, leaving more room for gas. The federal government envisages thatgas will represent 21% of gross electricity generation by 2010, from 12% in2001. This will only occur if the gas market reform engenders lower naturalgas prices, thereby enabling gas to compete with cheap coal, especially browncoal from Victoria.
In 1998, the National Electricity Market (NEM) was launched betweenQueensland, NSW, Victoria, South Australia and the Australian CapitalTerritory (ACT). In 2002, full retail contestability was introduced in NSW and Victoria, and in 2003 it was introduced in South Australia and the ACT. A fully contestable market at retail level has been implemented in the NEM jurisdictions, excepting Queensland, where the governmentpostponed indefinitely contestability to consumers below 200 MWh per year.
If implemented, the measures to be adopted following the recommendationsin the Parer Review are likely to facilitate competition by increasinginvestment in electricity transmission, expanding the states’ interconnectionsand interstate trade, controlling and reducing possible market power fromgenerating companies and reducing regulatory uncertainty. These measureswill also alleviate the threat of possible tensions on energy supply that canarise for a variety of reasons, including weather and generating capacityfailure.
199
The Country Reports Standard Reviews: AUSTRALIA
191-Standard Reviews 2/12/03 11:14 Page 199

RENEWABLES
In 2001, the bulk of renewable energy (77%) came from combustible renewablesand wastes, with a further 22% from hydro. The share of renewable energy inTPES remained stable until then, at around 6%.
The Mandatory Renewable Energy Target (MRET) began operations on 1 April2001 and established a requirement that wholesale purchasers of electricitysource an additional 9.5 TWh of energy from renewable sources by 2010. TheMRET is based on a system of tradable Renewable Energy Certificates (RECs),which allows renewable energy power plants and solar hot water systemsowners to earn extra funds for each megawatt-hour of energy they create orreplace.
In 2001, 600 000 RECs were created, exceeding the targeted 300 000 RECsand providing a head start for the 2002 target of 1.1 million RECs. In 2002,RECs traded at prices ranging from A$ 36 to A$ 40 per MWh, the higherfigure being equal to the penalty for not complying with the obligation. As ofMarch 2003, 178 power stations were accredited to generate RECs.
The federal government has allocated over A$ 300 million to support renewableenergy development as part of its greenhouse policy.
RESEARCH AND DEVELOPMENT
Companies involved in the energy sector can benefit from research anddevelopment (R&D) support programmes offered by the federal governmentunder the Backing Australia’s Ability policy. Although not energy-specific, theprogrammes involve the R&D Tax Concession, which is a federal governmentinitiative to increase the amount of R&D conducted in Australia by allowingcompanies to deduct up to 125% of eligible expenditure on R&D activitiesfrom assessable income. In June 2001, a 175% Premium Tax Concession wasadded for companies that increase their level of R&D. The R&D StartProgramme is another R&D support programme. It is intended for non-tax-exempt Australian companies and is a merit-based programme designed toassist Australian industry to undertake R&D and its commercialisationthrough a range of grants and loans. In the 2000 to 2001 financial year, theR&D Start Programme approved 252 grants and loans to industry totallingA$ 230 million.
The Cooperative Research Centre (CRC) for Coal in Sustainable Development,established on 1 July 2001, will continue to build on research carried out byits predecessor CRC for Black Coal Utilisation. On 1 July 2003, the AustralianPetroleum CRC was renamed the CRC for Greenhouse Gas Technologies(CO2CRC), to reflect its new focus to develop cost-effective technologies to
200
Standard Reviews: AUSTRALIA The Country Reports
191-Standard Reviews 2/12/03 11:14 Page 200

reduce CO2 emissions in the atmosphere. Other energy CRCs include miningtechnology and equipment, renewable energy and clean power from lignite.
The federal government has allocated A$ 1 million between 2002 and 2004to study the potential for a hydrogen industry in Australia.
COAL 21, a national initiative aimed at significantly reducing and eliminatingGHG emissions from coal-based electricity, was launched in early 2003. Theinitiative is a partnership between Australian governments and the coal,electricity and research communities. A major focus of this initiative will be thedevelopment of near-zero emissions and carbon sequestration technologies.COAL 21 links in with international initiatives in which Australia is taking aleading role, such as the Carbon Sequestration Leadership Forum and bilateralclimate action partnerships.
Australia participates in sixteen IEA Implementing Agreements.
201
The Country Reports Standard Reviews: AUSTRALIA
191-Standard Reviews 2/12/03 11:14 Page 201

191-Standard Reviews 2/12/03 11:14 Page 202

BELGIUM
GENERAL ENERGY POLICY
From the early 1970s, Belgium’s overall energy policy objectives have concentratedon security of supply based on the diversification of geographical sources andfuels, energy efficiency, transparent and competitive energy pricing andenvironmental protection.
Since the 2001 in-depth review, the main developments in Belgian energypolicy have been the major steps taken towards the National Climate Plan,advances in market liberalisation and a progressive phasing-out of nuclear.
The regional governments of Flanders, Wallonia and Brussels-Capital areprincipally responsible for designing and implementing policies for energyefficiency, renewables, non-nuclear energy research and development (R&D)and market regulation for the distribution and supply of electricity and gasthrough distribution networks. The federal government is responsible forissues that need to be dealt with at the national level, including electricity andgas tariffs, market regulation for large infrastructures for storage, transportand distribution of energy, the nuclear fuel cycle, and R&D in both nuclearfusion and fission.
The following websites contain additional information on the topics addressedin this review:
FEDERAL LEVEL
Federal Public Service – Economy – Division Energy:http://www.energie.mineco.fgov.be
CREG (Commission for Electricity and Gas Regulation): http://www.creg.be
ONDRAF/NIRAS (Belgian Agency for Radioactive Waste and Enriched Fissile Materials Management): http://www.ondraf.be
Federal Planning Bureau: http://www.plan.be
BRUSSELS-CAPITAL REGION
Brussels Institute for Management of the Environment, IBGEBIM,http://www.ibgebim.be
203
191-Standard Reviews 2/12/03 11:14 Page 203

FLEMISH REGION
Natural Resources and Energy Department: http://www.energiesparen.be
VREG (Flemish Electricity and Gas Regulatory Commission):http://www.vreg.be
Sustainable Energy Agency, ODE-Vlaanderen: http://www.ode.be
Energy and Environment Information System: http://www.emis.vito.be
WALLOON REGION
Administration for Energy: http://energie.wallonie.be and http://mrw.wallonie.be/dgtre
CWAPE (Walloon Electricity and Gas Regulatory Commission):http://www.cwape.be
Information site on renewables: http://www.erel.org
Energy desks: http://energie.wallonie.be (click on “particulier”)
Renewable Energy Agency: http://www.apere.org
ENERGY SUPPLY AND DEMAND
In 2002, total primary energy supply (TPES) was 59 Mtoe, 21% over the 1990levels compared to a 26% increase in GDP over the same period. The share ofoil in TPES has been quite steady over the past decade and amounted to 38%in 2002. Coal use has been replaced by natural gas as the share of coal inTPES declined from 21% to 16%, whereas the share of natural gas increasedfrom 17% to 22%. The latest forecasts date back to 1996 and do not takeinto account recent developments such as energy market liberalisation, thenuclear phase-out decision and new policies for renewables. However,modelling work has been conducted, for example in the context of developingclimate change mitigation measures.
Total final consumption (TFC) increased by 30% between 1990 and 2001reaching 43 Mtoe. Industry had the largest share (44%), followed by theresidential, services and other sectors (33%) and the transport sector (23%). Between 1990 and 2001, industrial energy demand grew by 40% (partly driven by non-energy use of fuels), while 23% growth could beobserved both in the transport sector and the residential, services and othersectors.
204
Standard Reviews: BELGIUM The Country Reports
191-Standard Reviews 2/12/03 11:14 Page 204

The government appointed an International Peer Review Group to assess the2000 report on future energy supply by the Commission for the Analysis ofMethods for the Generation of Electricity and Re-evaluation of Energy Vectors(AMPERE Commission). It made the following recommendations:
● Implement an active demand-side management (DSM) policy.
● Study the electricity saving potential in detail.
● Assess the status and cost of different electricity production technologies.
● Study the near-term potential for electricity generation from renewables.
● Carefully manage decentralised electricity production.
● Study all implications of nuclear energy phase-out and its replacement byother sources.
● Study in detail the possible impacts of international electricity trade, includingthe problems in managing international electricity flows through Belgium.
● Continuous monitoring of the development of technologies both on thedemand and supply side.
ENERGY AND THE ENVIRONMENT
Belgium agreed to reduce its greenhouse gas (GHG) emissions by 7.5% fromthe 1990 levels by 2008-2012 under the Kyoto Protocol and the EU “burden-sharing” agreement. In 2001, energy-related CO2 emissions were 12% higherthan those in 1990. Despite TPES declining by 0.3 Mtoe from 2000 to 2001,energy-related CO2 emissions increased by 1.1 Mt. Belgium’s third nationalcommunication to the United Nations Framework Convention on ClimateChange (UNFCCC)2 indicated that total GHG emissions are estimated toincrease by 16%, excluding bunker fuels, between 1990 and 2010 with thecurrent measures. According to a medium-term scenario assuming theintroduction of a carbon tax of €1.3 at 1990 prices per tonne of CO2 in 2002that would gradually be increased to €11.5 at 1990 prices per tonne of CO2
by 2010 and the use of non-fiscal measures (mainly standards), the increasewould be 6.4% over the same period, which would imply a 13.9% gap to theKyoto target. The gap can be closed by promptly adopting new domesticmeasures or by relying on the Kyoto flexible mechanisms. According to a long-term scenario, further measures and a tax of €20.4 per tCO2 would be neededto close the gap. The Federal Planning Bureau and consultants have issuedstudies on the economic impact of scenarios combining fiscal and non-fiscal
205
The Country Reports Standard Reviews: BELGIUM
2. See http://www.environment.fgov.be/Root/tasks/atmosphere/klim/pub/bel/set_fr.htm
191-Standard Reviews 2/12/03 11:14 Page 205

measures. The scenarios constitute both a sensitivity analysis of the modelsand a tool for the implementation of the National Climate Plan.
The federal government, in consultation with the regional governments,prepared the National Climate Plan for 2002-2012, which has not yet beenenforced. The regions were consulted because they have formulated their ownclimate change mitigation policies and measures, including energy efficiencymeasures (e.g. voluntary agreements) and portfolio standards for renewablesand CHP. The objective of the plan is to meet the Kyoto target through theimplementation of a coherent national policy that has sufficient sectoral andcross-sectoral measures and specific measures for individual industries. For theenergy sector, the plan addresses energy efficiency and standards, the use ofrenewables and the application of flexible mechanisms. Although the plandoes not propose a national carbon tax, it does refer to it in its scenarios.Furthermore, the Federal Plan for Sustainable Development for 2000-2004stipulates that if no agreement at the European Union level is reached, Belgiumwill unilaterally take steps to introduce CO2 and/or energy taxation.
A Climate Commission will be created to assess on an annual basis nationalco-operation and the implementation of the measures taken in the frameworkof the National Climate Plan. The commission will consist of representativesfrom the federal and regional governments and be supported by a permanentsecretariat.
ENERGY EFFICIENCY
Belgium’s TPES per capita increased from 4.88 toe in 1990 to 5.73 toe in2002 compared to the 3.41 toe average in OECD Europe in 2002. Thegovernment expects TPES per capita to level off. Belgian energy intensity(measured as TPES per GDP) is higher than the average in OECD Europebecause the latter has been improving faster. In 2002, Belgium’s energyintensity was 0.183 toe per US$ 1 000 at 1995 prices and exchange rates,compared to 0.161 toe in OECD Europe. In 1990, the level was 0.190 toe inBelgium and 0.184 toe in OECD Europe.
In 2003, an international consortium led by the Fraunhofer Institute finalised astudy for the federal government on demand-side management (see http://mineco.fgov.be/energy/home_fr.htm). In the “benchmarking scenario”, where savingsare derived from a comparison with other countries, CO2 reduction would besufficient to meet Belgium’s Kyoto target by lowering energy-related CO2
emissions to 100 MtCO2. The “economic potential scenario” assumes extensiveuse of demand reduction potentials, going beyond the current international bestpractices, and implementing investments with zero net costs (so-called “win-win”measures). Under this scenario, CO2 emissions would be cut down considerablyfurther, opening the potential for a possible second commitment period in the
206
Standard Reviews: BELGIUM The Country Reports
191-Standard Reviews 2/12/03 11:14 Page 206

Kyoto process, and partly compensating the impact of nuclear phase-out after2015. The study makes concrete proposals for demand-side management thatcould be included through co-ordinated federal and regional policies according totheir administrative feasibility and national or European constraints and priorities.
At the federal level, the first step to implement the proposals was taken aspart of the personal income tax reform by the law of August 2001, whichenabled tax reductions on investment in energy efficiency and the use ofrenewables in residential buildings. The tax reductions include 15% of theexpenditure on the replacement of old boilers, the installation of sanitarywater-heating systems using solar energy and the installation of photovoltaicpanels, and 40% of the cost of double-glazing windows, roof insulation, energyaudits and the regulation of central heating. With a total budget of €37.5 million,the maximum reduction of €500 per household in 2002 and €600 per householdin 2003 could be increased to €1 000 per household in 2004.
All regions have introduced policies and measures to promote energyefficiency. The 2002 Flemish decree for the promotion of energy efficiencysets the grid manager energy saving targets to be realised at customer level.Certificate markets to support combined heat and power (CHP) have beenintroduced in Flanders and also in Wallonia where they are imbedded into itsgreen certificates system. Brussels-Capital is in the process of preparing itsown certificate scheme to promote CHP. Flanders is establishing a quota-based certificate system for the promotion of CHP with a target to install anadditional 1 198 MW by 2005. Flanders and Wallonia have introducedvoluntary agreements for energy-intensive industries. The Flemish agreementsare based on “world top benchmarking” of energy efficiency, whereas theWalloon government subsidises energy auditing and monitoring in industry,as well as technical certification of products contributing to a better controlof energy consumption. Projects are under way in all regions to improve energyefficiency in buildings in line with the EU Directive on the Energy Performancein Buildings. The Flemish region is also preparing a law to establish a legalframework on which specific implementing measures will be based related toenergy efficiency, renewables and the implementation of flexible mechanismsand emissions trading.
OIL
Total oil supply increased from 18.7 Mtoe in 1990 to 24.3 Mtoe in 2001.Transport and industry are the largest oil consumers. Fuel consumptioncontinues to rise, especially in road transportation. The largest industrial oilconsumer is the chemical industry.
Belgium imports all the oil it needs. In 2001, crude oil imports amounted to32 Mt and the main sources were Norway (25%), the United Kingdom (19%),
207
The Country Reports Standard Reviews: BELGIUM
191-Standard Reviews 2/12/03 11:14 Page 207

Saudi Arabia (18%), the former Soviet Union (16%), Iran (9%) and Venezuela(4%). Oil product imports amounted to 15.5 Mt and came predominantly fromthe Netherlands (60%), the United Kingdom (10%), the former Soviet Union(9%) and France (8%). In 2001, Belgium exported different oil productstotalling 19.3 Mt, principally to OECD countries.
In 2002, the energy administration proposed a new law on a publicstockholding body and on stricter regulations on security stocks. In March2003, a report was finalised to meet the restricted Council of Ministers’ (viceprime ministers) request for more information on the additional costs ofcentralised stockholding. The newly appointed government is expected to takea decision on this issue. In September 2002, the energy administration beganupdating its crisis policy in co-operation with the oil industry. The objective isto make a “gentleman’s agreement” with the oil sector on the allocation of oilproducts and the use of the security stocks in times of crisis.
Heating oil “extra”, which is a new type of heating oil that was introduced in2002, is coloured diesel oil with a sulphur content of 50 parts per million(ppm). It is still more expensive than traditional heating oil, but enables bettercombustion and is therefore more environment-friendly.
By the end of 2003, funds for soil pollution in public service stations (Bofas)and for pollution at the end-user level (Premaz) are expected to be fullyoperational.
The Fund for Analysis of Oil Products (FAPETRO) carries out systematic qualitychecks of oil products on the Belgian market. In 2001, it took about 12 000motor fuel samples at Belgian filling stations and in 2002 about 10 000samples. The operation of the fund has been extended to private pumps, i.e.pumps owned by haulage, bus and taxi companies, and in 2003, the fund willstart to control the quality of heating fuel.
NATURAL GAS
In 2001, natural gas demand in Belgium totalled 13.2 Mtoe, 61% over the1990 level. Fourty per cent was used in the residential and services sectors,38% in industry and 22% for electricity generation. The government expectsmoderate growth of 7% in gas demand for the period 2001 to 2010. In 2001,the import sources were the Netherlands (54%), Norway (39%) and theUnited Kingdom (6%). Whereas the majority of supplies are on long-termcontracts, the share of spot markets reached 16% in 2000. The Zeebruggehub has made Belgium an important natural gas transit country. By 2005, gastransport capacity between Zeebrugge and Bacton (United Kingdom) willincrease from 8.5 bcm to 16.5 bcm because of the construction of two gascompressors at Zeebrugge. Two additional gas compressors, currently underconsideration, would increase the capacity to 25 bcm.
208
Standard Reviews: BELGIUM The Country Reports
191-Standard Reviews 2/12/03 11:14 Page 208
Despite a slow start, Belgium’s market opening reached 65% at the beginningof January 2003 and 83% in July 2003. A federal law passed in July 2001lowered the eligibility threshold for market access to 5 mcm per year and in2002 important steps were taken at the regional level. In Flanders, customerswith annual consumption of at least 1 mcm per year have been able to choosetheir supplier since the beginning of 2003 and on 1 July 2003 eligibility wasextended to all gas consumers. The network operators in the region werenominated on a provisional basis in October 2002 and technical regulationcovering access to the networks was published in November 2002. Walloniaadopted its decree for the organisation of the gas market in December 2002.The decree enables access to customers consuming at least 1 mcm per yearand to customers operating a good quality co-generation facility. Brussels-Capital has not opened its gas market. Despite progress in legislation, theshare of new entrants at the national level is still small at about 5%. In 2001,the dominant gas company, Distrigas, separated its operations into twodifferent companies, namely Distrigas NV and Fluxys. The latter is in chargeof the operation and development of the transport network, storage facilitiesand LNG terminal.
RENEWABLES
In 2002, the use of renewables amounted to 1.7 Mtoe and their share of TPESwas 2.9%. Electricity generation from renewables (including pumped storageand waste) totalled 2 TWh in 2001 (2.6% of total generation) with majorcontributions coming from combustible renewables and wastes.
A federal decree of July 2002 (enforced in July 2003), defines the conditionsfor issuing green certificates by the Commission for Electricity and GasRegulation (CREG) for offshore wind energy production. The decree alsostipulates that, upon request from any producer located in Belgium, thenational transmission operator must buy green certificates for the minimumprice of €90 per MWh for offshore wind energy, €50 per MWh for onshorewind energy, €50 per MWh for hydro, €150 per MWh for solar energy and€20 per MWh for biomass.
Both Flanders and Wallonia have introduced laws for portfolio standards andtradable renewable energy certificates. Electricity suppliers in Flanders areobliged to buy a certain amount of green certificates from green electricityproducers or invest in the necessary production capacity. The obligation is setat 0.8% of its total electricity supply in 2003, 1.2% in 2004, 2% in 2005 and6% in 2011. The Walloon government’s mandatory targets for the share ofrenewables in electricity generation are 3% for July 2003, 7% for 2007 and12% for 2012 encompassing electricity both from renewables and efficientCHP installations on the basis of avoided CO2 emissions (see http://www.cwape.be).The Flemish region has created CHP certificates by a separate decree. The
209
The Country Reports Standard Reviews: BELGIUM
191-Standard Reviews 2/12/03 11:14 Page 209

certificates cannot be exchanged between the two regions until they sign anagreement of mutual recognition of the certificates.
To implement EU Directive 2001/77/EC, the regional governments are preparinga guarantee of origin system for electricity generated from renewables. Thesystem is also intended to further develop the green electricity market.
A recent measure taken by Brussels-Capital is the introduction of grants of35% towards the purchase and installation of solar water-heating systems(subject to a maximum limit of €992 per household) to encourage the use ofrenewables in residential buildings. Brussels is planning a law that wouldestablish green electricity consumption quotas: 2% in 2004, 2.25% in 2005and 2.5% in 2006. To meet these quotas, suppliers will be obliged to buy thenecessary amount of green certificates from green electricity producers. Thesequotas include efficient CHP.
Wallonia’s Soltherm Programme aims at increasing the use of solar water-heating. The programme was introduced in 2000 with the target of installing200 000 m2 of solar panels over a ten-year period. At present, 4 400 m2 havebeen installed. The region provides a €625 subsidy for each installation. Inaddition to the subsidy, other promotional measures include efforts to increasethe quality of the systems, training activities and awareness campaigns. Thelocal public authorities participate, for example by giving additional subsidies anddistribution information to the potential users.
NUCLEARBelgium’s seven nuclear reactors generated 59% of its electricity in 2001. TheBelgian nuclear generating capacity increased from 5 713 MW in 2000 to5 761 MW at the beginning of 2003 owing to the replacement of the steamgenerators in Tihange 2.
On 31 January 2003, the law on the gradual phase-out of nuclear energy waspromulgated stipulating the following:
● Nuclear power plants used for industrial electricity production must beclosed 40 years after their commissioning.
● It is not permitted to build nuclear power plants for industrial electricityproduction.
● The CREG must supervise electricity supply security, inform the governmentabout possible problems and formulate recommendations in this respect.
● On the basis of government and CREG recommendations, the King can takemeasures when there is a risk of an electricity supply crisis, but withoutprejudice to the gradual nuclear phase-out. In the case of a force majeure(unforeseeable circumstances), the decision has to be elaborated accordingto the circumstances.
210
Standard Reviews: BELGIUM The Country Reports
191-Standard Reviews 2/12/03 11:14 Page 210

The report by the International Peer Review Group of the AMPERE Commissionmade some recommendations with respect to nuclear. These recommendationsinclude maintaining the necessary expertise on nuclear energy to ensure highperformance and safety, government participation in private R&D on futurereactor types, moving radioactive waste management forward more expeditiously,using participatory processes and speeding up the modernisation of nuclearsafety organisations and testing the efficiency of emergency plans.
To address the challenges created by the liberalisation of the electricity market,the Parliament approved a new law for the dismantling of nuclear powerplants and for spent fuel management. Synatom will become a full subsidiaryof Electrabel and will be responsible for all aspects of decommissioning andspent fuel management, including funds for decommissioning. An advisorycommittee will be created to supervise the implementation.
A number of royal decrees addressing nuclear safety, such as the protectionagainst ionising radiation, were enforced on 20 July 2001. The Federal NuclearInspection Authority became fully operational on 24 August 2001. The law oncivil liability of nuclear energy operators was amended in July 2000 toincrease the maximum liability from €99 million to €297 million.
By the end of 2002, vitrified high-level waste from the reprocessing of spentfuel had been shipped five times from The Hague to Belgoprocess (a subsidiaryof the Belgian waste management organisation ONDRAF) in Dessel.
The 1998 programme for the disposal of low-level waste continues. At thebeginning of 2002, ONDRAF published SAFIR 2, a report that summarises theresults from the second phase (1990 to 2000) of its methodological R&Dprogramme for the geological disposal of medium-, high-level and long-livedwaste. The report describes the progress with respect to feasibility and safetyof deep geological disposal in Belgium. It concludes that there are currentlyno insurmountable problems regarding geological disposal in Boom Clay (thehost formation most examined in Belgium), which increases confidence in thepossibility of disposal in clay, but recognises the need for further studies.SAFIR 2 was submitted to an international peer review organised by theNuclear Energy Agency. The peer review group recognised the high quality ofONDRAF’s work. It acknowledged that Boom Clay shows good properties interms of safety and feasibility for a disposal facility and that the report was agood basis for concertation with the safety authorities and decision-makers.However, it also confirmed that further research efforts are necessary andrecommended that the programme should develop in the direction ofstakeholder dialogue in choosing the disposal option and site and that astrategy must be developed for a structured approach to uncertainties and forthe definition of priorities. SAFIR 2 and the peer review results have beensubmitted to the government for its approval of the continuation of theprogramme and its elements, such as the elaboration of a decision frameworkand a dialogue process for each step of the geological proposal.
211
The Country Reports Standard Reviews: BELGIUM
191-Standard Reviews 2/12/03 11:14 Page 211

One-fifth of the core of the Tihange 2 and Doel 3 reactors is loaded withmixed oxide fuel (MOX). Use of MOX will continue until 2006 when stocksand supplies of separated civilian plutonium and reprocessed uranium areexhausted.
ELECTRICITY
In 2001, electricity consumption was 78 TWh, up by 35% from the 1990 level.This corresponds to an average growth rate of 2.7% per year. Nuclear poweraccounted for 59% of total gross electricity generation in 2001 followed bynatural gas (20.1%), coal (16.2%), oil (2.1%), combustible renewables andwastes (2%) and hydro (0.6%). The major change in generation structure hasbeen the increase of the share of natural gas from 7.7% in 1990 and thedecrease of the share of coal from 28.2%.
Market liberalisation is changing the industry structure in Belgium. Electrabelaccounts for almost 90% of total generation. If needed, part of the Belgiangeneration and the cross-border transmission capacity will be auctioned. Thesystem operation activities of Electrabel and the Company for the Co-ordination of the Production and Transport of Electricity (CPTE) have beenmerged into a single organisation, Elia, which became a legal entity in June2001. Elia comprises two companies, Elia System Operator (ESO), which wasappointed as the transmission system operator on 13 September 2002 andElia Assets, which owns the networks. Both companies are 70% owned byCPTE and 30% by Publi-T, which is a co-operative company representing theBelgian municipalities (i.e. local authorities); however, the energy administrationand the incumbents have agreed that CPTE should limit its share to 30%,municipalities to 30% and that 40% should be sold through the stockexchange. ESO’s principal tasks are to give third-party access to the high-voltage networks, define rules for it, draw an investment programme for thenetworks, allocate cross-border capacity and settle disputes.
The Electricity and Gas Control Committee (CCEG) was dismantled in July2003 and all regulatory duties at the federal level have been concentrated inthe CREG.
At the national level, 59% of the electricity market was opened forcompetition when the threshold for eligibility was lowered from 20 GWh to10 GWh per year at the beginning of 2003. The national average increasedto 80% on 1 July 2003 because of full opening in Flanders and will climb to87% at the beginning of 2005 owing to the steps to be taken in otherregions.
The Flemish electricity market was completely liberalised on 1 July 2003.Seven of the 20 suppliers active on the market supply electricity to householdcustomers. The grid manager appointed each household consumer a “default
212
Standard Reviews: BELGIUM The Country Reports
191-Standard Reviews 2/12/03 11:14 Page 212

supplier” to guarantee public service. The Flemish Energy Minister hasdemanded that the Flemish Electricity and Gas Regulatory Commission(VREG) assist Flemish customers in choosing an energy supplier. VREG willpublish energy prices and supply conditions on its website. The Flemish regionis preparing a decree to make energy invoices more transparent. Householdelectricity prices have been temporarily capped as from 1 July 2003 until 31December 2003, and the “default suppliers” are not allowed to increase theirprices. Furthermore, lower social tariffs for poor households will be continued.
At the beginning of 2003, electricity markets in Wallonia and Brussels-Capitalwere opened to all consumers with over 10 GWh annual demand at one site.In Wallonia, all high-voltage customers, connected to a voltage of 1 kV orhigher, will become eligible at the beginning of 2005. According to currentlegislation in Brussels-Capital, the next step will be taken at the beginning of2005 when the market will be opened for all high-tension consumers and fullmarket opening will take place at the beginning of 2007. However, inaccordance with the latest EU directives, the region plans to revise itslegislation to open the market to all enterprises on 1 July 2004 and toresidential consumers in 2007.
The CREG has elaborated the Indicative Programme for Electricity Generation2002 to 2011 (see http://www.creg.be) that addresses electricity demandmanagement, use of renewables, CHP and clean coal technologies as well as the international interconnection lines. The programme providesrecommendations within the framework of different scenarios taking intoaccount the latest energy and environmental policies, including the Kyototarget. Together with other plans and basic studies, the programme’srecommendations will be taken into account in energy policies.
RESEARCH AND DEVELOPMENT
The administration of non-nuclear-related R&D programmes is the exclusiveresponsibility of the three regions, while nuclear-related R&D programmes arepursued at the national level mainly by the National Nuclear Research Centre(CEN/SCK).
Wallonia’s energy R&D budget, €8 to €10 million per year, contributes 38%to the total governmental expenditures for energy R&D in Belgium. Untilrecently, the emphasis of Wallonian R&D included power generation andelectricity transmission, but it has now shifted more towards renewable energy technologies (49%) and energy conservation (35%). The results of thePROMETHEE Programme3 are used to define topics for possible R&D proposals
213
The Country Reports Standard Reviews: BELGIUM
3. The objective of the PROMETHEE Programme is to design a research and innovation strategy for theregion.
191-Standard Reviews 2/12/03 11:14 Page 213

for public financing. The current priorities are energy use of biomass andwaste, small hydro, solar energy and climate-sensitive architecture. BecauseBelgian coal resources are located in Wallonia, coal technologies receivesustained support. Wallonia supports the PIMENT Programme, whichpromotes energy efficiency and the application of renewable resources inbuildings and in the services sector. Wallonia’s future energy R&D policy isreflected in the Contrat d’Avenir pour la Wallonie (CAWA), presented in April2000 and updated in February 2002. CAWA emphasises participation in theEuropean research programmes and initiatives, collaboration betweenuniversities, research centres and enterprises, and sustaining the creation ofinnovative enterprises.
The Flemish government has ordered the Flemish Institute for TechnologicalResearch (VITO) to study how to create a framework for the implementationof the industrial benchmarking voluntary agreements. In addition, specialattention is given to CO2 emissions reduction projects, in particular to thepossibility to assist methane extraction combined with CO2 storage in exhaustedcoal mines.
The CEN/SCK continues to work on the nuclear R&D topics mentioned in the2001 in-depth review, namely reactor safety, nuclear waste management,radiation protection, radioecology, radiobiology, radioisotope production,medical applications, nuclear fusion natural radioactivity and safeguards. Thekey activities in reactor safety are reactor pressure vessel steel, integrity ofinternal reactor structural materials, fuels, reactor physics and instrumentation.The CEN/SCK also works on the pre-design of ADS (accelerator driven system)called Myrrha. Generally, an ADS system allows the transmutation of long-lived radionuclides in shorter-lived ones, which would ease the geologicaldisposal, but the scope of Myrrha is broader because it could be used fortesting materials and fuels for any new reactor type. A final decision on theimplementation of Myrrha is expected after June 2004. Furthermore, theSCK/CEN, in collaboration with Belgian universities, has set up an inter-university programme of the third cycle in nuclear engineering in the form ofthe consortium Belgian Nuclear Higher Education Network (BNEN).
214
Standard Reviews: BELGIUM The Country Reports
191-Standard Reviews 2/12/03 11:14 Page 214

CZECH REPUBLIC
GENERAL ENERGY POLICY
The Czech Republic’s energy policy objectives are set out in the National EnergyPolicy that was adopted by the government in 2000. In 2001, the governmentapproved the Energy Act to enforce the policy objectives, including legislativecompliance with the “acquis communautaire” and appointed an independentregulator, the Energy Regulatory Office (ERO), to implement the Energy Act,specifically by setting tariffs, licensing operators and monitoring the market opening.
In December 2001, the Czech Republic provisionally closed the “Energy Chapter”of the negotiations on European Union accession and will officially join the EUon 1 May 2004.
In 2002, in compliance with the new Energy Management Act that was enforcedin 2001, the government decided to update the National Energy Policy in orderto improve energy efficiency and environmental performance, enhance theenergy sector restructuring and comply with new EU and other internationalcommitments.
The updating of the energy strategy to 2030 is expected to be approved inthe second half of 2003. The preliminary version, made available in thesummer of 2003, includes six policy scenarios, ranging from expanding nuclearcapacities to easing environmental restrictions on brown coal mining.
ENERGY SUPPLY AND DEMAND
In 2002, total primary energy supply (TPES) was 41.3 Mtoe, almost the same levelas in 2001, which was still 12.5% lower than the 1990 level. Between 1990 and2002, energy production, mainly coal, decreased by 20% while energy importsincreased by 25%. Currently, coal and nuclear account for 79% and 16%respectively of domestic energy production. Crude oil and petroleum productsrepresent almost half of total imports, followed by natural gas with 41% and coalwith 6%. The country’s import dependence remains stable at 47%.
Coal was still the predominant fuel in 2002, accounting for 50% of TPES,followed by oil (21%), natural gas (19%), nuclear (12%), hydropower (0.5%)and other renewables (1.7%).
Between 1990 and 2001, total final consumption of energy (TFC) decreasedby 27%. Although final coal consumption during this period decreased by afactor of 4.5, it still currently accounts for 15% of TFC. Petroleum products andnatural gas have become the dominant fuels with market shares of 31% and
215
191-Standard Reviews 2/12/03 11:14 Page 215

25% respectively, followed by electricity with 17% and heat with 11%.Industrial consumption halved during the period 1990 to 2001 and currentlyaccounts for 38% of TFC. While the share of residential consumption hasremained stable at 22%, the share of transport consumption has rapidlyincreased from 8% to 20%. The share of services in TFC is 12%.
The latest available forecast issued in 2002 projected for 2010 a slightincrease of TPES by 1.5% to 42 Mtoe and an increase of TFC by 10.5% to28.3 Mtoe. While coal’s share in TPES and TFC is expected to decrease by one-third, coal will still account for one-third of TPES. Driven by the transportsector, the oil share will increase to 21% of TPES and 30% of TFC. Natural gasis expected to become the second fuel in TPES with 26% and the first in TFCwith 32%. The share of nuclear in TPES should grow by 76% and reach 16%of TPES in 2010. In 2010, the government aims to increase the share ofrenewables in TPES from 1.6% to 6%, which corresponds to an 8% increasein the use of renewables in gross power production.
ENERGY AND THE ENVIRONMENT
A major objective of the energy and environment policies is to continue andeven accelerate the reduction of pollutant emissions, which, despite impressiveprogress, remain much higher than the OECD Europe average.
Even if greenhouse gas emissions are 20% below the 1990 baseline, they areconstantly growing. GHG emissions in the Czech Republic stand at 11.56 tCO2
per capita (2000) and 0.89 kgCO2 per thousand US$ (at 1995 prices andpurchasing power parities) compared with the OECD Europe average of7.57 tCO2 and 0.41 kgCO2, respectively. Other pollutant emissions such assulphur have decreased but also remain much higher than the OECD average.Higher energy intensity and the dominance of coal largely explain this gap.
In October 2001, the Czech Republic ratified the Kyoto Protocol and adopteda new climate change strategy. In 2002, a new Clean Air Act was enforced,which harmonises and transposes into Czech legislation the relevant “acquiscommunautaire” prior to EU accession. The government has set up thenecessary conditions for the implementation of the flexible mechanisms of theKyoto Protocol. It has approved several projects, including a Joint Implementation(JI) project with the Netherlands on district heating systems using biomassand four projects with the Prototype Carbon Fund (PCF).
ENERGY EFFICIENCY AND RENEWABLES
The energy consumption per capita has slightly decreased in the Czech Republicfrom 4.5 toe in 1990 to 4 toe in 2001. Between 1990 and 2001, energy intensity
216
Standard Reviews: CZECH REPUBLIC The Country Reports
191-Standard Reviews 2/12/03 11:14 Page 216

per unit of GDP decreased by 17% at 0.29 toe per thousand US$ of GDP(purchasing power parities). However, it is still 1.6 times higher than the OECDEurope average.
The Czech Energy Agency (CEA) is the state agency responsible for theimplementation of the national energy efficiency programme. CEA selects and co-finances projects but has insufficient financial and human resources(20 staff) to implement the programme objectives. Funding for energyefficiency projects is also provided by the State Environmental Fund.
Substantial additional efforts from governmental organisations appear to berequired to make full use of the large energy savings potential, which has beenestimated at minimum 20%. Improving energy efficiency at low or no cost willincrease competitiveness and household welfare.
In an effort to converge with EU policies on renewable energy, the governmentaims to increase the share of renewable energy sources to at least 6% of TPESand 8% of the gross power production by 2010. In 2002, this sharerepresented 2.2%, with biomass accounting for 77% of the total amount. Oneof the important tools to achieve this objective is the State Programme for thePromotion of Energy Savings and for the Use of Renewables.
The main potential for development includes biomass, biogas, small hydropowerand solar water-heaters. In 2003, ERO enacted a regulation providing higherminimum purchase tariffs for electricity generated from renewable sources.This regulation is to be modified at the end of the first year of its implementation.The West Bohemia distribution company became the first electricity distributorto offer renewable electricity to its customers. The Ministry of Agriculturesupports energy crops used to produce biofuels.
COAL
Coal, mainly brown coal, continues to be the dominant fuel produced in theCzech Republic and is the largest contributor to TPES, primarily for powergeneration. Its share has continued to decrease in the consuming sectors(mainly coking coal in iron and steel industries).
In 2002, 48.9 Mt of brown coal including lignite (2001, 51.0 Mt) and 14.5 Mtof hard coal (2001, 15.1 Mt) were mined.
The restructuring process that was initiated in the 1990s to rationaliseproduction and reduce subsidies and losses is still ongoing. In the summer of2003, the government initiated the procedure to privatise the two remaininglarge state-owned brown coal mines, Severoceske Doly (Northern Bohemia)and Sokolovska ubelna (Western Bohemia). The sales are restricted to miningcompanies not operating in neighbouring countries and without assets in
217
The Country Reports Standard Reviews: CZECH REPUBLIC
191-Standard Reviews 2/12/03 11:14 Page 217

other energy sources. The other major brown coal mine, Mostecka ubelnaspolecnost (Northern Bohemia), was acquired in 1999 by Investenergy(Appian Group).
In 2002, the second largest hard coal producer CMD stopped its operation inthe Kladno basin, but continues its mining activities in the Ostrava-Karvinábasin. With the objective of phasing out the activity of OKD, the biggest hardcoal producer in the Czech Republic, part of the company was sold in 2002 tothe state enterprise Diamo, which specialises in the liquidation of reducedmining capacities and rehabilitation of mining sites.
OILCrude oil imports currently account for 98% of oil supply. The modernisationof the Kralupy refinery has increased demand for lighter international crude.In 2001, these supplies, which transit through the IKL pipeline that isconnected to Germany, accounted for 36% of total imports. Russian imports,delivered by the Druzhba pipeline, continue to provide the bulk of imports(64%). Net oil imports in 2002 reached 8 Mtoe.
The Ceská rafinérská, which comprises the Litvínov and Kralupy refineries, isjointly owned by the Czech oil and chemical company Unipetrol (51%shareholder), and the international oil companies Shell, Conoco and Agip(49%). The shareholders of the Ceská rafinérská have agreed that fromAugust 2003 the company will be limited to processing crude oil.
At the end of 2001, the government launched the privatisation of Unipetrol,which has the highest revenue among Czech-owned industrial companies. InFebruary 2002, the government’s 62.99% share in Unipetrol was sold toAgrofert Holding. However, Agrofert did not meet the financial obligationsassociated with the purchase and consequently in September 2002 thepurchase contract was cancelled. The government decided that the Ministry of Finance would prepare a public tender for the privatisation of Unipetrol,which is expected to be promulgated by the National Property Fund before31 October 2003 latest.
The second largest retail network in the Czech Republic was the state-ownedBenzina. Benzina was sold to the state-owned Cepro, which operates the retailnetwork under its new trade name EuroOil.
The Czech Republic has continued to consolidate its oil supply security system,with state-owned emergency oil stocks representing over 80 days equivalentof consumption. An additional 20 to 30 days of commercial stocks werereported by oil companies and, according to the IEA, the Czech Republic hasover 100 days of oil stocks. Emergency oil stocks were used to a limited extentduring the 2002 flooding. New storage capacities for crude oil (125 000 m3)and petroleum products (40 000 m3) will be operational at the end of 2003.
218
Standard Reviews: CZECH REPUBLIC The Country Reports
191-Standard Reviews 2/12/03 11:14 Page 218

NATURAL GAS
Imports (9.7 bcm in 2002) account for almost all gas supply and come mainlyfrom Russia (73%) and Norway (27%). The country is an important transitroute from Russia to Western Europe, which receives 25% of its supplythrough this route.
In 2002, the natural gas sector (Transgas and eight distribution companies)including transit, was sold to a single investor, RWE GAS for €4.2 billion. In2003, RWE acquired the remaining 3% of the Transgas shares owned by theState and is required to divest its upstream interest (MND) to Ruhrgas incompliance with anti-monopoly regulation.
A partial opening of the gas market has been initially planned for 2005. TheCzech Republic will organise the gas market in compliance with the EUAccession Treaty and with the mandatory EU directives.
NUCLEAR
Despite protests from neighbouring countries, notably Austria, and the factthat both the construction costs and commissioning date were exceeded, theTemelin nuclear power plant has been fully operational since April 2003. Thetwo hybrid Soviet-Western design reactors (1.8 GW) supply about 15% of thetotal electricity generation and have increased the share of nuclear in thepower mix from 18% in 2000 to 40% in 2002. The second nuclear powerplant, Dukovany, has been progressively upgraded and should operate until2025.
According to CEZ, the operator of the country’s two nuclear plants, the totalcost of the construction of the Temelin plant amounted to Kcs 98.6 billion andKcs 26.7 billion for the upgrading of Dukovany.
In May 2002, the government authorised the last operating uranium mine atDolní Rozínka to continue activities up to the year 2005. It also approveda strategy on radioactive waste.
ELECTRICITY
Between 2001 and 2002, total domestic electricity consumption droppedslightly by 0.2% from 53.8 TWh to 53.7 TWh. Industry remains the largestconsuming sector (35%), followed by households (22%).
In 2002, the net exports balance accounted for 22% of gross generation(11.4 TWh, of which exports are 16.6 TWh and imports 5.2 TWh). The CzechRepublic exports electricity principally to Germany and imports mainly from
219
The Country Reports Standard Reviews: CZECH REPUBLIC
191-Standard Reviews 2/12/03 11:14 Page 219

Poland. Exports have remained constrained by transmission capacity and the saturation of European markets, which depressed the prices. Severaldistribution companies import electricity directly (1.1 TWh) via 110 kV lines.
The Czech electricity market has entered into a new phase of transformationwith its gradual opening to competition and its future integration in the EUinternal electricity market. This process is accompanied by the establishmentof a new institutional structure.
In 2001, the Electricity Market Operator (EMO) was established as a state-owned stock share company and began its activities in 2002. EMO isresponsible for organising the short-term electricity market, includingprocessing of demand and offer balances on the short-term electricity market.
The Czech transmission system operator (CEPS) was originally a 100%subsidiary of CEZ. In March 2002, the government decided to transfer themajority ownership (66%) from CEZ to the National Property Fund and theMinistry of Labour and Social Affairs. These shares were later partly transferredinto the newly established Social Insurance Company. CEPS provides electricitytransmission services for users of the Czech transmission system within Europeaninterconnected power systems and dispatching for the Czech power system.
The Energy Regulatory Office (ERO) exercises regulation in the energy sectorand is responsible for designing the relevant secondary legislation determinedby the Energy Act. The Office for the Protection of Competition (UOHS) hasalso played a role in the restructuring of the sector in order to develop acompetitive market.
In January 2002, the first stage of the electricity market opening wasimplemented and consumers above 40 GWh per year, equivalent to 30% oftotal sales, were given the opportunity to choose their own suppliers. In January2003, the next stage of the market was opened for consumers above 9 GWh peryear, equivalent to 40% of the market. The proportion of clients who switchedto new suppliers during the first year has been estimated at 5% of the market.
In 2002, the power mix was dominated by coal (67%) and nuclear (25%). Thecommissioning of the Temelin plant has increased nuclear’s share in the powermix and the baseload overcapacity from 50% in 2000 to 70% in 2003. Grossgeneration rose from 64.2 TWh in 1999 to 76.0 TWh in 2002.
The electricity industry structure is characterised by the dominance of CEZ inthe domestic market. In 2002, CEZ’s share in the domestic market dropped to56.6%. The independent power producers (IPPs) have increased their share to33.7% and imports account for the remaining 9.7%.
In early 2003, the government decided to integrate the shares of the eightpower distribution companies to CEZ, which acquired majority stakes in five of the companies and minority shares in the remaining three. However, the
220
Standard Reviews: CZECH REPUBLIC The Country Reports
191-Standard Reviews 2/12/03 11:14 Page 220

Office for the Protection of Competition has conditioned its approval of themerger pending the sale of the three minority and one majority stakes as wellas its remaining shares (34%) in CEPS.
Thirty-two per cent of CEZ’s capital is floated on the stock exchange. Thegovernment intended to sell its majority stake in CEZ (67%) but did notconclude the international privatisation tender process during 2001 and2002. No privatisation plans for CEZ are foreseen before 2006.
DISTRICT HEATING
Heat is an important energy for households and major industries, accountingfor 17% and 21% of their final consumption, respectively. Coal remains themain fuel (63%) to generate heat, followed by gas (26%). Wastes andrenewables (mainly biomass) share has increased to 5%. The principal heatgenerators are also independent power producers, which are mainly privately-owned.
RESEARCH AND DEVELOPMENT
The National Research & Development Programme provides funding forprojects selected from all sectors of the national economy. Although there isno special budget for energy projects, the programme’s priorities includenuclear safety, the use of coal for energy purposes, energy efficiency and theuse of renewables.
The Ministry of Industry and Trade has initiated the procedure for the CzechRepublic to participate in the IEA Implementing Agreement on EnergyConservation in Buildings and Community Systems. The country became aContract Party by signing the agreement in March 2003 in Paris.
221
The Country Reports Standard Reviews: CZECH REPUBLIC
191-Standard Reviews 2/12/03 11:14 Page 221

191-Standard Reviews 2/12/03 11:14 Page 222

NEW ZEALAND
GENERAL ENERGY POLICY
The government’s general energy policy objectives and framework are set outin the “Energy Policy Framework” released in October 2000. The governmentis committed to seeking a sustainable and efficient energy future by ensuringthat energy services are delivered to consumers in an efficient, fair, reliableand sustainable manner. Current and future policies will aim to achieve thefollowing objectives:
● Environmental sustainability, including continuing to improve energy efficiencyand a progressive transition to renewable sources of energy.
● Consumer costs and prices should be as low as possible, while ensuringthat prices reflect the full costs of supply, including environmental costs.
● Reliable and secure supply of essential energy services.
● Fair pricing in order that the least advantaged in the community haveaccess to energy services at reasonable prices.
● Continued public ownership of publicly-owned assets.
ENERGY SUPPLY AND DEMAND
In 2002, New Zealand’s total primary energy supply (TPES) was 18.38 Mtoe,a 0.4% rise from the previous year. Oil and gas dominated the energy supply,with 36% and 28% of TPES respectively, followed by geothermal with 11%and hydroelectricity with 11%.
Total final consumption of energy (TFC) was 13.7 Mtoe, a drop of 1.1% fromthe previous year. Oil was the predominant fuel used directly by the consumer,representing 42% of total demand, followed by electricity at 21% and naturalgas at 20%. In 2001, industry accounted for 44% of TFC, transportation for36% and other sectors (primarily residences) for 20%.
ENERGY AND THE ENVIRONMENT
In December 2002, New Zealand ratified the Kyoto Protocol and committedto keep its greenhouse gas emissions at 1990 levels during the initial2008–2112 period.
223
191-Standard Reviews 2/12/03 11:14 Page 223

In October 2002, the government confirmed New Zealand’s climate changepolicy framework. The National Energy Efficiency and Conservation Strategy(NEECS) is one of the framework’s “foundation policies” together with theGrowth and Innovation Framework, the New Zealand Transport Strategy(under development), the New Zealand Waste Strategy, climate changeresearch and a partnership with local government to address climate changeat a local level.
Key measures and actions in the climate change policy include the following:
● A charge will be applied to emissions from fossil fuels and industrialprocesses during the Kyoto Protocol’s initial commitment period. Thecharge will approximate the international emissions price, but be capped atNZ$ 254 per tonne of carbon dioxide (CO2) equivalent. Revenue from thistax will be recycled into programmes such as funding climate changeprojects. The government retains the option of introducing emissionstrading as an alternative to an emissions charge if the international carbonmarket is functional and the price is consistently and reliably below theNZ$ 25 cap.
● Provision of government incentives for climate change projects that willdeliver defined reductions in GHG emissions, in any sector of the economy.Incentives might include money or the pre-allocation of emission units. Thegovernment will invite bids from firms or groups via a contestable process.To qualify, projects must go beyond business-as-usual plans.
● Negotiated Greenhouse Agreements (NGAs) for firms and industries wherethere is significant risk to their international competitiveness. NGAs wouldcomprise a contractual commitment by the firm or industry to achieveinternational best practice in managing emissions, in return for exemptionfrom all or part of the emissions charge.
● Exemption for the agricultural sector’s non-CO2 emissions from any pricemeasure (emissions charge or trading regime) in the first commitmentperiod, provided the sector invests in research to identify options forreducing agricultural emissions. The government retains the option ofimposing a levy if the research effort falls short of its targets.
● Government retention of the sink credits and associated liabilities allocatedto New Zealand under the Protocol in recognition of the carbon sink valueof post-1990 forest plantings. These credits will be retained and managedby the government, at least during the first commitment period.
● An amendment to the Resource Management Act (RMA) to remove theregional councils’ ability to directly control GHG emissions through resource
224
Standard Reviews: NEW ZEALAND The Country Reports
4. In 2002, NZ$ 1.0 equalled US$ 0.462.
191-Standard Reviews 2/12/03 11:14 Page 224

consents and regional plans, given that emissions will be dealt withthrough national policies. Further RMA measures are being consideredrelating to prioritising renewable energy and adaptation to the effects ofclimate change.
ENERGY EFFICIENCY
The National Energy Efficiency and Conservation Strategy (NEECS) wasapproved in September 2001. The NEECS aims to continue to improvenational energy efficiency with a target of at least a 20% improvement ineconomy-wide energy efficiency by 2012. It also addresses goals for renewableenergy supply described in the renewable energy section below.
The NEECS consists of five Action Plans in the following areas: buildings andappliances (residential/commercial), industry, transport, central and localgovernment, and energy supply. The Ministry for the Environment and theEnergy Efficiency and Conservation Authority (EECA), in particular, areworking on the policy and implementation aspects of the government’scommitment to energy efficiency and energy conservation.
RESIDENTIAL/COMMERCIAL SECTOR
The NEECS’s energy efficiency and conservation policies in the residential/commercial sector include revision of the Building Code, minimum energyperformance standards, the Energy Saver Fund, socially focused residentialretrofits, and research.
The government approved mandatory energy performance standards andenergy performance labelling for selected electrical products as specified inthe NEECS. From 1 April 2002, mandatory energy performance labelling wasrequired for a range of domestic appliances.
The Energy Saver Fund has been renamed the EnergyWise Residential GrantsFund. In 2000-2001 the government allocated NZ$ 1.1 million to EECA toadminister a Maori Healthy Housing and Employment Pilot as part of its Maori Housing Strategy. The project successfully delivered house retrofits to788 households resulting in an estimated 20 million kWh of energy savingsover the lifetime of the measures, equating to 12 600 tonnes of CO2 reductions.
INDUSTRY SECTOR
The government is redeveloping and relaunching the successful EnergyWiseCompanies Campaign. This programme has established effective partnerships
225
The Country Reports Standard Reviews: NEW ZEALAND
191-Standard Reviews 2/12/03 11:14 Page 225
between the government and the industrial and commercial sectors, therebydirecting management attention to the identification and implementation ofcost-effective energy-efficient practices and technologies.
Over 600 of New Zealand’s largest companies are actively committed to thecampaign. These companies are implementing energy management practicesand drawing support from the EECA’s best-practice advisers and technicalliterature. Additional tools are being developed and a number of partnershipsare being explored to help small businesses reduce energy costs.
A further component of the EECA’s commitment programme is the provisionof Crown Energy Efficiency Loans (13 loans were issued between July 2001and June 2002 totalling over NZ$ 980 000).
TRANSPORT SECTOR
The EECA’s energy efficiency and other transport-related policies as set out inthe NEECS focus on fleet management, policy and pricing, behaviour changeand research. The EECA has successfully established fleet management fuelmonitoring trials and benchmarking web-based software.
Transport behaviour change initiatives included launching the Walking SchoolBuses Campaign, co-ordinating the first National Walk a Child to School Day,public transport seminars and establishing relationships with key transportorganisations.
Research activities included demand management initiatives such as theGreen Travel Plans involving a partnership with the New Zealand Police. Aninvestigation was undertaken on transport energy issues from economic andother perspectives to help prioritise the EECA’s transport-related energy efficiencyinitiatives.
The EECA’s work on eco-efficient vehicles will include efficiency standards forvehicles, subject to detailed proposals reported to the government as part ofits climate change work programme. This work is directed by the NEECS’smajor short-term proposal to investigate measures to improve vehicle fuelefficiency.
CENTRAL AND LOCAL GOVERNMENT
The Government Leadership Programme encourages energy efficiencyimprovements within public sector agencies and institutions. At present thevoluntary scheme involves 34 government agencies. An energy saving goal of15% by 2005 over 2000 levels has been set, equivalent to energy savings ofNZ$ 14 million and CO2 emissions savings of about 75 000 to 100 000 tonnes
226
Standard Reviews: NEW ZEALAND The Country Reports
191-Standard Reviews 2/12/03 11:14 Page 226
per year. The scheme will be expanded to include the wider state sector, forexample hospitals, schools and defence, with emphasis on agencies spendingover NZ$ 100 000 per year on energy. The proposal would require investmentof NZ$ 30-40 million. The programme is considered to be the basis for seekingsimilar commitments from the private sector.
Local government has been targeted through the EnergyWise CouncilsProgramme. A similar 15% energy efficiency target for local government hasbeen set in the NEECS. Priority has been given to information disseminationthrough newsletters, seminars and forums, and improved monitoring,reporting, benchmarking and ranking among member councils. Priority hasalso been given to special efficiency projects in street lighting, water andsewage pumping.
MONITORING PROGRESS TOWARDS THE NEECS TARGETS
The methodology to measure progress towards the NEECS targets hasincluded establishing the base year for the targets and indices to measureprogress. The EECA is measuring and communicating progress through use ofa national energy efficiency index. This index is being built up from acomprehensive programme of sectoral and sub-sectoral monitoring thatincludes the development of a number of key indicators for each sector. Someof the necessary monitoring information already exists, but further expansionis required. The EECA is identifying data gaps, determining key monitoringindicators, and undertaking sector studies to fill data gaps. Sector studiesundertaken during the past 12 months include local government and thedairy, timber processing and meat industry sectors.
RENEWABLES AND NON-CONVENTIONAL FUELS
Nearly 30% of New Zealand’s TPES comes from renewable energy sources,including 13% from geothermal, 10% from hydroelectricity, 6% from biomassand 0.4% from solar and wind technologies.
In October 2002, the government released New Zealand’s renewable energytarget to have an additional 30 petajoules (PJ) per year from renewablesources in 2012 compared to 133.5 PJ in 2000. Some of the measures toachieve the target are being implemented as part of the government’s ClimateChange Policy Package, while the other measures will be part of theRenewable Energy Programme administered by the EECA.
Three important climate change measures are the “Projects” mechanism,Negotiated Greenhouse Agreements (NGAs) and an emissions charge. The“Projects” mechanism is being established as an incentive for actions that
227
The Country Reports Standard Reviews: NEW ZEALAND
191-Standard Reviews 2/12/03 11:14 Page 227

provide cost-effective GHG emissions reductions before and during the KyotoProtocol’s first commitment period. It will be a competitive bid-in funddesigned to support a range of GHG reduction projects, including renewableenergy projects. The NGAs will encourage the use of renewables because firmsentering into these agreements can meet their commitments in some cases byreducing the GHG intensity of their operations through the use of renewableenergy. The carbon emissions charge will increase the price of fossil fuels relativeto most renewable energy sources, thus increasing their competitiveness.
The Renewable Energy Programme is another effort within the NEECS tosupport renewable energy by engaging stakeholders and minimising barriersthat inhibit the full potential of renewable energy. The programme aims tocover information and communication, education and training in renewableenergy, identifying and prioritising research needs, supporting pilotprojects/demonstrations, standards setting, market development, capacityenhancement and business development and government leadership.Responsibility for implementing these measures rests largely with the EECAand the Ministry for the Environment.
COAL
In 2002, New Zealand had 1.3 Mtoe of coal primary energy supply. Coalproduction in 2002 was 2.73 Mtoe, an increase of 0.36 Mtoe on the previousyear. About 55% of coal mined in New Zealand is exported and there are noimports. Solid Energy is the dominant coal producer in New Zealand,accounting for over 75% of all coal produced in 2001.
OIL
In 2002, New Zealand produced 1.7 Mtoe of crude oil, condensate andnaphtha, a 7% decrease from 2000. About 85% of this production wasexported, mostly to Australia, Japan and the US, and the remaining 15% wasused for feedstocks at the Marsden Point Refinery. New Zealand also hassubstantial imports and, when considered on a net basis, New Zealandimports 70% of its oil supply.
In 2001, 18 wells were drilled in three petroleum basins. All of the wells weredrilled onshore. The 2001-2002 onshore and nearshore Taranaki BiddingRound attracted 41 bids for 26 blocks on offer and resulted in 21 new permitsbeing granted in August 2002. In September 2002, the government openedthe Deepwater Taranaki Bidding Round. Five blocks were placed on offertotalling 42 000 km2 of unexplored acreage adjacent to the highly productiveTaranaki basin. Planning is also under way for an onshore/offshore CanterburyBidding Round and a new Taranaki Bidding Round. As of November 2002,there were 69 onshore and offshore exploration permits in New Zealand.
228
Standard Reviews: NEW ZEALAND The Country Reports
191-Standard Reviews 2/12/03 11:14 Page 228
There have been two new oil discoveries since 2000. The Goldie discoverywithin the Ngatoro mining permit has been flowing at up to 700 barrels of oilper day (currently shut in) and in south Taranaki the Kauri discovery appearsto have the potential to produce oil and gas over multiple zones.
The government sets minimum quality standards for petrol and diesel in thePetroleum Products Specifications Regulations. The regulations affect theperformance of fuel and the limits for components that could be harmful tothe environment or to public health. In 2001, the government undertook thefirst comprehensive assessment of these regulations since their inception. Prioramendments to the regulations eliminated the use of lead and reduced theamount of permissible total aromatics in petrol.
The review considered consumers, industry, health, safety, environmental andquality issues when developing recommendations for petrol and diesel withinthe New Zealand context. New regulations came into force in September 2002and will be introduced in phases until January 2006. Major changes to thepetrol regulations include lowering the allowable levels of benzene and totalaromatics, prohibiting the use of methyl tertiary butyl ether (MTBE), restrictingthe acceptable manganese content and permitting the use of up to 10%volume ethanol as a blending agent. For diesel, major changes include thelowering of allowable levels of sulphur, decreasing the maximum acceptabledensity, increasing the minimum permissible cetane number and introducingstandards for filterability and polycyclic aromatic hydrocarbon content.
NATURAL GAS
Natural gas is critical to the New Zealand economy, providing 30% of TPES.All gas is produced domestically with no imports or exports. About 48% of gasis used for electricity generation and in the winter of 2001, additional gas wasused to meet electricity demand given low hydro output that winter. Thirty-seven per cent of gas is used for petrochemical production, mainly Methanexproducing methanol, and 15% is used directly in the industrial, commercialand residential sectors.
New Zealand’s gas sector is in transition owing to the expected depletion ofsupply from its largest gas field, the Maui field (currently 80% of supply).Depletion was anticipated around 2009 but is now expected to occur twoyears earlier or possibly even sooner. The government’s direct commercialinvolvement in gas ends in 2009 with the termination of the Maui contract.
In order to improve the efficiency of the sector, the government initiated awide-ranging review of the gas sector in February 2001, which resulted in the release in November 2002 of a draft government policy statement(“Development of New Zealand’s Gas Industry”), which will be subject tocomment in the next few months before a final statement is released.
229
The Country Reports Standard Reviews: NEW ZEALAND
191-Standard Reviews 2/12/03 11:14 Page 229

The government’s objective for gas is to “ensure that gas is delivered toexisting and new customers in an efficient, fair, reliable, and environmentallysustainable manner”. To meet this objective, the government has announcedthat it favours industry-led solutions where possible, but is prepared to useregulatory solutions where necessary.
To enable the development of industry-led solutions, the government hasinvited the gas industry to establish a governing entity and decision-makingprocess to manage the further development of gas market arrangements. Thegoverning entity must develop a work programme that allows for efficient gasmarket arrangements. It must be representative of all stakeholders, includingconsumers, and have an independent chair. The government intends thegoverning entity to:
● Improve arrangements for the wholesale trading of gas.
● Develop an open access regime for all transmission pipelines.
● Develop standard terms and conditions for accessing distribution pipelines.
● Develop model contracts for consumers.
● Develop standardised arrangements for customer switching.
● Establish an independent system for handling consumer complaints.
The government considers open access to the Maui pipeline as being criticalto promoting the efficient delivery of gas. The government intends to facilitatethe process of amending the Maui contracts (in which the government has asignificant commercial interest) so that non-Maui gas can be transportedthrough the Maui pipeline. The government has invited the companiesinvolved to present it with a proposal that provides open access to the Mauipipeline.
The debate in New Zealand on whether pipeline prices are excessive has ledthe government to request the Commerce Commission, under section 56 ofthe Commerce Act, to report on whether increased regulatory control shouldbe introduced for gas pipelines.
In the meantime, the government has decided to further develop the Gas(Information Disclosure) Regulations 1997. As part of these changes,Optimised Deprival Value (ODV) will be formalised in the informationdisclosure regime as an interim measure because of the following:
● While ODV is currently used by gas pipeline companies, there is no assuranceof consistent application of valuation rules (this can impact on profit measures).
● Regulated ODVs provide a firm basis for making any commercial gaintransparent.
230
Standard Reviews: NEW ZEALAND The Country Reports
191-Standard Reviews 2/12/03 11:14 Page 230

ELECTRICITY
The New Zealand electricity industry has experienced a major structural reformmoving from a centrally controlled system to a market-based competitivemodel. In 2000, a Ministerial Inquiry into the electricity industry led to furtherreform, a central tenet of which is the government’s desire for industrysolutions where possible, with regulation only where necessary.
In December 2000, this inquiry resulted in a government policy statement(GPS), designed to improve market functioning. It sets out expectations forpolicy delivery through industry self-governance and details the specificmarket improvements sought by the government, including:
● Disclosure of information on hydro spill, spot market bids by generators andhedge and contract prices.
● Real-time pricing and improved demand-side management.
● Low fixed charges for low-use consumers.
● Participation by all network and retail companies in a consumer complaintsresolution scheme.
● Model consumer contracts and prepayment meters.
● Improved arrangements for distributed generation.
● Forecasts of security of supply.
● Arrangements for making grid investments and agreeing on transmissionpricing.
New Zealand’s dependence on hydro electricity, coupled with low lake levelsand unusually high demand resulted in an electricity shortage in the winter of2001. Following the shortage, the government conducted a review of the waythe country’s electricity system functioned over the winter.
The review concluded that the electricity price spot market worked much asexpected, with very high prices signalling an increasingly tight supply situationand record demand, and that the market would have worked better if thereforms specified in the GPS had been fully implemented, for example:
● Projections of system adequacy.
● Disclosure of forward hedge prices.
● Disclosure of generator offer prices into the market.
● Development of real-time spot market pricing and promotion of demand-side participation.
231
The Country Reports Standard Reviews: NEW ZEALAND
191-Standard Reviews 2/12/03 11:14 Page 231

● Arrangements for new transmission investments to relieve constraints.
● Development of financial instruments to manage transmission risk.
In light of concerns about high spot prices and the findings of the electricitysector inquiry, the government amended the GPS with the ElectricityAmendment Act 2002. This amendment requires public disclosure ofgenerator offers on the wholesale market after two weeks rather than threemonths. This will give consumers and other interested parties an earlyopportunity to seek explanations from generators if questions arise aboutoffer behaviour and prices.
The government also advised the electricity industry that it will considertaking further measures if effective retail competition does not transpire. Thegovernment considers that there are sufficient electricity retailers in themarket for effective competition to occur, but only if regional monopolies donot develop.
ELECTRICITY GOVERNANCE ESTABLISHMENT COMMITTEE AND THE ELECTRICITY COMMISSION
The industry established the Electricity Governance Establishment Committee(EGEC) to develop a draft rulebook combining existing industry rules andenhancements required by the GPS. In December 2001, an application wasmade to the Commerce Commission to authorise the proposed self-governancearrangements, as it was likely that, without authorisation, the arrangementswould have been in breach of the Commerce Act. Authorisation, withconditions, was granted in September 2002, but this was appealed by someparties, including the state-owned transmission company, Transpower. TheEGEC continued to develop the necessary self-governing arrangements for theindustry.
In the first half of 2003, decreased rainfall again produced a shortfall inavailable electricity with prices beginning to rise in April 2003. A successfulenergy conservation campaign and higher rainfall during the latter part of2003 helped to avert any customer shortages. However, this near-crisisrenewed calls for a more reliable electricity industry able to avert the types ofshortages the country had experienced in two of the previous three years.Members of the EGEC continued their negotiations to determine suitablearrangements, but no solution suitable to all parties was found and the EGECbecame defunct.
The government responded by creating the Electricity Commission, which isresponsible for contracting with generators to provide reserve thermal powerto be used during dry years. This reserve power will be withheld from the
232
Standard Reviews: NEW ZEALAND The Country Reports
191-Standard Reviews 2/12/03 11:14 Page 232

market during normal years to avoid market distortion. Consumers will pay forthis reserve capacity through a special charge on their bills that is notexpected to exceed 0.5% per unit of electricity purchased. Sufficient reservecapacity will be built up over a three-year period to meet any electricityshortfall in a one-in-60 dry year.
MARKET DEVELOPMENTS
Since the last in-depth review, some specific improvements to marketarrangements have occurred, particularly with regard to opportunities forlarge consumers to participate in the wholesale electricity market.
● Hydro spill: Since April 2002, each hydro generator publicly reports hydrospill information, including the amount of water spilled and reasons for thespill, within four weeks of the end of each quarter.
● Hedge index: In July 2002, a public index for fixed electricity contracts wasestablished. The index is designed to provide some means of establishinga forward price curve for electricity.
● Bids and offers: All generator offers and demand bids from 29 May 2002are made publicly available four weeks after the day on which they aresubmitted.
● RTP trial: Real-time pricing offers electricity purchasers the opportunity toparticipate more effectively in the wholesale price discovery process. InOctober 2002, a three-month trial began in which every half-hour, six five-minute indicative prices will be calculated and published.
● Financial transmission rights: The government is developing a policy onthe introduction of FTRs, which the industry will be expected to implement.
REGULATION OF DISTRIBUTION BUSINESSES
An amendment to the Commerce Act in 2001 establishes a regulatory regime for electricity distribution businesses by providing the CommerceCommission with the regulatory power to declare price control. As part of the overall regime, the Commerce Commission is required to publishperformance thresholds. The thresholds, which are still under development,will act as a screening mechanism. If a distribution business breaches athreshold, the Commission can investigate the performance of that businessto determine whether it should be placed under price control. The firstassessment of distribution businesses against the thresholds is expected bymid-2003.
233
The Country Reports Standard Reviews: NEW ZEALAND
191-Standard Reviews 2/12/03 11:14 Page 233

ELECTRICITY COMPLAINTS
In January 2002, in response to a government request, an ElectricityComplaints Commission Scheme and an associated code of practice was setup to create a one-stop-shop where consumers can get independent help withcomplaints about their electricity company. The scheme covers distributioncompanies and retail companies. Under the scheme, every member companyagrees to maintain the minimum standards set out in the code of practice. Thescheme is funded by its members, but is fully independent of the industry.
COMPETITION
The electricity shortages in the winter of 2001, which caused significantincreases in spot prices and the subsequent demise of a major retailer, haveincreased incentives for generators to balance their generation-retail portfolio. A trend towards increased “regionalisation” has emerged, with generatorspreferring to retail in areas close to their source of generation. Nevertheless,partly owing to government directives, the level of retail competition hasimproved, with the proportion of domestic consumers with only one retailerdown to 3% and around 80% of the population now having a choice of threeor more retailers.
RESEARCH AND DEVELOPMENT
The Foundation for Research, Science and Technology (FRST) is responsible forinvesting the majority of public money in research and development. At anyone time FRST has approximately NZ$ 11 million per year allocated to energyprojects. This money is spread among renewables, energy efficiency, oil andgas and other projects. Each year, FRST focuses on and funds different areasof research. In 2001-2002, it focused on two energy portfolios, namelyTraditional Energy Resources and Energy Systems and Management.
In 2002-2003, NZ$ 5.94 million of new funding was made available acrossthese two portfolios. In the Traditional Energy Resources portfolio, NZ$ 4.25 mil-lion was made available annually to fund two projects; NZ$ 3.8 million peryear for six years was allocated to the Institute of Geological and NuclearSciences (IGNS) to fund work on “Basin Evolution and Petroleum Potential”,and NZ$ 450 000 per year for six years was allocated to the University ofWaikato to fund work on “Improving the Discovery of Oil and Gas”. In theEnergy Systems and Management portfolio, NZ$ 1.69 million of new fundingwas allocated annually to projects such as a Building Research AssociationProject on Household Energy Efficiency (NZ$ 700 000 for four years) and aNational Institute of Water and Atmospheric Research project on Energy andthe Climate Risk (NZ$ 210 000 for six years).
234
Standard Reviews: NEW ZEALAND The Country Reports
191-Standard Reviews 2/12/03 11:14 Page 234

NORWAY
GENERAL ENERGY POLICY
Norway is a major energy producer and exporter of oil and gas. Its energypolicy is oriented towards meeting the following objectives:
● Added value based on sustainable development.
● Liberalised energy markets.
● Limited energy use through measures stimulating increased energy efficiency.
● Increased production from renewable energy.
● Opening of new petroleum provinces.
● Accommodating the growing influence of international structures such asthe World Trade Organization (WTO), the Organisation for Economic Co-operation and Development (OECD) and the European Union (EU).
● Stability in the oil market.
● Responding effectively to changes in the international energy market,including ongoing mergers among major players and new information andcommunication technology.
The Parliament (Storting) determines the political framework for thepetroleum and energy sectors and resource management. The Ministry ofPetroleum and Energy has overall administrative responsibility for thesesectors and ensures that activities follow the guidelines drawn up byParliament. The Norwegian Petroleum Directorate and the Norwegian WaterResources and Energy Directorate are subordinate agencies of the ministryand are responsible for the administration of Norway’s petroleum, water andenergy resources. The Ministry of Environment has administrativeresponsibility for the climate change policy. Enova, the new state-ownedagency for promoting energy savings, renewable energy and environment-friendly natural gas solutions, was established on 1 July 2001, and has beenoperational since 1 January 2002. The Research Council of Norway isresponsible for publicly funded energy research and development (R&D).
In 1991, a carbon dioxide (CO2) tax was imposed on fossil fuels used forenergy purposes. In 2005, where technically possible, a scheme will beintroduced for early trade in greenhouse gas emissions from sources that arecurrently exempted from the CO2 tax. (Further details on the scheme for tradeare described in the Energy and the Environment section below.) Fossil fuels
235
191-Standard Reviews 2/12/03 11:14 Page 235

are also charged a SO2 tax. In 2002, a general value-added tax was appliedat a level of 24%. Table 1 shows CO2 and SO2 taxation on different fossil fuelsin 20025.
In 2001, the tax on electricity consumption was NKr 0.113 per kWh. On1 January 2002, the tax was reduced to NKr 0.093 per kWh. In 2000, a basictax on fuel oil was introduced to avoid increased use of heating oil after anincrease in the electricity tax from NKr 0.0594 per kWh in 1999 to NKr 0.0856in 2000. In 2002, the basic tax on fuel oil was NKr 0.389 per litre.
Manufacturing industries, mining and quarrying, greenhouse nurseries andhouseholds in northern Norway are exempted from the electricity tax. On20 March 2003, the Finance Minister, Per-Kristian Foss, announced that theexemptions would be extended to all commercial entities. This action wasprompted in part by the involvement of the EU surveillance committee (ESA)which claimed the exemptions amounted to state aid to the exemptedindustries and thus violated Norway’s European single market obligations.While ESA cannot influence overall taxation levels in Norway, it can commenton preferred tax treatment of selected industries. The tax cuts will beintroduced in 2004 and phased in over a two-year period, costing thegovernment up to NKr 500 million annually in lost revenue.
ENERGY SUPPLY AND DEMAND
In 2002, Norway’s total primary energy supply (TPES) was 27.7 Mtoe, a 4.1%rise from the previous year; 40% of the TPES came from hydroelectricity, 21%
236
Standard Reviews: NORWAY The Country Reports
5. In 2002, one Norwegian krone (NKr) was equal to US$ 0.125.
Table 1
CO2 and SO2 Taxation on Fossil Fuels, 2002
Product Carbon Dioxide Sulphur Dioxide
Coal and coke 0.49 NKr/kg
Fuel oil 0.49 NKr/litre 0.07 NKr/litre
Gasoline, leaded 0.73 NKr/litre
Gasoline, unleaded 0.73 NKr/litre
Oil, offshore 0.73 NKr/litre
Gas, offshore 0.73 NKr/Sm3
191-Standard Reviews 2/12/03 11:14 Page 236

from oil and 35% from natural gas. Norway has no nuclear facilities. In 2001,total final consumption of energy (TFC) was 21.2 Mtoe, a rise of 4.3% fromthe previous year. Electricity was the predominant fuel used directly by theconsumer, representing 46% of total demand, followed by oil at 40% andbiomass at 6%. Natural gas accounted for only 3% of the country’s TFC. In2001, industry accounted for 44% of TFC, transportation for 22%, and othersectors (primarily residences) for 34%.
Norway is a substantial producer and exporter of petroleum and natural gas.In 2002, Norway produced 145.8 Mtoe of crude oil and 14.7 Mtoe ofNGL/condensates, of which about 95% was exported. The country produced54.9 Mtoe of natural gas, exporting 99%. In 2002, Norway was the world’sseventh-largest oil producer (including NGL), and the third-largest oil exporter.It is the largest supplier of gas to north-west Europe, supplying about 13% ofEurope’s gas market. Based on the proven recoverable gas resources,Norwegian gas supply is likely to increase in the future.
ENERGY AND THE ENVIRONMENTNorway signed the Kyoto Protocol in April 1998 and ratified it in May 2002.The Norwegian commitment under the Kyoto Protocol is to limit the increasein greenhouse gas emissions to 1% above 1990 levels in the first commitmentperiod 2008-2012. CO2 emissions account for about 75% of total GHGemissions and have risen 33%6 from 1990 to 2001.
The energy sector accounts for about two-thirds of Norwegian GHG emissions.Road traffic and oil and gas production are the largest sources in this sector.Process-related industrial emissions from the production of metals, mineralsand chemicals are the second-largest source. In 2001, the oil and gas industryaccounted for 24% of CO2 emissions, road traffic for 22%, stationary combustionfor 20% and industrial processes for 17%. Since electricity is generated almostexclusively from hydropower, emissions from stationary combustion are dominatedby industrial sources.
In 2002, Parliament approved the former government’s June 2001 White Paperand the present government’s March 2002 supplementary White Paper onClimate Change Policy. On the basis of these papers, the government hasimplemented a framework to pursue the necessary climate change mitigationstrategy.
Up to 2008, the government will pursue a number of climate-related measures.These measures include continuing to levy the CO2 tax at the current level and
237
The Country Reports Standard Reviews: NORWAY
6. Owing to differences in methodology and definitions estimating energy-related CO2 emissions,the IEA statistics and the official Norwegian figures differ from one another. Norway’s statistics show thatin 1990 energy-related CO2 emissions were 28.4 Mt and in 2001 they were 34.4 Mt, for an increase overthat time of 21%.
191-Standard Reviews 2/12/03 11:14 Page 237
introducing a quota-based domestic emissions trading system for the period2005 to 2007 for industries not currently charged the CO2 tax. Consequently,almost all sectors will be regulated by climate policy instruments, which willfacilitate meeting the Kyoto Protocol requirement to make “demonstrableprogress” by 2005.
A broad domestic emissions trading system covering about 80% of the emissionswill be introduced for the first commitment period 2008-2012. The system willbe compatible with the international emissions trading system under theKyoto Protocol and will be based on the recommendations of the commissionof experts appointed to devise an emissions trading system.
A target has been introduced to reduce the use of mineral oils for heating by25%.
The government’s White Paper on Domestic Use of Natural Gas proposes thatNorway participate in an international mandatory certificate market for greenelectricity. Parliament has approved the government’s proposal that Norwaycontribute to developing an international market for such certificates. Indoing so, the government will keep in mind environmental concerns, securityof supply and an acceptable management of natural resources in Norway.
ENERGY EFFICIENCY AND RENEWABLES
Norway’s per capita energy use is higher than the OECD average but comparablewith its neighbours. In 2001, per capita energy use in Norway was 6.1 toe,while in 1997 it was 5.6 toe and in 1973 it was 5.3 toe. In 2001, per capitaenergy use in the OECD was 4.7 toe and in OECD Europe 3.4 toe. Norway’senergy mix differs from the OECD average and its neighbours in its above-average per capita electricity consumption, which stems from the country’srich supplies of relatively cheap hydropower. Consequently, a large energy-intensive industrial sector has developed and electricity is widely used to heatbuildings and water.
Enova, the new agency for promoting energy savings, renewable energy and environment-friendly natural gas solutions, has been operational since1 January 2002. Enova is a public enterprise owned by the Ministry ofPetroleum and Energy.
Enova’s principal mission is to contribute to energy savings, including theenvironmentally sound and rational use of energy, and the production ofrenewable energy, relying on financial instruments and incentives to stimulatemarket actors and mechanisms to achieve national energy policy goals. Inaddition, Enova is promoting environment-friendly natural gas solutions. The establishment of Enova signals a shift in Norway’s organisation andimplementation of its energy efficiency and renewable energy policy. By gathering
238
Standard Reviews: NORWAY The Country Reports
191-Standard Reviews 2/12/03 11:14 Page 238

strategic policy responsibilities in a small, flexible and market-oriented organisation,Norway intends to have a proactive agency with the capacity to stimulateenergy efficiency by motivating cost-effective and environmentally soundinvestment decisions. Enova enjoys considerable freedom in choosing its strategyand policy measures. It advises the Ministry of Petroleum and Energy onenergy efficiency and renewable energy issues.
Enova aims to achieve the following objectives adopted by Parliament inspring 2000:
● To limit energy use considerably below the business-as-usual scenario.
● To increase the annual use of central heating based on renewable energysources, heat pumps and waste heat by 4 TWh by 2010.
● To install wind power plants with an annual production capacity of 3 TWhby 2010.
● To increase the land-based use of natural gas.
To achieve these objectives, the Parliament will allocate a total of up toNKr 5 billion of grants over a ten-year period. The funding comes from a levyon the electricity distribution tariffs and from ordinary grants over the statebudget. Enova is responsible for establishing incentives and financial fundingschemes for cost-effective and environmentally sound investments.
Enova has organised its activities into main programme areas. Currently,organisations can apply for funding in the following programme areas:
● Heat distribution (infrastructure) and heat generation. Based on renewableenergy sources, such as bioenergy and waste. Enova can contribute up to15% of the total project cost.
● Energy end use/energy efficiency
• Industry: Energy savings and efficiency improvements in industry are targetedby benchmarking and analysis of industrial companies’ energy use.
• Energy management in large commercial buildings: The goal is to reduceenergy use by 100 GWh per year. Project activities that qualify forfunding are energy management, training, dissemination of information,energy monitoring and energy and environmental analyses.
• Energy management in small commercial buildings: The goal of theprogramme is to reduce the need for energy by approximately 70 GWhper year.
• Retrofitting of street lighting: The programme targets owners of largefacilities and outdoor lighting infrastructure who are considering changingexisting light fixtures.
239
The Country Reports Standard Reviews: NORWAY
191-Standard Reviews 2/12/03 11:14 Page 239

• Residential buildings: The programme is aimed at both new homes andthe rehabilitation of the existing building stock in the residential sector.
● Wind energy. Investment subsidies are granted to cost-effective projectsthat would not otherwise have been realised. The maximum level of subsidyis 10% of the total investment. A second programme aims to demonstrateand assist the commercialisation of wind technology suitable forNorwegian conditions by providing a maximum of 60% of approvedproject costs.
● Renewable energy (other than wind). The aim is to facilitate deploymentof new renewable energy technologies, particularly solar space and solarwater heating. Hydropower projects, including production from small, microand mini generation plants are not covered by Enova’s grant schemes.
● Information, advice and campaigns. National television advertisingcampaigns, energy information and advice on technologies and solutionsfor household and commercial end-users.
OIL
The government aims to promote stability and predictability in the oil market.Together with a reasonably high oil price, this will strengthen the basis forinvestments on the Norwegian Continental Shelf (NCS) and improve the energysecurity of oil-consuming countries. Experience in recent years has demonstratedthat a low oil price, even for a short period of time, has negative consequencesfor new activity on the NCS. Oil production peaked in 2000 and is expected toremain at its current level through 2004, at which time it will start to decline.As of 2001, Norway had estimated oil reserves of 9.4 billion barrels.
In November 2001, Norway announced that it would reduce its oil productionto help stabilise the crude oil market. In the first half of 2002, the governmentcut oil production by 150 000 barrels per day to reach a production target ofapproximately 3 million barrels per day. During this period, oil prices started toincrease, and in late June 2002, the government stated that it would notextend the restriction on oil production into the second half of 2002.
The Norwegian oil sector has undergone significant restructuring in the pastseveral years. Statoil is the country’s largest oil company and had at one timebeen 100% state-owned. Statoil managed, but did not own, the State DirectFinancial Interest (SDFI), which represented the government’s holdings in150 production licences representing about 40% of total production. In May2001, Statoil was allowed to purchase 15% of SDFI for US$ 4.2 billion7, and
240
Standard Reviews: NORWAY The Country Reports
7. Or NKr 38.6 billion.
191-Standard Reviews 2/12/03 11:14 Page 240

on 18 June 2001 the government sold 18.2% of its share in Statoil in an initial public offering for NKr 14 233 million or approximately US$ 1.9 billion8. In addition, the government sold 6.5% of SDFI to nine othercompanies for NKr 8.4 billion or US$ 1.1 billion. A new state-owned company,Petoro, was set up to manage the remaining SDFI portfolio, which is stillowned by the State. The SDFI portfolio has a production capacity of about1 million barrels per day of crude oil.
NATURAL GAS
Prior to 1 June 2001, all Norwegian gas was sold through the Gas NegotiatingCommittee (GFU), which consisted of Statoil and Norsk Hydro. Thegovernment-imposed GFU sold gas on behalf of the gas producers on theNorwegian Continental Shelf (NCS). In January 2002, the governmentterminated the GFU and replaced it with individual company-based sales.
On 14 May 2001, the Ministry of Petroleum and Energy established the state-owned Gassco. Since 1 January 2002, Gassco has operated most of the upstream pipeline network. It has no ownership in gas resources orinfrastructure. The company ensures neutrality and efficiency in the operationand development of the upstream pipeline network.
Gassled was created on 1 January 2003 as a unified ownership structure forthe major parts of the upstream pipeline network on the NCS. Theorganisation of the gas transportation activities under one ownership systemallows for more efficient operation and development of the system. Gassco isthe operator of Gassled.
By January 2003, new regulations had been implemented on principles foraccess to the upstream pipeline network. The new access regime is neutral forall users of the transport system and reduces the transaction costs related totransport. Gassco, as a neutral operator, organises the capacity managementand tariffs are listed in the regulations.
In the recent White Paper on Domestic Use of Natural Gas, the governmentpresents a policy to increase natural gas use. Norway has tended to exportalmost all of its natural gas, thereby improving the trade balances. Natural gasis one option to meet Norway’s growing energy demand. Availability of gas isan important factor in increasing its domestic use and the government hassuggested establishing a support scheme for building new gas infrastructure. Theproposed support scheme includes plants and transmission pipelines for LNG
241
The Country Reports Standard Reviews: NORWAY
8. Assuming NKr/US$ exchange rate of 7.50.9. Assuming NKr/US$ exchange rate of 7.50.
191-Standard Reviews 2/12/03 11:14 Page 241

transport. It will not cover distribution grids. The support scheme is proposedto be managed by Enova.
The White Paper also concentrates on the main political element of advancinggas-fired power plants with CO2 capture and storage, with the governmentproposing to do the following:
● Strengthen R&D activities to promote gas-fired power plants with CO2
capture.
● Establish a support scheme for investment in full-scale gas-fired powerplants with CO2 capture from 2006.
● Establish a public company to manage the support scheme for investmentin power plants with CO2 capture.
● Establish a national centre for practical uses of natural gas, targeted atend-users.
● Consider governmental participation in development and management ofCO2 infrastructure, and prepare for enhanced oil recovery and CO2 storage.
Companies on the NCS plan to construct a pipeline from the Ormen Langefield in the Norwegian Sea to the existing upstream pipeline network(Gassled) at Sleipner in the North Sea and from there a pipeline to Easingtonin the United Kingdom. The southern part of the pipeline system from Sleipnerto the UK is expected to have a capacity of 70 mcm (2.4 bcf) per day and willfurther increase the flexibility of the Norwegian upstream pipeline network.The development of this transportation system depends on furtheragreements by the Norwegian and UK governments. The 1 200 km pipelinesystem is expected to cost NKr 15-20 billion.
In August 2002, Norway and the UK jointly released a report, “UnlockingValue through Closer Relationships”, which called for greater co-operationbetween the two countries to ensure that resources are fully exploited withoutinterference from real or perceived barriers. Both countries are now discussinga framework treaty that will facilitate cross-border opportunities.
In May 2002, Parliament approved the development of the Snohvit LNGproject in the Barents region and allowed the State Direct Financial Interestto participate with investments of US$ 1.57 billion in the project. Totalinvestments in the project are expected to reach US$ 5 billion. The projectincludes subsea field development and an LNG plant onshore on Melkøya,close to Hammerfest. The Snohvit scheme is one of the biggest industrialdevelopments in Norway and is expected to produce 5.7 bcm of liquefiednatural gas for 25 years following the planned 2006 production start-up. Gasfrom the field will be transported by pipeline to the onshore facility, liquefiedand transported by ship to customers, for instance in Spain and the UnitedStates. Construction on the project began in June 2002.
242
Standard Reviews: NORWAY The Country Reports
191-Standard Reviews 2/12/03 11:14 Page 242

ELECTRICITY
More than 99% of Norwegian power generation is based on hydropower. In2001, total production was 121 TWh.
In 2001, the Norwegian Water Resources and Energy Directorate reviewed thedata on water inflow to hydropower plants and revised the estimate forhydropower production in a normal year. The earlier estimate was based onthe time series for water inflow for the period 1931 to 1990, whereas the newestimate is based on the period 1970 to 1999. Production in a normal year iscalculated to be about 118 TWh. However, production is highly dependent onyearly precipitation levels. In 2000, the production amounted to 143 TWh.
In December 2001, the state-owned power company Statkraft purchased theindependent electricity company Trondheim Energiverk for US$ 483 million,making Statkraft the second-largest power company in Scandinavia with over50% of the Norwegian market. In January 2001, Prime Minister Stoltenbergdeclared that the era of large-scale new hydropower was finished and severalsuch projects being developed, including Beiarn, Bjollaga and Melfjord, wereabandoned. The present government, which took office after general electionsin the autumn of 2001 and is headed by Prime Minister Bondevik, continuesthis policy.
Norway’s heavy reliance on hydropower caused problems during winter 2002/2003. Below-average precipitation lowered reservoir levels, which reduced theamount of electricity generation available. At the same time, unusually coldtemperatures increased electricity demand. Power prices rose to record highswith household bills two to three times higher than in 2001. Electricity importsfrom Russia, Poland and Germany into the Nordpool electricity exchange areaincreased. Civil servants called for energy conservation in offices and streets,with people being told to turn down heaters and otherwise reduce electricityuse. In addition, many industrial facilities curtailed their electricity use, withsome shutting down operations entirely during the period of high prices. Withthese responses to the unusual weather situation, the Norwegian electricitymarket was able to perform without any serious disruptions.
Norway is considering increased international electricity interconnections as ameans of dealing with the variability of hydropower production, which isdependent on meteorological conditions. The interconnections could be usedto export power in wet years (or seasons) and import power in dry years (orseasons). Imports and exports could also flow on a daily basis, reducing pricesand increasing the security of both regions. Statnett, the Norwegian gridoperator, has applied to the Ministry of Petroleum and Energy for a licence tobuild a 750 km subsea electricity cable between Suldal in Norway and theEasington terminal in the UK. Statnett would build the 1 200 MW cable inconjunction with the UK’s National Grid Transco, sharing the project’sexpected US$ 1.3 billion cost. The cable is planned to come on line in 2007.
243
The Country Reports Standard Reviews: NORWAY
191-Standard Reviews 2/12/03 11:14 Page 243

In 1999, Naturkraft (owned one-third each by Statkraft, Statoil and NorskHydro) was granted discharge permits, allowing it to proceed with plans todevelop two gas-fired power plants. In autumn 2000, the conditions of thedischarge permits were amended in accordance with a parliamentary decisionand were confirmed by Royal Decree in summer 2001. In October 2002,Naturkraft was granted an extension of the current licences.
In 2001, Industrikraft Midt-Norge was granted a construction and operatinglicence and discharge permit for a co-generation gas-fired power plant. In2002, Industrikraft Midt-Norge postponed the decision on this investment.
RESEARCH AND DEVELOPMENT
The government has decided to reorganise the Research Council of Norway byreplacing its current six sectors with the following three divisions:
● Development of Professions and Disciplines.
● Innovation and User-initiated Research.
● Strategic Commitments.
The Board of the Research Council will be smaller and stronger and themanagement of the divisions will be closely linked to it.
The Research Council of Norway recently signed an agreement with Enova,the new agency for promoting energy savings, new renewable energy andenvironment-friendly natural gas solutions, thereby ensuring closer co-ordination of the activities of the two parties.
244
Standard Reviews: NORWAY The Country Reports
191-Standard Reviews 2/12/03 11:14 Page 244

SPAIN
GENERAL ENERGY POLICYPrior to the 2001 in-depth review, the government abandoned the periodical ten-year National Energy Plan (Plan Energético Nacional, PEN), which focused onmeeting the country’s future energy requirements. In September 2002, thegovernment launched a new plan, the Electricity and Gas Sector Plan –Development of the Transmission Networks 2001-2011 (Planificación de losSectores de Electricidad y Gas – Desarrollo de las Redes de Transporte 2001-2011).This plan focuses on the development of Spain’s basic energy infrastructure andcontains information on demand evolution, energy mix, environmental issues,investments, etc. The plan estimates that a minimum investment of €26.5 billionis needed for electricity generation and gas and electricity distribution, andforesees that natural gas and renewables will become more important while theuse of nuclear, coal and oil in electricity generation will decline.
ENERGY SUPPLY AND DEMANDSpain depends on imports for most of its supply. In 2002, it imported 76% ofthe energy it consumed. In 2002, total primary energy supply (TPES) was131 Mtoe, representing a rapid growth of 44% over the 1990 figure. The shareof oil in TPES was 51.2%, followed by coal (16.2%), natural gas (14.3%), nuclear(12.5%) and renewable energy sources (5.8%).
In 2001, the government released new energy forecasts for the period up to2010 indicating that TPES will continue to grow rapidly by 30% between 2002and 2010, driven by economic growth of 2.9% per year. The share of oil isexpected to decline to 48%, nuclear to 9.7% and coal to 8.7%, whereas theshare of natural gas is expected to increase to 21.7%, combustible renewablesand wastes to 8% and hydro and other renewables to 3.6%.
Between 1990 and 2001, total final energy consumption (TFC) grew by 49%,with a 54% increase in the transport sector, 54% in the residential, services andagricultural sectors, and 43% in the industry sector. Between 2001 and 2010,the government expects TFC to increase by 37%. Growth will be strongest in theresidential, services and agricultural sectors (46%), but a significant demandincrease is also expected in the transport (40%) and industry (29%) sectors.
ENERGY AND THE ENVIRONMENTSpain ratified the Kyoto Protocol in April 2002. The government agreed tolimit the net increase in greenhouse gas emissions to 15% above 1990 levels
245
191-Standard Reviews 2/12/03 11:14 Page 245

by 2008-2012 under the Kyoto Protocol and the European Union (EU)“burden-sharing” agreement. However, energy-related CO2 emissions, which constitute a large share of total emissions, were 38% higher in 2001 than in 1990. Although Spain began preparing a Strategy forSustainable Development in June 2001 in an effort to meet its Kyotocommitment, no clear time frame has been set for the completion of this work. An Inter-ministerial Commission has been established to co-ordinate the strategy.
The Spanish Bureau for Climate Change, under the Ministry of theEnvironment’s General Directorate for Environment Quality and Assessment,was created by Royal Decree 376/2001 in April 2001 to act as the NationalClimate Council’s secretariat. Although the National Climate Council isresponsible for developing and supervising the Spanish strategy againstclimate change, the regional governments are allowed to adapt policies intheir specific geographic areas provided that these do not conflict withnational policies. The Spanish Bureau for Climate Change has establishedthree working groups, with representatives from administration and industry,to work on domestic climate change mitigation measures, emissions tradingand application of the clean development mechanism (CDM) and JointImplementation.
The EU Directive on Environmental Impact Assessment (85/377/EC) wastransposed to Spanish legislation by Law 6/2001 of 8 May 2001. RoyalDecree 287/2001 of 26 April 2001 adopted the EU Directive 1999/32/EC,which establishes limits for the sulphur content of oil products. Royal Decree785/2001 of 6 July 2001 prohibited the use of leaded fuel from 1 August2001.
ENERGY EFFICIENCY
Owing to the strong growth in energy demand, TPES per capita increased from2.35 toe in 1990 to 3.24 toe in 2002; the gap to the OECD Europe average(3.41 toe in 2002) has been narrowing fast. By 2010, the government expectsTPES per capita to reach 4.02 toe. Energy intensity (measured as TPES perGDP) in Spain has surpassed that in OECD Europe owing to growth of theformer and improvement in the latter. In 2002, Spain’s energy intensityreached 0.178 toe per US$ 1000 at 1995 prices and exchange rates comparedto 0.161 toe in OECD Europe.
The Institute for the Diversification and Saving of Energy (IDAE) workstogether with the government and the regional and local agencies to co-ordinate and implement policies and actions promoting the rational use of energy and the diversification of energy sources, including the use of renewables. The Ministry of Economy is preparing a Spanish Energy
246
Standard Reviews: SPAIN The Country Reports
191-Standard Reviews 2/12/03 11:14 Page 246
Efficiency Strategy, scheduled to be completed in 2003 that covers all sectors, except industry, with a prioritised list of measures and plans formonitoring and control.
Spain is in the process of establishing new mandatory building standards(updating those from 1979) and preparing a building certification andlabelling scheme to implement the EU’s “SAVE Directive” 93/76/EC. Once thelegislation is in place, the regions will enforce it. Energy efficiency in the publicsector is promoted through voluntary agreements, which are also used inindustry together with information dissemination, third-party financing andpromotion of co-generation. In the transport sector, measures include financialincentives to eliminate old cars; the development of city transport plans; thepromotion of reduced VAT on tickets for public transport and the use of annualvehicle taxes, which are proportionate to vehicle weight and engine size.
OIL
Total oil supply increased from 46.5 Mtoe in 1990 to 67.3 Mtoe in 2002 butits share in TPES remained stable at 51% to 52% throughout the decade.Demand for diesel is rapidly increasing whereas demand for gasoline islevelling off, mainly driven by lower taxes on diesel.
Spain has some indigenous oil resources but they cover less than 1% ofdemand. Proven domestic oil reserves were 157 million barrels as of January2003. Domestic production takes place in five oilfields. In 2002, thegovernment gave Repsol-YPF permission to explore potential oil deposits nearthe Canary Islands. Crude oil and oil products are imported from diversesources. In 2001, the volume of crude oil imports was 56.8 Mt and the mostsignificant sources were Nigeria (15%), Mexico (14%), Libya (13%), SaudiArabia (11%) and Russia (9%). Oil product imports were 21.2 Mt in 2001 andcame mainly from Italy (22%), Algeria (17%), the US (15%) and Russia (8%).In 2001, Spain exported a total of 6.2 Mt of different oil products, mainly tothe US and Western Europe.
Gasoline and diesel prices in Spain are among the lowest in IEA Europe,largely thanks to relatively low taxes. Price ceilings are imposed on 8 kg LPGcylinder and pipeline supplies of LPG, while prices for all other petroleumproducts can be set freely.
The oil market has been liberalised but remains rather concentrated withRepsol-YPF and Cepsa being the major players both in refining and distribution.The Compañia Logística de Hidrocarburos (CLH) transports about 95% of theoil products in Spain and owns most of the logistics. Repsol has reduced itsshareholding in CLH from over 60% in 2000 to about 25% (as at end April2003) to comply with the legislation that caps the shareholding of any singleowner of CLH at 25% of shares and voting rights.
247
The Country Reports Standard Reviews: SPAIN
191-Standard Reviews 2/12/03 11:14 Page 247
NATURAL GAS
Spain’s natural gas demand continues to grow. It reached 18.7 Mtoe in 2002which is almost four times higher than in 1990. In 2002, Spain’s first combinedcycle gas turbines were commissioned, further increasing natural gas demand.The government estimates gas demand to more than double by 2010.
Spain currently has five entry points for natural gas; two pipelines (the Lacq-Calahorra in the north and the Maghreb-Europe in the south) and threeregasification plants for LNG (Barcelona, Cartagena and Huelva). In 2001,44% of natural gas was imported via pipelines and 56% as LNG. Algeriaaccounted for 55% of supplies, which is under the indicative limit of 60% setby legislation for supplies from any single country.
The forecasted high demand growth requires significant investments in gasinfrastructure. In 2002, Spain’s Gas Natural and Portugal’s Trangas announcedan increase of 50% in the capacity of the Maghreb-Spain pipeline by the endof 2004. The National Energy Commission (CNE) has warned that “a delay inthe expansion of regasification [capacity], in the construction of the Huelva-Cordoba-Madrid gas pipeline, in the Sagunto [regasification] plant or in thecapacity extension of the Maghreb gas pipeline in its international section,could seriously compromise supply”. In 2003, only 0.55 mcm of regasificationcapacity will come into operation instead of the 1 mcm forecasted andrecommended by the CNE in 2001.
The Gas Natural Group remains the dominant player in the Spanish gasmarket. The group is vertically integrated and covers all areas of business fromimport to retail. The transmission system operator (TSO) Enagas owns themajority of the transmission networks. It has been held by Gas Natural Groupbut legislation limits the shareholding of any single owner of the TSO to 35%.After the June 2002 public offer, the shareholding of Gas Natural Group wasreduced to 41% and 46% of the shares were free floating.
The structure of third-party access tariffs was established by Ministerial Order949/2001 in August 2001 and the latest order defining tariff levels wasissued in January 2003. Although market liberalisation was extended to allconsumers at the beginning of 2003, small consumers can still chooseregulated tariffs. In the first quarter of 2003, about 60% of natural gas waspurchased from the free market, compared to 55% in 2002, 38% in 2001 and9% in 2000. There is no reliable information on the number of consumerschanging suppliers.
A 70% cap on the market share of any single supplier was enforced at thebeginning of 2003. Another regulatory measure, which is aimed at increasingcompetition, is that a minimum of 25% of the gas supplied through thepipeline from Algeria, the cheapest gas source for Spain, must be supplied tothe liberalised markets.
248
Standard Reviews: SPAIN The Country Reports
191-Standard Reviews 2/12/03 11:14 Page 248

To support the development of competition in the gas and electricity sectors,the CNE has launched campaigns to inform consumers about the possibilityto change suppliers. The Ministry of Economy has also established aninformation telephone line for consumers.
COAL
Coal demand was 21.2 Mtoe in 2002, slightly more than in 1990. Domesticproduction accounted for 33% of total coal demand. The most importantimport sources for hard coal were South Africa (38%), Australia (18%) andIndonesia (14%), and for steam coal were South Africa (46%), Indonesia(18%) and Russia (11%).
Coal is Spain’s most important domestic energy source. However, its price ishigher compared to coal available on the international market and thegovernment is subsidising domestic coal-mining. While coal subsidies havebeen decreasing, Spain gives more subsidies to the coal industry than anyother IEA coal-mining country except Germany. According to the EUregulations that took effect in July 2002, Spain’s coal production is estimatedto be reduced by 65% over the next ten years and production subsidies willno longer be provided for coal mines that are unable to improve theircompetitiveness. In 2002, subsidies of €606.9 million were given for theoperation of coal mines and €173.5 million were paid directly to the workersfor early retirement; there were no subsidies for production reductions orclosures.
RENEWABLES
The 1999 Plan for the Promotion of Renewable Energy in Spain sets a targetof 12% of Spain’s energy demand being met from renewable sources by 2010,in line with the EU target defined in the European Commission’s White Paperfor Renewable Energy Sources. In 2002, the use of renewables amounted to7.6 Mtoe and their share of TPES was 5.8%. Electricity generation fromrenewables totalled 51.3 TWh in 2001 (22% of total generation) with a majorcontribution coming from hydropower (17%) and 5% from the rest of therenewable energy plants.
Although the 1999 plan defines interim targets for 2006 for energy (a4.8 Mtoe increase over 1999 levels), investment (€10 billion) and state aid(€1.3 billion), no strategy to meet the final target in 2010 has yet beenannounced. During the three-year period between 1999 and 2001, 14.8% ofthe 2006 interim targets for energy, 25.2% for investment and 4.1% for stateaid had been achieved. Progress has principally been made in wind powerdevelopment, which achieved half of its 2006 electricity generation target by
249
The Country Reports Standard Reviews: SPAIN
191-Standard Reviews 2/12/03 11:14 Page 249

the end of 2001; its total capacity reached 3 244 MW. In addition to directsubsidies for investment and operation costs, renewables have guaranteedmarket access with regulated feed-in tariffs. However, problems with gridconnections and slow permit procedures slow down wind power capacityincreases.
NUCLEAR
Spain has nine nuclear reactors, operating at seven sites, with a total grossgenerating capacity of about 7 800 MW. In 2001, Confrentes and the twoAscó units were granted authorisation for an additional ten years of operation.In 2001, nuclear plants produced 63.7 TWh, supplying 27% of the country’selectricity requirements. Spanish nuclear reactors continue to perform veryefficiently; the load factor was 91.7% in 2002 and 93.1% in 2001, among thehighest in OECD countries.
ELECTRICITY
In 2001, electricity consumption was 201 TWh, compared to 126 TWh in1990. This corresponds to an average growth rate of 4.4% per year. In 2001,coal stations accounted for 30.6% of total gross electricity production,followed by nuclear (27.1%), hydro (17.5%), oil (10.5%), natural gas (10%),wind and solar power (3%) and combustible renewables and wastes (1.4%).
The government estimates electricity demand to grow by 46% between 2001and 2010, representing a 3.5% annual growth rate. Industry is investingheavily to meet the increasing demand. The three largest utilities, Endesa,Iberdrola and Unión Fenósa, plan to invest €8 billion for new generatingplants in Spain between August 2001 and 2005. In 2001, the TSO forelectricity, Red Eléctrica de España (REE), invested €78.4 million in expandingthe networks and announced plans to invest €60.2 million to €72.2 millionto improve interconnections with France. Feasibility studies are under way ona subsea electrical cable between Algeria and Spain.
In 2001, the Portuguese and Spanish governments decided to create theIberian Electricity Market (IBELM) by 1 January 2003 latest. However, itsimplementation and establishment is not likely to occur before 2006 owing to many unresolved issues, mainly related to different market designs in the two countries. According to the governments’ agreement, the IBELM should “... guarantee all agents established in both countries access to the IberianMarket Operator and to the interconnections with third countries under freeand equal trading conditions”. The Iberian market operator will be a newentity with owners from both countries. Its main functions will be to facilitatetrading and to administer access to the Spain-Portugal interconnections.
250
Standard Reviews: SPAIN The Country Reports
191-Standard Reviews 2/12/03 11:14 Page 250

Two decrees were issued in 2002 to facilitate market access for small consumers,either through load profiling or by installing hourly metering. Since thebeginning of 2003, small consumers have the option of either choosing theirsupplier or regulated tariffs. In 2007, regulated tariffs for high-voltage electricityconsumers will be abolished and electricity will have to be purchased fromliberalised markets.
In terms of volume, eligible consumers purchased 57% of their electricitysupply from liberalised markets in 2002 compared to 28% in 2000. However,67% of eligible consumers chose regulated tariffs in 2002.
The industry structure is changing. In 1998, power production was dividedbetween the Endesa Group (48%), Iberdrola (26%), Unión Fenósa (11%),Hidrocantábrico (4%) and independent power producers (11%). In 2002,ENEL acquired Viesco from the Endesa Group; Viesco currently has a 5% shareof the market. There have been several acquisition attempts among theSpanish power utilities, by foreign power utilities and by the gas industry, butonly the ownership structure of Hidrocantábrico has changed. In 2001, it wasacquired by Energie Baden-Wurttemberg (EnBW), Electricidade de Portugal(EdP) and the Spanish bank, Caja de Ahorros de Asturias (Cajastur). In April2003, REE increased its majority ownership of the Spanish mainlandelectricity transmission network to 84% by acquiring transmission assets fromEndesa and Unión Fenósa. It is currently negotiating with Hidrocantábricoand Viesco on the purchase of their electricity transmission networks.
RESEARCH AND DEVELOPMENT
In 2001, the public energy research and development (R&D) budget forenergy was €50 million, of which 48% was used for R&D on nuclear power,35% on renewable energy, 7% on energy conservation, 5% on fossil fuels, 3% on power and storage technologies and 2% on other areas.
The main recipient of public funding is the public CIEMAT (Research Centrefor Energy, Environment and Technology). Other bodies carrying out publiclyfunded energy R&D include CSIC (Centre for Scientific Research), ENUSA(National Uranium Company), CSN (Nuclear Safety Board), ENRESA (NationalCompany for Radioactive Wastes) and universities. Financing is also given toprivate companies and technology centres.
The National Plan for Scientific Research, Development and TechnologicalInnovation for the period 2000 to 2003 defines the priority areas for energyR&D. These included more efficient and less polluting energy systems (withspecial focus on renewables and fuel cells), alternative systems for propulsion,and new fuels for the transport sector with special attention to the reductionof CO2 emissions.
251
The Country Reports Standard Reviews: SPAIN
191-Standard Reviews 2/12/03 11:14 Page 251

191-Standard Reviews 2/12/03 11:14 Page 252

TURKEY
GENERAL ENERGY POLICY
Since the early 1980s, Turkish energy policy has concentrated on marketliberalisation in an effort to stimulate investment in response to increasinginternal energy demand. Turkey’s new government, which was elected inNovember 2002, has continued this policy despite lower energy demandinduced by the 2001 economic crisis.
The need for fiscal discipline has increased pressure on the government tolower energy supply costs. The government is in the process of renegotiatingthe price of energy imports and is also working towards diversifying itsexternal supply sources. Turkey is currently negotiating with Algeria andNigeria to extend its gas purchases from these two countries and is examiningalternative ways to save energy and to reduce its energy import bill. Thegovernment intends to establish Turkey as a strategic energy transit route.Several major pipeline projects are planned or under construction, inparticular the expansion of the existing pipelines from the Caspian region toEurope via Georgia, Azerbaijan and the Middle East.
Turkey’s energy imports increased prior to the 2001 economic crisis, owing tototal final energy consumption (TFC) growing much faster than domesticproduction. In an effort to mobilise large volumes of foreign investment toboost supply, the government removed constitutional restrictions on private-sector involvement in public-service contracts. In January 2000, theInternational Arbitration Law was applied for the first time to settle disputesbetween the State and the private sector on public-service contracts. The lawhas facilitated the financing of energy sector projects.
During the 1990s, Turkey attracted significant private investments using threemodels for project financing and ownership, namely Build-Operate-Transfer(BOT), Build-Own-Operate (BOO) and Transfer of Operating Rights (TOR). TORis still used for privatisation policies, for example in the electricity distributionsector.
In 2001, the Parliament voted two energy liberalisation laws, the ElectricityMarket Law and the Natural Gas Market Law, which aimed to end publicmonopoly in the energy sector and to implement cost-reflecting pricing structures.The laws made it possible to launch a new organisation, the Energy MarketRegulation Authority (EMRA), to regulate the electricity and natural gasmarkets. In November 2001, the government commissioned the Energy MarketRegulatory Board, which manages the EMRA.
253
191-Standard Reviews 2/12/03 11:14 Page 253

ENERGY SUPPLY AND DEMAND
Between 2000 and 2001, total primary energy supply (TPES) considerablydeclined by 6.5%, from 77 Mtoe to 72 Mtoe. Despite this decline, thegovernment foresees a significant recovery in energy demand and a doublingof the supply to 152 Mtoe by 2010. In 2002, oil maintained its lead with a40% share of TPES, followed by coal (27%), natural gas (20%) and renewables(14%). Between 2000 and 2001, energy production (54% of it being coal in2001) marginally decreased by 2% to 26 Mtoe owing to Turkey’s preferenceto reduce its energy imports. Net imports reduced significantly by 10%, andthe external energy dependence measured as a ratio of net imports to TPESdeclined from 65% in 2000 to 62% in 2001.
Between 2000 and 2001, TFC significantly decreased by 9% to almost 52 Mtoe.Industrial consumption declined by 19% during the same period, while TFC inthe transport and residential/commercial sectors decreased by 4% and 3%respectively.
ENERGY AND THE ENVIRONMENT
Turkey is an Annex I Party to the United Nations Framework Convention onClimate Change (UNFCCC), which includes OECD countries and countrieswith economies in transition. As such, Turkey has an obligation to implementpolicies and measures for emissions reductions, but does not have an emissionstarget. As an OECD country, Turkey was also an Annex II Party to the UNFCCC.During the Seventh Conference of the Parties to the UNFCCC (COP-7), held inMarrakech in 2001, it was decided to remove Turkey from the Annex II list,recognising its special circumstances as an Annex I Party. Turkey is in theprocess of ratifying the UNFCCC.
CO2 emissions from the energy sector increased by 58% between 1990 and2000 and then decreased by 8% between 2000 and 2001. CO2 emissionsfrom the energy sector are expected to increase again in the future togetherwith economic recovery.
ENERGY EFFICIENCY
In 2002, the Ministry of Industry and Trade issued regulations on the energylabelling for household refrigerators, deep freezers, washing machines, dryers,dishwashers and light bulbs. Since the beginning of 2003, the regulations aremandatory and were implemented to harmonise Turkish legislation with theEuropean Union. The Industrial Energy Manager Programme has been pursued,and most of the energy managers of big industrial entities have been trainedand are now certified energy managers.
254
Standard Reviews: TURKEY The Country Reports
191-Standard Reviews 2/12/03 11:14 Page 254
OIL
Turkey is not a major oil producer. Its oil production, which amounted to2.4 Mtoe in 2002, 9% down from 2.7 Mtoe in 2000, is expected to continueto gradually decline. In 2002, 91% of the oil demand was imported, mainlyfrom Iran, Libya and Saudi Arabia. The 2001 economic crisis affected total oildemand, which shrank by 7% in TPES to 30 Mtoe in 2002.
Most of Turkey’s future oil supply is expected to come from countries in CentralAsia, such as Azerbaijan and Kazakhstan. In September 2002, constructionbegan on the Baku-Tbilisi-Ceyhan oil pipeline by a consortium of internationaloil companies led by British Petroleum (BP), following the 1998 decision betweenGeorgia, Azerbaijan, Kazakhstan and Turkmenistan to build the pipeline. Thepipeline will connect the Caspian Sea to the Turkish Mediterranean via Georgiaand will provide oil and gas for the European and US markets. Construction isexpected to be completed in 200510.
In March 2003, an Oil Market Reform Law was presented by the governmentto the Parliament. If enacted, this law will liberalise oil and oil productspricing.
Downstream oil policy is guided by the need to liberalise the oil sector, throughprivatisation and modernisation efforts. The Turkish Petroleum RefineriesCorporation (TUPRAS) carries out most of Turkey’s oil refining and owns fourof the six oil refineries located in Turkey. TUPRAS is currently modernising its refineries and shifting the product mix towards lighter products such asgasoline in order to meet EU standards for gasoline and diesel fuel by 2004.The government envisages selling its remaining share of TUPRAS capital(65%); however, the privatisation calendar has not yet been approved. PetrolOfisi (POAS), the formerly state-owned petroleum distribution company, is nowmostly privatised; 51% of POAS was sold to investors in 2000. In July 2002,the government announced its intention to sell its remaining 25.8% share inPOAS to Dogan Petrol Yatirimlari, the majority shareholder. Privatisation is aprerequisite for the International Monetary Fund’s assistance to Turkey throughthe economic crisis.
NATURAL GAS
Turkish gas production is very limited and represented only 2% of the 14 Mtoeof total gas supplied to Turkey in 2002. Natural gas domestic production
255
The Country Reports Standard Reviews: TURKEY
10. In 2003, using the OECD Guidelines for Multinational Enterprises Framework, a code of businessconduct was backed by 38 governments (30 OECD members and eight non-members) and revised in2000; several non-governmental organisations challenged the project.
191-Standard Reviews 2/12/03 11:14 Page 255

significantly decreased in 2001 from 2000. Unlike other primary energies,natural gas supply did not decline during and after the economic crisis, butgrew by 6% from 2000 to 2001. Contractual take-or-pay obligations haveresulted in a relative increase in natural gas use. To regulate the seasonal,daily and hourly fluctuations in natural gas consumption, studies are beingcarried out to assess underground storage facilities. A project has beeninitiated to use the North Marmara and Degirmenkoy depleted gas fields inthe Thrace region, which could be commissioned in 2005. Salt caverns in theSalt Lake in Central Anatolia are also planned to be used as undergroundstorage facilities.
Up to 2001, Turkey imported 69% of its total imported gas from Russia, 23%from Algeria and 8% from Nigeria. Gas deliveries from Iran began inDecember 2001, after repeated delays. BOTAS signed the Natural Gas Saleand Purchase Agreement with SOCAR for the delivery of 6.6 bcm per year ofnatural gas from the Azeri “Shah Deniz” gas field from 2006. In February2003, the seller party was changed to AGSC (Azerbaijan Gas SupplyCompany). The pipeline will deliver gas at the Georgian/Turkish border and isexpected to cost €3.2 billion.
The government still expects gas demand to grow almost fourfold by 2010;however, questions remain on whether domestic demand will grow rapidlyenough to absorb the additional volumes contracted from Iran andAzerbaijan, in addition to the gas that will be supplied by Russia, Algeria and Nigeria. For instance, in June 2002, Turkey stopped gas imports from Iran, citing gas quality problems. In November 2002, Turkey announcedthat it had resumed gas imports from Iran after obtaining a lower price and a reduction in the take-or-pay percentage. The €3 billion Blue Stream Pipeline was put into operation in February 2003. It is planned to transport 16 bcm per year of natural gas along a distance of 1 200 kmfrom Russia to Turkey. In March 2003, Turkey halted gas imports from BlueStream.
In late February 2003, the government signed a binding agreement withGreece to facilitate the expansion of Turkey’s role as an important transitcentre for natural gas exports to Greece and beyond. The agreement calls forthe extension of the natural gas pipeline from Turkey to Greece, a project witha maximum capacity of 3.6 bcm per year for an investment of approximately€270 million. Other routes, notably from Turkey to Austria, are also beingconsidered.
The Natural Gas Market Law, enacted in May 2001, will gradually force BOTASto reduce its share of gas imports to 20%, requiring the company to sell partof its existing gas import contracts by 2009. By then, BOTAS should be splitinto separate units that will eventually be privatised for gas imports, transportand storage.
256
Standard Reviews: TURKEY The Country Reports
191-Standard Reviews 2/12/03 11:14 Page 256

COAL
Between 2000 and 2001, domestic coal production increased by 6% to 14 Mtoe.Turkey has both hard coal and lignite deposits. Two lignite mines are theproperty of the state-owned company EÜA,S. The Kangal mine is operated bya private company under contract. Most of the other mines are operated bythe state-owned company Turkish Coal Enterprises (TKI). Although Turkey stillimports approximately one-third of its coal consumption, coal supply decreasedby 12% to 20 Mtoe between 2000 and 2001.
ELECTRICITY
Between 1990 and 2000, Turkey more than doubled its gross electricityoutput to reach 124 TWh in 2000, the second-largest growth in IEA countries.The 2001 economic crisis stalled this growth. Between 2000 and 2001, totalelectricity output and electricity demand decreased by 2% and 1% respectively.The share of gas in electricity production continued to grow, representing 40%of the electricity produced in 2001, followed by coal with 31% and hydro with19%. Turkey has a relatively high number of co-generation plants.
Before the economic crisis, the rapid growth in electricity demand led Turkeyto increase its installed generating capacity and to import electricity fromBulgaria. The imports stopped in April 2003 because Turkish domesticproduction had become cheaper. Turkey’s economic difficulties alsocompromised several electricity generating projects. Regulatory changesadded to the temporary uncertainties, despite the approval in 2001 of thenew Electricity Market Law, which will eventually facilitate competition andinvestment. The new law called for the state-owned electricity utility, TEAS, tobe broken up into separate generation, transmission and trade companies.Following the unbundling, which was carried out in 2001, a new state-ownedcompany, Electricity Generation Company (EÜA,S) is responsible for electricitygeneration; the Turkish Electricity Transmission Company (TEIA,S) was createdto construct, operate and maintain Turkey’s high-voltage electricitytransmission grid and the newly created Turkish Electricity Trading andContracting Company (TETA,S) is responsible for wholesale electricity trade.Plants in the EÜA,S portfolio and the distribution assets of TEDAS are expectedto be privatised, while transmission will remain a state responsibility given itsmonopolistic character. TETA,S will be the dominant player in the wholesaletrading activities until private wholesale companies are introduced in themarket.
In May 2002, the EMRA issued drafts of the Energy Market LicensingRegulation and the Electricity Market Tariffs Regulation, which were enforcedin August 2002. The EMRA announced a four-stage approach to developinga competitive electricity market: 1) licensing firms in the electricity and natural
257
The Country Reports Standard Reviews: TURKEY
191-Standard Reviews 2/12/03 11:14 Page 257

gas markets; 2) allowing large industrial users the right to choose their initialelectricity provider in March 2003, which represents around 20% of the market;3) setting up the Market Financial Reconciliation Centre for balancing andsettlements; and 4) initiating the operations of this centre. The Parliament isexamining the possibility to expand the EMRA’s mandate to includepetroleum upstream activities.
In May 2002, the Ministry of Energy and Natural Resources informed theTurkish Privatisation Agency (OIB) on the power plants and distribution assetsto be included in the privatisation process. Progress on the implementation ofthe new Electricity Market Law has been slower than expected. OIB hasincluded 19 distribution regions in the portfolio of energy assets to beprivatised through tenders in 2004.
The EMRA is aiming for energy prices that reflect costs. In this respect, aregional power tariff could be implemented in 2003 to reduce discrepanciesbetween provinces.
RENEWABLES
Turkey has a relatively good potential for renewable energy. The countryrepresents approximately 1% of the total world hydroelectric potential. Turkeyhas significant potential for geothermal and wind energies, which largelyremain to be developed. Studies are in progress to promote the use ofrenewable energy sources in competitive electricity market conditions. Aseparate legislation is being prepared to define incentives for this purpose.
In 2002, renewable energy accounted for almost 14% of TPES. Althoughhydro represented a significant 3% share of TPES in 2001, combustiblerenewables and wastes – largely fuel wood consumed by households –represented the bulk of TPES with an 8% share. This share is expected todecrease in the future. Hydroelectricity production reduced by one-third in 2001 compared to 2000, mainly to compensate for lower electricitydemand and a rather inelastic supply of natural gas in the framework of take-or-pay contracts.
RESEARCH AND DEVELOPMENT
During 2002 and 2003, Turkey’s research, development and demonstration(RD&D) activities can be placed in two categories. The first category covers anumber of small-scale (up to €100 000) clean energy R&D projects, whichare principally financed by national funds. The total figure allocated to thiscategory is less than €1 million. The first category also covers universityprojects, such as photovoltaics, solar-heating devices and biogas, and joint
258
Standard Reviews: TURKEY The Country Reports
191-Standard Reviews 2/12/03 11:14 Page 258

ventures between public R&D organisations and small to medium-sizedprivate companies, such as the hybrid-electric car and energy conservation.
The second category covers medium or larger-sized international projects(from €100 000 to several million euros), which are generally funded byinternational organisations and include projects such as NATO-SfP projects,the EU Sixth Framework projects and WEAG projects. The main areas ofresearch for these projects are photovoltaic technologies, fuel cells, fuelreformers for fuel cells, the all-electric vehicle and biomass gasification.
259
The Country Reports Standard Reviews: TURKEY
191-Standard Reviews 2/12/03 11:14 Page 259

191-Standard Reviews 2/12/03 11:14 Page 260

PART 2.3
ENERGY BALANCES AND KEY STATISTICAL DATA OF IEA COUNTRIES
AUSTRALIA JAPAN
AUSTRIA KOREA
BELGIUM LUXEMBOURG
CANADA NETHERLANDS
CZECH REPUBLIC NEW ZEALAND
DENMARK NORWAY
FINLAND PORTUGAL
FRANCE SPAIN
GERMANY SWEDEN
GREECE SWITZERLAND
HUNGARY TURKEY
IRELAND UNITED KINGDOM
ITALY UNITED STATES
261-Energy Balances 2/12/03 11:23 Page 261

261-Energy Balances 2/12/03 11:23 Page 262

263
AUSTRALIA
ENERGY BALANCES AND KEY STATISTICAL DATA
Unit: Mtoe
SUPPLY
1973 1990 2000 2001 2010 2020 2030
TOTAL PRODUCTION 68.0 157.7 232.3 250.4 314.6 363.2 ..Coal1 40.3 106.3 163.2 179.6 207.8 229.7 ..Oil 19.8 29.0 33.9 35.0 32.0 34.2 ..Gas 3.4 17.1 28.5 29.1 65.0 87.8 ..Comb. Renewables & Wastes2 3.5 4.0 5.0 5.2 7.7 9.2 ..Nuclear – – – – – – ..Hydro 1.0 1.2 1.4 1.4 1.7 1.7 ..Geothermal – – – – – – ..Solar/Wind/Other3 – 0.1 0.1 0.1 0.4 0.5 ..
TOTAL NET IMPORTS4 –10.3 –65.7 –121.3 –134.9 –169.5 –181.8 ..Coal1 Exports 17.6 67.7 114.6 125.2 158.3 168.2 ..
Imports – – – – – – ..Net Imports –17.6 –67.7 –114.6 –125.2 –158.3 –168.2 ..
Oil Exports 3.4 9.3 22.8 27.4 26.1 27.7 ..Imports 12.5 14.2 26.3 27.3 44.4 56.5 ..Bunkers 1.8 0.6 0.9 0.8 1.0 1.2 ..Net Imports 7.4 4.3 2.6 –0.8 17.4 27.6 ..
Gas Exports – 2.3 9.3 8.8 28.6 41.2 ..Imports – – – – – – ..Net Imports – –2.3 –9.3 –8.8 –28.6 –41.2 ..
Electricity Exports – – – – – – ..Imports – – – – – – ..Net Imports – – – – – – ..
TOTAL STOCK CHANGES –0.1 –4.5 –1.1 0.1 – – ..
TOTAL SUPPLY (TPES) 57.6 87.5 109.8 115.6 145.1 181.4 ..Coal1 22.6 35.0 47.4 55.4 49.5 61.5 ..Oil 27.1 32.5 36.5 33.2 49.4 61.8 ..Gas 3.4 14.8 19.3 20.3 36.4 46.7 ..Comb. Renewables & Wastes2 3.5 4.0 5.0 5.2 7.7 9.2 ..Nuclear – – – – – – ..Hydro 1.0 1.2 1.4 1.4 1.7 1.7 ..Geothermal – – – – – – ..Solar/Wind/Other3 – 0.1 0.1 0.1 0.4 0.5 ..Electricity Trade5 – – – – – – ..
Shares (%)Coal 39.2 39.9 43.2 47.9 34.1 33.9 ..Oil 47.1 37.2 33.2 28.7 34.0 34.1 ..Gas 5.9 16.9 17.6 17.6 25.1 25.7 ..Comb. Renewables & Wastes 6.1 4.5 4.6 4.5 5.3 5.1 ..Nuclear – – – – – – ..Hydro 1.7 1.4 1.3 1.2 1.2 1.0 ..Geothermal – – – – – – ..Solar/Wind/Other – 0.1 0.1 0.1 0.3 0.3 ..Electricity Trade – – – – – – ..
0 is negligible, – is nil, .. is not available.Please note: All data except GDP and population refer to the fiscal year July to June.
261-Energy Balances 2/12/03 11:24 Page 263

Unit: Mtoe
DEMAND
FINAL CONSUMPTION BY SECTOR
1973 1990 2000 2001 2010 2020 2030
TFC 40.0 58.1 72.0 73.0 91.6 115.4 ..Coal1 4.9 4.3 4.0 3.8 2.5 2.7 ..Oil 24.7 30.5 37.2 37.1 46.0 57.8 ..Gas 2.4 8.8 11.5 12.1 18.7 24.1 ..Comb. Renewables & Wastes2 3.5 3.3 4.3 4.4 4.8 5.5 ..Geothermal – – – – – – ..Solar/Wind/Other – 0.1 0.1 0.1 0.1 0.2 ..Electricity 4.5 11.1 14.9 15.5 19.5 25.1 ..Heat – – – – – – ..
Shares (%)Coal 12.3 7.4 5.6 5.2 2.7 2.4 ..Oil 61.7 52.6 51.7 50.9 50.2 50.1 ..Gas 5.9 15.2 15.9 16.6 20.4 20.9 ..Comb. Renewables & Wastes 8.7 5.6 6.0 6.0 5.3 4.8 ..Geothermal – – – – – – ..Solar/Wind/Other – 0.1 0.1 0.1 0.1 0.2 ..Electricity 11.3 19.1 20.6 21.3 21.3 21.7 ..Heat – – – – – – ..
TOTAL INDUSTRY6 17.6 23.1 28.0 28.8 36.4 44.6 ..Coal1 4.6 4.1 3.9 3.6 2.3 2.6 ..Oil 7.7 6.3 7.5 7.5 9.2 10.8 ..Gas 1.8 6.1 7.5 8.0 12.8 16.5 ..Comb. Renewables & Wastes2 1.5 1.5 2.5 2.5 2.8 3.2 ..Geothermal – – – – – – ..Solar/Wind/Other – – – – – – ..Electricity 2.0 5.1 6.6 7.3 9.3 11.5 ..Heat – – – – – – ..
Shares (%)Coal 26.4 17.6 13.9 12.5 6.4 5.7 ..Oil 43.8 27.4 26.9 25.9 25.3 24.3 ..Gas 10.0 26.5 26.8 27.8 35.1 37.1 ..Comb. Renewables & Wastes 8.5 6.4 8.8 8.5 7.6 7.3 ..Geothermal – – – – – – ..Solar/Wind/Other – – – – – – ..Electricity 11.3 22.0 23.6 25.2 25.6 25.7 ..Heat – – – – – – ..
TRANSPORT7 13.5 22.7 28.2 28.3 37.1 47.5 ..
TOTAL OTHER SECTORS8 8.9 12.3 15.7 15.9 18.2 23.3 ..Coal1 0.3 0.1 0.0 0.1 0.0 0.0 ..Oil 3.5 1.8 2.0 2.0 0.8 0.9 ..Gas 0.6 2.7 3.6 3.7 5.2 6.7 ..Comb. Renewables & Wastes2 2.0 1.8 1.9 1.9 2.1 2.3 ..Geothermal – – – – – – ..Solar/Wind/Other – 0.1 0.1 0.1 0.1 0.2 ..Electricity 2.5 5.9 8.0 8.0 10.0 13.4 ..Heat – – – – – – ..
Shares (%)Coal 3.2 1.1 0.3 0.4 – – ..Oil 39.7 14.2 13.0 12.8 4.3 3.7 ..Gas 7.0 21.8 23.2 23.5 28.7 28.5 ..Comb. Renewables & Wastes 22.5 14.4 11.9 12.0 11.4 9.7 ..Geothermal – – – – – – ..Solar/Wind/Other – 0.7 0.6 0.7 0.7 0.8 ..Electricity 27.7 47.7 51.0 50.6 54.9 57.4 ..Heat – – – – – – ..
264
AUSTRALIA Energy Balances and Key Statistical Data
261-Energy Balances 2/12/03 11:24 Page 264

Unit: Mtoe
DEMAND
ENERGY TRANSFORMATION AND LOSSES
1973 1990 2000 2001 2010 2020 2030
ELECTRICITY GENERATION9
INPUT (Mtoe) 16.0 35.1 46.3 57.3 59.5 74.2 ..OUTPUT (Mtoe) 5.5 13.3 17.8 18.7 22.5 28.9 ..(TWh gross) 64.4 154.3 207.4 216.9 261.6 335.6 ..
Output Shares (%)Coal 74.9 77.1 77.4 78.3 66.9 67.8 ..Oil 2.6 2.7 1.3 1.3 1.1 0.9 ..Gas 4.3 10.6 12.6 12.1 21.3 22.3 ..Comb. Renewables & Wastes 0.5 0.4 0.5 0.6 1.7 1.8 ..Nuclear – – – – – – ..Hydro 17.7 9.2 8.1 7.6 7.7 6.0 ..Geothermal – – – – – – ..Solar/Wind/Other – – 0.0 0.1 1.3 1.1 ..
TOTAL LOSSES 17.8 29.3 38.6 48.7 53.5 66.0 ..of which:Electricity and Heat Generation10 10.5 21.7 28.5 38.6 37.0 45.4 ..Other Transformation 5.5 0.6 0.8 0.7 4.7 5.3 ..Own Use and Losses11 1.7 7.0 9.2 9.3 11.8 15.3 ..
Statistical Differences –0.1 0.2 –0.8 –6.1 – – ..
INDICATORS
1973 1990 2000 2001 2010 2020 2030
GDP (billion 1995 US$) 197.13 317.76 450.31 468.04 642.44 906.22 ..Population (millions) 13.61 17.18 19.27 19.47 21.49 23.62 ..TPES/GDP12 0.29 0.28 0.24 0.25 0.23 0.20 ..Energy Production/TPES 1.18 1.80 2.12 2.17 2.17 2.00 ..Per Capita TPES13 4.23 5.10 5.70 5.94 6.75 7.68 ..Oil Supply/GDP12 0.14 0.10 0.08 0.07 0.08 0.07 ..TFC/GDP12 0.20 0.18 0.16 0.16 0.14 0.13 ..Per Capita TFC13 2.94 3.38 3.74 3.75 4.27 4.89 ..Energy-related CO2
Emissions (Mt CO2)14 157.9 259.7 329.2 369.6 389.8 492.9 ..CO2 Emissions from Bunkers
(Mt CO2) 7.3 6.3 10.0 10.4 11.1 11.8 ..
GROWTH RATES (% per year)
73–79 79–90 90–00 00–01 01–10 10–20 20–30
TPES 3.0 2.2 2.3 5.3 2.6 2.3 ..Coal 1.5 3.2 3.1 16.8 –1.3 2.2 ..Oil 2.9 0.1 1.2 –9.0 4.5 2.3 ..Gas 12.7 7.1 2.7 5.4 6.7 2.5 ..Comb. Renewables & Wastes 0.1 1.0 2.4 2.4 4.5 1.8 ..Nuclear – – – – – – ..Hydro 5.1 –0.7 1.7 –2.1 2.2 0.1 ..Geothermal – – – – – – ..Solar/Wind/Other – 17.3 2.3 23.5 14.6 1.3 ..
TFC 2.5 2.1 2.2 1.4 2.6 2.3 ..
Electricity Consumption 6.3 5.0 2.9 4.4 2.6 2.5 ..Energy Production 3.9 5.7 3.9 7.8 2.6 1.4 ..Net Oil Imports 4.2 –6.9 –5.0 – – 4.8 ..GDP 2.5 3.0 3.5 3.9 3.6 3.5 ..Growth in the TPES/GDP Ratio 0.5 –0.8 –1.2 1.3 –1.0 –1.2 ..Growth in the TFC/GDP Ratio –0.0 –0.9 –1.3 –2.5 –1.0 –1.1 ..
Please note: Rounding may cause totals to differ from the sum of the elements.
265
Energy Balances and Key Statistical Data AUSTRALIA
261-Energy Balances 2/12/03 11:24 Page 265

261-Energy Balances 2/12/03 11:24 Page 266

AUSTRIA
ENERGY BALANCES AND KEY STATISTICAL DATA
Unit: Mtoe
SUPPLY
1973 1990 2000 2001 2010 2020 2030
TOTAL PRODUCTION 7.9 8.1 9.6 9.7 10.4 11.6 ..Coal1 1.0 0.6 0.3 0.3 0.0 0.0 ..Oil 2.7 1.2 1.1 1.0 1.0 1.1 ..Gas 2.0 1.1 1.5 1.5 1.8 2.1 ..Comb. Renewables & Wastes2 0.7 2.4 3.0 3.2 3.8 4.2 ..Nuclear – – – – – – ..Hydro 1.6 2.7 3.6 3.6 3.5 3.7 ..Geothermal – 0.0 0.0 0.0 0.0 0.0 ..Solar/Wind/Other3 – 0.0 0.1 0.1 0.3 0.4 ..
TOTAL NET IMPORTS4 14.0 17.2 19.1 20.0 22.0 23.9 ..Coal1 Exports 0.1 0.0 0.0 0.0 0.0 0.0 ..
Imports 3.1 3.2 3.0 3.3 3.0 2.1 ..Net Imports 3.0 3.2 3.0 3.3 3.0 2.1 ..
Oil Exports 0.1 0.6 1.5 1.7 1.6 1.8 ..Imports 9.9 10.2 12.5 13.4 13.4 15.1 ..Bunkers – – – – – – ..Net Imports 9.7 9.6 11.0 11.7 11.8 13.2 ..
Gas Exports – – 0.0 0.3 0.0 0.0 ..Imports 1.3 4.4 5.3 5.4 7.1 8.4 ..Net Imports 1.3 4.4 5.3 5.0 7.1 8.4 ..
Electricity Exports 0.4 0.6 1.3 1.2 1.3 1.3 ..Imports 0.3 0.6 1.2 1.2 1.4 1.5 ..Net Imports –0.1 –0.0 –0.1 0.0 0.1 0.1 ..
TOTAL STOCK CHANGES –0.3 –0.3 0.1 1.0 –0.2 –0.6 ..
TOTAL SUPPLY (TPES) 21.7 25.0 28.8 30.7 32.3 34.9 ..Coal1 3.9 4.1 3.6 3.7 3.0 2.1 ..Oil 12.3 10.6 12.2 13.1 12.5 14.1 ..Gas 3.3 5.2 6.5 6.9 9.0 10.3 ..Comb. Renewables & Wastes2 0.7 2.4 2.9 3.2 3.8 4.2 ..Nuclear – – – – – – ..Hydro 1.6 2.7 3.6 3.6 3.5 3.7 ..Geothermal – 0.0 0.0 0.0 0.0 0.0 ..Solar/Wind/Other3 – 0.0 0.1 0.1 0.3 0.4 ..Electricity Trade5 –0.1 –0.0 –0.1 0.0 0.1 0.1 ..
Shares (%)Coal 17.9 16.4 12.4 12.2 9.2 6.0 ..Oil 56.7 42.4 42.3 42.8 38.9 40.3 ..Gas 15.3 20.7 22.7 22.6 28.0 29.5 ..Comb. Renewables & Wastes 3.3 9.8 10.1 10.4 11.8 12.1 ..Nuclear – – – – – – ..Hydro 7.5 10.8 12.5 11.7 10.8 10.6 ..Geothermal – – 0.1 0.1 0.1 0.1 ..Solar/Wind/Other – 0.1 0.2 0.3 0.8 1.1 ..Electricity Trade –0.6 –0.2 –0.4 0.1 0.4 0.4 ..
0 is negligible, – is nil, .. is not available.
267
261-Energy Balances 2/12/03 11:24 Page 267

Unit: Mtoe
DEMAND
FINAL CONSUMPTION BY SECTOR
1973 1990 2000 2001 2010 2020 2030
TFC 16.8 20.6 24.5 25.8 26.9 29.0 ..Coal1 2.0 1.5 1.2 1.2 0.9 0.7 ..Oil 10.2 9.5 11.1 11.8 11.2 12.1 ..Gas 1.8 3.1 4.4 4.3 5.6 5.8 ..Comb. Renewables & Wastes2 0.7 2.1 2.2 2.5 2.6 2.8 ..Geothermal – 0.0 0.0 0.0 0.0 0.0 ..Solar/Wind/Other – 0.0 0.1 0.1 0.1 0.1 ..Electricity 2.2 3.7 4.5 4.9 5.2 5.9 ..Heat – 0.6 1.0 1.1 1.2 1.5 ..
Shares (%)Coal 11.8 7.4 4.8 4.6 3.4 2.5 ..Oil 60.4 46.2 45.2 45.9 41.7 41.8 ..Gas 10.7 14.9 18.0 16.7 21.0 20.1 ..Comb. Renewables & Wastes 4.1 10.4 9.2 9.5 9.8 9.6 ..Geothermal – – – – – – ..Solar/Wind/Other – 0.1 0.3 0.3 0.5 0.5 ..Electricity 12.9 18.1 18.5 18.8 19.2 20.4 ..Heat – 3.0 4.0 4.1 4.5 5.1 ..
TOTAL INDUSTRY6 6.5 7.0 8.2 8.0 8.7 8.9 ..Coal1 0.7 0.8 0.9 0.9 0.7 0.6 ..Oil 3.3 2.1 2.3 2.3 2.0 2.3 ..Gas 1.3 2.0 2.3 2.1 3.0 2.8 ..Comb. Renewables & Wastes2 0.0 0.6 0.7 0.7 0.8 0.8 ..Geothermal – – – – – – ..Solar/Wind/Other – – – – – – ..Electricity 1.0 1.5 1.9 2.0 2.1 2.3 ..Heat – – – – – 0.0 ..
Shares (%)Coal 11.5 11.0 11.2 11.6 8.4 7.0 ..Oil 51.7 29.8 28.1 29.0 23.0 25.5 ..Gas 20.2 28.6 28.6 26.1 34.9 32.0 ..Comb. Renewables & Wastes 0.5 8.7 8.2 8.4 9.2 9.6 ..Geothermal – – – – – – ..Solar/Wind/Other – – – – – – ..Electricity 16.1 21.8 23.9 24.9 24.5 25.8 ..Heat – – – – – – ..
TRANSPORT7 4.0 5.2 6.9 7.4 7.3 8.1 ..
TOTAL OTHER SECTORS8 6.3 8.4 9.4 10.4 10.9 12.0 ..Coal1 1.1 0.8 0.3 0.3 0.2 0.1 ..Oil 3.1 2.6 2.4 2.8 2.6 2.5 ..Gas 0.5 1.0 1.9 2.0 2.4 2.7 ..Comb. Renewables & Wastes2 0.7 1.5 1.6 1.8 1.8 1.9 ..Geothermal – 0.0 0.0 0.0 0.0 0.0 ..Solar/Wind/Other – 0.0 0.1 0.1 0.1 0.1 ..Electricity 1.0 1.9 2.3 2.5 2.6 3.2 ..Heat – 0.6 1.0 1.1 1.2 1.5 ..
Shares (%)Coal 17.9 8.9 2.7 2.5 1.7 0.9 ..Oil 48.6 31.2 25.5 26.5 23.5 20.7 ..Gas 7.6 11.8 19.7 18.7 21.7 22.6 ..Comb. Renewables & Wastes 10.3 18.3 16.7 17.1 16.6 16.0 ..Geothermal – – 0.1 – 0.1 – ..Solar/Wind/Other – 0.2 0.7 0.6 1.1 1.1 ..Electricity 15.6 22.4 24.3 24.3 24.2 26.4 ..Heat – 7.3 10.3 10.1 11.1 12.2 ..
268
AUSTRIA Energy Balances and Key Statistical Data
261-Energy Balances 2/12/03 11:24 Page 268

Unit: Mtoe
DEMAND
ENERGY TRANSFORMATION AND LOSSES
1973 1990 2000 2001 2010 2020 2030
ELECTRICITY GENERATION9
INPUT (Mtoe) 4.9 6.9 8.2 8.5 9.3 10.7 ..OUTPUT (Mtoe) 2.7 4.2 5.2 5.4 5.7 6.6 ..(TWh gross) 30.9 49.3 60.2 62.4 66.7 76.5 ..
Output Shares (%)Coal 10.3 14.2 11.2 12.7 8.0 3.7 ..Oil 14.1 3.8 2.7 3.2 5.2 8.7 ..Gas 14.3 15.7 13.4 13.6 18.4 22.4 ..Comb. Renewables & Wastes 0.7 2.4 3.0 3.2 4.7 5.0 ..Nuclear – – – – – – ..Hydro 60.6 63.9 69.5 67.0 61.0 56.5 ..Geothermal – – – – – – ..Solar/Wind/Other – – 0.1 0.3 2.5 3.6 ..
TOTAL LOSSES 4.7 4.5 4.3 4.7 5.4 6.0 ..of which:Electricity and Heat Generation10 2.2 2.0 2.0 2.0 2.2 2.5 ..Other Transformation 1.3 0.9 0.8 0.9 0.8 0.7 ..Own Use and Losses11 1.2 1.5 1.5 1.8 2.4 2.8 ..
Statistical Differences 0.1 0.0 0.0 0.3 – – –
INDICATORS
1973 1990 2000 2001 2010 2020 2030
GDP (billion 1995 US$) 137.92 212.47 269.37 271.17 324.07 395.05 ..Population (millions) 7.59 7.73 8.11 8.13 8.20 8.28 ..TPES/GDP12 0.16 0.12 0.11 0.11 0.10 0.09 ..Energy Production/TPES 0.37 0.32 0.33 0.32 0.32 0.33 ..Per Capita TPES13 2.85 3.24 3.55 3.78 3.94 4.22 ..Oil Supply/GDP12 0.09 0.05 0.05 0.05 0.04 0.04 ..TFC/GDP12 0.12 0.10 0.09 0.10 0.08 0.07 ..Per Capita TFC13 2.22 2.66 3.02 3.17 3.28 3.50 ..Energy-related CO2
Emissions (Mt CO2)14 54.3 56.6 62.7 66.6 65.5 69.7 ..CO2 Emissions from Bunkers
(Mt CO2) 0.3 0.9 1.7 1.7 1.7 1.7 ..
GROWTH RATES (% per year)
73–79 79–90 90–00 00–01 01–10 10–20 20–30
TPES 1.7 0.4 1.4 6.8 0.6 0.8 ..Coal –1.1 1.1 –1.3 4.4 –2.5 –3.4 ..Oil 0.8 –1.7 1.4 7.8 –0.5 1.2 ..Gas 4.6 1.7 2.3 6.6 3.0 1.3 ..Comb. Renewables & Wastes 6.3 8.1 1.8 9.0 2.1 1.0 ..Nuclear – – – – – – ..Hydro 6.7 1.2 2.9 – –0.3 0.6 ..Geothermal – – 36.8 – 3.7 – ..Solar/Wind/Other – – 16.7 17.1 14.0 3.5 ..
TFC 2.2 0.7 1.7 5.4 0.5 0.7 ..
Electricity Consumption 3.9 2.8 2.0 7.2 0.7 1.4 ..Energy Production 0.2 0.1 1.7 1.5 0.8 1.1 ..Net Oil Imports 2.7 –1.6 1.4 6.4 0.1 1.2 ..GDP 3.0 2.4 2.4 0.7 2.0 2.0 ..Growth in the TPES/GDP Ratio –1.2 –1.9 –1.0 6.1 –1.4 –1.2 ..Growth in the TFC/GDP Ratio –0.8 –1.7 –0.6 4.7 –1.5 –1.2 ..
Please note: Rounding may cause totals to differ from the sum of the elements.
269
Energy Balances and Key Statistical Data AUSTRIA
261-Energy Balances 2/12/03 11:24 Page 269

261-Energy Balances 2/12/03 11:24 Page 270
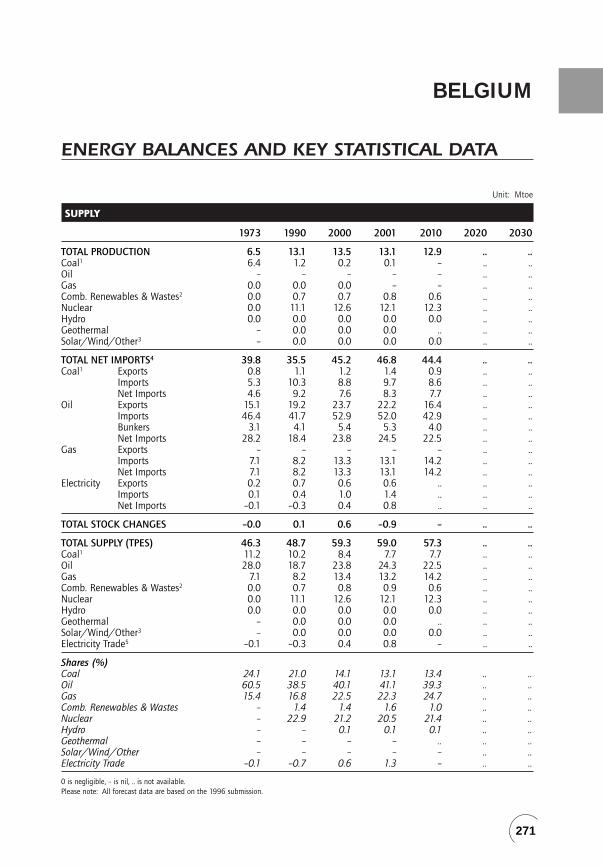
BELGIUM
ENERGY BALANCES AND KEY STATISTICAL DATA
Unit: Mtoe
SUPPLY
1973 1990 2000 2001 2010 2020 2030
TOTAL PRODUCTION 6.5 13.1 13.5 13.1 12.9 .. ..Coal1 6.4 1.2 0.2 0.1 – .. ..Oil – – – – – .. ..Gas 0.0 0.0 0.0 – – .. ..Comb. Renewables & Wastes2 0.0 0.7 0.7 0.8 0.6 .. ..Nuclear 0.0 11.1 12.6 12.1 12.3 .. ..Hydro 0.0 0.0 0.0 0.0 0.0 .. ..Geothermal – 0.0 0.0 0.0 .. .. ..Solar/Wind/Other3 – 0.0 0.0 0.0 0.0 .. ..
TOTAL NET IMPORTS4 39.8 35.5 45.2 46.8 44.4 .. ..Coal1 Exports 0.8 1.1 1.2 1.4 0.9 .. ..
Imports 5.3 10.3 8.8 9.7 8.6 .. ..Net Imports 4.6 9.2 7.6 8.3 7.7 .. ..
Oil Exports 15.1 19.2 23.7 22.2 16.4 .. ..Imports 46.4 41.7 52.9 52.0 42.9 .. ..Bunkers 3.1 4.1 5.4 5.3 4.0 .. ..Net Imports 28.2 18.4 23.8 24.5 22.5 .. ..
Gas Exports – – – – – .. ..Imports 7.1 8.2 13.3 13.1 14.2 .. ..Net Imports 7.1 8.2 13.3 13.1 14.2 .. ..
Electricity Exports 0.2 0.7 0.6 0.6 .. .. ..Imports 0.1 0.4 1.0 1.4 .. .. ..Net Imports –0.1 –0.3 0.4 0.8 .. .. ..
TOTAL STOCK CHANGES –0.0 0.1 0.6 –0.9 – .. ..
TOTAL SUPPLY (TPES) 46.3 48.7 59.3 59.0 57.3 .. ..Coal1 11.2 10.2 8.4 7.7 7.7 .. ..Oil 28.0 18.7 23.8 24.3 22.5 .. ..Gas 7.1 8.2 13.4 13.2 14.2 .. ..Comb. Renewables & Wastes2 0.0 0.7 0.8 0.9 0.6 .. ..Nuclear 0.0 11.1 12.6 12.1 12.3 .. ..Hydro 0.0 0.0 0.0 0.0 0.0 .. ..Geothermal – 0.0 0.0 0.0 .. .. ..Solar/Wind/Other3 – 0.0 0.0 0.0 0.0 .. ..Electricity Trade5 –0.1 –0.3 0.4 0.8 – .. ..
Shares (%)Coal 24.1 21.0 14.1 13.1 13.4 .. ..Oil 60.5 38.5 40.1 41.1 39.3 .. ..Gas 15.4 16.8 22.5 22.3 24.7 .. ..Comb. Renewables & Wastes – 1.4 1.4 1.6 1.0 .. ..Nuclear – 22.9 21.2 20.5 21.4 .. ..Hydro – – 0.1 0.1 0.1 .. ..Geothermal – – – – .. .. ..Solar/Wind/Other – – – – – .. ..Electricity Trade –0.1 –0.7 0.6 1.3 – .. ..
0 is negligible, – is nil, .. is not available.Please note: All forecast data are based on the 1996 submission.
271
261-Energy Balances 2/12/03 11:24 Page 271
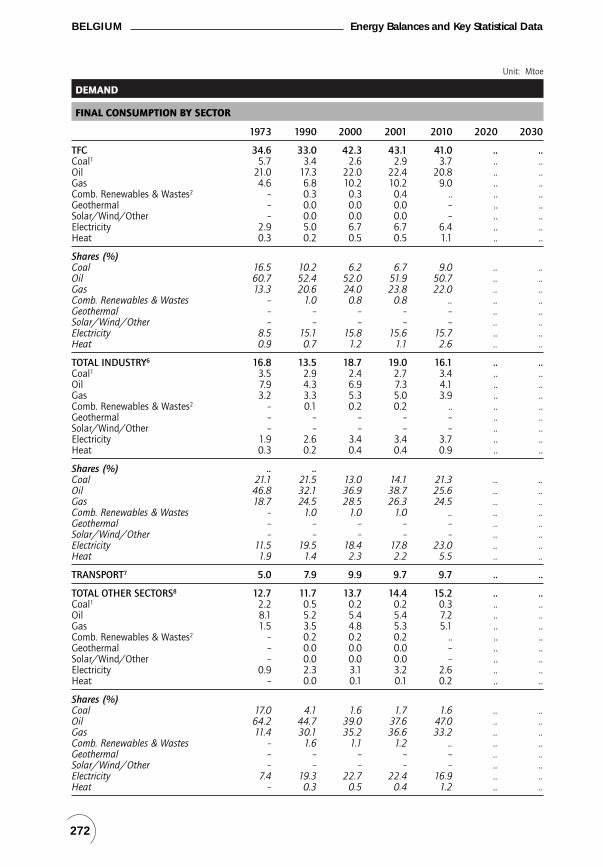
Unit: Mtoe
DEMAND
FINAL CONSUMPTION BY SECTOR
1973 1990 2000 2001 2010 2020 2030
TFC 34.6 33.0 42.3 43.1 41.0 .. ..Coal1 5.7 3.4 2.6 2.9 3.7 .. ..Oil 21.0 17.3 22.0 22.4 20.8 .. ..Gas 4.6 6.8 10.2 10.2 9.0 .. ..Comb. Renewables & Wastes2 – 0.3 0.3 0.4 .. .. ..Geothermal – 0.0 0.0 0.0 – .. ..Solar/Wind/Other – 0.0 0.0 0.0 – .. ..Electricity 2.9 5.0 6.7 6.7 6.4 .. ..Heat 0.3 0.2 0.5 0.5 1.1 .. ..
Shares (%)Coal 16.5 10.2 6.2 6.7 9.0 .. ..Oil 60.7 52.4 52.0 51.9 50.7 .. ..Gas 13.3 20.6 24.0 23.8 22.0 .. ..Comb. Renewables & Wastes – 1.0 0.8 0.8 .. .. ..Geothermal – – – – – .. ..Solar/Wind/Other – – – – – .. ..Electricity 8.5 15.1 15.8 15.6 15.7 .. ..Heat 0.9 0.7 1.2 1.1 2.6 .. ..
TOTAL INDUSTRY6 16.8 13.5 18.7 19.0 16.1 .. ..Coal1 3.5 2.9 2.4 2.7 3.4 .. ..Oil 7.9 4.3 6.9 7.3 4.1 .. ..Gas 3.2 3.3 5.3 5.0 3.9 .. ..Comb. Renewables & Wastes2 – 0.1 0.2 0.2 .. .. ..Geothermal – – – – – .. ..Solar/Wind/Other – – – – – .. ..Electricity 1.9 2.6 3.4 3.4 3.7 .. ..Heat 0.3 0.2 0.4 0.4 0.9 .. ..
Shares (%) .. ..Coal 21.1 21.5 13.0 14.1 21.3 .. ..Oil 46.8 32.1 36.9 38.7 25.6 .. ..Gas 18.7 24.5 28.5 26.3 24.5 .. ..Comb. Renewables & Wastes – 1.0 1.0 1.0 .. .. ..Geothermal – – – – – .. ..Solar/Wind/Other – – – – – .. ..Electricity 11.5 19.5 18.4 17.8 23.0 .. ..Heat 1.9 1.4 2.3 2.2 5.5 .. ..
TRANSPORT7 5.0 7.9 9.9 9.7 9.7 .. ..
TOTAL OTHER SECTORS8 12.7 11.7 13.7 14.4 15.2 .. ..Coal1 2.2 0.5 0.2 0.2 0.3 .. ..Oil 8.1 5.2 5.4 5.4 7.2 .. ..Gas 1.5 3.5 4.8 5.3 5.1 .. ..Comb. Renewables & Wastes2 – 0.2 0.2 0.2 .. .. ..Geothermal – 0.0 0.0 0.0 – .. ..Solar/Wind/Other – 0.0 0.0 0.0 – .. ..Electricity 0.9 2.3 3.1 3.2 2.6 .. ..Heat – 0.0 0.1 0.1 0.2 .. ..
Shares (%)Coal 17.0 4.1 1.6 1.7 1.6 .. ..Oil 64.2 44.7 39.0 37.6 47.0 .. ..Gas 11.4 30.1 35.2 36.6 33.2 .. ..Comb. Renewables & Wastes – 1.6 1.1 1.2 .. .. ..Geothermal – – – – – .. ..Solar/Wind/Other – – – – – .. ..Electricity 7.4 19.3 22.7 22.4 16.9 .. ..Heat – 0.3 0.5 0.4 1.2 .. ..
272
BELGIUM Energy Balances and Key Statistical Data
261-Energy Balances 2/12/03 11:24 Page 272

Unit: Mtoe
DEMAND
ENERGY TRANSFORMATION AND LOSSES
1973 1990 2000 2001 2010 2020 2030
ELECTRICITY GENERATION9
INPUT (Mtoe) 10.0 17.7 19.7 18.7 22.0 .. ..OUTPUT (Mtoe) 3.5 6.0 7.1 6.8 7.3 .. ..(TWh gross) 40.6 70.3 82.8 78.6 84.9 .. ..
Output Shares (%)Coal 21.7 28.2 19.4 16.2 8.7 .. ..Oil 53.7 1.9 1.0 2.1 2.3 .. ..Gas 23.7 7.7 19.3 20.1 29.6 .. ..Comb. Renewables & Wastes 0.3 1.0 1.6 2.0 3.5 .. ..Nuclear 0.2 60.8 58.2 59.0 55.5 .. ..Hydro 0.4 0.4 0.6 0.6 0.4 .. ..Geothermal – – – – – .. ..Solar/Wind/Other – 0.0 0.0 0.0 0.0 .. ..
TOTAL LOSSES 11.8 16.1 16.3 15.6 16.3 .. ..of which:Electricity and Heat Generation10 6.2 11.4 12.0 11.4 13.6 .. ..Other Transformation 4.2 2.1 1.6 1.5 1.3 .. ..Own Use and Losses11 1.4 2.7 2.7 2.7 1.5 .. ..
Statistical Differences –0.1 –0.5 0.7 0.3 – .. ..
INDICATORS
1973 1990 2000 2001 2010 2020 2030
GDP (billion 1995 US$) 174.37 255.75 316.69 319.13 391.60 .. ..Population (millions) 9.73 9.97 10.25 10.28 10.00 .. ..TPES/GDP12 0.27 0.19 0.19 0.18 0.15 .. ..Energy Production/TPES 0.14 0.27 0.23 0.22 0.23 .. ..Per Capita TPES13 4.76 4.88 5.79 5.74 5.73 .. ..Oil Supply/GDP12 0.16 0.07 0.08 0.08 0.06 .. ..TFC/GDP12 0.20 0.13 0.13 0.13 0.10 .. ..Per Capita TFC13 3.55 3.32 4.13 4.19 4.10 .. ..Energy-related CO2
Emissions (Mt CO2)14 133.6 106.9 118.5 119.6 116.4 .. ..CO2 Emissions from Bunkers
(Mt CO2) 11.3 16.0 21.7 20.2 16.0 .. ..
GROWTH RATES (% per year)
73–79 79–90 90–00 00–01 01–10 10–20 20–30
TPES 0.7 0.1 2.0 –0.5 –0.3 .. ..Coal –1.0 –0.3 –2.0 –7.9 –0.0 .. ..Oil –1.5 –2.8 2.4 2.1 –0.8 .. ..Gas 4.5 –1.2 5.0 –1.4 0.8 .. ..Comb. Renewables & Wastes 41.7 22.8 1.8 13.2 –5.1 .. ..Nuclear 130.2 12.8 1.2 –3.8 0.2 .. ..Hydro 4.9 1.3 5.4 –2.6 –2.6 .. ..Geothermal – – – – – .. ..Solar/Wind/Other – – 7.2 150.0 –16.4 .. ..
TFC 0.3 –0.6 2.5 1.9 –0.6 .. ..
Electricity Consumption 4.2 2.6 2.9 0.8 –0.5 .. ..Energy Production 2.4 5.2 0.4 –3.3 –0.2 .. ..Net Oil Imports –0.8 –3.4 2.6 2.9 –0.9 .. ..GDP 2.4 2.2 2.2 0.8 2.3 .. ..Growth in the TPES/GDP Ratio –1.6 –2.1 –0.2 –1.3 –2.6 .. ..Growth in the TFC/GDP Ratio –2.0 –2.7 0.3 1.1 –2.8 .. ..
Please note: Rounding may cause totals to differ from the sum of the elements.
273
Energy Balances and Key Statistical Data BELGIUM
261-Energy Balances 2/12/03 11:24 Page 273

261-Energy Balances 2/12/03 11:24 Page 274

CANADA
ENERGY BALANCES AND KEY STATISTICAL DATA
Unit: Mtoe
SUPPLY
1973 1990 2000 2001 2010 2020 2030
TOTAL PRODUCTION 198.0 273.7 374.8 379.2 461.3 505.3 ..Coal1 11.7 37.9 37.1 37.6 39.9 38.7 ..Oil 96.3 94.1 128.4 130.2 170.9 193.5 ..Gas 61.4 88.6 148.3 152.3 179.5 199.9 ..Comb. Renewables & Wastes2 7.8 8.1 11.2 10.5 17.0 19.0 ..Nuclear 4.1 19.4 19.0 20.0 20.3 19.0 ..Hydro 16.7 25.5 30.8 28.6 33.2 34.6 ..Geothermal – – – – 0.4 0.4 ..Solar/Wind/Other3 – 0.0 0.0 0.0 0.1 0.1 ..
TOTAL NET IMPORTS4 –35.4 –60.6 –132.2 –132.6 –175.1 –189.6 ..Coal1 Exports 7.6 21.4 22.3 20.9 20.3 23.1 ..
Imports 10.5 9.5 14.6 15.7 8.7 6.5 ..Net Imports 2.8 –11.9 –7.6 –5.2 –11.6 –16.6 ..
Oil Exports 63.1 49.7 93.4 96.0 128.2 143.9 ..Imports 48.8 34.5 54.3 57.0 54.3 60.0 ..Bunkers – 0.9 1.1 1.0 0.7 0.8 ..Net Imports –14.3 –16.1 –40.2 –40.0 –74.6 –84.7 ..
Gas Exports 23.1 33.0 82.7 88.5 88.0 88.0 ..Imports 0.3 0.5 1.3 3.2 1.0 1.0 ..Net Imports –22.8 –32.5 –81.3 –85.3 –86.9 –86.9 ..
Electricity Exports 1.4 1.6 4.4 3.4 5.4 4.7 ..Imports 0.2 1.5 1.3 1.4 3.4 3.3 ..Net Imports –1.2 –0.0 –3.1 –2.0 –2.0 –1.4 ..
TOTAL STOCK CHANGES –1.6 –4.0 8.3 1.6 – – ..
TOTAL SUPPLY (TPES) 161.0 209.1 250.9 248.2 286.1 315.7 ..Coal1 15.3 24.3 31.0 30.7 28.3 22.1 ..Oil 81.0 77.1 87.8 88.8 96.3 108.9 ..Gas 37.3 54.7 74.2 71.5 92.6 113.0 ..Comb. Renewables & Wastes2 7.8 8.1 11.2 10.5 17.0 19.0 ..Nuclear 4.1 19.4 19.0 20.0 20.3 19.0 ..Hydro 16.7 25.5 30.8 28.6 33.2 34.6 ..Geothermal – – – – 0.4 0.4 ..Solar/Wind/Other3 – 0.0 0.0 0.0 0.1 0.1 ..Electricity Trade5 –1.2 –0.0 –3.1 –2.0 –2.0 –1.4 ..
Shares (%)Coal 9.5 11.6 12.3 12.4 9.9 7.0 ..Oil 50.3 36.9 35.0 35.8 33.7 34.5 ..Gas 23.2 26.2 29.6 28.8 32.3 35.8 ..Comb. Renewables & Wastes 4.9 3.9 4.5 4.2 5.9 6.0 ..Nuclear 2.5 9.3 7.6 8.1 7.1 6.0 ..Hydro 10.4 12.2 12.3 11.5 11.6 10.9 ..Geothermal – – – – 0.2 0.1 ..Solar/Wind/Other – – – – – – ..Electricity Trade –0.7 – –1.2 –0.8 –0.7 –0.4 ..
0 is negligible, – is nil, .. is not available.
275
261-Energy Balances 2/12/03 11:24 Page 275

Unit: Mtoe
DEMAND
FINAL CONSUMPTION BY SECTOR
1973 1990 2000 2001 2010 2020 2030
TFC 133.2 161.3 191.4 185.0 220.3 248.8 ..Coal1 5.2 3.1 3.6 3.2 4.7 5.4 ..Oil 77.6 70.6 82.0 81.5 86.8 98.2 ..Gas 23.7 43.3 53.1 48.5 62.2 69.8 ..Comb. Renewables & Wastes2 7.6 7.8 10.5 9.8 15.6 17.5 ..Geothermal – – – – – – ..Solar/Wind/Other – – – – – – ..Electricity 18.9 36.0 41.4 41.1 50.2 57.0 ..Heat 0.1 0.6 0.8 0.8 0.7 0.9 ..
Shares (%)Coal 3.9 1.9 1.9 1.7 2.1 2.2 ..Oil 58.3 43.7 42.9 44.1 39.4 39.5 ..Gas 17.8 26.8 27.7 26.2 28.2 28.1 ..Comb. Renewables & Wastes 5.7 4.8 5.5 5.3 7.1 7.0 ..Geothermal – – – – – – ..Solar/Wind/Other – – – – – – ..Electricity 14.2 22.3 21.6 22.2 22.8 22.9 ..Heat 0.1 0.4 0.4 0.5 0.3 0.3 ..
TOTAL INDUSTRY6 52.8 63.2 75.3 71.3 97.5 111.1 ..Coal1 4.7 3.0 3.5 3.2 4.6 5.3 ..Oil 21.4 18.7 21.7 21.7 24.9 27.6 ..Gas 11.9 20.2 23.1 20.3 31.2 36.2 ..Comb. Renewables & Wastes2 5.7 6.2 8.7 8.0 13.6 15.4 ..Geothermal – – – – – – ..Solar/Wind/Other – – – – – – ..Electricity 9.1 14.4 17.5 17.2 22.4 25.8 ..Heat 0.1 0.6 0.8 0.8 0.7 0.9 ..
Shares (%)Coal 8.9 4.8 4.7 4.5 4.8 4.8 ..Oil 40.4 29.5 28.9 30.5 25.5 24.8 ..Gas 22.5 32.0 30.7 28.5 32.0 32.6 ..Comb. Renewables & Wastes 10.8 9.8 11.5 11.2 14.0 13.8 ..Geothermal – – – – – – ..Solar/Wind/Other – – – – – – ..Electricity 17.2 22.9 23.2 24.2 23.0 23.2 ..Heat 0.2 1.0 1.1 1.2 0.8 0.8 ..
TRANSPORT7 35.3 44.2 53.5 52.7 63.1 72.8 ..
TOTAL OTHER SECTORS8 45.1 54.0 62.7 61.0 59.7 64.8 ..Coal1 0.4 0.1 0.0 0.0 0.1 0.1 ..Oil 21.3 10.9 12.0 11.9 6.5 6.9 ..Gas 11.9 20.2 25.3 23.8 24.5 25.7 ..Comb. Renewables & Wastes2 1.9 1.6 1.8 1.8 2.0 2.2 ..Geothermal – – – – – – ..Solar/Wind/Other – – – – – – ..Electricity 9.5 21.2 23.5 23.5 26.7 30.0 ..Heat – 0.0 0.0 0.0 – – ..
Shares (%)Coal 0.9 0.1 0.1 0.1 0.1 0.1 ..Oil 47.4 20.2 19.1 19.4 10.8 10.7 ..Gas 26.3 37.4 40.3 38.9 41.0 39.6 ..Comb. Renewables & Wastes 4.2 3.0 2.9 3.0 3.3 3.3 ..Geothermal – – – – – – ..Solar/Wind/Other – – – – – – ..Electricity 21.2 39.3 37.6 38.5 44.7 46.2 ..Heat – – – – – – ..
276
CANADA Energy Balances and Key Statistical Data
261-Energy Balances 2/12/03 11:24 Page 276
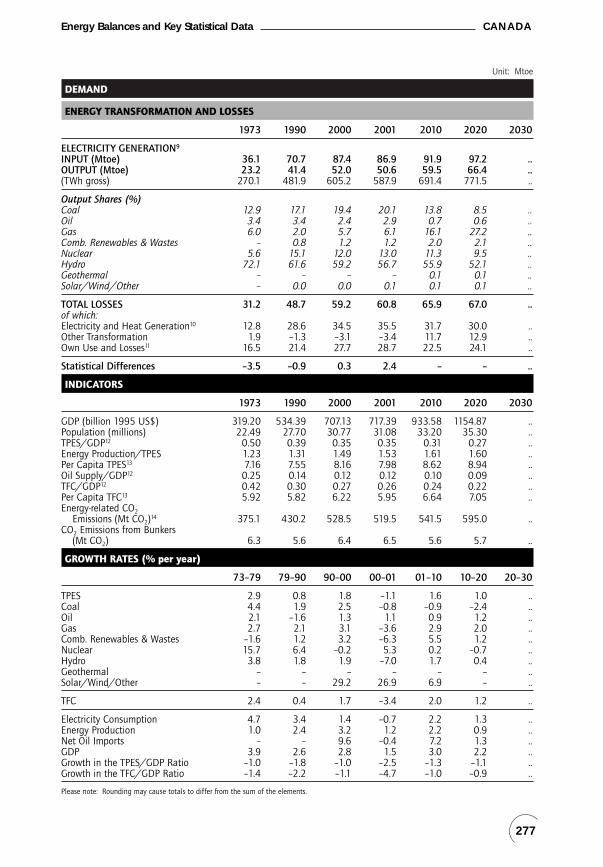
Unit: Mtoe
DEMAND
ENERGY TRANSFORMATION AND LOSSES
1973 1990 2000 2001 2010 2020 2030
ELECTRICITY GENERATION9
INPUT (Mtoe) 36.1 70.7 87.4 86.9 91.9 97.2 ..OUTPUT (Mtoe) 23.2 41.4 52.0 50.6 59.5 66.4 ..(TWh gross) 270.1 481.9 605.2 587.9 691.4 771.5 ..
Output Shares (%)Coal 12.9 17.1 19.4 20.1 13.8 8.5 ..Oil 3.4 3.4 2.4 2.9 0.7 0.6 ..Gas 6.0 2.0 5.7 6.1 16.1 27.2 ..Comb. Renewables & Wastes – 0.8 1.2 1.2 2.0 2.1 ..Nuclear 5.6 15.1 12.0 13.0 11.3 9.5 ..Hydro 72.1 61.6 59.2 56.7 55.9 52.1 ..Geothermal – – – – 0.1 0.1 ..Solar/Wind/Other – 0.0 0.0 0.1 0.1 0.1 ..
TOTAL LOSSES 31.2 48.7 59.2 60.8 65.9 67.0 ..of which:Electricity and Heat Generation10 12.8 28.6 34.5 35.5 31.7 30.0 ..Other Transformation 1.9 –1.3 –3.1 –3.4 11.7 12.9 ..Own Use and Losses11 16.5 21.4 27.7 28.7 22.5 24.1 ..
Statistical Differences –3.5 –0.9 0.3 2.4 – – ..
INDICATORS
1973 1990 2000 2001 2010 2020 2030
GDP (billion 1995 US$) 319.20 534.39 707.13 717.39 933.58 1154.87 ..Population (millions) 22.49 27.70 30.77 31.08 33.20 35.30 ..TPES/GDP12 0.50 0.39 0.35 0.35 0.31 0.27 ..Energy Production/TPES 1.23 1.31 1.49 1.53 1.61 1.60 ..Per Capita TPES13 7.16 7.55 8.16 7.98 8.62 8.94 ..Oil Supply/GDP12 0.25 0.14 0.12 0.12 0.10 0.09 ..TFC/GDP12 0.42 0.30 0.27 0.26 0.24 0.22 ..Per Capita TFC13 5.92 5.82 6.22 5.95 6.64 7.05 ..Energy-related CO2
Emissions (Mt CO2)14 375.1 430.2 528.5 519.5 541.5 595.0 ..CO2 Emissions from Bunkers
(Mt CO2) 6.3 5.6 6.4 6.5 5.6 5.7 ..
GROWTH RATES (% per year)
73–79 79–90 90–00 00–01 01–10 10–20 20–30
TPES 2.9 0.8 1.8 –1.1 1.6 1.0 ..Coal 4.4 1.9 2.5 –0.8 –0.9 –2.4 ..Oil 2.1 –1.6 1.3 1.1 0.9 1.2 ..Gas 2.7 2.1 3.1 –3.6 2.9 2.0 ..Comb. Renewables & Wastes –1.6 1.2 3.2 –6.3 5.5 1.2 ..Nuclear 15.7 6.4 –0.2 5.3 0.2 –0.7 ..Hydro 3.8 1.8 1.9 –7.0 1.7 0.4 ..Geothermal – – – – – – ..Solar/Wind/Other – – 29.2 26.9 6.9 – ..
TFC 2.4 0.4 1.7 –3.4 2.0 1.2 ..
Electricity Consumption 4.7 3.4 1.4 –0.7 2.2 1.3 ..Energy Production 1.0 2.4 3.2 1.2 2.2 0.9 ..Net Oil Imports – – 9.6 –0.4 7.2 1.3 ..GDP 3.9 2.6 2.8 1.5 3.0 2.2 ..Growth in the TPES/GDP Ratio –1.0 –1.8 –1.0 –2.5 –1.3 –1.1 ..Growth in the TFC/GDP Ratio –1.4 –2.2 –1.1 –4.7 –1.0 –0.9 ..
Please note: Rounding may cause totals to differ from the sum of the elements.
277
Energy Balances and Key Statistical Data CANADA
261-Energy Balances 2/12/03 11:24 Page 277

261-Energy Balances 2/12/03 11:24 Page 278

CZECH REPUBLIC
ENERGY BALANCES AND KEY STATISTICAL DATA
Unit: Mtoe
SUPPLY
1973 1990 2000 2001 2010 2020 2030
TOTAL PRODUCTION 38.51 38.52 29.86 30.49 25.66 21.47 19.37Coal1 38.01 34.71 25.00 25.29 17.00 12.00 9.60Oil 0.04 0.21 0.38 0.36 0.40 0.40 0.40Gas 0.36 0.20 0.17 0.12 0.10 0.30 0.30Comb. Renewables & Wastes2 – – 0.62 0.69 1.30 1.90 2.20Nuclear – 3.28 3.54 3.84 6.70 6.70 6.70Hydro 0.09 0.12 0.15 0.18 0.16 0.17 0.17Geothermal – – – – – – –Solar/Wind/Other3 – – – – – – –
TOTAL NET IMPORTS4 6.99 7.63 9.42 10.67 16.40 22.50 24.40Coal1 Exports 2.56 7.26 5.78 5.56 4.10 1.10 0.90
Imports 0.15 1.57 1.04 1.11 1.20 1.40 1.60Net Imports –2.41 –5.69 –4.74 –4.45 –2.90 0.30 0.70
Oil Exports 0.04 6.56 1.09 1.31 1.60 1.60 1.70Imports 8.91 15.16 8.63 9.51 10.20 10.60 11.00Bunkers – – – – – – –Net Imports 8.87 8.60 7.54 8.20 8.60 9.00 9.30
Gas Exports 0.01 – 0.00 – – – –Imports 0.73 4.78 7.48 7.73 11.00 13.00 14.00Net Imports 0.72 4.78 7.48 7.73 11.00 13.00 14.00
Electricity Exports 0.44 0.76 1.61 1.63 0.70 0.40 0.30Imports 0.25 0.70 0.75 0.81 0.40 0.60 0.70Net Imports –0.19 –0.06 –0.86 –0.82 –0.30 0.20 0.40
TOTAL STOCK CHANGES –0.08 1.25 1.10 0.24 – – –
TOTAL SUPPLY (TPES) 45.42 47.40 40.38 41.40 42.06 43.97 43.77Coal1 35.59 29.84 21.53 21.09 14.10 12.30 10.30Oil 8.91 8.96 7.89 8.39 9.00 9.40 9.70Gas 1.01 5.26 7.50 8.03 11.10 13.30 14.30Comb. Renewables & Wastes2 – – 0.62 0.69 1.30 1.90 2.20Nuclear – 3.28 3.54 3.84 6.70 6.70 6.70Hydro 0.09 0.12 0.15 0.18 0.16 0.17 0.17Geothermal – – – – – – –Solar/Wind/Other3 – – – – – – –Electricity Trade5 –0.19 –0.06 –0.86 –0.82 –0.30 0.20 0.40
Shares (%)Coal 78.4 63.0 53.3 50.9 33.5 28.0 23.5Oil 19.6 18.9 19.6 20.3 21.4 21.4 22.2Gas 2.2 11.1 18.6 19.4 26.4 30.3 32.7Comb. Renewables & Wastes – – 1.5 1.7 3.1 4.3 5.0Nuclear – 6.9 8.8 9.3 15.9 15.2 15.3Hydro 0.2 0.3 0.4 0.4 0.4 0.4 0.4Geothermal – – – – – – –Solar/Wind/Other – – – – – – –Electricity Trade –0.4 –0.1 –2.1 –2.0 –0.7 0.5 0.9
0 is negligible, – is nil, .. is not available.
279
261-Energy Balances 2/12/03 11:24 Page 279

Unit: Mtoe
DEMAND
FINAL CONSUMPTION BY SECTOR
1973 1990 2000 2001 2010 2020 2030
TFC 33.07 35.30 25.14 25.57 28.20 30.40 30.80Coal1 20.66 17.43 4.59 3.81 2.70 2.30 1.60Oil 8.06 8.09 7.55 7.89 8.30 8.40 8.70Gas 1.81 4.19 5.91 6.42 9.00 10.50 10.70Comb. Renewables & Wastes2 – – 0.21 0.28 0.70 1.00 1.20Geothermal – – – – – – –Solar/Wind/Other – – – – – – –Electricity 2.54 4.14 4.25 4.38 4.45 5.10 5.40Heat – 1.45 2.62 2.79 3.05 3.10 3.20
Shares (%)Coal 62.5 49.4 18.3 14.9 9.6 7.6 5.2Oil 24.4 22.9 30.0 30.9 29.4 27.6 28.2Gas 5.5 11.9 23.5 25.1 31.9 34.5 34.7Comb. Renewables & Wastes – – 0.8 1.1 2.5 3.3 3.9Geothermal – – – – – – –Solar/Wind/Other – – – – – – –Electricity 7.7 11.7 16.9 17.1 15.8 16.8 17.5Heat – 4.1 10.4 10.9 10.8 10.2 10.4
TOTAL INDUSTRY6 19.42 18.63 11.17 10.91 12.15 13.25 12.80Coal1 12.06 10.06 3.27 2.81 1.80 1.60 1.10Oil 5.30 4.23 2.75 2.82 3.40 3.30 3.40Gas 0.46 2.02 2.60 2.59 4.10 5.10 5.10Comb. Renewables & Wastes2 – – 0.14 0.19 0.10 0.20 0.30Geothermal – – – – – – –Solar/Wind/Other – – – – – – –Electricity 1.61 2.32 1.63 1.72 1.70 1.95 1.70Heat – – 0.78 0.79 1.05 1.10 1.20
Shares (%)Coal 62.1 54.0 29.3 25.7 14.8 12.1 8.6Oil 27.3 22.7 24.6 25.9 28.0 24.9 26.6Gas 2.4 10.9 23.3 23.7 33.7 38.5 39.8Comb. Renewables & Wastes – – 1.3 1.8 0.8 1.5 2.3Geothermal – – – – – – –Solar/Wind/Other – – – – – – –Electricity 8.3 12.4 14.6 15.7 14.0 14.7 13.3Heat – – 7.0 7.2 8.6 8.3 9.4
TRANSPORT7 2.46 2.86 4.88 5.15 4.80 5.20 5.70
TOTAL OTHER SECTORS8 11.18 13.81 9.10 9.52 11.25 11.95 12.30Coal1 8.47 7.37 1.33 1.00 0.90 0.70 0.50Oil 0.60 1.27 0.19 0.16 0.60 0.70 0.70Gas 1.35 2.17 3.28 3.81 4.70 5.00 5.20Comb. Renewables & Wastes2 – – 0.04 0.07 0.60 0.80 0.90Geothermal – – – – – – –Solar/Wind/Other – – – – – – –Electricity 0.76 1.56 2.42 2.48 2.45 2.75 3.00Heat – 1.45 1.84 2.00 2.00 2.00 2.00
Shares (%)Coal 75.7 53.3 14.6 10.5 8.0 5.9 4.1Oil 5.4 9.2 2.0 1.7 5.3 5.9 5.7Gas 12.1 15.7 36.1 40.0 41.8 41.8 42.3Comb. Renewables & Wastes – – 0.5 0.7 5.3 6.7 7.3Geothermal – – – – – – –Solar/Wind/Other – – – – – – –Electricity 6.8 11.3 26.6 26.1 21.8 23.0 24.4Heat – 10.5 20.3 21.1 17.8 16.7 16.3
280
CZECH REPUBLIC Energy Balances and Key Statistical Data
261-Energy Balances 2/12/03 11:24 Page 280

Unit: Mtoe
DEMAND
ENERGY TRANSFORMATION AND LOSSES
1973 1990 2000 2001 2010 2020 2030
ELECTRICITY GENERATION9
INPUT (Mtoe) 9.70 16.54 20.43 21.17 20.66 20.57 20.47OUTPUT (Mtoe) 3.54 5.38 6.27 6.38 5.75 5.90 6.00(TWh gross) 41.17 62.56 72.91 74.23 66.85 68.60 69.75
Output Shares (%)Coal 85.1 71.8 73.1 71.7 50.2 44.7 41.4Oil 11.3 4.8 0.5 0.5 0.7 1.2 1.4Gas 0.9 1.0 4.3 4.2 6.5 11.4 14.6Comb. Renewables & Wastes – – 1.0 1.0 1.4 2.6 3.0Nuclear – 20.1 18.6 19.9 38.4 37.5 36.8Hydro 2.6 2.3 2.4 2.8 2.8 2.8 2.7Geothermal – – – – – – –Solar/Wind/Other – – – – – – –
TOTAL LOSSES 13.62 13.54 14.86 15.29 13.86 13.57 12.97of which:Electricity and Heat Generation10 6.16 9.34 10.84 11.23 11.11 10.82 10.52Other Transformation 5.90 1.73 1.19 1.21 0.40 0.30 0.10Own Use and Losses11 1.57 2.48 2.83 2.85 2.35 2.45 2.35
Statistical Differences –1.27 –1.45 0.38 0.54 – – –
INDICATORS
1973 1990 2000 2001 2010 2020 2030
GDP (billion 1995 US$) 40.52 54.61 55.28 57.09 88.56 144.25 234.97Population (millions) 9.92 10.36 10.27 10.26 10.10 10.10 10.10TPES/GDP12 1.12 0.87 0.73 0.73 0.47 0.30 0.19Energy Production/TPES 0.85 0.81 0.74 0.74 0.61 0.49 0.44Per Capita TPES13 4.58 4.57 3.93 4.03 4.16 4.35 4.33Oil Supply/GDP12 0.22 0.16 0.14 0.15 0.10 0.07 0.04TFC/GDP12 0.82 0.65 0.45 0.45 0.32 0.21 0.13Per Capita TFC13 3.33 3.41 2.45 2.49 2.79 3.01 3.05Energy-related CO2
Emissions (Mt CO2)14 153.0 153.8 118.4 118.7 103.1 102.6 98.4CO2 Emissions from Bunkers
(Mt CO2) 0.7 0.7 0.5 0.4 0.4 0.4 0.4
GROWTH RATES (% per year)
73–79 79–90 90–00 00–01 01–10 10–20 20–30
TPES 1.2 –0.2 –1.6 2.5 0.2 0.4 –0.0Coal –0.3 –1.4 –3.2 –2.1 –4.4 –1.4 –1.8Oil 4.2 –2.2 –1.3 6.3 0.8 0.4 0.3Gas 14.3 8.0 3.6 7.1 3.7 1.8 0.7Comb. Renewables & Wastes – – – 11.1 7.3 3.9 1.5Nuclear – – 0.8 8.5 6.4 – –Hydro 13.3 –4.1 2.0 17.2 –1.1 0.3 –Geothermal – – – – – – –Solar/Wind/Other – – – – – – –
TFC 2.8 –0.9 –3.3 1.7 1.1 0.8 0.1
Electricity Consumption 3.4 2.6 0.2 3.0 0.2 1.4 0.6Energy Production 2.0 –1.0 –2.5 2.1 –1.9 –1.8 –1.0Net Oil Imports 3.9 –2.4 –1.3 8.7 0.5 0.5 0.3GDP 2.5 1.4 0.1 3.3 5.0 5.0 5.0Growth in the TPES/GDP Ratio –1.3 –1.6 –1.7 –0.7 –4.6 –4.3 –4.8Growth in the TFC/GDP Ratio 0.3 –2.2 –3.5 –1.5 –3.7 –4.0 –4.6
Please note: Rounding may cause totals to differ from the sum of the elements.
281
Energy Balances and Key Statistical Data CZECH REPUBLIC
261-Energy Balances 2/12/03 11:24 Page 281

261-Energy Balances 2/12/03 11:24 Page 282

DENMARK
ENERGY BALANCES AND KEY STATISTICAL DATA
Unit: Mtoe
SUPPLY
1973 1990 2000 2001 2010 2020 2030
TOTAL PRODUCTION 0.43 9.84 27.78 27.17 26.53 8.83 ..Coal1 – – – – – – ..Oil 0.07 5.85 18.26 17.34 13.96 4.42 ..Gas – 2.77 7.41 7.59 9.40 1.44 ..Comb. Renewables & Wastes2 0.35 1.16 1.65 1.77 2.44 2.24 ..Nuclear – – – – – – ..Hydro 0.00 0.00 0.00 0.00 0.00 0.00 ..Geothermal – 0.00 0.00 0.00 0.01 0.01 ..Solar/Wind/Other3 – 0.06 0.46 0.46 0.72 0.72 ..
TOTAL NET IMPORTS4 19.85 7.60 –8.84 –7.23 –2.96 14.88 ..Coal1 Exports 0.04 0.03 0.07 0.10 – – ..
Imports 1.91 6.25 3.86 4.16 5.47 4.32 ..Net Imports 1.87 6.22 3.79 4.06 5.47 4.32 ..
Oil Exports 2.89 5.56 18.47 16.26 2.77 – ..Imports 21.58 8.22 9.97 9.14 – 6.84 ..Bunkers 0.69 0.96 1.34 1.12 1.13 1.13 ..Net Imports 18.00 1.70 –9.84 –8.23 –3.90 5.71 ..
Gas Exports – 0.93 2.88 3.05 3.36 – ..Imports – – – – – 6.15 ..Net Imports – –0.93 –2.88 –3.05 –3.36 6.15 ..
Electricity Exports 0.11 0.42 0.67 0.76 1.17 1.30 ..Imports 0.09 1.03 0.72 0.71 – – ..Net Imports –0.02 0.61 0.06 –0.05 –1.17 –1.30 ..
TOTAL STOCK CHANGES –0.44 0.18 0.46 –0.16 – – ..
TOTAL SUPPLY (TPES) 19.83 17.61 19.40 19.78 23.57 23.71 ..Coal1 1.93 6.10 4.02 4.20 5.47 4.32 ..Oil 17.57 7.86 8.73 8.72 10.05 10.13 ..Gas – 1.82 4.45 4.63 6.04 7.58 ..Comb. Renewables & Wastes2 0.35 1.16 1.68 1.82 2.44 2.24 ..Nuclear – – – – – – ..Hydro 0.00 0.00 0.00 0.00 0.00 0.00 ..Geothermal – 0.00 0.00 0.00 0.01 0.01 ..Solar/Wind/Other3 – 0.06 0.47 0.47 0.72 0.72 ..Electricity Trade5 –0.02 0.61 0.06 –0.05 –1.17 –1.30 ..
Shares (%)Coal 9.7 34.7 20.7 21.2 23.2 18.2 ..Oil 88.6 44.7 45.0 44.1 42.6 42.7 ..Gas – 10.3 22.9 23.4 25.6 32.0 ..Comb. Renewables & Wastes 1.8 6.6 8.7 9.2 10.4 9.5 ..Nuclear – – – – – – ..Hydro – – – – – – ..Geothermal – – – – – – ..Solar/Wind/Other – 0.3 2.4 2.4 3.1 3.0 ..Electricity Trade –0.1 3.4 0.3 –0.2 –5.0 –5.5 ..
0 is negligible, – is nil, .. is not available.Please note: TPES for a given year strongly depends on the amount of net import of electricity, which may vary substantially from year to year. For forecast years; electricity exports may be lower when the CO2 quota system is taken into account.
283
261-Energy Balances 2/12/03 11:24 Page 283

Unit: Mtoe
DEMAND
FINAL CONSUMPTION BY SECTOR
1973 1990 2000 2001 2010 2020 2030
TFC 16.26 13.88 15.04 15.16 17.11 18.14 ..Coal1 0.34 0.41 0.31 0.25 0.31 0.35 ..Oil 14.26 7.55 7.43 7.24 8.22 8.69 ..Gas 0.12 1.16 1.68 1.77 2.00 2.12 ..Comb. Renewables & Wastes2 0.16 0.56 0.58 0.62 0.66 0.68 ..Geothermal – – – – – – ..Solar/Wind/Other – 0.00 0.01 0.01 0.01 0.01 ..Electricity 1.39 2.44 2.79 2.84 3.13 3.44 ..Heat – 1.76 2.25 2.44 2.78 2.85 ..
Shares (%)Coal 2.1 2.9 2.1 1.6 1.8 1.9 ..Oil 87.7 54.4 49.4 47.8 48.1 47.9 ..Gas 0.7 8.3 11.1 11.7 11.7 11.7 ..Comb. Renewables & Wastes 1.0 4.1 3.9 4.1 3.9 3.7 ..Geothermal – – – – – – ..Solar/Wind/Other – – – 0.1 – – ..Electricity 8.5 17.6 18.6 18.7 18.3 19.0 ..Heat – 12.7 14.9 16.1 16.2 15.7 ..
TOTAL INDUSTRY6 4.10 3.01 3.22 3.24 3.79 4.19 ..Coal1 0.21 0.33 0.28 0.22 0.28 0.32 ..Oil 3.41 1.23 1.05 1.06 1.19 1.30 ..Gas 0.02 0.54 0.79 0.83 0.99 1.09 ..Comb. Renewables & Wastes2 0.06 0.11 0.09 0.11 0.13 0.14 ..Geothermal – – – – – – ..Solar/Wind/Other – – – – – – ..Electricity 0.40 0.73 0.86 0.88 0.99 1.12 ..Heat – 0.07 0.15 0.16 0.22 0.23 ..
Shares (%)Coal 5.2 10.9 8.8 6.7 7.3 7.5 ..Oil 83.3 40.8 32.5 32.6 31.4 31.1 ..Gas 0.4 17.9 24.5 25.5 26.2 25.9 ..Comb. Renewables & Wastes 1.4 3.8 2.8 3.3 3.4 3.4 ..Geothermal – – – – – – ..Solar/Wind/Other – – – – – – ..Electricity 9.7 24.1 26.7 27.2 26.1 26.6 ..Heat – 2.5 4.7 4.8 5.7 5.5 ..
TRANSPORT7 3.52 4.11 4.87 4.66 5.60 6.01 ..
TOTAL OTHER SECTORS8 8.65 6.77 6.95 7.26 7.72 7.94 ..Coal1 0.13 0.08 0.03 0.03 0.04 0.04 ..Oil 7.34 2.24 1.55 1.56 1.45 1.40 ..Gas 0.10 0.62 0.88 0.95 1.01 1.03 ..Comb. Renewables & Wastes2 0.10 0.45 0.49 0.51 0.53 0.54 ..Geothermal – – – – – – ..Solar/Wind/Other – 0.00 0.01 0.01 0.01 0.01 ..Electricity 0.98 1.70 1.90 1.93 2.12 2.30 ..Heat – 1.68 2.09 2.28 2.56 2.62 ..
Shares (%)Coal 1.4 1.2 0.4 0.4 0.5 0.5 ..Oil 84.9 33.1 22.2 21.4 18.8 17.6 ..Gas 1.2 9.2 12.7 13.0 13.1 13.0 ..Comb. Renewables & Wastes 1.2 6.7 7.1 7.1 6.9 6.8 ..Geothermal – – – – – – ..Solar/Wind/Other – – 0.1 0.1 0.1 0.1 ..Electricity 11.3 25.1 27.4 26.6 27.5 29.0 ..Heat – 24.9 30.1 31.4 33.2 33.0 ..
284
DENMARK Energy Balances and Key Statistical Data
261-Energy Balances 2/12/03 11:24 Page 284

Unit: Mtoe
DEMAND
ENERGY TRANSFORMATION AND LOSSES
1973 1990 2000 2001 2010 2020 2030
ELECTRICITY GENERATION9
INPUT (Mtoe) 4.60 7.10 8.44 8.88 12.07 11.90 ..OUTPUT (Mtoe) 1.64 2.23 3.10 3.24 4.53 5.00 ..(TWh gross) 19.12 25.98 36.04 37.71 52.71 58.12 ..
Output Shares (%)Coal 35.8 90.3 46.3 47.3 43.7 34.7 ..Oil 64.1 3.7 12.3 11.1 9.6 6.9 ..Gas – 2.7 24.4 24.6 23.5 38.2 ..Comb. Renewables & Wastes – 0.8 5.1 5.6 9.5 7.9 ..Nuclear – – – – – – ..Hydro 0.1 0.1 0.1 0.1 0.1 0.0 ..Geothermal – – – – – – ..Solar/Wind/Other – 2.3 11.8 11.4 13.6 12.3 ..
TOTAL LOSSES 3.66 3.67 4.36 4.48 6.47 5.58 ..of which:Electricity and Heat Generation10 2.96 2.66 2.48 2.55 4.03 3.30 ..Other Transformation 0.44 –0.40 –0.04 0.11 – – ..Own Use and Losses11 0.26 1.41 1.91 1.82 2.44 2.27 ..
Statistical Differences –0.08 0.06 0.00 0.15 – – ..
INDICATORS
1973 1990 2000 2001 2010 2020 2030
GDP (billion 1995 US$) 128.44 163.49 205.49 207.45 244.29 273.00 ..Population (millions) 5.02 5.14 5.34 5.36 5.45 5.50 ..TPES/GDP12 0.15 0.11 0.09 0.10 0.10 0.09 ..Energy Production/TPES 0.02 0.56 1.43 1.37 1.13 0.37 ..Per Capita TPES13 3.95 3.43 3.63 3.69 4.32 4.31 ..Oil Supply/GDP12 0.14 0.05 0.04 0.04 0.04 0.04 ..TFC/GDP12 0.13 0.08 0.07 0.07 0.07 0.07 ..Per Capita TFC13 3.24 2.70 2.82 2.83 3.14 3.30 ..Energy-related CO2
Emissions (Mt CO2)14 56.6 50.6 50.1 50.5 63.8 63.2 ..CO2 Emissions from Bunkers
(Mt CO2) 4.5 4.8 6.6 5.9 6.0 6.0 ..
GROWTH RATES (% per year)
73–79 79–90 90–00 00–01 01–10 10–20 20–30
TPES 1.2 –1.7 1.0 2.0 2.0 0.1 ..Coal 14.4 3.2 –4.1 4.7 3.0 –3.3 ..Oil –1.4 –6.3 1.0 –0.1 1.6 0.1 ..Gas – – 9.4 4.1 3.0 3.3 ..Comb. Renewables & Wastes 6.9 7.4 3.8 7.8 3.3 –1.2 ..Nuclear – – – – – – ..Hydro – – – – – – ..Geothermal – – 4.1 – 15.5 –1.4 ..Solar/Wind/Other – 44.0 23.7 – 5.1 – ..
TFC 0.7 –1.8 0.8 0.8 1.4 0.8 ..
Electricity Consumption 4.9 2.5 1.4 1.7 1.1 1.4 ..Energy Production 14.7 23.4 10.9 –2.2 –0.3 –14.5 ..Net Oil Imports –2.6 –18.1 – –16.4 –8.0 – ..GDP 1.5 1.4 2.3 1.0 1.8 1.6 ..Growth in the TPES/GDP Ratio –0.3 –3.0 –1.3 1.0 0.1 –1.5 ..Growth in the TFC/GDP Ratio –0.9 –3.1 –1.5 –0.2 –0.5 –0.7 ..
Please note: Rounding may cause totals to differ from the sum of the elements.
285
Energy Balances and Key Statistical Data DENMARK
261-Energy Balances 2/12/03 11:24 Page 285

261-Energy Balances 2/12/03 11:24 Page 286
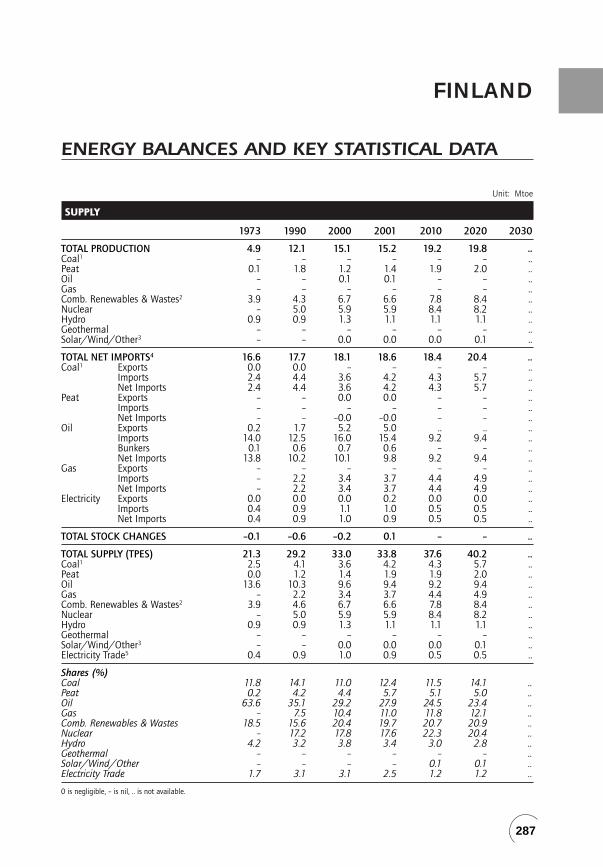
FINLAND
ENERGY BALANCES AND KEY STATISTICAL DATA
Unit: Mtoe
SUPPLY
1973 1990 2000 2001 2010 2020 2030
TOTAL PRODUCTION 4.9 12.1 15.1 15.2 19.2 19.8 ..Coal1 – – – – – – ..Peat 0.1 1.8 1.2 1.4 1.9 2.0 ..Oil – – 0.1 0.1 – – ..Gas – – – – – – ..Comb. Renewables & Wastes2 3.9 4.3 6.7 6.6 7.8 8.4 ..Nuclear – 5.0 5.9 5.9 8.4 8.2 ..Hydro 0.9 0.9 1.3 1.1 1.1 1.1 ..Geothermal – – – – – – ..Solar/Wind/Other3 – – 0.0 0.0 0.0 0.1 ..
TOTAL NET IMPORTS4 16.6 17.7 18.1 18.6 18.4 20.4 ..Coal1 Exports 0.0 0.0 – – – – ..
Imports 2.4 4.4 3.6 4.2 4.3 5.7 ..Net Imports 2.4 4.4 3.6 4.2 4.3 5.7 ..
Peat Exports – – 0.0 0.0 – – ..Imports – – – – – – ..Net Imports – – –0.0 –0.0 – – ..
Oil Exports 0.2 1.7 5.2 5.0 .. .. ..Imports 14.0 12.5 16.0 15.4 9.2 9.4 ..Bunkers 0.1 0.6 0.7 0.6 – – ..Net Imports 13.8 10.2 10.1 9.8 9.2 9.4 ..
Gas Exports – – – – – – ..Imports – 2.2 3.4 3.7 4.4 4.9 ..Net Imports – 2.2 3.4 3.7 4.4 4.9 ..
Electricity Exports 0.0 0.0 0.0 0.2 0.0 0.0 ..Imports 0.4 0.9 1.1 1.0 0.5 0.5 ..Net Imports 0.4 0.9 1.0 0.9 0.5 0.5 ..
TOTAL STOCK CHANGES –0.1 –0.6 –0.2 0.1 – – ..
TOTAL SUPPLY (TPES) 21.3 29.2 33.0 33.8 37.6 40.2 ..Coal1 2.5 4.1 3.6 4.2 4.3 5.7 ..Peat 0.0 1.2 1.4 1.9 1.9 2.0 ..Oil 13.6 10.3 9.6 9.4 9.2 9.4 ..Gas – 2.2 3.4 3.7 4.4 4.9 ..Comb. Renewables & Wastes2 3.9 4.6 6.7 6.6 7.8 8.4 ..Nuclear – 5.0 5.9 5.9 8.4 8.2 ..Hydro 0.9 0.9 1.3 1.1 1.1 1.1 ..Geothermal – – – – – – ..Solar/Wind/Other3 – – 0.0 0.0 0.0 0.1 ..Electricity Trade5 0.4 0.9 1.0 0.9 0.5 0.5 ..
Shares (%)Coal 11.8 14.1 11.0 12.4 11.5 14.1 ..Peat 0.2 4.2 4.4 5.7 5.1 5.0 ..Oil 63.6 35.1 29.2 27.9 24.5 23.4 ..Gas – 7.5 10.4 11.0 11.8 12.1 ..Comb. Renewables & Wastes 18.5 15.6 20.4 19.7 20.7 20.9 ..Nuclear – 17.2 17.8 17.6 22.3 20.4 ..Hydro 4.2 3.2 3.8 3.4 3.0 2.8 ..Geothermal – – – – – – ..Solar/Wind/Other – – – – 0.1 0.1 ..Electricity Trade 1.7 3.1 3.1 2.5 1.2 1.2 ..
0 is negligible, – is nil, .. is not available.
287
261-Energy Balances 2/12/03 11:24 Page 287

Unit: Mtoe
DEMAND
FINAL CONSUMPTION BY SECTOR
1973 1990 2000 2001 2010 2020 2030
TFC 19.4 22.7 24.8 25.2 29.2 31.3 ..Coal1 1.0 1.2 0.8 0.8 2.0 2.3 ..Peat 0.0 0.4 0.3 0.3 0.4 0.4 ..Oil 11.5 9.7 8.3 8.5 8.7 8.9 ..Gas 0.0 1.0 1.0 1.1 1.9 2.0 ..Comb. Renewables & Wastes2 3.9 3.5 5.0 4.8 5.8 6.2 ..Geothermal – – – – – – ..Solar/Wind/Other – – – – – – ..Electricity 2.3 5.1 6.5 6.6 7.7 8.5 ..Heat 0.6 1.9 2.8 3.0 2.7 2.9 ..
Shares (%)Coal 5.3 5.1 3.4 3.3 6.8 7.4 ..Peat 0.1 1.8 1.3 1.3 1.4 1.4 ..Oil 59.2 42.5 33.7 33.7 29.7 28.4 ..Gas 0.1 4.3 4.0 4.2 6.6 6.4 ..Comb. Renewables & Wastes 20.3 15.5 20.2 19.2 19.8 19.9 ..Geothermal – – – – – – ..Solar/Wind/Other – – – – – – ..Electricity 11.9 22.3 26.2 26.3 26.4 27.3 ..Heat 3.1 8.4 11.2 12.0 9.3 9.2 ..
TOTAL INDUSTRY6 7.6 10.5 12.2 11.9 15.1 16.5 ..Coal1 0.9 1.2 0.8 0.8 2.0 2.3 ..Peat 0.0 0.4 0.3 0.3 0.4 0.4 ..Oil 5.0 2.6 1.8 1.7 1.7 1.8 ..Gas 0.0 0.9 0.9 1.0 1.9 1.9 ..Comb. Renewables & Wastes2 – 2.5 3.9 3.7 4.6 5.0 ..Geothermal – – – – – – ..Solar/Wind/Other – – – – – – ..Electricity 1.6 2.8 3.7 3.6 4.4 4.9 ..Heat 0.1 0.2 0.7 0.8 0.2 0.2 ..
Shares (%)Coal 12.1 11.0 6.8 6.9 13.1 13.9 ..Peat 0.2 3.6 2.4 2.5 2.6 2.4 ..Oil 66.2 24.7 15.0 14.5 11.2 11.0 ..Gas 0.1 9.0 7.6 8.1 12.3 11.6 ..Comb. Renewables & Wastes – 23.4 32.1 30.8 30.3 30.0 ..Geothermal – – – – – – ..Solar/Wind/Other – – – – – – ..Electricity 20.4 26.6 30.1 30.6 29.1 29.7 ..Heat 1.0 1.7 6.0 6.5 1.5 1.4 ..
TRANSPORT7 2.6 4.4 4.5 4.6 4.4 4.7 ..
TOTAL OTHER SECTORS8 9.3 7.9 8.1 8.7 9.7 10.1 ..Coal1 0.1 0.0 0.0 0.0 0.0 0.0 ..Peat 0.0 0.0 0.0 0.0 0.0 0.0 ..Oil 3.9 2.7 2.1 2.2 2.6 2.5 ..Gas 0.0 0.0 0.1 0.1 0.1 0.1 ..Comb. Renewables & Wastes2 3.9 1.1 1.1 1.2 1.2 1.3 ..Geothermal – – – – – – ..Solar/Wind/Other – – – – – – ..Electricity 0.8 2.2 2.8 3.0 3.3 3.6 ..Heat 0.5 1.7 2.0 2.3 2.5 2.7 ..
Shares (%)Coal 1.1 0.1 – – – – ..Peat 0.1 0.2 0.3 0.3 0.2 0.3 ..Oil 42.3 35.0 25.6 25.7 27.3 24.5 ..Gas – 0.5 0.8 0.8 0.6 0.7 ..Comb. Renewables & Wastes 42.6 13.6 13.5 13.4 12.3 12.6 ..Geothermal – – – – – – ..Solar/Wind/Other – – – – – – ..Electricity 8.2 28.5 34.4 34.0 33.9 35.5 ..Heat 5.7 22.1 25.4 26.0 25.6 26.4 ..
288
FINLAND Energy Balances and Key Statistical Data
261-Energy Balances 2/12/03 11:24 Page 288

Unit: Mtoe
DEMAND
ENERGY TRANSFORMATION AND LOSSES
1973 1990 2000 2001 2010 2020 2030
ELECTRICITY GENERATION9
INPUT (Mtoe) 3.5 11.9 14.8 16.1 17.6 19.0 ..OUTPUT (Mtoe) 2.2 4.7 6.0 6.4 7.5 8.4 ..(TWh gross) 26.1 54.4 70.0 74.5 87.6 97.2 ..
Output Shares (%)Coal 18.7 18.5 13.2 15.2 13.5 17.9 ..Peat 9.4 14.6 5.7 8.3 6.0 5.6 ..Oil 31.6 3.1 0.9 0.9 1.6 1.7 ..Gas – 8.6 14.4 15.5 11.8 12.4 ..Comb. Renewables & Wastes – – 12.7 11.7 15.2 15.9 ..Nuclear – 35.3 32.1 30.6 36.7 32.4 ..Hydro 40.3 20.0 20.9 17.7 14.8 13.4 ..Geothermal – – – – – – ..Solar/Wind/Other – – 0.1 0.1 0.4 0.7 ..
TOTAL LOSSESof which: 2.0 7.1 8.3 9.1 8.4 8.9 ..Electricity and Heat Generation10 0.6 5.1 5.8 6.5 7.1 7.5 ..Other Transformation 0.5 0.6 0.8 1.0 0.7 0.9 ..Own Use and Losses11 0.9 1.4 1.6 1.7 0.6 0.6 ..
Statistical Differences –0.1 –0.7 –0.0 –0.5 – – ..
INDICATORS
1973 1990 2000 2001 2010 2020 2030
GDP (billion 1995 US$) 81.40 133.73 166.23 167.39 209.41 260.32 ..Population (millions) 4.67 4.99 5.18 5.19 5.26 5.29 ..TPES/GDP12 0.26 0.22 0.20 0.20 0.18 0.15 ..Energy Production/TPES 0.23 0.41 0.46 0.45 0.51 0.49 ..Per Capita TPES13 4.57 5.85 6.37 6.52 7.15 7.59 ..Oil Supply/GDP12 0.17 0.08 0.06 0.06 0.04 0.04 ..TFC/GDP12 0.24 0.17 0.15 0.15 0.14 0.12 ..Per Capita TFC13 4.16 4.56 4.78 4.86 5.56 5.91 ..Energy-related CO2
Emissions (Mt CO2)14 48.4 55.0 54.8 60.2 59.0 65.9 ..CO2 Emissions from Bunkers
(Mt CO2) 0.5 2.8 3.2 2.9 1.1 1.1 ..
GROWTH RATES (% per year)
73–79 79–90 90–00 00–01 01–10 10–20 20–30
TPES 2.3 1.6 1.2 2.5 1.2 0.7 ..Coal 7.4 0.6 –1.3 15.7 0.3 2.8 ..Peat 48.1 10.6 1.7 33.4 –0.1 0.4 ..Oil –0.5 –2.3 –0.6 –2.1 –0.3 0.2 ..Gas – 9.4 4.6 8.3 2.0 0.9 ..Comb. Renewables & Wastes –2.4 2.7 4.0 –1.4 1.7 0.8 ..Nuclear – 10.0 1.6 1.3 3.9 –0.2 ..Hydro 0.6 –0.0 3.0 –9.9 –0.2 – ..Geothermal – – – – – – ..Solar/Wind/Other – – – –14.3 19.6 6.6 ..
TFC 0.4 1.2 0.9 1.9 1.6 0.7 ..
Electricity Consumption 4.7 4.7 2.5 2.4 1.7 1.0 ..Energy Production 4.7 5.9 2.3 0.1 2.7 0.3 ..Net Oil Imports 1.1 –3.3 –0.1 –2.8 –0.7 0.2 ..GDP 2.4 3.3 2.2 0.7 2.5 2.2 ..Growth in the TPES/GDP Ratio –0.1 –1.6 –0.9 1.8 –1.3 –1.5 ..Growth in the TFC/GDP Ratio –1.9 –2.0 –1.3 1.2 –0.9 –1.5 ..
Please note: Rounding may cause totals to differ from the sum of the elements.
289
Energy Balances and Key Statistical Data FINLAND
261-Energy Balances 2/12/03 11:24 Page 289

261-Energy Balances 2/12/03 11:24 Page 290
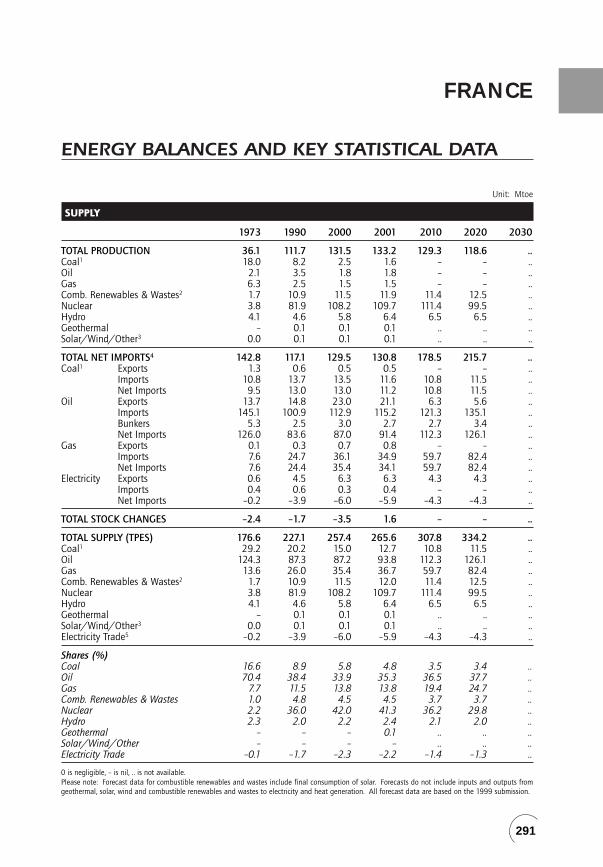
FRANCE
ENERGY BALANCES AND KEY STATISTICAL DATA
Unit: Mtoe
SUPPLY
1973 1990 2000 2001 2010 2020 2030
TOTAL PRODUCTION 36.1 111.7 131.5 133.2 129.3 118.6 ..Coal1 18.0 8.2 2.5 1.6 – – ..Oil 2.1 3.5 1.8 1.8 – – ..Gas 6.3 2.5 1.5 1.5 – – ..Comb. Renewables & Wastes2 1.7 10.9 11.5 11.9 11.4 12.5 ..Nuclear 3.8 81.9 108.2 109.7 111.4 99.5 ..Hydro 4.1 4.6 5.8 6.4 6.5 6.5 ..Geothermal – 0.1 0.1 0.1 .. .. ..Solar/Wind/Other3 0.0 0.1 0.1 0.1 .. .. ..
TOTAL NET IMPORTS4 142.8 117.1 129.5 130.8 178.5 215.7 ..Coal1 Exports 1.3 0.6 0.5 0.5 – – ..
Imports 10.8 13.7 13.5 11.6 10.8 11.5 ..Net Imports 9.5 13.0 13.0 11.2 10.8 11.5 ..
Oil Exports 13.7 14.8 23.0 21.1 6.3 5.6 ..Imports 145.1 100.9 112.9 115.2 121.3 135.1 ..Bunkers 5.3 2.5 3.0 2.7 2.7 3.4 ..Net Imports 126.0 83.6 87.0 91.4 112.3 126.1 ..
Gas Exports 0.1 0.3 0.7 0.8 – – ..Imports 7.6 24.7 36.1 34.9 59.7 82.4 ..Net Imports 7.6 24.4 35.4 34.1 59.7 82.4 ..
Electricity Exports 0.6 4.5 6.3 6.3 4.3 4.3 ..Imports 0.4 0.6 0.3 0.4 – – ..Net Imports –0.2 –3.9 –6.0 –5.9 –4.3 –4.3 ..
TOTAL STOCK CHANGES –2.4 –1.7 –3.5 1.6 – – ..
TOTAL SUPPLY (TPES) 176.6 227.1 257.4 265.6 307.8 334.2 ..Coal1 29.2 20.2 15.0 12.7 10.8 11.5 ..Oil 124.3 87.3 87.2 93.8 112.3 126.1 ..Gas 13.6 26.0 35.4 36.7 59.7 82.4 ..Comb. Renewables & Wastes2 1.7 10.9 11.5 12.0 11.4 12.5 ..Nuclear 3.8 81.9 108.2 109.7 111.4 99.5 ..Hydro 4.1 4.6 5.8 6.4 6.5 6.5 ..Geothermal – 0.1 0.1 0.1 .. .. ..Solar/Wind/Other3 0.0 0.1 0.1 0.1 .. .. ..Electricity Trade5 –0.2 –3.9 –6.0 –5.9 –4.3 –4.3 ..
Shares (%)Coal 16.6 8.9 5.8 4.8 3.5 3.4 ..Oil 70.4 38.4 33.9 35.3 36.5 37.7 ..Gas 7.7 11.5 13.8 13.8 19.4 24.7 ..Comb. Renewables & Wastes 1.0 4.8 4.5 4.5 3.7 3.7 ..Nuclear 2.2 36.0 42.0 41.3 36.2 29.8 ..Hydro 2.3 2.0 2.2 2.4 2.1 2.0 ..Geothermal – – – 0.1 .. .. ..Solar/Wind/Other – – – – .. .. ..Electricity Trade –0.1 –1.7 –2.3 –2.2 –1.4 –1.3 ..
0 is negligible, – is nil, .. is not available.Please note: Forecast data for combustible renewables and wastes include final consumption of solar. Forecasts do not include inputs and outputs fromgeothermal, solar, wind and combustible renewables and wastes to electricity and heat generation. All forecast data are based on the 1999 submission.
291
261-Energy Balances 2/12/03 11:24 Page 291

Unit: Mtoe
DEMAND
FINAL CONSUMPTION BY SECTOR
1973 1990 2000 2001 2010 2020 2030
TFC 138.1 147.4 168.6 173.8 204.5 231.2 ..Coal1 13.1 7.5 4.2 3.5 7.9 7.9 ..Oil 99.4 79.5 88.1 91.1 105.2 118.8 ..Gas 11.2 23.9 32.7 34.4 40.5 45.8 ..Comb. Renewables & Wastes2 1.7 9.6 9.6 10.0 11.4 12.5 ..Geothermal – 0.1 0.1 0.1 – – ..Solar/Wind/Other – 0.0 0.0 0.0 .. .. ..Electricity 12.8 26.0 33.1 34.0 39.5 46.1 ..Heat – 0.7 0.7 0.6 .. .. ..
Shares (%)Coal 9.5 5.1 2.5 2.0 3.9 3.4 ..Oil 72.0 53.9 52.2 52.4 51.5 51.4 ..Gas 8.1 16.2 19.4 19.8 19.8 19.8 ..Comb. Renewables & Wastes 1.2 6.5 5.7 5.8 5.6 5.4 ..Geothermal – 0.1 0.1 0.1 – – ..Solar/Wind/Other – – – – .. .. ..Electricity 9.3 17.6 19.6 19.6 19.3 20.0 ..Heat – 0.5 0.4 0.4 .. .. ..
TOTAL INDUSTRY6 55.7 46.3 50.8 50.4 63.6 70.5 ..Coal1 7.2 5.9 3.6 3.0 6.3 5.6 ..Oil 35.3 18.0 19.5 19.9 26.3 28.9 ..Gas 5.8 11.1 14.4 14.1 15.1 16.5 ..Comb. Renewables & Wastes2 0.2 1.5 1.7 1.7 2.0 2.6 ..Geothermal – – – – – – ..Solar/Wind/Other – – – – .. .. ..Electricity 7.2 9.9 11.6 11.6 13.8 16.9 ..Heat – – – – .. .. ..
Shares (%)Coal 12.9 12.7 7.1 5.9 10.0 8.0 ..Oil 63.4 38.8 38.4 39.6 41.4 41.0 ..Gas 10.4 24.0 28.3 28.1 23.8 23.4 ..Comb. Renewables & Wastes 0.4 3.3 3.3 3.5 3.1 3.7 ..Geothermal – – – – – – ..Solar/Wind/Other – – – – .. .. ..Electricity 13.0 21.3 22.9 23.0 21.7 24.0 ..Heat – – – – .. .. ..
TRANSPORT7 27.1 42.8 52.7 53.3 62.4 75.4 ..
TOTAL OTHER SECTORS8 55.4 58.2 65.0 70.2 78.5 85.2 ..Coal1 5.8 1.7 0.6 0.6 1.6 2.3 ..Oil 37.6 19.5 17.1 19.1 17.9 16.1 ..Gas 5.4 12.8 18.3 20.2 25.4 29.3 ..Comb. Renewables & Wastes2 1.5 8.1 7.7 8.0 9.1 9.6 ..Geothermal – 0.1 0.1 0.1 – – ..Solar/Wind/Other – 0.0 0.0 0.0 .. .. ..Electricity 5.0 15.3 20.5 21.4 24.6 27.9 ..Heat – 0.7 0.7 0.6 .. .. ..
Shares (%)Coal 10.5 2.9 1.0 0.8 2.0 2.7 ..Oil 68.0 33.4 26.3 27.3 22.7 18.9 ..Gas 9.7 22.0 28.1 28.8 32.3 34.4 ..Comb. Renewables & Wastes 2.7 13.9 11.8 11.4 11.6 11.3 ..Geothermal – 0.2 0.2 0.2 – – ..Solar/Wind/Other – – – – .. .. ..Electricity 9.0 26.3 31.5 30.5 31.3 32.8 ..Heat – 1.2 1.0 0.9 .. .. ..
292
FRANCE Energy Balances and Key Statistical Data
261-Energy Balances 2/12/03 11:24 Page 292

Unit: Mtoe
DEMAND
ENERGY TRANSFORMATION AND LOSSES
1973 1990 2000 2001 2010 2020 2030
ELECTRICITY GENERATION9
INPUT (Mtoe) 35.9 98.3 126.8 127.5 137.6 142.9 ..OUTPUT (Mtoe) 15.7 35.8 46.1 47.0 52.7 57.8 ..(TWh gross) 182.5 416.8 535.8 546.0 612.7 672.1 ..
Output Shares (%)Coal 19.4 8.5 5.8 4.5 1.5 1.9 ..Oil 40.2 2.1 1.4 1.0 0.2 0.1 ..Gas 5.5 0.7 2.1 3.1 16.3 29.8 ..Comb. Renewables & Wastes 0.4 0.4 0.6 0.6 .. .. ..Nuclear 8.1 75.4 77.5 77.1 69.8 56.8 ..Hydro 26.1 12.8 12.5 13.6 12.3 11.3 ..Geothermal – – – – – – ..Solar/Wind/Other 0.3 0.1 0.1 0.1 .. .. ..
TOTAL LOSSES 37.6 75.2 94.2 95.6 103.2 103.1 ..of which:Electricity and Heat Generation10 20.2 61.8 80.1 79.9 86.4 85.7 ..Other Transformation 5.4 1.6 0.4 2.1 .. .. ..Own Use and Losses11 12.0 11.8 13.7 13.6 16.9 17.4 ..
Statistical Differences 0.9 4.5 –5.3 –3.8 – – –
INDICATORS
1973 1990 2000 2001 2010 2020 2030
GDP (billion 1995 US$) 961.43 1473.22 1772.34 1804.85 2214.74 2780.22 ..Population (millions) 53.30 58.17 60.59 60.91 61.70 63.50 ..TPES/GDP12 0.18 0.15 0.15 0.15 0.14 0.12 ..Energy Production/TPES 0.20 0.49 0.51 0.50 0.42 0.35 ..Per Capita TPES13 3.31 3.90 4.25 4.36 4.99 5.26 ..Oil Supply/GDP12 0.13 0.06 0.05 0.05 0.05 0.05 ..TFC/GDP12 0.14 0.10 0.10 0.10 0.09 0.08 ..Per Capita TFC13 2.59 2.53 2.78 2.85 3.31 3.64 ..Energy-related CO2
Emissions (Mt CO2)14 489.0 352.7 375.8 384.9 470.7 563.7 ..CO2 Emissions from Bunkers
(Mt CO2) 22.7 17.7 25.3 22.7 22.7 24.9 ..
GROWTH RATES (% per year)
73–79 79–90 90–00 00–01 01–10 10–20 20–30
TPES 1.0 1.8 1.3 3.2 1.7 0.8 ..Coal 1.7 –4.2 –2.9 –15.6 –1.7 0.6 ..Oil –1.4 –2.4 –0.0 7.5 2.0 1.2 ..Gas 7.4 2.0 3.1 3.5 5.6 3.3 ..Comb. Renewables & Wastes 7.6 13.8 0.6 3.8 –0.5 0.9 ..Nuclear 18.1 20.6 2.8 1.4 0.2 –1.1 ..Hydro 5.7 –2.0 2.3 11.2 0.1 0.1 ..Geothermal – – 1.2 12.1 – – ..Solar/Wind/Other –1.8 3.2 2.9 2.5 – – ..
TFC 0.7 0.2 1.4 3.1 1.8 1.2 ..
Electricity Consumption 5.4 3.7 2.5 2.7 1.7 1.6 ..Energy Production 2.1 9.5 1.6 1.3 –0.3 –0.9 ..Net Oil Imports –1.4 –2.9 0.4 5.1 2.3 1.2 ..GDP 2.8 2.4 1.9 1.8 2.3 2.3 ..Growth in the TPES/GDP Ratio –1.8 –0.6 –0.6 1.3 –0.6 –1.4 ..Growth in the TFC/GDP Ratio –2.1 –2.1 –0.5 1.2 –0.5 –1.0 ..
Please note: Rounding may cause totals to differ from the sum of the elements.
293
Energy Balances and Key Statistical Data FRANCE
261-Energy Balances 2/12/03 11:24 Page 293

261-Energy Balances 2/12/03 11:24 Page 294

GERMANY
ENERGY BALANCES AND KEY STATISTICAL DATA
Unit: Mtoe
SUPPLY
1973 1990 2000 2001 2010 2020 2030
TOTAL PRODUCTION 171.7 186.2 135.2 133.7 116.9 .. ..Coal1 141.4 121.8 60.6 58.2 51.0 .. ..Oil 6.8 4.7 3.9 4.0 1.6 .. ..Gas 16.4 13.5 15.8 15.9 13.1 .. ..Comb. Renewables & Wastes2 2.5 4.8 7.8 8.2 8.3 .. ..Nuclear 3.2 39.8 44.2 44.6 39.1 .. ..Hydro 1.3 1.5 1.9 1.8 1.9 .. ..Geothermal – 0.0 0.0 0.0 – .. ..Solar/Wind/Other3 – 0.0 0.9 1.1 2.0 .. ..
TOTAL NET IMPORTS4 167.3 165.4 203.9 215.0 233.5 .. ..Coal1 Exports 18.3 8.2 0.6 0.5 0.1 .. ..
Imports 15.2 11.5 22.2 26.3 23.1 .. ..Net Imports –3.1 3.3 21.7 25.8 23.0 .. ..
Oil Exports 9.9 10.2 22.2 19.8 14.6 .. ..Imports 171.1 132.9 149.6 152.8 154.7 .. ..Bunkers 4.1 2.5 2.2 2.2 1.8 .. ..Net Imports 157.1 120.2 125.2 130.7 138.4 .. ..
Gas Exports 0.1 0.9 4.2 5.2 2.9 .. ..Imports 12.4 42.7 61.1 63.4 74.1 .. ..Net Imports 12.3 41.7 56.8 58.2 71.2 .. ..
Electricity Exports 0.7 2.6 3.6 3.6 1.7 .. ..Imports 1.7 2.7 3.9 3.9 2.6 .. ..Net Imports 1.0 0.1 0.3 0.3 0.9 .. ..
TOTAL STOCK CHANGES –1.1 4.7 4.3 2.4 – .. ..
TOTAL SUPPLY (TPES) 337.9 356.2 343.4 351.1 350.4 .. ..Coal1 139.4 128.5 84.8 85.0 74.0 .. ..Oil 161.9 126.5 131.7 134.5 140.0 .. ..Gas 28.7 55.0 71.8 75.6 84.2 .. ..Comb. Renewables & Wastes2 2.5 4.8 7.8 8.2 8.3 .. ..Nuclear 3.2 39.8 44.2 44.6 39.1 .. ..Hydro 1.3 1.5 1.9 1.8 1.9 .. ..Geothermal – 0.0 0.0 0.0 – .. ..Solar/Wind/Other3 – 0.0 0.9 1.1 2.0 .. ..Electricity Trade5 1.0 0.1 0.3 0.3 0.9 .. ..
Shares (%)Coal 41.2 36.1 24.7 24.2 21.1 .. ..Oil 47.9 35.5 38.4 38.3 39.9 .. ..Gas 8.5 15.4 20.9 21.5 24.0 .. ..Comb. Renewables & Wastes 0.7 1.3 2.3 2.3 2.4 .. ..Nuclear 0.9 11.2 12.9 12.7 11.2 .. ..Hydro 0.4 0.4 0.5 0.5 0.5 .. ..Geothermal – – – – – .. ..Solar/Wind/Other – – 0.3 0.3 0.6 .. ..Electricity Trade 0.3 – 0.1 0.1 0.3 .. ..
0 is negligible, – is nil, .. is not available.Please note: All data include the new Laender of Germany. In the forecast data, gas works gas is included with coal instead of with gas. Statistical differences in both coal and gas are due to differences between production and consumption in the German “Energiebilanzen”. Forecasts are based on the 1999 submission.
295
261-Energy Balances 2/12/03 11:24 Page 295

Unit: Mtoe
DEMAND
FINAL CONSUMPTION BY SECTOR
1973 1990 2000 2001 2010 2020 2030
TFC 246.6 247.3 242.3 246.0 261.7 .. ..Coal1 53.1 37.3 10.5 9.7 11.6 .. ..Oil 138.2 117.7 123.0 125.1 130.3 .. ..Gas 21.1 41.0 55.1 56.0 61.7 .. ..Comb. Renewables & Wastes2 1.7 3.0 4.6 4.9 4.3 .. ..Geothermal – 0.0 0.0 0.0 – .. ..Solar/Wind/Other – 0.0 0.1 0.1 0.5 .. ..Electricity 26.9 39.1 42.2 43.1 44.6 .. ..Heat 5.5 9.1 6.8 7.1 8.6 .. ..
Shares (%)Coal 21.5 15.1 4.3 3.9 4.4 .. ..Oil 56.0 47.6 50.8 50.8 49.8 .. ..Gas 8.6 16.6 22.7 22.8 23.6 .. ..Comb. Renewables & Wastes 0.7 1.2 1.9 2.0 1.6 .. ..Geothermal – – – – – .. ..Solar/Wind/Other – – – 0.1 0.2 .. ..Electricity 10.9 15.8 17.4 17.5 17.1 .. ..Heat 2.2 3.7 2.8 2.9 3.3 .. ..
TOTAL INDUSTRY6 105.9 89.5 79.9 78.1 88.8 .. ..Coal1 28.7 20.7 9.2 8.4 11.0 .. ..Oil 46.9 27.3 28.2 27.7 31.8 .. ..Gas 13.3 19.7 21.4 20.8 25.1 .. ..Comb. Renewables & Wastes2 0.0 0.8 0.5 0.5 0.3 .. ..Geothermal – – – – – .. ..Solar/Wind/Other – – – – – .. ..Electricity 15.3 18.6 19.7 19.8 18.9 .. ..Heat 1.6 2.4 0.9 0.9 1.7 .. ..
Shares (%)Coal 27.1 23.1 11.5 10.8 12.3 .. ..Oil 44.3 30.5 35.3 35.5 35.9 .. ..Gas 12.6 22.0 26.8 26.6 28.3 .. ..Comb. Renewables & Wastes – 0.9 0.6 0.6 0.3 .. ..Geothermal – – – – – .. ..Solar/Wind/Other – – – – – .. ..Electricity 14.5 20.8 24.7 25.4 21.3 .. ..Heat 1.5 2.7 1.1 1.2 1.9 .. ..
TRANSPORT7 39.7 60.0 67.4 66.0 67.4 .. ..
TOTAL OTHER SECTORS8 101.0 97.8 95.0 101.9 105.5 .. ..Coal1 22.7 16.6 1.3 1.3 0.7 .. ..Oil 54.2 31.6 28.9 33.0 33.0 .. ..Gas 7.8 21.3 33.7 35.3 36.6 .. ..Comb. Renewables & Wastes2 1.7 2.2 4.0 4.1 3.9 .. ..Geothermal – 0.0 0.0 0.0 – .. ..Solar/Wind/Other – 0.0 0.1 0.1 0.5 .. ..Electricity 10.7 19.3 21.1 22.0 24.0 .. ..Heat 3.9 6.7 5.9 6.2 6.9 .. ..
Shares (%)Coal 22.5 16.9 1.4 1.2 0.6 .. ..Oil 53.6 32.3 30.4 32.4 31.3 .. ..Gas 7.7 21.8 35.5 34.6 34.6 .. ..Comb. Renewables & Wastes 1.7 2.2 4.2 4.0 3.7 .. ..Geothermal – – – – – .. ..Solar/Wind/Other – – 0.1 0.1 0.5 .. ..Electricity 10.6 19.8 22.2 21.6 22.8 .. ..Heat 3.9 6.9 6.2 6.0 6.5 .. ..
296
GERMANY Energy Balances and Key Statistical Data
261-Energy Balances 2/12/03 11:24 Page 296

Unit: Mtoe
DEMAND
ENERGY TRANSFORMATION AND LOSSES
1973 1990 2000 2001 2010 2020 2030
ELECTRICITY GENERATION9
INPUT (Mtoe) 98.6 141.2 133.4 136.8 128.8 .. ..OUTPUT (Mtoe) 32.2 47.1 48.8 49.9 51.4 .. ..(TWh gross) 374.4 547.6 567.1 579.8 598.0 .. ..
Output Shares (%)Coal 69.0 58.8 52.7 51.9 50.5 .. ..Oil 12.0 1.9 0.8 1.1 0.8 .. ..Gas 10.9 7.4 9.3 9.9 14.5 .. ..Comb. Renewables & Wastes 0.8 0.9 1.8 2.2 2.7 .. ..Nuclear 3.2 27.8 29.9 29.5 25.1 .. ..Hydro 4.1 3.2 3.8 3.5 3.6 .. ..Geothermal – – – – – .. ..Solar/Wind/Other – 0.0 1.7 1.9 2.9 .. ..
TOTAL LOSSES 90.7 112.0 100.8 102.2 86.5 .. ..of which:Electricity and Heat Generation10 60.0 83.4 77.1 79.1 69.3 .. ..Other Transformation 7.0 8.0 5.9 5.9 0.9 .. ..Own Use and Losses11 23.7 20.5 17.7 17.2 16.3 .. ..
Statistical Differences 0.5 –3.0 0.3 2.8 2.2 .. ..
INDICATORS
1973 1990 2000 2001 2010 2020 2030
GDP (billion 1995 US$) 1514.68 2221.56 2687.83 2703.25 3230.63 .. ..Population (millions) 78.96 79.36 82.19 82.34 78.60 .. ..TPES/GDP12 0.22 0.16 0.13 0.13 0.11 .. ..Energy Production/TPES 0.51 0.52 0.39 0.38 0.33 .. ..Per Capita TPES13 4.28 4.49 4.18 4.26 4.46 .. ..Oil Supply/GDP12 0.11 0.06 0.05 0.05 0.04 .. ..TFC/GDP12 0.16 0.11 0.09 0.09 0.08 .. ..Per Capita TFC13 3.12 3.12 2.95 2.99 3.33 .. ..Energy-related CO2
Emissions (Mt CO2)14 1058.7 964.1 834.8 850.2 844.7 .. ..CO2 Emissions from Bunkers
(Mt CO2) 21.8 22.1 28.6 28.2 26.9 .. ..
GROWTH RATES (% per year)
73–79 79–90 90–00 00–01 01–10 10–20 20–30
TPES 1.5 –0.3 –0.4 2.2 –0.0 .. ..Coal –0.2 –0.6 –4.1 0.3 –1.5 .. ..Oil –0.1 –2.2 0.4 2.1 0.4 .. ..Gas 10.2 0.6 2.7 5.2 1.2 .. ..Comb. Renewables & Wastes 6.2 2.7 5.0 4.9 0.2 .. ..Nuclear 27.5 10.3 1.0 1.0 –1.5 .. ..Hydro 3.2 –0.5 2.2 –5.9 0.6 .. ..Geothermal – – 3.6 – – .. ..Solar/Wind/Other – – 50.6 18.0 7.2 .. ..
TFC 1.2 –0.6 –0.2 1.5 0.7 .. ..
Electricity Consumption 3.8 1.4 0.7 2.3 0.4 .. ..Energy Production 1.0 0.2 –3.2 –1.0 –1.5 .. ..Net Oil Imports 0.2 –2.5 0.4 4.4 0.6 .. ..GDP 2.4 2.2 1.9 0.6 2.0 .. ..Growth in the TPES/GDP Ratio –0.9 –2.5 –2.2 1.6 –2.0 .. ..Growth in the TFC/GDP Ratio –1.1 –2.8 –2.1 0.9 –1.3 .. ..
Please note: Rounding may cause totals to differ from the sum of the elements.
297
Energy Balances and Key Statistical Data GERMANY
261-Energy Balances 2/12/03 11:24 Page 297

261-Energy Balances 2/12/03 11:24 Page 298

GREECE
ENERGY BALANCES AND KEY STATISTICAL DATA
Unit: Mtoe
SUPPLY
1973 1990 2000 2001 2010 2020 2030
TOTAL PRODUCTION 2.33 9.20 9.99 9.97 11.14 .. ..Coal1 1.69 7.12 8.22 8.39 8.82 .. ..Oil – 0.84 0.26 0.18 0.30 .. ..Gas – 0.14 0.04 0.04 0.04 .. ..Comb. Renewables & Wastes2 0.45 0.89 1.01 1.01 1.14 .. ..Nuclear – – – – – .. ..Hydro 0.19 0.15 0.32 0.18 0.33 .. ..Geothermal – 0.00 0.00 0.00 0.11 .. ..Solar/Wind/Other3 – 0.06 0.14 0.17 0.40 .. ..
TOTAL NET IMPORTS4 11.12 12.74 18.13 18.60 29.40 .. ..Coal1 Exports 0.02 – 0.04 0.03 – .. ..
Imports 0.47 0.92 0.81 0.89 0.76 .. ..Net Imports 0.45 0.92 0.77 0.86 0.76 .. ..
Oil Exports 4.95 7.56 4.17 3.98 6.00 .. ..Imports 16.51 21.87 23.44 23.32 31.22 .. ..Bunkers 0.89 2.55 3.60 3.49 3.60 .. ..Net Imports 10.67 11.76 15.67 15.85 21.62 .. ..
Gas Exports – – – – – .. ..Imports – – 1.69 1.67 7.02 .. ..Net Imports – – 1.69 1.67 7.02 .. ..
Electricity Exports 0.00 0.05 0.15 0.09 – .. ..Imports 0.01 0.11 0.15 0.31 – .. ..Net Imports 0.00 0.06 –0.00 0.22 – .. ..
TOTAL STOCK CHANGES –1.10 0.24 –0.29 0.14 – .. ..
TOTAL SUPPLY (TPES) 12.36 22.18 27.82 28.70 40.54 .. ..Coal1 2.10 8.07 9.04 9.31 9.58 .. ..Oil 9.61 12.81 15.61 16.14 21.92 .. ..Gas – 0.14 1.70 1.68 7.06 .. ..Comb. Renewables & Wastes2 0.45 0.89 1.01 1.01 1.14 .. ..Nuclear – – – – – .. ..Hydro 0.19 0.15 0.32 0.18 0.33 .. ..Geothermal – 0.00 0.00 0.00 0.11 .. ..Solar/Wind/Other3 – 0.06 0.14 0.17 0.40 .. ..Electricity Trade5 0.00 0.06 –0.00 0.22 – .. ..
Shares (%)Coal 17.0 36.4 32.5 32.4 23.6 .. ..Oil 77.7 57.8 56.1 56.2 54.1 .. ..Gas – 0.6 6.1 5.9 17.4 .. ..Comb. Renewables & Wastes 3.6 4.0 3.6 3.5 2.8 .. ..Nuclear – – – – – .. ..Hydro 1.5 0.7 1.1 0.6 0.8 .. ..Geothermal – – – – 0.3 .. ..Solar/Wind/Other – 0.3 0.5 0.6 1.0 .. ..Electricity Trade – 0.3 – 0.7 – .. ..
0 is negligible, – is nil, .. is not available.Please note: All forecasts are based on the 2001 submisson.
299
261-Energy Balances 2/12/03 11:24 Page 299

Unit: Mtoe
DEMAND
FINAL CONSUMPTION BY SECTOR
1973 1990 2000 2001 2010 2020 2030
TFC 9.21 15.47 19.51 20.09 29.53 .. ..Coal1 0.52 1.20 0.88 0.89 0.76 .. ..Oil 7.15 10.75 13.46 13.92 19.87 .. ..Gas 0.00 0.11 0.38 0.38 1.88 .. ..Comb. Renewables & Wastes2 0.45 0.89 0.95 0.94 1.08 .. ..Geothermal – 0.00 0.00 0.00 – .. ..Solar/Wind/Other – 0.06 0.10 0.10 0.14 .. ..Electricity 1.09 2.45 3.71 3.83 5.79 .. ..Heat – – 0.03 0.03 0.03 .. ..
Shares (%)Coal 5.6 7.8 4.5 4.4 2.6 .. ..Oil 77.6 69.5 69.0 69.3 67.3 .. ..Gas – 0.7 1.9 1.9 6.4 .. ..Comb. Renewables & Wastes 4.9 5.8 4.9 4.7 3.7 .. ..Geothermal – – – – – .. ..Solar/Wind/Other – 0.4 0.5 0.5 0.5 .. ..Electricity 11.9 15.8 19.0 19.1 19.6 .. ..Heat – – 0.1 0.1 0.1 .. ..
TOTAL INDUSTRY6 3.49 4.70 5.19 5.23 7.32 .. ..Coal1 0.46 1.18 0.85 0.87 0.72 .. ..Oil 2.39 2.18 2.57 2.58 3.54 .. ..Gas – 0.10 0.37 0.35 0.99 .. ..Comb. Renewables & Wastes2 – 0.19 0.24 0.24 0.25 .. ..Geothermal – – – – – .. ..Solar/Wind/Other – – – – – .. ..Electricity 0.63 1.04 1.17 1.18 1.82 .. ..Heat – – – – – .. ..
Shares (%)Coal 13.1 25.0 16.4 16.6 9.8 .. ..Oil 68.7 46.5 49.4 49.4 48.4 .. ..Gas – 2.2 7.0 6.8 13.5 .. ..Comb. Renewables & Wastes – 4.1 4.6 4.5 3.4 .. ..Geothermal – – – – – .. ..Solar/Wind/Other – – – – – .. ..Electricity 18.2 22.2 22.5 22.7 24.8 .. ..Heat – – – – – .. ..
TRANSPORT7 2.70 5.95 7.36 7.53 11.44 .. ..
TOTAL OTHER SECTORS8 3.03 4.82 6.95 7.33 10.78 .. ..Coal1 0.04 0.03 0.03 0.02 0.04 .. ..Oil 2.08 2.63 3.56 3.83 4.98 .. ..Gas 0.00 0.01 0.01 0.02 0.86 .. ..Comb. Renewables & Wastes2 0.45 0.70 0.71 0.70 0.83 .. ..Geothermal – 0.00 0.00 0.00 – .. ..Solar/Wind/Other – 0.06 0.10 0.10 0.14 .. ..Electricity 0.46 1.40 2.53 2.63 3.91 .. ..Heat – – 0.03 0.03 0.03 .. ..
Shares (%)Coal 1.4 0.5 0.4 0.3 0.3 .. ..Oil 68.6 54.5 51.1 52.2 46.2 .. ..Gas 0.1 0.1 0.2 0.2 8.0 .. ..Comb. Renewables & Wastes 14.9 14.6 10.1 9.6 7.7 .. ..Geothermal – 0.1 – – – .. ..Solar/Wind/Other – 1.2 1.4 1.4 1.3 .. ..Electricity 15.0 29.0 36.3 35.8 36.3 .. ..Heat – – 0.4 0.4 0.3 .. ..
300
GREECE Energy Balances and Key Statistical Data
261-Energy Balances 2/12/03 11:24 Page 300

Unit: Mtoe
DEMAND
ENERGY TRANSFORMATION AND LOSSES
1973 1990 2000 2001 2010 2020 2030
ELECTRICITY GENERATION9
INPUT (Mtoe) 3.34 8.90 11.93 12.00 16.77 .. ..OUTPUT (Mtoe) 1.27 2.99 4.59 4.56 6.72 .. ..(TWh gross) 14.82 34.78 53.43 53.08 78.12 .. ..
Output Shares (%)Coal 35.5 72.4 64.2 66.8 43.7 .. ..Oil 49.5 22.3 16.6 16.0 12.6 .. ..Gas – 0.3 11.1 11.6 34.4 .. ..Comb. Renewables & Wastes – – 0.3 0.3 0.3 .. ..Nuclear – – – – – .. ..Hydro 15.0 5.1 6.9 4.0 4.9 .. ..Geothermal – – – – 0.2 .. ..Solar/Wind/Other – 0.0 0.8 1.4 4.0 .. ..
TOTAL LOSSES 3.14 7.00 8.53 8.77 11.00 .. ..of which:Electricity and Heat Generation10 2.07 5.91 7.31 7.41 10.00 .. ..Other Transformation 0.44 –0.23 –0.70 –0.64 – .. ..Own Use and Losses11 0.64 1.31 1.92 2.00 1.00 .. ..
Statistical Differences 0.00 –0.28 –0.21 –0.15 – .. ..
INDICATORS
1973 1990 2000 2001 2010 2020 2030
GDP (billion 1995 US$) 84.54 110.50 139.16 144.84 206.16 .. ..Population (millions) 8.93 10.16 10.92 10.96 11.00 .. ..TPES/GDP12 0.15 0.20 0.20 0.20 0.20 .. ..Energy Production/TPES 0.19 0.41 0.36 0.35 0.27 .. ..Per Capita TPES13 1.38 2.18 2.55 2.62 3.69 .. ..Oil Supply/GDP12 0.11 0.12 0.11 0.11 0.11 .. ..TFC/GDP12 0.11 0.14 0.14 0.14 0.14 .. ..Per Capita TFC13 1.03 1.52 1.79 1.83 2.68 .. ..Energy-related CO2
Emissions (Mt CO2)14 34.4 70.6 87.8 90.2 118.3 .. ..CO2 Emissions from Bunkers
(Mt CO2) 4.5 10.5 13.9 13.4 13.7 .. ..
GROWTH RATES (% per year)
73–79 79–90 90–00 00–01 01–10 10–20 20–30
TPES 4.4 3.0 2.3 3.2 3.9 .. ..Coal 8.7 8.0 1.1 3.0 0.3 .. ..Oil 3.5 0.7 2.0 3.4 3.5 .. ..Gas – – 28.6 –1.2 17.3 .. ..Comb. Renewables & Wastes – 6.4 1.2 – 1.3 .. ..Nuclear – – – – – .. ..Hydro 8.2 –6.2 7.7 –43.4 6.9 .. ..Geothermal – – –4.0 – 55.8 .. ..Solar/Wind/Other – – 9.2 19.6 10.4 .. ..
TFC 4.0 2.6 2.3 3.0 4.4 .. ..
Electricity Consumption 7.0 3.7 4.2 3.2 4.7 .. ..Energy Production 8.3 8.5 0.8 –0.2 1.2 .. ..Net Oil Imports 2.5 –0.4 2.9 1.2 3.5 .. ..GDP 3.3 0.7 2.3 4.1 4.0 .. ..Growth in the TPES/GDP Ratio 1.1 2.3 –0.0 –0.9 –0.1 .. ..Growth in the TFC/GDP Ratio 0.7 1.9 0.0 –1.1 0.4 .. ..
Please note: Rounding may cause totals to differ from the sum of the elements.
301
Energy Balances and Key Statistical Data GREECE
261-Energy Balances 2/12/03 11:24 Page 301

261-Energy Balances 2/12/03 11:24 Page 302

HUNGARY
ENERGY BALANCES AND KEY STATISTICAL DATA
Unit: Mtoe
SUPPLY
1973 1990 2000 2001 2010 2020 2030
TOTAL PRODUCTION 12.70 14.24 11.19 10.82 9.74 8.95 8.56Coal1 6.05 4.14 2.89 2.66 2.20 2.00 1.80Oil 2.02 2.27 1.68 1.57 1.00 0.80 0.70Gas 4.03 3.81 2.47 2.48 2.00 1.60 1.50Comb. Renewables & Wastes2 0.59 0.42 0.42 0.40 0.84 0.84 0.84Nuclear – 3.58 3.71 3.70 3.60 3.60 3.60Hydro 0.01 0.02 0.02 0.02 0.02 0.02 0.02Geothermal – – 0.01 0.01 0.08 0.10 0.10Solar/Wind/Other3 – – – 0.00 0.00 0.01 0.01
TOTAL NET IMPORTS4 8.66 14.17 13.87 13.78 17.11 18.77 19.37Coal1 Exports 0.11 – 0.13 0.10 – – –
Imports 1.74 1.63 1.21 1.09 1.33 1.35 1.27Net Imports 1.63 1.63 1.08 1.00 1.33 1.35 1.27
Oil Exports 0.92 1.52 1.80 2.31 1.50 1.50 1.50Imports 7.39 7.96 7.01 7.05 7.65 8.15 8.45Bunkers – – – – – – –Net Imports 6.48 6.44 5.21 4.73 6.15 6.65 6.95
Gas Exports 0.01 0.02 0.07 0.00 – – –Imports 0.17 5.19 7.35 7.78 9.48 10.46 10.95Net Imports 0.15 5.17 7.28 7.78 9.48 10.46 10.95
Electricity Exports 0.09 0.19 0.52 0.62 0.16 0.16 0.15Imports 0.49 1.14 0.82 0.90 0.31 0.47 0.35Net Imports 0.40 0.96 0.30 0.27 0.16 0.31 0.20
TOTAL STOCK CHANGES –0.02 0.06 –0.13 0.73 – – –
TOTAL SUPPLY (TPES) 21.33 28.47 24.93 25.34 26.85 27.73 27.93Coal1 7.91 6.12 3.97 3.62 3.53 3.35 3.07Oil 8.21 8.51 6.87 6.62 7.15 7.45 7.65Gas 4.17 8.91 9.65 10.71 11.48 12.06 12.45Comb. Renewables & Wastes2 0.64 0.38 0.42 0.40 0.84 0.84 0.84Nuclear – 3.58 3.71 3.70 3.60 3.60 3.60Hydro 0.01 0.02 0.02 0.02 0.02 0.02 0.02Geothermal – – 0.01 0.01 0.08 0.10 0.10Solar/Wind/Other3 – – – 0.00 0.00 0.01 0.01Electricity Trade5 0.40 0.96 0.30 0.27 0.16 0.31 0.20
Shares (%)Coal 37.1 21.5 15.9 14.3 13.1 12.1 11.0Oil 38.5 29.9 27.5 26.1 26.6 26.9 27.4Gas 19.6 31.3 38.7 42.3 42.7 43.5 44.6Comb. Renewables & Wastes 3.0 1.3 1.7 1.6 3.1 3.0 3.0Nuclear – 12.6 14.9 14.6 13.4 13.0 12.9Hydro – 0.1 0.1 0.1 0.1 0.1 0.1Geothermal – – – – 0.3 0.3 0.3Solar/Wind/Other – – – – – – –Electricity Trade 1.9 3.4 1.2 1.1 0.6 1.1 0.7
0 is negligible, – is nil, .. is not available.
303
261-Energy Balances 2/12/03 11:24 Page 303

Unit: Mtoe
DEMAND
FINAL CONSUMPTION BY SECTOR
1973 1990 2000 2001 2010 2020 2030
TFC 17.14 20.93 17.26 17.78 19.67 19.77 19.69Coal1 4.17 2.68 0.71 0.65 0.82 0.74 0.66Oil 6.71 7.41 5.54 5.31 5.90 6.20 6.40Gas 3.08 6.20 6.69 7.34 7.73 8.11 8.30Comb. Renewables & Wastes2 0.62 0.34 0.35 0.33 0.89 0.89 0.89Geothermal – – 0.01 0.01 – – –Solar/Wind/Other – – – 0.00 – – –Electricity 1.51 2.72 2.53 2.63 2.78 2.20 1.80Heat 1.06 1.59 1.44 1.52 1.55 1.64 1.64
Shares (%)Coal 24.3 12.8 4.1 3.6 4.2 3.7 3.4Oil 39.1 35.4 32.1 29.9 30.0 31.4 32.5Gas 17.9 29.6 38.8 41.3 39.3 41.0 42.2Comb. Renewables & Wastes 3.6 1.6 2.0 1.9 4.5 4.5 4.5Geothermal – – – – – – –Solar/Wind/Other – – – – – – –Electricity 8.8 13.0 14.7 14.8 14.2 11.1 9.1Heat 6.2 7.6 8.3 8.5 7.9 8.3 8.3
TOTAL INDUSTRY6 7.90 8.06 4.97 4.88 5.54 5.62 5.51Coal1 1.87 0.80 0.46 0.41 0.53 0.48 0.43Oil 2.34 2.11 1.55 1.28 1.68 1.77 1.81Gas 2.29 3.76 1.70 1.89 2.01 2.11 2.11Comb. Renewables & Wastes2 0.02 0.00 – 0.01 0.11 0.11 0.11Geothermal – – – – – – –Solar/Wind/Other – – – – – – –Electricity 0.92 1.18 0.76 0.81 0.82 0.74 0.63Heat 0.46 0.21 0.51 0.48 0.40 0.43 0.43
Shares (%)Coal 23.6 9.9 9.2 8.4 9.5 8.5 7.8Oil 29.6 26.2 31.2 26.2 30.4 31.5 32.8Gas 29.0 46.6 34.1 38.8 36.2 37.4 38.3Comb. Renewables & Wastes 0.2 – – 0.2 1.9 1.9 1.9Geothermal – – – – – – –Solar/Wind/Other – – – – – – –Electricity 11.7 14.7 15.2 16.6 14.8 13.1 11.4Heat 5.9 2.6 10.3 9.8 7.2 7.6 7.7
TRANSPORT7 2.37 3.15 3.33 3.48 3.55 3.71 3.84
TOTAL OTHER SECTORS8 6.88 9.72 8.96 9.42 10.57 10.44 10.33Coal1 1.93 1.88 0.25 0.23 0.29 0.26 0.23Oil 2.45 2.25 0.74 0.66 0.75 0.79 0.80Gas 0.78 2.44 4.99 5.45 5.72 6.01 6.19Comb. Renewables & Wastes2 0.60 0.34 0.35 0.32 0.78 0.78 0.78Geothermal – – 0.01 0.01 – – –Solar/Wind/Other – – – 0.00 – – –Electricity 0.52 1.43 1.69 1.73 1.88 1.40 1.11Heat 0.60 1.38 0.93 1.04 1.15 1.21 1.21
Shares (%)Coal 28.1 19.4 2.7 2.4 2.7 2.5 2.3Oil 35.7 23.1 8.3 7.0 7.1 7.5 7.8Gas 11.4 25.1 55.7 57.8 54.1 57.5 59.9Comb. Renewables & Wastes 8.7 3.5 3.9 3.4 7.4 7.5 7.6Geothermal – – 0.1 0.1 – – –Solar/Wind/Other – – – – – – –Electricity 7.5 14.7 18.8 18.3 17.8 13.4 10.8Heat 8.7 14.2 10.4 11.0 10.9 11.6 11.7
304
HUNGARY Energy Balances and Key Statistical Data
261-Energy Balances 2/12/03 11:24 Page 304

Unit: Mtoe
DEMAND
ENERGY TRANSFORMATION AND LOSSES
1973 1990 2000 2001 2010 2020 2030
ELECTRICITY GENERATION9
INPUT (Mtoe) 6.37 10.23 10.33 10.44 10.95 11.06 11.07OUTPUT (Mtoe) 1.52 2.45 3.03 3.13 3.28 3.36 3.47(TWh gross) 17.64 28.44 35.19 36.42 38.11 39.06 40.38
Output Shares (%)Coal 66.0 30.5 27.6 24.5 21.5 20.5 19.8Oil 17.2 4.8 12.5 11.5 10.5 10.0 9.7Gas 16.2 15.7 18.8 24.3 28.9 31.2 33.4Comb. Renewables & Wastes – 0.1 0.3 0.3 0.5 0.5 0.5Nuclear – 48.3 40.3 38.8 38.0 37.1 35.9Hydro 0.6 0.6 0.5 0.5 0.5 0.5 0.5Geothermal – – – – – – –Solar/Wind/Other – – – 0.0 0.1 0.2 0.2
TOTAL LOSSES 4.87 7.99 7.69 7.66 7.19 7.95 8.24of which:Electricity and Heat Generation10 3.67 6.03 5.66 5.61 5.80 5.78 5.61Other Transformation 0.21 –0.05 0.15 0.16 –0.20 –0.20 –0.20Own Use and Losses11 0.99 2.02 1.89 1.88 1.58 2.37 2.83
Statistical Differences –0.68 –0.45 –0.02 –0.09 – – –
INDICATORS
1973 1990 2000 2001 2010 2020 2030
GDP (billion 1995 US$) 34.03 50.35 54.39 56.47 83.92 132.84 216.38Population (millions) 10.43 10.37 10.21 10.19 10.06 9.86 9.54TPES/GDP12 0.63 0.57 0.46 0.45 0.32 0.21 0.13Energy Production/TPES 0.60 0.50 0.45 0.43 0.36 0.32 0.31Per Capita TPES13 2.05 2.75 2.44 2.49 2.67 2.81 2.93Oil Supply/GDP12 0.24 0.17 0.13 0.12 0.09 0.06 0.04TFC/GDP12 0.50 0.42 0.32 0.31 0.23 0.15 0.09Per Capita TFC13 1.64 2.02 1.69 1.74 1.95 2.01 2.06Energy-related CO2
Emissions (Mt CO2)14 68.5 70.5 55.4 56.3 58.3 59.7 60.0CO2 Emissions from Bunkers
(Mt CO2) 0.2 0.5 0.7 0.7 0.7 0.7 0.7
GROWTH RATES (% per year)
73–79 79–90 90–00 00–01 01–10 10–20 20–30
TPES 4.9 0.0 –1.3 1.6 0.6 0.3 0.1Coal 1.2 –3.0 –4.2 –8.9 –0.3 –0.5 –0.8Oil 5.6 –2.6 –2.1 –3.5 0.9 0.4 0.3Gas 10.0 1.7 0.8 10.9 0.8 0.5 0.3Comb. Renewables & Wastes –2.6 –3.3 0.9 –4.1 8.6 – –Nuclear – – 0.4 –0.4 –0.3 – –Hydro 6.3 1.3 – 6.7 – – –Geothermal – – – 20.0 34.1 1.3 –Solar/Wind/Other – – – – – 11.6 2.9
TFC 4.5 –0.6 –1.9 3.0 1.1 0.1 –0.0
Electricity Consumption 6.0 2.2 –0.7 3.8 0.6 –2.3 –2.0Energy Production 2.4 –0.3 –2.4 –3.3 –1.2 –0.8 –0.5Net Oil Imports 7.1 –3.8 –2.1 –9.1 3.0 0.8 0.4GDP 4.3 1.3 0.8 3.8 4.5 4.7 5.0Growth in the TPES/GDP Ratio 0.6 –1.2 –2.1 –2.1 –3.7 –4.2 –4.7Growth in the TFC/GDP Ratio 0.2 –1.8 –2.7 –0.8 –3.2 –4.4 –4.8
Please note: Rounding may cause totals to differ from the sum of the elements.
305
Energy Balances and Key Statistical Data HUNGARY
261-Energy Balances 2/12/03 11:24 Page 305

261-Energy Balances 2/12/03 11:24 Page 306

IRELAND
ENERGY BALANCES AND KEY STATISTICAL DATA
Unit: Mtoe
SUPPLY
1973 1990 2000 2001 2010 2020 2030
TOTAL PRODUCTION 1.120 3.467 2.110 1.729 2.899 .. ..Coal1 0.045 0.016 – – – .. ..Peat 1.020 1.411 0.894 0.810 0.881 .. ..Oil – – – – – .. ..Gas – 1.872 0.958 0.658 1.590 .. ..Comb. Renewables & Wastes2 – 0.108 0.164 0.180 0.168 .. ..Nuclear – – – – – .. ..Hydro 0.055 0.060 0.073 0.051 0.069 .. ..Geothermal – – – – – .. ..Solar/Wind/Other3 – – 0.021 0.029 0.191 .. ..
TOTAL NET IMPORTS4 5.901 7.357 12.153 13.607 14.346 .. ..Coal1 Exports 0.073 0.023 0.014 0.014 0.008 .. ..
Imports 0.578 2.290 1.727 1.874 0.907 .. ..Net Imports 0.505 2.267 1.713 1.860 0.899 .. ..
Peat Exports – – – – 0.010 .. ..Imports – – – – – .. ..Net Imports – – – – –0.010 .. ..
Oil Exports 0.472 0.680 1.326 1.288 1.423 .. ..Imports 5.956 5.788 9.435 10.296 10.409 .. ..Bunkers 0.092 0.018 0.154 0.164 0.089 .. ..Net Imports 5.392 5.090 7.955 8.844 8.897 .. ..
Gas Exports – – – – – .. ..Imports – – 2.477 2.924 4.470 .. ..Net Imports – – 2.477 2.924 4.470 .. ..
Electricity Exports 0.002 – 0.006 0.025 – .. ..Imports 0.006 – 0.015 0.003 0.090 .. ..Net Imports 0.004 – 0.009 –0.022 0.090 .. ..
TOTAL STOCK CHANGES 0.168 –0.250 0.070 –0.356 – .. ..
TOTAL SUPPLY (TPES) 7.189 10.575 14.333 14.981 17.245 .. ..Coal1 0.565 2.375 1.853 1.830 0.899 .. ..Peat 1.020 1.288 0.726 0.797 0.871 .. ..Oil 5.545 4.871 8.053 8.533 8.897 .. ..Gas – 1.872 3.435 3.583 6.060 .. ..Comb. Renewables & Wastes2 – 0.108 0.164 0.180 0.168 .. ..Nuclear – – – – – .. ..Hydro 0.055 0.060 0.073 0.051 0.069 .. ..Geothermal – – – – – .. ..Solar/Wind/Other3 – – 0.021 0.029 0.191 .. ..Electricity Trade5 0.004 – 0.008 –0.021 0.090 .. ..
Shares (%)Coal 7.9 22.5 12.9 12.2 5.2 .. ..Peat 14.2 12.2 5.1 5.3 5.1 .. ..Oil 77.1 46.1 56.2 57.0 51.6 .. ..Gas – 17.7 24.0 23.9 35.1 .. ..Comb. Renewables & Wastes – 1.0 1.1 1.2 1.0 .. ..Nuclear – – – – – .. ..Hydro 0.8 0.6 0.5 0.3 0.4 .. ..Geothermal – – – – – .. ..Solar/Wind/Other – – 0.1 0.2 1.1 .. ..Electricity Trade 0.1 – 0.1 –0.1 0.5 .. ..
0 is negligible, – is nil, .. is not available.
307
261-Energy Balances 2/12/03 11:24 Page 307

Unit: Mtoe
DEMAND
FINAL CONSUMPTION BY SECTOR
1973 1990 2000 2001 2010 2020 2030
TFC 5.416 7.840 11.225 11.744 14.037 .. ..Coal1 0.520 1.138 0.451 0.408 0.262 .. ..Peat 0.408 0.427 0.106 0.106 0.127 .. ..Oil 3.856 4.149 7.207 7.589 8.691 .. ..Gas 0.103 0.998 1.583 1.685 2.384 .. ..Comb. Renewables & Wastes2 – 0.108 0.140 0.156 0.128 .. ..Geothermal – – – – – .. ..Solar/Wind/Other – – – – – .. ..Electricity 0.529 1.021 1.737 1.800 2.445 .. ..Heat – – – – – .. ..
Shares (%)Coal 9.6 14.5 4.0 3.5 1.9 .. ..Peat 7.5 5.4 0.9 0.9 0.9 .. ..Oil 71.2 52.9 64.2 64.6 61.9 .. ..Gas 1.9 12.7 14.1 14.3 17.0 .. ..Comb. Renewables & Wastes – 1.4 1.2 1.3 0.9 .. ..Geothermal – – – – – .. ..Solar/Wind/Other – – – – – .. ..Electricity 9.8 13.0 15.5 15.3 17.4 .. ..Heat – – – – – .. ..
TOTAL INDUSTRY6 1.920 2.385 2.834 2.901 2.967 .. ..Coal1 0.044 0.272 0.051 0.048 0.004 .. ..Peat – – – – – .. ..Oil 1.662 0.879 1.170 1.185 0.734 .. ..Gas 0.025 0.787 0.853 0.892 1.154 .. ..Comb. Renewables & Wastes2 – 0.061 0.096 0.109 0.088 .. ..Geothermal – – – – – .. ..Solar/Wind/Other – – – – – .. ..Electricity 0.189 0.386 0.665 0.667 0.987 .. ..Heat – – – – – .. ..
Shares (%)Coal 2.3 11.4 1.8 1.7 0.1 .. ..Peat – – – – – .. ..Oil 86.6 36.9 41.3 40.8 24.7 .. ..Gas 1.3 33.0 30.1 30.7 38.9 .. ..Comb. Renewables & Wastes – 2.6 3.4 3.8 3.0 .. ..Geothermal – – – – – .. ..Solar/Wind/Other – – – – – .. ..Electricity 9.8 16.2 23.5 23.0 33.3 .. ..Heat – – – – – .. ..
TRANSPORT7 1.406 2.031 4.100 4.377 5.590 .. ..
TOTAL OTHER SECTORS8 2.090 3.425 4.291 4.466 5.480 .. ..Coal1 0.476 0.866 0.400 0.361 0.258 .. ..Peat 0.408 0.427 0.106 0.106 0.127 .. ..Oil 0.788 1.240 1.939 2.028 2.370 .. ..Gas 0.078 0.211 0.730 0.794 1.230 .. ..Comb. Renewables & Wastes2 – 0.047 0.044 0.047 0.040 .. ..Geothermal – – – – – .. ..Solar/Wind/Other – – – – – .. ..Electricity 0.340 0.634 1.071 1.130 1.455 .. ..Heat – – – – – .. ..
Shares (%)Coal 22.8 25.3 9.3 8.1 4.7 .. ..Peat 19.5 12.5 2.5 2.4 2.3 .. ..Oil 37.7 36.2 45.2 45.4 43.2 .. ..Gas 3.7 6.2 17.0 17.8 22.4 .. ..Comb. Renewables & Wastes – 1.4 1.0 1.1 0.7 .. ..Geothermal – – – – – .. ..Solar/Wind/Other – – – – – .. ..Electricity 16.3 18.5 25.0 25.3 26.6 .. ..Heat – – – – – .. ..
308
IRELAND Energy Balances and Key Statistical Data
261-Energy Balances 2/12/03 11:24 Page 308

Unit: Mtoe
DEMAND
ENERGY TRANSFORMATION AND LOSSES
1973 1990 2000 2001 2010 2020 2030
ELECTRICITY GENERATION9
INPUT (Mtoe) 1.766 3.135 4.976 5.262 5.369 .. ..OUTPUT (Mtoe) 0.632 1.224 2.036 2.118 2.740 .. ..(TWh gross) 7.348 14.229 23.673 24.632 31.859 .. ..
Output Shares (%)Coal 1.0 41.6 28.8 28.7 13.6 .. ..Peat 23.9 15.8 7.5 8.9 6.0 .. ..Oil 66.3 10.0 19.6 21.1 1.4 .. ..Gas – 27.7 39.1 37.1 69.0 .. ..Comb. Renewables & Wastes – – 0.4 0.4 0.5 .. ..Nuclear – – – – – .. ..Hydro 8.8 4.9 3.6 2.4 2.5 .. ..Geothermal – – – – – .. ..Solar/Wind/Other – – 1.0 1.4 7.0 .. ..
TOTAL LOSSESof which: 1.649 2.259 3.423 3.686 3.208 .. ..Electricity and Heat Generation10 1.134 1.911 2.940 3.144 2.629 .. ..Other Transformation 0.329 0.041 0.029 0.063 – .. ..Own Use and Losses11 0.186 0.307 0.454 0.479 0.579 .. ..
Statistical Differences 0.124 0.476 –0.314 –0.449 – .. ..
INDICATORS
1973 1990 2000 2001 2010 2020 2030
GDP (billion 1995 US$) 26.92 52.88 105.98 112.01 172.28 .. ..Population (millions) 3.07 3.51 3.80 3.85 4.18 .. ..TPES/GDP12 0.27 0.20 0.14 0.13 0.10 .. ..Energy Production/TPES 0.16 0.33 0.15 0.12 0.17 .. ..Per Capita TPES13 2.34 3.02 3.77 3.89 4.13 .. ..Oil Supply/GDP12 0.21 0.09 0.08 0.08 0.05 .. ..TFC/GDP12 0.20 0.15 0.11 0.10 0.08 .. ..Per Capita TFC13 1.76 2.24 2.95 3.05 3.36 .. ..Energy-related CO2
Emissions (Mt CO2)14 21.0 30.3 41.3 43.1 45.7 .. ..CO2 Emissions from Bunkers
(Mt CO2) 1.1 1.1 2.3 2.7 2.4 .. ..
GROWTH RATES (% per year)
73–79 79–90 90–00 00–01 01–10 10–20 20–30
TPES 3.6 1.6 3.1 4.5 1.6 .. ..Coal 6.9 9.9 –2.5 –1.2 –7.6 .. ..Peat 2.1 1.0 –5.6 9.8 1.0 .. ..Oil 2.3 –2.4 5.2 6.0 0.5 .. ..Gas – 13.6 6.3 4.3 6.0 .. ..Comb. Renewables & Wastes – – 4.3 9.8 –0.8 .. ..Nuclear – – – – – .. ..Hydro 4.3 –1.5 2.0 –30.1 3.4 .. ..Geothermal – – – – – .. ..Solar/Wind/Other – – – 38.1 23.3 .. ..
TFC 4.3 1.0 3.7 4.6 2.0 .. ..
Electricity Consumption 5.8 2.9 5.5 3.6 3.5 .. ..Energy Production 4.6 8.1 –4.8 –18.1 5.9 .. ..Net Oil Imports 2.9 –2.0 4.6 11.2 0.1 .. ..GDP 4.9 3.6 7.2 5.7 4.9 .. ..Growth in the TPES/GDP Ratio –1.3 –1.9 –3.8 –1.1 –3.2 .. ..Growth in the TFC/GDP Ratio –0.6 –2.4 –3.3 –1.0 –2.8 .. ..
Please note: Rounding may cause totals to differ from the sum of the elements.
309
Energy Balances and Key Statistical Data IRELAND
261-Energy Balances 2/12/03 11:24 Page 309

261-Energy Balances 2/12/03 11:24 Page 310

ITALY
ENERGY BALANCES AND KEY STATISTICAL DATA
Unit: Mtoe
SUPPLY
1973 1990 2000 2001 2010 2020 2030
TOTAL PRODUCTION 20.5 25.5 27.1 26.3 36.7 41.2 49.6Coal1 0.3 0.3 0.0 – – – –Oil 1.1 4.7 4.7 4.2 10.0 10.0 10.0Gas 12.6 14.0 13.6 12.5 13.0 8.0 8.0Comb. Renewables & Wastes2 0.2 0.8 1.7 2.2 5.0 12.0 18.0Nuclear 0.8 – – – – – –Hydro 3.2 2.7 3.8 4.0 4.0 4.3 4.3Geothermal 2.1 3.0 3.1 3.2 3.6 4.5 5.7Solar/Wind/Other3 – 0.0 0.1 0.2 1.1 2.4 3.6
TOTAL NET IMPORTS4 109.3 128.9 149.6 143.9 146.0 156.5 162.4Coal1 Exports 0.4 0.1 0.1 0.1 – – –
Imports 8.2 13.9 13.2 13.7 20.0 21.0 23.0Net Imports 7.7 13.7 13.1 13.6 20.0 21.0 23.0
Oil Exports 29.4 20.1 22.1 23.0 22.0 18.0 18.0Imports 136.4 109.5 110.0 106.9 76.5 70.0 70.0Bunkers 7.1 2.7 2.7 2.8 2.5 2.0 1.6Net Imports 99.9 86.7 85.2 81.1 52.0 50.0 50.4
Gas Exports – 0.0 0.0 0.1 – – –Imports 1.6 25.3 47.0 44.8 67.0 82.0 87.0Net Imports 1.6 25.3 47.0 44.8 67.0 82.0 87.0
Electricity Exports 0.2 0.1 0.0 0.0 – – –Imports 0.3 3.1 3.9 4.2 6.0 3.0 1.0Net Imports 0.1 3.0 3.8 4.2 6.0 3.0 1.0
TOTAL STOCK CHANGES –0.9 –1.8 –5.0 1.8 – – –
TOTAL SUPPLY (TPES) 128.9 152.6 171.7 172.0 182.7 197.7 212.0Coal1 8.1 14.6 12.6 13.4 20.0 21.0 23.0Oil 100.1 89.3 88.2 86.5 62.0 60.0 60.4Gas 14.2 39.0 57.9 58.1 80.0 90.0 95.0Comb. Renewables & Wastes2 0.2 0.9 2.2 2.5 6.0 12.5 19.0Nuclear 0.8 – – – – – –Hydro 3.2 2.7 3.8 4.0 4.0 4.3 4.3Geothermal 2.1 3.0 3.1 3.2 3.6 4.5 5.7Solar/Wind/Other3 – 0.0 0.1 0.2 1.1 2.4 3.6Electricity Trade5 0.1 3.0 3.8 4.2 6.0 3.0 1.0
Shares (%)Coal 6.3 9.6 7.3 7.8 10.9 10.6 10.8Oil 77.6 58.5 51.3 50.3 33.9 30.3 28.5Gas 11.0 25.6 33.7 33.8 43.8 45.5 44.8Comb. Renewables & Wastes 0.2 0.6 1.3 1.4 3.3 6.3 9.0Nuclear 0.6 – – – – – –Hydro 2.5 1.8 2.2 2.3 2.2 2.2 2.0Geothermal 1.7 1.9 1.8 1.9 2.0 2.3 2.7Solar/Wind/Other – – 0.1 0.1 0.6 1.2 1.7Electricity Trade 0.1 2.0 2.2 2.4 3.3 1.5 0.5
0 is negligible, – is nil, .. is not available.
311
261-Energy Balances 2/12/03 11:24 Page 311
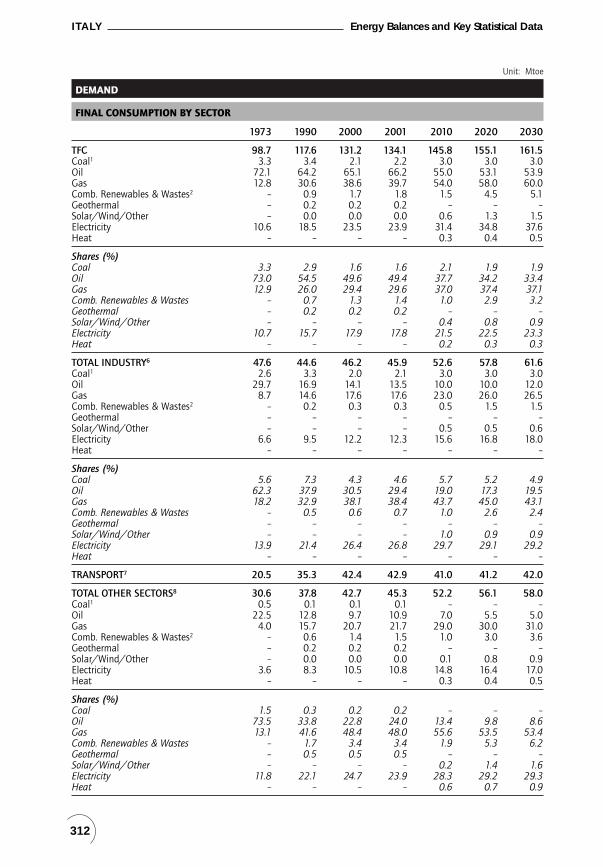
Unit: Mtoe
DEMAND
FINAL CONSUMPTION BY SECTOR
1973 1990 2000 2001 2010 2020 2030
TFC 98.7 117.6 131.2 134.1 145.8 155.1 161.5Coal1 3.3 3.4 2.1 2.2 3.0 3.0 3.0Oil 72.1 64.2 65.1 66.2 55.0 53.1 53.9Gas 12.8 30.6 38.6 39.7 54.0 58.0 60.0Comb. Renewables & Wastes2 – 0.9 1.7 1.8 1.5 4.5 5.1Geothermal – 0.2 0.2 0.2 – – –Solar/Wind/Other – 0.0 0.0 0.0 0.6 1.3 1.5Electricity 10.6 18.5 23.5 23.9 31.4 34.8 37.6Heat – – – – 0.3 0.4 0.5
Shares (%)Coal 3.3 2.9 1.6 1.6 2.1 1.9 1.9Oil 73.0 54.5 49.6 49.4 37.7 34.2 33.4Gas 12.9 26.0 29.4 29.6 37.0 37.4 37.1Comb. Renewables & Wastes – 0.7 1.3 1.4 1.0 2.9 3.2Geothermal – 0.2 0.2 0.2 – – –Solar/Wind/Other – – – – 0.4 0.8 0.9Electricity 10.7 15.7 17.9 17.8 21.5 22.5 23.3Heat – – – – 0.2 0.3 0.3
TOTAL INDUSTRY6 47.6 44.6 46.2 45.9 52.6 57.8 61.6Coal1 2.6 3.3 2.0 2.1 3.0 3.0 3.0Oil 29.7 16.9 14.1 13.5 10.0 10.0 12.0Gas 8.7 14.6 17.6 17.6 23.0 26.0 26.5Comb. Renewables & Wastes2 – 0.2 0.3 0.3 0.5 1.5 1.5Geothermal – – – – – – –Solar/Wind/Other – – – – 0.5 0.5 0.6Electricity 6.6 9.5 12.2 12.3 15.6 16.8 18.0Heat – – – – – – –
Shares (%)Coal 5.6 7.3 4.3 4.6 5.7 5.2 4.9Oil 62.3 37.9 30.5 29.4 19.0 17.3 19.5Gas 18.2 32.9 38.1 38.4 43.7 45.0 43.1Comb. Renewables & Wastes – 0.5 0.6 0.7 1.0 2.6 2.4Geothermal – – – – – – –Solar/Wind/Other – – – – 1.0 0.9 0.9Electricity 13.9 21.4 26.4 26.8 29.7 29.1 29.2Heat – – – – – – –
TRANSPORT7 20.5 35.3 42.4 42.9 41.0 41.2 42.0
TOTAL OTHER SECTORS8 30.6 37.8 42.7 45.3 52.2 56.1 58.0Coal1 0.5 0.1 0.1 0.1 – – –Oil 22.5 12.8 9.7 10.9 7.0 5.5 5.0Gas 4.0 15.7 20.7 21.7 29.0 30.0 31.0Comb. Renewables & Wastes2 – 0.6 1.4 1.5 1.0 3.0 3.6Geothermal – 0.2 0.2 0.2 – – –Solar/Wind/Other – 0.0 0.0 0.0 0.1 0.8 0.9Electricity 3.6 8.3 10.5 10.8 14.8 16.4 17.0Heat – – – – 0.3 0.4 0.5
Shares (%)Coal 1.5 0.3 0.2 0.2 – – –Oil 73.5 33.8 22.8 24.0 13.4 9.8 8.6Gas 13.1 41.6 48.4 48.0 55.6 53.5 53.4Comb. Renewables & Wastes – 1.7 3.4 3.4 1.9 5.3 6.2Geothermal – 0.5 0.5 0.5 – – –Solar/Wind/Other – – – – 0.2 1.4 1.6Electricity 11.8 22.1 24.7 23.9 28.3 29.2 29.3Heat – – – – 0.6 0.7 0.9
312
ITALY Energy Balances and Key Statistical Data
261-Energy Balances 2/12/03 11:24 Page 312

Unit: Mtoe
DEMAND
ENERGY TRANSFORMATION AND LOSSES
1973 1990 2000 2001 2010 2020 2030
ELECTRICITY GENERATION9
INPUT (Mtoe) 28.0 43.1 52.1 50.4 55.3 67.8 81.1OUTPUT (Mtoe) 12.4 18.3 23.2 23.4 28.4 34.8 39.6(TWh gross) 143.9 213.2 269.9 271.9 330.0 405.0 460.0
Output Shares (%)Coal 3.6 16.8 11.3 13.5 21.8 19.8 18.5Oil 62.4 48.2 31.8 27.6 6.7 5.4 4.8Gas 3.1 18.6 37.5 38.3 48.5 48.9 43.5Comb. Renewables & Wastes 0.9 0.1 0.7 1.0 5.4 8.6 15.2Nuclear 2.2 – – – – – –Hydro 26.1 14.8 16.4 17.2 14.2 12.3 10.9Geothermal 1.7 1.5 1.7 1.7 1.8 1.7 1.7Solar/Wind/Other – 0.0 0.5 0.7 1.6 3.2 5.4
TOTAL LOSSES 29.9 35.0 40.4 37.6 36.9 42.6 50.5of which:Electricity and Heat Generation10 15.6 24.8 28.8 27.1 26.6 32.6 41.0Other Transformation 6.0 1.0 2.2 1.1 1.5 1.0 0.5Own Use and Losses11 8.3 9.2 9.4 9.4 8.8 9.0 9.0
Statistical Differences 0.3 –0.0 0.0 0.3 – – –
INDICATORS
1973 1990 2000 2001 2010 2020 2030
GDP (billion 1995 US$) 647.03 1030.05 1203.89 1225.27 1490.35 1816.73 2214.58Population (millions) 54.75 56.72 57.76 57.93 58.49 58.04 56.98TPES/GDP12 0.20 0.15 0.14 0.14 0.12 0.11 0.10Energy Production/TPES 0.16 0.17 0.16 0.15 0.20 0.21 0.23Per Capita TPES13 2.35 2.69 2.97 2.97 3.12 3.41 3.72Oil Supply/GDP12 0.15 0.09 0.07 0.07 0.04 0.03 0.03TFC/GDP12 0.15 0.11 0.11 0.11 0.10 0.09 0.07Per Capita TFC13 1.80 2.07 2.27 2.32 2.49 2.67 2.83Energy-related CO2
Emissions (Mt CO2)14 334.4 400.1 425.1 425.3 428.6 451.4 473.9CO2 Emissions from Bunkers
(Mt CO2) 26.3 15.0 19.3 19.3 18.3 16.7 15.5
GROWTH RATES (% per year)
73–79 79–90 90–00 00–01 01–10 10–20 20–30
TPES 1.5 0.7 1.2 0.2 0.7 0.8 0.7Coal 4.3 3.1 –1.5 6.4 4.6 0.5 0.9Oil –0.0 –1.0 –0.1 –1.8 –3.6 –0.3 0.1Gas 8.1 5.1 4.0 0.3 3.6 1.2 0.5Comb. Renewables & Wastes 23.4 0.8 9.0 10.6 10.4 7.6 4.3Nuclear –2.9 – – – – – –Hydro 3.4 –3.3 3.4 5.9 0.0 0.6 –Geothermal 0.1 3.0 0.4 2.8 1.4 2.3 2.4Solar/Wind/Other – – 38.3 43.8 21.4 8.6 4.1
TFC 1.3 0.9 1.1 2.2 0.9 0.6 0.4
Electricity Consumption 4.0 3.0 2.4 1.7 3.1 1.0 0.8Energy Production 0.2 1.9 0.6 –2.9 3.8 1.2 1.9Net Oil Imports –0.4 –1.1 –0.2 –4.8 –4.8 –0.4 0.1GDP 3.5 2.4 1.6 1.8 2.2 2.0 2.0Growth in the TPES/GDP Ratio –1.9 –1.6 –0.4 –1.6 –1.5 –1.2 –1.3Growth in the TFC/GDP Ratio –2.1 –1.5 –0.5 0.4 –1.2 –1.3 –1.6
Please note: Rounding may cause totals to differ from the sum of the elements.
313
Energy Balances and Key Statistical Data ITALY
261-Energy Balances 2/12/03 11:24 Page 313

261-Energy Balances 2/12/03 11:24 Page 314

JAPAN
ENERGY BALANCES AND KEY STATISTICAL DATA
Unit: Mtoe
SUPPLY
1973 1990 2000 2001 2010 2020 2030
TOTAL PRODUCTION 29.5 73.3 105.5 104.1 .. .. ..Coal1 17.9 4.6 1.6 1.6 .. .. ..Oil 0.8 0.7 0.8 0.7 .. .. ..Gas 2.3 1.8 2.2 2.2 .. .. ..Comb. Renewables & Wastes2 – 4.4 5.8 5.2 .. .. ..Nuclear 2.5 52.7 83.9 83.4 .. .. ..Hydro 5.7 7.7 7.5 7.2 .. .. ..Geothermal 0.2 1.5 2.9 3.0 .. .. ..Solar/Wind/Other3 – 0.0 0.9 0.9 .. .. ..
TOTAL NET IMPORTS4 300.7 364.2 422.6 413.0 .. .. ..Coal1 Exports 0.4 1.1 1.8 1.2 .. .. ..
Imports 41.3 70.0 96.1 99.5 .. .. ..Net Imports 40.9 68.9 94.3 98.4 .. .. ..
Oil Exports 2.9 3.8 4.4 4.8 .. .. ..Imports 276.7 262.6 273.7 261.5 .. .. ..Bunkers 16.8 5.1 4.8 4.1 .. .. ..Net Imports 257.0 253.6 264.5 252.6 .. .. ..
Gas Exports – – – – .. .. ..Imports 2.8 41.7 63.8 62.0 .. .. ..Net Imports 2.8 41.7 63.8 62.0 .. .. ..
Electricity Exports – – – – .. .. ..Imports – – – – .. .. ..Net Imports – – – – .. .. ..
TOTAL STOCK CHANGES –6.6 –1.0 –3.9 3.6 .. .. ..
TOTAL SUPPLY (TPES) 323.6 436.5 524.2 520.7 .. .. ..Coal1 57.9 74.0 95.7 100.2 .. .. ..Oil 252.2 253.0 261.6 256.1 .. .. ..Gas 5.1 43.3 65.9 64.8 .. .. ..Comb. Renewables & Wastes2 – 4.4 5.8 5.2 .. .. ..Nuclear 2.5 52.7 83.9 83.4 .. .. ..Hydro 5.7 7.7 7.5 7.2 .. .. ..Geothermal 0.2 1.5 2.9 3.0 .. .. ..Solar/Wind/Other3 – 0.0 0.9 0.9 .. .. ..Electricity Trade5 – – – – .. .. ..
Shares (%)Coal 17.9 16.9 18.3 19.2 .. .. ..Oil 77.9 58.0 49.9 49.2 .. .. ..Gas 1.6 9.9 12.6 12.4 .. .. ..Comb. Renewables & Wastes – 1.0 1.1 1.0 .. .. ..Nuclear 0.8 12.1 16.0 16.0 .. .. ..Hydro 1.8 1.8 1.4 1.4 .. .. ..Geothermal 0.1 0.3 0.5 0.6 .. .. ..Solar/Wind/Other – – 0.2 0.2 .. .. ..Electricity Trade – – – – .. .. ..
0 is negligible, – is nil, .. is not available.Please note: Forecasts are not available.
315
261-Energy Balances 2/12/03 11:24 Page 315

Unit: Mtoe
DEMAND
FINAL CONSUMPTION BY SECTOR
1973 1990 2000 2001 2010 2020 2030
TFC 234.4 293.4 347.5 342.1 .. .. ..Coal1 20.2 22.5 21.6 20.8 .. .. ..Oil 171.5 188.3 221.0 218.5 .. .. ..Gas 7.0 14.7 20.2 20.4 .. .. ..Comb. Renewables & Wastes2 – 2.6 2.7 2.2 .. .. ..Geothermal – – – – .. .. ..Solar/Wind/Other – – 0.8 0.7 .. .. ..Electricity 35.7 65.1 80.8 79.1 .. .. ..Heat 0.0 0.2 0.4 0.4 .. .. ..
Shares (%)Coal 8.6 7.7 6.2 6.1 .. .. ..Oil 73.2 64.2 63.6 63.9 .. .. ..Gas 3.0 5.0 5.8 6.0 .. .. ..Comb. Renewables & Wastes – 0.9 0.8 0.7 .. .. ..Geothermal – – – – .. .. ..Solar/Wind/Other – – 0.2 0.2 .. .. ..Electricity 15.2 22.2 23.3 23.1 .. .. ..Heat – 0.1 0.1 0.1 .. .. ..
TOTAL INDUSTRY6 140.2 134.5 139.4 131.6 .. .. ..Coal1 18.2 21.7 21.3 20.8 .. .. ..Oil 94.9 73.3 73.4 68.1 .. .. ..Gas 2.1 4.6 8.1 8.4 .. .. ..Comb. Renewables & Wastes2 – 2.5 2.7 2.2 .. .. ..Geothermal – – – – .. .. ..Solar/Wind/Other – – – – .. .. ..Electricity 25.1 32.4 33.9 32.1 .. .. ..Heat – – – – .. .. ..
Shares (%)Coal 13.0 16.2 15.3 15.8 .. .. ..Oil 67.7 54.4 52.7 51.8 .. .. ..Gas 1.5 3.4 5.8 6.4 .. .. ..Comb. Renewables & Wastes – 1.8 1.9 1.7 .. .. ..Geothermal – – – – .. .. ..Solar/Wind/Other – – – – .. .. ..Electricity 17.9 24.1 24.3 24.4 .. .. ..Heat – – – – .. .. ..
TRANSPORT7 42.6 74.3 95.0 96.1 .. .. ..
TOTAL OTHER SECTORS8 51.6 84.5 113.1 114.4 .. .. ..Coal1 1.8 0.8 0.2 – .. .. ..Oil 35.3 42.5 54.1 55.9 .. .. ..Gas 5.0 10.1 12.1 12.0 .. .. ..Comb. Renewables & Wastes2 – 0.1 0.0 0.0 .. .. ..Geothermal – – – – .. .. ..Solar/Wind/Other – – 0.8 0.7 .. .. ..Electricity 9.5 30.9 45.3 45.3 .. .. ..Heat 0.0 0.2 0.4 0.4 .. .. ..
Shares (%)Coal 3.4 0.9 0.2 – .. .. ..Oil 68.5 50.2 47.9 48.8 .. .. ..Gas 9.6 11.9 10.7 10.5 .. .. ..Comb. Renewables & Wastes – 0.1 – – .. .. ..Geothermal – – – – .. .. ..Solar/Wind/Other – – 0.7 0.7 .. .. ..Electricity 18.4 36.6 40.1 39.6 .. .. ..Heat 0.1 0.2 0.4 0.4 .. .. ..
316
JAPAN Energy Balances and Key Statistical Data
261-Energy Balances 2/12/03 11:24 Page 316

Unit: Mtoe
DEMAND
ENERGY TRANSFORMATION AND LOSSES
1973 1990 2000 2001 2010 2020 2030
ELECTRICITY GENERATION9
INPUT (Mtoe) 90.6 169.4 221.6 217.2 .. .. ..OUTPUT (Mtoe) 40.0 73.2 90.9 88.9 .. .. ..(TWh gross) 465.4 850.8 1056.9 1033.2 .. .. ..
Output Shares (%)Coal 8.0 14.5 21.3 23.1 .. .. ..Oil 73.2 29.7 13.9 11.3 .. .. ..Gas 2.3 19.4 24.5 24.9 .. .. ..Comb. Renewables & Wastes – 2.0 1.2 0.7 .. .. ..Nuclear 2.1 23.8 30.5 31.0 .. .. ..Hydro 14.3 10.5 8.3 8.1 .. .. ..Geothermal 0.1 0.2 0.3 0.3 .. .. ..Solar/Wind/Other – 0.0 0.0 0.0 .. .. ..
TOTAL LOSSES 94.6 142.0 176.5 171.9 .. .. ..of which:Electricity and Heat Generation10 50.5 96.1 130.3 128.0 .. .. ..Other Transformation 25.1 23.3 24.4 23.3 .. .. ..Own Use and Losses11 19.0 22.6 21.8 20.6 .. .. ..
Statistical Differences –5.4 1.1 0.2 6.8 .. .. ..
INDICATORS
1973 1990 2000 2001 2010 2020 2030
GDP (billion 1995 US$) 2618.63 4935.97 5680.57 5647.68 .. .. ..Population (millions) 108.66 123.54 126.93 127.21 .. .. ..TPES/GDP12 0.12 0.09 0.09 0.09 .. .. ..Energy Production/TPES 0.09 0.17 0.20 0.20 .. .. ..Per Capita TPES13 2.98 3.53 4.13 4.09 .. .. ..Oil Supply/GDP12 0.10 0.05 0.05 0.05 .. .. ..TFC/GDP12 0.09 0.06 0.06 0.06 .. .. ..Per Capita TFC13 2.16 2.37 2.74 2.69 .. .. ..Energy-related CO2
Emissions (Mt CO2)14 891.2 1018.7 1149.9 1132.3 .. .. ..CO2 Emissions from Bunkers
(Mt CO2) 58.6 29.6 35.0 31.7 .. .. ..
GROWTH RATES (% per year)
73–79 79–90 90–00 00–01 01–10 10–20 20–30
TPES 1.5 1.9 1.8 –0.7 .. .. ..Coal –2.0 3.4 2.6 4.6 .. .. ..Oil 0.4 –0.2 0.3 –2.1 .. .. ..Gas 24.2 8.0 4.3 –1.6 .. .. ..Comb. Renewables & Wastes – – 2.8 –9.6 .. .. ..Nuclear 39.1 10.1 4.8 –0.7 .. .. ..Hydro 3.2 0.9 –0.2 –3.5 .. .. ..Geothermal 22.3 6.2 6.8 2.5 .. .. ..Solar/Wind/Other – 4.8 46.5 –5.4 .. .. ..
TFC 1.0 1.5 1.7 –1.5 .. .. ..
Electricity Consumption 3.9 3.4 2.2 –2.2 .. .. ..Energy Production 4.9 5.8 3.7 –1.4 .. .. ..Net Oil Imports 0.5 –0.4 0.4 –4.5 .. .. ..GDP 3.5 4.0 1.4 –0.6 .. .. ..Growth in the TPES/GDP Ratio –1.9 –2.0 0.4 –0.1 .. .. ..Growth in the TFC/GDP Ratio –2.4 –2.4 0.3 –1.0 .. .. ..
Please note: Rounding may cause totals to differ from the sum of the elements.
317
Energy Balances and Key Statistical Data JAPAN
261-Energy Balances 2/12/03 11:24 Page 317

261-Energy Balances 2/12/03 11:24 Page 318

KOREA
ENERGY BALANCES AND KEY STATISTICAL DATA
Unit: Mtoe
SUPPLY
1973 1990 2000 2001 2010 2020 2030
TOTAL PRODUCTION 6.76 21.91 33.37 34.21 .. .. ..Coal1 6.65 7.58 1.79 1.65 .. .. ..Oil – – 0.67 0.57 .. .. ..Gas – – – – .. .. ..Comb. Renewables & Wastes2 – – 2.12 2.36 .. .. ..Nuclear – 13.78 28.40 29.22 .. .. ..Hydro 0.11 0.55 0.35 0.36 .. .. ..Geothermal – – – – .. .. ..Solar/Wind/Other3 – 0.00 0.05 0.05 .. .. ..
TOTAL NET IMPORTS4 13.03 68.51 159.40 158.51 .. .. ..Coal1 Exports 0.12 – – – .. .. ..
Imports 0.45 15.73 38.45 39.15 .. .. ..Net Imports 0.34 15.73 38.45 39.15 .. .. ..
Oil Exports 1.04 3.73 40.85 40.14 .. .. ..Imports 14.28 55.41 150.78 146.53 .. .. ..Bunkers 0.56 1.58 6.05 5.94 .. .. ..Net Imports 12.69 50.10 103.88 100.46 .. .. ..
Gas Exports – – – – .. .. ..Imports – 2.68 17.07 18.90 .. .. ..Net Imports – 2.68 17.07 18.90 .. .. ..
Electricity Exports – – – – .. .. ..Imports – – – – .. .. ..Net Imports – – – – .. .. ..
TOTAL STOCK CHANGES 1.86 2.17 –1.61 2.07 .. .. ..
TOTAL SUPPLY (TPES) 21.64 92.58 191.16 194.78 .. .. ..Coal1 8.13 25.49 39.45 43.00 .. .. ..Oil 13.40 50.04 103.79 101.08 .. .. ..Gas – 2.72 17.01 18.73 .. .. ..Comb. Renewables & Wastes2 – – 2.12 2.36 .. .. ..Nuclear – 13.78 28.40 29.22 .. .. ..Hydro 0.11 0.55 0.35 0.36 .. .. ..Geothermal – – – – .. .. ..Solar/Wind/Other3 – 0.00 0.05 0.05 .. .. ..Electricity Trade5 – – – – .. .. ..
Shares (%)Coal 37.6 27.5 20.6 22.1 .. .. ..Oil 61.9 54.0 54.3 51.9 .. .. ..Gas – 2.9 8.9 9.6 .. .. ..Comb. Renewables & Wastes – – 1.1 1.2 .. .. ..Nuclear – 14.9 14.9 15.0 .. .. ..Hydro 0.5 0.6 0.2 0.2 .. .. ..Geothermal – – – – .. .. ..Solar/Wind/Other – – – – .. .. ..Electricity Trade – – – – .. .. ..
0 is negligible, – is nil, .. is not available.Please note: Forecasts are not available.
319
261-Energy Balances 2/12/03 11:24 Page 319

Unit: Mtoe
DEMAND
FINAL CONSUMPTION BY SECTOR
1973 1990 2000 2001 2010 2020 2030
TFC 17.40 63.99 126.18 130.25 .. .. ..Coal1 6.49 11.37 6.69 7.23 .. .. ..Oil 9.81 43.82 86.11 85.25 .. .. ..Gas – 0.67 10.92 11.81 .. .. ..Comb. Renewables & Wastes2 – – 0.11 0.11 .. .. ..Geothermal – – – – .. .. ..Solar/Wind/Other – 0.00 0.04 0.04 .. .. ..Electricity 1.10 8.12 20.08 21.53 .. .. ..Heat – – 2.22 4.28 .. .. ..
Shares (%)Coal 37.3 17.8 5.3 5.6 .. .. ..Oil 56.4 68.5 68.2 65.5 .. .. ..Gas – 1.1 8.7 9.1 .. .. ..Comb. Renewables & Wastes – – 0.1 0.1 .. .. ..Geothermal – – – – .. .. ..Solar/Wind/Other – – – – .. .. ..Electricity 6.3 12.7 15.9 16.5 .. .. ..Heat – – 1.8 3.3 .. .. ..
TOTAL INDUSTRY6 7.37 25.17 58.21 60.66 .. .. ..Coal1 0.39 2.71 6.12 6.65 .. .. ..Oil 6.22 17.42 38.29 37.63 .. .. ..Gas – 0.07 2.88 3.21 .. .. ..Comb. Renewables & Wastes2 – – – – .. .. ..Geothermal – – – – .. .. ..Solar/Wind/Other – – – – .. .. ..Electricity 0.76 4.97 10.92 11.37 .. .. ..Heat – – – 1.81 .. .. ..
Shares (%)Coal 5.3 10.8 10.5 11.0 .. .. ..Oil 84.4 69.2 65.8 62.0 .. .. ..Gas – 0.3 4.9 5.3 .. .. ..Comb. Renewables & Wastes – – – – .. .. ..Geothermal – – – – .. .. ..Solar/Wind/Other – – – – .. .. ..Electricity 10.3 19.7 18.8 18.7 .. .. ..Heat – – – 3.0 .. .. ..
TRANSPORT7 2.60 14.93 30.03 31.08 .. .. ..
TOTAL OTHER SECTORS8 7.43 23.89 37.94 38.52 .. .. ..Coal1 6.08 8.67 0.57 0.58 .. .. ..Oil 1.02 11.56 17.97 16.74 .. .. ..Gas – 0.60 8.04 8.61 .. .. ..Comb. Renewables & Wastes2 – – 0.11 0.11 .. .. ..Geothermal – – – – .. .. ..Solar/Wind/Other – 0.00 0.04 0.04 .. .. ..Electricity 0.33 3.06 8.99 9.97 .. .. ..Heat – – 2.22 2.47 .. .. ..
Shares (%)Coal 81.9 36.3 1.5 1.5 .. .. ..Oil 13.7 48.4 47.4 43.5 .. .. ..Gas – 2.5 21.2 22.4 .. .. ..Comb. Renewables & Wastes – – 0.3 0.3 .. .. ..Geothermal – – – – .. .. ..Solar/Wind/Other – – 0.1 0.1 .. .. ..Electricity 4.5 12.8 23.7 25.9 .. .. ..Heat – – 5.9 6.4 .. .. ..
320
KOREA Energy Balances and Key Statistical Data
261-Energy Balances 2/12/03 11:24 Page 320

Unit: Mtoe
DEMAND
ENERGY TRANSFORMATION AND LOSSES
1973 1990 2000 2001 2010 2020 2030
ELECTRICITY GENERATION9
INPUT (Mtoe) 3.30 26.60 66.03 71.07 .. .. ..OUTPUT (Mtoe) 1.27 9.06 22.68 24.21 .. .. ..(TWh gross) 14.83 105.37 263.73 281.51 .. .. ..
Output Shares (%)Coal 9.0 16.8 37.0 39.2 .. .. ..Oil 82.3 17.9 9.3 8.5 .. .. ..Gas – 9.1 10.7 10.8 .. .. ..Comb. Renewables & Wastes – – 0.2 0.1 .. .. ..Nuclear – 50.2 41.3 39.8 .. .. ..Hydro 8.7 6.0 1.5 1.5 .. .. ..Geothermal – – – – .. .. ..Solar/Wind/Other – – 0.0 0.0 .. .. ..
TOTAL LOSSES 4.10 28.58 61.33 62.69 .. .. ..of which:Electricity and Heat Generation10 2.03 17.53 40.52 41.37 .. .. ..Other Transformation 1.06 6.64 8.68 8.57 .. .. ..Own Use and Losses11 1.01 4.41 12.14 12.76 .. .. ..
Statistical Differences 0.14 0.02 3.65 1.84 .. .. ..
INDICATORS
1973 1990 2000 2001 2010 2020 2030
GDP (billion 1995 US$) 93.22 341.55 620.45 639.24 .. .. ..Population (millions) 34.10 42.87 47.01 47.34 .. .. ..TPES/GDP12 0.23 0.27 0.31 0.30 .. .. ..Energy Production/TPES 0.31 0.24 0.17 0.18 .. .. ..Per Capita TPES13 0.63 2.16 4.07 4.11 .. .. ..Oil Supply/GDP12 0.14 0.15 0.17 0.16 .. .. ..TFC/GDP12 0.19 0.19 0.20 0.20 .. .. ..Per Capita TFC13 0.51 1.49 2.68 2.75 .. .. ..Energy-related CO2
Emissions (Mt CO2)14 65.8 226.2 421.7 435.8 .. .. ..CO2 Emissions from Bunkers
(Mt CO2) 2.1 5.9 21.0 20.9 .. .. ..
GROWTH RATES (% per year)
73–79 79–90 90–00 00–01 01–10 10–20 20–30
TPES 10.8 7.9 7.5 1.9 .. .. ..Coal 6.9 7.0 4.5 9.0 .. .. ..Oil 12.3 5.8 7.6 –2.6 .. .. ..Gas – – 20.1 10.1 .. .. ..Comb. Renewables & Wastes – – – 11.1 .. .. ..Nuclear – 29.2 7.5 2.9 .. .. ..Hydro 10.5 9.6 –4.5 3.5 .. .. ..Geothermal – – – – .. .. ..Solar/Wind/Other – – 32.0 –6.3 .. .. ..
TFC 9.8 7.0 7.0 3.2 .. .. ..
Electricity Consumption 15.9 10.6 9.5 7.2 .. .. ..Energy Production 4.9 8.4 4.3 2.5 .. .. ..Net Oil Imports 13.3 5.8 7.6 –3.3 .. .. ..GDP 8.5 7.6 6.2 3.0 .. .. ..Growth in the TPES/GDP Ratio 2.1 0.3 1.3 –1.1 .. .. ..Growth in the TFC/GDP Ratio 1.2 –0.6 0.8 0.2 .. .. ..
Please note: Rounding may cause totals to differ from the sum of the elements.
321
Energy Balances and Key Statistical Data KOREA
261-Energy Balances 2/12/03 11:24 Page 321

261-Energy Balances 2/12/03 11:24 Page 322

LUXEMBOURG
ENERGY BALANCES AND KEY STATISTICAL DATA
Unit: Mtoe
SUPPLY
1973 1990 2000 2001 2010 2020 2030
TOTAL PRODUCTION 0.00 0.03 0.06 0.06 0.05 .. ..Coal1 – – – – – .. ..Oil – – – – – .. ..Gas – – – – – .. ..Comb. Renewables & Wastes2 – 0.03 0.04 0.05 0.04 .. ..Nuclear – – – – – .. ..Hydro 0.00 0.01 0.01 0.01 0.01 .. ..Geothermal – – – – – .. ..Solar/Wind/Other3 – – 0.00 0.00 0.00 .. ..
TOTAL NET IMPORTS4 4.51 3.55 3.68 3.75 3.67 .. ..Coal1 Exports – – – – – .. ..
Imports 2.44 1.13 0.13 0.11 0.10 .. ..Net Imports 2.44 1.13 0.13 0.11 0.10 .. ..
Oil Exports 0.01 0.01 0.02 0.03 – .. ..Imports 1.69 1.67 2.41 2.49 1.80 .. ..Bunkers – – – – – .. ..Net Imports 1.67 1.65 2.39 2.46 1.80 .. ..
Gas Exports – – – – – .. ..Imports 0.22 0.43 0.67 0.69 1.47 .. ..Net Imports 0.22 0.43 0.67 0.69 1.47 .. ..
Electricity Exports 0.07 0.06 0.06 0.06 0.18 .. ..Imports 0.24 0.40 0.56 0.55 0.48 .. ..Net Imports 0.18 0.34 0.49 0.49 0.30 .. ..
TOTAL STOCK CHANGES –0.01 –0.01 –0.05 0.03 – .. ..
TOTAL SUPPLY (TPES) 4.51 3.57 3.68 3.83 3.72 .. ..Coal1 2.44 1.13 0.13 0.11 0.10 .. ..Oil 1.67 1.64 2.34 2.48 1.80 .. ..Gas 0.22 0.43 0.67 0.69 1.47 .. ..Comb. Renewables & Wastes2 – 0.03 0.04 0.05 0.04 .. ..Nuclear – – – – – .. ..Hydro 0.00 0.01 0.01 0.01 0.01 .. ..Geothermal – – – – – .. ..Solar/Wind/Other3 – – 0.00 0.00 0.00 .. ..Electricity Trade5 0.18 0.34 0.49 0.49 0.30 .. ..
Shares (%)Coal 54.1 31.7 3.4 2.9 2.7 .. ..Oil 37.1 46.0 63.5 64.8 48.4 .. ..Gas 4.9 12.0 18.2 18.1 39.5 .. ..Comb. Renewables & Wastes – 0.7 1.2 1.2 1.1 .. ..Nuclear – – – – – .. ..Hydro 0.1 0.2 0.3 0.3 0.2 .. ..Geothermal – – – – – .. ..Solar/Wind/Other – – 0.1 0.1 0.1 .. ..Electricity Trade 3.9 9.5 13.4 12.7 8.0 .. ..
0 is negligible, – is nil, .. is not available.Please note: All forecast data are based on the 1999 submission.
323
261-Energy Balances 2/12/03 11:24 Page 323

Unit: Mtoe
DEMAND
FINAL CONSUMPTION BY SECTOR
1973 1990 2000 2001 2010 2020 2030
TFC 2.94 2.96 3.62 3.76 3.24 .. ..Blast Furnace Gas 0.74 0.20 – – – .. ..Other Coal1 0.24 0.35 0.13 0.11 0.10 .. ..Oil 1.54 1.64 2.34 2.48 1.80 .. ..Gas 0.18 0.42 0.62 0.64 0.72 .. ..Comb. Renewables & Wastes2 – – 0.02 0.02 0.01 .. ..Geothermal – – – – – .. ..Solar/Wind/Other – – – – – .. ..Electricity 0.26 0.36 0.49 0.48 0.55 .. ..Heat – – 0.03 0.03 0.06 .. ..
Shares (%)Blast Furnace Gas 25.1 6.8 – – – .. ..Other Coal 8.1 11.7 3.5 2.9 3.1 .. ..Oil 52.1 55.3 64.6 65.9 55.6 .. ..Gas 6.0 14.2 17.2 16.9 22.2 .. ..Comb. Renewables & Wastes – – 0.4 0.4 0.4 .. ..Geothermal – – – – – .. ..Solar/Wind/Other – – – – – .. ..Electricity 8.7 12.0 13.6 12.9 16.9 .. ..Heat – – 0.7 0.9 1.8 .. ..
TOTAL INDUSTRY6 2.09 1.34 0.97 0.94 1.04 .. ..Blast Furnace Gas 0.74 0.20 – – – .. ..Other Coal1 0.20 0.34 0.13 0.11 0.10 .. ..Oil 0.81 0.30 0.09 0.08 0.09 .. ..Gas 0.14 0.28 0.41 0.41 0.45 .. ..Comb. Renewables & Wastes2 – – – – – .. ..Geothermal – – – – – .. ..Solar/Wind/Other – – – – – .. ..Electricity 0.20 0.23 0.33 0.32 0.37 .. ..Heat – – 0.02 0.02 0.04 .. ..
Shares (%)Blast Furnace Gas 35.4 15.1 – – – .. ..Other Coal 9.7 25.3 12.9 11.7 9.2 .. ..Oil 38.6 22.0 9.0 8.7 8.7 .. ..Gas 6.6 20.8 42.4 43.4 42.8 .. ..Comb. Renewables & Wastes – – – – – .. ..Geothermal – – – – – .. ..Solar/Wind/Other – – – – – .. ..Electricity 9.7 16.8 34.1 34.0 35.1 .. ..Heat – – 1.7 2.2 4.2 .. ..
TRANSPORT7 0.29 1.03 1.92 2.03 1.41 .. ..
TOTAL OTHER SECTORS8 0.56 0.59 0.72 0.80 0.79 .. ..Coal1 0.03 0.01 0.00 0.00 0.00 .. ..Oil 0.44 0.31 0.33 0.38 0.31 .. ..Gas 0.04 0.14 0.21 0.23 0.27 .. ..Comb. Renewables & Wastes2 – – 0.02 0.02 0.01 .. ..Geothermal – – – – – .. ..Solar/Wind/Other – – – – – .. ..Electricity 0.05 0.13 0.15 0.16 0.17 .. ..Heat – – 0.01 0.01 0.02 .. ..
Shares (%)Coal 6.1 1.0 0.1 0.1 0.5 .. ..Oil 78.4 53.6 46.1 47.3 39.3 .. ..Gas 6.8 24.1 29.1 29.1 34.6 .. ..Comb. Renewables & Wastes – – 2.2 2.0 1.8 .. ..Geothermal – – – – – .. ..Solar/Wind/Other – – – – – .. ..Electricity 8.8 21.3 21.1 19.9 21.9 .. ..Heat – – 1.2 1.6 1.9 .. ..
324
LUXEMBOURG Energy Balances and Key Statistical Data
261-Energy Balances 2/12/03 11:24 Page 324

Unit: Mtoe
DEMAND
ENERGY TRANSFORMATION AND LOSSES
1973 1990 2000 2001 2010 2020 2030
ELECTRICITY GENERATION9
INPUT (Mtoe) 0.44 0.20 0.09 0.10 0.58 .. ..OUTPUT (Mtoe) 0.12 0.05 0.04 0.04 0.30 .. ..(TWh gross) 1.39 0.62 0.43 0.50 3.48 .. ..
Output Shares (%)Blast Furnace Gas 58.8 76.4 – – – .. ..Other Coal – – – – – .. ..Oil 27.6 1.4 – – – .. ..Gas 10.2 5.4 53.1 56.0 94.8 .. ..Comb. Renewables & Wastes – 5.4 12.9 11.8 1.4 .. ..Nuclear – – – – – .. ..Hydro 3.4 11.2 27.7 26.7 2.6 .. ..Geothermal – – – – – .. ..Solar/Wind/Other – – 6.2 5.4 1.1 .. ..
TOTAL LOSSES 1.54 0.61 0.06 0.07 0.48 .. ..of which:Electricity and Heat Generation10 0.32 0.14 0.02 0.02 0.23 .. ..Other Transformation 1.08 0.41 – – – .. ..Own Use and Losses11 0.14 0.06 0.04 0.04 0.25 .. ..
Statistical Differences 0.02 0.00 0.00 0.00 – .. ..
INDICATORS
1973 1990 2000 2001 2010 2020 2030
GDP (billion 1990 US$) 8.44 14.91 25.08 25.34 31.10 .. ..Population (millions) 0.35 0.38 0.44 0.44 0.49 .. –TPES/GDP12 0.53 0.24 0.15 0.15 0.12 .. ..Energy Production/TPES 0.00 0.01 0.02 0.02 0.01 .. ..Per Capita TPES13 12.83 9.37 8.39 8.65 7.65 .. ..Oil Supply/GDP12 0.20 0.11 0.09 0.10 0.06 .. ..TFC/GDP12 0.35 0.20 0.14 0.15 0.10 .. ..Per Capita TFC13 8.39 7.76 8.24 8.50 6.66 .. ..Energy-related CO2
Emissions (Mt CO2)14 16.5 10.5 8.0 8.4 8.1 – ..CO2 Emissions from Bunkers
(Mt CO2) 0.2 0.4 1.0 1.1 1.1 .. ..
GROWTH RATES (% per year)
73–79 79–90 90–00 00–01 01–10 10–20 20–30
TPES –2.5 –0.8 0.3 4.1 –0.3 .. ..Coal –4.6 –4.3 –19.8 –12.0 –1.1 .. –Oil –4.0 2.1 3.6 6.2 –3.5 .. ..Gas 13.6 –0.8 4.6 3.6 8.7 .. ..Comb. Renewables & Wastes – 3.0 5.8 4.5 –1.0 .. ..Nuclear – – – – – .. ..Hydro 12.2 –2.6 5.2 10.0 –3.5 .. ..Geothermal – – – – – .. ..Solar/Wind/Other – – – – 8.0 .. ..
TFC –0.1 0.1 2.0 4.0 –1.7 .. ..
Electricity Consumption 2.7 1.6 3.3 –1.6 1.4 .. ..Energy Production 36.6 1.6 6.3 5.3 –1.2 .. ..Net Oil Imports –3.5 1.8 3.8 2.8 –3.4 .. ..GDP 1.3 4.6 5.3 1.0 2.3 .. ..Growth in the TPES/GDP Ratio –3.7 –5.1 –4.8 3.0 –2.6 .. ..Growth in the TFC/GDP Ratio –1.3 –4.3 –3.1 3.0 –3.9 .. ..
Please note: Rounding may cause totals to differ from the sum of the elements.
325
Energy Balances and Key Statistical Data LUXEMBOURG
261-Energy Balances 2/12/03 11:24 Page 325

261-Energy Balances 2/12/03 11:24 Page 326

NETHERLANDS
ENERGY BALANCES AND KEY STATISTICAL DATA
Unit: Mtoe
SUPPLY
1973 1990 2000 2001 2010 2020 2030
TOTAL PRODUCTION 56.8 60.3 56.9 60.4 59.3 64.8 ..Coal1 1.1 – – – – – ..Oil 1.6 4.1 2.4 2.3 0.8 0.8 ..Gas 53.7 54.6 51.9 55.7 54.7 60.9 ..Comb. Renewables & Wastes2 – 0.7 1.5 1.3 2.5 2.5 ..Nuclear 0.3 0.9 1.0 1.0 0.9 – ..Hydro – 0.0 0.0 0.0 0.0 0.0 ..Geothermal – – – – – – ..Solar/Wind/Other3 – 0.0 0.1 0.1 0.3 0.6 ..
TOTAL NET IMPORTS4 6.0 6.4 21.1 16.9 20.1 21.9 ..Coal1 Exports 1.4 2.2 6.1 10.6 7.4 7.4 ..
Imports 2.9 11.6 14.2 19.0 15.5 16.7 ..Net Imports 1.5 9.4 8.2 8.4 8.1 9.3 ..
Oil Exports 42.4 60.2 65.9 68.3 43.9 43.9 ..Imports 83.8 91.1 107.8 110.1 93.3 93.5 ..Bunkers 11.6 10.9 13.4 14.7 21.1 21.1 ..Net Imports 29.8 19.9 28.5 27.1 28.3 28.5 ..
Gas Exports 25.3 25.8 29.7 35.5 33.9 33.9 ..Imports – 2.0 12.5 15.3 16.0 16.1 ..Net Imports –25.3 –23.8 –17.2 –20.2 –17.9 –17.8 ..
Electricity Exports 0.1 0.0 0.3 0.4 – – ..Imports 0.0 0.8 2.0 1.8 1.6 1.8 ..Net Imports –0.1 0.8 1.6 1.5 1.6 1.8 ..
TOTAL STOCK CHANGES –0.3 –0.2 –2.5 –0.1 – – ..
TOTAL SUPPLY (TPES) 62.4 66.5 75.5 77.2 79.4 86.7 ..Coal1 2.9 8.9 8.0 8.3 8.1 9.3 ..Oil 30.9 24.3 28.6 29.5 29.0 29.3 ..Gas 28.5 30.8 34.7 35.5 36.8 43.1 ..Comb. Renewables & Wastes2 – 0.7 1.5 1.3 2.5 2.5 ..Nuclear 0.3 0.9 1.0 1.0 0.9 – ..Hydro – 0.0 0.0 0.0 0.0 0.0 ..Geothermal – – – – – – ..Solar/Wind/Other3 – 0.0 0.1 0.1 0.3 0.6 ..Electricity Trade5 –0.1 0.8 1.6 1.5 1.6 1.8 ..
Shares (%)Coal 4.6 13.4 10.6 10.8 10.2 10.8 ..Oil 49.5 36.6 37.8 38.1 36.6 33.8 ..Gas 45.6 46.3 46.0 46.0 46.4 49.7 ..Comb. Renewables & Wastes – 1.1 2.0 1.6 3.1 2.9 ..Nuclear 0.5 1.4 1.4 1.3 1.2 – ..Hydro – – – – – – ..Geothermal – – – – – – ..Solar/Wind/Other – – 0.1 0.1 0.4 0.7 ..Electricity Trade –0.2 1.2 2.2 1.9 2.1 2.1 ..
0 is negligible, – is nil, .. is not available.
327
261-Energy Balances 2/12/03 11:24 Page 327

Unit: Mtoe
DEMAND
FINAL CONSUMPTION BY SECTOR
1973 1990 2000 2001 2010 2020 2030
TFC 48.8 51.2 59.5 60.3 65.7 69.4 ..Coal1 1.1 1.2 0.7 0.7 2.4 2.5 ..Oil 24.7 19.9 24.5 25.0 24.5 24.7 ..Gas 19.3 23.0 23.1 23.3 27.3 28.6 ..Comb. Renewables & Wastes2 – 0.3 0.3 0.2 0.4 0.4 ..Geothermal – – – – – – ..Solar/Wind/Other – 0.0 0.0 0.0 0.0 0.1 ..Electricity 3.8 6.3 8.4 8.6 10.0 12.1 ..Heat – 0.4 2.6 2.5 1.0 1.1 ..
Shares (%)Coal 2.2 2.4 1.1 1.1 3.7 3.6 ..Oil 50.5 38.9 41.1 41.4 37.3 35.6 ..Gas 39.5 44.9 38.8 38.7 41.5 41.3 ..Comb. Renewables & Wastes – 0.6 0.5 0.4 0.6 0.6 ..Geothermal – – – – – – ..Solar/Wind/Other – – – – – 0.1 ..Electricity 7.8 12.4 14.2 14.2 15.2 17.4 ..Heat – 0.9 4.3 4.2 1.6 1.5 ..
TOTAL INDUSTRY6 21.2 21.1 22.8 22.9 28.7 31.7 ..Coal1 0.8 1.2 0.6 0.6 2.4 2.4 ..Oil 10.4 8.2 9.2 9.7 10.4 10.9 ..Gas 8.1 8.8 8.2 7.6 11.7 13.4 ..Comb. Renewables & Wastes2 – 0.1 0.1 0.1 0.0 0.0 ..Geothermal – – – – – – ..Solar/Wind/Other – – – – 0.0 0.0 ..Electricity 2.0 2.9 3.5 3.5 3.8 4.5 ..Heat – – 1.2 1.4 0.4 0.4 ..
Shares (%)Coal 3.6 5.6 2.8 2.7 8.3 7.7 ..Oil 48.8 39.0 40.4 42.3 36.3 34.5 ..Gas 38.4 41.6 36.1 33.1 40.7 42.2 ..Comb. Renewables & Wastes – 0.2 0.3 0.3 – – ..Geothermal – – – – – – ..Solar/Wind/Other – – – – – – ..Electricity 9.2 13.5 15.3 15.3 13.1 14.3 ..Heat – – 5.1 6.3 1.5 1.4 ..
TRANSPORT7 7.5 10.6 14.5 14.6 13.1 12.7 ..
TOTAL OTHER SECTORS8 20.2 19.5 22.1 22.8 23.9 24.9 ..Coal1 0.3 0.1 0.0 0.0 0.0 0.0 ..Oil 6.9 1.2 0.8 0.8 1.2 1.2 ..Gas 11.1 14.2 14.9 15.8 15.6 15.3 ..Comb. Renewables & Wastes2 – 0.2 0.2 0.2 0.4 0.4 ..Geothermal – – – – – – ..Solar/Wind/Other – 0.0 0.0 0.0 0.0 0.1 ..Electricity 1.8 3.4 4.8 4.9 6.0 7.4 ..Heat – 0.4 1.4 1.1 0.6 0.6 ..
Shares (%)Coal 1.6 0.3 0.1 0.1 0.2 0.1 ..Oil 34.2 6.2 3.8 3.6 5.0 4.7 ..Gas 55.3 72.9 67.1 69.1 65.2 61.3 ..Comb. Renewables & Wastes – 1.3 1.0 0.8 1.7 1.5 ..Geothermal – – – – – – ..Solar/Wind/Other – – – – 0.1 0.2 ..Electricity 8.8 17.2 21.7 21.6 25.2 29.6 ..Heat – 2.3 6.3 4.8 2.6 2.5 ..
328
NETHERLANDS Energy Balances and Key Statistical Data
261-Energy Balances 2/12/03 11:24 Page 328
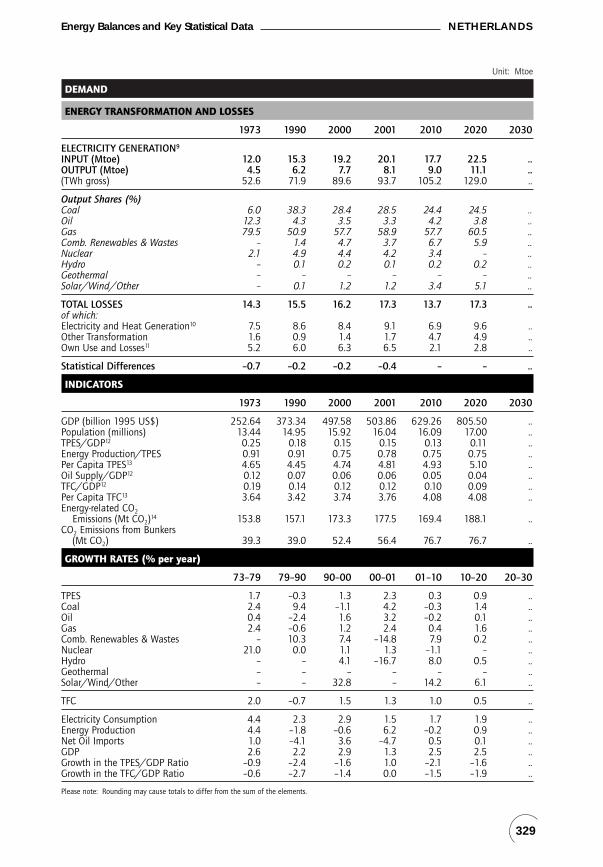
Unit: Mtoe
DEMAND
ENERGY TRANSFORMATION AND LOSSES
1973 1990 2000 2001 2010 2020 2030
ELECTRICITY GENERATION9
INPUT (Mtoe) 12.0 15.3 19.2 20.1 17.7 22.5 ..OUTPUT (Mtoe) 4.5 6.2 7.7 8.1 9.0 11.1 ..(TWh gross) 52.6 71.9 89.6 93.7 105.2 129.0 ..
Output Shares (%)Coal 6.0 38.3 28.4 28.5 24.4 24.5 ..Oil 12.3 4.3 3.5 3.3 4.2 3.8 ..Gas 79.5 50.9 57.7 58.9 57.7 60.5 ..Comb. Renewables & Wastes – 1.4 4.7 3.7 6.7 5.9 ..Nuclear 2.1 4.9 4.4 4.2 3.4 – ..Hydro – 0.1 0.2 0.1 0.2 0.2 ..Geothermal – – – – – – ..Solar/Wind/Other – 0.1 1.2 1.2 3.4 5.1 ..
TOTAL LOSSES 14.3 15.5 16.2 17.3 13.7 17.3 ..of which:Electricity and Heat Generation10 7.5 8.6 8.4 9.1 6.9 9.6 ..Other Transformation 1.6 0.9 1.4 1.7 4.7 4.9 ..Own Use and Losses11 5.2 6.0 6.3 6.5 2.1 2.8 ..
Statistical Differences –0.7 –0.2 –0.2 –0.4 – – ..
INDICATORS
1973 1990 2000 2001 2010 2020 2030
GDP (billion 1995 US$) 252.64 373.34 497.58 503.86 629.26 805.50 ..Population (millions) 13.44 14.95 15.92 16.04 16.09 17.00 ..TPES/GDP12 0.25 0.18 0.15 0.15 0.13 0.11 ..Energy Production/TPES 0.91 0.91 0.75 0.78 0.75 0.75 ..Per Capita TPES13 4.65 4.45 4.74 4.81 4.93 5.10 ..Oil Supply/GDP12 0.12 0.07 0.06 0.06 0.05 0.04 ..TFC/GDP12 0.19 0.14 0.12 0.12 0.10 0.09 ..Per Capita TFC13 3.64 3.42 3.74 3.76 4.08 4.08 ..Energy-related CO2
Emissions (Mt CO2)14 153.8 157.1 173.3 177.5 169.4 188.1 ..CO2 Emissions from Bunkers
(Mt CO2) 39.3 39.0 52.4 56.4 76.7 76.7 ..
GROWTH RATES (% per year)
73–79 79–90 90–00 00–01 01–10 10–20 20–30
TPES 1.7 –0.3 1.3 2.3 0.3 0.9 ..Coal 2.4 9.4 –1.1 4.2 –0.3 1.4 ..Oil 0.4 –2.4 1.6 3.2 –0.2 0.1 ..Gas 2.4 –0.6 1.2 2.4 0.4 1.6 ..Comb. Renewables & Wastes – 10.3 7.4 –14.8 7.9 0.2 ..Nuclear 21.0 0.0 1.1 1.3 –1.1 – ..Hydro – – 4.1 –16.7 8.0 0.5 ..Geothermal – – – – – – ..Solar/Wind/Other – – 32.8 – 14.2 6.1 ..
TFC 2.0 –0.7 1.5 1.3 1.0 0.5 ..
Electricity Consumption 4.4 2.3 2.9 1.5 1.7 1.9 ..Energy Production 4.4 –1.8 –0.6 6.2 –0.2 0.9 ..Net Oil Imports 1.0 –4.1 3.6 –4.7 0.5 0.1 ..GDP 2.6 2.2 2.9 1.3 2.5 2.5 ..Growth in the TPES/GDP Ratio –0.9 –2.4 –1.6 1.0 –2.1 –1.6 ..Growth in the TFC/GDP Ratio –0.6 –2.7 –1.4 0.0 –1.5 –1.9 ..
Please note: Rounding may cause totals to differ from the sum of the elements.
329
Energy Balances and Key Statistical Data NETHERLANDS
261-Energy Balances 2/12/03 11:24 Page 329

261-Energy Balances 2/12/03 11:24 Page 330

NEW ZEALAND
ENERGY BALANCES AND KEY STATISTICAL DATA
Unit: Mtoe
SUPPLY
1973 1990 2000 2001 2010 2020 2030
TOTAL PRODUCTION 4.05 12.26 14.75 14.93 17.72 20.92 26.37Coal1 1.29 1.39 2.20 2.37 4.00 6.00 9.00Oil 0.18 1.96 1.92 1.81 2.15 2.15 2.79Gas 0.28 3.90 5.06 5.32 2.97 3.28 2.95Comb. Renewables & Wastes2 – 0.68 1.23 1.18 1.56 2.03 2.63Nuclear – – – – – – –Hydro 1.23 2.01 2.12 1.85 2.23 2.33 2.35Geothermal 1.07 2.32 2.16 2.34 4.75 4.96 6.45Solar/Wind/Other3 – 0.01 0.07 0.07 0.07 0.18 0.20
TOTAL NET IMPORTS4 4.27 1.79 3.16 3.06 3.40 3.71 4.09Coal1 Exports 0.02 0.23 1.11 1.30 2.50 3.67 5.51
Imports – 0.01 – – – – –Net Imports –0.02 –0.22 –1.11 –1.30 –2.50 –3.67 –5.51
Oil Exports – 1.47 1.42 1.39 – – –Imports 4.60 3.80 5.93 6.01 6.29 7.82 10.16Bunkers 0.31 0.32 0.23 0.24 0.39 0.43 0.56Net Imports 4.29 2.01 4.28 4.37 5.90 7.39 9.60
Gas Exports – – – – – – –Imports – – – – – – –Net Imports – – – – – – –
Electricity Exports – – – – – – –Imports – – – – – – –Net Imports – – – – – – –
TOTAL STOCK CHANGES –0.05 –0.03 0.14 0.30 – – –
TOTAL SUPPLY (TPES) 8.27 14.02 18.05 18.29 21.12 24.64 30.47Coal1 1.26 1.13 1.10 1.27 1.50 2.33 3.49Oil 4.42 3.98 6.32 6.27 8.05 9.54 12.40Gas 0.28 3.90 5.06 5.32 2.97 3.28 2.95Comb. Renewables & Wastes2 – 0.68 1.23 1.18 1.56 2.03 2.63Nuclear – – – – – – –Hydro 1.23 2.01 2.12 1.85 2.23 2.33 2.35Geothermal 1.07 2.32 2.16 2.34 4.75 4.96 6.45Solar/Wind/Other3 – 0.01 0.07 0.07 0.07 0.18 0.20Electricity Trade5 – – – – – – –
Shares (%)Coal 15.3 8.0 6.1 7.0 7.1 9.4 11.5Oil 53.5 28.4 35.0 34.3 38.1 38.7 40.7Gas 3.4 27.8 28.0 29.1 14.0 13.3 9.7Comb. Renewables & Wastes – 4.9 6.8 6.4 7.4 8.2 8.6Nuclear – – – – – – –Hydro 14.9 14.3 11.7 10.1 10.5 9.5 7.7Geothermal 12.9 16.5 12.0 12.8 22.5 20.1 21.2Solar/Wind/Other – 0.1 0.4 0.4 0.3 0.7 0.7Electricity Trade – – – – – – –
0 is negligible, – is nil, .. is not available.Please note: Forecast data, except GDP and population, refer to the fiscal year.
331
261-Energy Balances 2/12/03 11:24 Page 331
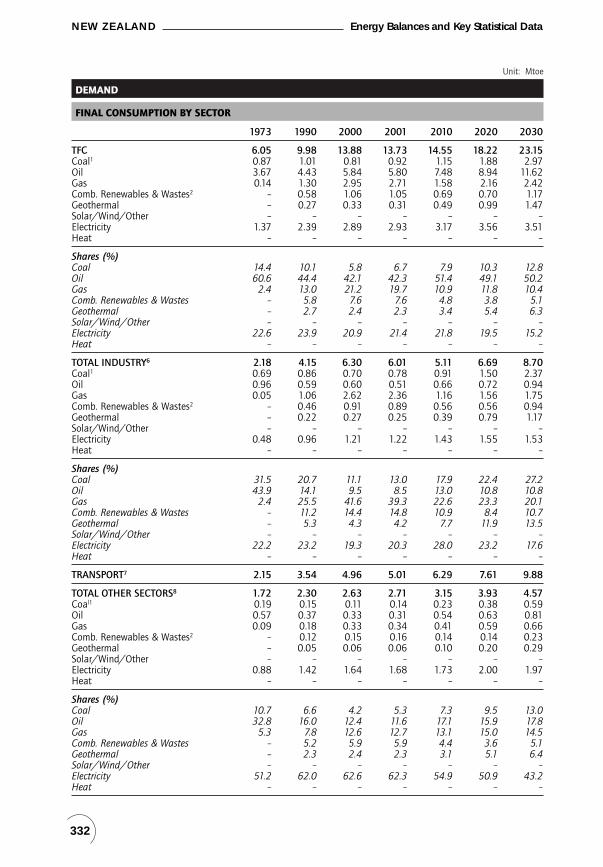
Unit: Mtoe
DEMAND
FINAL CONSUMPTION BY SECTOR
1973 1990 2000 2001 2010 2020 2030
TFC 6.05 9.98 13.88 13.73 14.55 18.22 23.15Coal1 0.87 1.01 0.81 0.92 1.15 1.88 2.97Oil 3.67 4.43 5.84 5.80 7.48 8.94 11.62Gas 0.14 1.30 2.95 2.71 1.58 2.16 2.42Comb. Renewables & Wastes2 – 0.58 1.06 1.05 0.69 0.70 1.17Geothermal – 0.27 0.33 0.31 0.49 0.99 1.47Solar/Wind/Other – – – – – – –Electricity 1.37 2.39 2.89 2.93 3.17 3.56 3.51Heat – – – – – – –
Shares (%)Coal 14.4 10.1 5.8 6.7 7.9 10.3 12.8Oil 60.6 44.4 42.1 42.3 51.4 49.1 50.2Gas 2.4 13.0 21.2 19.7 10.9 11.8 10.4Comb. Renewables & Wastes – 5.8 7.6 7.6 4.8 3.8 5.1Geothermal – 2.7 2.4 2.3 3.4 5.4 6.3Solar/Wind/Other – – – – – – –Electricity 22.6 23.9 20.9 21.4 21.8 19.5 15.2Heat – – – – – – –
TOTAL INDUSTRY6 2.18 4.15 6.30 6.01 5.11 6.69 8.70Coal1 0.69 0.86 0.70 0.78 0.91 1.50 2.37Oil 0.96 0.59 0.60 0.51 0.66 0.72 0.94Gas 0.05 1.06 2.62 2.36 1.16 1.56 1.75Comb. Renewables & Wastes2 – 0.46 0.91 0.89 0.56 0.56 0.94Geothermal – 0.22 0.27 0.25 0.39 0.79 1.17Solar/Wind/Other – – – – – – –Electricity 0.48 0.96 1.21 1.22 1.43 1.55 1.53Heat – – – – – – –
Shares (%)Coal 31.5 20.7 11.1 13.0 17.9 22.4 27.2Oil 43.9 14.1 9.5 8.5 13.0 10.8 10.8Gas 2.4 25.5 41.6 39.3 22.6 23.3 20.1Comb. Renewables & Wastes – 11.2 14.4 14.8 10.9 8.4 10.7Geothermal – 5.3 4.3 4.2 7.7 11.9 13.5Solar/Wind/Other – – – – – – –Electricity 22.2 23.2 19.3 20.3 28.0 23.2 17.6Heat – – – – – – –
TRANSPORT7 2.15 3.54 4.96 5.01 6.29 7.61 9.88
TOTAL OTHER SECTORS8 1.72 2.30 2.63 2.71 3.15 3.93 4.57Coal1 0.19 0.15 0.11 0.14 0.23 0.38 0.59Oil 0.57 0.37 0.33 0.31 0.54 0.63 0.81Gas 0.09 0.18 0.33 0.34 0.41 0.59 0.66Comb. Renewables & Wastes2 – 0.12 0.15 0.16 0.14 0.14 0.23Geothermal – 0.05 0.06 0.06 0.10 0.20 0.29Solar/Wind/Other – – – – – – –Electricity 0.88 1.42 1.64 1.68 1.73 2.00 1.97Heat – – – – – – –
Shares (%)Coal 10.7 6.6 4.2 5.3 7.3 9.5 13.0Oil 32.8 16.0 12.4 11.6 17.1 15.9 17.8Gas 5.3 7.8 12.6 12.7 13.1 15.0 14.5Comb. Renewables & Wastes – 5.2 5.9 5.9 4.4 3.6 5.1Geothermal – 2.3 2.4 2.3 3.1 5.1 6.4Solar/Wind/Other – – – – – – –Electricity 51.2 62.0 62.6 62.3 54.9 50.9 43.2Heat – – – – – – –
332
NEW ZEALAND Energy Balances and Key Statistical Data
261-Energy Balances 2/12/03 11:24 Page 332

Unit: Mtoe
DEMAND
ENERGY TRANSFORMATION AND LOSSES
1973 1990 2000 2001 2010 2020 2030
ELECTRICITY GENERATION9
INPUT (Mtoe) 3.16 5.37 6.20 6.67 8.90 8.96 9.51OUTPUT (Mtoe) 1.59 2.77 3.39 3.43 3.48 3.91 3.87(TWh gross) 18.53 32.27 39.47 39.91 40.52 45.50 44.96
Output Shares (%)Coal 8.5 1.5 2.5 3.7 3.1 2.4 2.5Oil 6.1 0.0 – – – – –Gas 1.4 17.6 24.2 31.2 13.3 11.7 5.3Comb. Renewables & Wastes – 1.3 1.5 1.2 6.5 8.3 9.3Nuclear – – – – – – –Hydro 77.3 72.3 62.4 53.8 63.9 59.5 60.7Geothermal 6.7 6.8 7.4 8.2 11.2 13.5 17.1Solar/Wind/Other – 0.4 1.9 2.1 2.0 4.5 5.1
TOTAL LOSSES 2.35 4.09 3.82 4.28 6.57 6.42 7.32of which:Electricity and Heat Generation10 1.57 2.59 2.80 3.23 5.42 5.04 5.64Other Transformation 0.36 0.60 –0.08 –0.05 0.44 0.48 0.62Own Use and Losses11 0.43 0.90 1.09 1.10 0.71 0.90 1.06
Statistical Differences –0.13 –0.06 0.35 0.28 – – –
INDICATORS
1973 1990 2000 2001 2010 2020 2030
GDP (billion 1995 US$) 42.85 52.23 68.88 71.11 88.80 113.68 145.52Population (millions) 2.97 3.36 3.83 3.85 4.28 4.60 4.87TPES/GDP12 0.19 0.27 0.26 0.26 0.24 0.22 0.21Energy Production/TPES 0.49 0.87 0.82 0.82 0.84 0.85 0.87Per Capita TPES13 2.78 4.17 4.71 4.75 4.94 5.36 6.25Oil Supply/GDP12 0.10 0.08 0.09 0.09 0.09 0.08 0.09TFC/GDP12 0.14 0.19 0.20 0.19 0.16 0.16 0.16Per Capita TFC13 2.04 2.97 3.62 3.57 3.40 3.96 4.75Energy-related CO2
Emissions (Mt CO2)14 17.0 22.3 31.4 32.9 33.8 41.7 53.3CO2 Emissions from Bunkers
(Mt CO2) 1.6 2.4 2.5 2.7 3.1 3.3 3.7
GROWTH RATES (% per year)
73–79 79–90 90–00 00–01 01–10 10–20 20–30
TPES 1.5 4.1 2.6 1.4 1.6 1.6 2.1Coal –4.5 1.5 –0.3 16.0 1.8 4.5 4.1Oil –0.9 –0.5 4.7 –0.8 2.8 1.7 2.7Gas 20.3 14.7 2.6 5.2 –6.3 1.0 –1.0Comb. Renewables & Wastes – 3.1 6.1 –4.2 3.2 2.6 2.7Nuclear – – – – – – –Hydro 4.6 2.0 0.5 –12.9 2.1 0.4 0.1Geothermal –2.2 8.6 –0.7 8.3 8.2 0.4 2.7Solar/Wind/Other – 12.5 19.4 7.7 –0.2 10.0 1.1
TFC 2.1 3.5 3.4 –1.1 0.7 2.3 2.4
Electricity Consumption 3.0 3.5 1.9 1.4 0.9 1.2 –0.1Energy Production 4.6 7.9 1.9 1.3 1.9 1.7 2.3Net Oil Imports –2.5 –5.4 7.8 2.2 3.4 2.3 2.7GDP 0.0 1.8 2.8 3.2 2.5 2.5 2.5Growth in the TPES/GDP Ratio 1.5 2.2 –0.2 –1.8 –0.9 –0.9 –0.3Growth in the TFC/GDP Ratio 2.0 1.7 0.5 –4.2 –1.8 –0.2 –0.1
Please note: Rounding may cause totals to differ from the sum of the elements.
333
Energy Balances and Key Statistical Data NEW ZEALAND
261-Energy Balances 2/12/03 11:24 Page 333

261-Energy Balances 2/12/03 11:24 Page 334

NORWAY
ENERGY BALANCES AND KEY STATISTICAL DATA
Unit: Mtoe
SUPPLY
1973 1990 2000 2001 2010 2020 2030
TOTAL PRODUCTION 8.08 120.30 229.04 226.57 .. .. ..Coal1 0.29 0.20 0.42 1.20 .. .. ..Oil 1.52 84.51 169.50 164.66 .. .. ..Gas – 24.14 45.80 48.88 .. .. ..Comb. Renewables & Wastes2 – 1.03 1.36 1.47 .. .. ..Nuclear – – – – .. .. ..Hydro 6.27 10.42 11.95 10.36 .. .. ..Geothermal – – – – .. .. ..Solar/Wind/Other3 – 0.00 0.01 0.01 .. .. ..
TOTAL NET IMPORTS4 6.15 –96.94 –202.88 –202.06 .. .. ..Coal1 Exports 0.09 0.17 0.39 1.01 .. .. ..
Imports 0.67 0.84 0.99 0.88 .. .. ..Net Imports 0.58 0.67 0.60 –0.13 .. .. ..
Oil Exports 3.58 78.10 163.37 162.45 .. .. ..Imports 10.23 4.47 4.53 4.47 .. .. ..Bunkers 0.64 0.45 0.83 0.81 .. .. ..Net Imports 6.01 –74.08 –159.67 –158.80 .. .. ..
Gas Exports – 22.17 42.17 43.45 .. .. ..Imports – – – – .. .. ..Net Imports – –22.17 –42.17 –43.45 .. .. ..
Electricity Exports 0.45 1.40 1.77 0.62 .. .. ..Imports 0.01 0.03 0.13 0.92 .. .. ..Net Imports –0.45 –1.37 –1.64 0.31 .. .. ..
TOTAL STOCK CHANGES 0.41 –1.87 –0.37 2.10 .. .. ..
TOTAL SUPPLY (TPES) 14.63 21.49 25.79 26.61 .. .. ..Coal1 0.91 0.86 1.08 0.94 .. .. ..Oil 7.90 8.57 9.41 8.08 .. .. ..Gas – 1.98 3.63 5.42 .. .. ..Comb. Renewables & Wastes2 – 1.03 1.36 1.49 .. .. ..Nuclear – – – – .. .. ..Hydro 6.27 10.42 11.95 10.36 .. .. ..Geothermal – – – – .. .. ..Solar/Wind/Other3 – 0.00 0.01 0.01 .. .. ..Electricity Trade5 –0.45 –1.37 –1.64 0.31 .. .. ..
Shares (%)Coal 6.2 4.0 4.2 3.5 .. .. ..Oil 54.0 39.9 36.5 30.4 .. .. ..Gas – 9.2 14.1 20.4 .. .. ..Comb. Renewables & Wastes – 4.8 5.3 5.6 .. .. ..Nuclear – – – – .. .. ..Hydro 42.8 48.5 46.3 38.9 .. .. ..Geothermal – – – – .. .. ..Solar/Wind/Other – – – – .. .. ..Electricity Trade –3.1 –6.4 –6.4 1.2 .. .. ..
0 is negligible, – is nil, .. is not available.Please note: Forecasts are not available.
335
261-Energy Balances 2/12/03 11:24 Page 335
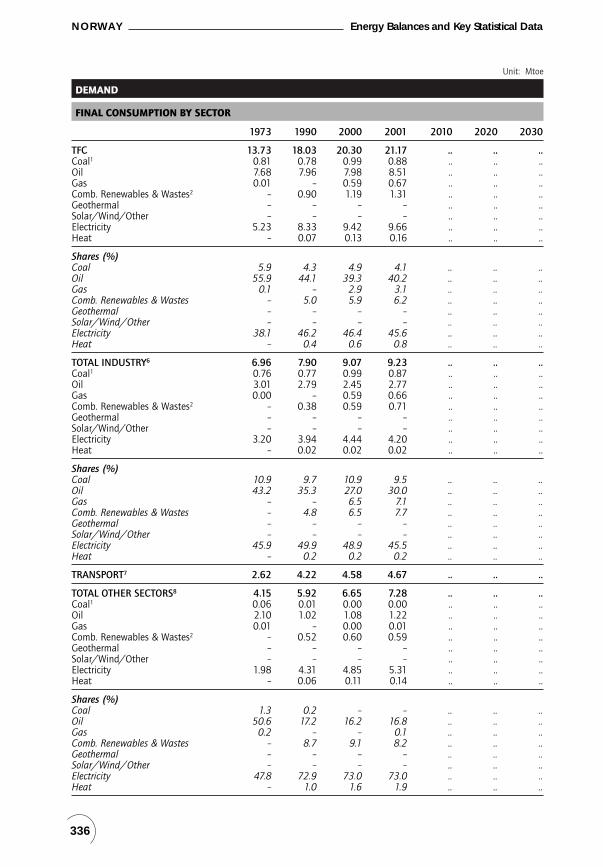
Unit: Mtoe
DEMAND
FINAL CONSUMPTION BY SECTOR
1973 1990 2000 2001 2010 2020 2030
TFC 13.73 18.03 20.30 21.17 .. .. ..Coal1 0.81 0.78 0.99 0.88 .. .. ..Oil 7.68 7.96 7.98 8.51 .. .. ..Gas 0.01 – 0.59 0.67 .. .. ..Comb. Renewables & Wastes2 – 0.90 1.19 1.31 .. .. ..Geothermal – – – – .. .. ..Solar/Wind/Other – – – – .. .. ..Electricity 5.23 8.33 9.42 9.66 .. .. ..Heat – 0.07 0.13 0.16 .. .. ..
Shares (%)Coal 5.9 4.3 4.9 4.1 .. .. ..Oil 55.9 44.1 39.3 40.2 .. .. ..Gas 0.1 – 2.9 3.1 .. .. ..Comb. Renewables & Wastes – 5.0 5.9 6.2 .. .. ..Geothermal – – – – .. .. ..Solar/Wind/Other – – – – .. .. ..Electricity 38.1 46.2 46.4 45.6 .. .. ..Heat – 0.4 0.6 0.8 .. .. ..
TOTAL INDUSTRY6 6.96 7.90 9.07 9.23 .. .. ..Coal1 0.76 0.77 0.99 0.87 .. .. ..Oil 3.01 2.79 2.45 2.77 .. .. ..Gas 0.00 – 0.59 0.66 .. .. ..Comb. Renewables & Wastes2 – 0.38 0.59 0.71 .. .. ..Geothermal – – – – .. .. ..Solar/Wind/Other – – – – .. .. ..Electricity 3.20 3.94 4.44 4.20 .. .. ..Heat – 0.02 0.02 0.02 .. .. ..
Shares (%)Coal 10.9 9.7 10.9 9.5 .. .. ..Oil 43.2 35.3 27.0 30.0 .. .. ..Gas – – 6.5 7.1 .. .. ..Comb. Renewables & Wastes – 4.8 6.5 7.7 .. .. ..Geothermal – – – – .. .. ..Solar/Wind/Other – – – – .. .. ..Electricity 45.9 49.9 48.9 45.5 .. .. ..Heat – 0.2 0.2 0.2 .. .. ..
TRANSPORT7 2.62 4.22 4.58 4.67 .. .. ..
TOTAL OTHER SECTORS8 4.15 5.92 6.65 7.28 .. .. ..Coal1 0.06 0.01 0.00 0.00 .. .. ..Oil 2.10 1.02 1.08 1.22 .. .. ..Gas 0.01 – 0.00 0.01 .. .. ..Comb. Renewables & Wastes2 – 0.52 0.60 0.59 .. .. ..Geothermal – – – – .. .. ..Solar/Wind/Other – – – – .. .. ..Electricity 1.98 4.31 4.85 5.31 .. .. ..Heat – 0.06 0.11 0.14 .. .. ..
Shares (%)Coal 1.3 0.2 – – .. .. ..Oil 50.6 17.2 16.2 16.8 .. .. ..Gas 0.2 – – 0.1 .. .. ..Comb. Renewables & Wastes – 8.7 9.1 8.2 .. .. ..Geothermal – – – – .. .. ..Solar/Wind/Other – – – – .. .. ..Electricity 47.8 72.9 73.0 73.0 .. .. ..Heat – 1.0 1.6 1.9 .. .. ..
336
NORWAY Energy Balances and Key Statistical Data
261-Energy Balances 2/12/03 11:24 Page 336

Unit: Mtoe
DEMAND
ENERGY TRANSFORMATION AND LOSSES
1973 1990 2000 2001 2010 2020 2030
ELECTRICITY GENERATION9
INPUT (Mtoe) 6.31 10.59 12.19 10.64 .. .. ..OUTPUT (Mtoe) 6.28 10.46 12.01 10.43 .. .. ..(TWh gross) 73.03 121.61 139.61 121.28 .. .. ..
Output Shares (%)Coal 0.0 0.2 0.1 0.2 .. .. ..Oil 0.2 0.0 0.0 0.0 .. .. ..Gas – – 0.2 0.2 .. .. ..Comb. Renewables & Wastes – 0.2 0.2 0.2 .. .. ..Nuclear – – – – .. .. ..Hydro 99.8 99.6 99.5 99.3 .. .. ..Geothermal – – – – .. .. ..Solar/Wind/Other – – 0.0 0.0 .. .. ..
TOTAL LOSSES 0.86 3.66 4.98 6.49 .. .. ..of which:Electricity and Heat Generation10 0.03 0.04 0.05 0.06 .. .. ..Other Transformation 0.09 –0.04 –0.06 –0.13 .. .. ..Own Use and Losses11 0.73 3.66 4.99 6.57 .. .. ..
Statistical Differences 0.05 –0.20 0.52 –1.06 .. .. ..
INDICATORS
1973 1990 2000 2001 2010 2020 2030
GDP (billion 1995 US$) 70.52 123.12 175.85 178.39 .. .. ..Population (millions) 3.96 4.24 4.49 4.51 .. .. –TPES/GDP12 0.21 0.17 0.15 0.15 .. .. ..Energy Production/TPES 0.55 5.60 8.88 8.52 .. .. ..Per Capita TPES13 3.70 5.07 5.74 5.90 .. .. ..Oil Supply/GDPY 0.11 0.07 0.05 0.05 .. .. ..TFC/GDP12 0.19 0.15 0.12 0.12 .. .. ..Per Capita TFC13 3.47 4.25 4.52 4.69 .. .. ..Energy-related CO2
Emissions (Mt CO2)14 24.2 28.5 34.0 37.9 .. .. ..CO2 Emissions from Bunkers
(Mt CO2) 2.8 2.7 3.7 3.7 .. .. ..
GROWTH RATES (% per year)
73–79 79–90 90–00 00–01 01–10 10–20 20–30
TPES 4.0 1.4 1.8 3.2 .. .. ..Coal 1.4 –1.3 2.2 –12.2 .. .. ..Oil 2.2 –0.4 0.9 –14.1 .. .. ..Gas – 9.8 6.3 49.4 .. .. ..Comb. Renewables & Wastes – 5.6 2.8 9.3 .. .. ..Nuclear – – – – .. .. ..Hydro 3.3 2.9 1.4 –13.3 .. .. ..Geothermal – – – – .. .. ..Solar/Wind/Other – – – –33.3 .. .. ..
TFC 3.5 0.6 1.2 4.3 .. .. ..
Electricity Consumption 3.6 2.3 1.2 2.5 .. .. ..Energy Production 33.7 9.1 6.7 –1.1 .. .. ..Net Oil Imports – 20.4 8.0 –0.5 .. .. ..GDP 4.6 2.6 3.6 1.4 .. .. ..Growth in the TPES/GDP Ratio –0.6 –1.2 –1.7 1.7 .. .. ..Growth in the TFC/GDP Ratio –1.1 –2.0 –2.4 2.8 .. .. ..
Please note: Rounding may cause totals to differ from the sum of the elements.
337
Energy Balances and Key Statistical Data NORWAY
261-Energy Balances 2/12/03 11:24 Page 337

261-Energy Balances 2/12/03 11:24 Page 338
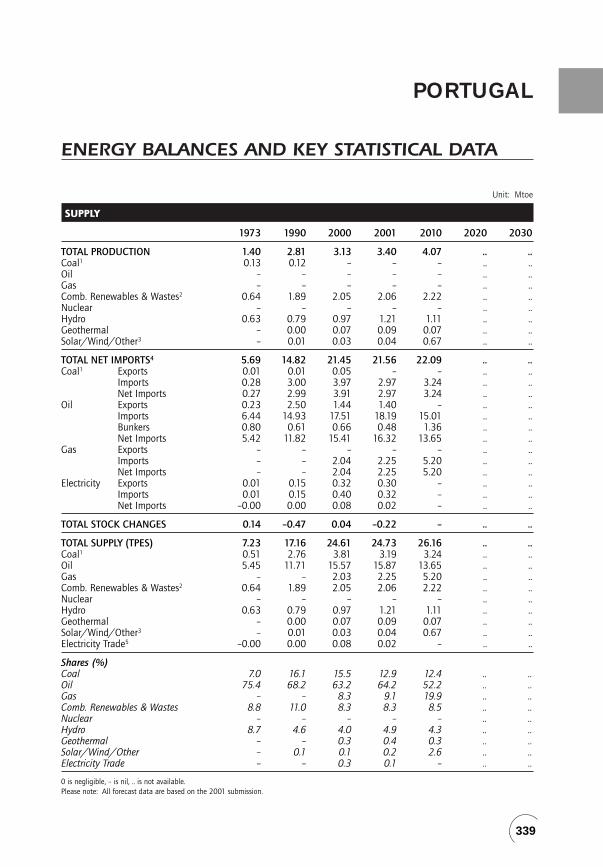
PORTUGAL
ENERGY BALANCES AND KEY STATISTICAL DATA
Unit: Mtoe
SUPPLY
1973 1990 2000 2001 2010 2020 2030
TOTAL PRODUCTION 1.40 2.81 3.13 3.40 4.07 .. ..Coal1 0.13 0.12 – – – .. ..Oil – – – – – .. ..Gas – – – – – .. ..Comb. Renewables & Wastes2 0.64 1.89 2.05 2.06 2.22 .. ..Nuclear – – – – – .. ..Hydro 0.63 0.79 0.97 1.21 1.11 .. ..Geothermal – 0.00 0.07 0.09 0.07 .. ..Solar/Wind/Other3 – 0.01 0.03 0.04 0.67 .. ..
TOTAL NET IMPORTS4 5.69 14.82 21.45 21.56 22.09 .. ..Coal1 Exports 0.01 0.01 0.05 – – .. ..
Imports 0.28 3.00 3.97 2.97 3.24 .. ..Net Imports 0.27 2.99 3.91 2.97 3.24 .. ..
Oil Exports 0.23 2.50 1.44 1.40 – .. ..Imports 6.44 14.93 17.51 18.19 15.01 .. ..Bunkers 0.80 0.61 0.66 0.48 1.36 .. ..Net Imports 5.42 11.82 15.41 16.32 13.65 .. ..
Gas Exports – – – – – .. ..Imports – – 2.04 2.25 5.20 .. ..Net Imports – – 2.04 2.25 5.20 .. ..
Electricity Exports 0.01 0.15 0.32 0.30 – .. ..Imports 0.01 0.15 0.40 0.32 – .. ..Net Imports –0.00 0.00 0.08 0.02 – .. ..
TOTAL STOCK CHANGES 0.14 –0.47 0.04 –0.22 – .. ..
TOTAL SUPPLY (TPES) 7.23 17.16 24.61 24.73 26.16 .. ..Coal1 0.51 2.76 3.81 3.19 3.24 .. ..Oil 5.45 11.71 15.57 15.87 13.65 .. ..Gas – – 2.03 2.25 5.20 .. ..Comb. Renewables & Wastes2 0.64 1.89 2.05 2.06 2.22 .. ..Nuclear – – – – – .. ..Hydro 0.63 0.79 0.97 1.21 1.11 .. ..Geothermal – 0.00 0.07 0.09 0.07 .. ..Solar/Wind/Other3 – 0.01 0.03 0.04 0.67 .. ..Electricity Trade5 –0.00 0.00 0.08 0.02 – .. ..
Shares (%)Coal 7.0 16.1 15.5 12.9 12.4 .. ..Oil 75.4 68.2 63.2 64.2 52.2 .. ..Gas – – 8.3 9.1 19.9 .. ..Comb. Renewables & Wastes 8.8 11.0 8.3 8.3 8.5 .. ..Nuclear – – – – – .. ..Hydro 8.7 4.6 4.0 4.9 4.3 .. ..Geothermal – – 0.3 0.4 0.3 .. ..Solar/Wind/Other – 0.1 0.1 0.2 2.6 .. ..Electricity Trade – – 0.3 0.1 – .. ..
0 is negligible, – is nil, .. is not available.Please note: All forecast data are based on the 2001 submission.
339
261-Energy Balances 2/12/03 11:24 Page 339

Unit: Mtoe
DEMAND
FINAL CONSUMPTION BY SECTOR
1973 1990 2000 2001 2010 2020 2030
TFC 6.11 13.42 19.51 19.64 20.73 .. ..Coal1 0.19 0.59 0.43 0.19 0.34 .. ..Oil 4.59 8.97 13.10 13.08 11.83 .. ..Gas 0.05 0.05 0.83 1.04 1.80 .. ..Comb. Renewables & Wastes2 0.58 1.74 1.70 1.70 1.84 .. ..Geothermal – – 0.00 0.00 – .. ..Solar/Wind/Other – 0.01 0.02 0.02 0.06 .. ..Electricity 0.70 2.03 3.30 3.44 4.54 .. ..Heat – 0.03 0.13 0.16 0.32 .. ..
Shares (%)Coal 3.1 4.4 2.2 1.0 1.6 .. ..Oil 75.1 66.8 67.1 66.6 57.1 .. ..Gas 0.8 0.4 4.3 5.3 8.7 .. ..Comb. Renewables & Wastes 9.5 13.0 8.7 8.7 8.9 .. ..Geothermal – – – – – .. ..Solar/Wind/Other – 0.1 0.1 0.1 0.3 .. ..Electricity 11.5 15.1 16.9 17.5 21.9 .. ..Heat – 0.2 0.7 0.8 1.5 .. ..
TOTAL INDUSTRY6 2.71 6.22 7.90 7.67 6.99 .. ..Coal1 0.14 0.59 0.43 0.19 0.34 .. ..Oil 1.81 3.96 4.76 4.56 2.89 .. ..Gas 0.00 – 0.66 0.83 0.92 .. ..Comb. Renewables & Wastes2 0.32 0.59 0.55 0.55 0.59 .. ..Geothermal – – – – – .. ..Solar/Wind/Other – – – – – .. ..Electricity 0.44 1.05 1.37 1.39 1.93 .. ..Heat – 0.03 0.13 0.15 0.32 .. ..
Shares (%)Coal 5.1 9.5 5.5 2.5 4.9 .. ..Oil 66.9 63.7 60.2 59.4 41.4 .. ..Gas 0.1 – 8.4 10.8 13.2 .. ..Comb. Renewables & Wastes 11.8 9.5 6.9 7.2 8.4 .. ..Geothermal – – – – – .. ..Solar/Wind/Other – – – – – .. ..Electricity 16.2 16.9 17.4 18.1 27.6 .. ..Heat – 0.5 1.6 2.0 4.6 .. ..
TRANSPORT7 1.95 3.82 6.67 6.70 7.44 .. ..
TOTAL OTHER SECTORS8 1.46 3.37 4.95 5.26 6.30 .. ..Coal1 0.04 0.00 – – – .. ..Oil 0.87 1.21 1.70 1.86 1.55 .. ..Gas 0.05 0.05 0.17 0.21 0.88 .. ..Comb. Renewables & Wastes2 0.26 1.15 1.15 1.15 1.25 .. ..Geothermal – – 0.00 0.00 – .. ..Solar/Wind/Other – 0.01 0.02 0.02 0.06 .. ..Electricity 0.25 0.95 1.90 2.01 2.56 .. ..Heat – – 0.01 0.01 – .. ..
Shares (%)Coal 2.4 – – – – .. ..Oil 59.7 35.9 34.4 35.3 24.6 .. ..Gas 3.2 1.5 3.5 4.0 14.0 .. ..Comb. Renewables & Wastes 17.9 34.1 23.2 21.9 19.8 .. ..Geothermal – – – – – .. ..Solar/Wind/Other – 0.3 0.4 0.4 1.0 .. ..Electricity 16.8 28.1 38.3 38.3 40.6 .. ..Heat – – 0.1 0.2 – .. ..
340
PORTUGAL Energy Balances and Key Statistical Data
261-Energy Balances 2/12/03 11:24 Page 340

Unit: Mtoe
DEMAND
ENERGY TRANSFORMATION AND LOSSES
1973 1990 2000 2001 2010 2020 2030
ELECTRICITY GENERATION9
INPUT (Mtoe) 1.33 5.10 7.62 7.85 9.63 .. ..OUTPUT (Mtoe) 0.84 2.44 3.73 3.97 5.19 .. ..(TWh gross) 9.79 28.36 43.37 46.17 60.40 .. ..
Output Shares (%)Coal 3.9 32.1 33.9 29.5 21.7 .. ..Oil 19.2 33.1 19.4 20.2 7.9 .. ..Gas – – 16.5 15.6 33.7 .. ..Comb. Renewables & Wastes 2.0 2.4 3.6 3.5 3.3 .. ..Nuclear – – – – – .. ..Hydro 74.8 32.3 26.1 30.4 21.4 .. ..Geothermal – 0.0 0.2 0.2 0.1 .. ..Solar/Wind/Other – 0.0 0.4 0.6 11.8 .. ..
TOTAL LOSSES 1.23 3.21 5.16 5.06 5.44 .. ..of which:Electricity and Heat Generation10 0.49 2.63 3.75 3.71 4.12 .. ..Other Transformation 0.23 –0.38 0.16 –0.02 – .. ..Own Use and Losses11 0.51 0.96 1.25 1.36 1.32 .. ..
Statistical Differences –0.11 0.53 –0.06 0.04 – .. ..
INDICATORS
1973 1990 2000 2001 2010 2020 2030
GDP (billion 1995 US$) 57.68 98.55 129.27 131.40 179.09 .. ..Population (millions) 8.64 9.90 10.01 10.06 10.17 .. ..TPES/GDP12 0.13 0.17 0.19 0.19 0.15 .. ..Energy Production/TPES 0.19 0.16 0.13 0.14 0.16 .. ..Per Capita TPES13 0.84 1.73 2.46 2.46 2.57 .. ..Oil Supply/GDP12 0.09 0.12 0.12 0.12 0.08 .. ..TFC/GDP12 0.11 0.14 0.15 0.15 0.12 .. ..Per Capita TFC13 0.71 1.36 1.95 1.95 2.04 .. ..Energy-related CO2
Emissions (Mt CO2)14 16.4 39.6 59.6 59.1 60.2 .. ..CO2 Emissions from Bunkers
(Mt CO2) 3.5 3.5 3.9 3.3 6.1 .. ..
GROWTH RATES (% per year)
73–79 79–90 90–00 00–01 01–10 10–20 20–30
TPES 5.5 5.1 3.7 0.5 0.6 .. ..Coal –2.4 18.2 3.3 –16.1 0.2 .. ..Oil 6.1 3.8 2.9 2.0 –1.7 .. ..Gas – – – 10.9 9.7 .. ..Comb. Renewables & Wastes 3.2 8.5 0.8 0.2 0.8 .. ..Nuclear – – – – – .. ..Hydro 7.3 –1.8 2.1 23.9 –0.9 .. ..Geothermal – – 37.0 30.0 –3.0 .. ..Solar/Wind/Other – – 11.6 24.2 36.4 .. ..
TFC 4.7 4.8 3.8 0.6 0.6 .. ..
Electricity Consumption 8.5 5.3 5.0 4.1 3.1 .. ..Energy Production 4.4 4.1 1.1 8.5 2.0 .. ..Net Oil Imports 8.1 2.9 2.7 5.9 –2.0 .. ..GDP 2.9 3.4 2.8 1.7 3.5 .. ..Growth in the TPES/GDP Ratio 2.5 1.6 0.9 –1.2 –2.8 .. ..Growth in the TFC/GDP Ratio 1.8 1.3 1.0 –1.0 –2.8 .. ..
Please note: Rounding may cause totals to differ from the sum of the elements.
341
Energy Balances and Key Statistical Data PORTUGAL
261-Energy Balances 2/12/03 11:24 Page 341

261-Energy Balances 2/12/03 11:24 Page 342

SPAIN
ENERGY BALANCES AND KEY STATISTICAL DATA
Unit: Mtoe
SUPPLY
1973 1990 2000 2001 2010 2020 2030
TOTAL PRODUCTION 11.3 34.7 31.4 33.0 .. .. ..Coal1 6.5 11.9 7.7 7.4 .. .. ..Oil 0.7 1.2 0.2 0.3 .. .. ..Gas 0.0 1.3 0.1 0.5 .. .. ..Comb. Renewables & Wastes2 0.0 4.1 4.1 4.1 .. .. ..Nuclear 1.7 14.1 16.2 16.6 .. .. ..Hydro 2.5 2.2 2.5 3.5 .. .. ..Geothermal – – 0.0 0.0 .. .. ..Solar/Wind/Other3 – 0.0 0.4 0.6 .. .. ..
TOTAL NET IMPORTS4 42.5 56.6 94.2 93.9 .. .. ..Coal1 Exports 0.0 0.0 0.5 0.4 .. .. ..
Imports 2.2 7.1 13.3 11.6 .. .. ..Net Imports 2.2 7.1 12.7 11.2 .. .. ..
Oil Exports 4.3 12.3 7.6 6.4 .. .. ..Imports 45.3 61.8 79.2 79.7 .. .. ..Bunkers 1.4 3.7 6.0 6.7 .. .. ..Net Imports 39.6 45.9 65.6 66.6 .. .. ..
Gas Exports – – – – .. .. ..Imports 0.9 3.7 15.5 15.8 .. .. ..Net Imports 0.9 3.7 15.5 15.8 .. .. ..
Electricity Exports 0.2 0.3 0.7 0.6 .. .. ..Imports 0.0 0.3 1.1 0.9 .. .. ..Net Imports –0.2 –0.0 0.4 0.3 .. .. ..
TOTAL STOCK CHANGES –1.5 –0.1 –1.2 0.5 .. .. ..
TOTAL SUPPLY (TPES) 52.4 91.2 124.3 127.4 170.3 .. ..Coal1 9.0 19.4 20.6 18.7 14.9 .. ..Oil 38.4 46.5 64.9 67.1 81.7 .. ..Gas 0.9 5.0 15.2 16.4 37.0 .. ..Comb. Renewables & Wastes2 0.0 4.1 4.1 4.1 13.6 .. ..Nuclear 1.7 14.1 16.2 16.6 16.6 .. ..Hydro 2.5 2.2 2.5 3.5 3.3 .. ..Geothermal – – 0.0 0.0 0.0 .. ..Solar/Wind/Other3 – 0.0 0.4 0.6 2.8 .. ..Electricity Trade5 –0.2 –0.0 0.4 0.3 0.4 .. ..
Shares (%)Coal 17.2 21.3 16.5 14.7 8.7 .. ..Oil 73.3 50.9 52.2 52.7 48.0 .. ..Gas 1.8 5.4 12.2 12.9 21.7 .. ..Comb. Renewables & Wastes – 4.5 3.3 3.2 8.0 .. ..Nuclear 3.3 15.5 13.0 13.0 9.7 .. ..Hydro 4.7 2.4 2.0 2.8 2.0 .. ..Geothermal – – – – – .. ..Solar/Wind/Other – – 0.4 0.5 1.6 .. ..Electricity Trade –0.3 – 0.3 0.2 0.2 .. ..
0 is negligible, – is nil, .. is not available.The forecast data for 2010 have been estimated by the IEA Secretariat based on the official 2011 Spanish forecast, assuming a linear growth between 2001 and 2011.
343
261-Energy Balances 2/12/03 11:24 Page 343

Unit: Mtoe
DEMAND
FINAL CONSUMPTION BY SECTOR
1973 1990 2000 2001 2010 2020 2030
TFC 39.9 62.5 89.2 93.3 127.8 .. ..Coal1 4.0 3.2 1.3 1.5 2.3 .. ..Oil 30.1 39.9 55.9 57.6 73.9 .. ..Gas 0.7 4.6 12.4 13.5 22.8 .. ..Comb. Renewables & Wastes2 – 3.9 3.4 3.4 4.9 .. ..Geothermal – – 0.0 0.0 0.0 .. ..Solar/Wind/Other – – 0.0 0.0 0.3 .. ..Electricity 5.1 10.8 16.2 17.3 23.6 .. ..Heat – 0.0 – – .. .. ..
Shares (%)Coal 9.9 5.2 1.5 1.6 1.8 .. ..Oil 75.6 63.9 62.6 61.7 57.8 .. ..Gas 1.8 7.4 13.9 14.5 17.8 .. ..Comb. Renewables & Wastes – 6.3 3.8 3.7 3.8 .. ..Geothermal – – – – – .. ..Solar/Wind/Other – – – – 0.3 .. ..Electricity 12.7 17.3 18.2 18.5 18.5 .. ..Heat – – – – .. .. ..
TOTAL INDUSTRY6 20.7 25.3 34.3 36.2 46.6 .. ..Coal1 3.6 2.9 1.2 1.4 2.2 .. ..Oil 13.4 11.3 14.7 15.2 16.1 .. ..Gas 0.4 3.8 9.6 10.5 17.2 .. ..Comb. Renewables & Wastes2 – 1.8 1.3 1.3 2.3 .. ..Geothermal – – – – – .. ..Solar/Wind/Other – – – – – .. ..Electricity 3.3 5.4 7.4 7.8 8.9 .. ..Heat – – – – .. .. ..
Shares (%)Coal 17.5 11.6 3.6 3.9 4.6 .. ..Oil 64.7 44.6 43.0 42.1 34.5 .. ..Gas 2.0 14.9 28.1 28.9 36.8 .. ..Comb. Renewables & Wastes – 7.3 3.8 3.6 5.0 .. ..Geothermal – – – – – .. ..Solar/Wind/Other – – – – – .. ..Electricity 15.8 21.5 21.5 21.5 19.1 .. ..Heat – – – – .. .. ..
TRANSPORT7 11.9 22.8 33.6 35.1 49.0 .. ..
TOTAL OTHER SECTORS8 7.2 14.4 21.3 22.1 32.2 .. ..Coal1 0.3 0.3 0.1 0.1 0.1 .. ..Oil 4.9 6.1 7.9 7.8 10.7 .. ..Gas 0.3 0.8 2.7 3.0 5.6 .. ..Comb. Renewables & Wastes2 – 2.1 2.1 2.1 2.1 .. ..Geothermal – – 0.0 0.0 0.0 .. ..Solar/Wind/Other – – 0.0 0.0 0.3 .. ..Electricity 1.7 5.1 8.5 9.1 13.4 .. ..Heat – 0.0 – – – .. ..
Shares (%)Coal 4.3 2.1 0.3 0.2 0.3 .. ..Oil 68.2 42.4 37.1 35.1 33.1 .. ..Gas 4.1 5.8 12.9 13.8 17.5 .. ..Comb. Renewables & Wastes – 14.4 9.7 9.3 6.5 .. ..Geothermal – – – – – .. ..Solar/Wind/Other – – 0.1 0.2 1.0 .. ..Electricity 23.4 35.2 39.8 41.3 41.6 .. ..Heat – – – – – .. ..
344
SPAIN Energy Balances and Key Statistical Data
261-Energy Balances 2/12/03 11:24 Page 344

Unit: Mtoe
DEMAND
ENERGY TRANSFORMATION AND LOSSES
1973 1990 2000 2001 2010 2020 2030
ELECTRICITY GENERATION9
INPUT (Mtoe) 12.6 33.0 45.0 45.4 61.1 .. ..OUTPUT (Mtoe) 6.5 13.0 19.1 20.2 27.4 .. ..(TWh gross) 75.7 151.2 222.2 234.7 318.3 .. ..
Output Shares (%)Coal 18.9 40.1 36.4 30.6 16.1 .. ..Oil 33.2 5.7 10.2 10.5 4.6 .. ..Gas 1.0 1.0 9.1 10.0 31.4 .. ..Comb. Renewables & Wastes 0.1 0.4 0.9 1.4 7.2 .. ..Nuclear 8.7 35.9 28.0 27.1 20.0 .. ..Hydro 38.2 16.8 13.3 17.5 12.2 .. ..Geothermal – – – – – .. ..Solar/Wind/Other – 0.0 2.1 3.0 8.5 .. ..
TOTAL LOSSES 12.5 28.4 35.3 34.1 42.5 .. ..of which:Electricity and Heat Generation10 6.1 20.0 25.9 25.2 33.8 .. ..Other Transformation 2.7 2.3 1.3 1.1 .. .. ..Own Use and Losses11 3.7 6.1 8.0 7.7 8.7 .. ..
Statistical Differences 0.0 0.3 –0.1 0.0 – .. ..
INDICATORS
1973 1990 2000 2001 2010 2020 2030
GDP (billion 1995 US$) 346.85 542.10 705.15 724.01 937.02 .. ..Population (millions) 34.82 38.86 39.93 40.27 42.36 .. ..TPES/GDP12 0.15 0.17 0.18 0.18 0.18 .. ..Energy Production/TPES 0.22 0.38 0.25 0.26 .. .. ..Per Capita TPES13 1.50 2.35 3.11 3.16 4.02 .. ..Oil Supply/GDP12 0.11 0.09 0.09 0.09 0.09 .. ..TFC/GDP12 0.11 0.12 0.13 0.13 0.14 .. ..Per Capita TFC13 1.14 1.61 2.23 2.32 3.02 .. ..Energy-related CO2
Emissions (Mt CO2)14 141.6 206.5 283.0 285.6 336.9 .. ..CO2 Emissions from Bunkers
(Mt CO2) 7.0 15.0 27.4 29.9 8.5 .. ..
GROWTH RATES (% per year)
73–79 79–90 90–00 00–01 01–10 10–20 20–30
TPES 4.1 2.9 3.1 2.5 3.3 .. ..Coal 3.0 5.5 0.6 –8.8 –2.5 .. ..Oil 4.1 –0.5 3.4 3.5 2.2 .. ..Gas 6.7 12.3 11.8 7.8 9.5 .. ..Comb. Renewables & Wastes 24.8 49.4 0.1 –0.9 14.3 .. ..Nuclear 0.4 20.9 1.4 2.4 –0.0 .. ..Hydro 8.2 –5.3 1.5 38.7 –0.6 .. ..Geothermal – – – – –7.4 .. ..Solar/Wind/Other – – 71.5 45.1 17.8 .. ..
TFC 4.1 1.9 3.6 4.6 3.6 .. ..
Electricity Consumption 6.4 3.6 4.1 6.6 3.5 .. ..Energy Production 5.5 7.5 –1.0 5.3 – .. ..Net Oil Imports 3.2 –0.4 3.6 1.5 – .. ..GDP 2.3 2.9 2.7 2.7 2.9 .. ..Growth in the TPES/GDP Ratio 1.8 0.0 0.5 –0.2 0.4 .. ..Growth in the TFC/GDP Ratio 1.8 –0.9 0.9 1.9 0.6 .. ..
Please note: Rounding may cause totals to differ from the sum of the elements.
345
Energy Balances and Key Statistical Data SPAIN
261-Energy Balances 2/12/03 11:24 Page 345

261-Energy Balances 2/12/03 11:24 Page 346

SWEDEN
ENERGY BALANCES AND KEY STATISTICAL DATA
Unit: Mtoe
SUPPLY
1973 1990 2000 2001 2010 2020 2030
TOTAL PRODUCTION 9.3 29.8 30.8 34.4 33.1 .. ..Coal1 0.0 0.0 – – – .. ..Peat – 0.2 0.2 0.3 0.4 .. ..Oil – 0.0 – – – .. ..Gas – – – – – .. ..Comb. Renewables & Wastes2 3.5 5.5 8.5 8.2 9.0 .. ..Nuclear 0.6 17.8 14.9 18.8 17.8 .. ..Hydro 5.1 6.2 6.8 6.8 5.8 .. ..Geothermal – – – – – .. ..Solar/Wind/Other3 – 0.0 0.4 0.3 0.2 .. ..
TOTAL NET IMPORTS4 29.6 16.7 16.7 16.5 19.7 .. ..Coal1 Exports 0.0 0.0 0.0 0.0 0.1 .. ..
Imports 1.7 2.6 2.4 2.4 2.3 .. ..Net Imports 1.7 2.6 2.3 2.4 2.2 .. ..
Peat Exports – – – – – .. ..Imports – – – – – .. ..Net Imports – – – – – .. ..
Oil Exports 1.4 8.7 11.1 10.2 9.4 .. ..Imports 30.4 23.1 25.8 25.5 26.9 .. ..Bunkers 1.1 0.7 1.4 1.4 1.4 .. ..Net Imports 27.8 13.8 13.3 13.9 16.0 .. ..
Gas Exports – – – – – .. ..Imports – 0.5 0.7 0.8 1.0 .. ..Net Imports – 0.5 0.7 0.8 1.0 .. ..
Electricity Exports 0.4 1.3 1.2 1.6 – .. ..Imports 0.5 1.1 1.6 1.0 0.5 .. ..Net Imports 0.1 –0.2 0.4 –0.6 0.5 .. ..
TOTAL STOCK CHANGES 0.5 0.2 –0.0 0.2 – .. ..
TOTAL SUPPLY (TPES) 39.3 46.7 47.5 51.1 52.8 .. ..Coal1 1.6 2.7 2.2 2.5 2.2 .. ..Peat – 0.2 0.2 0.3 0.4 .. ..Oil 28.4 13.8 13.4 14.1 16.0 .. ..Gas – 0.5 0.7 0.8 1.0 .. ..Comb. Renewables & Wastes2 3.5 5.5 8.5 8.2 9.0 .. ..Nuclear 0.6 17.8 14.9 18.8 17.8 .. ..Hydro 5.1 6.2 6.8 6.8 5.8 .. ..Geothermal – – – – – .. ..Solar/Wind/Other3 – 0.0 0.4 0.3 0.2 .. ..Electricity Trade5 0.1 –0.2 0.4 –0.6 0.5 .. ..
Shares (%)Coal 4.1 5.8 4.7 4.9 4.2 .. ..Peat – 0.5 0.5 0.6 0.7 .. ..Oil 72.2 29.6 28.1 27.5 30.4 .. ..Gas – 1.1 1.5 1.5 1.8 .. ..Comb. Renewables & Wastes 9.0 11.8 17.9 16.0 17.1 .. ..Nuclear 1.4 38.1 31.4 36.8 33.7 .. ..Hydro 13.1 13.4 14.2 13.3 10.9 .. ..Geothermal – – – – – .. ..Solar/Wind/Other – – 0.8 0.6 0.3 .. ..Electricity Trade 0.2 –0.3 0.8 –1.2 0.9 .. ..
0 is negligible, – is nil, .. is not available.Please note: All forecast data are based on the 2000 submission.
347
261-Energy Balances 2/12/03 11:24 Page 347
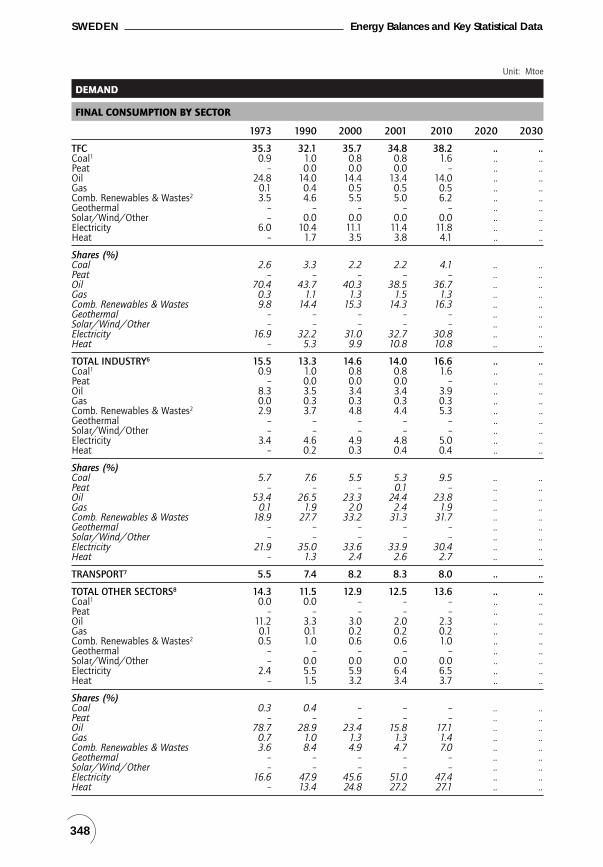
Unit: Mtoe
DEMAND
FINAL CONSUMPTION BY SECTOR
1973 1990 2000 2001 2010 2020 2030
TFC 35.3 32.1 35.7 34.8 38.2 .. ..Coal1 0.9 1.0 0.8 0.8 1.6 .. ..Peat – 0.0 0.0 0.0 – .. ..Oil 24.8 14.0 14.4 13.4 14.0 .. ..Gas 0.1 0.4 0.5 0.5 0.5 .. ..Comb. Renewables & Wastes2 3.5 4.6 5.5 5.0 6.2 .. ..Geothermal – – – – – .. ..Solar/Wind/Other – 0.0 0.0 0.0 0.0 .. ..Electricity 6.0 10.4 11.1 11.4 11.8 .. ..Heat – 1.7 3.5 3.8 4.1 .. ..
Shares (%)Coal 2.6 3.3 2.2 2.2 4.1 .. ..Peat – – – – – .. ..Oil 70.4 43.7 40.3 38.5 36.7 .. ..Gas 0.3 1.1 1.3 1.5 1.3 .. ..Comb. Renewables & Wastes 9.8 14.4 15.3 14.3 16.3 .. ..Geothermal – – – – – .. ..Solar/Wind/Other – – – – – .. ..Electricity 16.9 32.2 31.0 32.7 30.8 .. ..Heat – 5.3 9.9 10.8 10.8 .. ..
TOTAL INDUSTRY6 15.5 13.3 14.6 14.0 16.6 .. ..Coal1 0.9 1.0 0.8 0.8 1.6 .. ..Peat – 0.0 0.0 0.0 – .. ..Oil 8.3 3.5 3.4 3.4 3.9 .. ..Gas 0.0 0.3 0.3 0.3 0.3 .. ..Comb. Renewables & Wastes2 2.9 3.7 4.8 4.4 5.3 .. ..Geothermal – – – – – .. ..Solar/Wind/Other – – – – – .. ..Electricity 3.4 4.6 4.9 4.8 5.0 .. ..Heat – 0.2 0.3 0.4 0.4 .. ..
Shares (%)Coal 5.7 7.6 5.5 5.3 9.5 .. ..Peat – – – 0.1 – .. ..Oil 53.4 26.5 23.3 24.4 23.8 .. ..Gas 0.1 1.9 2.0 2.4 1.9 .. ..Comb. Renewables & Wastes 18.9 27.7 33.2 31.3 31.7 .. ..Geothermal – – – – – .. ..Solar/Wind/Other – – – – – .. ..Electricity 21.9 35.0 33.6 33.9 30.4 .. ..Heat – 1.3 2.4 2.6 2.7 .. ..
TRANSPORT7 5.5 7.4 8.2 8.3 8.0 .. ..
TOTAL OTHER SECTORS8 14.3 11.5 12.9 12.5 13.6 .. ..Coal1 0.0 0.0 – – – .. ..Peat – – – – – .. ..Oil 11.2 3.3 3.0 2.0 2.3 .. ..Gas 0.1 0.1 0.2 0.2 0.2 .. ..Comb. Renewables & Wastes2 0.5 1.0 0.6 0.6 1.0 .. ..Geothermal – – – – – .. ..Solar/Wind/Other – 0.0 0.0 0.0 0.0 .. ..Electricity 2.4 5.5 5.9 6.4 6.5 .. ..Heat – 1.5 3.2 3.4 3.7 .. ..
Shares (%)Coal 0.3 0.4 – – – .. ..Peat – – – – – .. ..Oil 78.7 28.9 23.4 15.8 17.1 .. ..Gas 0.7 1.0 1.3 1.3 1.4 .. ..Comb. Renewables & Wastes 3.6 8.4 4.9 4.7 7.0 .. ..Geothermal – – – – – .. ..Solar/Wind/Other – – – – – .. ..Electricity 16.6 47.9 45.6 51.0 47.4 .. ..Heat – 13.4 24.8 27.2 27.1 .. ..
348
SWEDEN Energy Balances and Key Statistical Data
261-Energy Balances 2/12/03 11:24 Page 348

Unit: Mtoe
DEMAND
ENERGY TRANSFORMATION AND LOSSES
1973 1990 2000 2001 2010 2020 2030
ELECTRICITY GENERATION9
INPUT (Mtoe) 8.2 26.7 26.2 30.5 28.6 .. ..OUTPUT (Mtoe) 6.7 12.6 12.5 13.9 13.2 .. ..(TWh gross) 78.1 146.0 145.6 161.7 153.0 .. ..
Output Shares (%)Coal 0.6 1.2 1.8 2.0 2.3 .. ..Peat – 0.0 0.0 0.0 0.1 .. ..Oil 19.4 0.8 1.2 1.7 3.4 .. ..Gas – 0.3 0.3 0.2 0.6 .. ..Comb. Renewables & Wastes 0.5 1.3 3.0 2.2 3.9 .. ..Nuclear 2.7 46.7 39.4 44.6 44.7 .. ..Hydro 76.7 49.7 54.0 49.0 43.8 .. ..Geothermal – – – – – .. ..Solar/Wind/Other – 0.0 0.3 0.3 1.3 .. ..
TOTAL LOSSESof which: 3.4 15.2 12.9 16.0 14.5 .. ..Electricity and Heat Generation10 1.5 12.2 10.6 13.2 10.7 .. ..Other Transformation 1.0 0.2 –0.1 0.4 1.4 .. ..Own Use and Losses11 1.0 2.8 2.4 2.4 2.4 .. ..
Statistical Differences 0.6 –0.7 –1.1 0.2 – .. ..
INDICATORS
1973 1990 2000 2001 2010 2020 2030
GDP (billion 1995 US$) 171.39 240.29 291.56 293.95 352.33 .. ..Population (millions) 8.14 8.56 8.87 8.90 9.18 .. ..TPES/GDP12 0.23 0.19 0.16 0.17 0.15 .. ..Energy Production/TPES 0.24 0.64 0.65 0.67 0.63 .. ..Per Capita TPES13 4.83 5.45 5.35 5.74 5.75 .. ..Oil Supply/GDP12 0.17 0.06 0.05 0.05 0.05 .. ..TFC/GDP12 0.21 0.13 0.12 0.12 0.11 .. ..Per Capita TFC13 4.34 3.76 4.03 3.92 4.16 .. ..Energy-related CO2
Emissions (Mt CO2)14 84.9 51.2 51.4 48.1 49.5 .. ..CO2 Emissions from Bunkers
(Mt CO2) 3.9 3.0 5.8 6.6 6.8 .. ..
GROWTH RATES (% per year)
73–79 79–90 90–00 00–01 01–10 10–20 20–30
TPES 1.5 0.8 0.2 7.5 0.4 .. ..Coal 1.6 3.9 –2.0 12.0 –1.3 .. ..Peat – – –0.1 22.9 2.3 .. ..Oil –1.3 –5.7 –0.3 5.3 1.5 .. ..Gas – – 2.8 9.7 2.6 .. ..Comb. Renewables & Wastes 1.8 3.1 4.4 –3.7 1.1 .. ..Nuclear 46.7 11.3 –1.7 25.8 –0.6 .. ..Hydro 0.3 1.6 0.8 0.7 –1.8 .. ..Geothermal – – – – – .. ..Solar/Wind/Other – – 27.4 4.4 15.5 .. ..
TFC 0.4 –1.1 1.1 –2.5 1.0 .. ..
Electricity Consumption 3.5 3.2 0.7 3.1 0.3 .. ..Energy Production 8.0 6.6 0.4 11.5 –0.4 .. ..Net Oil Imports –0.2 –6.1 –0.4 5.1 1.6 .. ..GDP 1.8 2.1 2.0 0.8 2.0 .. ..Growth in the TPES/GDP Ratio –0.3 –1.3 –1.7 6.6 –1.6 .. ..Growth in the TFC/GDP Ratio –1.3 –3.1 –0.9 –3.3 –1.0 .. ..
Please note: Rounding may cause totals to differ from the sum of the elements.
349
Energy Balances and Key Statistical Data SWEDEN
261-Energy Balances 2/12/03 11:24 Page 349

261-Energy Balances 2/12/03 11:24 Page 350
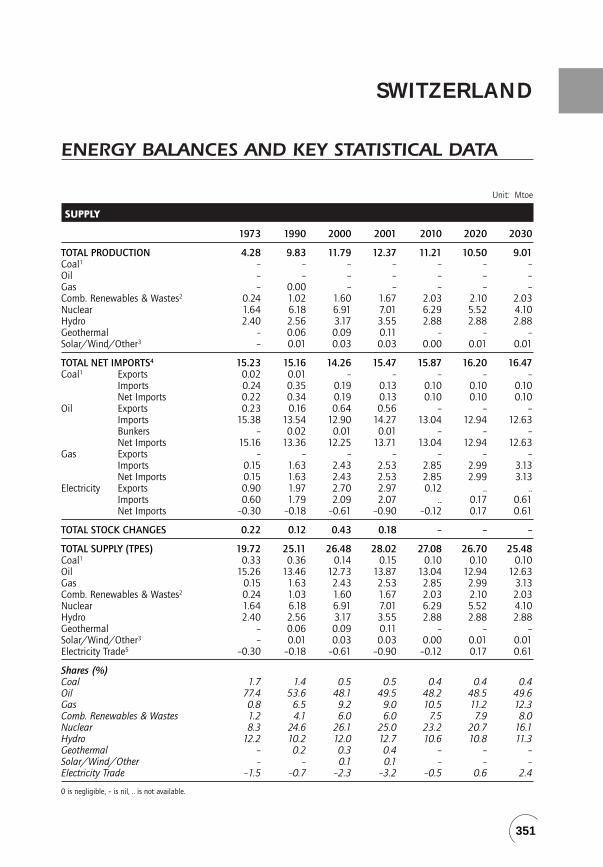
SWITZERLAND
ENERGY BALANCES AND KEY STATISTICAL DATA
Unit: Mtoe
SUPPLY
1973 1990 2000 2001 2010 2020 2030
TOTAL PRODUCTION 4.28 9.83 11.79 12.37 11.21 10.50 9.01Coal1 – – – – – – –Oil – – – – – – –Gas – 0.00 – – – – –Comb. Renewables & Wastes2 0.24 1.02 1.60 1.67 2.03 2.10 2.03Nuclear 1.64 6.18 6.91 7.01 6.29 5.52 4.10Hydro 2.40 2.56 3.17 3.55 2.88 2.88 2.88Geothermal – 0.06 0.09 0.11 – – –Solar/Wind/Other3 – 0.01 0.03 0.03 0.00 0.01 0.01
TOTAL NET IMPORTS4 15.23 15.16 14.26 15.47 15.87 16.20 16.47Coal1 Exports 0.02 0.01 – – – – –
Imports 0.24 0.35 0.19 0.13 0.10 0.10 0.10Net Imports 0.22 0.34 0.19 0.13 0.10 0.10 0.10
Oil Exports 0.23 0.16 0.64 0.56 – – –Imports 15.38 13.54 12.90 14.27 13.04 12.94 12.63Bunkers – 0.02 0.01 0.01 – – –Net Imports 15.16 13.36 12.25 13.71 13.04 12.94 12.63
Gas Exports – – – – – – –Imports 0.15 1.63 2.43 2.53 2.85 2.99 3.13Net Imports 0.15 1.63 2.43 2.53 2.85 2.99 3.13
Electricity Exports 0.90 1.97 2.70 2.97 0.12 .. ..Imports 0.60 1.79 2.09 2.07 .. 0.17 0.61Net Imports –0.30 –0.18 –0.61 –0.90 –0.12 0.17 0.61
TOTAL STOCK CHANGES 0.22 0.12 0.43 0.18 – – –
TOTAL SUPPLY (TPES) 19.72 25.11 26.48 28.02 27.08 26.70 25.48Coal1 0.33 0.36 0.14 0.15 0.10 0.10 0.10Oil 15.26 13.46 12.73 13.87 13.04 12.94 12.63Gas 0.15 1.63 2.43 2.53 2.85 2.99 3.13Comb. Renewables & Wastes2 0.24 1.03 1.60 1.67 2.03 2.10 2.03Nuclear 1.64 6.18 6.91 7.01 6.29 5.52 4.10Hydro 2.40 2.56 3.17 3.55 2.88 2.88 2.88Geothermal – 0.06 0.09 0.11 – – –Solar/Wind/Other3 – 0.01 0.03 0.03 0.00 0.01 0.01Electricity Trade5 –0.30 –0.18 –0.61 –0.90 –0.12 0.17 0.61
Shares (%)Coal 1.7 1.4 0.5 0.5 0.4 0.4 0.4Oil 77.4 53.6 48.1 49.5 48.2 48.5 49.6Gas 0.8 6.5 9.2 9.0 10.5 11.2 12.3Comb. Renewables & Wastes 1.2 4.1 6.0 6.0 7.5 7.9 8.0Nuclear 8.3 24.6 26.1 25.0 23.2 20.7 16.1Hydro 12.2 10.2 12.0 12.7 10.6 10.8 11.3Geothermal – 0.2 0.3 0.4 – – –Solar/Wind/Other – – 0.1 0.1 – – –Electricity Trade –1.5 –0.7 –2.3 –3.2 –0.5 0.6 2.4
0 is negligible, – is nil, .. is not available.
351
261-Energy Balances 2/12/03 11:24 Page 351

Unit: Mtoe
DEMAND
FINAL CONSUMPTION BY SECTOR
1973 1990 2000 2001 2010 2020 2030
TFC 17.57 19.66 21.18 21.56 21.76 21.89 21.69Coal1 0.29 0.35 0.14 0.15 0.10 0.10 0.10Oil 14.30 12.85 13.12 13.19 12.65 12.56 12.26Gas 0.24 1.52 2.23 2.32 2.68 2.77 2.85Comb. Renewables & Wastes2 0.24 0.60 0.75 0.78 1.31 1.38 1.39Geothermal – 0.06 0.09 0.11 – – –Solar/Wind/Other – 0.01 0.02 0.03 – – –Electricity 2.50 4.04 4.50 4.65 4.76 4.83 4.83Heat – 0.25 0.32 0.34 0.27 0.26 0.26
Shares (%)Coal 1.6 1.8 0.7 0.7 0.5 0.4 0.5Oil 81.4 65.3 62.0 61.2 58.1 57.4 56.5Gas 1.3 7.7 10.5 10.7 12.3 12.6 13.1Comb. Renewables & Wastes 1.4 3.0 3.5 3.6 6.0 6.3 6.4Geothermal – 0.3 0.4 0.5 – – –Solar/Wind/Other – – 0.1 0.1 – – –Electricity 14.2 20.5 21.3 21.6 21.9 22.1 22.3Heat – 1.3 1.5 1.6 1.2 1.2 1.2
TOTAL INDUSTRY6 4.78 3.93 4.75 4.90 4.85 4.89 5.03Coal1 0.08 0.33 0.13 0.14 0.10 0.10 0.10Oil 3.70 1.31 1.73 1.80 1.42 1.38 1.39Gas 0.05 0.59 0.76 0.78 1.14 1.14 1.19Comb. Renewables & Wastes2 – 0.16 0.43 0.45 0.49 0.51 0.50Geothermal – – 0.01 0.01 – – –Solar/Wind/Other – – – – – – –Electricity 0.95 1.48 1.56 1.59 1.63 1.69 1.77Heat – 0.05 0.13 0.14 0.08 0.07 0.07
Shares (%)Coal 1.6 8.4 2.7 2.9 2.0 2.0 2.0Oil 77.4 33.4 36.3 36.7 29.3 28.3 27.7Gas 1.1 15.1 16.0 15.9 23.4 23.3 23.7Comb. Renewables & Wastes – 4.1 9.1 9.1 10.2 10.5 9.9Geothermal – – 0.1 0.2 – – –Solar/Wind/Other – – – – – – –Electricity 19.9 37.7 32.8 32.4 33.5 34.5 35.3Heat – 1.2 2.8 2.8 1.6 1.4 1.4
TRANSPORT7 4.29 6.29 7.06 6.87 7.10 7.43 7.47
TOTAL OTHER SECTORS8 8.49 9.44 9.38 9.80 9.81 9.58 9.20Coal1 0.21 0.02 0.01 0.01 0.00 0.00 0.00Oil 6.48 5.47 4.57 4.76 4.43 4.06 3.72Gas 0.19 0.92 1.47 1.54 1.54 1.63 1.66Comb. Renewables & Wastes2 0.24 0.44 0.32 0.34 0.82 0.87 0.89Geothermal – 0.06 0.08 0.10 – – –Solar/Wind/Other – 0.01 0.02 0.02 – – –Electricity 1.37 2.34 2.72 2.83 2.83 2.83 2.74Heat – 0.20 0.18 0.20 0.19 0.19 0.19
Shares (%)Coal 2.5 0.2 0.1 0.1 – – –Oil 76.3 57.9 48.7 48.6 45.2 42.4 40.4Gas 2.2 9.8 15.7 15.7 15.7 17.0 18.0Comb. Renewables & Wastes 2.8 4.6 3.4 3.4 8.4 9.1 9.7Geothermal – 0.6 0.9 1.0 – – –Solar/Wind/Other – 0.1 0.2 0.2 – – –Electricity 16.1 24.7 29.0 28.9 28.8 29.5 29.8Heat – 2.1 2.0 2.1 1.9 2.0 2.1
352
SWITZERLAND Energy Balances and Key Statistical Data
261-Energy Balances 2/12/03 11:24 Page 352

Unit: Mtoe
DEMAND
ENERGY TRANSFORMATION AND LOSSES
1973 1990 2000 2001 2010 2020 2030
ELECTRICITY GENERATION9
INPUT (Mtoe) 4.48 9.39 11.12 11.66 10.07 9.35 7.91OUTPUT (Mtoe) 3.17 4.70 5.67 6.07 5.22 5.00 4.56(TWh gross) 36.82 54.62 65.96 70.55 60.73 58.18 53.03
Output Shares (%)Coal – 0.1 – – – – –Oil 7.1 0.5 0.1 0.1 0.1 0.1 0.2Gas – 0.6 1.5 1.2 1.7 2.2 2.7Comb. Renewables & Wastes – 1.0 2.4 2.1 3.2 3.6 4.2Nuclear 17.1 43.3 40.1 38.0 39.8 36.4 29.6Hydro 75.8 54.6 55.8 58.6 55.2 57.6 63.2Geothermal – – – – – – –Solar/Wind/Other – – 0.0 0.0 0.1 0.1 0.1
TOTAL LOSSES 2.17 5.09 5.92 6.04 5.31 4.81 3.80of which:Electricity and Heat Generation10 1.32 4.42 5.10 5.23 4.55 4.06 3.05Other Transformation 0.14 0.01 –0.03 –0.02 0.00 – –Own Use and Losses11 0.72 0.66 0.85 0.83 0.76 0.75 0.74
Statistical Differences –0.02 0.36 –0.62 0.42 – – –
INDICATORS
1973 1990 2000 2001 2010 2020 2030
GDP (billion 1995 US$) 246.18 308.43 336.14 339.10 412.46 469.33 534.04Population (millions) 6.44 6.71 7.18 7.23 7.50 7.40 7.40TPES/GDP12 0.08 0.08 0.08 0.08 0.07 0.06 0.05Energy Production/TPES 0.22 0.39 0.45 0.44 0.41 0.39 0.35Per Capita TPES13 3.06 3.74 3.69 3.87 3.61 3.61 3.44Oil Supply/GDP12 0.06 0.04 0.04 0.04 0.03 0.03 0.02TFC/GDP12 0.07 0.06 0.06 0.06 0.05 0.05 0.04Per Capita TFC13 2.73 2.93 2.95 2.98 2.90 2.96 2.93Energy-related CO2
Emissions (Mt CO2)14 43.6 41.5 42.9 43.8 43.4 43.5 42.9CO2 Emissions from Bunkers
(Mt CO2) 2.1 3.2 4.8 4.6 4.6 4.6 4.6
GROWTH RATES (% per year)
73–79 79–90 90–00 00–01 01–10 10–20 20–30
TPES 0.2 2.1 0.5 5.8 –0.4 –0.1 –0.5Coal –6.3 4.5 –9.1 6.5 –4.5 – 0.3Oil –2.2 0.1 –0.6 9.0 –0.7 –0.1 –0.2Gas 31.0 7.2 4.1 4.1 1.3 0.5 0.5Comb. Renewables & Wastes 11.2 7.7 4.5 4.8 2.2 0.3 –0.3Nuclear 11.0 6.5 1.1 1.4 –1.2 –1.3 –2.9Hydro 2.1 –0.5 2.1 12.1 –2.3 – –Geothermal – – 4.1 17.6 – – –Solar/Wind/Other – – 12.1 4.0 –21.3 5.2 1.8
TFC –0.6 1.4 0.7 1.8 0.1 0.1 –0.1
Electricity Consumption 2.6 3.0 1.1 3.2 0.3 0.2 0.0Energy Production 6.5 4.2 1.8 4.9 –1.1 –0.6 –1.5Net Oil Imports –1.6 –0.3 –0.9 11.9 –0.6 –0.1 –0.2GDP –0.4 2.3 0.9 0.9 2.2 1.3 1.3Growth in the TPES/GDP Ratio 0.6 –0.2 –0.3 4.9 –2.5 –1.4 –1.7Growth in the TFC/GDP Ratio –0.3 –0.9 –0.1 0.9 –2.1 –1.2 –1.4
Please note: Rounding may cause totals to differ from the sum of the elements.
353
Energy Balances and Key Statistical Data SWITZERLAND
261-Energy Balances 2/12/03 11:24 Page 353

261-Energy Balances 2/12/03 11:24 Page 354

TURKEY
ENERGY BALANCES AND KEY STATISTICAL DATA
Unit: Mtoe
SUPPLY
1973 1990 2000 2001 2010 2020 2030
TOTAL PRODUCTION 15.52 25.86 26.71 26.15 39.22 58.20 71.68Coal1 5.21 12.41 13.29 14.04 26.15 32.36 35.13Oil 3.59 3.61 2.73 2.49 1.13 0.49 0.17Gas – 0.18 0.53 0.26 0.17 0.14 0.10Comb. Renewables & Wastes2 6.45 7.21 6.56 6.32 4.42 3.93 3.75Nuclear – – – – – 7.30 14.60Hydro 0.22 1.99 2.66 2.07 5.34 10.00 10.00Geothermal 0.05 0.43 0.68 0.70 0.97 1.71 3.64Solar/Wind/Other3 – 0.03 0.27 0.29 1.05 2.27 4.28
TOTAL NET IMPORTS4 8.74 27.98 50.60 45.73 113.00 220.98 391.56Coal1 Exports – – – – – – –
Imports 0.01 4.21 9.25 5.63 13.55 75.21 163.21Net Imports 0.01 4.21 9.25 5.63 13.55 75.21 163.21
Oil Exports 0.86 1.90 1.31 2.58 – – –Imports 9.68 23.18 30.72 29.35 50.04 71.41 102.20Bunkers 0.09 0.12 0.40 0.24 – – –Net Imports 8.73 21.16 29.01 26.53 50.04 71.41 102.20
Gas Exports – – – – – – –Imports – 2.68 12.05 13.21 49.41 74.36 126.15Net Imports – 2.68 12.05 13.21 49.41 74.36 126.15
Electricity Exports – 0.08 0.04 0.04 – – –Imports – 0.02 0.33 0.39 – – –Net Imports – –0.06 0.29 0.36 – – –
TOTAL STOCK CHANGES 0.11 –0.83 0.18 0.57 – – –
TOTAL SUPPLY (TPES) 24.37 53.01 77.49 72.46 152.22 279.18 463.24Coal1 5.15 16.94 23.32 20.45 39.70 107.57 198.34Oil 12.50 23.61 31.08 28.91 51.17 71.89 102.38Gas – 2.86 12.63 13.37 49.58 74.51 126.25Comb. Renewables & Wastes2 6.45 7.21 6.56 6.32 4.42 3.93 3.75Nuclear – – – – – 7.30 14.60Hydro 0.22 1.99 2.66 2.07 5.34 10.00 10.00Geothermal 0.05 0.43 0.68 0.70 0.97 1.71 3.64Solar/Wind/Other3 – 0.03 0.27 0.29 1.05 2.27 4.28Electricity Trade5 – –0.06 0.29 0.36 – – –
Shares (%)Coal 21.1 32.0 30.1 28.2 26.1 38.5 42.8Oil 51.3 44.5 40.1 39.9 33.6 25.8 22.1Gas – 5.4 16.3 18.4 32.6 26.7 27.3Comb. Renewables & Wastes 26.5 13.6 8.5 8.7 2.9 1.4 0.8Nuclear – – – – – 2.6 3.2Hydro 0.9 3.8 3.4 2.8 3.5 3.6 2.2Geothermal 0.2 0.8 0.9 1.0 0.6 0.6 0.8Solar/Wind/Other – 0.1 0.3 0.4 0.7 0.8 0.9Electricity Trade – –0.1 0.4 0.5 – – –
0 is negligible, – is nil, .. is not available.
355
261-Energy Balances 2/12/03 11:24 Page 355

Unit: Mtoe
DEMAND
FINAL CONSUMPTION BY SECTOR
1973 1990 2000 2001 2010 2020 2030
TFC 20.04 40.55 57.13 51.79 111.84 197.52 322.00Coal1 2.94 7.57 10.13 7.02 15.56 55.68 112.31Oil 9.70 20.80 26.92 25.01 44.17 63.07 90.64Gas 0.04 0.72 4.49 4.45 25.25 29.71 33.76Comb. Renewables & Wastes2 6.45 7.21 6.46 6.21 4.42 3.93 3.75Geothermal 0.05 0.36 0.62 0.62 0.89 1.64 3.56Solar/Wind/Other – 0.03 0.26 0.29 0.60 1.12 1.93Electricity 0.85 3.87 8.25 8.20 20.95 42.39 76.04Heat – – – – – – –
Shares (%)Coal 14.7 18.7 17.7 13.6 13.9 28.2 34.9Oil 48.4 51.3 47.1 48.3 39.5 31.9 28.2Gas 0.2 1.8 7.9 8.6 22.6 15.0 10.5Comb. Renewables & Wastes 32.2 17.8 11.3 12.0 3.9 2.0 1.2Geothermal 0.2 0.9 1.1 1.2 0.8 0.8 1.1Solar/Wind/Other – 0.1 0.5 0.6 0.5 0.6 0.6Electricity 4.3 9.5 14.4 15.8 18.7 21.5 23.6Heat – – – – – – –
TOTAL INDUSTRY6 4.30 13.71 22.58 18.30 51.26 108.99 202.38Coal1 1.14 4.52 8.60 5.38 11.88 46.04 101.82Oil 2.60 6.16 8.16 7.46 12.33 19.77 31.63Gas 0.00 0.67 1.76 1.47 15.41 18.04 20.67Comb. Renewables & Wastes2 – – – – – – –Geothermal – – – – – – –Solar/Wind/Other – 0.01 0.10 0.12 0.27 0.51 0.96Electricity 0.55 2.35 3.96 3.87 11.37 24.64 47.30Heat – – – – – – –
Shares (%)Coal 26.5 33.0 38.1 29.4 23.2 42.2 50.3Oil 60.5 44.9 36.1 40.8 24.1 18.1 15.6Gas 0.1 4.9 7.8 8.0 30.1 16.5 10.2Comb. Renewables & Wastes – – – – – – –Geothermal – – – – – – –Solar/Wind/Other – 0.1 0.4 0.6 0.5 0.5 0.5Electricity 12.9 17.2 17.6 21.2 22.2 22.6 23.4Heat – – – – – – –
TRANSPORT7 4.49 9.58 12.50 11.99 23.71 33.94 48.48
TOTAL OTHER SECTORS8 11.26 17.26 22.05 21.50 36.88 54.60 71.14Coal1 1.28 3.03 1.53 1.64 3.68 9.64 10.49Oil 3.15 5.11 6.38 5.65 8.31 9.73 11.29Gas 0.04 0.05 2.69 2.94 9.83 11.66 13.07Comb. Renewables & Wastes2 6.45 7.21 6.46 6.21 4.42 3.93 3.75Geothermal 0.05 0.36 0.62 0.62 0.89 1.64 3.56Solar/Wind/Other – 0.02 0.17 0.17 0.34 0.61 0.98Electricity 0.29 1.49 4.22 4.27 9.41 17.40 28.01Heat – – – – – – –
Shares (%)Coal 11.4 17.6 6.9 7.6 10.0 17.7 14.7Oil 28.0 29.6 28.9 26.3 22.5 17.8 15.9Gas 0.3 0.3 12.2 13.7 26.7 21.4 18.4Comb. Renewables & Wastes 57.3 41.7 29.3 28.9 12.0 7.2 5.3Geothermal 0.4 2.1 2.8 2.9 2.4 3.0 5.0Solar/Wind/Other – 0.1 0.7 0.8 0.9 1.1 1.4Electricity 2.6 8.6 19.1 19.9 25.5 31.9 39.4Heat – – – – – – –
356
TURKEY Energy Balances and Key Statistical Data
261-Energy Balances 2/12/03 11:24 Page 356

Unit: Mtoe
DEMAND
ENERGY TRANSFORMATION AND LOSSES
1973 1990 2000 2001 2010 2020 2030
ELECTRICITY GENERATION9
INPUT (Mtoe) 2.77 11.08 24.54 24.77 56.01 116.54 206.29OUTPUT (Mtoe) 1.07 4.95 10.74 10.55 24.65 48.72 85.17(TWh gross) 12.43 57.54 124.92 122.73 286.59 566.51 990.32
Output Shares (%)Coal 26.1 35.1 30.6 31.3 33.3 37.2 35.3Oil 51.4 6.9 8.4 8.5 0.0 – 0.0Gas – 17.7 36.1 40.4 43.1 35.0 44.5Comb. Renewables & Wastes 1.6 – 0.2 0.1 – – –Nuclear – – – – – 4.9 5.7Hydro 20.9 40.2 24.7 19.6 21.7 20.5 11.7Geothermal – 0.1 0.1 0.1 0.0 0.0 0.0Solar/Wind/Other – – 0.0 0.1 1.8 2.4 2.8
TOTAL LOSSES 4.03 11.58 19.97 20.01 40.38 81.65 141.24of which:Electricity and Heat Generation10 1.70 6.13 13.80 14.22 31.36 67.82 121.12Other Transformation 1.32 2.89 1.44 1.06 2.51 3.79 5.87Own Use and Losses11 1.00 2.56 4.73 4.73 6.51 10.05 14.25
Statistical Differences 0.30 0.88 0.40 0.66 – – –
INDICATORS
1973 1990 2000 2001 2010 2020 2030
GDP (billion 1995 US$) 68.40 144.57 205.47 190.29 413.30 797.95 1375.98Population (millions) 38.45 56.20 67.46 68.61 74.12 81.92 88.87TPES/GDP12 0.36 0.37 0.38 0.38 0.37 0.35 0.34Energy Production/TPES 0.64 0.49 0.34 0.36 0.26 0.21 0.15Per Capita TPES13 0.63 0.94 1.15 1.06 2.05 3.41 5.21Oil Supply/GDP12 0.18 0.16 0.15 0.15 0.12 0.09 0.07TFC/GDP12 0.29 0.28 0.28 0.27 0.27 0.25 0.23Per Capita TFC13 0.52 0.72 0.85 0.75 1.51 2.41 3.62Energy-related CO2
Emissions (Mt CO2)14 52.8 128.8 203.7 188.0 406.3 783.0 1333.5CO2 Emissions from Bunkers
(Mt CO2) 0.4 0.9 2.9 2.3 1.6 1.6 1.6
GROWTH RATES (% per year)
73–79 79–90 90–00 00–01 01–10 10–20 20–30
TPES 3.7 5.2 3.9 –6.5 8.6 6.3 5.2Coal 4.1 9.0 3.2 –12.3 7.6 10.5 6.3Oil 3.1 4.2 2.8 –7.0 6.5 3.5 3.6Gas – – 16.0 5.8 15.7 4.2 5.4Comb. Renewables & Wastes 3.1 –0.7 –0.9 –3.7 –3.9 –1.2 –0.5Nuclear – – – – – – 7.2Hydro 25.7 7.6 2.9 –22.2 11.1 6.5 –Geothermal 3.8 19.7 4.7 1.8 3.8 5.9 7.8Solar/Wind/Other – – 25.2 10.2 15.3 8.0 6.6
TFC 4.1 4.3 3.5 –9.3 8.9 5.9 5.0
Electricity Consumption 11.3 8.2 7.9 –0.6 11.0 7.3 6.0Energy Production 1.9 3.7 0.3 –2.1 4.6 4.0 2.1Net Oil Imports 5.1 5.5 3.2 –8.5 7.3 3.6 3.7GDP 4.5 4.5 3.6 –7.4 9.0 6.8 5.6Growth in the TPES/GDP Ratio –0.8 0.7 0.3 1.0 –0.4 –0.5 –0.4Growth in the TFC/GDP Ratio –0.4 –0.2 –0.1 –2.1 –0.1 –0.9 –0.6
Please note: Rounding may cause totals to differ from the sum of the elements.
357
Energy Balances and Key Statistical Data TURKEY
261-Energy Balances 2/12/03 11:24 Page 357

261-Energy Balances 2/12/03 11:24 Page 358

UNITED KINGDOM
ENERGY BALANCES AND KEY STATISTICAL DATA
Unit: Mtoe
SUPPLY
1973 1990 2000 2001 2010 2020 2030
TOTAL PRODUCTION 108.5 208.0 271.3 262.2 .. .. ..Coal1 75.9 53.6 17.5 19.0 2.6 – ..Oil 0.5 95.2 131.7 121.7 .. .. ..Gas 24.4 40.9 97.4 95.2 .. .. ..Comb. Renewables & Wastes2 – 0.6 2.1 2.3 10.4 10.5 ..Nuclear 7.3 17.1 22.2 23.5 18.9 7.7 ..Hydro 0.3 0.4 0.4 0.3 0.4 0.4 ..Geothermal – 0.0 0.0 0.0 – – ..Solar/Wind/Other3 – 0.0 0.1 0.1 .. .. ..
TOTAL NET IMPORTS4 110.4 2.1 –42.7 –24.0 .. .. ..Coal1 Exports 2.0 1.8 0.7 0.6 – – ..
Imports 1.1 10.3 14.9 22.8 18.8 15.6 ..Net Imports –0.9 8.5 14.2 22.2 18.8 15.6 ..
Oil Exports 20.9 76.5 117.6 109.5 .. .. ..Imports 136.9 65.4 70.9 73.1 .. .. ..Bunkers 5.4 2.5 2.1 2.3 .. .. ..Net Imports 110.6 –13.6 –48.8 –38.8 .. .. ..
Gas Exports – – 11.3 10.7 .. .. ..Imports 0.7 6.2 2.0 2.4 .. .. ..Net Imports 0.7 6.2 –9.3 –8.3 .. .. ..
Electricity Exports 0.0 0.0 0.0 0.0 – – ..Imports 0.0 1.0 1.2 0.9 0.4 0.3 ..Net Imports 0.0 1.0 1.2 0.9 0.4 0.3 ..
TOTAL STOCK CHANGES 1.8 2.1 2.5 –3.0 .. .. ..
TOTAL SUPPLY (TPES) 220.7 212.2 231.2 235.2 244.1 251.5 ..Coal1 76.4 63.1 34.2 39.8 21.3 15.6 ..Oil 111.6 82.6 83.7 81.5 92.6 103.0 ..Gas 25.1 47.2 87.3 86.8 100.1 114.1 ..Comb. Renewables & Wastes2 – 0.6 2.1 2.3 10.4 10.5 ..Nuclear 7.3 17.1 22.2 23.5 18.9 7.7 ..Hydro 0.3 0.4 0.4 0.3 0.4 0.4 ..Geothermal – 0.0 0.0 0.0 – – ..Solar/Wind/Other3 – 0.0 0.1 0.1 .. .. ..Electricity Trade5 0.0 1.0 1.2 0.9 0.4 0.3 ..
Shares (%)Coal 34.6 29.7 14.8 16.9 8.7 6.2 ..Oil 50.5 38.9 36.2 34.6 37.9 40.9 ..Gas 11.4 22.2 37.7 36.9 41.0 45.3 ..Comb. Renewables & Wastes – 0.3 0.9 1.0 4.3 4.2 ..Nuclear 3.3 8.1 9.6 10.0 7.8 3.1 ..Hydro 0.2 0.2 0.2 0.1 0.2 0.2 ..Geothermal – – – – – – ..Solar/Wind/Other – – – – .. .. ..Electricity Trade – 0.5 0.5 0.4 0.2 0.1 ..
0 is negligible, – is nil, .. is not available.Please note: Forecast data are based on the 2000 submission. Forecasts for production, imports, exports of coal are IEA Secretariat estimates.
359
261-Energy Balances 2/12/03 11:24 Page 359

Unit: Mtoe
DEMAND
FINAL CONSUMPTION BY SECTOR
1973 1990 2000 2001 2010 2020 2030
TFC 147.1 145.4 160.7 161.4 180.0 195.6 ..Coal1 26.5 10.8 3.1 4.3 3.6 3.3 ..Oil 77.0 68.8 73.9 72.5 84.9 95.2 ..Gas 23.6 41.8 52.2 52.9 57.9 61.3 ..Comb. Renewables & Wastes2 – 0.4 0.6 0.6 0.7 0.8 ..Geothermal – 0.0 0.0 0.0 – – ..Solar/Wind/Other – 0.0 0.0 0.0 – – ..Electricity 20.0 23.6 28.3 28.7 32.9 35.1 ..Heat – – 2.5 2.3 .. .. ..
Shares (%)Coal 18.0 7.4 2.0 2.7 2.0 1.7 ..Oil 52.3 47.3 46.0 44.9 47.2 48.7 ..Gas 16.1 28.7 32.5 32.8 32.2 31.3 ..Comb. Renewables & Wastes – 0.3 0.4 0.4 0.4 0.4 ..Geothermal – – – – – – ..Solar/Wind/Other – – – – – – ..Electricity 13.6 16.2 17.6 17.8 18.3 17.9 ..Heat – – 1.6 1.4 .. .. ..
TOTAL INDUSTRY6 65.0 42.8 43.9 43.4 48.1 50.0 ..Coal1 13.3 6.4 1.6 2.4 2.9 2.9 ..Oil 33.7 15.7 16.1 15.2 17.0 17.1 ..Gas 10.1 12.0 15.2 15.0 17.0 17.8 ..Comb. Renewables & Wastes2 – 0.1 0.2 0.2 0.6 0.6 ..Geothermal – – – – – – ..Solar/Wind/Other – – – – – – ..Electricity 7.8 8.7 9.8 9.7 10.6 11.6 ..Heat – – 1.1 1.0 .. .. ..
Shares (%)Coal 20.5 14.9 3.6 5.5 6.0 5.7 ..Oil 51.8 36.8 36.6 35.0 35.3 34.2 ..Gas 15.6 27.9 34.5 34.5 35.3 35.6 ..Comb. Renewables & Wastes – 0.2 0.5 0.5 1.2 1.2 ..Geothermal – – – – – – ..Solar/Wind/Other – – – – – – ..Electricity 12.1 20.2 22.3 22.3 22.0 23.2 ..Heat – – 2.5 2.3 .. .. ..
TRANSPORT7 31.0 46.5 53.3 52.3 62.8 73.0 ..
TOTAL OTHER SECTORS8 51.2 56.1 63.5 65.7 69.1 72.7 ..Coal1 13.1 4.4 1.6 1.9 0.7 0.4 ..Oil 12.6 7.0 5.2 5.8 5.8 5.9 ..Gas 13.5 29.8 37.0 38.0 40.9 43.5 ..Comb. Renewables & Wastes2 – 0.3 0.4 0.4 0.1 0.2 ..Geothermal – 0.0 0.0 0.0 – – ..Solar/Wind/Other – 0.0 0.0 0.0 – – ..Electricity 12.0 14.5 17.8 18.3 21.6 22.7 ..Heat – – 1.4 1.3 .. .. ..
Shares (%)Coal 25.5 7.8 2.5 2.9 1.0 0.6 ..Oil 24.7 12.5 8.3 8.8 8.4 8.1 ..Gas 26.4 53.2 58.4 57.8 59.2 59.9 ..Comb. Renewables & Wastes – 0.6 0.6 0.6 0.2 0.2 ..Geothermal – – – – – – ..Solar/Wind/Other – – – – – – ..Electricity 23.4 25.8 28.1 27.8 31.3 31.2 ..Heat – – 2.2 2.0 .. .. ..
360
UNITED KINGDOM Energy Balances and Key Statistical Data
261-Energy Balances 2/12/03 11:24 Page 360

Unit: Mtoe
DEMAND
ENERGY TRANSFORMATION AND LOSSES
1973 1990 2000 2001 2010 2020 2030
ELECTRICITY GENERATION9
INPUT (Mtoe) 72.5 74.4 80.8 85.0 79.4 74.9 ..OUTPUT (Mtoe) 24.2 27.3 32.2 33.0 36.2 38.2 ..(TWh gross) 281.4 317.8 374.6 383.5 420.9 443.7 ..
Output Shares (%)Coal 62.1 65.0 32.7 34.8 15.8 9.4 ..Oil 25.6 10.9 2.3 1.9 0.4 0.3 ..Gas 1.0 1.6 39.6 37.2 56.0 73.6 ..Comb. Renewables & Wastes – 0.2 1.2 1.3 9.3 8.9 ..Nuclear 10.0 20.7 22.7 23.5 17.3 6.7 ..Hydro 1.4 1.6 1.4 1.1 1.2 1.1 ..Geothermal – – – – – – ..Solar/Wind/Other – 0.0 0.3 0.3 – – ..
TOTAL LOSSES 72.7 67.5 70.1 73.9 64.1 55.9 ..of which:Electricity and Heat Generation10 48.3 47.1 46.1 49.7 43.2 36.7 ..Other Transformation 7.1 4.1 4.7 5.0 2.6 2.5 ..Own Use and Losses11 17.3 16.3 19.4 19.1 18.3 16.7 ..
Statistical Differences 0.9 –0.7 0.3 –0.1 – – ..
INDICATORS
1973 1990 2000 2001 2010 2020 2030
GDP (billion 1995 US$) 748.36 1040.25 1309.07 1334.80 1630.75 2037.13 ..Population (millions) 56.22 57.29 58.66 58.79 61.00 61.65 ..TPES/GDP12 0.29 0.20 0.18 0.18 0.15 0.12 ..Energy Production/TPES 0.49 0.98 1.17 1.11 .. .. ..Per Capita TPES13 3.93 3.70 3.94 4.00 4.00 4.08 ..Oil Supply/GDP12 0.15 0.08 0.06 0.06 0.06 0.05 ..TFC/GDP12 0.20 0.14 0.12 0.12 0.11 0.10 ..Per Capita TFC13 2.62 2.54 2.74 2.75 2.95 3.17 ..Energy-related CO2
Emissions (Mt CO2)14 640.0 560.3 524.6 540.8 537.9 577.4 ..CO2 Emissions from Bunkers
(Mt CO2) 25.4 20.9 30.3 33.0 25.9 25.9 ..
GROWTH RATES (% per year)
73–79 79–90 90–00 00–01 01–10 10–20 20–30
TPES –0.1 –0.3 0.9 1.7 0.4 0.3 ..Coal –0.5 –1.5 –5.9 16.3 –6.7 –3.1 ..Oil –2.6 –1.3 0.1 –2.7 1.4 1.1 ..Gas 8.3 1.4 6.3 –0.5 1.6 1.3 ..Comb. Renewables & Wastes – – 12.9 8.7 18.4 0.0 ..Nuclear 5.4 5.0 2.6 5.9 –2.4 –8.6 ..Hydro 1.6 1.9 –0.2 –20.1 2.4 – ..Geothermal – – – – – – ..Solar/Wind/Other – – 23.8 4.3 – – ..
TFC 0.1 –0.2 1.0 0.4 1.2 0.8 ..
Electricity Consumption 0.9 1.0 1.8 1.3 1.5 0.6 ..Energy Production 10.1 0.7 2.7 –3.4 – – ..Net Oil Imports –27.1 – 13.6 –20.5 – – ..GDP 1.5 2.2 2.3 2.0 2.3 2.2 ..Growth in the TPES/GDP Ratio –1.5 –2.5 –1.4 –0.2 –1.8 –1.9 ..Growth in the TFC/GDP Ratio –1.3 –2.3 –1.3 –1.5 –1.0 –1.4 ..
Please note: Rounding may cause totals to differ from the sum of the elements.
361
Energy Balances and Key Statistical Data UNITED KINGDOM
261-Energy Balances 2/12/03 11:24 Page 361

261-Energy Balances 2/12/03 11:24 Page 362

UNITED STATES
ENERGY BALANCES AND KEY STATISTICAL DATA
Unit: Mtoe
SUPPLY
1973 1990 2000 2001 2010 2020 2030
TOTAL PRODUCTION 1455 1650 1675 1712 1892 2058 ..Coal1 333 539 543 573 638 698 ..Oil 534 433 366 363 374 375 ..Gas 503 419 448 461 521 597 ..Comb. Renewables & Wastes2 37 62 73 71 91 107 ..Nuclear 23 159 208 211 221 223 ..Hydro 23 23 22 17 27 27 ..Geothermal 2 14 13 13 18 29 ..Solar/Wind/Other3 – 0 2 2 2 3 ..
TOTAL NET IMPORTS4 289 315 581 622 828 1079 ..Coal1 Exports 31 67 37 30 23 19 ..
Imports 1 2 10 13 15 20 ..Net Imports –30 –65 –27 –17 –8 1 ..
Oil Exports 11 39 50 47 56 59 ..Imports 316 413 601 620 795 997 ..Bunkers 9 29 28 20 19 19 ..Net Imports 296 346 523 554 719 919 ..
Gas Exports 2 2 6 9 14 10 ..Imports 24 35 88 92 128 167 ..Net Imports 22 33 82 84 113 157 ..
Electricity Exports 0 2 1 2 1 1 ..Imports 1 2 4 3 4 2 ..Net Imports 1 0 3 2 2 1 ..
TOTAL STOCK CHANGES –8 –38 48 –53 – – ..
TOTAL SUPPLY (TPES) 1736 1928 2304 2281 2719 3137 ..Coal1 311 458 542 545 630 699 ..Oil 824 770 893 904 1093 1294 ..Gas 515 439 549 517 634 754 ..Comb. Renewables & Wastes2 37 62 73 71 91 107 ..Nuclear 23 159 208 211 221 223 ..Hydro 23 23 22 17 27 27 ..Geothermal 2 14 13 13 18 29 ..Solar/Wind/Other3 – 0 2 2 2 3 ..Electricity Trade5 1 0 3 2 2 1 ..
Shares (%)Coal 17.9 23.8 23.5 23.9 23.2 22.3 ..Oil 47.5 40.0 38.7 39.6 40.2 41.2 ..Gas 29.6 22.8 23.8 22.7 23.3 24.0 ..Comb. Renewables & Wastes 2.2 3.2 3.2 3.1 3.3 3.4 ..Nuclear 1.3 8.3 9.0 9.2 8.1 7.1 ..Hydro 1.3 1.2 0.9 0.8 1.0 0.8 ..Geothermal 0.1 0.7 0.6 0.6 0.7 0.9 ..Solar/Wind/Other – – 0.1 0.1 0.1 0.1 ..Electricity Trade 0.1 – 0.1 0.1 0.1 – ..
0 is negligible, – is nil, .. is not available.
363
261-Energy Balances 2/12/03 11:24 Page 363

Unit: Mtoe
DEMAND
FINAL CONSUMPTION BY SECTOR
1973 1990 2000 2001 2010 2020 2030
TFC 1246 1283 1571 1541 1828 2146 ..Coal1 44 31 31 32 35 35 ..Oil 701 698 816 825 1013 1211 ..Gas 341 303 360 335 391 439 ..Comb. Renewables & Wastes2 16 23 51 49 18 20 ..Geothermal – 0 1 1 – – ..Solar/Wind/Other – – 1 1 – – ..Electricity 143 226 301 287 349 413 ..Heat – 2 10 10 23 29 ..
Shares (%)Coal 3.5 2.4 2.0 2.1 1.9 1.6 ..Oil 56.3 54.4 52.0 53.6 55.4 56.5 ..Gas 27.4 23.6 22.9 21.8 21.4 20.4 ..Comb. Renewables & Wastes 1.3 1.8 3.2 3.2 1.0 0.9 ..Geothermal – – – – – – ..Solar/Wind/Other – – 0.1 0.1 – – ..Electricity 11.5 17.6 19.2 18.7 19.1 19.2 ..Heat – 0.2 0.6 0.6 1.3 1.3 ..
TOTAL INDUSTRY6 406 377 487 471 497 573 ..Coal1 31 21 29 30 32 32 ..Oil 161 149 160 168 182 212 ..Gas 151 124 155 139 166 191 ..Comb. Renewables & Wastes2 7 9 36 35 – – ..Geothermal – – 0 0 – – ..Solar/Wind/Other – – – – – – ..Electricity 56 75 98 91 96 113 ..Heat – – 8 8 21 26 ..
Shares (%)Coal 7.5 5.7 6.0 6.3 6.5 5.6 ..Oil 39.7 39.4 32.9 35.7 36.6 36.9 ..Gas 37.3 32.8 31.9 29.6 33.5 33.4 ..Comb. Renewables & Wastes 1.8 2.4 7.4 7.4 – – ..Geothermal – – – – – – ..Solar/Wind/Other – – – – – – ..Electricity 13.7 19.7 20.2 19.4 19.3 19.6 ..Heat – – 1.6 1.6 4.2 4.5 ..
TRANSPORT7 420 502 610 609 805 982 ..
TOTAL OTHER SECTORS8 420 404 474 461 526 591 ..Coal1 14 10 2 2 2 3 ..Oil 137 63 63 65 54 52 ..Gas 173 164 189 181 205 224 ..Comb. Renewables & Wastes2 9 14 13 12 12 12 ..Geothermal – 0 0 0 – – ..Solar/Wind/Other – – 1 1 – – ..Electricity 87 152 202 196 251 297 ..Heat – 2 2 2 2 3 ..
Shares (%)Coal 3.2 2.4 0.5 0.5 0.5 0.5 ..Oil 32.6 15.6 13.4 14.1 10.2 8.8 ..Gas 41.2 40.6 39.9 39.4 38.9 37.9 ..Comb. Renewables & Wastes 2.1 3.4 2.8 2.7 2.2 2.0 ..Geothermal – 0.1 0.1 0.1 – – ..Solar/Wind/Other – – 0.3 0.3 – – ..Electricity 20.8 37.5 42.6 42.5 47.7 50.3 ..Heat – 0.5 0.4 0.4 0.5 0.5 ..
364
UNITED STATES Energy Balances and Key Statistical Data
261-Energy Balances 2/12/03 11:24 Page 364
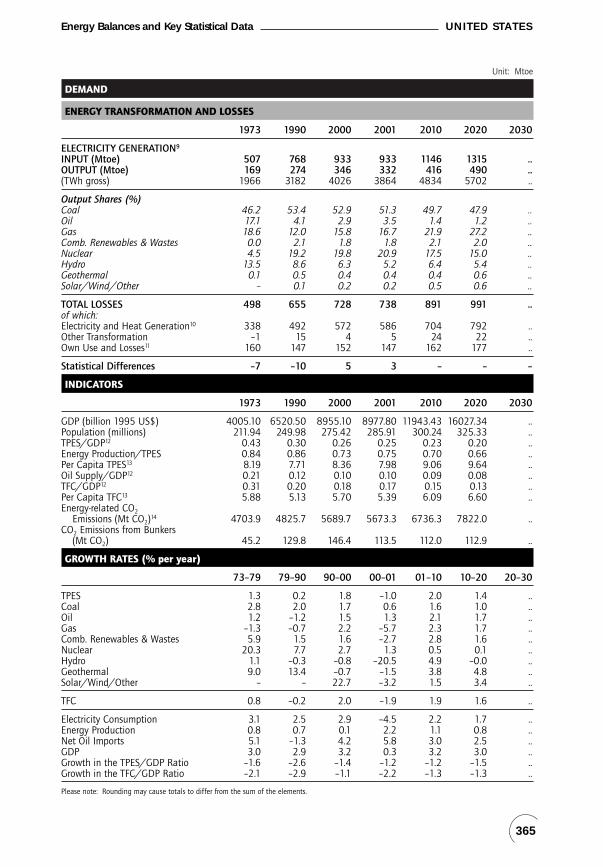
Unit: Mtoe
DEMAND
ENERGY TRANSFORMATION AND LOSSES
1973 1990 2000 2001 2010 2020 2030
ELECTRICITY GENERATION9
INPUT (Mtoe) 507 768 933 933 1146 1315 ..OUTPUT (Mtoe) 169 274 346 332 416 490 ..(TWh gross) 1966 3182 4026 3864 4834 5702 ..
Output Shares (%)Coal 46.2 53.4 52.9 51.3 49.7 47.9 ..Oil 17.1 4.1 2.9 3.5 1.4 1.2 ..Gas 18.6 12.0 15.8 16.7 21.9 27.2 ..Comb. Renewables & Wastes 0.0 2.1 1.8 1.8 2.1 2.0 ..Nuclear 4.5 19.2 19.8 20.9 17.5 15.0 ..Hydro 13.5 8.6 6.3 5.2 6.4 5.4 ..Geothermal 0.1 0.5 0.4 0.4 0.4 0.6 ..Solar/Wind/Other – 0.1 0.2 0.2 0.5 0.6 ..
TOTAL LOSSES 498 655 728 738 891 991 ..of which:Electricity and Heat Generation10 338 492 572 586 704 792 ..Other Transformation –1 15 4 5 24 22 ..Own Use and Losses11 160 147 152 147 162 177 ..
Statistical Differences –7 –10 5 3 – – –
INDICATORS
1973 1990 2000 2001 2010 2020 2030
GDP (billion 1995 US$) 4005.10 6520.50 8955.10 8977.80 11943.43 16027.34 ..Population (millions) 211.94 249.98 275.42 285.91 300.24 325.33 ..TPES/GDP12 0.43 0.30 0.26 0.25 0.23 0.20 ..Energy Production/TPES 0.84 0.86 0.73 0.75 0.70 0.66 ..Per Capita TPES13 8.19 7.71 8.36 7.98 9.06 9.64 ..Oil Supply/GDP12 0.21 0.12 0.10 0.10 0.09 0.08 ..TFC/GDP12 0.31 0.20 0.18 0.17 0.15 0.13 ..Per Capita TFC13 5.88 5.13 5.70 5.39 6.09 6.60 ..Energy-related CO2
Emissions (Mt CO2)14 4703.9 4825.7 5689.7 5673.3 6736.3 7822.0 ..CO2 Emissions from Bunkers
(Mt CO2) 45.2 129.8 146.4 113.5 112.0 112.9 ..
GROWTH RATES (% per year)
73–79 79–90 90–00 00–01 01–10 10–20 20–30
TPES 1.3 0.2 1.8 –1.0 2.0 1.4 ..Coal 2.8 2.0 1.7 0.6 1.6 1.0 ..Oil 1.2 –1.2 1.5 1.3 2.1 1.7 ..Gas –1.3 –0.7 2.2 –5.7 2.3 1.7 ..Comb. Renewables & Wastes 5.9 1.5 1.6 –2.7 2.8 1.6 ..Nuclear 20.3 7.7 2.7 1.3 0.5 0.1 ..Hydro 1.1 –0.3 –0.8 –20.5 4.9 –0.0 ..Geothermal 9.0 13.4 –0.7 –1.5 3.8 4.8 ..Solar/Wind/Other – – 22.7 –3.2 1.5 3.4 ..
TFC 0.8 –0.2 2.0 –1.9 1.9 1.6 ..
Electricity Consumption 3.1 2.5 2.9 –4.5 2.2 1.7 ..Energy Production 0.8 0.7 0.1 2.2 1.1 0.8 ..Net Oil Imports 5.1 –1.3 4.2 5.8 3.0 2.5 ..GDP 3.0 2.9 3.2 0.3 3.2 3.0 ..Growth in the TPES/GDP Ratio –1.6 –2.6 –1.4 –1.2 –1.2 –1.5 ..Growth in the TFC/GDP Ratio –2.1 –2.9 –1.1 –2.2 –1.3 –1.3 ..
Please note: Rounding may cause totals to differ from the sum of the elements.
365
Energy Balances and Key Statistical Data UNITED STATES
261-Energy Balances 2/12/03 11:24 Page 365

261-Energy Balances 2/12/03 11:24 Page 366

ANNEX A
ENERGY BALANCESAND KEY STATISTICAL DATA TABLES
367-Annex A 2/12/03 11:22 Page 367

368
ANNEX A Energy Balances and Key Statistical Data Tables
1973-1979 1997 1998 1999 2000 2001 2002
Canada 3.9 4.2 4.1 5.5 4.6 1.5 3.3United States 3.0 4.5 4.3 4.1 3.8 0.3 2.3North America 3.1 4.5 4.3 4.2 3.8 0.3 2.4
Australia 2.5 4.5 5.3 4.0 1.8 3.9 3.5Japan 3.5 1.8 –1.1 0.7 2.4 –0.6 –0.7Korea 8.5 5.0 –6.7 10.9 9.3 3.0 6.0New Zealand 0.0 1.9 0.4 4.7 2.6 3.2 3.8Pacific 3.5 2.2 –1.2 1.7 2.9 0.1 0.2
Austria 3.0 1.6 3.9 2.7 3.5 0.7 1.0Belgium 2.4 3.6 2.0 3.2 3.7 0.8 0.7Czech Republic 2.5 –0.8 –1.0 0.5 3.3 3.3 1.8Denmark 1.5 3.0 2.5 2.3 3.0 1.0 1.5Finland 2.4 6.3 5.3 4.1 6.1 0.7 1.6France 2.8 1.9 3.4 3.2 3.8 1.8 1.0Germany 2.4 1.4 2.0 2.0 2.9 0.6 0.2Greece 3.3 3.6 3.4 3.6 4.2 4.1 4.0Hungary 4.3 4.6 4.9 4.2 5.2 3.8 3.1Ireland 4.9 10.9 8.8 11.1 10.0 5.7 3.7Italy 3.5 2.0 1.8 1.6 2.9 1.8 0.4Luxembourg 1.3 7.7 7.5 6.0 8.9 1.0 0.6Netherlands 2.6 3.8 4.3 4.0 3.3 1.3 0.1Norway 4.6 5.2 2.6 2.1 2.4 1.4 2.0Portugal 2.9 3.9 4.6 3.5 3.5 1.7 0.4Spain 2.3 4.0 4.3 4.2 4.2 2.7 1.8Sweden 1.8 2.4 3.6 4.6 4.4 0.8 2.2Switzerland –0.4 1.7 2.4 1.5 3.2 0.9 –0.2Turkey 4.5 7.5 3.1 –4.7 7.4 –7.4 3.6United Kingdom 1.5 3.4 2.9 2.4 3.1 2.0 1.5IEA Europe 2.4 2.6 2.9 2.6 3.5 1.3 0.9
IEA Total 2.9 3.1 2.3 2.9 3.5 0.7 1.3
1. Data are in 1995 dollars at 1995 pricesSources: National Accounts, Volume 1, OECD Paris, 2003, and Main Economic Indicators, OECD Paris, 2003.
Table A1
GDP Growth Rates for IEA Countries1
(annual average percentage change)
367-Annex A 2/12/03 11:22 Page 368

AverageAnnual Growth
Rates (%)1973 1979 2000 2001 20022 1990-1995 1996-2001
Canada 0.50 0.48 0.35 0.35 0.32 0.36 –2.9United States 0.43 0.39 0.26 0.25 0.25 –0.8 –2.0North America 0.44 0.40 0.26 0.26 0.25 –0.7 –2.1
Australia 0.29 0.30 0.24 0.25 0.25 –1.7 –1.1Japan 0.12 0.11 0.09 0.09 0.09 1.1 –0.2Korea 0.23 0.26 0.31 0.30 0.30 2.2 –0.5New Zealand 0.19 0.21 0.26 0.26 0.25 –0.9 –0.4Pacific 0.14 0.13 0.12 0.12 0.12 1.7 0.33
Austria 0.16 0.15 0.11 0.11 0.11 –0.4 –1.1Belgium 0.27 0.24 0.19 0.18 0.18 –0.0 –1.8Czech Republic 1.12 1.04 0.73 0.73 0.71 –1.9 –1.4Denmark 0.15 0.15 0.09 0.10 0.09 0.7 –4.8Finland 0.26 0.26 0.20 0.20 0.20 1.0 –3.3France 0.18 0.16 0.15 0.15 0.15 0.1 –1.9Germany 0.22 0.21 0.13 0.13 0.13 –2.8 –1.9Greece 0.15 0.16 0.20 0.20 0.20 –0.1 –0.3Hungary 0.63 0.65 0.46 0.45 0.43 0.3 –4.8Ireland 0.27 0.25 0.14 0.13 0.13 –3.1 –4.2Italy 0.20 0.18 0.14 0.14 0.14 –0.2 –0.6Luxembourg 0.53 0.43 0.15 0.15 0.16 –4.8 –3.8Netherlands 0.25 0.23 0.15 0.15 0.15 –0.5 –2.7Norway 0.21 0.20 0.15 0.15 0.15 –1.6 0.0Portugal 0.13 0.15 0.19 0.19 0.19 1.4 1.0Spain 0.15 0.17 0.18 0.18 0.18 1.0 0.7Sweden 0.23 0.23 0.16 0.17 0.17 0.7 –3.1Switzerland 0.08 0.08 0.08 0.08 0.08 0.2 –0.2Turkey 0.36 0.34 0.38 0.38 0.38 –0.1 0.5United Kingdom 0.29 0.27 0.18 0.18 0.17 –0.7 –2.5IEA Europe 0.22 0.21 0.16 0.16 0.15 –0.8 –1.6
IEA Total 0.27 0.25 0.19 0.19 0.18 –0.3 –1.3
1. Measured in toe per $1 000 of GDP at 1995 prices and exchange rates; changes in energy intensity reflect the combined effectsof efficiency improvements, structural changes, fuel substitution and exchange rates.
2. Preliminary data.Sources: Energy Balances of OECD Countries, IEA/OECD Paris 2003, National Accounts, Volume 1, OECD Paris, 2002, and MainEconomic Indicators, OECD Paris, 2003.
369
Energy Balances and Key Statistical Data Tables ANNEX A
Table A2
TPES/GDP Ratios for IEA Countries1
367-Annex A 2/12/03 11:22 Page 369

AverageAnnual Growth
Rates (%)1973 1979 2000 2001 20021 1990-1995 1996-2001
Canada 7.16 7.88 8.16 7.98 7.65 0.9 0.0United States 8.19 8.36 8.36 7.98 7.95 0.58 –0.2North America 8.09 8.31 8.34 7.98 7.93 0.62 –0.2
Australia 4.23 4.70 5.70 5.94 6.23 0.35 1.6Japan 2.98 3.06 4.13 4.09 4.01 2.2 0.3Korea 0.63 1.07 4.07 4.11 4.23 8.7 2.8New Zealand 2.78 2.88 4.71 4.75 4.72 0.43 1.4Pacific 2.58 2.76 4.28 4.29 4.30 3.01 1.0
Austria 2.85 3.17 3.55 3.78 3.72 0.8 1.2Belgium 4.76 4.93 5.79 5.74 5.73 1.2 0.6Czech Republic 4.58 4.73 3.93 4.03 4.03 –2.8 –0.3Denmark 3.95 4.16 3.63 3.69 3.64 2.4 –2.9Finland 4.57 5.12 6.37 6.52 6.68 –0.2 0.8France 3.31 3.41 4.25 4.36 4.37 0.7 0.5Germany 4.28 4.73 4.18 4.26 4.19 –1.4 –0.3Greece 1.38 1.68 2.55 2.62 2.69 0.6 2.6Hungary 2.05 2.65 2.44 2.49 2.47 –2.0 –0.3Ireland 2.34 2.63 3.77 3.89 3.97 0.9 3.4Italy 2.35 2.51 2.97 2.97 2.92 0.9 1.2Luxembourg 12.83 10.69 8.39 8.65 9.00 –2.5 0.9Netherlands 4.65 4.91 4.74 4.81 4.81 1.0 –0.1Norway 3.70 4.54 5.74 5.90 6.11 1.6 2.2Portugal 0.84 1.03 2.46 2.46 2.52 3.1 4.2Spain 1.50 1.80 3.11 3.16 3.24 2.3 4.1Sweden 4.83 5.17 5.35 5.74 5.64 0.8 –0.1Switzerland 3.06 3.15 3.69 3.87 3.73 –0.8 1.3Turkey 0.63 0.70 1.15 1.06 1.08 1.2 –0.3United Kingdom 3.93 3.91 3.94 4.00 3.87 0.8 –0.1IEA Europe 3.08 3.25 3.47 3.52 3.49 0.17 0.4
IEA Total 4.43 4.64 5.15 5.09 5.07 0.92 0.4
1. Preliminary data.Sources: Energy Balances of OECD Countries, IEA/OECD Paris 2003, National Accounts, Volume 1, OECD Paris, 2002, and MainEconomic Indicators, OECD Paris, 2003.
370
ANNEX A Energy Balances and Key Statistical Data Tables
Table A3
TPES per Inhabitant for IEA Countries(toe per capita)
367-Annex A 2/12/03 11:22 Page 370

AverageAnnual Growth
Rates (%)1973 1979 2000 2001 20022 1990-1995 1996-2001
Canada 0.42 0.38 0.28 0.27 0.26 0.1 –3.6United States 0.31 0.27 0.17 0.18 0.17 –0.7 –1.9North America 0.32 0.28 0.18 0.18 0.18 –0.6 –2.1
Australia 0.20 0.20 0.16 0.16 0.16 –1.2 –1.9Japan 0.09 0.08 0.06 0.06 0.06 0.8 –0.2Korea 0.19 0.20 0.21 0.20 0.20 2.9 –1.4New Zealand 0.14 0.16 0.20 0.20 0.19 0.4 –0.3Pacific 0.10 0.09 0.08 0.08 0.08 1.7 0.03
Austria 0.12 0.12 0.09 0.09 0.10 –0.6 –0.9Belgium 0.20 0.18 0.14 0.13 0.13 0.6 –1.3Czech Republic 0.82 0.83 0.46 0.45 0.45 –4.6 –2.1Denmark 0.13 0.12 0.08 0.07 0.07 –0.0 –3.2Finland 0.24 0.21 0.16 0.15 0.15 0.7 –2.6France 0.14 0.13 0.10 0.10 0.10 0.3 –1.6Germany 0.16 0.15 0.09 0.09 0.09 –2.5 –2.1Greece 0.11 0.11 0.14 0.14 0.14 –0.1 –1.0Hungary 0.50 0.51 0.33 0.32 0.31 –1.4 –4.2Ireland 0.20 0.19 0.11 0.11 0.10 –3.0 –3.1Italy 0.15 0.13 0.11 0.11 0.11 –0.3 –0.5Luxembourg 0.35 0.32 0.15 0.14 0.15 –3.3 –2.4Netherlands 0.19 0.19 0.12 0.12 0.12 –0.6 –2.5Norway 0.19 0.18 0.12 0.12 0.12 –2.5 –1.1Portugal 0.11 0.12 0.15 0.15 0.15 0.8 0.9Spain 0.11 0.13 0.12 0.13 0.13 1.3 1.3Sweden 0.21 0.19 0.13 0.12 0.12 1.2 –3.8Switzerland 0.07 0.07 0.07 0.06 0.06 0.6 –1.1Turkey 0.29 0.29 0.27 0.28 0.27 0.3 –1.2United Kingdom 0.20 0.18 0.13 0.12 0.12 –0.8 –2.5IEA Europe 0.17 0.16 0.11 0.11 0.11 –0.8 –1.6
IEA Total 0.20 0.18 0.13 0.13 0.13 –0.3 –1.3
1. Measured in toe per $1 000 of GDP at 1995 prices and exchange rates.Sources: Energy Balances of OECD Countries, IEA/OECD Paris, 2003, National Accounts, Volume 1, OECD Paris, 2002, and MainEconomic Indicators, OECD Paris, 2003.
371
Energy Balances and Key Statistical Data Tables ANNEX A
Table A4
TFC/GDP Ratios for IEA Countries1
367-Annex A 2/12/03 11:22 Page 371
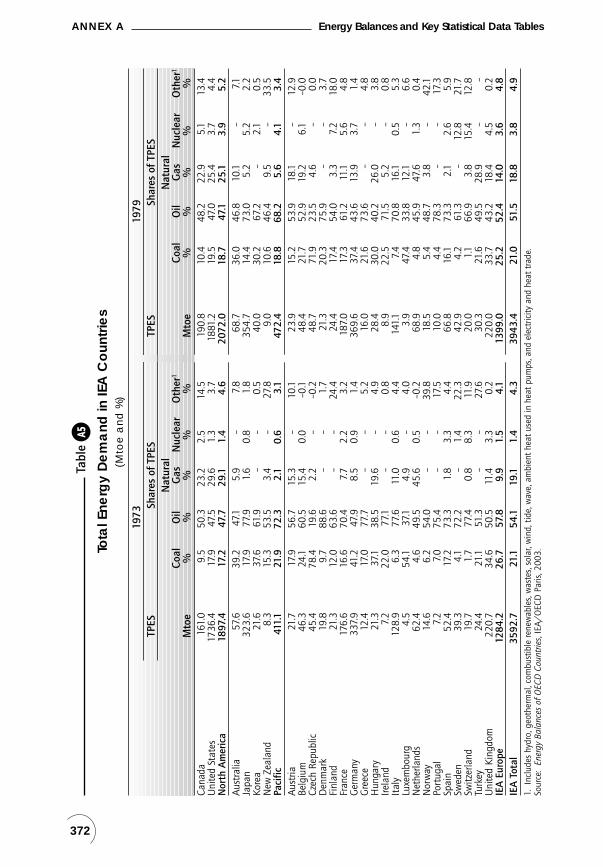
372
ANNEX A Energy Balances and Key Statistical Data Tables
1973
1979
TPES
Shar
es o
f TP
ESTP
ESSh
ares
of
TPES
Nat
ural
Nat
ural
Coal
Oil
Gas
Nuc
lear
Oth
er1
Coal
Oil
Gas
Nuc
lear
Oth
er1
Mto
e%
%%
%%
Mto
e%
%%
%%
Cana
da16
1.0
9.5
50.3
23.2
2.5
14.5
190.
810
.448
.222
.95.
113
.4U
nite
d St
ates
1736
.417
.947
.529
.61.
33.
718
81.2
19.5
47.0
25.4
3.7
4.4
Nor
th A
mer
ica
1897
.417
.247
.729
.11.
44.
620
72.0
18.7
47.1
25.1
3.9
5.2
Aus
tral
ia57
.639
.247
.15.
9–
7.8
68.7
36.0
46.8
10.1
–7.1
Japa
n32
3.6
17.9
77.9
1.6
0.8
1.8
354.
714
.473
.05.
25.
22.
2Ko
rea
21.6
37.6
61.9
––
0.5
40.0
30.2
67.2
–2.
10.
5N
ew Z
eala
nd8.
315
.353
.53.
4–
27.8
9.0
10.6
46.4
9.5
–33
.5Pa
cific
411.
121
.972
.32.
10.
63.
147
2.4
18.8
68.2
5.6
4.1
3.4
Aus
tria
21.7
17.9
56.7
15.3
–10
.123
.915
.253
.918
.1–
12.9
Belg
ium
46.3
24.1
60.5
15.4
0.0
–0.1
48.4
21.7
52.9
19.2
6.1
–0.0
Czec
h Re
publ
ic45
.478
.419
.62.
2–
–0.2
48.7
71.9
23.5
4.6
–0.
0D
enm
ark
19.8
9.7
88.6
––
1.7
21.3
20.3
75.9
––
3.7
Finl
and
21.3
12.0
63.6
––
24.4
24.4
17.4
54.0
3.3
7.2
18.0
Fran
ce
176.
616
.670
.47.
72.
23.
218
7.0
17.3
61.2
11.1
5.6
4.8
Ger
man
y
33
7.9
41.2
47.9
8.5
0.9
1.4
369.
637
.443
.613
.93.
71.
4G
reec
e
12.4
17.0
77.7
––
5.2
16.0
21.6
73.6
––
4.8
Hun
gary
21.3
37.1
38.5
19.6
–4.
928
.430
.040
.226
.0–
3.8
Irela
nd
7.2
22.0
77.1
––
0.8
8.9
22.5
71.5
5.2
–0.
8It
aly
12
8.9
6.3
77.6
11.0
0.6
4.4
141.
17.
470
.816
.10.
55.
3Lu
xem
bour
g
4.5
54.1
37.1
4.9
–4.
03.
947
.433
.812
.1–
6.6
Net
herla
nds
62
.44.
649
.545
.60.
5–0
.268
.94.
845
.947
.61.
30.
4N
orw
ay
14.6
6.2
54.0
––
39.8
18.5
5.4
48.7
3.8
–42
.1Po
rtug
al
7.
27.
075
.4–
–17
.510
.04.
478
.3–
–17
.3Sp
ain
52
.417
.273
.31.
83.
34.
466
.816
.173
.32.
12.
65.
9Sw
eden
39
.34.
172
.2–
1.4
22.3
42.9
4.2
61.3
–12
.821
.7Sw
itzer
land
19
.71.
777
.40.
88.
311
.920
.01.
166
.93.
815
.412
.8Tu
rkey
24
.421
.151
.3–
–27
.630
.321
.649
.528
.9–
–U
nite
d Ki
ngdo
m22
0.7
34.6
50.5
11.4
3.3
0.2
220.
033
.743
.218
.44.
50.
2IE
A E
urop
e12
84.2
26.7
57.8
9.9
1.5
4.1
1399
.025
.252
.414
.03.
64.
8IE
A T
otal
3592
.721
.154
.119
.11.
44.
339
43.4
21.0
51.5
18.8
3.8
4.9
1.In
clud
es h
ydro
, geo
ther
mal
, com
bust
ible
rene
wab
les,
was
tes,
sola
r, w
ind,
tid
e, w
ave,
am
bien
t he
at u
sed
in h
eat
pum
ps, a
nd e
lect
ricity
and
hea
t tr
ade.
Sour
ce:
Ener
gy B
alan
ces
of O
ECD
Cou
ntrie
s, IE
A/
OEC
D P
aris
, 200
3.
Tabl
eA5
Tota
l Ene
rgy
De
ma
nd in
IEA
Co
untr
ies
(Mto
e a
nd
%)
367-Annex A 2/12/03 11:22 Page 372

373
Energy Balances and Key Statistical Data Tables ANNEX A
2001
2002
120
01-2
002
TPES
Shar
es o
f TP
ESTP
ESSh
ares
of
TPES
Chan
ge
Nat
ural
Nat
ural
in T
PES
Coal
Oil
Gas
Nuc
lear
Oth
er2
Coal
Oil
Gas
Nuc
lear
Oth
er2
Mto
e%
%%
%%
Mto
e%
%%
%%
%Ca
nada
24
8.2
12.4
35.8
28.8
8.1
15.0
239.
712
.836
.227
.88.
115
.1–3
.4U
nite
d St
ates
22
81.4
23.9
39.6
22.7
9.2
4.6
2286
.723
.639
.023
.49.
44.
60.
2N
orth
Am
eric
a25
29.6
22.7
39.2
23.3
9.1
5.6
2526
.422
.638
.723
.89.
35.
6–0
.1A
ustr
alia
115.
647
.928
.717
.6–
5.8
122.
748
.029
.117
.6–
5.4
6.1
Japa
n52
0.7
19.2
49.2
12.4
16.0
3.1
510.
919
.550
.112
.315
.13.
1–1
.9Ko
rea
194.
822
.151
.99.
615
.01.
420
1.8
21.5
51.0
10.5
15.4
1.6
3.6
New
Zea
land
18.3
7.0
34.3
29.1
–29
.718
.47.
235
.727
.5–
29.6
0.4
Paci
fic84
9.4
23.5
46.7
12.8
13.3
3.7
853.
823
.847
.012
.912
.63.
60.
5A
ustr
ia30
.712
.242
.822
.6–
22.5
30.3
12.3
43.5
22.4
–21
.8–1
.4Be
lgiu
m59
.013
.141
.122
.320
.53.
058
.815
.738
.222
.121
.02.
9–0
.4Cz
ech
Repu
blic
41.4
50.9
20.3
19.4
9.3
0.1
41.3
49.7
19.9
18.7
11.8
–0.2
–0.2
Den
mar
k
19
.821
.244
.123
.4–
11.3
19.5
21.4
43.9
23.7
–11
.0–1
.3Fi
nlan
d
33
.818
.127
.911
.017
.625
.634
.719
.128
.610
.616
.824
.92.
6Fr
ance
26
5.6
4.8
35.3
13.8
41.3
4.8
266.
35.
034
.613
.942
.73.
80.
3G
erm
any
351.
124
.238
.321
.512
.73.
234
3.1
24.3
37.6
22.0
12.5
3.6
–2.3
Gre
ece
28
.732
.456
.25.
9–
5.5
29.5
32.1
56.0
6.0
–5.
92.
6H
unga
ry25
.314
.326
.142
.314
.62.
725
.113
.426
.043
.014
.53.
2–0
.8Ire
land
15
.017
.557
.023
.9–
1.6
15.5
17.0
57.4
23.5
–2.
23.
1It
aly
17
2.0
7.8
50.3
33.8
–8.
116
9.1
8.0
49.8
34.1
–8.
2–1
.7Lu
xem
bour
g
3.8
2.9
64.8
18.1
–14
.24.
02.
363
.026
.1–
8.6
5.2
Net
herla
nds
77
.210
.838
.146
.01.
33.
777
.210
.738
.646
.01.
33.
40.
0N
orw
ay
26.6
3.5
30.4
20.4
–45
.727
.71.
620
.835
.2–
42.4
4.1
Port
ugal
24.7
12.9
64.2
9.1
–13
.825
.413
.863
.410
.7–
12.0
2.7
Spai
n
127.
414
.752
.712
.913
.06.
713
1.3
16.2
51.2
14.3
12.5
5.8
3.1
Swed
en
51.1
5.4
27.5
1.5
36.8
28.7
50.3
5.5
27.1
1.6
35.6
30.1
–1.5
Switz
erla
nd
28.0
0.5
49.5
9.0
25.0
15.9
27.1
0.5
47.8
9.2
26.2
16.3
–3.4
Turk
ey
72.5
28.2
39.9
18.4
–13
.474
.526
.639
.819
.8–
13.8
2.9
Uni
ted
King
dom
235.
216
.934
.636
.910
.01.
522
8.5
15.7
35.3
37.3
10.0
1.6
–2.8
IEA
Eur
ope
1688
.915
.639
.722
.914
.67.
116
79.2
15.6
39.2
23.4
14.8
7.0
–0.6
IEA
Tot
al50
67.9
20.5
40.7
21.4
11.6
5.8
5059
.420
.540
.321
.811
.75.
7–0
.21.
Prel
imin
ary
data
.2.
Incl
udes
hyd
ro, g
eoth
erm
al, c
ombu
stib
le re
new
able
s, w
aste
s, so
lar,
win
d, t
ide,
wav
e, a
mbi
ent
heat
use
d in
hea
t pu
mps
, and
ele
ctric
ity a
nd h
eat
trad
e.So
urce
:En
ergy
Bal
ance
s of
OEC
D C
ount
ries,
IEA
/O
ECD
Par
is, 2
003.
Tabl
eA5
(con
tinu
ed)
Tota
l Ene
rgy
De
ma
nd in
IEA
Co
untr
ies
(Mto
e a
nd
%)
367-Annex A 2/12/03 11:22 Page 373

ANNEX A Energy Balances and Key Statistical Data Tables
374
2010
2020
2010
-202
0
TPES
Shar
es o
f TP
ESTP
ESSh
ares
of
TPES
Chan
ge
Nat
ural
Nat
ural
in T
PES
Coal
Oil
Gas
Nuc
lear
Oth
er1
Coal
Oil
Gas
Nuc
lear
Oth
er1
Mto
e%
%%
%%
Mto
e%
%%
%%
%Ca
nada
28
6.1
9.9
33.7
32.3
7.117
.031
5.7
7.0
34.5
35.8
6.0
16.7
10.3
Uni
ted
Stat
es
2719
.123
.240
.223
.38.
15.
231
37.3
22.3
41.2
24.0
7.15.
315
.4N
orth
Am
eric
a30
05.3
21.9
39.6
24.2
8.0
6.3
3453
.020
.940
.625
.17.
06.
414
.9A
ustr
alia
145.
134
.134
.025
.1–
6.8
181.
433
.934
.125
.7–
6.3
25.0
Japa
n
....
....
....
....
....
....
..Ko
rea
....
....
....
....
....
....
..N
ew Z
eala
nd
21.1
7.138
.114
.0–
40.7
24.6
9.4
38.7
13.3
–38
.516
.6Pa
cific
....
....
....
....
....
....
..A
ustr
ia
32.3
9.2
38.9
28.0
–24
.034
.96.
040
.329
.5–
24.3
8.2
Belg
ium
57.3
13.4
39.3
24.7
21.4
1.1
....
....
....
..Cz
ech
Repu
blic
42.1
33.5
21.4
26.4
15.9
2.8
44.0
28.0
21.4
30.3
15.2
5.2
4.5
Den
mar
k
23
.623
.242
.625
.6–
8.5
....
....
....
..Fi
nlan
d
37
.616
.524
.511
.822
.324
.940
.219
.123
.412
.120
.425
.06.
9Fr
ance
30
7.8
3.5
36.5
19.4
36.2
4.4
334.
23.
437
.724
.729
.84.
48.
6G
erm
any
350.
421
.139
.924
.011
.23.
7..
....
....
....
Gre
ece
40
.523
.654
.117
.4–
4.9
....
....
....
..H
unga
ry26
.913
.126
.642
.713
.44.
127
.712
.126
.943
.513
.04.
63.
3Ire
land
17
.210
.351
.635
.1–
3.0
....
....
....
..It
aly
18
2.7
10.9
33.9
43.8
–11
.319
7.7
10.6
30.3
45.5
–13
.58.
2Lu
xem
bour
g
3.7
2.7
48.4
39.5
–9.
5..
....
....
....
Net
herla
nds
79
.410
.236
.646
.41.
25.
686
.710
.833
.849
.7–
5.8
9.2
Nor
way
..
....
....
....
....
....
....
Port
ugal
26.2
12.4
52.2
19.9
–15
.5..
....
....
....
Spai
n
170.
38.
748
.021
.79.
711
.8..
....
....
....
Swed
en
52.8
4.8
30.4
1.8
33.7
29.2
....
....
....
..Sw
itzer
land
27
.10.
448
.210
.523
.217
.726
.70.
448
.511
.220
.719
.3–1
.4Tu
rkey
15
2.2
26.1
33.6
32.6
–7.
727
9.2
38.5
25.8
26.7
2.6
6.4
83.4
Uni
ted
King
dom
244.
18.
737
.941
.07.
84.
625
1.5
6.2
40.9
45.3
3.1
4.4
3.0
IEA
Eur
ope
....
....
....
....
....
....
..IE
A T
otal
....
....
....
....
....
....
..1.
Incl
udes
hyd
ro, g
eoth
erm
al, c
ombu
stib
le re
new
able
s, w
aste
s, so
lar,
win
d, t
ide.
wav
e, a
mbi
ent
heat
use
d in
hea
t pu
mps
and
ele
ctric
ity t
rade
.N
ote:
The
IEA
Sec
reta
riat
has
estim
ated
dat
a fo
r cer
tain
cou
ntrie
s. Pl
ease
see
Ene
rgy
Bala
nces
and
Key
Sta
tistic
al D
ata
for d
etai
ls (P
art
2.3)
.So
urce
:Co
untr
y su
bmis
sion
s.
Tabl
eA5
(con
tinu
ed)
Tota
l Ene
rgy
De
ma
nd in
IEA
Co
untr
ies
(Mto
e a
nd
%)
367-Annex A 2/12/03 11:22 Page 374

375
Energy Balances and Key Statistical Data Tables ANNEX A
1973
1979
2000
2001
2002
1
TPES
Prod
ucti
on%
TPES
Prod
ucti
on%
TPES
Prod
ucti
on%
TPES
Prod
ucti
on%
TPES
Prod
ucti
on%
Nor
th A
mer
ica
Coal
326.
334
5.1
105.
738
6.8
443.
611
4.7
572.
658
0.0
101.
357
5.4
611.
010
6.2
570.
558
7.0
102.
9O
il90
5.0
630.
269
.697
5.6
581.
759
.698
0.4
494.
850
.599
2.5
493.
549
.797
8.8
498.
650
.9N
atur
al G
as55
1.8
564.
010
2.2
520.
652
1.8
100.
262
3.0
596.
295
.758
8.9
613.
510
4.2
601.
259
2.1
98.5
Tota
l18
97.4
1653
.587
.120
72.0
1736
.183
.825
54.8
2049
.980
.225
29.6
2091
.082
.725
26.4
2053
.681
.3
Paci
ficCo
al89
.866
.173
.689
.070
.379
.018
3.7
168.
891
.919
9.9
185.
292
.720
3.2
191.
494
.2O
il29
7.2
20.8
7.0
322.
023
.87.
440
8.2
37.3
9.1
396.
738
.19.
640
1.1
37.1
9.3
Nat
ural
Gas
8.7
6.0
68.1
26.4
9.9
37.6
107.
235
.833
.410
9.1
36.6
33.5
110.
538
.434
.7To
tal
411.
110
8.3
26.3
472.
413
9.0
29.4
843.
238
5.9
45.8
849.
440
3.7
47.5
853.
840
5.8
47.5
IEA
Eur
ope
Coal
342.
730
3.2
88.5
352.
829
6.6
84.1
264.
214
0.9
53.3
264.
014
0.6
53.3
262.
213
5.8
51.8
Oil
742.
022
.83.
173
2.8
118.
016
.166
1.4
338.
751
.267
1.3
322.
048
.065
7.9
317.
648
.3N
atur
al G
as12
7.0
119.
994
.419
5.9
167.
285
.337
4.5
239.
363
.938
6.6
242.
862
.839
3.3
247.
362
.9To
tal
1284
.251
7.8
40.3
1399
.069
8.4
49.9
1657
.010
74.0
64.8
1688
.910
69.9
63.4
1679
.210
64.3
63.4
IEA
Tot
alCo
al75
8.9
714.
494
.182
8.6
810.
697
.810
20.5
889.
787
.210
39.2
936.
990
.210
35.9
914.
288
.2O
il19
44.2
673.
734
.720
30.5
723.
535
.620
50.0
870.
742
.520
60.5
853.
641
.420
37.9
853.
441
.9N
atur
al G
as68
7.5
689.
810
0.3
743.
069
8.9
94.1
1104
.787
1.3
78.9
1084
.789
2.9
82.3
1105
.087
7.8
79.4
Tota
l35
92.7
2279
.663
.439
43.4
2573
.565
.350
54.9
3509
.869
.450
67.9
3564
.670
.350
59.4
3523
.769
.6
1.Pr
elim
inar
y da
ta.
Sour
ce:
Ener
gy B
alan
ces
of O
ECD
Cou
ntrie
s, IE
A/
OEC
D P
aris
, 200
3.
Tabl
eA6
Dev
elo
pm
ent
of I
EA E
nerg
y Se
lf-su
ffic
ienc
y b
y Pr
od
uct
(Mto
e a
nd
%)
367-Annex A 2/12/03 11:22 Page 375

TotalEnergy1 Coal1 Oil1 Gas1 Electricity2
Canada 1.528 1.225 1.466 2.129 1.041United States 0.750 1.053 0.402 0.892 0.995North America 0.827 1.062 0.497 1.042 1.001
Australia 2.166 3.242 1.054 1.434 1.000Japan 0.200 0.016 0.003 0.033 1.000Korea 0.176 0.038 0.006 – 1.000New Zealand 0.816 1.864 0.289 1.000 1.000Pacific 0.475 0.927 0.096 0.335 1.000
Austria 0.316 0.076 0.078 0.212 0.996Belgium 0.222 0.015 – – 0.896Czech Republic 0.737 1.200 0.043 0.015 1.147Denmark 1.373 – 1.990 1.639 1.016Finland 0.448 0.226 0.006 – 0.882France 0.502 0.125 0.019 0.041 1.143Germany 0.381 0.684 0.029 0.211 0.994Greece 0.347 0.902 0.011 0.024 0.955Hungary 0.427 0.736 0.237 0.231 0.920Ireland 0.115 0.308 – 0.184 1.010Italy 0.153 – 0.048 0.215 0.849Luxembourg 0.016 – – – 0.081Netherlands 0.783 – 0.079 1.567 0.844Norway 8.515 1.271 20.373 9.011 0.971Portugal 0.137 – – – 0.995Spain 0.259 0.393 0.005 0.029 0.986Sweden 0.673 0.103 – – 1.049Switzerland 0.441 – – – 1.174Turkey 0.361 0.686 0.086 0.019 0.967United Kingdom 1.115 0.478 1.494 1.097 0.974IEA Europe 0.634 0.533 0.480 0.628 0.992
IEA Total 0.703 0.902 0.414 0.823 0.998
1. Calculated as production divided by primary energy supply.2. Calculated as the ratio between domestic generation and total apparent consumption, or TFC plus own-use in the energy sectorand distribution losses. Includes CHP units.Source: Energy Balances of OECD Countries, IEA/OECD Paris, 2003.
376
ANNEX A Energy Balances and Key Statistical Data Tables
Table A7
Indigenous Production/Primary Energy Supply in IEA Countries, 2001
367-Annex A 2/12/03 11:22 Page 376

377
Energy Balances and Key Statistical Data Tables ANNEX A
TPES
Oil
Supp
lyN
et O
il Im
port
s1
%%
%%
%%
2000
2001
Chg.
2002
2Ch
g.20
0020
01Ch
g.20
022
Chg.
2000
2001
Chg.
2002
2Ch
g.Ca
nada
250.
924
8.2
–1.1
239.
7–3
.487
.888
.81.
186
.8–2
.3–3
9.1
–39.
0 e
–0.4
–48.
9 e
25.4
Uni
ted
Stat
es
2303
.822
81.4
–1.0
2286
.70.
289
2.5
903.
71.
389
2.1
–1.3
551.
157
3.1
4.0
553.
5 e
–3.4
Nor
th A
mer
ica
2554
.825
29.6
–1.0
2526
.4–0
.198
0.4
992.
51.
297
8.8
–1.4
511.
953
4.1
4.3
504.
7–5
.5A
ustr
alia
109.
811
5.6
5.3
122.
76.
136
.533
.2–9
.035
.77.
33.
5–0
.1–1
02.3
1.6
e–21
01.3
Japa
n52
4.2
520.
7–0
.751
0.9
–1.9
261.
625
6.1
–2.1
256.
1–0
.026
9.3
256.
7–4
.725
9.1
e0.
9Ko
rea
191.
219
4.8
1.9
201.
83.
610
3.8
101.
1–2
.610
2.9
1.8
109.
910
6.4
–3.2
106.
3 e
–0.1
New
Zea
land
18.0
18.3
1.4
18.4
0.4
6.3
6.3
–0.8
6.6
4.6
4.5
4.6
2.4
5.1
e10
.7Pa
cific
843.
284
9.4
0.7
853.
80.
540
8.2
396.
7–2
.840
1.1
1.1
387.
236
7.6
–5.1
372.
01.
2A
ustr
ia28
.830
.76.
830
.3–1
.412
.213
.17.
813
.20.
411
.011
.76.
412
.5 e
7.2
Belg
ium
59
.359
.0–0
.558
.8–0
.423
.824
.32.
122
.4–7
.529
.229
.82.
029
.2 e
–2.1
Czec
h Re
publ
ic40
.441
.42.
541
.3–0
.27.
98.
46.
38.
2–1
.97.
58.
28.
78.
0 e
–2.6
Den
mar
k
19
.419
.82.
019
.5–1
.38.
78.
7–0
.18.
6–1
.8–8
.5–7
.1–1
6.3
–9.4
e32
.4Fi
nlan
d
33
.033
.82.
534
.72.
69.
69.
4–2
.19.
95.
410
.810
.4–3
.69.
9 e
–4.5
Fran
ce
257.
426
5.6
3.2
266.
30.
387
.293
.87.
592
.1–1
.890
.094
.1 e
4.6
94.3
e0.
2G
erm
any
343.
435
1.1
2.2
343.
1–2
.313
1.7
134.
52.
112
8.9
–4.2
127.
413
2.9
4.3
124.
4 e
–6.4
Gre
ece
27
.828
.73.
229
.52.
615
.616
.13.
416
.52.
319
.319
.30.
420
.3 e
5.0
Hun
gary
24.9
25.3
1.6
25.1
–0.8
6.9
6.6
–3.5
6.5
–1.3
5.2
e4.
7–9
.14.
7 e
0.3
Irela
nd
14.3
15.0
4.5
15.5
3.1
8.1
8.5
6.0
8.9
3.9
8.1
9.0
11.1
9.1
e0.
9It
aly
17
1.7
172.
00.
216
9.1
–1.7
88.2
86.5
–1.8
84.2
–2.7
87.9
83.9
–4.5
82.4
e–1
.8Lu
xem
bour
g
3.7
3.8
4.1
4.0
5.2
2.3
2.5
6.2
2.5
2.3
2.4
2.5
2.8
2.6
e4.
2N
ethe
rland
s
75.5
77.2
2.3
77.2
0.0
28.6
29.5
3.2
29.8
1.2
41.9
41.8
–0.1
40.5
e–3
.2N
orw
ay
25.8
26.6
3.2
27.7
4.1
9.4
8.1
–14.
15.
8–2
8.8
–158
.8–1
58.0
–0.5
–151
.9 e
–3.8
Port
ugal
24.6
24.7
0.5
25.4
2.7
15.6
15.9
2.0
16.1
1.5
16.1
16.8
4.5
16.2
e–3
.7Sp
ain
12
4.3
127.
42.
513
1.3
3.1
64.9
67.1
3.5
67.3
0.2
71.6
73.3
2.4
75.0
e2.
3Sw
eden
47
.551
.17.
550
.3–1
.513
.414
.15.
313
.7–2
.914
.6 e
15.3
e4.
814
.3 e
–6.8
Switz
erla
nd
26.5
28.0
5.8
27.1
–3.4
12.7
13.9
9.0
12.9
–6.7
12.3
13.7
11.9
13.0
e–5
.1Tu
rkey
77
.572
.5–6
.574
.52.
931
.128
.9–7
.029
.72.
729
.426
.8–9
.027
.3 e
1.8
Uni
ted
King
dom
231.
223
5.2
1.7
228.
5–2
.883
.781
.5–2
.780
.7–0
.9–4
6.7
–36.
5–2
1.9
–38.
4 e
5.2
IEA
Eur
ope
1657
.016
88.9
1.9
1679
.2–0
.666
1.4
671.
31.
565
7.9
–2.0
370.
539
2.7
6.0
383.
9–2
.3IE
A T
otal
5054
.950
67.9
0.3
5059
.4–0
.220
50.0
2060
.50.
520
37.9
–1.1
1269
.712
94.5
2.0
1260
.52.
61.
Impo
rts
min
us e
xpor
ts.
2.Pr
elim
inar
y da
ta.
Sour
ce: E
nerg
y Ba
lanc
es o
f OEC
D C
ount
ries,
IEA
/O
ECD
Par
is, 2
003.
Tabl
eA8
Rec
ent
Ene
rgy
and
Oil
Sup
ply
Tre
nds
for
IEA
Co
untr
ies
(Mto
e a
nd
%)
367-Annex A 2/12/03 11:22 Page 377

378
ANNEX A Energy Balances and Key Statistical Data Tables
TFC
Indu
stry
1Re
side
ntia
l/Co
mm
erci
al2
Tran
spor
t19
7319
7920
0020
0119
7319
7920
0020
0119
7319
7920
0020
0119
7319
7920
0020
01Ca
nada
58.3
53.3
42.9
44.1
40.4
37.3
28.9
30.5
47.4
35.4
19.1
19.4
98.9
95.2
90.4
91.0
Uni
ted
Stat
es
56.3
57.7
52.0
53.6
39.7
48.3
32.9
35.7
32.6
25.0
13.4
14.1
95.9
96.9
97.2
97.2
Nor
th A
mer
ica
56.5
57.2
51.0
52.6
39.8
47.0
32.4
35.0
34.0
26.1
14.0
14.7
96.1
96.7
96.6
96.7
Aus
tral
ia61
.759
.751
.750
.943
.840
.626
.925
.939
.726
.713
.012
.899
.499
.697
.997
.7Ja
pan
73.2
70.3
63.6
63.9
67.7
62.2
52.7
51.8
68.5
63.6
47.9
48.8
96.9
97.6
98.3
98.3
Kore
a56
.462
.068
.265
.584
.477
.765
.862
.013
.725
.147
.443
.599
.199
.499
.499
.4N
ew Z
eala
nd60
.655
.142
.142
.343
.935
.09.
58.
532
.822
.812
.411
.699
.999
.999
.299
.3Pa
cific
70.4
67.8
62.6
62.0
65.6
60.5
51.7
50.1
58.1
53.2
44.0
43.7
97.6
98.2
98.5
98.5
Aus
tria
60.4
54.9
45.2
45.9
51.7
40.1
28.1
29.0
48.6
44.7
25.5
26.5
92.9
94.8
92.3
91.8
Belg
ium
60.7
56.9
52.0
51.9
46.8
38.6
36.9
38.7
64.2
58.3
39.0
37.6
98.4
98.6
98.7
98.7
Czec
h Re
publ
ic24
.424
.830
.030
.927
.326
.024
.625
.95.
48.
82.
01.
788
.088
.694
.795
.4D
enm
ark
87.7
80.2
49.4
47.8
83.3
70.5
32.5
32.6
84.9
76.2
22.2
21.4
99.7
99.7
99.4
99.4
Finl
and
59.2
54.8
33.7
33.7
66.2
54.3
15.0
14.5
42.3
41.1
25.6
25.7
99.3
99.5
98.6
98.5
Fran
ce72
.066
.852
.252
.463
.459
.238
.439
.668
.056
.126
.327
.397
.798
.197
.697
.6G
erm
any
56.0
53.2
50.8
50.8
44.3
39.5
35.3
35.5
53.6
47.8
30.4
32.4
93.5
97.1
97.7
97.4
Gre
ece
77
.677
.469
.069
.368
.769
.449
.449
.468
.661
.651
.152
.299
.299
.799
.799
.7H
unga
ry39
.142
.232
.129
.929
.632
.731
.226
.235
.736
.58.
37.
081
.290
.697
.397
.2Ire
land
71
.264
.364
.264
.686
.673
.841
.340
.837
.730
.545
.245
.410
0.0
100.
010
0.0
100.
0It
aly
73
.065
.149
.649
.462
.352
.130
.529
.473
.558
.522
.824
.097
.197
.397
.597
.4Lu
xem
bour
g
52.1
43.8
64.6
65.9
38.6
19.9
9.0
8.7
78.4
67.8
46.1
47.3
99.0
99.2
99.6
99.6
Net
herla
nds
50
.542
.641
.141
.448
.846
.740
.442
.334
.216
.83.
83.
699
.099
.099
.099
.1N
orw
ay
55.9
52.6
39.3
40.2
43.2
43.3
27.0
30.0
50.6
37.3
16.2
16.8
98.3
98.3
97.1
96.9
Port
ugal
75.1
73.7
67.1
66.6
66.9
66.9
60.2
59.4
59.7
52.9
34.4
35.3
98.0
99.0
99.5
99.5
Spai
n
75.6
78.6
62.6
61.7
64.7
70.0
43.0
42.1
68.2
64.4
37.1
35.1
98.8
99.1
98.8
98.7
Swed
en
70.4
62.8
40.3
38.5
53.4
48.1
23.3
24.4
78.7
62.6
23.4
15.8
96.8
96.9
96.7
96.6
Switz
erla
nd
81.4
75.3
62.0
61.2
77.4
64.0
36.3
36.7
76.3
70.7
48.7
48.6
95.9
95.8
96.8
96.6
Turk
ey
48.4
49.4
47.1
48.3
60.5
56.6
36.1
40.8
28.0
23.7
28.9
26.3
88.1
96.3
99.2
99.2
Uni
ted
King
dom
52.3
48.5
46.0
44.9
51.8
45.6
36.6
35.0
24.7
21.6
8.3
8.8
99.1
99.1
98.6
98.5
IEA
Eur
ope
60.7
56.7
49.7
49.6
52.6
47.6
35.3
35.6
52.3
44.2
24.1
24.5
96.5
97.8
98.0
97.9
IEA
Tot
al59
.658
.352
.453
.049
.149
.337
.138
.243
.336
.122
.322
.996
.397
.297
.397
.3
1.In
clud
es n
on-e
nerg
y us
e.2.
Incl
udes
pub
lic a
nd a
gric
ultu
ral u
se.
Sour
ce:
Ener
gy B
alan
ces
of O
ECD
Cou
ntrie
s, IE
A/
OEC
D P
aris
, 200
3.
Tabl
eA9
Sha
re o
f Oil
Use
by
Sec
tor i
n IE
A C
oun
trie
s(%
)
367-Annex A 2/12/03 11:22 Page 378

379
Energy Balances and Key Statistical Data Tables ANNEX A
1973 1979 2001 20021 2010 2020 2030
Canada 96.3 86.6 130.2 136.3 170.9 193.5 ..United States 533.8 495.1 363.2 362.3 373.9 374.7 ..North America 630.2 581.7 493.5 498.6 544.8 568.2 ..
Australia 19.8 22.7 35.0 34.3 32.0 34.2 ..Japan 0.8 0.6 0.7 0.6 .. .. ..Korea – – 0.6 0.5 .. .. ..New Zealand 0.2 0.4 1.8 1.7 2.2 2.2 2.8Pacific 20.8 23.8 38.1 37.1 .. .. ..
Austria 2.7 1.8 1.0 1.0 1.0 1.1 ..Belgium – – – – – .. ..Czech Republic 0.0 0.3 0.4 0.4 0.4 0.4 0.4Denmark 0.1 0.4 17.3 18.7 14.0 .. ..Finland – – 0.1 0.1 – – ..France 2.1 2.0 1.8 1.7 – – ..Germany 6.8 4.9 4.0 4.2 1.6 .. ..Greece – – 0.2 0.2 0.3 .. ..Hungary 2.0 2.4 1.6 1.5 1.0 0.8 0.7Ireland – – – – – .. ..Italy 1.1 1.8 4.2 5.5 10.0 10.0 10.0Luxembourg – – – – – .. ..Netherlands 1.6 1.6 2.3 3.2 0.8 0.8 ..Norway 1.5 18.6 164.7 158.4 .. .. ..Portugal – – – – – .. ..Spain 0.7 1.4 0.3 0.3 .. .. ..Sweden – 0.0 – – – .. ..Switzerland – – – – – – –Turkey 3.6 2.9 2.5 2.4 1.1 0.5 0.2United Kingdom 0.5 79.9 121.7 120.0 .. .. ..IEA Europe 22.8 118.0 322.0 317.6 .. .. ..
IEA Total 673.7 723.5 853.6 853.4 .. .. ..
1. Preliminary data.Note: The IEA Secretariat has estimated forecast data for certain countries. Please see Energy Balances and Key Statistical Data for details(Part 2.3).Sources: Energy Balances of OECD Countries, Paris IEA/OECD, 2003, for 1973, 1979 and 2001; and country submissions for 2010, 2020and 2030.
Table A10
Historical and Projected Oil Production in IEA Countries(Mtoe)
367-Annex A 2/12/03 11:22 Page 379

380
ANNEX A Energy Balances and Key Statistical Data Tables
1979 2000 2001 20022 2010 2020 2030
Canada 7.8 –39.1 e –39.0 e –48.9 e –73.9 –83.9 ..United States 423.7 551.1 e 573.1 553.5 e 738.6 938.5 ..North America 431.5 511.9 e 534.1 504.7 e 664.7 854.6 ..
Australia 10.8 3.5 e –0.1 1.6 e 18.3 28.8 ..Japan 277.0 269.3 e 256.7 259.1 e .. .. ..Korea 27.0 109.9 e 106.4 106.3 e .. .. ..New Zealand 4.2 4.5 e 4.6 5.1 e 6.3 7.8 10.2Pacific 318.9 387.2 e 367.6 372.0 e .. .. ..
Austria 11.4 11.0 e 11.7 12.5 e 11.8 13.2 ..Belgium 29.4 29.2 e 29.8 29.2 e 26.5 .. ..Czech Republic 11.2 7.5 e 8.2 8.0 e 8.6 9.0 9.3Denmark 15.8 –8.5 e –7.1 –9.4 e –2.8 .. ..Finland 15.3 10.8 e 10.4 9.9 e 9.2 9.4 ..France 120.7 90.0 e 94.1 e 94.3 e 115.0 129.5 ..Germany 162.7 127.4 e 132.9 124.4 e 140.2 .. ..Greece 13.3 19.3 e 19.3 20.3 e 25.2 .. ..Hungary 9.8 5.2 e 4.7 4.7 e 6.2 6.7 7.0Ireland 6.4 8.1 e 9.0 9.1 e 9.0 .. ..Italy 102.6 87.9 e 83.9 82.4 e 54.5 52.0 52.0Luxembourg 1.4 2.4 e 2.5 2.6 e 1.8 .. ..Netherlands 41.4 41.9 e 41.8 40.5 e 49.4 49.7 ..Norway –9.3 –158.8 e –158.0 –151.9 e .. .. ..Portugal 9.2 16.1 e 16.8 16.2 e 15.0 .. ..Spain 49.6 71.6 e 73.3 75.0 e .. .. ..Sweden 28.4 14.6 e 15.3 e 14.3 e 17.5 .. ..Switzerland 13.8 12.3 e 13.7 13.0 e 13.0 12.9 12.6Turkey 11.8 29.4 e 26.8 27.3 e 50.0 71.4 102.2United Kingdom 19.2 –46.7 e –36.5 –38.4 e .. .. ..IEA Europe 664.2 370.5 e 392.7 383.9 e .. .. ..
IEA Total 1414.6 1269.7 e 1294.5 1260.5 e .. .. ..
1. Includes requirements for marine bunkers.2. Preliminary data.Note: The IEA Secretariat has estimated data for certain countries (e). Please see Energy Balances and Key Statistical Data for details(Part 2.3).Sources: Energy Balances of OECD Countries, IEA/OECD Paris, 2003, for 1979, 2000 and 2001 and country submissions for 2010,2020 and 2030.
Table A11
Historical and Projected Net Oil Imports of IEA Countries1
(Mtoe)
367-Annex A 2/12/03 11:22 Page 380

381
Energy Balances and Key Statistical Data Tables ANNEX A
1973
1979
2001
2002
1
Out
put
Shar
eO
utpu
tSh
are
Out
put
Shar
eO
utpu
tSh
are
TWh
%TW
h%
TWh
%TW
h%
Coal
1606
.537
.220
19.6
37.8
3433
.637
.734
65.2
37.4
Oil
1105
.725
.610
52.3
19.7
465.
55.
148
8.4
5.3
Nat
ural
Gas
512.
911
.959
8.5
11.2
1538
.616
.916
38.6
17.7
Com
b. R
enew
able
s &
Was
tes
6.9
0.2
11.7
0.2
140.
61.
515
6.3
1.7
Nuc
lear
188.
34.
457
3.4
10.7
2263
.924
.922
66.7
24.5
Hyd
ro89
1.2
20.6
1073
.720
.111
86.8
13.0
1169
.812
.6G
eoth
erm
al6.
40.
18.
60.
225
.70.
324
.80.
3So
lar/
Win
d0.
60.
00.
50.
037
.30.
450
.10.
5To
tal
4318
.410
0.0
5338
.410
0.0
9097
.310
0.0
9259
.810
0.0
1.Pr
elim
inar
y da
ta.
Sour
ce:
Ener
gy B
alan
ces
of O
ECD
Cou
ntrie
s, IE
A/
OEC
D P
aris
, 200
3.
Tabl
eA1
2
Tota
l IEA
Ele
ctr
icity
Ge
nera
tion
by
Fue
l(T
Wh
an
d %
)
367-Annex A 2/12/03 11:22 Page 381

Energy Electricity Shares of Fuel in Electricity Generation (%)Inputs1 Output(Mtoe) in TWh Coal Oil Gas Nuclear Hydro Other2
Canada 86.9 587.9 20.1 2.9 6.1 13.0 56.7 1.3United States 932.5 e 3863.8 51.3 3.5 16.7 20.9 5.2 2.4North America 1019.4 4451.7 47.2 3.4 15.3 19.9 12.0 2.2
Australia 57.3 e 216.9 78.3 1.3 12.1 - 7.6 0.7Japan 217.2 e 1033.2 23.1 11.3 24.9 31.0 8.1 1.1Korea 71.1 e 281.5 39.2 8.5 10.8 39.8 1.5 0.2New Zealand 6.7 39.9 3.7 - 31.2 - 53.8 11.4Pacific 352.2 1571.5 33.1 9.2 20.7 27.5 8.0 1.1
Austria 8.5 62.4 12.7 3.2 13.6 - 67.0 3.5Belgium 18.7 e 78.6 16.2 2.1 20.1 59.0 0.6 2.1Czech Republic 21.2 74.2 71.7 0.5 4.2 19.9 2.8 1.0Denmark 8.9 37.7 47.3 11.1 24.6 - 0.1 17.0Finland 16.1 74.5 23.5 0.9 15.5 30.6 17.7 11.8France 127.5 e 546.0 4.5 1.0 3.1 77.1 13.6 0.7Germany 136.8 e 579.8 51.9 1.1 9.9 29.5 3.5 4.1Greece 12.0 53.1 66.8 16.0 11.6 - 4.0 1.8Hungary 10.4 36.4 24.5 11.5 24.3 38.8 0.5 0Ireland 5.3 e 24.6 37.6 21.1 37.1 - 2.4 1.7Italy 50.4 271.9 13.5 27.6 38.3 - 17.2 3.4Luxembourg 0.1 0.5 .. .. 56.0 - 26.7 17.3Netherlands 20.1 e 93.7 28.5 3.3 58.9 4.2 0.1 4.8Norway 10.6 e 121.3 0.2 0.0 0.2 - 99.3 0.3Portugal 7.8 46.2 29.5 20.2 15.6 - 30.4 4.2Spain 45.4 e 234.7 30.6 10.5 10.0 27.1 17.5 4.4Sweden 30.5 161.7 2.1 1.7 0.2 44.6 49.0 2.5Switzerland 11.7 e 70.5 - 0.1 1.2 38.0 58.6 2.2Turkey 24.8 e 122.7 31.3 8.5 40.4 - 19.6 0.3United Kingdom 85.0 e 383.5 34.8 1.9 37.2 23.5 1.1 1.6IEA Europe 651.9 3074.1 26.4 5.6 17.3 30.8 17.1 2.8
IEA Total 2023.6 9097.3 37.7 5.1 16.9 24.9 13.0 2.2
1. Includes CHP units.2. Includes combustible renewables, wastes, geothermal, solar, wind, tide and wave.Source: Energy Balances of OECD Countries, IEA/OECD Paris, 2003.
382
ANNEX A Energy Balances and Key Statistical Data Tables
Table A13
Electricity Generation in IEA Countries, 2001
367-Annex A 2/12/03 11:22 Page 382

383
Energy Balances and Key Statistical Data Tables ANNEX A
AverageAnnual Growth
Rates (%)1973 1979 1999 2000 2001 1990-1995 1996-2001
Canada 0.80 0.82 0.81 0.81 0.79 –0.0 –2.8United States 0.49 0.50 0.45 0.45 0.43 0.07 –2.3North America 0.52 0.52 0.48 0.48 0.46 0.03 –2.3
Australia 0.33 0.40 0.46 0.46 0.46 –0.9 0.21Japan 0.18 0.18 0.19 0.19 0.18 1.46 0.02Korea 0.16 0.23 0.42 0.43 0.44 3.72 2.57New Zealand 0.43 0.51 0.56 0.57 0.56 –1.2 –0.7Pacific 0.19 0.20 0.23 0.23 0.23 1.73 0.93
Austria 0.21 0.22 0.22 0.22 0.23 –0.5 0.31Belgium 0.23 0.25 0.28 0.27 0.27 1.50 –0.6Czech Republic 0.96 1.05 1.14 1.14 1.13 0.68 –0.7Denmark 0.15 0.18 0.18 0.18 0.18 –0.3 –2.8Finland 0.37 0.43 0.51 0.49 0.50 2.64 –1.5France 0.19 0.22 0.27 0.26 0.26 1.47 –1.1Germany 0.25 0.27 0.21 0.21 0.22 –2.4 –0.4Greece 0.18 0.22 0.37 0.38 0.38 2.20 1.08Hungary 0.66 0.70 0.75 0.71 0.70 0.73 –3.2Ireland 0.27 0.30 0.23 0.22 0.22 –0.3 –3.6Italy 0.22 0.23 0.26 0.26 0.26 0.80 0.93Luxembourg 0.41 0.42 0.26 0.25 0.24 –0.1 –3.2Netherlands 0.20 0.22 0.22 0.22 0.22 0.49 –0.3Norway 0.96 0.91 0.70 0.68 0.70 –1.9 –0.9Portugal 0.17 0.23 0.34 0.34 0.35 1.97 1.98Spain 0.21 0.26 0.31 0.32 0.33 0.93 2.45Sweden 0.46 0.51 0.52 0.50 0.51 –1.1 –2.0Switzerland 0.14 0.16 0.18 0.18 0.18 1.02 –0.1Turkey 0.18 0.26 0.62 0.62 0.67 5.15 4.97United Kingdom 0.38 0.37 0.30 0.30 0.30 –0.6 –1.3IEA Europe 0.26 0.28 0.28 0.28 0.29 –0.1 –0.2
IEA Total 0.33 0.34 0.34 0.34 0.33 0.36 –0.8
1. Calculated as production plus net imports divided by GDP and measured in kWh per dollar of GDP at 1995 prices and exchangerates; includes CHP units.Sources: Energy Balances of OECD Countries, IEA/OECD Paris, 2003, National Accounts, Volume 1, OECD Paris, 2002, and MainEconomic Indicators, OECD Paris, 2003.
Table A14
Electricity Intensity of IEA Countries1
367-Annex A 2/12/03 11:22 Page 383

2001
Total Capacity
NaturalCoal Oil Gas Nuclear Hydro Other Total
Canada 16.15 7.75 8.06 10.62 67.41 1.34 111.31United States1 315.24 45.34 279.12 98.14 98.90 17.85 854.59North America 331.39 53.09 287.18 108.76 166.31 19.19 965.91
Australia 28.52 1.78 7.59 0 7.69 1.21 46.80Japan2, 3 41.43 65.33 58.86 45.91 46.39 4.27 262.18Korea 15.99 9.62 12.97 13.72 3.91 0.55 56.76New Zealand 0.31 0 2.33 0 5.26 0.71 8.61Pacific 86.25 76.73 81.76 59.62 63.25 6.75 374.36
Austria 1.90 0.32 3.50 0 11.55 0.39 17.66Belgium 2.07 0.30 5.38 5.74 1.42 0.63 15.53Czech Republic 10.87 0.06 0.59 1.76 2.15 0.03 15.44Denmark 5.21 1.89 2.68 0 0.01 2.98 12.77Finland 5.12 1.40 2.69 2.64 2.90 1.74 16.48France 12.75 10.46 3.28 63.18 25.03 0.81 115.51Germany 49.76 6.76 20.93 22.40 8.98 10.84 119.67Greece 4.52 2.00 1.11 0 3.08 0.29 10.99Hungary 2.01 0.95 3.50 1.87 0.05 0.02 8.39Ireland2 1.26 0.84 1.95 0 0.53 0.15 4.73Italy 6.82 20.05 26.72 0 20.43 2.08 76.09Luxembourg 0 0 0.07 0 1.14 0.02 1.23Netherlands 3.57 0.89 14.89 0.45 0.04 0.55 20.38Norway 0.08 0.01 0.04 0 28.13 0.16 28.42Portugal 1.78 2.85 1.37 0 4.56 0.44 10.99Spain 11.41 8.17 6.78 7.52 18.02 3.82 55.71Sweden 0.69 5.22 0.35 9.44 16.24 1.72 33.65Switzerland 0 0.13 0.33 3.20 13.24 0.37 17.26Turkey 6.99 2.48 7.15 0 11.67 0.04 28.33United Kingdom 33.43 5.72 22.61 12.49 4.30 1.26 79.80IEA Europe 160.20 70.48 125.91 130.67 173.45 28.33 689.04
IEA Total 577.84 200.29 494.84 299.05 403.01 54.27 2029.30
1. Capacity is net summer capacity.2. Only gross capacity data are available.3. Does not include autoproducer capacity.Source: Country submissions.
384
ANNEX A Energy Balances and Key Statistical Data Tables
Table A15
Electricity Generation in IEA Countries(GW net)
367-Annex A 2/12/03 11:22 Page 384

385
Energy Balances and Key Statistical Data Tables ANNEX A
Tota
l Ene
rgy
Oil
Prod
ucts
Elec
tric
ity
Gas
Coal
Resi
dent
ial/
Resi
dent
ial/
Resi
dent
ial/
Resi
dent
ial/
Resi
dent
ial/
Indu
stry
Com
mer
cial
Indu
stry
Com
mer
cial
Indu
stry
Com
mer
cial
Indu
stry
Com
mer
cial
Indu
stry
Com
mer
cial
Cana
da
3.2
–11.
2–1
.1–2
.3..
....
....
..U
nite
d St
ates
–1
1.9
–8.8
–5.9
–8.2
–2.4
–2.7
–20.
7–1
4.3
5.6
..
Aus
tral
ia
8.
9–3
.6..
–4.5
8.9
0.2
....
....
Japa
n
9.4
–0.9
–1.6
–2.3
....
....
26.8
..Ko
rea
21.2
..4.
0..
....
....
–1.1
..N
ew Z
eala
nd
3.9
–2.3
–5.1
–4.5
6.6
2.2
4.3
1.8
....
Aus
tria
–2
.1–3
.6–0
.1–5
.1..
–0.0
..–4
.0..
–0.3
Belg
ium
–0
.0–2
.5–5
.6–4
.4..
....
....
–0.4
Czec
h Re
publ
ic0.
5–0
.8–9
.1–1
1.6
0.8
7.8
–2.8
–0.3
3.8
6.9
Den
mar
k
4.
1–3
.3–0
.7..
9.5
–1.0
..–6
.1..
2.6
Finl
and
3.6
–1.7
–0.7
–4.5
8.9
3.0
–2.0
–14.
70.
7..
Fran
ce
–4.9
–1.8
–0.2
–3.9
0.7
–0.9
–12.
80.
8..
..G
erm
any
–1.5
–0.9
1.7
0.9
....
....
....
Gre
ece
–3
.9–4
.6–5
.4–5
.9–0
.90.
5..
....
..H
unga
ry10
.0–1
.215
.1–6
.07.
8–0
.59.
80.
3..
–0.6
Irela
nd
12.5
–7.5
5.8
–8.1
19.6
–8.6
23.1
–3.3
....
Ital
y
0.5
–2.6
5.8
–2.7
....
....
....
Luxe
mbo
urg
–5
.3–3
.8–5
.3–4
.6..
6.4
....
....
Net
herla
nds
–6
.11.
4–2
.5–3
.6..
–1.7
–7.9
4.6
....
Nor
way
–2
1.5
74.3
–1.8
–7.7
....
....
....
Port
ugal
–3.6
–5.8
–1.8
–7.2
–1.7
–1.1
....
–20.
5..
Spai
n
–6.4
–3.4
1.0
–2.1
....
–11.
2–9
.8..
..Sw
eden
–1
.0–3
.1–3
.9–3
.8..
....
....
..Sw
itzer
land
–5
.4–4
.6–3
.5–4
.9–1
.7–1
.3–1
2.1
–7.5
–16.
8..
Turk
ey
3.6
–2.4
19.6
2.6
–2.6
–4.2
–11.
7–1
0.9
2.6
4.1
Uni
ted
King
dom
–3.4
–0.6
–0.9
–5.0
–2.3
–1.2
–5.4
4.6
4.1
3.9
Sour
ce: E
nerg
y Pr
ices
and
Tax
es, I
EA/
OEC
D P
aris
, 200
3.
Tabl
eA1
6
Perc
ent
ag
e C
hang
e i
n Re
al E
nerg
y Pr
ice
s fo
r End
-use
rs i
n IE
A C
oun
trie
s,20
01-2
002
367-Annex A 2/12/03 11:22 Page 385
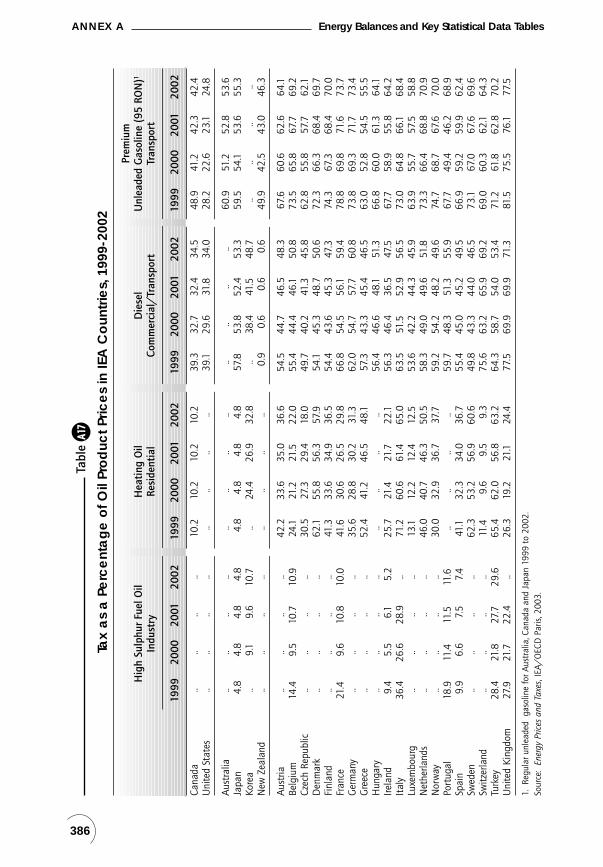
386
ANNEX A Energy Balances and Key Statistical Data Tables
Prem
ium
Hig
h Su
lphu
r Fu
el O
ilH
eati
ng O
ilD
iese
lU
nlea
ded
Gas
olin
e (9
5 RO
N)1
Indu
stry
Resi
dent
ial
Com
mer
cial
/Tr
ansp
ort
Tran
spor
t
1999
2000
2001
2002
1999
2000
2001
2002
1999
2000
2001
2002
1999
2000
2001
2002
Cana
da
....
....
10.2
10.2
10.2
10.2
39.3
32.7
32.4
34.5
48.9
41.2
42.3
42.4
Uni
ted
Stat
es
....
....
....
....
39.1
29.6
31.8
34.0
28.2
22.6
23.1
24.8
Aus
tral
ia
..
....
....
....
....
....
..60
.951
.252
.853
.6Ja
pan
4.
84.
84.
84.
84.
84.
84.
84.
857
.853
.852
.453
.359
.554
.153
.655
.3Ko
rea
..9.
19.
610
.7..
24.4
26.9
32.8
..38
.441
.548
.7..
....
..N
ew Z
eala
nd
....
....
....
....
0.9
0.6
0.6
0.6
49.9
42.5
43.0
46.3
Aus
tria
..
....
..42
.233
.635
.036
.654
.544
.746
.548
.367
.660
.662
.664
.1Be
lgiu
m
14.4
9.5
10.7
10.9
24.1
21.2
21.5
22.0
55.4
44.4
46.1
50.8
73.5
65.8
67.7
69.2
Czec
h Re
publ
ic..
....
..30
.527
.329
.418
.049
.740
.241
.345
.862
.855
.857
.762
.1D
enm
ark
....
....
62.1
55.8
56.3
57.9
54.1
45.3
48.7
50.6
72.3
66.3
68.4
69.7
Finl
and
....
....
41.3
33.6
34.9
36.5
54.4
43.6
45.3
47.3
74.3
67.3
68.4
70.0
Fran
ce
21.4
9.6
10.8
10.0
41.6
30.6
26.5
29.8
66.8
54.5
56.1
59.4
78.8
69.8
71.6
73.7
Ger
man
y
..
....
..35
.628
.830
.231
.362
.054
.757
.760
.873
.869
.371
.773
.4G
reec
e
....
....
52.4
41.2
46.5
48.1
57.3
43.3
45.4
46.5
63.0
52.8
54.5
55.5
Hun
gary
....
....
....
....
56.4
46.6
48.1
51.3
66.8
60.0
61.3
64.1
Irela
nd
9.4
5.5
6.1
5.2
25.7
21.4
21.7
22.1
56.3
46.4
36.5
47.5
67.7
58.9
55.8
64.2
Ital
y
36.4
26.6
28.9
..71
.260
.661
.465
.063
.551
.552
.956
.573
.064
.866
.168
.4Lu
xem
bour
g
....
....
13.1
12.2
12.4
12.5
53.6
42.2
44.3
45.9
63.9
55.7
57.5
58.8
Net
herla
nds
..
....
..46
.040
.746
.350
.558
.349
.049
.651
.873
.366
.468
.870
.9N
orw
ay
....
....
30.0
32.9
36.7
37.7
59.2
54.2
48.2
49.6
74.7
68.7
67.6
70.0
Port
ugal
18.9
11.4
11.5
11.6
....
....
59.7
48.3
51.3
55.9
67.7
49.4
46.2
68.9
Spai
n
9.9
6.6
7.5
7.4
41.1
32.3
34.0
36.7
55.4
45.0
45.2
49.5
66.9
59.2
59.9
62.4
Swed
en
....
....
62.3
53.2
56.9
60.6
49.8
43.3
44.0
46.5
73.1
67.0
67.6
69.6
Switz
erla
nd
....
....
11.4
9.6
9.5
9.3
75.6
63.2
65.9
69.2
69.0
60.3
62.1
64.3
Turk
ey
28.4
21.8
27.7
29.6
65.4
62.0
56.8
63.2
64.3
58.7
54.0
53.4
71.2
61.8
62.8
70.2
Uni
ted
King
dom
27.9
21.7
22.4
..26
.319
.221
.124
.477
.569
.969
.971
.381
.575
.576
.177
.5
1.Re
gula
r unl
eade
d g
asol
ine
for A
ustr
alia
, Can
ada
and
Japa
n 19
99 t
o 20
02.
Sour
ce:
Ener
gy P
rices
and
Tax
es, I
EA/
OEC
D P
aris
, 200
3.
Tabl
eA1
7
Tax
as
a P
erc
ent
ag
e o
f Oil
Pro
duc
t Pric
es
in IE
A C
oun
trie
s,19
99-2
002
367-Annex A 2/12/03 11:22 Page 386

387
Energy Balances and Key Statistical Data Tables ANNEX A
IEA
Tot
alIE
A N
orth
Am
eric
aIE
A P
acifi
cIE
A E
urop
e19
7319
7920
0020
0119
7319
7920
0020
0119
7319
7920
0020
0119
7319
7920
0020
01
SUPP
LYU
nit:
Mto
eTO
TAL
PRO
DU
CTIO
N22
79.6
2573
.535
09.8
3564
.616
53.5
1736
.120
49.9
2091
.010
8.3
139.
038
5.9
403.
751
7.8
698.
410
74.0
1069
.9Co
al1
714.
481
0.6
889.
793
6.9
345.
144
3.6
580.
061
1.0
66.1
70.3
168.
818
5.2
303.
229
6.6
140.
914
0.6
Oil
673.
772
3.5
870.
785
3.6
630.
258
1.7
494.
849
3.5
20.8
23.8
37.3
38.1
22.8
118.
033
8.7
322.
0G
as68
9.8
698.
987
1.3
892.
956
4.0
521.
859
6.2
613.
56.
09.
935
.836
.611
9.9
167.
223
9.3
242.
8Co
mb.
Ren
ewab
les
& W
aste
s270
.290
.816
1.7
160.
145
.359
.984
.481
.73.
54.
014
.213
.921
.426
.863
.164
.5N
ucle
ar49
.215
0.0
578.
559
0.0
27.3
80.3
226.
923
0.6
2.5
19.2
112.
311
2.6
19.3
50.6
239.
324
6.9
Hyd
ro76
.692
.310
9.4
102.
139
.645
.352
.645
.98.
110
.111
.410
.929
.037
.045
.445
.3G
eoth
erm
al5.
67.
422
.222
.52.
13.
513
.112
.91.
31.
75.
05.
32.
22.
24.
14.
3So
lar/
Win
d/O
ther
30.
00.
16.
36.
6–
–2.
01.
9–
0.0
1.11.1
0.0
0.0
3.2
3.6
TOTA
L N
ET IM
PORT
S413
32.6
1425
.214
99.2
1541
.425
3.8
374.
444
8.8
489.
630
7.7
338.
746
3.8
439.
777
1.2
712.
258
6.6
612.
2Co
al1
Expo
rts
84.1
113.
419
2.7
199.
538
.751
.558
.950
.918
.226
.711
7.6
127.
727
.235
.216
.220
.9Im
port
s11
4.4
144.
729
1.2
310.
911
.215
.524
.328
.841
.844
.413
4.5
138.
761
.484
.913
2.4
143.
5N
et Im
port
s30
.331
.398
.511
1.4
–27.
5–3
6.1
–34.
6–2
2.1
23.6
17.7
17.0
11.0
34.2
49.7
116.
212
2.6
Oil
Expo
rts
233.
125
1.9
706.
469
6.6
74.1
40.4
143.
514
3.4
7.3
4.2
69.5
73.7
151.
620
7.3
493.
547
9.5
Impo
rts
1596
.316
66.4
1976
.119
91.0
365.
347
1.9
655.
467
7.5
308.
132
3.1
456.
744
1.3
923.
087
1.4
864.
087
2.2
Bunk
ers
71.0
74.0
85.0
76.6
9.2
26.0
29.2
20.6
19.4
14.5
12.0
11.0
42.3
33.6
43.8
45.0
Net
Impo
rts
1292
.313
40.5
1184
.712
17.9
281.
940
5.5
482.
851
3.5
281.
330
4.4
375.
235
6.6
729.
063
0.6
326.
734
7.8
Gas
Expo
rts
50.3
82.5
188.
520
5.0
24.9
24.0
88.2
97.1
––
9.3
8.8
25.5
58.5
91.1
99.1
Impo
rts
60.0
135.
340
3.0
414.
924
.229
.089
.195
.52.
816
.780
.980
.933
.089
.623
3.0
238.
4N
et Im
port
s9.
752
.821
4.4
209.
8–0
.75.
00.
9–1
.62.
816
.771
.672
.17.
531
.114
2.0
139.
3El
ectri
city
Expo
rts
6.7
10.3
27.6
26.5
1.6
2.9
5.6
4.9
––
––
5.0
7.4
22.0
21.6
Impo
rts
7.110
.928
.628
.41.
62.
95.
54.
7–
––
–5.
48.
123
.123
.7N
et Im
port
s0.
40.
61.
01.
90.
0–0
.0–0
.1–0
.2–
––
–0.
40.
71.1
2.2
TOTA
L ST
OCK
CH
AN
GES
–19.
5–5
5.4
45.9
–38.
1–9
.8–3
8.5
56.0
–51.
0–4
.8–5
.3–6
.56.
0–4
.8–1
1.6
–3.6
6.8
TOTA
L SU
PPLY
(TPE
S)35
92.7
3943
.450
54.9
5067
.918
97.4
2072
.025
54.8
2529
.641
1.1
472.
484
3.2
849.
412
84.2
1399
.016
57.0
1688
.9Co
al1
758.
982
8.6
1020
.510
39.2
326.
338
6.8
572.
657
5.4
89.8
89.0
183.
719
9.9
342.
735
2.8
264.
226
4.0
Oil
1944
.220
30.5
2050
.020
60.5
905.
097
5.6
980.
499
2.5
297.
232
2.0
408.
239
6.7
742.
073
2.8
661.
467
1.3
Gas
687.
574
3.0
1104
.710
84.7
551.
852
0.6
623.
058
8.9
8.7
26.4
107.
210
9.1
127.
019
5.9
374.
538
6.6
Com
b. R
enew
able
s &
Was
tes2
70.3
90.9
162.
316
0.4
45.3
59.9
84.4
81.7
3.5
4.0
14.2
13.9
21.4
26.9
63.7
64.8
Nuc
lear
49.2
150.
057
8.5
590.
027
.380
.322
6.9
230.
62.
519
.211
2.3
112.
619
.350
.623
9.3
246.
9H
ydro
76.6
92.3
109.
410
2.1
39.6
45.3
52.6
45.9
8.1
10.1
11.4
10.9
29.0
37.0
45.4
45.3
Geo
ther
mal
5.6
7.4
22.2
22.5
2.1
3.5
13.1
12.9
1.3
1.7
5.0
5.3
2.2
2.2
4.1
4.3
Sola
r/W
ind/
Oth
er3
0.0
0.1
6.3
6.6
––
2.0
1.9
–0.
01.1
1.10.
00.
03.
23.
6El
ectri
city
Tra
de5
0.4
0.7
1.0
1.9
0.0
–0.0
–0.1
–0.2
––
––
0.4
0.7
1.12.
2
Tabl
eA1
8
Ene
rgy
Bala
nce
s a
nd K
ey S
tatis
tica
l Da
ta fo
r IEA
and
Re
gio
ns
367-Annex A 2/12/03 11:22 Page 387

388
ANNEX A Energy Balances and Key Statistical Data Tables
IEA
Tot
alIE
A N
orth
Am
eric
aIE
A P
acifi
cIE
A E
urop
e19
7319
7920
0020
0119
7319
7920
0020
0119
7319
7920
0020
0119
7319
7920
0020
01
SUPP
LYU
nit:
Mto
eFu
el S
hare
s (%
)Co
al21
.121
.020
.220
.517
.218
.722
.422
.721
.918
.821
.823
.526
.725
.215
.915
.6O
il54
.151
.540
.640
.747
.747
.138
.439
.272
.368
.248
.446
.757
.852
.439
.939
.7Ga
s19
.118
.821
.921
.429
.125
.124
.423
.32.
15.
612
.712
.89.
914
.022
.622
.9Co
mb.
Ren
ewab
les
& W
aste
s2.
02.
33.
23.
22.
42.
93.
33.
20.
90.
91.
71.
61.
71.
93.
83.
8N
ucle
ar1.
43.
811
.411
.61.
43.
98.
99.
10.
64.
113
.313
.31.
53.
614
.414
.6H
ydro
2.1
2.3
2.2
2.0
2.1
2.2
2.1
1.8
2.0
2.1
1.4
1.3
2.3
2.6
2.7
2.7
Geot
herm
al0.
20.
20.
40.
40.
10.
20.
50.
50.
30.
40.
60.
60.
20.
20.
20.
3So
lar/
Win
d/O
ther
–
–0.
10.
1–
–0.
10.
1–
–0.
10.
1–
–0.
20.
2El
ectri
city
Tra
de–
––
––
––
––
––
––
–0.
10.
1
DEM
AN
DU
nit:
Mto
e
FIN
AL
CON
SUM
PTIO
N B
Y SE
CTO
R
TFC
2643
.928
40.3
3510
.934
90.8
1379
.114
60.6
1762
.617
25.6
297.
833
2.2
559.
555
9.1
966.
910
47.6
1188
.712
06.1
Coal
122
4.3
201.
511
4.5
110.
249
.445
.834
.935
.232
.533
.133
.132
.714
2.5
122.
646
.642
.3O
il15
75.1
1654
.618
39.5
1851
.377
8.7
835.
789
8.5
906.
920
9.6
225.
135
0.1
346.
758
6.8
593.
959
0.9
597.
7G
as47
5.4
519.
371
3.6
693.
736
5.0
347.
541
3.0
383.
99.
514
.345
.547
.010
0.8
157.
525
5.1
262.
8Co
mb.
Ren
ewab
les
& W
aste
s247
.261
.311
5.1
112.
423
.633
.861
.158
.73.
53.
88.
27.
820
.023
.745
.746
.0G
eoth
erm
al0.
00.
11.
92.
0–
–0.
50.
6–
–0.
30.
30.
00.
11.1
1.1So
lar/
Win
d/O
ther
–0.
03.
03.
0–
–1.
41.
4–
0.0
0.9
0.9
–0.
00.
70.
7El
ectri
city
314.
238
9.3
682.
567
4.7
162.
319
6.8
342.
332
8.6
42.7
55.7
118.
611
9.0
109.
213
6.9
221.
522
7.1H
eat
7.6
14.2
40.7
43.5
0.1
1.0
10.8
10.4
0.0
0.1
2.6
4.7
7.5
13.0
27.3
28.4
Fuel
Sha
res
(%)
Coal
8.
57.1
3.3
3.2
3.6
3.1
2.0
2.0
10.9
10.0
5.9
5.8
14.7
11.7
3.9
3.5
Oil
59.6
58.3
52.4
53.0
56.5
57.2
51.0
52.6
70.4
67.8
62.6
62.0
60.7
56.7
49.7
49.6
Gas
18.0
18.3
20.3
19.9
26.5
23.8
23.4
22.2
3.2
4.3
8.1
8.4
10.4
15.0
21.5
21.8
Com
b. R
enew
able
s &
Was
tes
1.8
2.2
3.3
3.2
1.7
2.3
3.5
3.4
1.2
1.2
1.5
1.4
2.1
2.3
3.8
3.8
Geot
herm
al–
–0.
10.
1–
––
––
–0.
10.
1–
–0.
10.
1So
lar/
Win
d/O
ther
––
0.1
0.1
––
0.1
0.1
––
0.2
0.2
––
0.1
0.1
Elec
trici
ty11
.913
.719
.419
.311
.813
.519
.419
.014
.316
.821
.221
.311
.313
.118
.618
.8H
eat
0.3
0.5
1.2
1.2
–0.
10.
60.
6–
–0.
50.
80.
81.
22.
32.
4
Tabl
eA1
8(c
onti
nued
)
Ene
rgy
Bala
nce
s a
nd K
ey S
tatis
tica
l Da
ta fo
r IEA
and
Re
gio
ns
367-Annex A 2/12/03 11:22 Page 388

389
Energy Balances and Key Statistical Data Tables ANNEX A
IEA
Tot
alIE
A N
orth
Am
eric
aIE
A P
acifi
cIE
A E
urop
e19
7319
7920
0020
0119
7319
7920
0020
0119
7319
7920
0020
0119
7319
7920
0020
01
DEM
AN
DU
nit:
Mto
e
TOTA
L IN
DU
STRY
610
46.0
1084
.911
98.0
1167
.145
8.4
488.
856
2.0
542.
116
7.4
168.
023
1.9
227.1
420.
242
8.1
404.
139
8.0
Coal
113
9.2
126.
110
3.4
99.0
35.2
31.3
32.6
32.7
23.9
24.0
32.0
31.8
80.1
70.7
38.7
34.5
Oil
513.
153
5.1
444.
344
5.3
182.
422
9.7
182.
018
9.9
109.
810
1.6
119.
811
3.7
221.
020
3.7
142.
514
1.7
Gas
220.
921
8.4
305.
228
6.1
163.
213
5.9
178.
415
9.5
3.9
6.0
21.1
22.0
53.9
76.5
105.
810
4.6
Com
b. R
enew
able
s &
Was
tes2
18.0
20.8
66.3
63.8
12.9
13.7
44.5
42.8
1.5
2.1
6.0
5.5
3.6
4.9
15.7
15.4
Geo
ther
mal
––
0.4
0.4
––
0.1
0.1
––
0.3
0.3
––
0.0
0.0
Sola
r/W
ind/
Oth
er–
–0.
10.
1–
––
––
––
––
–0.
10.
1El
ectri
city
152.
218
0.2
263.
225
5.5
64.6
77.2
115.
710
8.5
28.3
34.2
52.7
52.0
59.3
68.9
94.9
95.0
Hea
t2.
54.
415
.116
.90.
11.
08.
78.
5–
––
1.8
2.5
3.4
6.4
6.7
Fuel
Sha
res
(%)
Coal
13.3
11.6
8.6
8.5
7.7
6.4
5.8
6.0
14.3
14.3
13.8
14.0
19.0
16.5
9.6
8.7
Oil
49.1
49.3
37.1
38.2
39.8
47.0
32.4
35.0
65.6
60.5
51.7
50.1
52.6
47.6
35.3
35.6
Gas
21.1
20.1
25.5
24.5
35.6
27.8
31.7
29.4
2.3
3.6
9.1
9.7
12.8
17.9
26.2
26.3
Com
b. R
enew
able
s &
Was
tes
1.7
1.9
5.5
5.5
2.8
2.8
7.9
7.9
0.9
1.3
2.6
2.4
0.9
1.2
3.9
3.9
Geot
herm
al–
––
––
––
––
–0.
10.
1–
––
–So
lar/
Win
d/O
ther
––
––
––
––
––
––
––
––
Elec
trici
ty14
.616
.622
.021
.914
.115
.820
.620
.016
.920
.322
.722
.914
.116
.123
.523
.9H
eat
0.2
0.4
1.3
1.5
–0.
21.
51.
6–
––
0.8
0.6
0.8
1.6
1.7
TRA
NSP
ORT
769
7.5
796.
011
72.6
1174
.045
5.8
498.
766
3.5
661.
960
.980
.315
8.2
160.
518
0.9
217.
035
0.8
351.
6
TOTA
L O
THER
SEC
TORS
890
0.3
959.
411
40.3
1149
.746
4.9
473.
153
7.152
1.7
69.6
83.9
169.
417
1.6
365.
840
2.5
433.
845
6.5
Coal
181
.574
.511
.111
.114
.014
.52.
32.
58.
39.
11.
00.
859
.250
.97.
87.
8O
il39
0.0
346.
225
4.5
263.
615
8.1
123.
675
.476
.840
.544
.674
.575
.019
1.4
178.
010
4.6
111.
9G
as23
7.5
284.
738
7.5
387.
218
5.0
195.
721
4.7
205.
25.
78.
324
.224
.746
.880
.714
8.6
157.
3Co
mb.
Ren
ewab
les
& W
aste
s229
.240
.546
.646
.310
.820
.115
.014
.12.
01.
72.
22.
216
.418
.729
.529
.9G
eoth
erm
al0.
00.
11.
51.
6–
–0.
40.
4–
–0.
10.
10.
00.
11.1
1.1So
lar/
Win
d/O
ther
–0.
02.
92.
9–
–1.
41.
4–
0.0
0.9
0.9
–0.
00.
60.
6El
ectri
city
157.1
203.
741
0.5
410.
497
.011
9.2
225.
921
9.3
13.2
20.1
64.0
65.0
46.8
64.5
120.
712
6.1
Hea
t5.
09.
825
.626
.6–
0.0
2.1
2.0
0.0
0.1
2.6
2.9
5.0
9.7
20.9
21.7
Tabl
eA1
8(c
onti
nued
)
Ene
rgy
Bala
nce
s a
nd K
ey S
tatis
tica
l Da
ta fo
r IEA
and
Re
gio
ns
367-Annex A 2/12/03 11:22 Page 389

390
ANNEX A Energy Balances and Key Statistical Data Tables
IEA
Tot
alIE
A N
orth
Am
eric
aIE
A P
acifi
cIE
A E
urop
e19
7319
7920
0020
0119
7319
7920
0020
0119
7319
7920
0020
0119
7319
7920
0020
01
DEM
AN
DU
nit:
Mto
eFu
el S
hare
s (%
)Co
al
9.1
7.8
1.0
1.0
3.0
3.1
0.4
0.5
11.9
10.8
0.6
0.5
16.2
12.6
1.8
1.7
Oil
43.3
36.1
22.3
22.9
34.0
26.1
14.0
14.7
58.1
53.2
44.0
43.7
52.3
44.2
24.1
24.5
Gas
26.4
29.7
34.0
33.7
39.8
41.4
40.0
39.3
8.1
9.9
14.3
14.4
12.8
20.0
34.3
34.5
Com
b. R
enew
able
s &
Was
tes
3.2
4.2
4.1
4.0
2.3
4.3
2.8
2.7
2.9
2.0
1.3
1.3
4.5
4.7
6.8
6.5
Geot
herm
al–
–0.
10.
1–
–0.
10.
1–
––
––
–0.
20.
2So
lar/
Win
d/O
ther
––
0.3
0.2
––
0.3
0.3
––
0.6
0.5
––
0.1
0.1
Elec
trici
ty17
.421
.236
.035
.720
.925
.242
.142
.018
.924
.037
.837
.912
.816
.027
.827
.6H
eat
0.6
1.0
2.2
2.3
––
0.4
0.4
–0.
11.
61.
71.
42.
44.
84.
8
ENER
GY
TRA
NSF
ORM
ATIO
N A
ND
LO
SSES
ELEC
TRIC
ITY
GEN
ERAT
ION
9
INPU
T (M
toe)
983.
612
07.7
1998
.320
23.6
543.
364
9.8
1020
.210
19.4
113.
115
2.5
340.
235
2.2
327.
240
5.4
638.
065
1.9
OU
TPU
T (M
toe)
371.
445
9.1
792.
278
2.4
192.
323
3.8
398.
338
2.8
48.4
63.1
134.
813
5.1
130.
716
2.2
259.
126
4.4
(TW
h gr
oss)
4318
.453
38.4
9211
.790
97.3
2235
.627
18.8
4630
.944
51.7
563.
273
3.7
1567
.515
71.5
1519
.718
85.9
3013
.330
74.1
Out
put
Shar
es (
%)
Coal
37.2
37.8
38.4
37.7
42.1
43.3
48.5
47.2
15.7
15.7
30.9
33.1
37.9
38.5
26.7
26.4
Oil
25.6
19.7
5.3
5.1
15.4
12.5
2.9
3.4
63.2
46.9
11.1
9.2
26.6
19.5
5.9
5.6
Gas
11.9
11.2
16.3
16.9
17.0
13.4
14.4
15.3
2.4
11.0
20.6
20.7
7.8
8.2
16.8
17.3
Com
b. R
enew
able
s &
Was
tes
0.2
0.2
1.6
1.5
0.0
0.1
1.7
1.7
0.1
0.1
1.0
0.6
0.4
0.5
1.6
1.7
Nuc
lear
4.4
10.7
24.1
24.9
4.7
11.2
18.8
19.9
1.7
10.0
27.5
27.5
4.9
10.3
30.5
30.8
Hyd
ro20
.620
.113
.813
.020
.619
.413
.212
.016
.716
.08.
58.
022
.222
.817
.517
.1Ge
othe
rmal
0.1
0.2
0.3
0.3
0.1
0.2
0.3
0.3
0.3
0.3
0.4
0.4
0.2
0.1
0.2
0.2
Sola
r/W
ind/
Oth
er0.
00.
00.
30.
4–
–0.
10.
2–
0.0
0.1
0.1
0.0
0.0
0.8
0.9
TOTA
L LO
SSES
(Mto
e)96
4.5
1102
.615
41.1
1569
.752
9.2
605.
878
7.2
798.
611
8.8
142.
228
0.2
287.
531
6.5
354.
747
3.7
483.
5of
whi
ch:
Elec
tricit
y an
d H
eat G
ener
atio
n1060
3.5
733.
011
57.8
1189
.435
1.0
415.
060
6.7
621.
964
.689
.220
2.1
211.
218
7.9
228.
934
8.9
356.
3O
ther
Tra
nsfo
rmat
ion
80.4
96.0
55.5
56.3
1.3
33.4
0.5
1.3
32.1
25.0
33.8
32.6
47.1
37.6
21.2
22.5
Ow
n U
se a
nd L
osse
s1128
0.5
273.
732
7.8
323.
917
6.9
157.
418
0.0
175.
422
.228
.144
.343
.881
.588
.210
3.5
104.
8
Stat
istic
al D
iffer
ence
s–1
5.6
0.4
3.0
7.4
–10.
95.
65.
05.
4–5
.5–1
.93.
52.
80.
8–3
.3–5
.4–0
.8
Tabl
eA1
8(c
onti
nued
)
Ene
rgy
Bala
nce
s a
nd K
ey S
tatis
tica
l Da
ta fo
r IEA
and
Re
gio
ns
367-Annex A 2/12/03 11:22 Page 390

391
Energy Balances and Key Statistical Data Tables ANNEX A
IEA
Tot
alIE
A N
orth
Am
eric
aIE
A P
acifi
cIE
A E
urop
e19
7319
7920
0020
0119
7319
7920
0020
0119
7319
7920
0020
0119
7319
7920
0020
01
IND
ICAT
ORS
Uni
t: M
toe
GD
P (b
illio
n 19
95 U
S$)
1307
815
529
2713
427
311
4324
5185
9662
9695
2952
3638
6820
6826
5802
6707
1065
210
790
Popu
latio
n (m
illio
ns)
811
851
981
995
234
249
306
317
159
171
197
198
417
430
478
480
TPES
/GD
P120.
270.
250.
190.
190.
440.
400.
260.
260.
140.
130.
120.
120.
220.
210.
160.
16En
ergy
Pro
duct
ion/
TPES
0.63
0.65
0.69
0.70
0.87
0.84
0.80
0.83
0.26
0.29
0.46
0.48
0.40
0.50
0.65
0.63
Per C
apita
TPE
S134.
434.
645.
155.
098.
098.
318.
347.
982.
582.
764.
284.
293.
083.
253.
473.
52O
il Su
pply
/GD
P120.
150.
130.
080.
080.
210.
190.
100.
100.
100.
090.
060.
060.
130.
110.
060.
06TF
C/G
DP12
0.20
0.18
0.13
0.13
0.32
0.28
0.18
0.18
0.10
0.09
0.08
0.08
0.17
0.16
0.11
0.11
Per C
apita
TFC
133.
263.
343.
583.
515.
885.
865.
765.
441.
871.
942.
842.
832.
322.
442.
492.
51En
ergy
–rel
ated
CO
2
Emiss
ions
(Mt C
O2)14
9836
.74
1036
9.10
1175
5.50
1181
8.04
5079
.05
5298
.77
6218
.25
6192
.76
1131
.93
1249
.33
1932
.1919
70.5
936
25.7
638
21.0
036
05.0
636
54.6
9CO
2Em
issio
ns fr
omBu
nker
s (M
t CO
2)29
9.42
312.
9747
7.03
444.
5051
.53
105.
1915
2.78
119.
9869
.58
53.3
268
.45
65.6
717
8.31
154.
4625
5.80
258.
85
GRO
WTH
RAT
ES (
% p
er y
ear)
Uni
t: M
toe
73-7
979
-01
91-0
100
-01
73-7
979
-01
91-0
100
-01
73-7
979
-01
91-0
100
-01
73-7
979
-01
91-0
100
-01
TPES
1.6
1.2
1.6
0.3
1.5
1.0
1.6
–1.0
2.3
2.8
2.8
0.7
1.4
0.9
1.0
1.9
Coal
1.5
1.10.
81.
82.
91.
91.
90.
5–0
.23.
93.
78.
80.
5–1
.4–2
.5–0
.1O
il0.
70.
11.
40.
51.
30.
11.
81.
21.
31.
01.
4–2
.8–0
.2–0
.40.
71.
5G
as1.
31.
82.
5–1
.8–1
.00.
61.
4–5
.520
.37.
04.
91.
87.
53.
34.
03.
2Co
mb.
Ren
ewab
les
& W
aste
s4.
42.
71.
8–1
.14.
81.
51.
0–3
.22.
36.
13.
9–1
.83.
94.
32.
41.
7N
ucle
ar20
.46.
72.
32.
019
.75.
21.
91.
640
.18.
84.
80.
217
.47.
81.
83.
2H
ydro
3.2
0.5
0.1
–6.7
2.3
0.1
–1.1
–12.
63.
80.
4–1
.0–4
.94.
11.
02.
0–0
.3G
eoth
erm
al4.
95.
40.
60.
99.
06.
4–1
.1–1
.54.
75.
54.
95.
00.
23.
21.
83.
7So
lar/
Win
d/O
ther
7.2
23.7
23.6
7.3
––
20.6
–2.8
–18
.923
.9–2
.0–1
.422
.925
.618
.1
TFC
1.2
1.0
1.6
–0.6
1.0
0.8
1.8
–2.1
1.8
2.5
2.4
–0.1
1.3
0.7
1.0
1.5
Elec
trici
ty C
onsu
mpt
ion
3.6
2.7
2.1
–1.1
3.3
2.5
1.8
–4.0
4.5
3.7
2.9
0.3
3.8
2.4
2.1
2.5
Ener
gy P
rodu
ctio
n2.
01.
61.
31.
60.
80.
90.
82.
04.
35.
23.
94.
65.
12.
11.
3–0
.4N
et O
il Im
port
s0.
6–0
.51.
92.
86.
21.1
5.6
6.4
1.3
0.8
1.2
–5.0
–2.4
–2.8
–1.4
6.4
GD
P2.
92.
72.
40.
73.
13.
03.
30.
33.
53.
01.
60.
12.
42.
32.
11.
3G
row
th in
the
TPES
/GD
P Ra
tio–1
.3–1
.5–0
.7–0
.4–1
.5–2
.0–1
.6–1
.3–1
.2–0
.21.
20.
7–1
.0–1
.4–1
.00.
6G
row
th in
the
TFC/
GD
P Ra
tio–1
.7–1
.7–0
.7–1
.2–2
.0–2
.2–1
.5–2
.4–1
.7–0
.50.
8–0
.2–1
.1–1
.6–1
.00.
2
Tabl
eA1
8(c
onti
nued
)
Ene
rgy
Bala
nce
s a
nd K
ey S
tatis
tica
l Da
ta fo
r IEA
and
Re
gio
ns
367-Annex A 2/12/03 11:22 Page 391

Tabl
e A
18 (F
ootn
otes
)
1.In
clud
es li
gnite
and
pea
t, ex
cept
for F
inla
nd, I
rela
nd a
nd S
wed
en.
In t
hese
thr
ee c
ases
, pea
t is
sho
wn
sepa
rate
ly.
2.Co
mpr
ises
sol
id b
iom
ass,
liqui
d bi
omas
s, bi
ogas
, ind
ustr
ial w
aste
and
mun
icip
al w
aste
. D
ata
are
ofte
n ba
sed
on p
artia
l sur
veys
and
may
not
be
com
para
ble
betw
een
coun
trie
s.3.
Oth
er in
clud
es t
ide,
wav
e an
d am
bien
t he
at u
sed
in h
eat
pum
ps.
4.To
tal n
et im
port
s in
clud
e co
mbu
stib
le re
new
able
s an
d w
aste
s.5.
Tota
l sup
ply
of e
lect
ricity
repr
esen
ts n
et t
rade
. A
neg
ativ
e nu
mbe
r ind
icat
es t
hat
expo
rts
are
grea
ter t
han
impo
rts.
6.In
clud
es n
on-e
nerg
y us
e.7.
Incl
udes
less
tha
n 1%
non
-oil
fuel
s.8.
Incl
udes
resi
dent
ial,
com
mer
cial
, pub
lic s
ervi
ce a
nd a
gric
ultu
ral s
ecto
rs.
9.In
puts
to
elec
tric
ity g
ener
atio
n in
clud
e in
puts
to
elec
tric
ity, C
HP
and
heat
pla
nts.
Out
put
refe
rs o
nly
to e
lect
ricity
gen
erat
ion.
10.
Loss
es a
risin
g in
the
prod
uctio
n of
ele
ctric
ity a
nd h
eat a
t pub
lic u
tiliti
es a
nd a
utop
rodu
cers
. For
non
-foss
il-fu
el e
lect
ricity
gen
erat
ion,
theo
retic
al lo
sses
are
sho
wn
base
d on
pla
nt e
ffic
ienc
ies
of 3
3% fo
rnu
clea
r, 10
% fo
r geo
ther
mal
and
100
% fo
r hyd
ro.
11.
Dat
a on
“lo
sses
” fo
r for
ecas
t ye
ars
ofte
n in
clud
e la
rge
stat
istic
al d
iffer
ence
s co
verin
g d
iffer
ence
s be
twee
n ex
pect
ed s
uppl
y an
d de
man
d an
d m
ostly
do
not
refle
ct re
al e
xpec
tatio
ns o
n tr
ansf
orm
atio
nga
ins
and
loss
es.
12.
Toe
per t
hous
and
US
dolla
rs a
t 19
95 p
rices
and
exc
hang
e ra
tes.
13.
Toe
per p
erso
n.14
.“E
nerg
y-re
late
d CO
2em
issi
ons”
hav
e be
en e
stim
ated
usi
ng th
e IP
CC T
ier I
Sec
tora
l App
roac
h. I
n ac
cord
ance
with
the
IPCC
met
hodo
logy
, em
issi
ons
from
inte
rnat
iona
l mar
ine
and
avia
tion
bunk
ers
are
not
incl
uded
in n
atio
nal t
otal
s. Pr
ojec
ted
emis
sion
s fo
r oi
l and
gas
are
der
ived
by
calc
ulat
ing
the
ratio
of
emis
sion
s to
ene
rgy
use
for
2001
and
app
lyin
g th
is f
acto
r to
for
ecas
t en
ergy
sup
ply.
Fut
ure
coal
em
issi
ons
are
base
d on
pro
duct
-spec
ific
supp
ly p
roje
ctio
ns a
nd a
re c
alcu
late
d us
ing
the
IPCC
/O
ECD
em
issi
on fa
ctor
s an
d m
etho
dolo
gy.
e =
estim
ate.
392
ANNEX A Energy Balances and Key Statistical Data Tables
367-Annex A 2/12/03 11:22 Page 392

ANNEX B
GOVERNMENT ENERGY R&D BUDGETS
393-Annex B 2/12/03 11:25 Page 393

1991
1992
1993
1994
1995
1996
1997
1998
1999
2000
2001
2002
e
Cana
da1
362.
436
7.6
315.
732
2.0
322.
030
0.6
265.
924
9.6
248.
626
6.5
293.
229
8.4
Uni
ted
Stat
es2
598.
42
261.
72
264.
02
441.
62
409.
12
149.
91
965.
72
024.
62
293.
82
266.
72
814.
42
847.
3
Aus
tral
ia..
..11
0.4
..11
6.3
..15
7.6
....
....
..Ja
pan
383.
039
2.9
404.
743
3.9
445.
745
9.1
437.
744
1.8
433.
243
6.3
433.
5..
Kore
a..
....
....
....
....
....
..N
ew Z
eala
nd2.
0..
4.7
3.8
4.4
5.3
5.1
6.4
6.1
6.4
8.9
10.1
Aus
tria
17.8
15.3
20.8
23.6
24.1
24.3
25.7
27.4
26.5
....
..Be
lgiu
m2
8.9
9.6
16.6
17.4
43.8
56.4
54.5
70.4
49.7
....
..Cz
ech
Repu
blic
....
....
....
....
....
....
Den
mar
k26
2.0
310.
030
2.0
259.
024
5.1
217.
625
8.3
316.
231
2.6
327.1
328.
015
9.6
Finl
and
36.1
38.3
39.8
48.2
58.2
56.1
79.4
81.9
77.6
65.5
62.6
..Fr
ance
466.
344
4.3
448.
942
4.3
501.
948
3.2
488.
252
7.161
7.158
6.7
441.
640
3.5
Ger
man
y344
1.2
363.
136
6.0
300.
026
2.2
285.
025
9.2
280.
118
7.7
268.
629
2.5
278.
0G
reec
e4.
63.
53.
33.
36.
17.
514
.3..
..5.
77.
08.
8H
unga
ry..
....
..44
.610
.5..
122.
086
.138
9.6
350.
974
0.6
Irela
nd..
....
....
....
....
....
3.7
Ital
y40
7.3
..22
9.7
225.
424
3.8
237.
822
1.9
222.
1..
262.
728
3.0
286.
6Lu
xem
bour
g4–
––
––
––
––
––
–N
ethe
rland
s13
8.0
136.
015
3.6
165.
912
1.2
127.1
144.
913
7.3
139.
812
6.3
172.
3..
Nor
way
368.
539
1.9
366.
535
5.7
304.
428
8.3
281.
827
7.4
371.
637
0.0
384.
538
7.9
Port
ugal
5.1
4.7
3.2
2.7
1.4
1.7
1.2
1.6
2.0
1.5
1.0
2.6
Spai
n78
.066
.058
.064
.160
.059
.360
.347
.450
.049
.349
.750
.8Sw
eden
567.
071
4.1
553.
159
8.0
452.
941
3.1
467.
044
0.0
590.
064
6.5
763.
1..
Switz
erla
nd19
9.0
220.
622
3.3
220.
821
5.1
206.
719
6.9
182.
617
9.9
166.
817
2.8
180.
0Tu
rkey
59.
723
.641
.242
.118
9.1
274.
81
608.
91
387.
81
406.
32
730.
69
661.
923
107
.5U
nite
d Ki
ngdo
m14
2.9
133.
598
.850
.952
.936
.449
.343
.842
.848
.030
.438
.1Eu
rope
an C
omm
issi
on6
....
....
....
....
....
....
1.A
ll da
ta re
fer t
o th
e fis
cal y
ear,
Apr
il 20
02 t
o M
arch
200
3 fo
r 200
2.2.
Figu
re fo
r 199
1 re
fers
to
Wal
loni
a on
ly.
From
199
1 to
199
4, n
ucle
ar d
ata
are
not
avai
labl
e an
d th
eref
ore
are
not
incl
uded
in t
he b
udge
t.3.
Dat
a do
not
incl
ude
the
new
Län
der o
f Ger
man
y pr
ior t
o 19
92.
4.Lu
xem
bour
g ha
s no
ene
rgy
R&D
pro
gram
me.
5.Th
e st
rong
incr
ease
in t
he b
udge
t is
due
to
high
infla
tion
rate
in T
urke
y an
d to
new
RD
&D
act
iviti
es.
6.N
o in
form
atio
n on
R&
D b
udge
ts h
as b
een
prov
ided
by
the
Euro
pean
Com
mis
sion
.N
ote:
Bud
gets
pro
vide
d fo
r rec
ent
year
s by
som
e co
untr
ies
may
hav
e be
en e
stim
ated
.So
urce
: Cou
ntry
sub
mis
sion
s.
394
ANNEX B Government Energy R&D Budgets
Tabl
eB1
IEA
Gov
ern
me
nt R
&D
Bud
ge
ts in
Na
tiona
l Cur
renc
ies
(mill
ion
s e
xce
pt
for
Jap
an
ese
an
d T
urk
ish c
urr
en
cie
s.w
hic
h a
re in
bill
ion
s)
393-Annex B 2/12/03 11:25 Page 394

1991
1992
1993
1994
1995
1996
1997
1998
1999
2000
2001
2002
e
Cana
da1
425.
442
5.9
360.
736
3.7
355.
832
6.7
285.
626
9.2
263.
927
2.1
296.
229
8.4
Uni
ted
Stat
es3
203.
82
724.
92
663.
82
813.
02
716.
12
377.
82
133.
52
169.
82
423.
12
345.
22
845.
32
847.
3
Aus
tral
ia..
..13
1.7
..13
5.7
..17
6.6
....
....
..Ja
pan
367.
037
0.0
378.
940
5.8
418.
543
4.6
412.
641
7.0
414.
642
6.8
428.
9..
Kore
a..
....
....
....
....
....
..N
ew Z
eala
nd2.
4..
5.4
4.4
4.9
5.8
5.6
6.8
6.6
6.8
8.9
10.1
Aus
tria
21.5
17.9
23.7
26.1
26.0
25.9
27.1
28.7
27.6
....
..Be
lgiu
m2
11.1
11.6
19.3
19.8
49.0
62.5
59.6
75.7
52.8
....
..Cz
ech
Repu
blic
....
....
....
....
....
....
Den
mar
k33
2.2
381.
936
7.0
309.
328
7.7
249.
228
9.6
350.
933
7.9
341.
033
2.8
159.
6Fi
nlan
d44
.446
.747
.356
.365
.363
.187
.587
.683
.268
.463
.5..
Fran
ce54
4.9
509.
350
2.4
466.
654
2.6
515.
151
3.9
550.
064
0.8
605.
844
9.5
403.
5G
erm
any3
534.
241
8.6
407.
032
5.4
278.
729
9.9
271.
028
9.6
193.
127
6.9
297.
327
8.0
Gre
ece
10.2
6.8
5.5
5.0
8.4
9.6
17.1
....
6.1
7.2
8.8
Hun
gary
....
....
101.
419
.7..
171.
411
1.6
460.
038
0.5
740.
6Ire
land
....
....
....
....
....
..3.
7It
aly
580.
9..
301.
628
6.0
294.
527
2.9
248.
624
2.3
..27
5.9
289.
728
6.6
Luxe
mbo
urg4
––
––
––
––
––
––
Net
herla
nds
181.
917
5.3
194.
120
4.9
147.
015
2.3
170.
315
8.6
159.
013
8.0
178.
8..
Nor
way
516.
455
1.2
504.
649
0.9
407.
236
9.8
350.
834
7.9
438.
537
6.4
384.
538
7.9
Port
ugal
8.7
7.2
4.6
3.6
1.7
2.2
1.4
1.9
2.2
1.6
1.0
2.6
Spai
n11
7.5
93.1
78.4
83.2
74.3
70.9
70.5
54.1
55.5
52.9
51.2
50.8
Swed
en68
7.3
857.1
646.
368
2.8
499.
544
9.4
499.
146
6.2
621.
067
4.0
779.
4..
Switz
erla
nd22
8.1
246.
124
2.7
235.
922
7.5
217.
620
7.8
192.
718
8.6
172.
717
6.6
180.
0Tu
rkey
3 25
2.5
4 83
7.5
5 03
1.1
2 49
2.1
5 98
1.5
4 88
8.1
15 7
62.7
7 73
9.5
5 04
1.3
6 53
0.6
14 2
94.0
23 1
07.5
Uni
ted
King
dom
190.
917
1.4
123.
762
.963
.842
.455
.948
.346
.050
.431
.338
.1Eu
rope
an C
omm
issi
on5
....
....
....
....
....
....
1.A
ll da
ta re
fer t
o th
e fis
cal y
ear,
Apr
il 20
02 t
o M
arch
200
3 fo
r 200
2.2.
Figu
re fo
r 199
1 re
fers
to
Wal
loni
a on
ly.
From
199
1 to
199
4, n
ucle
ar d
ata
are
not
avai
labl
e an
d th
eref
ore
are
not
incl
uded
in t
he b
udge
t.3.
Dat
a do
not
incl
ude
the
new
Län
der o
f Ger
man
y pr
ior t
o 19
92.
4.Lu
xem
bour
g ha
s no
ene
rgy
R&D
pro
gram
me.
5.N
o in
form
atio
n on
R&
D b
udge
ts h
as b
een
prov
ided
by
the
Euro
pean
Com
mis
sion
.N
ote:
Bud
gets
pro
vide
d fo
r rec
ent
year
s by
som
e co
untr
ies
may
hav
e be
en e
stim
ated
.So
urce
s: O
ECD
Eco
nom
ic O
utlo
ok, O
ECD
Par
is, 2
002,
and
cou
ntry
sub
mis
sion
s.
395
Government Energy R&D Budgets ANNEX B
Tabl
eB2
IEA
Gov
ern
me
nt R
&D
Bud
ge
ts in
200
2 N
atio
nal C
urre
ncie
s(m
illio
ns
exc
ep
t fo
r Ja
pa
ne
se a
nd
Tu
rkish
cu
rre
nc
ies.
wh
ich
are
in b
illio
ns)
393-Annex B 2/12/03 11:25 Page 395

2002
exch
. rat
es19
9119
9219
9319
9419
9519
9619
9719
9819
9920
0020
0120
02e
(Uni
t pe
r $)
Cana
da1
271.
627
2.0
230.
323
2.2
227.
220
8.6
182.
417
1.9
168.
517
3.7
189.
119
0.5
1.56
6U
nite
d St
ates
3 20
3.8
2 72
4.9
2 66
3.8
2 81
3.0
2 71
6.1
2 37
7.8
2 13
3.5
2 16
9.8
2 42
3.1
2 34
5.2
2 84
5.3
2 84
7.3
1.0
Aus
tral
ia..
..71
.6..
73.7
..95
.9..
....
....
1.84
1Ja
pan
2 92
8.8
2 95
2.9
3 02
3.8
3 23
8.9
3 33
9.8
3 46
8.2
3 29
3.2
3 32
7.8
3 30
9.1
3 40
6.1
3 42
3.4
..12
5.30
Kore
a..
....
....
....
....
....
..1
251.
0N
ew Z
eala
nd1.
1..
2.5
2.0
2.3
2.7
2.6
3.2
3.0
3.1
4.1
4.7
2.16
3
Aus
tria
20.3
16.9
22.3
24.6
24.5
24.4
25.6
27.1
26.0
....
..1.
061
Belg
ium
210
.410
.918
.218
.646
.258
.956
.271
.449
.7..
....
1.06
1Cz
ech
Repu
blic
....
....
....
....
....
....
32.7
3D
enm
ark
42.1
48.4
46.6
39.2
36.5
31.6
36.7
44.5
42.9
43.3
42.2
20.2
7.88
4Fi
nlan
d41
.844
.044
.653
.061
.559
.582
.482
.578
.464
.559
.9..
1.06
1Fr
ance
513.
648
0.0
473.
543
9.7
511.
448
5.5
484.
351
8.3
604.
057
1.0
423.
738
0.3
1.06
1G
erm
any3
503.
539
4.5
383.
630
6.7
262.
728
2.7
255.
427
3.0
182.
026
1.0
280.
226
2.0
1.06
1G
reec
e9.
66.
45.
24.
88.
09.
116
.1..
..5.
86.
88.
31.
061
Hun
gary
....
....
0.4
0.1
..0.
70.
41.
81.
52.
925
7.4
Irela
nd..
....
....
....
....
....
3.5
1.06
1It
aly
547.
5..
284.
226
9.6
277.
625
7.2
234.
322
8.4
..26
0.1
273.
127
0.1
1.06
1Lu
xem
bour
g4–
––
––
––
––
––
–1.
061
Net
herla
nds
171.
516
5.2
182.
919
3.1
138.
514
3.5
160.
514
9.5
149.
913
0.1
168.
5..
1.06
1N
orw
ay64
.769
.063
.261
.551
.046
.343
.943
.654
.947
.148
.148
.67.
986
Port
ugal
8.2
6.8
4.3
3.4
1.6
2.0
1.3
1.8
2.1
1.5
0.9
2.4
1.06
1Sp
ain
110.
787
.773
.978
.470
.066
.966
.551
.052
.349
.948
.347
.91.
061
Swed
en70
.788
.266
.570
.251
.446
.251
.348
.063
.969
.380
.2..
9.72
Switz
erla
nd14
6.5
158.
115
5.9
151.
514
6.1
139.
813
3.5
123.
812
1.1
110.
911
3.4
115.
61.
557
Turk
ey2.
23.
23.
31.
64.
03.
210
.45.
13.
34.
39.
515
.315
12 3
00U
nite
d Ki
ngdo
m28
6.2
257.
018
5.5
94.3
95.6
63.6
83.9
72.4
69.0
75.6
47.0
57.1
0.66
7
Tota
l Rep
orte
d58
954.
8..
8 00
5.6
8 09
6.5
8 14
6.1
7 77
7.7
7 45
0.0
7 41
3.4
....
....
Euro
pean
Com
mis
sion
6..
....
....
....
....
....
..1.
117
1.A
ll da
ta re
fer t
o th
e fis
cal y
ear,
Apr
il 20
02 t
o M
arch
200
3 fo
r 200
2.2.
Figu
re fo
r 199
1 re
fers
to
Wal
loni
a on
ly.
From
199
1 to
199
4, n
ucle
ar d
ata
are
not
avai
labl
e an
d th
eref
ore
are
not
incl
uded
in t
he b
udge
t.3.
Dat
a do
not
incl
ude
the
new
Län
der o
f Ger
man
y pr
ior t
o 19
92.
4.Lu
xem
bour
g ha
s no
ene
rgy
R&D
pro
gram
me.
5.Ye
arly
tot
als
are
not
com
para
ble
beca
use
of m
issi
ng d
ata.
6.N
o in
form
atio
n on
R&
D b
udge
ts h
as b
een
prov
ided
by
the
Euro
pean
Com
mis
sion
.N
ote:
Bud
gets
pro
vide
d fo
r rec
ent
year
s by
som
e co
untr
ies
may
hav
e be
en e
stim
ated
.So
urce
s: O
ECD
Eco
nom
ic O
utlo
ok, O
ECD
Par
is, 2
002,
and
cou
ntry
sub
mis
sion
s.
396
ANNEX B Government Energy R&D Budgets
Tabl
eB3
IEA
Gov
ern
me
nt R
&D
Bud
ge
ts(U
S$ m
illio
n a
t 20
02 p
rice
s a
nd
exc
ha
ng
e ra
tes)
393-Annex B 2/12/03 11:25 Page 396

R&D/GDP including nuclear research1994 1995 1996 1997 1998 1999 2000 2001 2002e
Canada1 0.42 0.40 0.36 0.30 0.27 0.25 0.25 0.27 0.26United States 0.35 0.33 0.28 0.24 0.23 0.25 0.23 0.28 0.27
Australia .. 0.24 .. 0.29 .. .. .. .. ..Japan 0.88 0.90 0.90 0.84 0.86 0.85 0.85 0.86 ..Korea .. .. .. .. .. .. .. .. ..New Zealand 0.04 0.05 0.05 0.05 0.06 0.06 0.06 0.07 0.08
Austria 0.14 0.14 0.14 0.14 0.14 0.13 .. .. ..Belgium 0.09 0.22 0.27 0.25 0.31 0.21 .. .. ..Czech Republic .. .. .. .. .. .. .. .. ..Denmark 0.27 0.24 0.21 0.23 0.27 0.26 0.25 0.24 0.12Finland 0.55 0.61 0.57 0.74 0.71 0.64 0.50 0.46 ..France 0.37 0.42 0.40 0.39 0.40 0.46 0.41 0.30 0.27Germany 0.17 0.15 0.16 0.14 0.15 0.09 0.13 0.14 0.13Greece 0.05 0.08 0.09 0.15 .. .. 0.05 0.05 0.06Hungary .. 0.01 0.00 .. 0.01 0.01 0.03 0.02 0.04Ireland .. .. .. .. .. .. .. .. 0.03Italy 0.26 0.26 0.24 0.22 0.21 .. 0.23 0.23 0.23Luxembourg2 – – – – – – – – –Netherlands 0.57 0.40 0.40 0.43 0.39 0.37 0.31 0.40 ..Norway 0.40 0.32 0.28 0.25 0.24 0.30 0.25 0.25 0.25Portugal 0.04 0.02 0.02 0.01 0.02 0.02 0.01 0.01 0.02Spain 0.16 0.14 0.13 0.12 0.09 0.09 0.08 0.08 0.07Sweden 0.37 0.26 0.24 0.26 0.23 0.29 0.31 0.35 ..Switzerland 0.62 0.59 0.56 0.53 0.48 0.46 0.41 0.42 0.43Turkey 0.01 0.02 0.02 0.06 0.03 0.02 0.02 0.05 0.08United Kingdom 0.07 0.07 0.05 0.06 0.05 0.05 0.05 0.03 0.04
R&D/GDP excluding nuclear research1994 1995 1996 1997 1998 1999 2000 2001 2002e
Canada1 0.20 0.19 0.20 0.17 0.16 0.17 0.18 0.21 0.21United States 0.29 0.26 0.24 0.20 0.20 0.22 0.20 0.25 0.25
Australia .. 0.22 .. 0.29 .. .. .. .. ..Japan 0.22 0.22 0.22 0.21 0.25 0.24 0.25 0.25 ..Korea .. .. .. .. .. .. .. .. ..New Zealand 0.04 0.05 0.05 0.05 0.06 0.06 0.06 0.07 0.08
Austria 0.13 0.13 0.13 0.13 0.13 0.12 .. .. ..Belgium 0.09 0.10 0.10 0.08 0.09 0.04 .. .. ..Czech Republic .. .. .. .. .. .. .. .. ..Denmark 0.26 0.24 0.20 0.23 0.25 0.23 0.23 0.22 0.10Finland 0.48 0.55 0.49 0.67 0.64 0.56 0.44 0.41 ..France 0.04 0.04 0.04 0.03 0.03 0.04 0.04 0.05 0.06Germany 0.07 0.06 0.07 0.06 0.06 0.05 0.06 0.08 0.07Greece 0.05 0.07 0.08 0.14 .. .. 0.04 0.05 0.06Hungary .. 0.01 0.00 .. 0.01 0.00 0.03 0.02 0.04Ireland .. .. .. .. .. .. .. .. 0.03Italy 0.15 0.16 0.14 0.12 0.12 .. 0.13 0.14 0.15Luxembourg2 – – – – – – – – –Netherlands 0.42 0.35 0.36 0.38 0.36 0.34 0.26 0.35 ..Norway 0.34 0.26 0.23 0.20 0.19 0.25 0.21 0.21 0.22Portugal 0.01 0.02 0.02 0.01 0.02 0.02 0.01 0.01 0.01Spain 0.09 0.07 0.07 0.06 0.05 0.05 0.04 0.04 0.04Sweden 0.30 0.23 0.21 0.23 0.21 0.27 0.29 0.33 ..Switzerland 0.44 0.43 0.40 0.37 0.34 0.34 0.28 0.29 0.31Turkey 0.00 0.02 0.01 0.05 0.02 0.02 0.02 0.05 0.08United Kingdom 0.04 0.04 0.03 0.04 0.03 0.03 0.03 0.02 0.02
1. All data refer to the fiscal year, April 2002 to March 2003 for 2002.2. Luxembourg has no energy R&D programme.Note: Budgets provided for recent years by some countries may have been estimated.Sources: OECD Economic Outlook, OECD Paris, 2002, and country submissions.
397
Government Energy R&D Budgets ANNEX B
Table B4
IEA Government Budgets on Energy R&D(per thousand units of GDP)
393-Annex B 2/12/03 11:25 Page 397
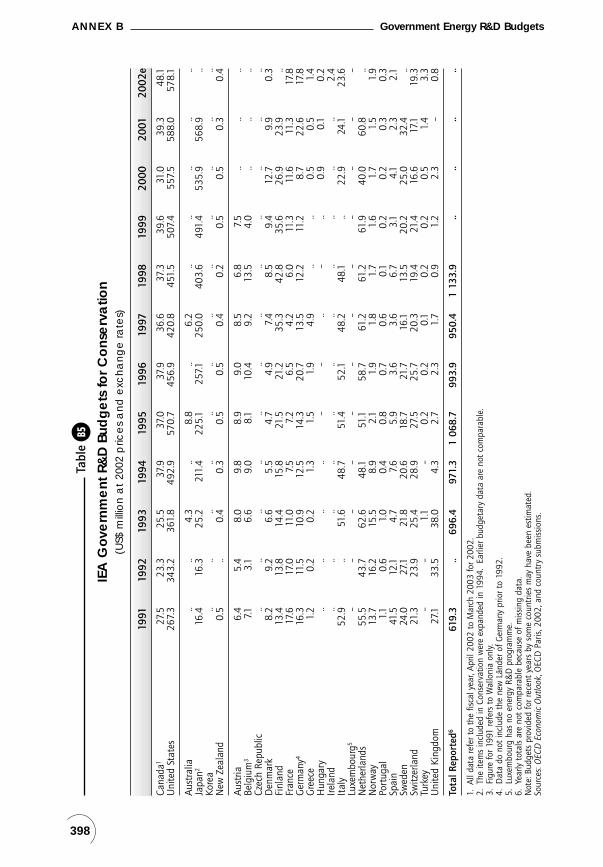
1991
1992
1993
1994
1995
1996
1997
1998
1999
2000
2001
2002
e
Cana
da1
27.5
23.3
25.5
37.9
37.0
37.9
36.6
37.3
39.6
31.0
39.3
48.1
Uni
ted
Stat
es26
7.3
343.
236
1.8
492.
957
0.7
456.
942
0.8
451.
550
7.4
557.
558
8.0
578.
1
Aus
tral
ia..
..4.
3..
8.8
..6.
2..
....
....
Japa
n216
.416
.325
.221
1.4
225.
125
7.125
0.0
403.
649
1.4
535.
956
8.9
..Ko
rea
....
....
....
....
....
....
New
Zea
land
0.5
..0.
40.
30.
50.
50.
40.
20.
50.
50.
30.
4
Aus
tria
6.4
5.4
8.0
9.8
8.9
9.0
8.5
6.8
7.5
....
..Be
lgiu
m3
7.13.
16.
69.
08.
110
.49.
213
.54.
0..
....
Czec
h Re
publ
ic..
....
....
....
....
....
..D
enm
ark
8.2
9.2
6.6
5.5
4.7
4.9
7.4
8.5
9.4
12.7
9.9
0.3
Finl
and
13.4
13.8
14.4
15.8
21.5
21.2
35.3
42.8
35.6
26.9
23.9
..Fr
ance
17.6
17.0
11.0
7.5
7.2
6.5
4.2
6.0
11.3
11.6
11.3
17.8
Ger
man
y416
.311
.510
.912
.514
.320
.713
.512
.211
.28.
722
.617
.8G
reec
e1.
20.
20.
21.
31.
51.
94.
9..
..0.
50.
51.
4H
unga
ry..
....
..–
–..
–..
0.9
0.1
0.2
Irela
nd..
....
....
....
....
....
2.4
Ital
y52
.9..
51.6
48.7
51.4
52.1
48.2
48.1
..22
.924
.123
.6Lu
xem
bour
g5–
––
––
––
––
––
–N
ethe
rland
s55
.543
.762
.648
.151
.158
.761
.261
.261
.940
.060
.8..
Nor
way
13.7
16.2
15.5
8.9
2.1
1.9
1.8
1.7
1.6
1.7
1.5
1.9
Port
ugal
1.1
0.6
1.0
0.4
0.8
0.7
0.6
0.1
0.2
0.2
0.3
0.3
Spai
n41
.512
.14.
77.
65.
93.
63.
66.
73.
14.
12.
32.
1Sw
eden
24.0
27.1
21.8
20.6
18.7
21.7
16.1
13.5
20.2
25.0
32.4
..Sw
itzer
land
21.3
23.9
25.4
28.9
27.5
25.7
20.3
19.4
21.4
16.6
17.1
19.3
Turk
ey–
–1.
1–
0.2
0.2
0.1
0.2
0.2
0.5
1.4
3.3
Uni
ted
King
dom
27.1
33.5
38.0
4.3
2.7
2.3
1.7
0.9
1.2
2.3
–0.
8
Tota
l Rep
orte
d661
9.3
..69
6.4
971.
31
068.
799
3.9
950.
41
133.
9..
....
..
1.A
ll da
ta re
fer t
o th
e fis
cal y
ear,
Apr
il 20
02 t
o M
arch
200
3 fo
r 200
2.2.
The
item
s in
clud
ed in
Con
serv
atio
n w
ere
expa
nded
in 1
994.
Earli
er b
udge
tary
dat
a ar
e no
t co
mpa
rabl
e.3.
Figu
re fo
r 199
1 re
fers
to
Wal
loni
a on
ly.
4.D
ata
do n
ot in
clud
e th
e ne
w L
ände
r of G
erm
any
prio
r to
1992
.5.
Luxe
mbo
urg
has
no e
nerg
y R&
D p
rogr
amm
e.6.
Year
ly t
otal
s ar
e no
t co
mpa
rabl
e be
caus
e of
mis
sing
dat
a.N
ote:
Bud
gets
pro
vide
d fo
r rec
ent
year
s by
som
e co
untr
ies
may
hav
e be
en e
stim
ated
.So
urce
s: O
ECD
Eco
nom
ic O
utlo
ok, O
ECD
Par
is, 2
002,
and
cou
ntry
sub
mis
sion
s.
398
ANNEX B Government Energy R&D Budgets
Tabl
eB5
IEA
Gov
ern
me
nt R
&D
Bud
ge
ts fo
r Co
nse
rva
tion
(US$
mill
ion
at
2002
pric
es
an
d e
xch
an
ge
rate
s)
393-Annex B 2/12/03 11:25 Page 398

1991
1992
1993
1994
1995
1996
1997
1998
1999
2000
2001
2002
e
Cana
da1
81.8
68.4
49.0
39.4
36.5
42.9
35.9
36.8
37.1
34.1
41.7
36.7
Uni
ted
Stat
es98
.110
4.2
186.
511
3.0
124.
985
.774
.078
.377
.289
.611
3.1
102.
5
Aus
tral
ia..
..30
.8..
25.6
..53
.3..
....
....
Japa
n93
.498
.210
3.5
109.
612
4.8
123.
411
9.6
90.0
30.5
24.3
31.2
..Ko
rea
....
....
....
....
....
....
New
Zea
land
–..
1.2
0.4
0.4
0.5
0.5
0.6
0.5
0.5
1.4
2.1
Aus
tria
0.5
0.7
0.3
0.2
0.3
0.6
0.2
0.2
0.1
....
..Be
lgiu
m–
––
––
0.1
0.1
–0.
2..
....
Czec
h Re
publ
ic..
....
....
....
....
....
..D
enm
ark
–2.
52.
93.
23.
32.
72.
42.
02.
41.
81.
7–
Finl
and
––
––
––
2.1
2.3
2.6
1.3
2.5
..Fr
ance
34.6
33.1
30.7
30.7
29.4
29.0
28.6
28.3
28.2
29.7
32.4
26.8
Ger
man
y26.
96.
33.
72.
60.
7–
––
––
––
Gre
ece
–0.
10.
10.
61.
01.
11.
7..
..–
....
Hun
gary
....
....
––
..–
–0.
50.
10.
1Ire
land
....
....
....
....
....
..–
Ital
y–
..–
––
––
–..
––
–Lu
xem
bour
g3–
––
––
––
––
––
–N
ethe
rland
s0.
76.
99.
812
.58.
98.
99.
98.
37.
98.
77.
5..
Nor
way
18.8
19.7
17.3
27.3
25.4
22.3
21.2
20.3
33.0
25.5
23.6
18.6
Port
ugal
––
–0.
30.
20.
10.
10.
10.
10.
1–
–Sp
ain
––
––
––
––
0.1
1.4
–0.
2Sw
eden
1.8
1.1
––
––
––
–..
–..
Switz
erla
nd11
.112
.312
.311
.611
.08.
69.
48.
27.
87.1
7.2
7.7
Turk
ey–
0.2
0.1
0.1
2.7
1.9
3.9
0.8
0.1
0.1
1.9
2.1
Uni
ted
King
dom
1.6
6.9
6.4
5.0
10.8
5.1
7.5
6.0
4.0
4.4
3.3
3.3
Tota
l Rep
orte
d434
9.4
360.
645
4.7
356.
440
5.8
332.
937
0.4
282.
123
1.9
229.
0..
..
1.A
ll da
ta re
fer t
o th
e fis
cal y
ear,
Apr
il 20
02 t
o M
arch
200
3 fo
r 200
2.2.
Dat
a do
not
incl
ude
the
new
Län
der o
f Ger
man
y pr
ior t
o 19
92.
3.Lu
xem
bour
g ha
s no
ene
rgy
R&D
pro
gram
me.
4.Ye
arly
tot
als
are
not
com
para
ble
beca
use
of m
issi
ng d
ata.
Not
e: B
udge
ts p
rovi
ded
for r
ecen
t ye
ars
by s
ome
coun
trie
s m
ay h
ave
been
est
imat
ed.
Sour
ces:
OEC
D E
cono
mic
Out
look
, OEC
D P
aris
, 200
2, a
nd c
ount
ry s
ubm
issi
ons.
399
Government Energy R&D Budgets ANNEX B
Tabl
eB6
IEA
Gov
ern
me
nt R
&D
Bud
ge
ts fo
r Oil
& G
as
(US$
mill
ion
at
2002
pric
es
an
d e
xch
an
ge
rate
s)
393-Annex B 2/12/03 11:25 Page 399
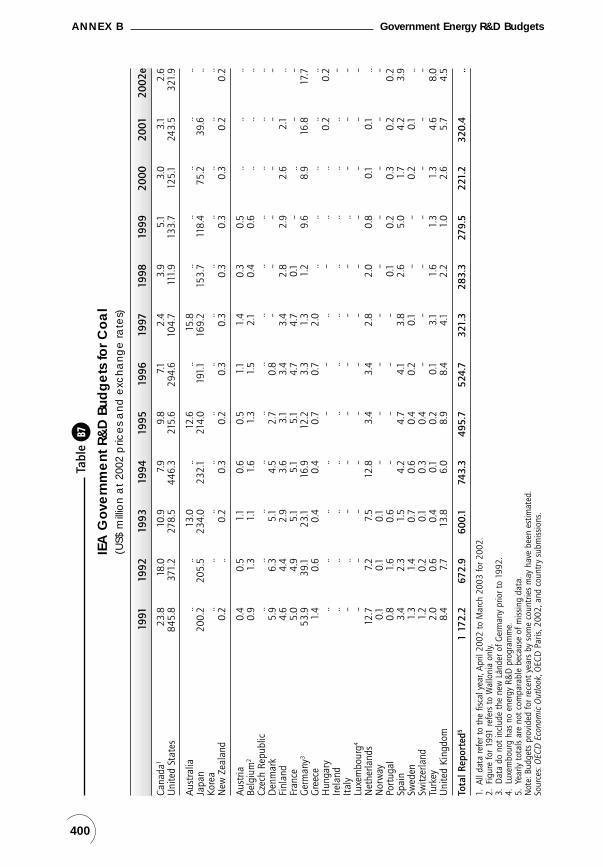
1991
1992
1993
1994
1995
1996
1997
1998
1999
2000
2001
2002
e
Cana
da1
23.8
18.0
10.9
7.9
9.8
7.12.
43.
95.
13.
03.
12.
6U
nite
d St
ates
845.
837
1.2
278.
544
6.3
215.
629
4.6
104.
711
1.9
133.
712
5.1
243.
532
1.9
Aus
tral
ia..
..13
.0..
12.6
..15
.8..
....
....
Japa
n20
0.2
205.
523
4.0
232.
121
4.0
191.
116
9.2
153.
711
8.4
75.2
39.6
..Ko
rea
....
....
....
....
....
....
New
Zea
land
0.2
..0.
20.
30.
20.
30.
30.
30.
30.
30.
20.
2
Aus
tria
0.4
0.5
1.1
0.6
0.5
1.1
1.4
0.3
0.5
....
..Be
lgiu
m2
0.9
1.3
1.1
1.6
1.3
1.5
2.1
0.4
0.6
....
..Cz
ech
Repu
blic
....
....
....
....
....
....
Den
mar
k5.
96.
35.
14.
52.
70.
8–
––
––
–Fi
nlan
d4.
64.
42.
93.
63.
13.
43.
42.
82.
92.
62.
1..
Fran
ce5.
04.
95.
15.
15.
14.
74.
70.
1–
..–
–G
erm
any3
53.9
39.1
23.1
16.9
12.2
3.3
1.3
1.2
9.6
8.9
16.8
17.7
Gre
ece
1.4
0.6
0.4
0.4
0.7
0.7
2.0
....
....
..H
unga
ry..
....
..–
–..
–..
..0.
20.
2Ire
land
....
....
....
....
....
..–
Ital
y–
..–
––
––
–..
––
–Lu
xem
bour
g4–
––
––
––
––
––
–N
ethe
rland
s12
.77.
27.
512
.83.
43.
42.
82.
00.
80.
10.
1..
Nor
way
0.1
0.1
0.1
––
––
––
––
–Po
rtug
al0.
81.
60.
6–
––
–0.
10.
20.
30.
20.
2Sp
ain
3.4
2.3
1.5
4.2
4.7
4.1
3.8
2.6
5.0
1.7
4.2
3.9
Swed
en1.
31.
40.
70.
60.
40.
20.
1–
–0.
20.
1..
Switz
erla
nd1.
20.
20.
10.
30.
4–
––
––
––
Turk
ey2.
00.
60.
40.
10.
20.
13.
11.
61.
31.
34.
68.
0U
nite
d Ki
ngdo
m8.
47.
713
.86.
08.
98.
44.
12.
21.
02.
65.
74.
5
Tota
l Rep
orte
d51
172.
267
2.9
600.
174
3.3
495.
752
4.7
321.
328
3.3
279.
522
1.2
320.
4..
1.A
ll da
ta re
fer t
o th
e fis
cal y
ear,
Apr
il 20
02 t
o M
arch
200
3 fo
r 200
2.2.
Figu
re fo
r 199
1 re
fers
to
Wal
loni
a on
ly.
3.D
ata
do n
ot in
clud
e th
e ne
w L
ände
r of G
erm
any
prio
r to
1992
.4.
Luxe
mbo
urg
has
no e
nerg
y R&
D p
rogr
amm
e.5.
Year
ly t
otal
s ar
e no
t co
mpa
rabl
e be
caus
e of
mis
sing
dat
a.N
ote:
Bud
gets
pro
vide
d fo
r rec
ent
year
s by
som
e co
untr
ies
may
hav
e be
en e
stim
ated
.So
urce
s: O
ECD
Eco
nom
ic O
utlo
ok, O
ECD
Par
is, 2
002,
and
cou
ntry
sub
mis
sion
s.
400
ANNEX B Government Energy R&D Budgets
Tabl
eB7
IEA
Gov
ern
me
nt R
&D
Bud
ge
ts fo
r Co
al
(US$
mill
ion
at
2002
pric
es
an
d e
xch
an
ge
rate
s)
393-Annex B 2/12/03 11:25 Page 400

1991
1992
1993
1994
1995
1996
1997
1998
1999
2000
2001
2002
e
Cana
da1
107.
211
7.0
114.
011
4.1
111.
784
.882
.168
.652
.346
.138
.638
.8U
nite
d St
ates
691.
626
3.2
137.
710
9.7
95.0
43.3
61.3
21.4
23.8
36.0
47.8
49.2
Aus
tral
ia..
..0.
7..
5.0
..0.
7..
....
....
Japa
n1
618.
51
656.
71
709.
91
758.
61
924.
12
033.
11
948.
51
914.
41
943.
81
855.
41
940.
3..
Kore
a..
....
....
....
....
....
..N
ew Z
eala
nd–
..–
––
––
––
––
–
Aus
tria
0.4
0.4
0.5
0.6
0.5
0.8
0.6
–0.
4..
....
Belg
ium
2..
....
..22
.533
.033
.845
.635
.1..
....
Czec
h Re
publ
ic..
....
....
....
....
....
..D
enm
ark
0.6
0.8
0.8
0.8
0.5
0.5
0.5
2.8
2.7
2.6
2.3
1.9
Finl
and
8.4
8.4
7.9
6.7
5.7
7.3
6.7
7.0
7.7
6.0
5.5
..Fr
ance
373.
835
1.7
345.
532
4.5
416.
339
2.7
399.
443
0.4
504.
247
0.0
321.
425
5.4
Ger
man
y317
2.3
91.7
81.4
67.0
65.8
51.5
36.5
34.9
19.6
22.5
15.7
8.0
Gre
ece
0.1
––
0.2
0.2
0.3
0.2
....
....
..H
unga
ry..
....
..–
–..
0.2
0.4
..–
0.5
Irela
nd..
....
....
....
....
....
–It
aly
56.3
..49
.750
.039
.835
.935
.531
.9..
45.9
44.8
43.7
Luxe
mbo
urg4
––
––
––
––
––
––
Net
herla
nds
22.4
30.9
25.3
12.6
12.0
10.6
10.2
4.1
6.7
1.0
0.9
..N
orw
ay8.
99.
29.
28.
78.
88.
48.
19.
18.
67.
87.
56.
9Po
rtug
al1.
31.
10.
32.
20.
10.
10.
1–
––
––
Spai
n17
.921
.618
.817
.816
.716
.716
.47.
75.
013
.513
.813
.6Sw
eden
1.3
1.4
1.4
1.3
1.2
1.1
0.9
0.9
0.9
0.9
0.9
..Sw
itzer
land
26.8
24.1
23.7
23.8
23.0
19.9
20.4
19.1
13.9
18.9
17.6
16.1
Turk
ey–
0.9
1.2
0.9
0.6
0.8
1.2
0.8
0.2
0.1
0.2
0.2
Uni
ted
King
dom
42.2
37.1
20.7
14.8
13.2
7.0
1.7
3.3
––
––
Tota
l Rep
orte
d53
150.
0..
2 54
8.9
2 51
4.4
2 76
2.6
2 74
7.7
2 66
4.6
2 60
2.4
....
....
1.A
ll da
ta re
fer t
o th
e fis
cal y
ear,
Apr
il 20
02 t
o M
arch
200
3 fo
r 200
2.2.
From
199
1 to
199
4, n
ucle
ar d
ata
are
not
avai
labl
e.3.
Dat
a do
not
incl
ude
the
new
Län
der o
f Ger
man
y pr
ior t
o 19
92.
4.Lu
xem
bour
g ha
s no
ene
rgy
R&D
pro
gram
me.
5.Ye
arly
tot
als
are
not
com
para
ble
beca
use
of m
issi
ng d
ata.
Not
e: B
udge
ts p
rovi
ded
for r
ecen
t ye
ars
by s
ome
coun
trie
s m
ay h
ave
been
est
imat
ed.
Sour
ces:
OEC
D E
cono
mic
Out
look
, OEC
D P
aris
, 200
2, a
nd c
ount
ry s
ubm
issi
ons.
401
Government Energy R&D Budgets ANNEX B
Tabl
eB8
IEA
Gov
ern
me
nt R
&D
Bud
ge
ts fo
r Co
nve
ntio
nal N
ucle
ar
(US$
mill
ion
at
2002
pric
es
an
d e
xch
an
ge
rate
s)
393-Annex B 2/12/03 11:25 Page 401

1991
1992
1993
1994
1995
1996
1997
1998
1999
2000
2001
2002
e
Cana
da1
––
––
––
–0.
20.
40.
40.
40.
4U
nite
d St
ates
––
––
––
––
––
––
Aus
tral
ia..
..–
..–
..–
....
....
..Ja
pan
494.
244
1.8
439.
039
5.8
308.
628
5.7
245.
421
1.9
195.
933
4.9
275.
6..
Kore
a..
....
....
....
....
....
..N
ew Z
eala
nd–
..–
––
––
––
––
–
Aus
tria
––
––
––
––
–..
....
Belg
ium
....
....
––
––
–..
....
Czec
h Re
publ
ic..
....
....
....
....
....
..D
enm
ark
––
––
––
–..
––
––
Finl
and
––
0.1
–0.
8–
––
––
–..
Fran
ce36
.926
.442
.033
.714
.313
.811
.020
.218
.710
.7–
3.8
Ger
man
y222
.13.
8–
––
––
––
––
–G
reec
e–
––
––
––
....
....
..H
unga
ry..
....
..–
–..
––
..–
–Ire
land
....
....
....
....
....
..–
Ital
y–
..–
––
––
–..
––
–Lu
xem
bour
g3–
––
––
––
––
––
–N
ethe
rland
s1.
70.
50.
522
.2–
––
––
13.1
12.9
..N
orw
ay–
––
––
––
––
––
–Po
rtug
al–
––
––
––
––
––
–Sp
ain
––
––
––
––
–0.
8–
–Sw
eden
4.0
4.3
4.1
4.0
3.6
3.2
2.8
2.9
2.8
2.8
2.8
..Sw
itzer
land
1.0
1.4
1.2
0.5
0.9
0.9
0.3
0.1
0.1
–0.
1–
Turk
ey–
––
––
––
––
––
–U
nite
d Ki
ngdo
m12
0.9
99.4
46.9
1.9
0.2
––
––
––
–
Tota
l Rep
orte
d468
0.9
577.
553
3.9
457.
932
8.4
303.
625
9.6
235.
321
7.9
362.
829
1.8
..
1.A
ll da
ta re
fer t
o th
e fis
cal y
ear,
Apr
il 20
02 t
o M
arch
200
3 fo
r 200
2.2.
Dat
a do
not
incl
ude
the
new
Län
der o
f Ger
man
y pr
ior t
o 19
92.
3.Lu
xem
bour
g ha
s no
ene
rgy
R&D
pro
gram
me.
4.Ye
arly
tot
als
are
not
com
para
ble
beca
use
of m
issi
ng d
ata.
Not
e: B
udge
ts p
rovi
ded
for r
ecen
t ye
ars
by s
ome
coun
trie
s m
ay h
ave
been
est
imat
ed.
Sour
ces:
OEC
D E
cono
mic
Out
look
, OEC
D P
aris
, 200
2, a
nd c
ount
ry s
ubm
issi
ons.
402
ANNEX B Government Energy R&D Budgets
Tabl
eB9
IEA
Gov
ern
me
nt R
&D
Bud
ge
ts fo
r Nuc
lea
r Bre
ed
ers
(US$
mill
ion
at
2002
pric
es
an
d e
xch
an
ge
rate
s)
393-Annex B 2/12/03 11:25 Page 402
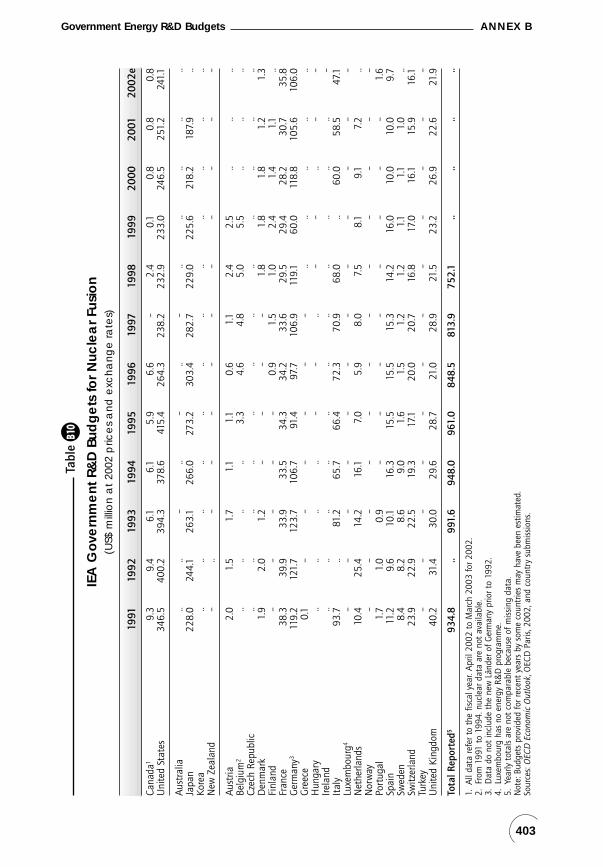
1991
1992
1993
1994
1995
1996
1997
1998
1999
2000
2001
2002
e
Cana
da1
9.3
9.4
6.1
6.1
5.9
6.6
–2.
40.
10.
80.
80.
8U
nite
d St
ates
346.
540
0.2
394.
337
8.6
415.
426
4.3
238.
223
2.9
233.
024
6.5
251.
224
1.1
Aus
tral
ia..
..–
..–
..–
....
....
..Ja
pan
228.
024
4.1
263.
126
6.0
273.
230
3.4
282.
722
9.0
225.
621
8.2
187.
9..
Kore
a..
....
....
....
....
....
..N
ew Z
eala
nd–
..–
––
––
––
––
–
Aus
tria
2.0
1.5
1.7
1.1
1.1
0.6
1.1
2.4
2.5
....
..Be
lgiu
m2
....
....
3.3
4.6
4.8
5.0
5.5
....
..Cz
ech
Repu
blic
....
....
....
....
....
....
Den
mar
k1.
92.
01.
2–
––
–1.
81.
81.
81.
21.
3Fi
nlan
d–
––
––
0.9
1.5
1.0
2.4
1.4
1.1
..Fr
ance
38.3
39.9
33.9
33.5
34.3
34.2
33.6
29.5
29.4
28.2
30.7
35.8
Ger
man
y311
9.2
121.
712
3.7
106.
791
.497
.710
6.9
119.
160
.011
8.8
105.
610
6.0
Gre
ece
0.1
––
––
––
....
....
..H
unga
ry..
....
..–
–..
––
..–
–Ire
land
....
....
....
....
....
..–
Ital
y93
.7..
81.2
65.7
66.4
72.3
70.9
68.0
..60
.058
.547
.1Lu
xem
bour
g4–
––
––
––
––
––
–N
ethe
rland
s10
.425
.414
.216
.17.
05.
98.
07.
58.
19.
17.
2..
Nor
way
––
––
––
––
––
––
Port
ugal
1.7
1.0
0.9
––
––
––
––
1.6
Spai
n11
.29.
610
.116
.315
.515
.515
.314
.216
.010
.010
.09.
7Sw
eden
8.4
8.2
8.6
9.0
1.6
1.5
1.2
1.2
1.1
1.1
1.0
..Sw
itzer
land
23.9
22.9
22.5
19.3
17.1
20.0
20.7
16.8
17.0
16.1
15.9
16.1
Turk
ey–
––
––
––
––
––
–U
nite
d Ki
ngdo
m40
.231
.430
.029
.628
.721
.028
.921
.523
.226
.922
.621
.9
Tota
l Rep
orte
d593
4.8
..99
1.6
948.
096
1.0
848.
581
3.9
752.
1..
....
..
1.A
ll da
ta re
fer t
o th
e fis
cal y
ear.
Apr
il 20
02 t
o M
arch
200
3 fo
r 200
2.2.
From
199
1 to
199
4. n
ucle
ar d
ata
are
not
avai
labl
e.3.
Dat
a do
not
incl
ude
the
new
Län
der o
f Ger
man
y pr
ior t
o 19
92.
4.Lu
xem
bour
g ha
s no
ene
rgy
R&D
pro
gram
me.
5.Ye
arly
tot
als
are
not
com
para
ble
beca
use
of m
issi
ng d
ata.
Not
e: B
udge
ts p
rovi
ded
for r
ecen
t ye
ars
by s
ome
coun
trie
s m
ay h
ave
been
est
imat
ed.
Sour
ces:
OEC
D E
cono
mic
Out
look
, OEC
D P
aris
, 200
2, a
nd c
ount
ry s
ubm
issi
ons.
403
Government Energy R&D Budgets ANNEX B
Tabl
eB1
0
IEA
Gov
ern
me
nt R
&D
Bud
ge
ts fo
r Nuc
lea
r Fus
ion
(US$
mill
ion
at
2002
pric
es
an
d e
xch
an
ge
rate
s)
393-Annex B 2/12/03 11:25 Page 403
1991
1992
1993
1994
1995
1996
1997
1998
1999
2000
2001
2002
e
Cana
da1
9.2
10.6
9.5
11.0
10.7
10.7
8.2
8.5
10.3
19.2
16.9
17.1
Uni
ted
Stat
es18
4.9
259.
224
8.3
254.
730
7.8
227.
021
3.8
262.
227
3.3
218.
025
3.1
247.
4
Aus
tral
ia..
..7.1
..3.
4..
5.0
....
....
..Ja
pan
106.
410
1.8
105.
897
.898
.310
0.1
99.3
109.
911
7.114
1.0
128.
0..
Kore
a..
....
....
....
....
....
..N
ew Z
eala
nd0.
4..
0.7
0.8
0.9
1.1
1.1
1.3
0.9
1.0
1.7
1.2
Aus
tria
4.5
3.9
5.2
6.8
8.0
6.2
7.4
9.7
9.1
....
..Be
lgiu
m2
0.3
1.9
2.2
2.3
3.8
2.8
3.1
1.3
1.0
....
..Cz
ech
Repu
blic
....
....
....
....
....
....
Den
mar
k17
.718
.820
.017
.416
.313
.116
.918
.615
.916
.017
.89.
2Fi
nlan
d1.
81.
95.
75.
45.
57.
011
.38.
29.
08.
67.
9..
Fran
ce7.
37.1
5.2
4.9
4.8
4.5
2.8
3.7
12.2
12.8
17.3
22.3
Ger
man
y310
5.3
111.
012
1.2
80.0
70.6
87.6
68.7
76.9
67.8
71.1
67.5
54.6
Gre
ece
4.3
4.6
3.2
1.7
3.1
2.9
6.1
....
1.8
2.6
3.1
Hun
gary
....
....
0.4
0.1
..–
–0.
41.
01.
7Ire
land
....
....
....
....
....
..0.
6It
aly
35.2
..26
.129
.540
.237
.634
.632
.3..
22.1
36.5
49.0
Luxe
mbo
urg4
––
––
––
––
––
––
Net
herla
nds
34.6
20.6
20.5
25.6
22.9
27.6
36.7
40.3
42.0
31.4
44.2
..N
orw
ay11
.112
.29.
78.
05.
24.
84.
85.
65.
55.
54.
34.
0Po
rtug
al1.
82.
41.
50.
60.
51.
10.
61.
21.
30.
80.
40.
3Sp
ain
16.1
22.0
19.8
14.5
14.0
14.0
14.0
17.5
14.9
16.2
15.2
15.5
Swed
en10
.224
.812
.415
.011
.67.
47.
612
.312
.023
.325
.2..
Switz
erla
nd31
.737
.639
.237
.036
.134
.436
.435
.436
.326
.325
.425
.7Tu
rkey
0.1
1.2
0.3
0.4
0.1
0.1
1.9
1.6
1.1
1.2
0.4
0.6
Uni
ted
King
dom
34.3
31.0
28.5
16.9
16.5
10.8
7.3
5.4
7.4
6.9
9.4
19.5
Tota
l Rep
orte
d561
7.1
..69
2.1
630.
268
0.8
601.
158
7.5
652.
0..
....
..
1.A
ll da
ta re
fer t
o th
e fis
cal y
ear,
Apr
il 20
02 t
o M
arch
200
3 fo
r 200
2.2.
Figu
re fo
r 199
1 re
fers
to
Wal
loni
a on
ly.
3.D
ata
do n
ot in
clud
e th
e ne
w L
ände
r of G
erm
any
prio
r to
1992
.4.
Luxe
mbo
urg
has
no e
nerg
y R&
D p
rogr
amm
e.5.
Year
ly t
otal
s ar
e no
t co
mpa
rabl
e be
caus
e of
mis
sing
dat
a.N
ote:
Bud
gets
pro
vide
d fo
r rec
ent
year
s by
som
e co
untr
ies
may
hav
e be
en e
stim
ated
.So
urce
s: O
ECD
Eco
nom
ic O
utlo
ok, O
ECD
Par
is, 2
002,
and
cou
ntry
sub
mis
sion
s.
404
ANNEX B Government Energy R&D Budgets
Tabl
eB1
1
IEA
Gov
ern
me
nt R
&D
Bud
ge
ts fo
r Re
new
ab
les
(US$
mill
ion
at
2002
pric
es
an
d e
xch
an
ge
rate
s)
393-Annex B 2/12/03 11:25 Page 404

1991
1992
1993
1994
1995
1996
1997
1998
1999
2000
2001
2002
e
Sola
r Hea
ting
53.5
257.
951
.955
.747
.031
.633
.430
.828
.434
.430
.4..
Sola
r Pho
to-E
lect
ric20
9.5
144.
537
4.3
218.
523
6.4
212.
321
2.2
237.1
239.
726
7.7
244.
9..
Sola
r The
rmal
-Ele
ctric
43.7
18.4
22.5
58.0
51.4
44.2
43.1
30.8
31.4
21.4
39.3
..W
ind
89.2
66.5
76.8
86.7
111.
610
5.1
91.2
95.4
91.9
82.7
99.7
..O
cean
12.0
3.0
4.2
3.9
2.2
2.0
2.2
10.8
6.6
7.110
.1..
Biom
ass
106.
881
.876
.913
3.8
138.
712
4.7
126.
517
2.8
164.
014
2.1
173.
1..
Geo
ther
mal
97.5
84.6
76.1
62.3
79.1
69.1
68.5
65.5
62.0
51.0
60.4
..La
rge
Hyd
ro (>
10 M
W)
4.3
8.5
8.1
9.7
12.6
9.1
7.0
5.7
6.7
4.6
1.9
..Sm
all H
ydro
(<10
MW
)0.
57.
41.
41.
71.
72.
83.
43.
16.
55.
73.
2..
TOTA
L61
7.1
672.
569
2.1
630.
268
0.8
601.
158
7.5
652.
063
7.3
623.
567
4.9
..
Not
es: Y
early
tot
als
are
not
com
para
ble
beca
use
of m
issi
ng d
ata
(see
Tab
le B
11).
Budg
ets
prov
ided
for r
ecen
t ye
ars
by s
ome
coun
trie
s m
ay h
ave
been
est
imat
ed.
Sour
ces:
OEC
D E
cono
mic
Out
look
, OEC
D P
aris
, 200
2, a
nd c
ount
ry s
ubm
issi
ons.
405
Government Energy R&D Budgets ANNEX B
Tabl
eB1
2
Tota
l Re
po
rte
d G
ove
rnm
ent
R&
D B
udg
ets
for R
ene
wa
ble
Ene
rgy
Sour
ce
s(U
S$ m
illio
n a
t 20
02 p
rice
s a
nd
exc
ha
ng
e ra
tes)
393-Annex B 2/12/03 11:25 Page 405

1991
1992
1993
1994
1995
1996
1997
1998
1999
2000
2001
2002
e
Cana
da1
3.1
8.3
9.0
8.4
8.2
7.0
3.9
4.2
4.3
14.7
18.8
19.1
Uni
ted
Stat
es67
.448
.249
.813
3.6
148.
413
3.8
136.
313
5.4
134.
412
8.1
136.
714
4.9
Aus
tral
ia..
..5.
3..
4.3
..3.
9..
....
....
Japa
n88
.690
.155
.563
.563
.566
.268
.011
7.2
122.
115
1.9
174.
1..
Kore
a..
....
....
....
....
....
..N
ew Z
eala
nd–
..–
–0.
10.
20.
20.
20.
60.
50.
40.
5
Aus
tria
5.1
3.2
3.4
4.3
3.6
4.2
3.7
4.1
3.0
....
..Be
lgiu
m2
0.1
2.4
7.0
3.9
5.4
5.3
1.7
4.6
2.7
....
..Cz
ech
Repu
blic
....
....
....
....
....
....
Den
mar
k4.
04.
75.
43.
93.
84.
14.
14.
23.
83.
43.
73.
3Fi
nlan
d11
.012
.911
.115
.515
.711
.815
.213
.914
.512
.512
.9..
Fran
ce–
––
––
––
––
0.7
1.9
4.2
Ger
man
y35.
84.
42.
42.
92.
011
.419
.720
.97.
520
.439
.946
.2G
reec
e0.
90.
1–
0.1
0.1
0.1
0.2
....
2.1
2.2
2.4
Hun
gary
....
....
––
..0.
2–
..–
0.2
Irela
nd..
....
....
....
....
....
0.4
Ital
y51
.7..
10.9
19.0
15.1
15.5
14.2
14.9
..77
.475
.573
.7Lu
xem
bour
g4–
––
––
––
––
––
–N
ethe
rland
s1.
720
.233
.135
.815
.317
.317
.712
.110
.19.
59.
4..
Nor
way
0.8
3.3
3.2
3.2
4.0
3.0
2.6
2.4
2.0
5.7
2.8
3.9
Port
ugal
––
––
––
––
––
0.1
–Sp
ain
––
––
0.3
0.3
0.3
0.4
1.2
1.6
0.8
0.8
Swed
en2.
41.
83.
48.
33.
91.
09.
56.
814
.07.
28.
8..
Switz
erla
nd20
.724
.920
.918
.218
.319
.515
.316
.916
.417
.820
.520
.6Tu
rkey
––
0.1
0.1
––
0.1
0.1
0.5
1.1
0.7
0.7
Uni
ted
King
dom
2.2
3.1
–6.
95.
51.
91.
92.
02.
32.
72.
52.
8
Tota
l Rep
orte
d526
5.6
..22
0.6
327.
731
7.5
302.
531
8.8
360.
2..
....
..
1.A
ll da
ta re
fer t
o th
e fis
cal y
ear,
Apr
il 20
02 t
o M
arch
200
3 fo
r 200
2.2.
Figu
re fo
r 199
1 re
fers
to
Wal
loni
a on
ly.
3.D
ata
do n
ot in
clud
e th
e ne
w L
ände
r of G
erm
any
prio
r to
1992
.4.
Luxe
mbo
urg
has
no e
nerg
y R&
D p
rogr
amm
e.5.
Year
ly t
otal
s ar
e no
t co
mpa
rabl
e be
caus
e of
mis
sing
dat
a.N
ote:
Bud
gets
pro
vide
d fo
r rec
ent
year
s by
som
e co
untr
ies
may
hav
e be
en e
stim
ated
.So
urce
s: O
ECD
Eco
nom
ic O
utlo
ok, O
ECD
Par
is, 2
002,
and
cou
ntry
sub
mis
sion
s.
406
ANNEX B Government Energy R&D Budgets
Tabl
eB1
3
IEA
Gov
ern
me
nt R
&D
Bud
ge
ts fo
r Ele
ctr
icity
(US$
mill
ion
at
2002
pric
es
an
d e
xch
an
ge
rate
s)
393-Annex B 2/12/03 11:25 Page 406
1991
1992
1993
1994
1995
1996
1997
1998
1999
2000
2001
2002
e
Cana
da1
9.7
16.9
6.3
7.6
7.4
11.6
13.3
10.1
19.2
24.5
29.5
27.0
Uni
ted
Stat
es70
2.1
935.
21
007.
088
4.1
838.
387
2.3
884.
387
6.1
1 04
0.2
944.
51
211.
71
162.
2
Aus
tral
ia..
..10
.3..
14.1
..11
.0..
....
....
Japa
n83
.298
.287
.810
4.1
108.
210
8.1
110.
698
.064
.169
.277
.7..
Kore
a..
....
....
....
....
....
..N
ew Z
eala
nd–
..–
0.2
0.1
––
0.6
0.3
0.3
0.1
0.3
Aus
tria
1.0
1.4
2.1
1.1
1.6
2.0
2.7
3.5
2.9
....
..Be
lgiu
m2
2.0
2.2
1.2
1.8
1.8
1.1
1.4
1.0
0.6
....
..Cz
ech
Repu
blic
....
....
....
....
....
....
Den
mar
k3.
74.
24.
53.
95.
35.
55.
46.
66.
75.
05.
64.
3Fi
nlan
d2.
62.
52.
66.
19.
17.
97.1
4.4
3.7
5.4
3.9
..Fr
ance
––
––
––
––
–7.
38.
614
.1G
erm
any3
1.8
5.1
17.2
18.1
5.8
10.4
8.8
7.8
6.4
10.6
12.1
11.7
Gre
ece
1.7
0.9
1.3
0.5
1.3
2.1
1.0
....
–..
..H
unga
ry..
....
..–
–..
0.3
–..
––
Irela
nd..
....
....
....
....
....
–It
aly
257.
7..
64.7
56.7
64.7
43.8
30.9
33.3
..31
.833
.833
.0Lu
xem
bour
g4–
––
––
––
––
––
–N
ethe
rland
s31
.79.
89.
47.
517
.911
.114
.014
.112
.517
.325
.4..
Nor
way
11.2
8.4
8.2
5.3
5.5
5.9
5.5
4.5
4.2
1.0
8.4
13.2
Port
ugal
1.4
0.1
––
––
–0.
20.
20.
2–
–Sp
ain
20.6
20.1
18.9
18.1
13.0
12.7
13.0
1.9
7.10.
62.
02.
0Sw
eden
17.3
18.1
14.0
11.3
10.2
10.2
13.0
10.4
12.7
8.7
8.9
..Sw
itzer
land
8.8
10.7
10.5
11.9
11.7
10.6
10.5
8.0
8.3
8.1
9.6
10.3
Turk
ey–
0.2
0.2
0.1
0.2
0.2
0.2
0.1
0.1
0.1
0.3
0.4
Uni
ted
King
dom
9.3
6.9
1.1
8.9
9.2
7.130
.731
.229
.929
.83.
44.
2
Tota
l Rep
orte
d51
165.
7..
1 26
7.3
1 14
7.4
1 12
5.6
1 12
2.7
1 16
3.4
1 11
2.0
....
....
1.A
ll da
ta re
fer t
o th
e fis
cal y
ear,
Apr
il 20
02 t
o M
arch
200
3 fo
r 200
2.2.
Figu
re fo
r 199
1 re
fers
to
Wal
loni
a on
ly.
3.D
ata
do n
ot in
clud
e th
e ne
w L
ände
r of G
erm
any
prio
r to
1992
.4.
Luxe
mbo
urg
has
no e
nerg
y R&
D p
rogr
amm
e.5.
Year
ly t
otal
s ar
e no
t co
mpa
rabl
e be
caus
e of
mis
sing
dat
a.N
ote:
Bud
gets
pro
vide
d fo
r rec
ent
year
s by
som
e co
untr
ies
may
hav
e be
en e
stim
ated
.So
urce
s: O
ECD
Eco
nom
ic O
utlo
ok, O
ECD
Par
is, 2
002,
and
cou
ntry
sub
mis
sion
s.
407
Government Energy R&D Budgets ANNEX B
Tabl
eB1
3a
IEA
Gov
ern
me
nt R
&D
Bud
ge
ts fo
r Ene
rgy
Syst
em
s A
naly
sis
& O
the
rs(U
S$ m
illio
n a
t 20
02 p
rice
s a
nd
exc
ha
ng
e ra
tes)
393-Annex B 2/12/03 11:25 Page 407

Australia1 Austria2
2001 2002 2001 2002$ % $ % $ % $ %
1.1 Industry .. .. .. .. .. .. .. ..1.2 Residential. Commercial .. .. .. .. .. .. .. ..1.3 Transportation .. .. .. .. .. .. .. ..1.4 Other Conservation .. .. .. .. .. .. .. ..
TOTAL CONSERVATION .. .. .. .. .. .. .. ..
2.1 Enhanced Oil & Gas .. .. .. .. .. .. .. ..2.2 Refining. Transp. & Stor. .. .. .. .. .. .. .. ..2.3 Oil Shale & Tar Sands .. .. .. .. .. .. .. ..2.4 Other Oil & Gas .. .. .. .. .. .. .. ..
Total Oil & Gas .. .. .. .. .. .. .. ..
3.1 Coal Prod. Prep. & Trans. .. .. .. .. .. .. .. ..3.2 Coal Combustion .. .. .. .. .. .. .. ..3.3 Coal Conversion .. .. .. .. .. .. .. ..3.4 Other Coal .. .. .. .. .. .. .. ..
Total Coal .. .. .. .. .. .. .. ..
TOTAL FOSSIL FUELS .. .. .. .. .. .. .. ..
4.1 Solar Heating & Cooling .. .. .. .. .. .. .. ..4.2 Solar Photo–Electric .. .. .. .. .. .. .. ..4.3 Solar Thermal–Electric .. .. .. .. .. .. .. ..
Total Solar .. .. .. .. .. .. .. ..
5. Wind .. .. .. .. .. .. .. ..6. Ocean .. .. .. .. .. .. .. ..7. Biomass .. .. .. .. .. .. .. ..8. Geothermal .. .. .. .. .. .. .. ..9.1 Large Hydro (>10 MW) .. .. .. .. .. .. .. ..9.2 Small Hydro (<10 MW) .. .. .. .. .. .. .. ..
Total Hydro .. .. .. .. .. .. .. ..
TOTAL RENEWABLE ENERGY .. .. .. .. .. .. .. ..
10.1 Nuclear LWR .. .. .. .. .. .. .. ..10.2 Other Converter Reactors .. .. .. .. .. .. .. ..10.3 Nuclear Fuel Cycle .. .. .. .. .. .. .. ..10.4 Nuclear Supporting Tech. .. .. .. .. .. .. .. ..10.5 Nuclear Breeder .. .. .. .. .. .. .. ..
Total Nuclear Fission .. .. .. .. .. .. .. ..
11. Nuclear Fusion .. .. .. .. .. .. .. ..
TOTAL NUCLEAR .. .. .. .. .. .. .. ..
12.1 Electric Power Conversion .. .. .. .. .. .. .. ..12.2 Electricity Transm. & Distr. .. .. .. .. .. .. .. ..12.3 Energy Storage .. .. .. .. .. .. .. ..
TOTAL POWER & STORAGE .. .. .. .. .. .. .. ..
13.1 Energy Systems Analysis .. .. .. .. .. .. .. ..13.2 Other Tech. or Research .. .. .. .. .. .. .. ..
TOTAL OTHER TECH./RESEARCH .. .. .. .. .. .. .. ..
TOTAL ENERGY R&D .. .. .. .. .. .. .. ..
1. Australia has not provided data for 2001 and 2002.2. Austria has not provided data for 2001 and 2002.3. Belgium has not provided data for 2001 and 2002.4. All data refer to the fiscal year, April 2002 to March 2003 for 2002.Note: Budgets provided for recent years by some countries may have been estimated.Sources: OECD Economic Outlook, OECD Paris, 2002, and country submissions.
408
ANNEX B Government Energy R&D Budgets
Table B14
IEA Government Energy R&D Expenditure by Country, 2001 and 2002(US$ million at 2002 prices and exchange rates)
393-Annex B 2/12/03 11:25 Page 408

409
Government Energy R&D Budgets ANNEX B
Belgium3 Canada4 Denmark2001 2002 2001 2002e 2001 2002e
$ % $ % $ % $ % $ % $ %
.. .. .. .. 17.83 9.42 17.54 9.20 8.40 19.91 0.34 1.69
.. .. .. .. 8.81 4.66 9.33 4.90 1.12 2.65 – –
.. .. .. .. 9.01 4.76 17.53 9.20 – – – –
.. .. .. .. 3.69 1.95 3.75 1.97 0.35 0.82 – –
.. .. .. .. 39.34 20.80 48.15 25.27 9.87 23.38 0.34 1.69
.. .. .. .. 7.20 3.81 4.45 2.34 1.34 3.17 – –
.. .. .. .. 4.61 2.44 3.75 1.97 – – – –
.. .. .. .. 15.02 7.94 15.81 8.30 – – – –
.. .. .. .. 14.87 7.86 12.70 6.67 0.39 0.91 – –
.. .. .. .. 41.69 22.04 36.71 19.27 1.72 4.09 – –
.. .. .. .. 0.27 0.14 0.28 0.15 – – – –
.. .. .. .. 0.52 0.27 0.39 0.21 – – – –
.. .. .. .. 1.29 0.68 1.27 0.67 – – – –
.. .. .. .. 1.05 0.55 0.64 0.33 – – – –
.. .. .. .. 3.12 1.65 2.58 1.36 – – – –
.. .. .. .. 44.81 23.69 39.29 20.62 1.72 4.09 – –
.. .. .. .. 1.37 0.73 1.31 0.69 1.03 2.44 – –
.. .. .. .. 2.84 1.50 2.14 1.12 3.47 8.23 – –
.. .. .. .. 0.30 0.16 0.39 0.20 – – – –
.. .. .. .. 4.51 2.38 3.84 2.01 4.50 10.67 – –
.. .. .. .. 1.87 0.99 1.44 0.76 6.47 15.34 8.50 41.99
.. .. .. .. – – – – 1.80 4.27 – –
.. .. .. .. 5.97 3.15 6.78 3.56 5.06 11.98 0.66 3.26
.. .. .. .. 0.22 0.12 0.39 0.21 – – – –
.. .. .. .. .. .. 2.72 1.42 – – – –
.. .. .. .. .. .. 1.92 1.01 – – – –
.. .. .. .. 4.36 2.31 4.63 2.43 – – – –
.. .. .. .. 16.93 8.95 17.08 8.97 17.84 42.26 9.16 45.24
.. .. .. .. 0.40 0.21 0.42 0.22 – – – –
.. .. .. .. 36.40 19.25 36.69 19.25 – – – –
.. .. .. .. 0.52 0.27 0.43 0.22 – – – –
.. .. .. .. 1.32 0.70 1.26 0.66 2.32 5.49 1.85 9.15
.. .. .. .. 0.40 0.21 0.42 0.22 – – – –
.. .. .. .. 39.04 20.64 39.21 20.58 2.32 5.49 1.85 9.15
.. .. .. .. 0.78 0.41 0.79 0.41 1.20 2.84 1.26 6.20
.. .. .. .. 39.82 21.05 39.99 20.99 3.51 8.32 3.11 15.35
.. .. .. .. 10.11 5.34 9.60 5.04 1.34 3.17 0.99 4.89
.. .. .. .. 4.93 2.61 3.78 1.99 0.90 2.13 0.19 0.94
.. .. .. .. 3.73 1.97 5.68 2.98 1.47 3.48 2.11 10.40
.. .. .. .. 18.77 9.92 19.06 10.01 3.71 8.78 3.29 16.23
.. .. .. .. 2.64 1.39 1.61 0.85 2.15 5.09 1.42 7.02
.. .. .. .. 26.84 14.19 25.35 13.30 3.41 8.08 2.93 14.46
.. .. .. .. 29.48 15.58 26.96 14.15 5.56 13.17 4.35 21.48
.. .. .. .. 189.14 100.00 190.54 100.00 42.21 100.00 20.24 100.00
393-Annex B 2/12/03 11:25 Page 409
Finland1 France2001 2002 2001 2002e
$ % $ % $ % $ %
1.1 Industry 11.33 18.93 .. .. 2.01 0.48 3.77 0.991.2 Residential. Commercial 6.83 11.41 .. .. 1.44 0.34 2.92 0.771.3 Transportation 3.94 6.58 .. .. 4.22 1.00 6.41 1.691.4 Other Conservation 1.77 2.96 .. .. 3.65 0.86 4.71 1.24
TOTAL CONSERVATION 23.88 39.88 .. .. 11.32 2.67 17.81 4.68
2.1 Enhanced Oil & Gas – – .. .. – – – –2.2 Refining. Transp. & Stor. 2.52 4.21 .. .. 4.51 1.06 3.68 0.972.3 Oil Shale & Tar Sands – – .. .. 0.38 0.09 – –2.4 Other Oil & Gas – – .. .. 27.53 6.50 23.09 6.07
Total Oil & Gas 2.52 4.21 .. .. 32.43 7.65 26.77 7.04
3.1 Coal Prod. Prep. & Trans. 0.03 0.05 .. .. – – – –3.2 Coal Combustion 0.14 0.23 .. .. – – – –3.3 Coal Conversion – – .. .. – – – –3.4 Other Coal 1.94 3.25 .. .. – – – –
Total Coal 2.11 3.53 .. .. – – – –
TOTAL FOSSIL FUELS 4.63 7.73 .. .. 32.43 7.65 26.77 7.04
4.1 Solar Heating & Cooling 0.03 0.05 .. .. 1.06 0.25 1.13 0.304.2 Solar Photo–Electric – – .. .. 7.77 1.83 11.97 3.154.3 Solar Thermal–Electric 0.15 0.26 .. .. – – – –
Total Solar 0.18 0.30 .. .. 8.83 2.08 13.10 3.44
5. Wind 0.68 1.14 .. .. 2.40 0.57 3.77 0.996. Ocean – – .. .. – – – –7. Biomass 6.45 10.77 .. .. 2.30 0.54 3.20 0.848. Geothermal – – .. .. 3.65 0.86 2.17 0.579.1 Large Hydro (>10 MW) – – .. .. – – – –9.2 Small Hydro (<10 MW) 0.63 1.05 .. .. 0.10 0.02 0.09 0.02
Total Hydro 0.63 1.05 .. .. 0.10 0.02 0.09 0.02
TOTAL RENEWABLE ENERGY 7.94 13.26 .. .. 17.27 4.08 22.34 5.87
10.1 Nuclear LWR 3.71 6.19 .. .. 42.21 9.96 17.91 4.7110.2 Other Converter Reactors – – .. .. – – 16.02 4.2110.3 Nuclear Fuel Cycle 1.01 1.69 .. .. 164.05 38.72 82.00 21.5610.4 Nuclear Supporting Tech. 0.78 1.30 .. .. 115.12 27.17 139.49 36.6810.5 Nuclear Breeder – – .. .. – – 3.77 0.99
Total Nuclear Fission 5.50 9.18 .. .. 321.39 75.86 259.19 68.15
11. Nuclear Fusion 1.14 1.91 .. .. 30.70 7.25 35.82 9.42
TOTAL NUCLEAR 6.64 11.09 .. .. 352.09 83.11 295.00 77.57
12.1 Electric Power Conversion 7.54 12.59 .. .. 1.92 0.45 4.24 1.1212.2 Electricity Transm. & Distr. 4.97 8.30 .. .. – – – –12.3 Energy Storage 0.43 0.71 .. .. – – – –
TOTAL POWER & STORAGE 12.93 21.59 .. .. 1.92 0.45 4.24 1.12
13.1 Energy Systems Analysis 3.69 6.16 .. .. 8.63 2.04 14.14 3.7213.2 Other Tech. or Research 0.18 0.30 .. .. – – – –
TOTAL OTHER TECH./RESEARCH 3.86 6.45 .. .. 8.63 2.04 14.14 3.72
TOTAL ENERGY R&D 59.88 100.00 .. .. 423.66 100.00 380.30 100.00
1. Other coal refers to peat. Finland has not provided data for 2002.Note: Budgets provided for recent years by some countries may have been estimated.Sources: OECD Economic Outlook, OECD Paris, 2002, and country submissions.
410
ANNEX B Government Energy R&D Budgets
Table B14 (continued)
IEA Government Energy R&D Expenditure by Country, 2001 and 2002(US$ million at 2002 prices and exchange rates)
393-Annex B 2/12/03 11:25 Page 410

411
Government Energy R&D Budgets ANNEX B
Germany Greece Hungary2001 2002e 2001 2002e 2001 2002e
$ % $ % $ % $ % $ % $ %
4.88 1.74 5.37 2.05 .. .. .. .. 0.06 3.73 0.15 5.0614.37 5.13 10.08 3.85 .. .. .. .. – – 0.03 1.01
– – – – .. .. .. .. 0.08 5.41 – –3.35 1.20 2.36 0.90 .. .. .. .. – – – –
22.60 8.07 17.81 6.80 0.51 7.59 1.38 16.52 0.14 9.15 0.17 6.08
– – – – .. .. .. .. – – – –– – – – .. .. .. .. – – – –– – – – .. .. .. .. – – – –– – – – .. .. .. .. 0.15 10.12 0.14 4.79
– – – – .. .. .. .. 0.15 10.12 0.14 4.79
– – – – .. .. .. .. – – – –15.80 5.64 16.68 6.37 .. .. .. .. 0.22 14.89 0.20 7.060.96 0.34 1.04 0.40 .. .. .. .. – – – –
– – – – .. .. .. .. – – – –
16.76 5.98 17.72 6.76 .. .. .. .. 0.22 14.89 0.20 7.06
16.76 5.98 17.72 6.76 0.45 6.67 0.48 5.78 0.37 25.01 0.34 11.85
11.40 4.07 7.16 2.73 .. .. .. .. 0.29 19.77 0.50 17.4727.01 9.64 24.32 9.28 .. .. .. .. – – – –1.53 0.55 1.04 0.40 .. .. .. .. – – – –
39.94 14.26 32.52 12.41 .. .. .. .. 0.29 19.77 0.50 17.47
16.86 6.02 14.42 5.50 .. .. .. .. – – 0.23 8.10– – – – .. .. .. .. – – – –
3.83 1.37 3.68 1.40 .. .. .. .. 0.68 46.08 0.92 32.076.90 2.46 3.96 1.51 .. .. .. .. – – – –
– – – – .. .. .. .. – – – –– – – – .. .. .. .. – – – –
– – – – .. .. .. .. – – – –
67.53 24.10 54.57 20.83 2.61 38.56 3.08 36.89 0.97 65.85 1.66 57.64
10.06 3.59 3.49 1.33 .. .. .. .. – – – –– – – – .. .. .. .. – – – –
5.65 2.02 4.52 1.73 .. .. .. .. – – – –– – – – .. .. .. .. – – 0.50 17.42– – – – .. .. .. .. – – – –
15.71 5.61 8.01 3.06 .. .. .. .. – – 0.50 17.42
105.55 37.68 106.03 40.47 .. .. .. .. – – – –
121.26 43.28 114.04 43.53 0.96 14.22 1.03 12.31 – – 0.50 17.42
29.21 10.43 36.38 13.88 .. .. .. .. – – – –7.47 2.67 7.07 2.70 .. .. .. .. – – 0.20 7.023.26 1.16 2.73 1.04 .. .. .. .. – – – –
39.94 14.26 46.18 17.63 2.23 32.95 2.38 28.50 – – 0.20 7.02
0.96 0.34 0.75 0.29 .. .. .. .. – – – –11.11 3.97 10.93 4.17 .. .. .. .. – – – –
12.07 4.31 11.69 4.46 .. .. .. .. – – – –
280.16 100.00 262.02 100.00 6.78 100.00 8.34 100.00 1.48 100.00 2.88 100.00
393-Annex B 2/12/03 11:25 Page 411

Ireland Italy2001 2002e 2001 2002e
$ % $ % $ % $ %
1.1 Industry .. .. 0.35 10.08 9.65 3.53 9.43 3.491.2 Residential. Commercial .. .. 2.04 58.99 14.47 5.30 14.14 5.231.3 Transportation .. .. 0.05 1.36 – – – –1.4 Other Conservation .. .. – – – – – –
TOTAL CONSERVATION .. .. 2.44 70.44 24.12 8.83 23.56 8.72
2.1 Enhanced Oil & Gas .. .. – – – – – –2.2 Refining. Transp. & Stor. .. .. – – – – – –2.3 Oil Shale & Tar Sands .. .. – – – – – –2.4 Other Oil & Gas .. .. – – – – – –
Total Oil & Gas .. .. – – – – – –
3.1 Coal Prod. Prep. & Trans. .. .. – – – – – –3.2 Coal Combustion .. .. – – – – – –3.3 Coal Conversion .. .. – – – – – –3.4 Other Coal .. .. – – – – – –
Total Coal .. .. – – – – – –
TOTAL FOSSIL FUELS .. .. – – – – – –
4.1 Solar Heating & Cooling .. .. – – 4.44 1.63 3.77 1.404.2 Solar Photo–Electric .. .. 0.02 0.54 13.51 4.95 9.43 3.494.3 Solar Thermal–Electric .. .. – – 15.92 5.83 33.46 12.39
Total Solar .. .. 0.02 0.54 33.87 12.40 46.65 17.27
5. Wind .. .. 0.19 5.45 0.48 0.18 0.47 0.176. Ocean .. .. 0.23 6.68 – – – –7. Biomass .. .. 0.09 2.72 2.12 0.78 1.89 0.708. Geothermal .. .. – – – – – –9.1 Large Hydro (>10 MW) .. .. – – – – – –9.2 Small Hydro (<10 MW) .. .. 0.02 0.54 – – – –
Total Hydro .. .. 0.02 0.54 – – – –
TOTAL RENEWABLE ENERGY .. .. 0.55 15.94 36.47 13.36 49.01 18.14
10.1 Nuclear LWR .. .. – – – – – –10.2 Other Converter Reactors .. .. – – – – – –10.3 Nuclear Fuel Cycle .. .. – – 44.77 16.40 43.73 16.1910.4 Nuclear Supporting Tech. .. .. – – – – – –10.5 Nuclear Breeder .. .. – – – – – –
Total Nuclear Fission .. .. – – 44.77 16.40 43.73 16.19
11. Nuclear Fusion .. .. – – 58.47 21.41 47.13 17.45
TOTAL NUCLEAR .. .. – – 103.24 37.81 90.86 33.64
12.1 Electric Power Conversion .. .. 0.09 2.72 28.95 10.60 28.28 10.4712.2 Electricity Transm. & Distr. .. .. 0.33 9.54 34.74 12.72 33.93 12.5612.3 Energy Storage .. .. – – 11.77 4.31 11.50 4.26
TOTAL POWER & STORAGE .. .. 0.42 12.26 75.45 27.63 73.70 27.29
13.1 Energy Systems Analysis .. .. – – – – – –13.2 Other Tech. or Research .. .. 0.05 1.36 33.77 12.37 32.99 12.21
TOTAL OTHER TECH./RESEARCH .. .. 0.05 1.36 33.77 12.37 32.99 12.21
TOTAL ENERGY R&D .. .. 3.46 100.00 273.06 100.00 270.12 100.00
1. Japan has not provided data for 20022. Korea has not provided data for 2001 and 2002.3. Luxembourg has no energy R&D programme.Note: Budgets provided for recent years by some countries may have been estimated.Sources: OECD Economic Outlook, OECD Paris, 2002, and country submissions.
412
ANNEX B Government Energy R&D Budgets
Table B14 (continued)
IEA Government Energy R&D Expenditure by Country, 2001 and 2002(US$ million at 2002 prices and exchange rates)
393-Annex B 2/12/03 11:25 Page 412

413
Government Energy R&D Budgets ANNEX B
Japan1 Korea2 Luxembourg3
2001 2002 2001 2002 2001 2002$ % $ % $ % $ % $ % $ %
488.52 14.27 .. .. .. .. .. .. – – – –29.38 0.86 .. .. .. .. .. .. – – – –31.97 0.93 .. .. .. .. .. .. – – – –19.04 0.56 .. .. .. .. .. .. – – – –
568.91 16.62 .. .. .. .. .. .. – – – –
23.84 0.70 .. .. .. .. .. .. – – – –2.14 0.06 .. .. .. .. .. .. – – – –
– – .. .. .. .. .. .. – – – –5.24 0.15 .. .. .. .. .. .. – – – –
31.22 0.91 .. .. .. .. .. .. – – – –
5.55 0.16 .. .. .. .. .. .. – – – –9.08 0.27 .. .. .. .. .. .. – – – –
23.70 0.69 .. .. .. .. .. .. – – – –1.31 0.04 .. .. .. .. .. .. – – – –
39.64 1.16 .. .. .. .. .. .. – – – –
70.87 2.07 .. .. .. .. .. .. – – – –
0.46 0.01 .. .. .. .. .. .. – – – –79.20 2.31 .. .. .. .. .. .. – – – –
– – .. .. .. .. .. .. – – – –
79.65 2.33 .. .. .. .. .. .. – – – –
7.78 0.23 .. .. .. .. .. .. – – – –6.00 0.18 .. .. .. .. .. .. – – – –
15.79 0.46 .. .. .. .. .. .. – – – –18.73 0.55 .. .. .. .. .. .. – – – –
– – .. .. .. .. .. .. – – – –– – .. .. .. .. .. .. – – – –
– – .. .. .. .. .. .. – – – –
127.96 3.74 .. .. .. .. .. .. – – – –
95.79 2.80 .. .. .. .. .. .. – – – –65.78 1.92 .. .. .. .. .. .. – – – –
762.45 22.27 .. .. .. .. .. .. – – – –1 016.31 29.69 .. .. .. .. .. .. – – – –
275.62 8.05 .. .. .. .. .. .. – – – –
2 215.95 64.73 .. .. .. .. .. .. – – – –
187.89 5.49 .. .. .. .. .. .. – – – –
2 403.83 70.22 .. .. .. .. .. .. – – – –
107.37 3.14 .. .. .. .. .. .. – – – –45.73 1.34 .. .. .. .. .. .. – – – –21.03 0.61 .. .. .. .. .. .. – – – –
174.13 5.09 .. .. .. .. .. .. – – – –
1.30 0.04 .. .. .. .. .. .. – – – –76.37 2.23 .. .. .. .. .. .. – – – –
77.67 2.27 .. .. .. .. .. .. – – – –
3 423.37 100.00 .. .. .. .. .. .. – – – –
393-Annex B 2/12/03 11:25 Page 413

Netherlands1 New Zealand2001 2002 2001 2002e
$ % $ % $ % $ %
1.1 Industry 25.92 15.38 .. .. 0.22 5.38 0.18 3.911.2 Residential. Commercial 17.60 10.45 .. .. – – 0.13 2.721.3 Transportation 13.50 8.01 .. .. – – – –1.4 Other Conservation 3.81 2.26 .. .. 0.09 2.13 0.07 1.60
TOTAL CONSERVATION 60.83 36.10 .. .. 0.31 7.52 0.38 8.23
2.1 Enhanced Oil & Gas 6.75 4.00 .. .. 1.44 34.77 1.82 39.062.2 Refining. Transp. & Stor. – – .. .. – – – –2.3 Oil Shale & Tar Sands – – .. .. – – – –2.4 Other Oil & Gas 0.78 0.46 .. .. – – 0.32 6.92
Total Oil & Gas 7.53 4.47 .. .. 1.44 34.77 2.14 45.98
3.1 Coal Prod. Prep. & Trans. – – .. .. 0.04 1.05 0.04 0.933.2 Coal Combustion – – .. .. 0.13 3.07 0.07 1.613.3 Coal Conversion – – .. .. – – 0.05 1.113.4 Other Coal 0.10 0.06 .. .. – – – –
Total Coal 0.10 0.06 .. .. 0.17 4.13 0.17 3.65
TOTAL FOSSIL FUELS 7.63 4.53 .. .. 1.61 38.90 2.31 49.63
4.1 Solar Heating & Cooling 0.20 0.12 .. .. – – – –4.2 Solar Photo–Electric 16.92 10.04 .. .. 0.09 2.24 0.14 3.084.3 Solar Thermal–Electric – – .. .. 0.11 2.64 0.06 1.22
Total Solar 17.11 10.16 .. .. 0.20 4.88 0.20 4.30
5. Wind 13.40 7.95 .. .. 0.11 2.58 0.11 2.286. Ocean 0.29 0.17 .. .. – – – –7. Biomass 13.40 7.95 .. .. 0.43 10.33 0.25 5.468. Geothermal – – .. .. 0.96 23.25 0.67 14.429.1 Large Hydro (>10 MW) – – .. .. – – – –9.2 Small Hydro (<10 MW) – – .. .. – – – –
Total Hydro – – .. .. – – – –
TOTAL RENEWABLE ENERGY 44.20 26.23 .. .. 1.70 41.04 1.23 26.46
10.1 Nuclear LWR 0.49 0.29 .. .. – – – –10.2 Other Converter Reactors 0.39 0.23 .. .. – – – –10.3 Nuclear Fuel Cycle – – .. .. – – – –10.4 Nuclear Supporting Tech. – – .. .. – – – –10.5 Nuclear Breeder 12.91 7.66 .. .. – – – –
Total Nuclear Fission 13.79 8.18 .. .. – – – –
11. Nuclear Fusion 7.24 4.29 .. .. – – – –
TOTAL NUCLEAR 21.03 12.48 .. .. – – – –
12.1 Electric Power Conversion 7.82 4.64 .. .. 0.42 10.04 0.47 10.0012.2 Electricity Transm. & Distr. 0.59 0.35 .. .. – – – –12.3 Energy Storage 0.98 0.58 .. .. – – – –
TOTAL POWER & STORAGE 9.39 5.57 .. .. 0.42 10.04 0.47 10.00
13.1 Energy Systems Analysis 4.50 2.67 .. .. – – 0.10 2.1913.2 Other Tech. or Research 20.93 12.42 .. .. 0.10 2.50 0.16 3.49
TOTAL OTHER TECH./RESEARCH 25.43 15.09 .. .. 0.10 2.50 0.26 5.69
TOTAL ENERGY R&D 168.51 100.00 .. .. 4.14 100.00 4.66 100.00
1. The Netherlands has not provided data for 2002.Note: Budgets provided for recent years by some countries may have been estimated.Sources: OECD Economic Outlook, OECD Paris, 2002, and country submissions.
414
ANNEX B Government Energy R&D Budgets
Table B14 (continued)
IEA Government Energy R&D Expenditure by Country, 2001 and 2002(US$ million at 2002 prices and exchange rates)
393-Annex B 2/12/03 11:25 Page 414

415
Government Energy R&D Budgets ANNEX B
Norway Portugal Spain2001 2002e 2001 2002e 2001 2002e
$ % $ % $ % $ % $ % $ %
0.13 0.26 0.13 0.26 0.31 33.51 0.27 10.92 0.83 1.72 0.76 1.591.38 2.86 1.77 3.63 – – – – 0.59 1.22 0.59 1.24
– – – – – – – – 0.85 1.76 0.79 1.65– – – – – – – – – – – –
1.50 3.12 1.89 3.89 0.31 33.51 0.27 10.92 2.27 4.71 2.15 4.49
4.72 9.80 3.67 7.55 0.01 0.94 0.00 0.08 – – – –1.93 4.01 1.50 3.09 – – – – – – 0.21 0.43
– – – – – – – – – – – –16.97 35.24 13.47 27.74 – – – – – – – –
23.62 49.05 18.65 38.39 0.01 0.94 0.00 0.08 – – 0.21 0.43
– – – – 0.01 1.46 0.04 1.81 – – – –– – – – 0.08 8.01 0.11 4.63 4.15 8.60 3.82 7.97– – – – 0.02 2.50 0.03 1.23 – – – –– – – – 0.04 4.16 0.06 2.31 0.05 0.11 0.05 0.10
– – – – 0.15 16.13 0.24 9.95 4.20 8.71 3.86 8.07
23.62 49.05 18.65 38.39 0.16 17.17 0.25 10.07 4.20 8.71 4.07 8.50
0.30 0.62 0.31 0.64 0.04 3.75 0.02 0.66 0.05 0.10 0.05 0.100.91 1.90 1.29 2.66 0.04 4.79 0.02 0.62 2.35 4.87 2.38 4.98
– – – – – – 0.05 1.85 6.55 13.58 6.90 14.41
1.21 2.52 1.60 3.30 0.08 8.43 0.08 3.13 8.95 18.54 9.33 19.49
0.81 1.69 0.63 1.29 0.01 0.73 0.01 0.42 2.07 4.29 1.86 3.880.25 0.52 0.16 0.34 0.18 19.25 0.02 0.62 – – – –0.89 1.85 0.58 1.19 0.09 9.37 0.13 5.17 4.14 8.59 4.34 9.07
– – – – 0.03 3.33 0.02 1.00 – – – –1.13 2.34 1.06 2.19 – – – – – – – –
– – – – – – – – – – – –
1.13 2.34 1.06 2.19 – – – – – – – –
4.30 8.92 4.03 8.30 0.39 41.10 0.25 10.38 15.16 31.41 15.53 32.44
– – – – – – – – 1.49 3.08 1.38 2.87– – – – – – – – – – – –
1.88 3.90 1.88 3.87 – – – – 7.61 15.77 7.54 15.755.63 11.70 5.01 10.31 – – – – 4.71 9.76 4.67 9.74
– – – – – – – – – – – –
7.51 15.60 6.89 14.18 – – – – 13.81 28.61 13.58 28.37
– – – – – – 1.60 65.43 9.98 20.68 9.71 20.28
7.51 15.60 6.89 14.18 – – 1.60 65.43 23.79 49.30 23.29 48.64
– – 0.88 1.80 0.04 4.79 0.03 1.16 – – – –2.32 4.81 1.68 3.45 0.01 1.56 0.01 0.31 0.85 1.76 0.84 1.750.48 0.99 1.31 2.71 – – – – – – – –
2.79 5.80 3.87 7.97 0.06 6.35 0.04 1.47 0.85 1.76 0.84 1.75
1.13 2.34 1.73 3.56 0.01 0.94 0.01 0.35 0.55 1.15 0.55 1.147.30 15.16 11.52 23.72 0.01 0.94 0.03 1.39 1.43 2.97 1.45 3.03
8.43 17.50 13.25 27.28 0.02 1.87 0.04 1.74 1.99 4.12 2.00 4.17
48.15 100.00 48.57 100.00 0.94 100.00 2.44 100.00 48.26 100.00 47.88 100.00
393-Annex B 2/12/03 11:25 Page 415
Sweden1 Switzerland2001 2002 2001 2002e
$ % $ % $ % $ %
1.1 Industry 5.00 6.24 .. .. 1.30 1.14 1.93 1.671.2 Residential. Commercial 4.09 5.10 .. .. 4.77 4.21 5.78 5.001.3 Transportation 20.16 25.15 .. .. 6.05 5.34 6.42 5.561.4 Other Conservation 3.19 3.97 .. .. 4.99 4.40 5.14 4.44
TOTAL CONSERVATION 32.44 40.46 .. .. 17.12 15.10 19.27 16.67
2.1 Enhanced Oil & Gas – – .. .. 7.24 6.38 7.71 6.672.2 Refining. Transp. & Stor. – – .. .. – – – –2.3 Oil Shale & Tar Sands – – .. .. – – – –2.4 Other Oil & Gas – – .. .. – – – –
Total Oil & Gas – – .. .. 7.24 6.38 7.71 6.67
3.1 Coal Prod. Prep. & Trans. – – .. .. – – – –3.2 Coal Combustion – – .. .. – – – –3.3 Coal Conversion – – .. .. – – – –3.4 Other Coal 0.13 0.17 .. .. – – – –
Total Coal 0.13 0.17 .. .. – – – –
TOTAL FOSSIL FUELS 0.13 0.17 .. .. 7.24 6.38 7.71 6.67
4.1 Solar Heating & Cooling 1.56 1.94 .. .. 4.19 3.69 4.50 3.894.2 Solar Photo–Electric 1.23 1.53 .. .. 10.90 9.61 10.92 9.444.3 Solar Thermal–Electric – – .. .. 0.90 0.79 0.64 0.56
Total Solar 2.78 3.47 .. .. 15.98 14.10 16.06 13.89
5. Wind 3.62 4.51 .. .. 0.93 0.82 1.28 1.116. Ocean – – .. .. – – – –7. Biomass 17.40 21.70 .. .. 4.45 3.92 4.50 3.898. Geothermal 0.43 0.53 .. .. 2.01 1.77 1.93 1.679.1 Large Hydro (>10 MW) – – .. .. 0.77 0.68 0.64 0.569.2 Small Hydro (<10 MW) 0.97 1.21 .. .. 1.30 1.15 1.28 1.11
Total Hydro 0.97 1.21 .. .. 2.07 1.83 1.93 1.67
TOTAL RENEWABLE ENERGY 25.20 31.43 .. .. 25.43 22.43 25.69 22.22
10.1 Nuclear LWR – – .. .. 0.86 0.76 0.64 0.5610.2 Other Converter Reactors – – .. .. 1.76 1.55 1.28 1.1110.3 Nuclear Fuel Cycle 0.91 1.14 .. .. 3.46 3.05 3.21 2.7810.4 Nuclear Supporting Tech. – – .. .. 11.47 10.12 10.92 9.4410.5 Nuclear Breeder 2.76 3.45 .. .. 0.07 0.06 – –
Total Nuclear Fission 3.68 4.59 .. .. 17.63 15.55 16.06 13.89
11. Nuclear Fusion 1.03 1.28 .. .. 15.87 14.00 16.06 13.89
TOTAL NUCLEAR 4.71 5.87 .. .. 33.50 29.54 32.11 27.78
12.1 Electric Power Conversion 7.05 8.79 .. .. 4.94 4.36 5.14 4.4412.2 Electricity Transm. & Distr. 1.19 1.49 .. .. 5.21 4.60 5.14 4.4412.3 Energy Storage 0.52 0.65 .. .. 10.35 9.12 10.28 8.89
TOTAL POWER & STORAGE 8.76 10.93 .. .. 20.50 18.08 20.55 17.78
13.1 Energy Systems Analysis 2.47 3.08 .. .. 7.43 6.55 7.71 6.6713.2 Other Tech. or Research 6.47 8.07 .. .. 2.18 1.92 2.57 2.22
TOTAL OTHER TECH./RESEARCH 8.94 11.15 .. .. 9.61 8.47 10.28 8.89
TOTAL ENERGY R&D 80.18 100.00 .. .. 113.39 100.00 115.61 100.00
1. Sweden has not provided data for 2002.Note: Budgets provided for recent years by some countries may have been estimated.Sources: OECD Economic Outlook, OECD Paris, 2002, and country submissions.
416
ANNEX B Government Energy R&D Budgets
Table B14 (continued)
IEA Government Energy R&D Expenditure by Country, 2001 and 2002(US$ million at 2002 prices and exchange rates)
393-Annex B 2/12/03 11:25 Page 416

417
Government Energy R&D Budgets ANNEX B
Turkey United Kingdom United States2001 2002e 2001 2002e 2001 2002e
$ % $ % $ % $ % $ % $ %
1.29 13.65 2.02 13.22 – – – – 150.25 5.28 144.13 5.060.00 0.00 0.00 0.00 – – – – 131.65 4.63 125.22 4.400.08 0.83 1.27 8.31 – – 0.82 1.44 258.20 9.07 246.14 8.640.00 0.02 0.01 0.06 – – – – 47.87 1.68 62.59 2.20
1.37 14.50 3.30 21.59 – – 0.82 1.44 587.97 20.66 578.07 20.30
1.90 20.07 2.09 13.67 2.00 4.27 1.94 3.40 68.41 2.40 75.35 2.650.04 0.37 0.02 0.14 – – – – 21.08 0.74 14.19 0.50
– – 0.00 0.01 – – – – – – – –– – 0.00 0.00 1.33 2.83 1.36 2.39 23.64 0.83 12.96 0.46
1.93 20.44 2.11 13.82 3.33 7.09 3.31 5.79 113.13 3.98 102.50 3.60
1.66 17.53 1.66 10.87 – – – – 4.34 0.15 4.90 0.172.91 30.75 6.30 41.25 5.69 12.11 4.51 7.89 175.29 6.16 219.97 7.730.00 0.01 0.00 0.00 – – – – 7.64 0.27 25.00 0.880.00 0.00 0.00 0.00 – – – – 56.27 1.98 72.05 2.53
4.56 48.29 7.96 52.12 5.69 12.11 4.51 7.89 243.54 8.56 321.92 11.31
6.50 68.73 10.08 65.95 9.02 19.21 7.81 13.68 356.67 12.54 424.42 14.91
0.03 0.36 0.04 0.26 – – – – 3.95 0.14 4.71 0.170.03 0.31 0.03 0.17 2.78 5.93 8.10 14.18 75.88 2.67 71.55 2.51
– – – – – – – – 13.86 0.49 13.18 0.46
0.06 0.67 0.07 0.43 2.78 5.93 8.10 14.18 93.70 3.29 89.44 3.14
0.08 0.84 0.10 0.68 2.17 4.61 3.15 5.51 39.99 1.41 38.21 1.34– – – – 1.55 3.29 3.75 6.56 – – – –
0.06 0.62 0.05 0.31 2.78 5.93 4.20 7.35 87.21 3.07 87.68 3.080.25 2.59 0.43 2.81 – – 0.30 0.53 27.21 0.96 27.04 0.95
– – – – – – – – .. .. .. ..– – – – 0.15 0.33 – – .. .. .. ..
– – – – 0.15 0.33 – – 5.04 0.18 4.99 0.18
0.45 4.71 0.65 4.23 9.44 20.09 19.49 34.13 253.15 8.90 247.36 8.69
0.01 0.08 0.03 0.18 – – – – .. .. .. ..0.00 0.00 0.00 0.00 – – – – .. .. .. ..0.00 0.05 – – – – – – .. .. .. ..0.16 1.65 0.14 0.89 – – – – 47.82 1.68 49.24 1.73
– – – – – – – – – – – –
0.17 1.78 0.16 1.08 – – – – 47.82 1.68 49.24 1.73
– – – – 22.63 48.19 21.93 38.41 251.22 8.83 241.10 8.47
0.17 1.78 0.16 1.08 22.63 48.19 21.93 38.41 299.04 10.51 290.34 10.20
0.21 2.24 0.28 1.84 2.47 5.27 2.85 4.99 84.44 2.97 74.78 2.630.45 4.80 0.42 2.73 – – – – 46.26 1.63 .. ..0.03 0.30 0.00 0.00 – – – – 6.05 0.21 70.14 2.46
0.69 7.34 0.70 4.57 2.47 5.27 2.85 4.99 136.75 4.81 144.92 5.09
0.10 1.08 0.08 0.56 0.46 0.99 0.45 0.79 .. .. .. ..0.18 1.86 0.31 2.03 2.94 6.26 3.75 6.56 1 211.72 42.59 1 162.15 40.82
0.28 2.94 0.40 2.59 3.40 7.25 4.20 7.35 1 211.72 42.591 162.15 40.82
9.45 100.00 15.28 100.00 46.96 100.00 57.11 100.00 2 845.29 100.002 847.26 100.00
393-Annex B 2/12/03 11:25 Page 417

393-Annex B 2/12/03 11:25 Page 418

ANNEX C
INTERNATIONAL ENERGY AGENCY “SHARED GOALS”
Member countries* of the IEA seek to create the conditions in which the energy sectorsof their economies can make the fullest possible contribution to sustainable economicdevelopment and the well-being of their people and of the environment. Informulating energy policies, the establishment of free and open markets is afundamental point of departure, though energy security and environmental protectionneed to be given particular emphasis by governments. IEA countries recognise thesignificance of increasing global interdependence in energy. They therefore seek topromote the effective operation of international energy markets and encouragedialogue with all participants.
In order to secure their objectives they therefore aim to create a policy frameworkconsistent with the following goals:
1. Diversity, efficiency and flexibilitywithin the energy sector are basic condi-tions for longer-term energy security: thefuels used within and across sectors andthe sources of those fuels should be asdiverse as practicable. Non-fossil fuels,particularly nuclear and hydro power,make a substantial contribution to theenergy supply diversity of IEA countriesas a group.
2. Energy systems should have theability to respond promptly and flexiblyto energy emergencies. In some casesthis requires collective mechanisms andaction: IEA countries co-operate throughthe Agency in responding jointly to oilsupply emergencies.
3. The environmentally sustainableprovision and use of energy is central tothe achievement of these shared goals.Decision-makers should seek to minimisethe adverse environmental impacts ofenergy activities, just as environmentaldecisions should take account of theenergy consequences. Government inter-ventions should where practicable haveregard to the Polluter Pays Principle.
4. More environmentally acceptableenergy sources need to be encouragedand developed. Clean and efficient useof fossil fuels is essential. The develop-ment of economic non-fossil sources isalso a priority. A number of IEA memberswish to retain and improve the nuclear
* Australia, Austria, Belgium, Canada, the Czech Republic, Denmark, Finland, France, Germany, Greece,Hungary, Ireland, Italy, Japan, Korea, Luxembourg, the Netherlands, New Zealand, Norway, Portugal,Spain, Sweden, Switzerland, Turkey, the United Kingdom, the United States.
419
419-Annex C + fin 2/12/03 11:21 Page 419

420
ANNEX C International Energy Agency “Shared Goals”
option for the future, at the highestavailable safety standards, becausenuclear energy does not emit carbondioxide. Renewable sources will also havean increasingly important contribution tomake.
5. Improved energy efficiency canpromote both environmental protectionand energy security in a cost-effectivemanner. There are significant opportuni-ties for greater energy efficiency at allstages of the energy cycle from produc-tion to consumption. Strong efforts bygovernments and all energy users areneeded to realise these opportunities.
6. Continued research, developmentand market deployment of new andimproved energy technologies make acritical contribution to achieving the ob-jectives outlined above. Energy technolo-gy policies should complement broaderenergy policies. International co-opera-tion in the development and dissemina-tion of energy technologies, includingindustry participation and co-operationwith non-member countries, should beencouraged.
7. Undistorted energy prices enablemarkets to work efficiently. Energy pricesshould not be held artificially below thecosts of supply to promote social orindustrial goals. To the extent necessaryand practicable, the environmental costsof energy production and use should bereflected in prices.
8. Free and open trade and a secureframework for investment contribute toefficient energy markets and energysecurity. Distortions to energy trade andinvestment should be avoided.
9. Co-operation among all energymarket participants helps to improveinformation and understanding, andencourage the development of efficient,environmentally acceptable and flexibleenergy systems and markets worldwide.These are needed to help promote theinvestment, trade and confidence neces-sary to achieve global energy securityand environmental objectives.
(The Shared Goals were adopted by IEAMinisters at their 4 June 1993 meetingin Paris.)
419-Annex C + fin 2/12/03 11:21 Page 420

ANNEX D
COMMUNIQUE
MEETING OF THE IEA GOVERNING BOARD AT MINISTERIAL LEVEL, 28-29 APRIL 2003
We, the energy ministers of IEA member countries, meeting in Paris on the 28-29 April 2003, agree:
Energy Security, Environmental Protection and Economic Growth – “The ThreeE’s” – remain robust as the IEA’s guiding principles for energy policy. Reachingour shared goals requires constant adaptation to changing circumstances andrenewal of commitment. This is particularly true in the context of the currentgeopolitical instability in key energy-producing regions, price volatility, demandgrowth and a growing threat to our environment.
Energy Security Remains our Focus
We strongly affirm our readiness to combat any disruption of oil supplies,including through the judicious use of emergency oil stocks, demand restraintand other appropriate response measures.
We welcome the benefit of reinforced dialogue between producers andconsumers of oil, as well as between the IEA and OPEC secretariats, which hascontributed to mitigating the effects of potentially serious crises in worldmarkets and the economy. We appreciate OPEC Ministers’ commitment tokeep world oil markets amply supplied, and we call for attention to thecorrelation between oil market volatility and low industry stocks, and theimportance of maintaining adequate stocks to anticipate seasonal needs andto promote oil market stability.
The Eighth International Energy Forum (IEF), held in Osaka last September,made a substantial contribution to that dialogue. We look forward to theNinth IEF, to be held from 22 to 24 May 2004 in Amsterdam, the Netherlands,and pledge our active support for greater co-operation between consumersand producers.
Recent energy market events have provided a sharp reminder of the centralrole of energy for our near-term security. Insecurity arises from a range ofissues, including geopolitical instability, natural disasters, terrorism and evenpoor regulatory design. Increasingly tight capacity in energy infrastructureand production facilities and diminished potential for fuel substitution
421
419-Annex C + fin 2/12/03 11:21 Page 421

demand renewed attention to existing energy security policies and procedures.Growing oil demand in IEA member and non-member countries, particularly intransport, requires greater effort by importing countries to build and holdappropriate emergency stocks.
Addressing the Challenges of Investment, Diversification,Efficiency and Technology
Meeting the longer-term challenges of maintaining a secure, efficient and safeenergy system will require near-term action. Substantial new investment willbe needed to provide secure supply, to reduce growing energy-related greenhousegas emissions and to overcome the problem of the lack of access to electricityfor more than a quarter of the world’s population.
Diversity by energy type, source and route remains essential to improvingenergy security. Each country has chosen its own mix of fuels among oil, gas,coal, nuclear and renewables based on energy resource endowments andnational policies. We call for the continuing development of policies andprograms, consistent with national priorities, to promote diversification, includingincreased support for energy research, development, demonstration anddeployment. We remain particularly interested in the acceleration of thecommercial availability of cleaner technologies with low pollution and carbonemissions.
While appreciating that much has been done since the first oil shock of 1973to reduce energy use per unit of output, more can and must be done. Wecommit ourselves to achieving greater energy efficiency both through nationalprograms and through international technology collaboration. To do so, wewill increase incentives to efficiency in market and consumer behaviour, inparticular in the transport sector, for buildings and equipment. We will alsoseek to reduce energy intensity through R&D, technological innovation andinternational collaboration.
Our high and rising dependence on oil, particularly in transport, posessignificant economic, security and environmental challenges. We recognisethe importance of working together, and with the private sector, to accelerateresearch and development in fuel efficiency and competitive alternative fuelsources and carriers in our economies and worldwide. We note, in particular,our intent to further develop the technologies for a hydrogen future.
We note the increasing reliance on natural gas in the energy mix as well asthe growing dependence in many countries on natural gas imports, and haveconsidered its implication for overall energy security. Notwithstanding theregionally discrete nature of gas markets, national level production anddistribution problems can nonetheless affect global energy markets. We callon the Secretariat to continue its assessment of these vulnerabilities, and toidentify policy options and strategies, including securing diverse gas sources
422
ANNEX D Communique International Energy Agency
419-Annex C + fin 2/12/03 11:21 Page 422

and routes as well as technology development, to contribute to a greater securityof gas supply. The collaboration of government and industry is essential to thiseffort.
Strengthening and extending the forces of the marketplace within and beyondour borders can contribute to enhancing energy security, economic growthand environmental protection. We commit ourselves to strengthen the policyframework permitting markets to meet our global investment and trade needsand to promote enabling environments that will attract private investment.
Promoting International Co-operation
We affirm the increasing importance of IEA non-member countries in worldenergy markets and warmly welcome the participation of Russian EnergyMinister Igor Yusufov at this meeting. We will engage Russia and other keycountries more actively in our dialogue on energy policy, and we direct theSecretariat to reinforce a world-view in its work. In particular, we encouragethe acceleration of energy security co-operation with international organisationsand IEA non-member countries, especially those critical to global energy supplyand demand. We recognise that only through a more global framework cansecurity be assured.
Committing to Sustainable Development
We acknowledge the importance of, and our commitment to, implementingthe agreements reached at the Johannesburg World Summit on SustainableDevelopment of September 2002. We particularly commit ourselves toenhance the role of renewables and other lower carbon-emitting sources ofenergy in the energy mix, and work to shape a future where basic energyservices will be available to an increasing number of the world’s citizens. Wewill continue our efforts to mitigate the impact of energy use on the globalenvironment, and in particular on the global climate system, consistent withour efforts under the UN Framework Convention on Climate Change. We willcontinue to stimulate the development of new market-oriented instrumentsessential to reaching our sustainable development goals at lower costs. Wealso call for the further development of technologies needed to meet thesegoals, and to this end, with the help of the Secretariat, call for a review of thefocus of our co-operative R&D programs in strategic areas.
We reaffirm our commitment to promoting a sustainable energy future,meeting the social, environmental and economic challenges this entails.
423
Communique International Energy Agency ANNEX D
419-Annex C + fin 2/12/03 11:21 Page 423

419-Annex C + fin 2/12/03 11:21 Page 424

ANNEX E
MEASUREMENT OF FINANCIAL SUPPORT FOR COAL PRODUCTION
The Producer Subsidy Equivalent (PSE) measures financial support for coalproduction. The PSE includes support for the production of coal that theindustry would normally be expected to cover in a competitive environment.This includes direct state payments, the value of protection provided by importconstraints and the effects of special sales agreements.
Support for production is normally either direct budgetary assistance, or pricesupport. Many direct payments to producers help to maintain domesticproduction and are included in the PSE. Other direct payments are designedto speed contraction of the industry, or are otherwise unrelated to currentproduction, and are taken into account.
Price support is typically provided by government-imposed limits on coalimports, or as the result of agreements between coal producers and large coalconsumers (usually electric utilities), sometimes involving government intripartite agreements. Published information on these arrangements is limited.The practical effect of these arrangements is to protect indigenous coalproduction. It is necessary to select a reference price for comparable coalqualities, against which the domestic price is to be compared, to measure thedegree of support provided through higher prices.
Although an average PSE per tonne produced is calculated, some mines mayrequire more support than the average and some less, perhaps none at all.
425
419-Annex C + fin 2/12/03 11:21 Page 425

426
ANNEX E Measurement of Financial Support for Coal Production
Coun
try
1991
1992
1993
1994
1995
1996
1997
1998
1999
2000
p
Fran
cePr
oduc
tion
(in m
illio
n tc
e)10
.07
9.45
8.30
7.46
7.80
7.07
5.73
4.43
4.13
3.16
Aid
per
tce
(in
FRF)
222
225
288
269
7581
434
581
564
691
Aid
per
tce
(in
USD
)39
.42
42.5
150
.79
48.4
114
.95
15.7
374
.41
98.6
991
.76
97.15
Ger
man
y Pr
oduc
tion
(in m
illio
n tc
e)67
.57
66.8
659
.29
53.15
54.4
548
.94
47.0
641
.62
40.0
234
.00
Aid
per
tce
(in
DEM
)17
018
419
224
222
422
0.34
217
211
216.
924
4.5
Aid
per
tce
(in
USD
)10
2.40
117.
9311
5.93
149.
2015
6.15
146.
4112
4.94
119.
8311
8.2
115.
4
Japa
nPr
oduc
tion
(in m
illio
n tc
e)6.
345.
985.
685.
464.
935.
103.
372.
912.
80n.
a.A
id p
er t
ce (i
n Ye
n)17
289
15 6
4917
192
17 1
8416
878
15 5
5316
849
13 7
7215
107
n.a.
Aid
per
tce
(in
USD
)12
8.54
123.
5215
4.60
168.
1417
9.36
142.
9513
9.24
105.
6213
4.29
n.a.
Spai
nPr
oduc
tion
(in m
illio
n tc
e)11
.60
12.3
912
.33
12.3
911
.94
11.9
512
.07
11.0
010
.34
10.3
8A
id p
er t
ce (i
n PT
A)
6 35
46
073
6 13
310
370
11 5
9311
058
11 5
9112
624
11 3
7612
652
Aid
per
tce
(in
USD
)61
.16
59.3
248
.22
77.3
992
.97
87.2
879
.18
85.8
372
.92
70.3
2
Turk
eyPr
oduc
tion
(in m
illio
n tc
e)2.
692.
472.
462.
341.
881.
971.
941.
641.
471.
67A
id p
er t
ce (i
n ‘0
00 T
L)63
71
713
1 76
02
106
6 48
78
031
12 3
7127
212
63 9
7613
8 07
8A
id p
er t
ce (i
n U
SD)
151.
6124
8.32
160.
0270
.66
141.
9598
.79
81.6
010
4.54
155.
822
0.95
Uni
ted
King
dom
Prod
uctio
n (in
mill
ion
tce)
78.11
69.7
556
.41
41.2
346
.97
43.1
041
.70
35.4
232
.06
27.5
Aid
per
tce
(in
GBP
)14
.45
15.5
13.
455.
032.
762.
674.
300.
000.
00
2.15
Aid
per
tce
(in
USD
)25
.49
27.2
15.
187.
714.
354.
167.
030.
000.
003.
25
p:Pr
elim
inar
y da
ta, s
ubje
ct t
o re
visi
on.
Not
e:tc
e is
ton
ne o
f coa
l equ
ival
ent.
Tabl
e1
IEA
Se
cre
taria
t Est
ima
tes
of T
ota
l Pro
duc
er S
ubsi
dy
Equi
vale
nt (
PSE)
for C
oa
l Pro
duc
tion
in S
ele
cte
d IE
A C
oun
trie
s
419-Annex C + fin 2/12/03 11:21 Page 426
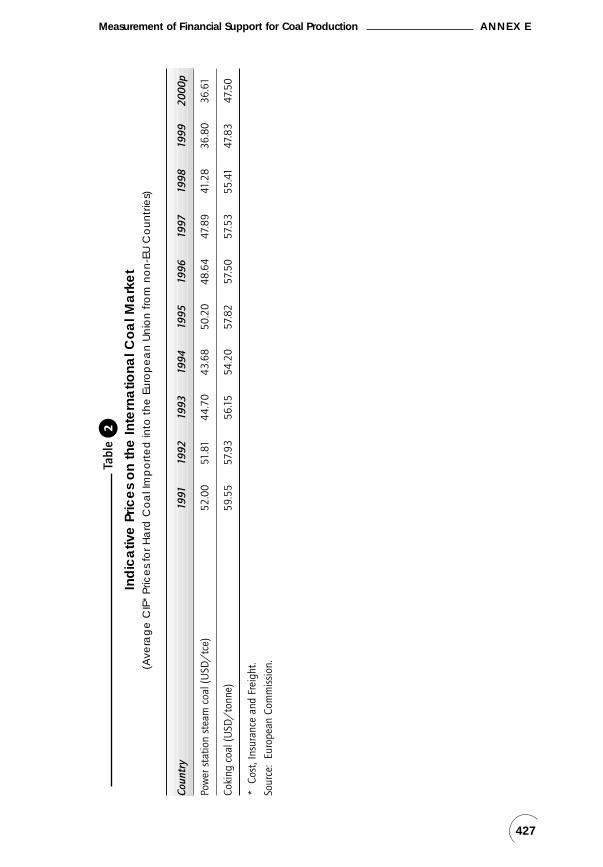
427
Measurement of Financial Support for Coal Production ANNEX E
Coun
try
1991
1992
1993
1994
1995
1996
1997
1998
1999
2000
p
Pow
er s
tatio
n st
eam
coa
l (U
SD/
tce)
52.0
051
.81
44.7
043
.68
50.2
048
.64
47.8
941
.28
36.8
036
.61
Coki
ng c
oal (
USD
/to
nne)
59.5
557
.93
56.15
54.2
057
.82
57.5
057
.53
55.4
147
.83
47.5
0
*Co
st, I
nsur
ance
and
Fre
ight
.
Sour
ce:
Euro
pean
Com
mis
sion
.
Tabl
e2
Ind
ica
tive
Pric
es
on
the
Inte
rna
tiona
l Co
al M
ark
et
(Ave
rag
e C
IF*
Pric
es
for
Ha
rd C
oa
l Im
po
rte
d in
to t
he
Eu
rop
ea
n U
nio
n f
rom
no
n-E
U C
ou
ntr
ies)
419-Annex C + fin 2/12/03 11:21 Page 427

419-Annex C + fin 2/12/03 11:21 Page 428

ANNEX F
GLOSSARY AND LIST OF ABBREVIATIONS
In this report, abbreviations are substituted for a number of terms used withinthe International Energy Agency. Although these terms are generally writtenout on first mention and abbreviated subsequently, this glossary provides aquick and central reference for many of the abbreviations used.
AMEM ASEAN Energy Ministers’ Meeting
APEC Asian Pacific Economic Co-operation
APM Administrative Pricing Mechanism
APSA ASEAN Petroleum Security Agreement
ASCOPE ASEAN Council on Petroleum
ASEAN Association of South-East Asian Nations
bcf billion cubic feet
BEE Bureau of Energy Efficiency
CDM Clean Development Mechanism
CERT Committee on Energy Research and Technology
CHP combined production of heat and power; sometimes, when referringto industrial CHP, the term “co-generation” is used
CNOOC China National Offshore Oil Corporation
CO2 carbon dioxide
COP Conference of the Parties
CRE Energy Regulatory Commission
CSD Commission for Sustainable Development
CTI Climate Technology Initiative
EU The European Union, whose members are Austria, Belgium, Denmark,Finland, France, Germany, Greece, Ireland, Italy, Luxembourg, theNetherlands, Portugal, Spain, Sweden and the United Kingdom
FERC Federal Electricity Regulatory Commission
FSU Former Soviet Union
GDP gross domestic product
GHG greenhouse gas
429
419-Annex C + fin 2/12/03 11:21 Page 429

IEA International Energy Agency whose members are Australia,Austria, Belgium, Canada, the Czech Republic, Denmark, Finland,France, Germany, Greece, Hungary, Ireland, Italy, Japan, Korea,Luxembourg, the Netherlands, New Zealand, Norway, Portugal,Spain, Sweden, Switzerland, Turkey, the United Kingdom, the UnitedStates
IEF International Energy Forum
IEP International Energy Program
IPHE International Partnership for the Hydrogen Economy
IPP independent power producer
ISO` independent system operator
JCC Japanese crude cocktail
JI Joint Implementation
kb/d thousand barrels per day
kWh kilowatt-hour, or one kilowatt × one hour, or one watt × one hour× 103
LDC local distribution company
LNG liquefied natural gas
LPG liquefied petroleum gas; refers to propane, butane and theirisomers, which are gases at atmospheric pressure and normaltemperature
mb/d million barrels per day
MBtu million British thermal units
mcm million cubic metres
MEDT Ministry of Economic Development and Trade
Mt million tonnes
Mtoe million tonnes of oil equivalent; see toe
NGL natural gas liquids
NSO Neutral Transmission System Organisation
OECD Organisation for Economic Co-operation and Development
OPEC Organization of Petroleum Exporting Countries
PSA production-sharing agreement
R&D research and development, especially in energy technology; mayinclude the demonstration and dissemination phases as well
430
ANNEX F Glossary and List of Abbreviations
419-Annex C + fin 2/12/03 11:21 Page 430

RTO regional transmission organisations
SOME ASEAN Senior Officials Meeting on Energy
tcf trillion cubic feet
TFC total final consumption of energy; the difference between TPESand TFC consists of net energy losses in the production of electricityand synthetic gas, refinery use and other energy sector uses andlosses
toe tonne of oil equivalent, defined as 107 kcal
TRC Tradable Renewable Energy Certificates
TPA third-party access
TPES total primary energy supply
UNEP United Nations Environment Programme
UNFCCC United Nations Framework Convention on Climate Change
WSSD World Summit for Sustainable Development
1Q first quarter
2Q second quarter
3Q third quarter
4Q fourth quarter
Average exchange rates in 2002 were as follow:
Australia A$ 1 = US$ 0.543
Canada C$ 1 = US$ 0.639
Czech Republic Kcs 1 = US$ 0.0306
Denmark DKr 1 = US$ 0.127
Hungary Ft 1 = US$ 0.0039
Japan ¥ 1 = US$ 0.008
Korea W 1 = US$ 0.0008
New Zealand NZ$ 1 = US$ 0.462
Norway NKr 1 = US$ 0.125
Sweden SKr 1 = US$ 0.103
Switzerland SF 1 = US$ 0.642
Turkey TL 1 000 = US$ 0.0007
United Kingdom £ 1 = US$ 1.490
Euro € 1 = US$ 0.943
431
Glossary and List of Abbreviations ANNEX F
419-Annex C + fin 2/12/03 11:21 Page 431

419-Annex C + fin 2/12/03 11:21 Page 432

ANNEX G
FOOTNOTES TO ENERGY BALANCES AND KEY STATISTICAL DATA
1. Includes lignite and peat, except for Finland, Ireland and Sweden. In thesethree cases, peat is shown separately.
2. Comprises solid biomass, liquid biomass, biogas, industrial waste andmunicipal waste. Data are often based on partial surveys and may not becomparable between countries.
3. “Other” includes tide, wave and ambient heat used in heat pumps.
4. Total net imports include combustible renewables and wastes.
5. Total supply of electricity represents net trade. A negative numberindicates that exports are greater than imports.
6. Includes non-energy use.
7. Includes less than 1% non-oil fuels.
8. Includes residential, commercial, public service and agricultural sectors.
9. Inputs to electricity generation include inputs to electricity, CHP and heatplants. Output refers only to electricity generation.
10. Losses arising in the production of electricity and heat at public utilitiesand autoproducers. For non-fossil-fuel electricity generation, theoreticallosses are shown based on plant efficiencies of 33% for nuclear, 10% forgeothermal and 100% for hydro.
11. Data on “losses” for forecast years often include large statistical differencescovering differences between expected supply and demand and mostly donot reflect real expectations on transformation gains and losses.
12. Toe per thousand US dollars at 1995 prices and exchange rates.
13. Toe per person.
14. “Energy-related CO2 emissions” have been estimated using the IPCC Tier ISectoral Approach. In accordance with the IPCC methodology, emissionsfrom international marine and aviation bunkers are not included innational totals. Projected emissions for oil and gas are derived bycalculating the ratio of emissions to energy use for 2001 and applying thisfactor to forecast energy supply. Future coal emissions are based onproduct-specific supply projections and are calculated using the IPCC/OECD emission factors and methodology.
433
419-Annex C + fin 2/12/03 11:21 Page 433

F
419-Annex C + fin 2/12/03 11:21 Page 434
OECD TOKYO CENTRE
Tel: (+81-3) 3586 2016Fax: (+81-3) 3584 7929
E-mail: [email protected]
OECD WASHINGTON CENTER
Tel: (+1-202) 785-6323Toll-free number for orders:
(+1-800) 456-6323Fax: (+1-202) 785-0350
E-mail: [email protected]
INTERNATIONALENERGY AGENCY
O R D E R F O R M
You can also sendyour order
to your nearestOECD sales point
or throughthe OECD online
services:www.oecd.org/
bookshop
OECD PARIS CENTRETel: (+33-01) 45 24 81 67Fax: (+33-01) 49 10 42 76E-mail: [email protected]
OECD BONN CENTRETel: (+49-228) 959 12 15Fax: (+49-228) 959 12 18E-mail: [email protected]
OECD MEXICO CENTRETel: (+52-5) 280 12 09Fax: (+52-5) 280 04 80E-mail: [email protected]
IEA BOOKSFax: +33 (0)1 40 57 65 59
E-mail: [email protected]/books
DELIVERY DETAILSName Organisation
Address
Country Postcode
Telephone E-mail
PAYMENT DETAILS
I enclose a cheque payable to IEA Publications for the sum of €
Please debit my credit card (tick choice). Mastercard VISA American Express
Card no:
Expiry date: Signature:
PUBLICATIONS ISBN QTY PRICE TOTAL
Energy Policies of IEA Countries – 2003 Review (Compendium) 92-64-01480-2 €120
Energy Policies of IEA Countries – Finland – 2003 Review 92-64-01482-9 Forthcoming
Energy Policies of IEA Countries – Japan – 2003 Review 92-64-01474-8 €75
Energy Policies of IEA Countries – Italy – 2003 Review 92-64-01476-4 €75
Energy Policies of IEA Countries – Switzerland – 2003 Review 92-64-01478-0 €75
Energy Policies of IEA Countries – Ireland – 2003 Review 92-64-01472-1 €75
Energy Policies of IEA Countries – Hungary – 2003 Review 92-64-01470-5 €75
Energy Policies of IEA Countries – 2002 Review (Compendium) 92-64-19773-7 €120
TOTAL
I would like to order the following publications
9, rue de la FédérationF-75739 Paris Cedex 15
419-Annex C + fin 2/12/03 11:21 Page 435

IEA PUBLICATIONS, 9, rue de la Fédération, 75739 PARIS CEDEX 15
PRINTED IN FRANCE BY STEDI
(61 2003 13 1P1) ISBN 92-64-01480-2 - 2003
419-Annex C + fin 2/12/03 11:21 Page 436