energy saver aged-care toolkit - nsw environment & heritage · 2.2 energy management...
TRANSCRIPT

Aged-care toolkit
ENERGY SAVER
savepower.nsw.gov.au

Published by:
Office of Environment and HeritageDepartment of Premier and Cabinet59-61 Goulburn Street, SydneyAustralia
Ph: 02 9995 5000 (switchboard)Ph: 131 555 (environment information and publication requests)Ph: 1300 361 967 (national parks, climate change and energyefficiency information and publication requests)Fax: 02 9995 5999TTY: 02 9211 4723Email: [email protected]: www.environment.nsw.gov.au
OEH 2012/0602 ISBN 978 1 74293 736 6Published August 2012
© Copyright State of NSW and the Department of Premier and Cabinet NSW 2012
The Office of Environment and Heritage, Department of Premier and Cabinet and the State of NSW are pleased to allow this material to be reproduced in whole or in part for educational and non-commercial use, provided the meaning is unchanged and its source, publisher and authorship are acknowledged.
Office of Environment and Heritage, Department of Premier and Cabinet NSW (OEH) has compiled the Aged-care toolkit in good faith, exercising all due care and attention. OEH does not accept responsibility for any inaccurate or incomplete information supplied by third parties. No representation is made about the accuracy, completeness or suitability of the information in this publication for any particular purpose. OEH shall not be liable for any damage which may occur to any person or organisation taking action or not on the basis of this publication. Readers should seek appropriate advice when applying the information to their specific needs.

1
Table of contents
1. Introduction . . . . . . . . . . . . . . . . . . . . . . . . . . . . . . . . . . . . . . . . . . . . . . . . . . . . . . . . . . . . . . . . . . . . . . . . . . . . . . . . . . . . . . . . . . . . . . . . . . . . . . . . . . . . . . . . . . . . . . . . . . . . . . . . . . . . . . . . . . . . . . . . . . . . . . . . . . . . . . . . . . . . . . . . . . . . .2
2. Energy consumption in aged-care facilities . . . . . . . . . . . . . . . . . . . . . . . . . . . . . . . . . . . . . . . . . . . . . . . . . . . . . . . . . . . . . . . . . . . . . . . . . . . . . . . . . . . . . . . . . . . . . . . . . . . . . . . . . .3
2.1 Energy audit review . . . . . . . . . . . . . . . . . . . . . . . . . . . . . . . . . . . . . . . . . . . . . . . . . . . . . . . . . . . . . . . . . . . . . . . . . . . . . . . . . . . . . . . . . . . . . . . . . . . . . . . . . . . . . . . . . . . . . . . . . . . . . . . . . . . . . . . . . . . . . . . . . . . . . . . . . 3
2.2 Energy management fundamentals . . . . . . . . . . . . . . . . . . . . . . . . . . . . . . . . . . . . . . . . . . . . . . . . . . . . . . . . . . . . . . . . . . . . . . . . . . . . . . . . . . . . . . . . . . . . . . . . . . . . . . . . . . . . . . . . . . . . . . . . . 3
2.3 Energy costs . . . . . . . . . . . . . . . . . . . . . . . . . . . . . . . . . . . . . . . . . . . . . . . . . . . . . . . . . . . . . . . . . . . . . . . . . . . . . . . . . . . . . . . . . . . . . . . . . . . . . . . . . . . . . . . . . . . . . . . . . . . . . . . . . . . . . . . . . . . . . . . . . . . . . . . . . . . . . . . . . . . . . . . 4
2.4 Energy use breakdown . . . . . . . . . . . . . . . . . . . . . . . . . . . . . . . . . . . . . . . . . . . . . . . . . . . . . . . . . . . . . . . . . . . . . . . . . . . . . . . . . . . . . . . . . . . . . . . . . . . . . . . . . . . . . . . . . . . . . . . . . . . . . . . . . . . . . . . . . . . . . . . . . . . 5
2.5 Daily trends . . . . . . . . . . . . . . . . . . . . . . . . . . . . . . . . . . . . . . . . . . . . . . . . . . . . . . . . . . . . . . . . . . . . . . . . . . . . . . . . . . . . . . . . . . . . . . . . . . . . . . . . . . . . . . . . . . . . . . . . . . . . . . . . . . . . . . . . . . . . . . . . . . . . . . . . . . . . . . . . . . . . . . . . . 6
3. Energy benchmarks and potential savings . . . . . . . . . . . . . . . . . . . . . . . . . . . . . . . . . . . . . . . . . . . . . . . . . . . . . . . . . . . . . . . . . . . . . . . . . . . . . . . . . . . . . . . . . . . . . . . . . . . . . . . . . . . .7
3.1 What drives energy consumption? . . . . . . . . . . . . . . . . . . . . . . . . . . . . . . . . . . . . . . . . . . . . . . . . . . . . . . . . . . . . . . . . . . . . . . . . . . . . . . . . . . . . . . . . . . . . . . . . . . . . . . . . . . . . . . . . . . . . . . . . . . . . 7
3.2 Benchmarks . . . . . . . . . . . . . . . . . . . . . . . . . . . . . . . . . . . . . . . . . . . . . . . . . . . . . . . . . . . . . . . . . . . . . . . . . . . . . . . . . . . . . . . . . . . . . . . . . . . . . . . . . . . . . . . . . . . . . . . . . . . . . . . . . . . . . . . . . . . . . . . . . . . . . . . . . . . . . . . . . . . . . . . . 7
3.3 Energy savings . . . . . . . . . . . . . . . . . . . . . . . . . . . . . . . . . . . . . . . . . . . . . . . . . . . . . . . . . . . . . . . . . . . . . . . . . . . . . . . . . . . . . . . . . . . . . . . . . . . . . . . . . . . . . . . . . . . . . . . . . . . . . . . . . . . . . . . . . . . . . . . . . . . . . . . . . . . . . . . . . . . 9
4. Opportunities for energy savings . . . . . . . . . . . . . . . . . . . . . . . . . . . . . . . . . . . . . . . . . . . . . . . . . . . . . . . . . . . . . . . . . . . . . . . . . . . . . . . . . . . . . . . . . . . . . . . . . . . . . . . . . . . . . . . . . . . . . . . . . . . . . 11
4.1 Building fabric . . . . . . . . . . . . . . . . . . . . . . . . . . . . . . . . . . . . . . . . . . . . . . . . . . . . . . . . . . . . . . . . . . . . . . . . . . . . . . . . . . . . . . . . . . . . . . . . . . . . . . . . . . . . . . . . . . . . . . . . . . . . . . . . . . . . . . . . . . . . . . . . . . . . . . . . . . . . . . . . . . 11
4.2 Lighting . . . . . . . . . . . . . . . . . . . . . . . . . . . . . . . . . . . . . . . . . . . . . . . . . . . . . . . . . . . . . . . . . . . . . . . . . . . . . . . . . . . . . . . . . . . . . . . . . . . . . . . . . . . . . . . . . . . . . . . . . . . . . . . . . . . . . . . . . . . . . . . . . . . . . . . . . . . . . . . . . . . . . . . . . . . . . . 12
4.3 Air-conditioning . . . . . . . . . . . . . . . . . . . . . . . . . . . . . . . . . . . . . . . . . . . . . . . . . . . . . . . . . . . . . . . . . . . . . . . . . . . . . . . . . . . . . . . . . . . . . . . . . . . . . . . . . . . . . . . . . . . . . . . . . . . . . . . . . . . . . . . . . . . . . . . . . . . . . . . . . . . . . .16
4.4 Heating . . . . . . . . . . . . . . . . . . . . . . . . . . . . . . . . . . . . . . . . . . . . . . . . . . . . . . . . . . . . . . . . . . . . . . . . . . . . . . . . . . . . . . . . . . . . . . . . . . . . . . . . . . . . . . . . . . . . . . . . . . . . . . . . . . . . . . . . . . . . . . . . . . . . . . . . . . . . . . . . . . . . . . . . . . . . . . . 19
4.5 Hot water . . . . . . . . . . . . . . . . . . . . . . . . . . . . . . . . . . . . . . . . . . . . . . . . . . . . . . . . . . . . . . . . . . . . . . . . . . . . . . . . . . . . . . . . . . . . . . . . . . . . . . . . . . . . . . . . . . . . . . . . . . . . . . . . . . . . . . . . . . . . . . . . . . . . . . . . . . . . . . . . . . . . . . . . . . 20
4.6 Laundry . . . . . . . . . . . . . . . . . . . . . . . . . . . . . . . . . . . . . . . . . . . . . . . . . . . . . . . . . . . . . . . . . . . . . . . . . . . . . . . . . . . . . . . . . . . . . . . . . . . . . . . . . . . . . . . . . . . . . . . . . . . . . . . . . . . . . . . . . . . . . . . . . . . . . . . . . . . . . . . . . . . . . . . . . . . . . 22
4.7 Kitchen . . . . . . . . . . . . . . . . . . . . . . . . . . . . . . . . . . . . . . . . . . . . . . . . . . . . . . . . . . . . . . . . . . . . . . . . . . . . . . . . . . . . . . . . . . . . . . . . . . . . . . . . . . . . . . . . . . . . . . . . . . . . . . . . . . . . . . . . . . . . . . . . . . . . . . . . . . . . . . . . . . . . . . . . . . . . . . . 23
4.8 Other equipment . . . . . . . . . . . . . . . . . . . . . . . . . . . . . . . . . . . . . . . . . . . . . . . . . . . . . . . . . . . . . . . . . . . . . . . . . . . . . . . . . . . . . . . . . . . . . . . . . . . . . . . . . . . . . . . . . . . . . . . . . . . . . . . . . . . . . . . . . . . . . . . . . . . . . . . . . . .24
5. Energy efficiency checklist. . . . . . . . . . . . . . . . . . . . . . . . . . . . . . . . . . . . . . . . . . . . . . . . . . . . . . . . . . . . . . . . . . . . . . . . . . . . . . . . . . . . . . . . . . . . . . . . . . . . . . . . . . . . . . . . . . . . . . . . . . . . . . . . . . . . . . . . . . . . 25
6. Further support . . . . . . . . . . . . . . . . . . . . . . . . . . . . . . . . . . . . . . . . . . . . . . . . . . . . . . . . . . . . . . . . . . . . . . . . . . . . . . . . . . . . . . . . . . . . . . . . . . . . . . . . . . . . . . . . . . . . . . . . . . . . . . . . . . . . . . . . . . . . . . . . . . . . . . . . . . . . . . . . . . . 30
6.1 Seek specialist help . . . . . . . . . . . . . . . . . . . . . . . . . . . . . . . . . . . . . . . . . . . . . . . . . . . . . . . . . . . . . . . . . . . . . . . . . . . . . . . . . . . . . . . . . . . . . . . . . . . . . . . . . . . . . . . . . . . . . . . . . . . . . . . . . . . . . . . . . . . . . . . . . . . . . . . 30
6.2 Financial support . . . . . . . . . . . . . . . . . . . . . . . . . . . . . . . . . . . . . . . . . . . . . . . . . . . . . . . . . . . . . . . . . . . . . . . . . . . . . . . . . . . . . . . . . . . . . . . . . . . . . . . . . . . . . . . . . . . . . . . . . . . . . . . . . . . . . . . . . . . . . . . . . . . . . . . . . . . 30
6.3 Energy efficiency information and resources. . . . . . . . . . . . . . . . . . . . . . . . . . . . . . . . . . . . . . . . . . . . . . . . . . . . . . . . . . . . . . . . . . . . . . . . . . . . . . . . . . . . . . . . . . . . . . . . . . . . . .31
Glossary . . . . . . . . . . . . . . . . . . . . . . . . . . . . . . . . . . . . . . . . . . . . . . . . . . . . . . . . . . . . . . . . . . . . . . . . . . . . . . . . . . . . . . . . . . . . . . . . . . . . . . . . . . . . . . . . . . . . . . . . . . . . . . . . . . . . . . . . . . . . . . . . . . . . . . . . . . . . . . . . . . . . . . . . . . . . . . . . . . . . . . . 32

2 ENERGY SAVER Aged-care toolkit
1. Introduction
As Australia’s population ages, there is an increasing demand for aged-care services. The sector currently consumes around 7.8 million gigajoules of energy in Australia each year. Around a third of this energy consumption is in NSW, which has more than 930 facilities currently offering more than 62,000 residential places. As demand increases, so too will this energy consumption.
Energy prices have also been rising with projections that they will continue to rise in the future. This has a direct impact on operational costs of facilities, many of which are already operating in an environment of low financial returns.
This toolkit is intended for maintenance managers, property and asset managers, finance controllers and others in the aged-care industry to identify and understand the savings and costs relevant to implementing energy-saving projects. Directors of facilities may also find it useful in understanding what drives the energy consumption of their facilities and to identify the total energy savings that may be possible for their site.
The Energy Saver program has developed this toolkit to help your organisation:
� understand the drivers of energy use at aged-care facilities
� recognise seasonal and daily energy usage cycles
� identify key areas for improvement
� identify energy efficiency technologies that are appropriate to aged-care facilities
� understand how much energy-saving initiatives cost and their likely return on investment.
An energy efficiency checklist has also been included in section 5. This can be used as a quick guide to carry out your own site inspection and focus on the key areas where energy can be saved. Details of how to improve the energy efficiency of these areas is outlined in section 4.
Benefits of energy efficiency � Reduced operating and maintenance costs.
� Reduced system and equipment failure.
� Improved indoor environment and air quality and increased resident comfort.
� Enables the cost savings to be used elsewhere in the business.
� Lower energy consumption and carbon emissions.
Energy Saver programThe NSW Office of Environment and Heritage’s Energy Saver program provides services to assist medium to large NSW businesses reduce their energy consumption and costs.
Energy Saver provides subsidised energy audits, technical and project support, resources and training to assist businesses to identify and implement energy savings.
Contact the Energy Saver team to find out how we can assist you.
Email: [email protected]
Phone: (02) 8837 6000
Web: www.environment.nsw.gov.au/sustainbus

3Energy consumption in aged-care facilities
to gas-boosted solar hot water. Additional savings could also be found through other measures, such as equipment maintenance, effective purchasing and good housekeeping.
Table 2.1: Range of audited aged-care facilities
Site characteristics Variation
Climate 4 different climate zones across NSW
Gross floor area 3100–11,764 m2
Number of beds 40–180 beds
Occupancy 56–100%
Services provided 2 high-care, 4 low-care and 9 mixed-care sites
Age of facility 2–30 years
Proportional split between electricity and
gas use
All facilities used both gas and electricity with 13 facilities using over 50% electricity and 2 facilities using over 50% gas
Annual electricity consumption
291–1482 Megawatt hours (MWh)
Annual gas consumption 66–3507 Gigajoules (GJ)
This toolkit is based on 15 energy audits of NSW residential aged-care facilities. The findings were verified against another five audits, which were also conducted through the Office of Environment and Heritage’s (OEH) Energy Saver program. The program provides subsidised energy audits to help NSW organisations reduce their energy use and costs.
The 15 audits represent a cross-section of facilities, with different operations, locations and size (see Table 2.1). Despite this diversity, there were several common areas where energy saving opportunities were identified.
This toolkit looks at areas where energy can be used more efficiently and provides a range of solutions and their associated costs and savings. It outlines strategies to:
� reduce energy demand by improving building insulation
� improve control of systems that use energy
� upgrade inefficient equipment.
OpportunitiesThe review found that site savings of more than 15 per cent for electricity and 18 per cent for gas could be achieved by implementing energy efficiency projects. This includes savings on lighting energy of up to 80 per cent and hot water energy savings of up to 90 per cent when switching
2. Energy consumption in aged-care facilities
2.1 Energy audit review
2.2 Energy management fundamentals
Successful energy management requires an integrated approach, so it’s best to avoid implementing initiatives in isolation. From the outset, it is important to:
� get senior management buy-in
� understand your organisation’s energy use, costs and legal obligations – this will help to substantiate your business case for projects
� get buy-in from your staff – some energy efficiency initiatives will require them to change their current behaviours
� incorporate energy efficiency criteria into your operational, maintenance, procurement, refurbishment and design practices.
Your energy management program needs long-term commitment and planning to maximise benefits and potential savings.
Next steps � Learn how to manage your energy through the
OEH Energy Management Basics training course. www.environment.nsw.gov.au/sustainbus/greenskills/training.htm
� Find out how to engage and motivate your employees through the Staff Engagement module of the OEH Sustainability Advantage program. www.environment.nsw.gov.au/sustainbus/SustAdvStaff.htm
� Identify improvements your staff can make to save energy, water and waste through the Resource Efficiency module of the OEH Sustainability Advantage program. www.environment.nsw.gov.au/sustainbus/SustAdvResourceEff.htm

4 ENERGY SAVER Aged-care toolkit
2.3 Energy costs
� Install power factor correction
Power factor is a measure of how effectively electricity supplied from the grid is used by the facility. A power factor approaching ‘one’ means that there is little or no wastage of the supplied electricity. Improving the power factor during periods of maximum demand has the potential to significantly reduce electricity demand costs. Power factor correction equipment (capacitor banks) on supply points can be installed to improve a site’s power factor when it’s suboptimal. The upfront cost of this technology is around $10,000 to $20,000 with a payback period of one to two years.
Next steps � Find out more about energy price rises and
how they relate to your organisation in the ISF report. Located at: datasearch.uts.edu.au/isf/publications/index.cfm?year=2011
� Forecast your own energy price rises using the online calculator located at: datasearch.uts.edu.au/isf/publications/index.cfm?year=2012
� Learn how to read your energy bills and track your demand (kVA) through the OEH Energy management basics training course: www.environment.nsw.gov.au/sustainbus/greenskills/training.htm
Aged-care facilities in NSW pay an average $128 per megawatt hour (MWh) for electricity and $19 per gigajoule (GJ) of gas based on the findings of this review. One GJ = 0.2778 MWh, so the gas price is about half the electricity price for the same amount of energy.
Electricity prices have risen significantly over the past four years and are expected to continue to increase.
The Institute of Sustainable Futures (ISF) was commissioned by the Energy Saver program to forecast future energy prices for businesses using 160 MWh to 10,000 MWh of electricity annually. Only generic estimates were calculated, covering volume charges, which are applied per unit of energy consumed. These calculations do not include demand charges.
The study predicted that by 2020 electricity prices will increase by at least 28 per cent or as much as 50 per cent.
Gas prices are forecast to increase by 39 to 54 per cent in the same time period.
How to reduce your demand charges Demand is a measure of the rate at which energy is consumed. Peak demand seldom occurs for more than a few hours or fractions of hours each month or year, but electricity companies must maintain sufficient generating and transmission capacity to supply this peak demand. Therefore a demand charge is based on $/kilovolt for your highest monthly or annual demand.
While demand charges on your bill cannot be negotiated with your supplier, there are a number of strategies to minimise them.
� Spread electricity consumption throughout the day
Turning everything on at once will maximise your peak demand charges, so look for ways to spread out the load. Learn the off-peak times for your tariff and, wherever possible, schedule non-essential operations to take place at these times.
5Energy consumption in aged-care facilities
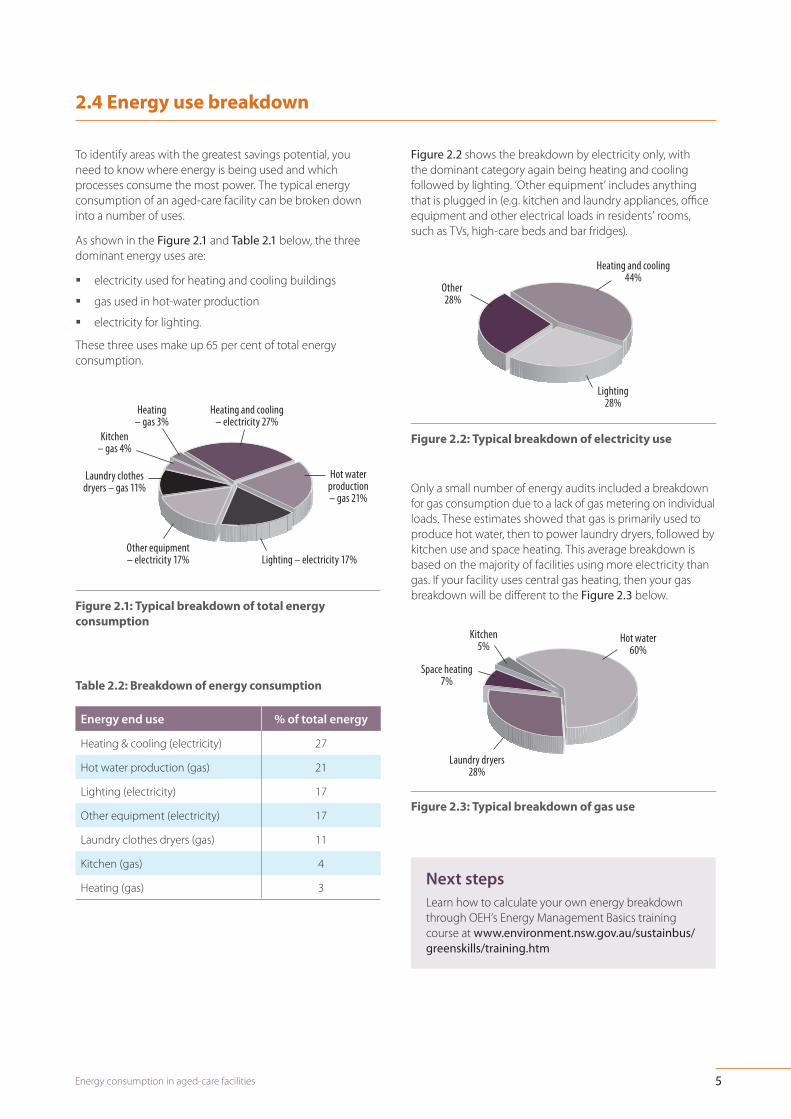
2.4 Energy use breakdown
Figure 2.2 shows the breakdown by electricity only, with the dominant category again being heating and cooling followed by lighting. ‘Other equipment’ includes anything that is plugged in (e.g. kitchen and laundry appliances, office equipment and other electrical loads in residents’ rooms, such as TVs, high-care beds and bar fridges).
Figure 2.2: Typical breakdown of electricity use
Only a small number of energy audits included a breakdown for gas consumption due to a lack of gas metering on individual loads. These estimates showed that gas is primarily used to produce hot water, then to power laundry dryers, followed by kitchen use and space heating. This average breakdown is based on the majority of facilities using more electricity than gas. If your facility uses central gas heating, then your gas breakdown will be different to the Figure 2.3 below.
Figure 2.3: Typical breakdown of gas use
Next stepsLearn how to calculate your own energy breakdown through OEH’s Energy Management Basics training course at www.environment.nsw.gov.au/sustainbus/greenskills/training.htm
To identify areas with the greatest savings potential, you need to know where energy is being used and which processes consume the most power. The typical energy consumption of an aged-care facility can be broken down into a number of uses.
As shown in the Figure 2.1 and Table 2.1 below, the three dominant energy uses are:
� electricity used for heating and cooling buildings
� gas used in hot-water production
� electricity for lighting.
These three uses make up 65 per cent of total energy consumption.
Figure 2.1: Typical breakdown of total energy consumption
Table 2.2: Breakdown of energy consumption
Energy end use % of total energy
Heating & cooling (electricity) 27
Hot water production (gas) 21
Lighting (electricity) 17
Other equipment (electricity) 17
Laundry clothes dryers (gas) 11
Kitchen (gas) 4
Heating (gas) 3
Heating – gas 3%
Lighting 28%
Other 28%
Kitchen5%
Hot water 60%
Space heating7%
Laundry dryers 28%
Kitchen – gas 4%
Laundry clothes dryers – gas 11%
Heating and cooling – electricity 27%
Heating and cooling 44%
Other equipment – electricity 17%
Hot water production – gas 21%
Lighting – electricity 17%

6 ENERGY SAVER Aged-care toolkit
kW
kW
0.30
1.30
2.30
3.30
4.30
5.30
6.30
7.30
8.30
9.30
10.30
11.30
12.30
13.30
14.30
15.30
16.30
17.30
18.30
19.30
20.30
21.30
22.30
23.30
90
80
70
60
50
40
30
20
10
0
Time of day
2.5 Daily trends
Half-hourly interval data for your electricity consumption and load can be obtained from your energy supplier if your site consumes more than 160 MWh annually. This information is recorded by your energy meter.
When analysing this data, similar trends were found for all the audited aged-care facilities.
Aged-care facilities operate 24/7, so electricity is continually used for some tasks. While electricity is never completely turned off, the typical overnight base load is generally 20 per cent of the overall consumption.
This base load rises steeply in the morning with the start of laundry and kitchen operations.
The daily use then changes depending on the season. In summer, electricity consumption peaks towards the middle of the day due to the increased air-conditioning load (see Figure 2.4). In winter, electricity consumption shows an early morning peak between 8.00 am and 10.30 am due to heating requirements (see Figure 2.5). During winter there is no peak during the middle of the day but facilities in colder climates have an additional evening peak between 5.00 pm and 9.30 pm due to heating requirements.
Electricity consumption reduces considerably during the more temperate spring and autumn months.
Next steps � Contact your energy supplier to obtain
your electricity meter interval data. This includes consumption (kWh) and load (kVa).
� Learn how to input your half-hourly interval data into a tool which will graph your own load profiles through the OEH Energy Management Basics training course at www.environment.nsw.gov.au/sustainbus/greenskills/training.htm
� Consider your startup times and whether they could be amended to reduce energy use.
kW
kW
0.30
1.30
2.30
3.30
4.30
5.30
6.30
7.30
8.30
9.30
10.30
11.30
12.30
13.30
14.30
15.30
16.30
17.30
18.30
19.30
20.30
21.30
22.30
23.30
90
80
70
60
50
40
30
20
10
0
Time of day
Figure 2.4: Summer daily consumption profile
kW
0.15
1.00
1.45
2.30
3.15
4.00
4.45
5.30
6.15
7.00
7.45
8.30
9.15
10.00
10.45
11.30
12.15
13.00
13.45
14.30
15.15
16.00
16.45
17.30
18.15
19.00
10.45
20.30
21.15
22.00
22.45
23.30
100
90
80
70
60
50
40
30
20
10
0
kW
Time of day
Figure 2.5: Winter daily consumption profile
12.30 pm to 5 pm afternoon peak
6 am start up
9 am morning peak
6 am start up
6 am-10.30 am morning peak

7Energy benchmarks and potential savings
3.1 What drives energy consumption?
mainly by more hot water and dryer usage in colder weather and also through heat losses from uninsulated hot-water pipe work.
When measuring your energy consumption, temperature can be taken into account through using a rolling monthly indicator for monitoring energy usage for a single facility and tracking performance over time (e.g. comparing monthly energy usage in December 2011 against December 2010). This takes into account seasonal changes.
Regression AnalysisThis is a statistical method that determines the strength of the relationship between one dependent variable and a series of other changing variables.
3. Energy benchmarks and potential savings
Audit data confirmed that electricity use is strongly correlated to outside temperature. Regression analysis found that, on average, over 80 per cent of the variation in electricity consumption is due to the outside temperature and follows a seasonal pattern. The additional seasonal load is generated by the extra heating and cooling required.
The review also identified that the further outside temperature moves from the normal range of living temperatures the higher the increase in energy consumption. This highlights the need to control the thermal efficiency of buildings to try and reduce the impacts of these temperature extremes.
There was a lesser correlation between gas use and temperature, which was to be expected given 12 of the 15 facilities used electricity as their main energy source. However, gas use did increase at lower temperatures when it was used for hot-water production. This would be caused
3.2 Benchmarks
Benchmarks allow you to monitor your energy performance against specified performance standards and compare it to other aged-care facilities. Ideally, these benchmarks should normalise the energy performance for variables beyond the control of the operator.
While temperature was identified as having the greatest correlation with energy use, it is a difficult indicator for benchmarking across multiple sites. The energy industry uses ‘heating degree days’ and ‘cooling degree days’ to calculate the effect of the outside air temperature on a building’s energy consumption. If you are interested in learning more about this concept go to: www.degreedays.net.
Statistically, it is desirable to use as many data points as possible when establishing a benchmark. The Aged-care resource data management tool has been developed to capture this data. Over time, as more facilities use it, more useful benchmarks will be established.
Next stepsBenchmark your performance against other aged-care facilities. Input your site information and consumption data into the Aged-care Resource Data Management Tool, available online at www.agedservices.asn.au.

8 ENERGY SAVER Aged-care toolkit
Benchmark case studyA benchmark analysis of the 15 sites that were audited was undertaken to identify if there were any variables apart from temperature that also correlated with the energy use of all sites (see Table 3.1). This is a small sample and would not be representative of the aged-care industry as a whole.
Table 3.1: Benchmark case study results
Variables
Regression analysis results
(degree of correlation %)
Annual occupied bed days 74%
Number of beds 52%
Gross Floor Area (m2) 28%
Age of facility No correlation
The regression analysis found there was a correlation between the number of beds and site electricity consumption. As a number of the audited sites were operating with either low occupancy or around 80 per cent, the occupied bed days also correlated strongly with electricity consumption. This signals that large variations in occupancy may impact on energy consumption as
space heating and cooling and hot-water production requirements are reduced at low occupancies.
There was a weak correlation with gross floor area and there was no relationship found between the age of the facility and electricity consumption. This means there was no trend found for older buildings to consume more or less energy than newer buildings. This may come down to the individual buildings’ climatic location or whether its building fabric and heating/cooling systems have been improved over time.
Older buildings will have issues going forward as to whether they are fit for purpose and whether they can be cost-effectively retrofitted to provide suitable heating and cooling for residents.
There was also no correlation found between these variables and gas usage. This was expected because the audited sites used electricity rather than gas as their main energy source.
If you own a number of facilities it may be useful to undertake your own regression analysis of your energy consumption against these variables and temperature to determine the most suitable benchmark for your properties.
Notes:

9Energy benchmarks and potential savings
3.3 Energy savings
From a cost perspective, facilities can achieve greater savings for electricity efficiency projects than gas initiatives primarily because electricity costs more than gas.
The savings were all calculated in today’s energy prices for comparison purposes. Keep in mind that the projected future energy price increases will reduce a 10-year payback project to seven years and a five-year payback project to 3.8 years.
Installing power factor correction equipment and switching to ozone laundry systems can have paybacks of only two years.
TipRemember, the financial payback period will reduce as energy prices increase.
ElectricityTypical site electricity savings of more than 15 per cent were found through the aged-care energy audits. Table 3.2 identifies the level of savings versus their ‘payback’ period. Payback is how quickly the project pays for itself in the form of reduced energy bills.
This shows that overall site savings can rise to 13 per cent for projects under a five-year payback. New lighting solutions can save up to 80 per cent of lighting energy (see page 15).
GasLarger gas savings can be achieved faster, with an average of 18 per cent savings found for projects with five or less year’s payback (see Table 3.3). Gas-boosted solar hot water can reduce hot water costs by up to 90 per cent (see page 20).
Table 3.2: Site electricity savings
Payback period < 2 years < 3 years < 5 years < 10 years
Electricity consumption savings 4% 8% 13% 18%
Table 3.3: Site gas savings
Payback period < 2 years < 3 years < 5 years < 10 years
Gas consumption savings 2% 13% 18% 20%
Energy Savings CertificatesProject costs can be reduced if your energy efficiency project is eligible to generate Energy Savings Certificates (ESC).
You can transfer your project’s electricity savings to an Accredited Certificate Provider (ACP) who will create ESCs on your behalf and then register and trade them to liable entities.
Liable entities include NSW electricity retailers who are required under the Energy Saving Scheme legislation to purchase certificates to meet energy-saving targets.
One ESC is equivalent to one tonne of carbon dioxide equivalent saved. Determining the number of certificates varies depending on the technology used to save the energy and because savings can be brought forward, in
some instances up to 10 years. The ACP will undertake these calculations for you. They may also require data-logging or meter data to monitor and verify the savings.
The price of a certificate is open to market fluctuations (in 2011 the price per certificate varied between $25 and $30) and the ACP will negotiate with you a proportion of these costs to cover their expenses.
Contact an ACP to discuss whether your energy efficiency project is eligible for ESCs: www.ess.nsw.gov.au/How_to_be_involved/Work_with_an_Accredited_Certificate_Provider
Refer to section 6.2 for further information on financial support opportunities.
10 ENERGY SAVER Aged-care toolkit
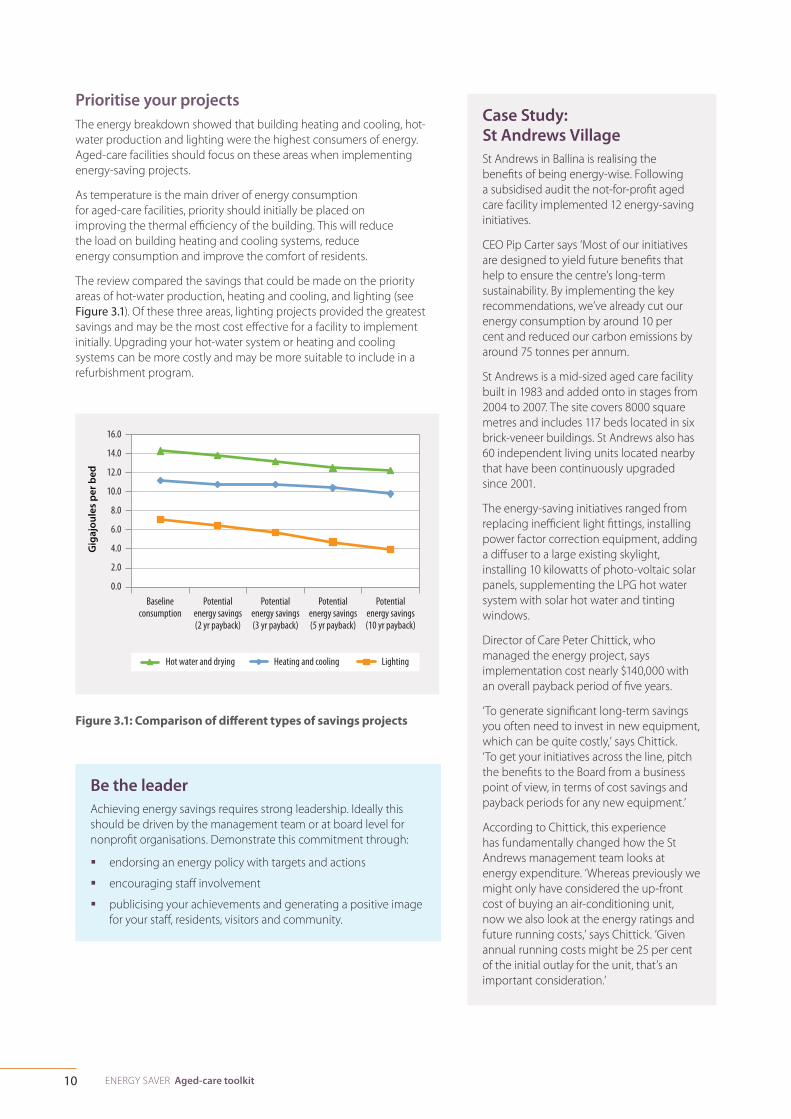
Prioritise your projectsThe energy breakdown showed that building heating and cooling, hot-water production and lighting were the highest consumers of energy. Aged-care facilities should focus on these areas when implementing energy-saving projects.
As temperature is the main driver of energy consumption for aged-care facilities, priority should initially be placed on improving the thermal efficiency of the building. This will reduce the load on building heating and cooling systems, reduce energy consumption and improve the comfort of residents.
The review compared the savings that could be made on the priority areas of hot-water production, heating and cooling, and lighting (see Figure 3.1). Of these three areas, lighting projects provided the greatest savings and may be the most cost effective for a facility to implement initially. Upgrading your hot-water system or heating and cooling systems can be more costly and may be more suitable to include in a refurbishment program.
Gig
ajou
les
per b
ed
16.0
14.0
12.0
10.0
8.0
6.0
4.0
2.0
0.0Baseline
consumption
Hot water and drying Heating and cooling Lighting
Potential energy savings (2 yr payback)
Potential energy savings (3 yr payback)
Potential energy savings (5 yr payback)
Potential energy savings (10 yr payback)
Figure 3.1: Comparison of different types of savings projects
Be the leaderAchieving energy savings requires strong leadership. Ideally this should be driven by the management team or at board level for nonprofit organisations. Demonstrate this commitment through:
� endorsing an energy policy with targets and actions
� encouraging staff involvement
� publicising your achievements and generating a positive image for your staff, residents, visitors and community.
Case Study: St Andrews VillageSt Andrews in Ballina is realising the benefits of being energy-wise. Following a subsidised audit the not-for-profit aged care facility implemented 12 energy-saving initiatives.
CEO Pip Carter says ‘Most of our initiatives are designed to yield future benefits that help to ensure the centre’s long-term sustainability. By implementing the key recommendations, we’ve already cut our energy consumption by around 10 per cent and reduced our carbon emissions by around 75 tonnes per annum.
St Andrews is a mid-sized aged care facility built in 1983 and added onto in stages from 2004 to 2007. The site covers 8000 square metres and includes 117 beds located in six brick-veneer buildings. St Andrews also has 60 independent living units located nearby that have been continuously upgraded since 2001.
The energy-saving initiatives ranged from replacing inefficient light fittings, installing power factor correction equipment, adding a diffuser to a large existing skylight, installing 10 kilowatts of photo-voltaic solar panels, supplementing the LPG hot water system with solar hot water and tinting windows.
Director of Care Peter Chittick, who managed the energy project, says implementation cost nearly $140,000 with an overall payback period of five years.
‘To generate significant long-term savings you often need to invest in new equipment, which can be quite costly,’ says Chittick. ‘To get your initiatives across the line, pitch the benefits to the Board from a business point of view, in terms of cost savings and payback periods for any new equipment.’
According to Chittick, this experience has fundamentally changed how the St Andrews management team looks at energy expenditure. ‘Whereas previously we might only have considered the up-front cost of buying an air-conditioning unit, now we also look at the energy ratings and future running costs,’ says Chittick. ‘Given annual running costs might be 25 per cent of the initial outlay for the unit, that’s an important consideration.’

11Opportunities for energy savings
HousekeepingCompile a regular checklist for housekeeping inspections that covers all issues which may impact energy efficiency. This will strengthen current operating practices and identify areas where energy could be saved. Conduct these housekeeping inspections at different times during the day and night to capture changes in energy use.
Use the checklists in this Toolkit to start you off.
Shading windowsExternal shading devices, such as canvas awnings and roller shutters, reduce heat gain through windows in summer by 70 to 85 per cent. Fitting tinted or reflective coatings to windows can reduce the amount of solar heat gain where external shading devices aren’t suitable. If you plan to tint windows, select carefully as tinting can also reduce heat gain in winter.
Table 4.1 shows the approximate costs and payback periods for some of the main energy efficiency measures to improve the thermal efficiency of an aged-care building.
4. Opportunities for energy savings
4.1 Building fabric
The outside temperature is the main driver of energy consumption for aged-care facilities, so it is essential to focus on improving the building fabric. The rate that heat can be lost or gained within an aged-care building depends on:
� the temperature difference between inside and outside air
� the insulation properties of the building fabric
� the amount of fresh air entering the building through poorly fitted windows, doors or joins in windows.
InsulationInstalling ceiling insulation is likely to have the biggest impact on reducing variations between inside and outside air temperatures. Insulation can reduce heating and cooling energy requirements by 25 per cent. In colder climates insulating floors, where accessible, will also reduce temperature extremes.
Draught proofingOlder facilities may have gaps in walls, windows, doors and skylights. These should be identified as part of routine maintenance and can be fixed through caulking or adding weather stripping, however, operators should be mindful of AS1668.2 ventilation requirements. Curtains with pelmets can reduce draughts, help rooms retain more of their residual heat overnight and reduce winter heat losses by up to 40 per cent.
Table 4.1: Building fabric energy and cost savings
Measure Cost Annual savings1 Payback period
Draught proofing $50–$100 weather stripping per door or window
9% of electricity consumption ($8000 for a 100-bed facility) 3–5 yrs
Curtains $200/m2 4% of electricity consumption ($3500 for a 100-bed facility) > 5 yrs
Window shading > $250/m2 4% of electricity consumption ($3500 for a 100-bed facility) > 5 yrs
Window tinting $80/m2 4% of electricity consumption ($3500 for a 100-bed facility) > 5 yrs
Ceiling insulation $13-$14/m2 to supply and install R3.5 or R4.0 ceiling batts
11% of electricity consumption ($9500 for a 100-bed facility)
5–7 yrs
1 Note that paybacks can vary depending on the application.
Notes:

12 ENERGY SAVER Aged-care toolkit
A well-lit environment is essential for the safety of residents, especially elderly people who may have failing eyesight. Lighting typically represents around 17 per cent of the total energy consumption in aged-care facilities, so there is significant potential to make savings. A good starting point is to know the recommended lighting levels for specific areas in aged-care facilities. Table 4.2 outlines the Commonwealth Department of Health and Ageing lighting standards as well as those additional areas covered by the Australian Standard 1680. Where areas are covered by both standards, the Commonwealth requirements are generally more stringent.
The following energy management strategy should be followed:
� reduce the demand for artificial lighting
� optimise the use of existing lighting systems
� upgrade to more energy-efficient lighting systems.
It is common for newer aged-care facilities to incorporate skylights into their design to make the most of natural daylight and reduce the demand for artificial lighting. Ideally, the surrounding lighting circuits should be put on a photoelectric sensor so that they do not come on if there is sufficient light coming from the skylights. Photoelectric sensors can also be linked to outdoor lighting.
4.2 Lighting
Table 4.2: Required lux levels
Area
Commonwealth Department of Health and Ageing lighting standards
Illumination level (lux)
AS/NZS Standard 1680: 2008 Interior and Workplace lighting 2.1 and 2.2
Illumination level (lux)
Entry 150 160
Living 150
Bedroom General areas: 150
Bedside reading: 240
Corridors/hallways: 100 Corridors/hallways – 40
Kitchen General areas – 160 Task area (food prep) – 300
General areas – 160 Task area (food prep) – 240
Recreation 300
Bathroom General areas: 150
Basin/mirror: 300
80
Offices (administrative tasks) 320
Staffroom 80
Storerooms 80–160 (depending on type of goods stored)
Carparks (indoor) 800 (first 15 m during daytime)
160 (next 4 m during daytime)
160 (during night time)

13Opportunities for energy savings
Involve staffAs part of an awareness campaign, conduct regular meetings, label light switches and put posters up in staff rooms.
If an area is over-lit, consider removing some of the lamps from the light fixtures (delamping), or where there are many T8 fluorescents, a voltage reduction unit can be installed on the lighting circuit to reduce the energy consumption of the existing lights. This will reduce the lux levels by about 10 per cent. This is only recommended if the lights are in new condition, are on a magnetic or conventional ballast, and above the required lux levels.
MaintenanceSimply cleaning light fittings, sky lights and windows can improve light levels. Painting walls in light colours can also increase reflectivity and let light bounce around a room.
Control lightingMotion sensors can be used to optimise existing lighting systems in areas that are occasionally used, such as:
� office areas
� dining rooms and sitting rooms
� toilets
� storerooms
� laundry, kitchen and kitchenettes.
Table 4.3 shows the approximate costs and payback periods of some of the main energy efficiency measures to optimise the use of daylight and reduce the use of existing lighting systems.
Table 4.3: Lighting optimisation energy and cost savings
Measure Cost Annual savings1 Payback period
Motion sensors $200 each $100 2 yrs
Voltage reduction unit (VRU) installed on lighting circuit for > 30 T8 fluorescents
$600 for a 12 amp rated VRU $2400 4 yrs
Skylights $440 to supply and install 250 mm diameter skylight; $575 for a 400 mm diameter
up to 13% of electricity consumption if lighting can be halved ($11,000 for a 100-bed facility)
5–13 yrs
1 Savings depend on the number of lights, their wattage and the running time that is reduced.
Notes:
14 ENERGY SAVER Aged-care toolkit
Fifty-watt halogen lamps can also be replaced by Infrared Coating (IRC) halogen lamps, which will provide the same light distribution characteristics for less power. However, the fire risk typically associated with halogen down lights will remain the same with this option.
Avoid compact fluorescent lamps that are marketed as replacements for halogens. These lamps have extremely poor light output and are not suitable for aged-care buildings.
Table 4.4 on the following page provides a cost and energy savings comparison of different energy efficiency lighting options.
LED buyer’s checklist � Source high quality lights from reputable suppliers.
� The design of the LED light needs to include a method of dissipating heat. Typically, this is in the form of metal fins that sit behind the luminaires.
� Look for evidence of lamp life testing.
� Ensure that the light is compliant with all applicable standards by engaging a lighting specialist to design the lighting upgrade.
� Install a test area and evaluate whether it meets your standards and is suitable for widespread installation (e.g. illuminance, uniformity, glare, colour.).
Next steps � Find more information about efficient lighting
options in the Energy Saver lighting technology report. Available online at www.environment.nsw.gov.au/sustainbus/energyefflight.htm
� Learn how to undertake your own lighting upgrade step by step through Energy Saver lighting upgrade training. Access www.environment.nsw.gov.au/sustainbus/energyauditing.htm to find the next available course.
Upgrade to energy-efficient lighting Upgrading your lighting can provide the best return on investment for energy-saving projects. Savings of more than 30 per cent are common (see Table 4.4). Many aged-care facilities have already replaced standard incandescent bulbs with compact fluorescent lights. The two other types of light fittings that are cost effective to replace are T8 fluorescent tubes and 50 W halogens.
Replace T8 fluorescents
T8 fluorescent lights can be upgraded to T5s. T5s use slightly shorter lamps with different pin spacing and require electronic control equipment. There are two upgrade options: replacing the whole light fitting or just the T8 lamp with a T5 upgrade kit. The latter option uses the existing light fitting and components and should only be undertaken if they are in good condition. Apart from using less power, the T5 electronic control equipment avoids flicker and improves lamp life.
When replacing the whole fitting, one with two T5 lamps can be used or a single T5 lamp within a high performance louvre fitting can be selected. The design of this fitting provides increased reflection of the lamp which gives a similar light output to two T8s. Although these fittings are more expensive, they provide up to 60 per cent energy savings.
There are also a large variety of light emitting diode (LED) linear tubes on the market as replacements for T8 lamps. These have varying performance and quality issues. Less light is produced by LED tubular lamps than by T8 lamps and most of the light produced by an LED lamp is projected forward. LED lamps will therefore light the space differently than the existing system and should be avoided if you have concerns with maintaining lux levels. Once again, this option re-uses lamp holders and cables and the condition of this old equipment should also be taken into account before replacement.
Replace halogensLED lights are suitable replacements for 50 W halogen lamps. LED lights generate very little heat and can reduce the fire risk associated with halogens, as well as reducing the heat load on air-conditioning systems.
10 W LED lamps are available as a simple bulb replacement for 50 W halogens. However, their light output will be lower and the better option is to install a new 16 W LED lamp, which completely replaces the existing light fitting and power supply with brand new components that are designed to work together. Replacing the entire light fitting is more likely to achieve the same lighting effect as the existing halogen.

15Opportunities for energy savings
Table 4.4: Lighting upgrade energy costs and savings
Preferred option
Existing lamp type
Energy-efficient option Costs Energy savings and benefits
4 Twin 36 W T8 fluorescent tube
Replace complete fitting with louvered fitting with twin T5 lamps and an electronic ballast
Lamp cost $15 a pair plus new fitting and installation cost of $85
� 30–40% savings of lighting energy
� Simple payback 3–5 years
� Lamp life of 16,000–20,000 hrs
� Typical efficacy of 75 lumens/watt
4 Twin 36 W T8 fluorescent tube
Replace complete fitting with high-efficiency luminaire containing single T5 lamp
Lamp cost of $7.50 plus new fitting and installation cost of $145
� 60–67% savings of lighting energy
� Simple payback 1–3 years
� Lamp life of 16,000–20,000 hrs
� Typical efficacy of 85 lumens/watt
Twin 36 W T8 fluorescent tube
Replace lamps with T8 to T5 conversion kit
Lamp cost of $15 a pair plus conversion kit and installation cost of $80
� 20–50% savings of lighting energy
� Simple payback 2–3 years
� Lamp life of 16,000–20,000 hrs
� Typical efficacy of 75 lumens/watt
Twin 36 W T8 fluorescent tube
Replace lamp with 24 W LED tube
Lamp cost of $140 a pair plus fitting and installation cost of $160
� 50–70% savings of lighting energy
� Simple payback 4–6 years
� Lamp life up to 50,000 hrs
� Risk of poor quality product and low light levels
� Typical efficacy of 65 lumens/watt
4 50 W halogen Replace complete fitting with 16 W LED and new power supply
Lamp cost $70–120 plus new fitting and installation cost of $80
� 60–80% savings of lighting energy
� Simple payback 1–3 years
� Lamp life 30,000–50,000 hrs
� Reduces heat load and fire risk
50 W halogen Replace lamp with 10 W LED Lamp cost $20–$80 and installation cost of $60
� 60–80% savings of lighting energy
� Simple payback 1–2 years
� Lamp life 10,000–50,000 hrs
� Reduces heat load and fire risk
� Risk of poor quality product
50 W halogen Replace lamp with 35 W IRC halogen
Lamp cost of $12 with installation cost of $12
� 30% savings of lighting energy
� Simple payback <1 year
� Lamp life up to 6000 hrs
� Same fire risk as halogen
4 These options are preferred for upgrading fluorescent twin 36 W troffers. These upgrades will provide brand new, fully compliant luminaires that should deliver good energy reductions. These are low-risk options and minimal design verification is required.
4 This option is preferred for replacing 50 W halogen lights as it will deliver excellent energy reductions whilst providing brand new, fully compliant luminaires. Minimal lighting design verification is required with this option and there is minimal risk in its selection and implementation Using good quality products is an essential element of minimising risk.

16 ENERGY SAVER Aged-care toolkit
4.3 Air-conditioning
Instead of setting a temperature setpoint for the whole year, it can be adjusted seasonally to reduce the energy consumed whilst still providing comfortable temperatures for residents. Because residents in aged-care facilities are quite often frail, we recommend setting thermostats at 24°C for cooling in the summer and no less than 20°C for heating in the winter in common areas.
Depending on the flexibility of your air conditioning control, energy can also be saved through programming a wider ‘dead band’ around your temperature setpoint. A dead band is a temperature range in which neither heating nor cooling is turned on. Many air conditioning systems come with a 0.5°C dead band, but this can be increased to 1–1.5°C.
Control it � Timers can be used to limit operating times of air-
conditioners servicing common areas.
� Start and stop times for air-conditioners can be optimised to reflect outside and inside air temperatures, rather than turning them on at a fixed time all year round.
� Make sure temperature sensors are located centrally within a room to provide a representative temperature, not blocked by furniture or placed by entry ways.
� Motion sensors can be used to regulate operation in areas that are used infrequently or only at certain times of day.
� Ensure all piping, ductwork and vessels are insulated to reduce heat loss and heat gain.
Air-conditioning is the primary user of electricity in aged-care facilities. It plays an important role in providing a regular supply of fresh air, as well as maintaining a level of comfort for residents.
Typically, air-conditioning equipment in aged-care buildings is made up of a combination of small individual units in resident rooms and packaged direct expansion or variable refrigerant flow units in common areas. These multiple systems are normally individually controlled, which leads to a higher chance of excessive operating times, incorrect modes of operation and inefficient temperature setpoints. Total site energy consumption can be reduced by as much as four per cent, simply by adjusting temperature setpoints.
Upgrading air conditioning systems can be a costly exercise and it may be more feasible to plan these upgrades around building renovations or when equipment reaches its end of life.
� A packaged air conditioning unit (10 kW to 100 kW) has an economic life of 10–15 years.
� A single-room air conditioning unit (including split cassettes up to 10 kW) has an economic life of 7–10 years.
Set your temperatureA temperature setpoint is the desired temperature level within a building. The further the pre-existing air temperature inside a building is from the setpoint, the harder an air conditioner has to work to reach it. For example, on a hot day the heat load within a building would be much higher than normal and the air-conditioning system must consume a greater amount of electricity in order to maintain the temperature setpoint. Changing the temperature setpoint by 1°C reduces or increases energy consumption of cooling or heating equipment by around 10 per cent.
Notes:

17Opportunities for energy savings
Different types of air-conditioners have different control capabilities. If your control is limited, buy a universal remote controller that’s suitable for a number of different types of air-conditioners. This can set timers and limit the operating temperature range of air-conditioners (e.g. restricting their use to between 20°C and 24°C).
Remember, setting an air-conditioner as low or as high as it can go will not get to the required temperature any quicker and will just waste energy.
A building management system (BMS) can be installed to increase your control of air-conditioning units and other systems. These fully flexible systems can undertake various energy-saving control strategies, including setting optimal temperature bands and optimum start/stop times on a variable time schedule. In climates where it is cool at night and hot during the day, a BMS can be utilised for night purging by opening selected windows to allow cool air in to reduce the internal temperature of the building without using the air-conditioning. Lighting control can also be integrated into a BMS. A BMS can also be linked to submetering and can perform many reporting functions, which can be used in your day to day energy management.
Cool down economicallyAn economy cycle on your air-conditioner draws in outside air to cool down the internal building when the outside temperature is cooler than it is inside. This requires the installation of motorised dampers, larger fresh air ducts, fans and external temperature/humidity controls. A reputable air conditioning contractor should be able to quote for the installation of an economy cycle at your site.
Get fresh A simple solution for providing cooling for residents is to optimise natural airflow between window openings on opposite sides of a room. Ceiling fans provide this ventilation mechanically by moving air over your body, and their operating costs are similar to that of a light bulb. Simple controls such as reed switches can also be installed on windows to turn off a room air conditioner when a window is open. A reed switch is an electrical switch operated by applying a magnetic field.
Inverter technologyUpgrade old air-conditioners when they fail or become uneconomical to repair. Older units may use R22 refrigerant, which is due to be phased out from 2015. R22 will become more expensive closer to the phase out date, and the refrigerant pipework will need to be replaced to cope with the new refrigerant.
For single-unit installations, upgrade to inverter compressor reverse cycle units. Inverter-driven units can reduce electricity consumption using a variable-speed compressor motor. This improves temperature regulation as the system can run at partial load. By contrast, traditional air-conditioners regulate temperature by using a compressor that is either working at maximum capacity or switched off. Inverter manufacturers
claim electricity savings of up to 40 per cent over standard systems. As these systems mostly work at partial loads, manufacturers have scaled the minimum-sized units up to 2000 watts. This means that the temperature setpoints have to be closely monitored as a unit of this size can easily consume more energy if incorrectly controlled.
MaintenanceA regular maintenance schedule for all air-conditioners is vital. This should include cleaning/replacing filters and inspecting ducts and pipework for signs of damage or wear and tear. Repair and replace parts as needed. This should include resident-owned air-conditioners, as their inefficiencies impact your energy bill.
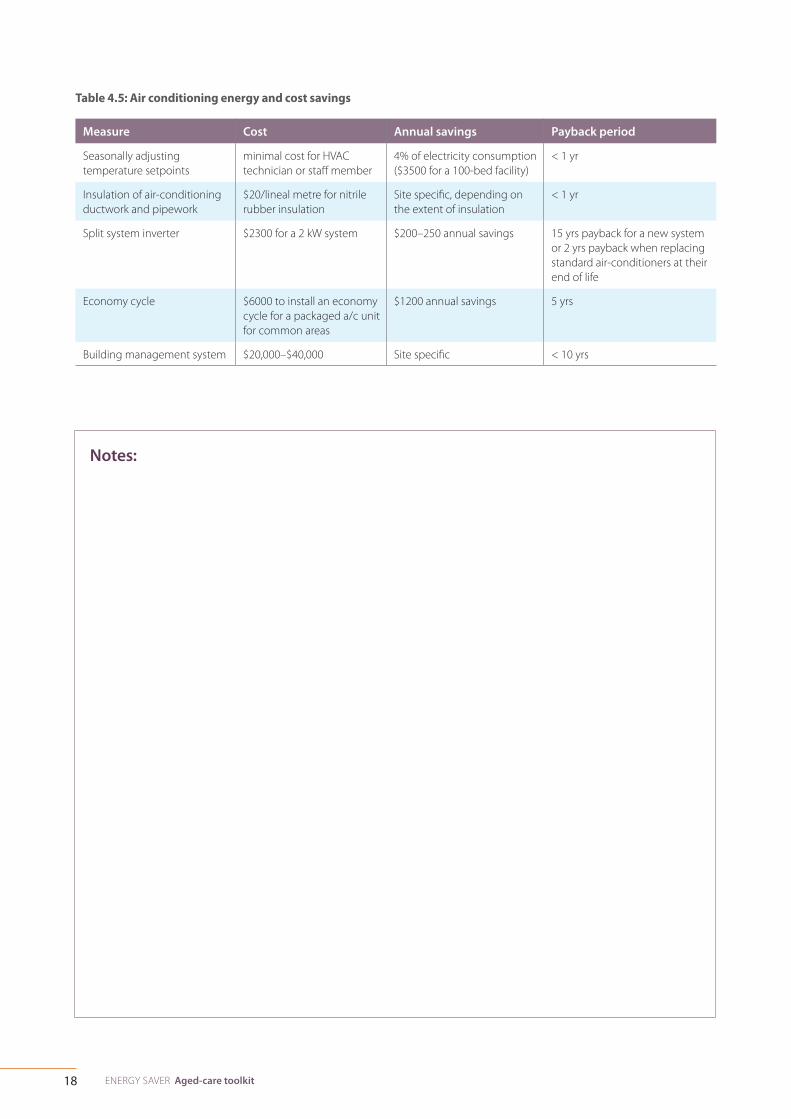
Table 4.5 (next page) shows the approximate costs and payback periods of some of the main energy efficiency measures to optimise the use of air-conditioners.
Involve staffIt is important for staff to understand the benefits of energy efficiency to guarantee their involvement in energy savings. These benefits include:
� a more comfortable and healthier environment for residents
� an improvement in staff working conditions.
Train staffStaff should be trained to operate equipment and controls correctly.
They should be made aware of areas where energy and money can be saved.
Motivate staffAsk staff for their opinions and encourage them to report maintenance issues and review their work areas for ways to save energy.
Provide them with feedback as to how the facility is progressing with its energy savings and other benefits.
18 ENERGY SAVER Aged-care toolkit
Table 4.5: Air conditioning energy and cost savings
Measure Cost Annual savings Payback period
Seasonally adjusting temperature setpoints
minimal cost for HVAC technician or staff member
4% of electricity consumption ($3500 for a 100-bed facility)
< 1 yr
Insulation of air-conditioning ductwork and pipework
$20/lineal metre for nitrile rubber insulation
Site specific, depending on the extent of insulation
< 1 yr
Split system inverter $2300 for a 2 kW system $200–250 annual savings 15 yrs payback for a new system or 2 yrs payback when replacing standard air-conditioners at their end of life
Economy cycle $6000 to install an economy cycle for a packaged a/c unit for common areas
$1200 annual savings 5 yrs
Building management system $20,000–$40,000 Site specific < 10 yrs
Notes:

19Opportunities for energy savings
4.4 Heating
Typically, ducted or hydronic gas-based systems are the most cost-effective to run for larger aged-care facilities (more than 100 beds) in colder climates. Operators should be mindful of adequate ventilation requirements (AS1668) when not using a central air conditioning system in winter.
Check and control � Costs can be reduced by ensuring that heaters
have localised controls that include programmable timers and thermostats. Setting thermostats to maximum temperature will not heat up a room quicker. It simply results in an overheated space and more energy consumption.
� Check controls thoroughly and regularly. Ensure system operating hours match the times when heating is required, as needs vary throughout the day and year. Fit simple time switches in smaller spaces to automate this process.
� To ensure gas boilers are running efficiently, service them regularly. The service should include a combustion analysis to determine running efficiency, which should be at least 80 per cent.
� Boilers, hot-water tanks and pipes should all be insulated to prevent heat escaping. Paybacks on this simple exercise are almost immediate.
Reverse-cycle air-conditionersA reverse-cycle inverter air-conditioning unit can be an alternative to gas heating. They are up to three times more efficient than a portable electric heater. If selecting this as a replacement heating system, then the additional cost of operating an air-conditioner in summer (if there wasn’t one before) should also be factored in.
Aged-care facilities commonly use portable or fixed electrical heaters. These units are very inefficient compared to gas heating or reverse cycle air-conditioners and can add significantly to your electricity bill. Gas heating produces the least amount of carbon emissions and can save you 60 per cent in operating costs compared to electric heaters.
Choosing a heaterWhen choosing a heating system, the factors to consider in addition to the purchase price of the unit include installation, maintenance and running costs. There are generally two types of heating: radiant, convective or a combination of both.
Radiant heaters quickly heat an object directly in front of them and are typically used in draughty areas, such as bathrooms. Convection heaters draw cool air into heating coils and expel heated air. A fan-assisted convection heater or a ceiling fan will assist in moving the heated air around a room rather than it rising to the ceiling.
Because convection heaters can replace cold air with warm air, they can heat an entire room far more efficiently than radiant heaters. They are also safer because the elements that heat the air are hidden within the heater. Radiant heaters in bathrooms can be replaced by a heat lamp, which can be up to four times more efficient, especially when linked to the light switch.
Go for gasGas heaters include wall furnaces, gas log fires, radiant/convective units or solely convective units. Gas heaters can either be flued or unflued. NSW Health has warned of potential air pollutants caused by unflued gas heaters.
Although flued gas heaters cost more to buy ($1000 to $2500), their running costs can be up to two thirds less than direct element electric heaters.
Other factors impacting running costs include the size of the area being heated, heater size and hours of operation.
Notes:

20 ENERGY SAVER Aged-care toolkit
4.5 Hot water
Replacing an electric hot-water storage system with a solar gas-boosted system is expensive, with a cost estimate of $75,000 for a 100 bed facility with over a 15-year payback. Another option is to add solar to an existing gas hot-water system which will reduce heating consumption by over 50 per cent. This is less costly but paybacks are still around 8 years. This level of investment may be more suited to a time when the system needs to be replaced or when the facility is undergoing renovations.
STCsThe Small-scale Renewable Energy Scheme creates a financial incentive for owners to install solar water heaters, heat pumps and solar panel systems. STCs are created for these systems according to the amount of electricity they produce or displace.
Calculate the number of STCs claimable by a solar hot-water system by using the calculators on the Clean Energy Regulator website: www.rec-registry.gov.au/swhCalculatorInit.shtml
Table 4.6 (on the following page) provides a comparison of the installation and operating costs of the different hot-water systems currently on the market. It shows that the operational costs of a solar hot-water system are a lot less than electric or gas hot-water systems. These various costs should be considered when replacing units.
Hot-water production is the second highest energy consumer for aged-care facilities. The number one priority to reduce energy use in hot-water production is to replace electric storage hot-water systems. If you upgrade to a gas-boosted solar system, annual operating costs can drop by as much as 90 per cent (see Table 4.6).
Upgrade options:
� OPTION 1 – Solar hot water
Solar water heating is the most energy-efficient means of heating water. Supplementary heating is typically required to boost water to the required temperature (e.g. on cloudy days or at night). Gas boosting should be used in preference to electric boosting where this is available.
The use of solar hot-water systems can also entitle you to Small-scale Technology Certificates (STCs — see below).
� OPTION 2 – Gas hot water
In instances where solar hot-water heating is not possible because of roof constraints, gas hot-water heating systems are recommended.
� OPTION 3 – Air-source heat pump
In instances where solar or gas hot-water systems are not possible, then an air-source heat pump is recommended. These are still three times more efficient than an electric storage system as they only use electricity to pump refrigerant around the system, not to heat the water. In alpine areas, heat pump systems are not practical and ground-source heat pumps should be considered.
The use of a heat pump hot-water system can also entitle you to STCs.
Notes:

21Opportunities for energy savings
Table 4.6: Indicative purchase costs and operating costs for hot-water systems
Fuel Appliance Purchase cost (excl. install.) per resident1
Annual energy cost per resident
Electricity Off-peak storage $150–$375 $84
Peak rate storage $125–$200 $244
Peak rate continuous flow $125–$275 $232
Heat pump $625–$875 $65
Natural gas Storage
5-star efficiency $200–$300 $62
2-star efficiency $175–$250 $78
Instantaneous
5-star efficiency $200–$525 $62
2-star efficiency $150–$200 $75
LPG Storage
5-star efficiency $200–$300 $185
2-star efficiency $175–$250 $227
Instantaneous
5-star efficiency $200–$525 $183
2-star efficiency $150–$200 $227
Solar Solar/off-peak electric storage $625–$1125 $30
Solar/gas storage (5-star efficiency) Natural gas $750–$1250 $21
Solar/gas storage (5-star efficiency) LPG $750–$1250 $65
1 Based on hot-water usage of 65 litres per resident per day
Insulate pipeworkCheck your hot-water distribution system. Insulating this pipework can reduce heat losses by up to 70 per cent. Heat loss reductions will also enable you to lower the outlet temperature of hot-water systems. Running hot-water systems at higher than necessary temperatures to reduce the risk of legionella will also increase your energy requirements. A minimum temperature of 60°C must be maintained to prevent legionella in a hot-water storage system.
If you have a separate hot-water system servicing your laundry or kitchen, install a timer on its recirculating pump to turn this off over night.
Save water, save energyMinimising the amount of hot water used also reduces the energy required to heat the water. Install water saving devices in both kitchens and bathrooms, for example tap aerators or flow restrictors, water efficient pre-rinse nozzles and water efficient showerheads.
Bucket testCheck your shower’s flow rate. A standard 10 L bucket should take more than one minute to fill. If filling takes less than one minute, then a water-saving shower head or flow restrictor should be installed.
22 ENERGY SAVER Aged-care toolkit
4.6 Laundry
Purchasing decisionsWhen replacing dryers, the additional benefits of a unit with heat recovery (transferring heat from the warm exhaust air to the cold incoming air) can save up to 25 per cent on energy consumption. Dryers with humidity sensors can also save energy by automatically switching off the dryer when the load is dry.
TipEstablish a procurement policy for your organisation and include energy efficiency and life cycle costs in your purchasing decisions.
The proportion of gas used for drying alone is estimated as typically one-third of the gas consumed in aged-care facilities. Focusing on improving the energy efficiency of your laundering system will also help you to save water, chemicals and money. Ozone laundry systems can save you $15,000 a year.
Ozone laundry systemsOzone is a form of oxygen that is created by applying an electric current to air. When used in laundering operations, ozone opens up the linen fibres and releases ingrained dirt as well as working as a disinfectant. This results in a reduction in the number of wash cycles and in the residual moisture content of the washed textiles.
This reduced residual moisture content results in decreased drying and ironing time and linen lasts longer. This also produces savings in electricity, gas, water and chemicals compared to standard laundry systems. Costs for an ozone laundry system are around $30,000 per site with a payback of two years.
Notes:

23Opportunities for energy savings
4.7 Kitchen
To increase efficiencies you can fit a VSD to compressors or fans or use electronically commutated (EC) fans. EC fans are cheaper to retrofit than VSDs and will reduce their speed when a temperature setpoint has been met.
When installing refrigeration equipment for cool rooms ensure that pipework runs are kept as short as possible and that condenser units are kept in a shaded, well-ventilated area.
Purchasing decisionsWhen replacing your kitchen appliances, it really pays to think long term. Choose gas appliances in preference to electric. A gas combi oven–steamer could save you more than $4000 in annual energy bills compared to an electric one. You can recoup the difference in the upfront cost in one to two years.
Dishwashers can also be purchased with heat recovery, reducing heating costs. They can be connected directly to your hot-water line, which saves the cost of heating the water by an electric element. If you have a dishwasher with an electric element, it’s important to turn it off out of hours as it will continually maintain the boiler temperature at 85°C whether in use or not.
Kitchen equipment can account for 30 per cent of the energy load in a kitchen. Implementing a startup and shutdown schedule for each individual piece of equipment can save money by reducing operating and idle times as well as reducing the demand charge on your electricity bill.
Next steps � Would you like to train your kitchen staff in energy
efficiency? Find training resources here: www.environment.nsw.gov.au/sustainbus/greenskills/enefftraining/resource/business.htm#hospitality
� Learn more about refrigeration energy savings through an Energy Saver commercial refrigeration seminar. Access www.environment.nsw.gov.au/sustainbus/energyauditing.htm to find the next course available for you.
VentilationTurn off exhaust fans in the kitchen when not required. At times when the kitchen isn’t running at full capacity, you may be able to turn down the ventilation. This can be done by installing a variable speed drive (VSD) on the fan motor, which can reduce exhaust operating costs by between 30 and 50 per cent.
Infrared heat detectors and associated control systems can also be installed for a cost of $5000 with an estimated payback of two years. These systems will turn the ventilation on only when a heat source is detected under the kitchen hood.
RefrigerationRefrigeration can be in the form of stand-alone refrigerators, freezers, room bar fridges, cool rooms and freezer rooms. Maintenance of this equipment is essential to ensure it runs efficiently and the following should be carried out:
� check door seals and replace them if damaged
� keep condensers and evaporator coils clean and free of dust
� replace any deteriorated condensers
� check that temperature sensors are located in an area that can provide a reliable indication of cool room temperature and check that the temperature sensor is working correctly (either by an ice bath or with another thermometer).
Check that refrigerant levels are correct. Too little refrigerant leads to low suction pressure and long compressor run times. Too much refrigerant leads to excessive head pressure and high power consumption. As of July 2012 the cost of synthetic refrigerants increased substantially to reflect their global warming potential. This provides a disincentive to use them and is an added maintenance cost that should be taken into account when upgrading your refrigeration system.
Most commercial refrigeration systems use electric heaters to defrost evaporator coils. Check the manufacturer’s recommendations to identify whether the length of the defrost cycles can be shortened or if they can be timed to defrost outside peak hours.

24 ENERGY SAVER Aged-care toolkit
4.8 Other equipment
Make an energy smart purchase by thinking in terms of life cycle costs, which include purchase price, annual energy costs and other long-term expenses associated with the equipment (e.g. maintenance requirements etc.).
Next stepsVisit the energy rating website at energyrating.gov.au for more information on energy efficient appliances.
Time outInstall timers on equipment where you can (e.g. printers, zip boilers, vending machines etc.). Purchasing a $70 digital timer for a vending machine could save you up to $500 a year (note: check service agreements before taking action).
Reach for the stars When buying a new appliance, look for the energy rating label: the higher the number of stars, the bigger the savings. To compare models with the same star rating use the energy consumption numbers on the star rating label. The lower the number the more you save.
Notes:

25Energy efficiency checklist
5. Energy efficiency checklist
Use this checklist to walk around your site and identify opportunities for energy savings. Refer to section 4 of the toolkit for further background information on each area.
Building fabric Action required
Section 4 Page 11
Check ceiling space for insulation. Is there 100% coverage, could it be improved?
Are all external doors and windows sealed to stop draughts. Also check skylights for air gaps.
Are there any opportunities to add external shading or tinting to windows that get a lot of summer sun?
Are windows fitted with curtains and pelmets to reduce heat loss during winter?
Lighting Action required
Section 4 Page 12 Are windows, light fixtures and skylights clean?
Are there areas where skylights could be installed to reduce the need for artificial light?
Buy a lux meter and find out what your lux levels are. Check these against the standards.
Are there any opportunities to delamp in overlit areas?
Do staff know where light switches are, or how they are controlled? Are switches labelled?
Are any empty areas lit unnecessarily?
26 ENERGY SAVER Aged-care toolkit
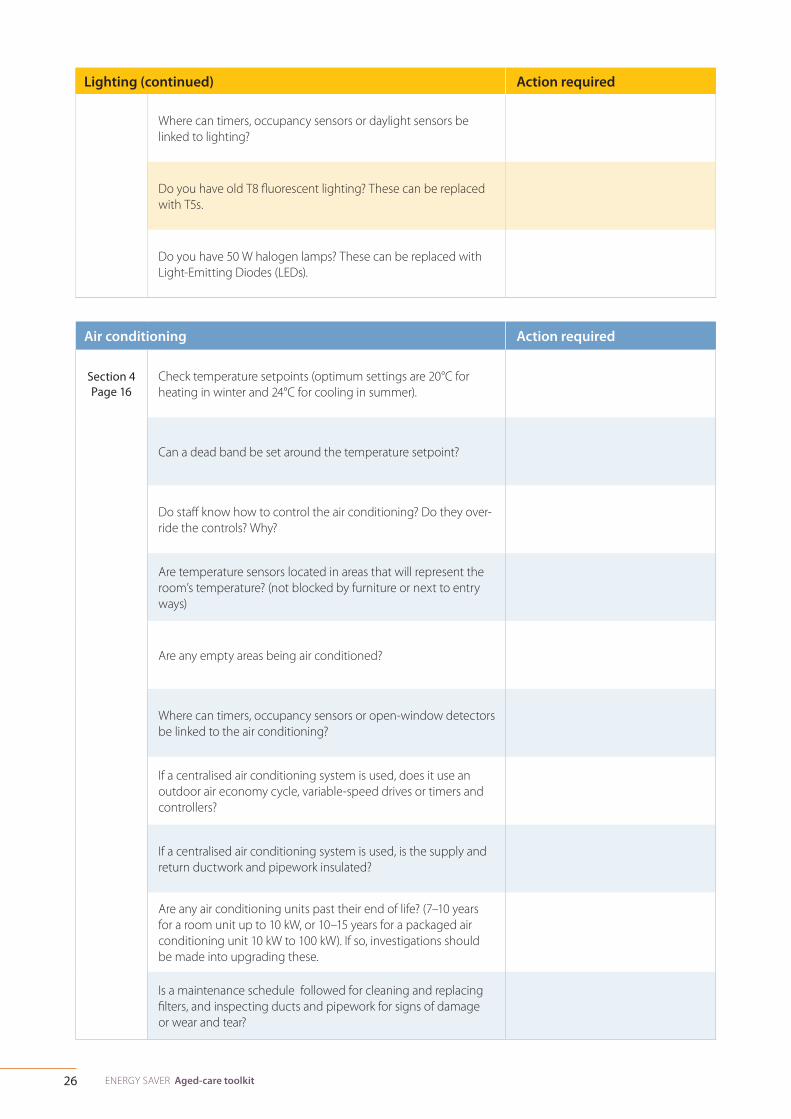
Lighting (continued) Action required
Where can timers, occupancy sensors or daylight sensors be linked to lighting?
Do you have old T8 fluorescent lighting? These can be replaced with T5s.
Do you have 50 W halogen lamps? These can be replaced with Light-Emitting Diodes (LEDs).
Air conditioning Action required
Section 4 Page 16
Check temperature setpoints (optimum settings are 20°C for heating in winter and 24°C for cooling in summer).
Can a dead band be set around the temperature setpoint?
Do staff know how to control the air conditioning? Do they over-ride the controls? Why?
Are temperature sensors located in areas that will represent the room’s temperature? (not blocked by furniture or next to entry ways)
Are any empty areas being air conditioned?
Where can timers, occupancy sensors or open-window detectors be linked to the air conditioning?
If a centralised air conditioning system is used, does it use an outdoor air economy cycle, variable-speed drives or timers and controllers?
If a centralised air conditioning system is used, is the supply and return ductwork and pipework insulated?
Are any air conditioning units past their end of life? (7–10 years for a room unit up to 10 kW, or 10–15 years for a packaged air conditioning unit 10 kW to 100 kW). If so, investigations should be made into upgrading these.
Is a maintenance schedule followed for cleaning and replacing filters, and inspecting ducts and pipework for signs of damage or wear and tear?
27Energy efficiency checklist
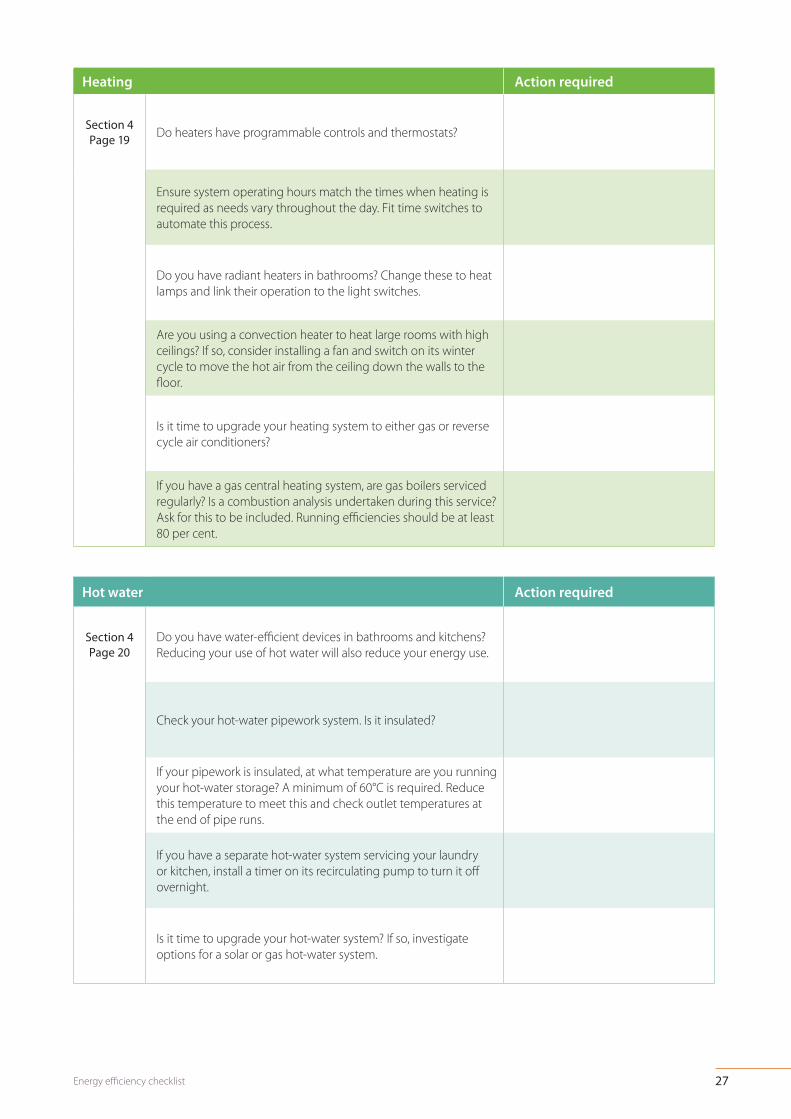
Heating Action required
Section 4 Page 19 Do heaters have programmable controls and thermostats?
Ensure system operating hours match the times when heating is required as needs vary throughout the day. Fit time switches to automate this process.
Do you have radiant heaters in bathrooms? Change these to heat lamps and link their operation to the light switches.
Are you using a convection heater to heat large rooms with high ceilings? If so, consider installing a fan and switch on its winter cycle to move the hot air from the ceiling down the walls to the floor.
Is it time to upgrade your heating system to either gas or reverse cycle air conditioners?
If you have a gas central heating system, are gas boilers serviced regularly? Is a combustion analysis undertaken during this service? Ask for this to be included. Running efficiencies should be at least 80 per cent.
Hot water Action required
Section 4 Page 20
Do you have water-efficient devices in bathrooms and kitchens? Reducing your use of hot water will also reduce your energy use.
Check your hot-water pipework system. Is it insulated?
If your pipework is insulated, at what temperature are you running your hot-water storage? A minimum of 60°C is required. Reduce this temperature to meet this and check outlet temperatures at the end of pipe runs.
If you have a separate hot-water system servicing your laundry or kitchen, install a timer on its recirculating pump to turn it off overnight.
Is it time to upgrade your hot-water system? If so, investigate options for a solar or gas hot-water system.

28 ENERGY SAVER Aged-care toolkit
Laundry Action required
Section 4 Page 22
Investigate the potential to install an ozone laundry system if you don’t have one already.
Is it time to upgrade your dryers? Look for equipment with heat recovery and moisture sensors.
Kitchen Action required
Section 4 Page 23
Is your exhaust fan running when the kitchen is empty? Investigate the potential of putting this on a timer, heat sensor or installing a Variable Speed Drive (VSD) on the fan motor.
Check refrigerator and cool room door seals.
Are condensers and evaporator coils clean and free of dust? Do any condensers need replacing?
Check that temperature sensors in cool rooms are in a suitable location and that they work (either by an ice bath or with another thermometer).
Check that refrigerant levels are correct.
Do you know when your defrost cycles occur? Can these be reduced or moved to off-peak times? (check with the manufacturer’s recommendations)
Does your cool room have Electronically Commutated (EC) fans? If not, consider retrofitting these.
Do you have a startup and shutdown schedule for kitchen equipment?
Do you need to purchase new kitchen equipment? Take the operating energy costs into account when weighing up the costs of different equipment. Gas appliances will be cheaper to run.

29Energy efficiency checklist
All equipment and appliances Action required
Section 4 Page 24 Is equipment left on out of working hours or when not required?
Install timers on equipment where you can (e.g. printers, zip boilers, vending machines)
Upgrade to a multi-function device instead of using separate printers, photocopiers and fax machines.
When buying new appliances check the energy star rating label.
Notes:

30 ENERGY SAVER Aged-care toolkit
6. Further support
After you have identified where energy savings can be made (the checklists should assist you), there are several sources of help.
These new arrangements started on 1 July 2012.
For further information, go to the Clean Energy Future website at www.cleanenergyfuture.gov.au or call 1800 057 590.
Low Carbon Australia Low Carbon Australia Limited has been established by the Australian Government as an independent company with over $100 million initial funding.
Low Carbon Australia provides financial solutions to Australian businesses to encourage action on energy efficiency, cost-effective carbon reductions, and accreditation for carbon-neutral products and organisations.
Low Carbon Australia has the following financial products to support cost-effective energy efficiency projects:
� loans – building owners and tenants can apply
� operating leases for equipment – off-balance sheet lease financing
� finance leases for equipment – on-balance sheet lease financing
� on-bill financing – finance through an energy utility.
For more information and to apply:
Phone: (02) 9191 9315
Email: [email protected]
Web: www.lowcarbonaustralia.com.au
6.2 Financial support
NSW Energy Savings CertificatesThe Energy Savings Scheme is an energy efficiency scheme based on the trading of Energy Savings Certificates (ESCs) in New South Wales. One ESC represents one tonne of carbon dioxide saved through reductions in the demand for electricity.
Participants in the scheme need to be or use an Accredited Certificate Provider to create ESCs when they undertake eligible energy-saving projects. Further information on ESCs can be found in section 3.
For information and to apply:
Phone: (02) 9290 8452
Email: [email protected]
Web: www.ess.nsw.gov.au
List of Accredited Certificate Providers: www.ess.nsw.gov.au/Overview_of_the_scheme/List_of_Accredited_Certificate_Providers
Clean Energy Advance and Clean Energy SupplementThe Clean Energy Advance and Clean Energy Supplement are financial assistance payments that the Australian Government will provide to support aged-care residents and aged-care providers with the onset of the carbon price. These payments recognise that aged-care providers bear the electricity costs of their residents.
A new Australian Government aged-care subsidy will also be paid to aged-care providers with respect to aged-care residents who are not eligible for the aged pension, service pension or the Commonwealth Seniors Health Card.
6.1 Seek specialist help
Some energy-saving measures can be implemented easily in-house. However, if you are interested in implementing the more expensive or complex options, contact Energy Saver for assistance. Energy Saver can subsidise the cost of an energy auditor to provide you with customised business cases, looking at either lighting, heating, air conditioning or hot-water savings.
Conditions apply – contact Energy Saver
Email: [email protected]
Phone: (02) 8837 6000

31Further support
6.3 Energy efficiency information and resources
Energy Saver provides a range of reports, seminars and case studies to assist organisations in their energy management.
Publications Reports on lighting and industrial refrigeration are free to download from the Energy Saver website. Visit www.environment.nsw.gov.au/sustainbus/energyauditing.htm to download them and check for new publications.
Case studies
A range of Energy Saver audit case studies are available at: www.environment.nsw.gov.au/sustainbus/escasestudies.htm
Seminars and training resourcesEnergy Saver delivers a range of training workshops and seminars to assist business in understanding energy management and efficient technologies.
Training workshops
� Energy management basics
� Energy-efficient HVAC for business
� Energy-efficient lighting
Energy efficiency seminars/webinars
� Industrial refrigeration
� Commercial refrigeration
� Lighting
Access www.environment.nsw.gov.au/sustainbus/energyauditing.htm to find the next course available for you.
Contact the Energy Saver team:
Email: [email protected]
Phone: (02) 8837 6000
Web: www.environment.nsw.gov.au/sustainbus
32 ENERGY SAVER Aged-care toolkit
Glossary Ballast: an electrical device that regulates the power delivered to fluorescent and high intensity discharge lamps. Conventional ballasts are known as wound ballasts, magnetic ballasts or copper ballasts. Electronic ballasts are an upgrade in technology from conventional ballasts.
Building management system (BMS): A computer based control system designed to control, monitor and optimise various building services.
Depending on the installed hardware and software the BMS has the ability to check inputs such as temperature, humidity, air distribution, carbon dioxide levels and energy consumption.
The BMS can then control the operation of services such as heating, ventilation, cooling and lighting through on/off controls triggered by the input variables.
Damper: A moveable plate that regulates the flow of air inside an air conditioning duct.
Direct expansion (DX) HVAC system: Direct expansion HVAC systems use the same coil system to expand the refrigerant and cool the air. A valve is used to stop the compressed gas before it reaches the cooling coil, and then relieves some of its pressure, allowing it to expand and cool. The cool gas is then released into the coil while outside air is run past the coil to cool it down.
Gigajoule (GJ): A unit of energy, used to indicate a volume of gas. 1 gigajoule = 0.2778 MWh. The volume of gas equivalent to a gigajoule varies with the gas composition, but is about 26 m3.
Hydronic heating: A system that transfers heat by circulating heated water through a closed system of pipes.
HVAC system: Heating, ventilation and air conditioning system.
Lux: the amount of light that falls on a surface. This is measured in lumens per square metre and is known as lux.
Megawatt hour (MWh): A unit of energy, especially electrical energy, equal to the work done by one thousand kilowatts acting for one hour and equivalent to 3.6 gigajoules.
Regression analysis: A statistical measure that attempts to determine the strength of the relationship between one dependent variable and a series of other changing variables.
Submetering: Submetering is the installation of metering devices to measure actual energy consumption after the primary utility energy meter. Submetering allows you to monitor energy usage for individual buildings, pieces of equipment or other loads to account for their actual energy usage.
Submetering can interface with software programs to create energy usage charts and graphs.
T5 lamp: Linear fluorescent lamp with a diameter of 5 1/8ths of an inch.
T8 lamp: Linear fluorescent lamp with a diameter of 8 1/8ths of an inch.
Voltage reduction unit: This unit can control the voltage supplied to appliances. When installed at the switchboard on fluorescent lighting circuits it supplies mains voltage to the lights when they start up and drops this voltage down after the lights have warmed up. As the power required to turn this type of light on is more than the power needed to maintain the lighting level, energy savings are made by this drop in power.
VRF HVAC system: Variable refrigerant flow HVAC systems match the volume or flow rate of refrigerant to the required heating or cooling loads thereby saving energy and providing more accurate control.

