energy subsidies: global estimates, causes of variance...
TRANSCRIPT
63
3Energy subsidies: Global
estimates, causes of variance, and gaps for the nuclear fuel cycle
Doug Koplow
AbstractSubsidies to energy cost hundreds of billions of dollars per year, often skewing market decisions in ways detrimental to environmental quality and social welfare. Subsidy reform could provide large fiscal and environmental gains, although remains politically challenging to implement . Growing data collection by international agencies and others has expanded the fuels and countries captured in international subsidy figures. However, important gaps remain regarding credit support, liability subsidies, natural resource leasing, and state-owned enterprises (SoEs) . In addition, data on subsidies to the nuclear fuel cycle remain particularly weak, with no global estimates at all and very few national ones . This is despite uS$4 .4 trillion in projected investments in new nuclear facilities by 2050, much of which will be state-guaranteed, and heavy government involvement with many parts of the nuclear fuel cycle . These hidden subsidies promote the expansion of nuclear facilities, infrastructure, and capabilities throughout the world even when other alternatives could provide the same energy services more quickly, at lower risk, and for less money .
LEARNING FRoM FuKuSHIMA
64
IntroductionHundreds of billions of dollars per year in energy subsidies slow the transition to cleaner forms of energy and divert limited public funds from health, education, and other social objectives. Reforming these subsidies, particularly in the fossil fuel sector, is now broadly accepted as an integral strategy to address climate change. As recognition of the fiscal and environmental benefits of subsidy reform has grown, data collection and compilation have also expanded. This is important progress, although subsidy elimination remains politically challenging and the pace of reform slower than needed.
Current beneficiaries continue to invest heavily to fight reform efforts, and remaining gaps in subsidy data impede effective opposition. Global subsidy estimates differ by more an order of magnitude, with valuation differences being a primary driver. Variance in geographic coverage, the types of subsidy programs evaluated, and the fuels assessed also contribute to the large range. Coverage is much worse for the nuclear fuel cycle than for renewables or fossil energy, making inter-fuel comparisons impossible. Industry estimates in all sectors tend to skew low, complicating policy debates.
Imperfect data will remain a challenge for years to come, yet does not justify slowing reform. There are broad areas of consensus regarding definitions and valuations. Further, even the lower bound estimates by international agencies indicate a problem massive in scale, and with significant negative side effects. Of the more than 35 countries for which the International Energy Agency (IEA) assessed fossil fuel subsidies in 2011 (IEA 2012), nearly half spent a larger share of their government budget on fossil fuel subsidies than on publicly funded health care (Koplow 2015a).
Although much attention on subsidies within developed countries has been focused on support to renewable energy, subsidies to conventional fuels such as oil, gas, coal, and nuclear are more entrenched and generally larger. The percentage depletion tax subsidy for oil and gas in the United States, for example, is nearly a century old; accident liability caps on nuclear reactors date to the mid-1950s. Subsidies extend the operating lives of inefficient and polluting coal plants and mask the real costs of nuclear power, helping to propel reactor sales to countries with no experience managing a nuclear sector. Subsidies to oil production tip many uneconomic sites into profitability, needlessly unlocking decades
65
3 . ENERGy SuBSIDIES
of new carbon (Erickson et al. 2017). Critical price signals that would encourage market participants to select lower-risk and cleaner energy paths are lost.
This chapter provides a brief introduction to the many forms of energy subsidies and how they are measured, the degree to which they crowd out other social spending, and their global scale. As a first step in addressing the dearth of data on nuclear subsidies, the chapter also introduces common approaches used to subsidise nuclear power worldwide.
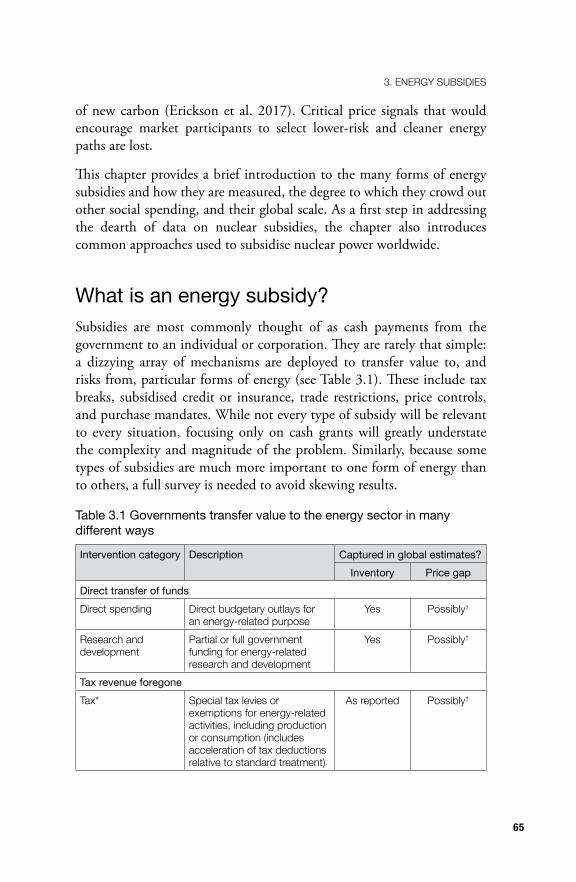
What is an energy subsidy?Subsidies are most commonly thought of as cash payments from the government to an individual or corporation. They are rarely that simple: a dizzying array of mechanisms are deployed to transfer value to, and risks from, particular forms of energy (see Table 3.1). These include tax breaks, subsidised credit or insurance, trade restrictions, price controls, and purchase mandates. While not every type of subsidy will be relevant to every situation, focusing only on cash grants will greatly understate the complexity and magnitude of the problem. Similarly, because some types of subsidies are much more important to one form of energy than to others, a full survey is needed to avoid skewing results.
Table 3.1 Governments transfer value to the energy sector in many different ways
Intervention category Description Captured in global estimates?Inventory Price gap
Direct transfer of fundsDirect spending Direct budgetary outlays for
an energy-related purposeyes Possibly†
Research and development
Partial or full government funding for energy-related research and development
yes Possibly†
Tax revenue foregoneTax* Special tax levies or
exemptions for energy-related activities, including production or consumption (includes acceleration of tax deductions relative to standard treatment)
As reported Possibly†
LEARNING FRoM FuKuSHIMA
66
Intervention category Description Captured in global estimates?Inventory Price gap
Other government revenue foregoneAccess* Policies governing the terms
of access to domestic onshore and offshore resources (e .g . leasing auctions, royalties, production sharing arrangements)
No Possibly†
Information Provision of market-related information that would otherwise have to be purchased by private market participants
yes No
Transfer of risk to governmentLending and credit Below-market provision of
loans or loan guarantees for energy-related activities
No No
Government ownership*
Government ownership of all or a significant part of an energy enterprise or a supporting service organisation; often includes high risk or expensive portions of fuel cycle (nuclear waste, oil security, or stockpiling)
No Possibly†
Risk Government-provided insurance or indemnification at below-market prices
No No
Induced transfersCross-subsidy* Policies that reduce costs to
particular types of customers or regions by increasing charges to other customers or regions
Partial Possibly†
Import or export restrictions*
Restrictions on the free market flow of energy products and services between countries
Partial yes
Price controls* Direct regulation of wholesale or retail energy prices
Some yes
Purchase requirements*
Required purchase of particular energy commodities, such as domestic coal, regardless of whether other choices are more economically attractive
No yes
67
3 . ENERGy SuBSIDIES
Intervention category Description Captured in global estimates?Inventory Price gap
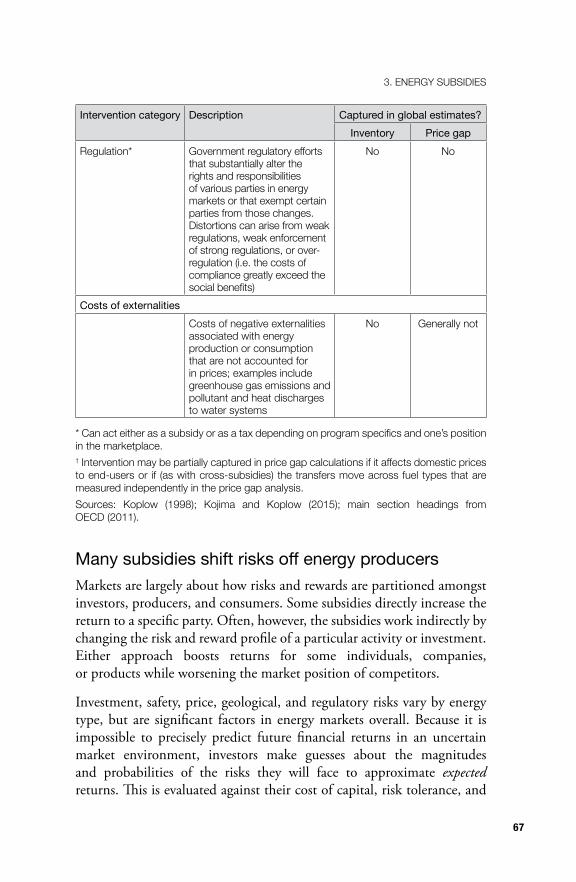
Regulation* Government regulatory efforts that substantially alter the rights and responsibilities of various parties in energy markets or that exempt certain parties from those changes . Distortions can arise from weak regulations, weak enforcement of strong regulations, or over-regulation (i .e . the costs of compliance greatly exceed the social benefits)
No No
Costs of externalitiesCosts of negative externalities associated with energy production or consumption that are not accounted for in prices; examples include greenhouse gas emissions and pollutant and heat discharges to water systems
No Generally not
* Can act either as a subsidy or as a tax depending on program specifics and one’s position in the marketplace .† Intervention may be partially captured in price gap calculations if it affects domestic prices to end-users or if (as with cross-subsidies) the transfers move across fuel types that are measured independently in the price gap analysis .Sources: Koplow (1998); Kojima and Koplow (2015); main section headings from oECD (2011) .
Many subsidies shift risks off energy producersMarkets are largely about how risks and rewards are partitioned amongst investors, producers, and consumers. Some subsidies directly increase the return to a specific party. Often, however, the subsidies work indirectly by changing the risk and reward profile of a particular activity or investment. Either approach boosts returns for some individuals, companies, or products while worsening the market position of competitors.
Investment, safety, price, geological, and regulatory risks vary by energy type, but are significant factors in energy markets overall. Because it is impossible to precisely predict future financial returns in an uncertain market environment, investors make guesses about the magnitudes and probabilities of the risks they will face to approximate expected returns. This is evaluated against their cost of capital, risk tolerance, and
LEARNING FRoM FuKuSHIMA
68
other business objectives in driving investment and corporate strategy. Interventions that shift core risks away from the private sector will alter these estimates, and can significantly distort energy market choices.
Government policies that limit or eliminate key down-side risks can be extremely valuable in turning unprofitable projects into profitable, investable ones. The down-side hedge is particularly material where there is a great deal of uncertainty over the ability to make a technology work, or on the timing and cost of delivery. Examples include very long-duration exposure to uncertain costs (as with nuclear waste disposal) and high capital costs that must be recovered through product sales over an extended period of time (as with coal plants deploying carbon capture and sequestration). The competitive environment can change dramatically during the development and construction period of high-risk projects, making them particularly uncomfortable for investors. Responses to this discomfort include a much higher cost of capital or withdrawal of funding entirely.
The challenge on the public policy side is twofold. First, risk-based subsidies do not actually eliminate risks; rather, they transfer them from the subsidy beneficiary to somebody else. Most often, the ‘somebody else’ is the government (and therefore taxpayers). However, other outcomes are also possible. Liability caps shift risks associated with uncompensated damages from accidents to plant neighbours or industries dependent on a common resource (as with contaminated fisheries after an oil spill). Purchase mandates shift price risk to customers. Second, comparable substitutes that can be developed and delivered without the same complications often exist, making public risk absorption hard to justify on policy grounds.
Subsidised insurance programs that socialise private risks are common: nuclear accidents, earthquakes, flooding, and dam failures are but a few examples. Not only do the subsidies harm competing products with lower economic or operational risks, but aggregate risks to society may actually rise. Critical decisions on where to locate a power plant or mine, or how heavily to fund operational safety and worker training, are made by the plant owners and shaped by a fear of financial losses. If government subsidies shift too much of this risk away from these private decision-makers, owners can make irreversible investment, siting, or operational decisions that increase the societal risks of future problems.
69
3 . ENERGy SuBSIDIES
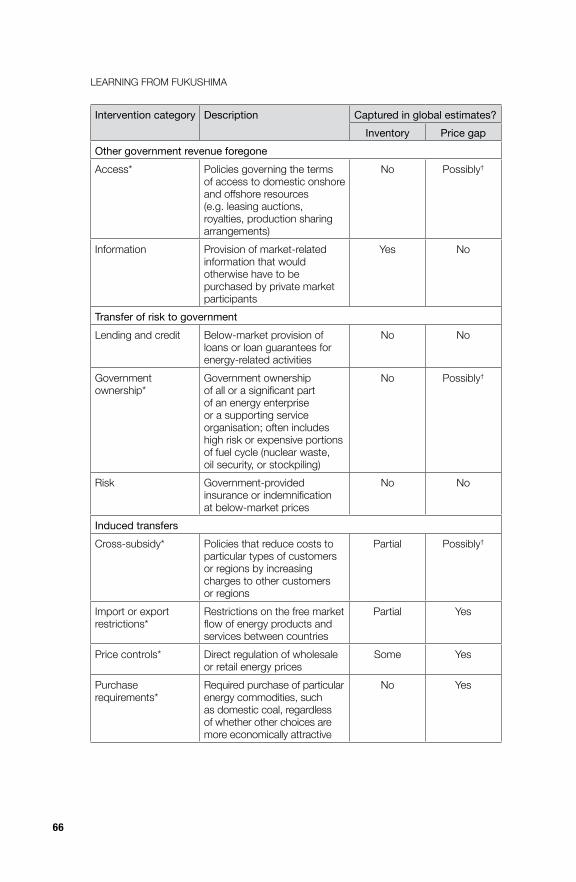
Grants are merely a starting point: An overview of subsidy typesTable 3.1 provides a comprehensive overview of the main types of transfer mechanisms, along with an estimate of how well current global estimates capture particular types of government interventions. Global subsidy estimates rely on two main techniques: measuring the degree to which domestic energy prices lag market prices for a fuel (the ‘price gap’ approach); and aggregating the subsidies associated with hundreds of individual government programs supporting energy (the ‘inventory’ approach).
The many categories within Table 3.1 underscore both the complexity of markets and the importance of tracking multiple venues of support in order to properly gauge their overall scale and impact. Although global estimates of subsidy magnitude run in the hundreds of billions of dollars annually, the real values are likely significantly larger. Current estimates have material gaps in terms of subsidy types, fuels, and geographic regions captured.
Another notable point in Table 3.1 is that quite a few of the transfer mechanisms can act as a tax or as a subsidy, depending on the program details and the associated market environment. If program rules or disbursements change over time, the direction of impact can shift as well. Fees levied on oil and gas, for example, are often earmarked to support industry-related site inspections and cleanup, or to fund infrastructure construction and maintenance. If the fees exceed these other costs, they may partially act as a tax; if they cover only part of the cost, a residual subsidy will remain. Subsidies to energy consumers can sometimes act as a tax on producers, and vice versa. Teasing out these interactions is a significant challenge of subsidy measurement.
Recipients frequently tap into as many subsidies as they can, capturing different types of support from multiple levels of government. This process is referred to as ‘subsidy stacking’, and applies to state-owned enterprises (SOEs) as well as to private firms or individuals. SOEs are common in many parts of the energy sector, including the nuclear fuel cycle.
Sometimes the support to SOEs is obvious, such as bailouts when a state firm runs out of cash. More often, however, the subsidies become evident only when compared to a free market baseline. SOEs borrow money and pay interest, for example, but not at a market rate. They earn break-even or
LEARNING FRoM FuKuSHIMA
70
even some net revenues on operations, but far less than needed to generate a reasonable rate of return on billions in invested taxpayer capital. Where competing resources are both less capital-intensive and privately owned, the lack of a required return on investment can be a large impediment to competitive energy markets. SOEs may pay no taxes, have inadequate insurance coverage relative to the riskiness of their operations, or receive below-market access to publicly owned minerals.
Energy subsidies as an ‘investment’: The opportunity costs of current patterns of supportAccess to modern energy services has been clearly demonstrated to improve health, productivity, and welfare for recipient families (World Bank 2010: 19). Yet, billions of people lack access. As of 2013, 17 per cent of the global population had no electricity and a much higher proportion had limited or low-quality access. Nearly 40 per cent were without access to clean cooking fuels (IEA 2015: 101–6).
Intentionally or not, global energy subsidies represent a massive investment in the energy sector. It is reasonable to ask whether this spending helps to finance poverty reduction and the development of cleaner and better fuel sources for the world’s poor. While there are clearly some benefits, studies suggest that the vast majority of support continues to be ineffective in reducing energy poverty.
Fossil fuel subsidies in the developing world have mostly been focused on keeping transport and cooking fuel prices below market levels. Although often justified as a poverty-reduction strategy, in practice much of this support ‘leaks’ to wealthier citizens. Higher income groups use much more energy per capita. They consume energy from power and gas networks that frequently do not even extend to the poorest areas due to the high installation costs and low purchasing power in those districts. Other subsidies rely on political connections to access, bypassing the poor. Low domestic prices also frequently trigger development of black markets that move subsidised supplies to other countries or illegal domestic sales at market prices or above.
71
3 . ENERGy SuBSIDIES
Developing country surveys found that only 8 per cent of fossil fuel subsidies reached consumers in the poorest 20 per cent of the population (IEA 2011), and less than 25 per cent reached the poorest two quintiles (IEA, OPEC, OECD, and the World Bank 2010: 24).1 Leakage rates for gasoline have been particularly high according to International Monetary Fund (IMF) analysis, with an estimated US$33 in subsidies to gasoline required for each US$1 that actually reached the poorest 20 per cent of society (Arze del Granado, Coady, and Gillingham 2010: 13).
The IEA estimated that US$13.1 billion in new capital was invested in 2013 to improve access to electricity and clean cooking fuels, an increase from the previous year (IEA 2015: 105). Still, the investment comprises a mere 2.5 per cent of the estimated half a trillion dollars in fossil fuel subsidies to consumers that year. Within the spending on energy poverty, the vast majority supported expansion of power generation or distribution networks. Less than 5 per cent focused on expanding options for clean cooking—despite significant negative health effects from the use of traditional cooking fuels.
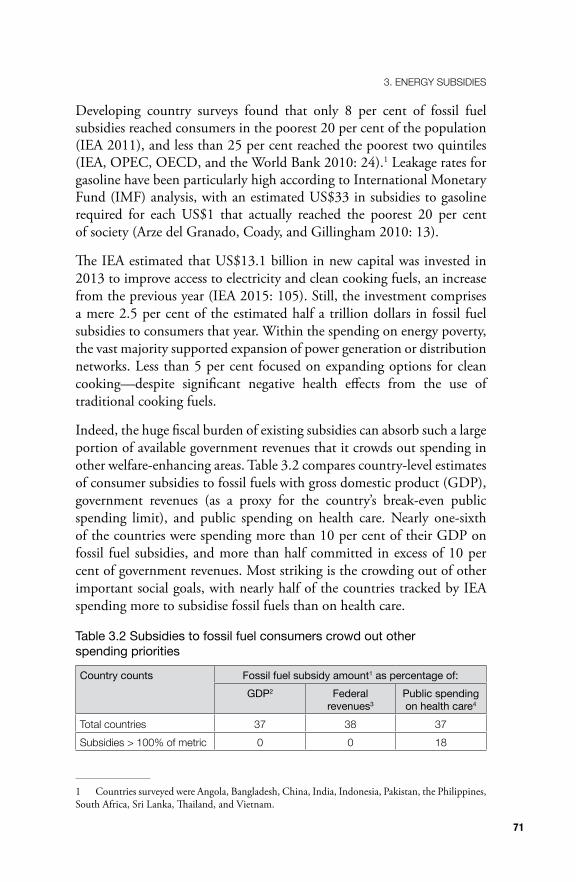
Indeed, the huge fiscal burden of existing subsidies can absorb such a large portion of available government revenues that it crowds out spending in other welfare-enhancing areas. Table 3.2 compares country-level estimates of consumer subsidies to fossil fuels with gross domestic product (GDP), government revenues (as a proxy for the country’s break-even public spending limit), and public spending on health care. Nearly one-sixth of the countries were spending more than 10 per cent of their GDP on fossil fuel subsidies, and more than half committed in excess of 10 per cent of government revenues. Most striking is the crowding out of other important social goals, with nearly half of the countries tracked by IEA spending more to subsidise fossil fuels than on health care.
Table 3.2 Subsidies to fossil fuel consumers crowd out other spending priorities
Country counts Fossil fuel subsidy amount1 as percentage of:GDP2 Federal
revenues3Public spending on health care4
Total countries 37 38 37Subsidies > 100% of metric 0 0 18
1 Countries surveyed were Angola, Bangladesh, China, India, Indonesia, Pakistan, the Philippines, South Africa, Sri Lanka, Thailand, and Vietnam.
LEARNING FRoM FuKuSHIMA
72
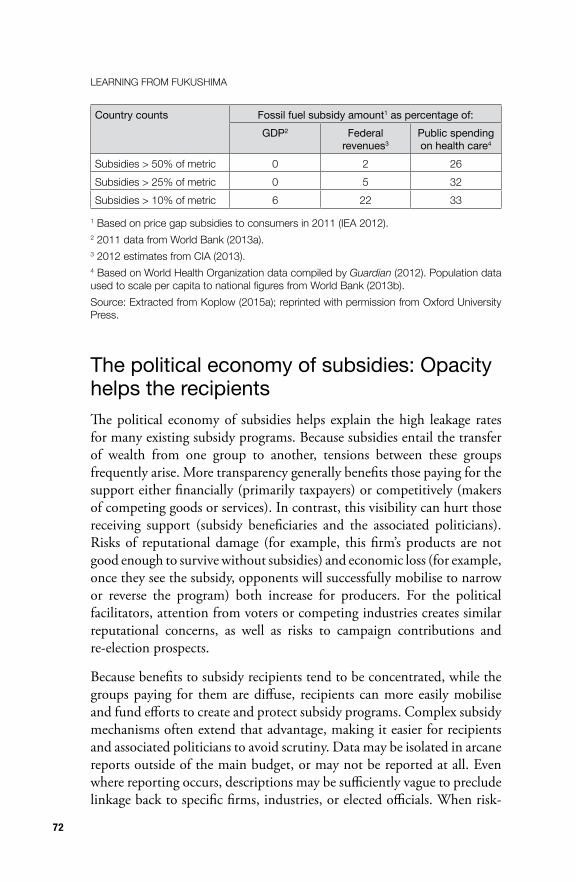
Country counts Fossil fuel subsidy amount1 as percentage of:GDP2 Federal
revenues3Public spending on health care4
Subsidies > 50% of metric 0 2 26Subsidies > 25% of metric 0 5 32Subsidies > 10% of metric 6 22 33
1 Based on price gap subsidies to consumers in 2011 (IEA 2012) .2 2011 data from World Bank (2013a) .3 2012 estimates from CIA (2013) .4 Based on World Health organization data compiled by Guardian (2012) . Population data used to scale per capita to national figures from World Bank (2013b).Source: Extracted from Koplow (2015a); reprinted with permission from oxford university Press .
The political economy of subsidies: Opacity helps the recipientsThe political economy of subsidies helps explain the high leakage rates for many existing subsidy programs. Because subsidies entail the transfer of wealth from one group to another, tensions between these groups frequently arise. More transparency generally benefits those paying for the support either financially (primarily taxpayers) or competitively (makers of competing goods or services). In contrast, this visibility can hurt those receiving support (subsidy beneficiaries and the associated politicians). Risks of reputational damage (for example, this firm’s products are not good enough to survive without subsidies) and economic loss (for example, once they see the subsidy, opponents will successfully mobilise to narrow or reverse the program) both increase for producers. For the political facilitators, attention from voters or competing industries creates similar reputational concerns, as well as risks to campaign contributions and re-election prospects.
Because benefits to subsidy recipients tend to be concentrated, while the groups paying for them are diffuse, recipients can more easily mobilise and fund efforts to create and protect subsidy programs. Complex subsidy mechanisms often extend that advantage, making it easier for recipients and associated politicians to avoid scrutiny. Data may be isolated in arcane reports outside of the main budget, or may not be reported at all. Even where reporting occurs, descriptions may be sufficiently vague to preclude linkage back to specific firms, industries, or elected officials. When risk-
73
3 . ENERGy SuBSIDIES
based subsidies turn bad (such as when credit recipients go bankrupt or natural disasters hit subsidised clients of government insurance programs), publicity is inevitable. Because these events often arise years after the subsidies were granted, however, political fallout is less likely; indeed, the sponsoring politician may no longer even be in elected office.
Limited reportingEven discerning whether a subsidy was granted can sometimes be difficult, particularly in countries with strong central governments, state ownership of key industries, and a limited tradition of transparency. Levers potentially available to citizens to force political accountability may be greatly constrained. Free and fair elections, the right to sue firms or governments for redress, regulated securities markets with mandated disclosure, or statutorily protected rights to public information may exist in name only or not at all. In these types of settings, quantifying subsidies becomes extremely difficult. Absent an initiative from the central government itself, reform becomes nearly impossible.
Western democracies that pride themselves on open government are not immune from challenges either. Bias amongst regulators or legislators for a particular energy resource can influence policy in subtle ways, regardless of reporting. Further, although agency budgets are published regularly, publicly available, and usually independently audited, disclosures can be less complete and more fragile than often assumed. The existing rules often required a political battle to put in place, and remain subject to political pressure for bypass or reversal. The United Kingdom, for example, was recently forced to disclose that it had capped investor risk to nuclear waste management and reactor decommissioning costs at the planned new Hinkley Point C project. The subsidies only saw the light of day due to laws requiring disclosure of data under public records requests (Doward 2016).
Reporting in the United States provides another instructive example: disclosure of federal tax expenditures and credit subsidies occurs only due to statutory mandates. Even so, reporting is limited to a highly aggregated level. Attribution to specific recipients is impossible, and, depending on the subsidy, even allocation to particular industries can be difficult. Individual government insurance programs will often be evaluated, but risk subsidies across the government rarely get tallied or linked to specific
LEARNING FRoM FuKuSHIMA
74
subsidised beneficiary groups. Federal indemnification, where private liability is limited by statute rather than subsidised through a government-run insurance program, is rarely quantified at all.
Even the tax and credit subsidy data remain imperfect. Tax breaks are measured in terms of federal revenue foregone, but in some cases the breaks generate tax-exempt income to the recipient and are therefore more valuable than a similarly sized cash grant. Measurement of this second impact made comparisons of subsidy value across types of government support more accurate, but was discontinued in 2008. Metrics for US credit subsidies contain two important inaccuracies. First, the values exclude the cost of program administration. Second, and more importantly, interest rate subsidies are measured against the cost of funds to the US Treasury (the ‘risk-free rate’) rather than the estimated risk of the borrower, which would be much higher. Inadequate integration of risk in the pricing of sovereign credit and credit guarantees is an endemic problem around the world (Lucas 2013). Credit subsidy estimates for particularly high-risk energy enterprises (new energy technologies, nuclear power plants, carbon sequestration sites) will be disproportionately understated in official government data.
Reporting on subnational subsidies is generally weaker than that at the national level. State-level tracking even of tax subsidies in the US remained voluntary until a recent Governmental Accounting Standards Board ruling established standards and made reporting mandatory (Governmental Accounting Standards Board 2015). Subnational subsidies to credit, insurance, and project-related infrastructure are common, but rarely tracked. SOEs, particularly power plants, are also common at the state or municipal levels in many countries.
Challenging valuationValuation of many subsidy mechanisms requires ‘counter-factual’ baseline assumptions against which to compare current practice. What would a neutral tax, or an unsubsidised insurance or credit market, look like? The task is manageable, although challenging. Government-prepared assessments of tax breaks or credit subsidies may not all be using the same baseline assumptions, for example, making comparisons and aggregation more difficult. Similarly, when governments do not estimate subsidy values, developing them independently can be time consuming and complex, and may require related data that only the government has.
75
3 . ENERGy SuBSIDIES
These impediments result in less frequent and less complete coverage for complex subsidy mechanisms than for grants. In most cases, even the Organisation for Economic Co-operation and Development’s (OECD) inventory incorporates tax expenditure data only if the member state estimates it, and while plans are underway to incorporate credit subsidies, this important area has not yet been implemented.
A final complication is that industry can slow reform, or defuse political opposition to subsidy extension or expansion, by challenging the baseline assumptions adopted by governments. Indeed, beneficiaries routinely hire their own consultants to defend existing policies and to estimate subsidy costs using (more favourable) alternative assumptions. In comparison to analysis by government agencies or non-governmental organisations (NGOs), these assessments often report lower costs and bigger benefits of the status quo.
A notable parallel strategy to block reforms is to simply deny that key interventions are subsidies at all. Often, this involves claims that the subsidised treatment of one’s own industry is part of the baseline tax system and not a diversion from it. The American Petroleum Institute, the largest oil and gas trade association in the United States, provides a textbook example of this approach. Its director of tax and accounting, Stephen Comstock, wrote: ‘Contrary to what some in politics, the media and most recently, the president during the State of the Union, have said, the oil and natural gas industry currently receives not one taxpayer “subsidy,” “loophole” or deduction’ (Comstock 2014).
Objectively, this is a refutable statement, and his claims run counter to an impressive array of US federal agencies that have long viewed and valued these policies as clear subsidies to oil and gas.2 While making the case that some government interventions constitute targeted subsidies to a particular industry is not always simple, Comstock contests even the most basic ones. His approach underscores the political challenges to reform: a sizeable portion of the electorate will accept the industry framing even if it is incorrect, and industry trade associations often have much larger budgets to promote their position than do NGOs or even the subsidy research staff at international organisations.
2 This includes the US Treasury, the Joint Committee on Taxation, the Congressional Budget Office, the Government Accountability Office, and the Congressional Research Service.
LEARNING FRoM FuKuSHIMA
76
Global subsidies: Measurement strategies and magnitudeAssessing the implications of subsidies on key policy questions such as climate change or the cost structure of nuclear power requires aggregating data across subsidy types and from multiple levels of government into metrics of combined support. Subsidy measurement has focused on quantifying the value transferred to market participants from particular programs (program-specific or inventory approach) or on the variance between the observed and the ‘free market’ price for an energy commodity (price gap approach). The former captures the price effects, but does not identify the specific subsidies causing them. The latter tracks the individual subsidies, but does not delineate their pricing impacts (Koplow 2015b).
The price gap approach requires less data than the subsidy inventories, and is particularly useful in multi-country studies where government data are not readily available. However, this metric misses the many subsidies that boost industry profitability or allow marginal competitors to stay afloat, although without affecting equilibrium prices. Price gap estimates should therefore be viewed as lower bound (Koplow 2009).
The OECD’s Total Support Estimate (TSE) metric captures both pricing distortions (net market transfers) and transfers that do not affect end-market prices (net budgetary transfers). The TSE tracks individual policies on producer and consumer sides of the market, allowing interactions to be evaluated. Government programs that support the general structure of a particular fuel market, although not a specific producer or consumer, are tracked separately. The OECD’s approach is data intensive: its most recent review of government support to fossil fuels included more than 800 subsidies provided by a diverse array of government agencies—yet still contained important residual gaps in coverage (see OECD 2015).
A final differentiating factor across the commonly reported global estimates is the inclusion of ‘normative’ adjustments to subsidy value. The IMF valued fiscal subsidies (using IEA’s price gap data plus producer subsidies as calculated by the OECD, less tax subsidies) into a ‘pre-tax’ measure of support. In addition, the IMF also developed a ‘post-tax’ estimate that was roughly 16 times its lower estimate, equal to nearly 7 per cent of global GDP (Coady et al. 2015). This higher value includes an imputed national consumption tax on fuel for countries that either had no existing tax of
77
3 . ENERGy SuBSIDIES
this type, or one that the IMF felt was inappropriately low; and negative externalities to both energy and to transport. The IMF’s post-tax estimate remains contentious among subsidy practitioners because of these factors.
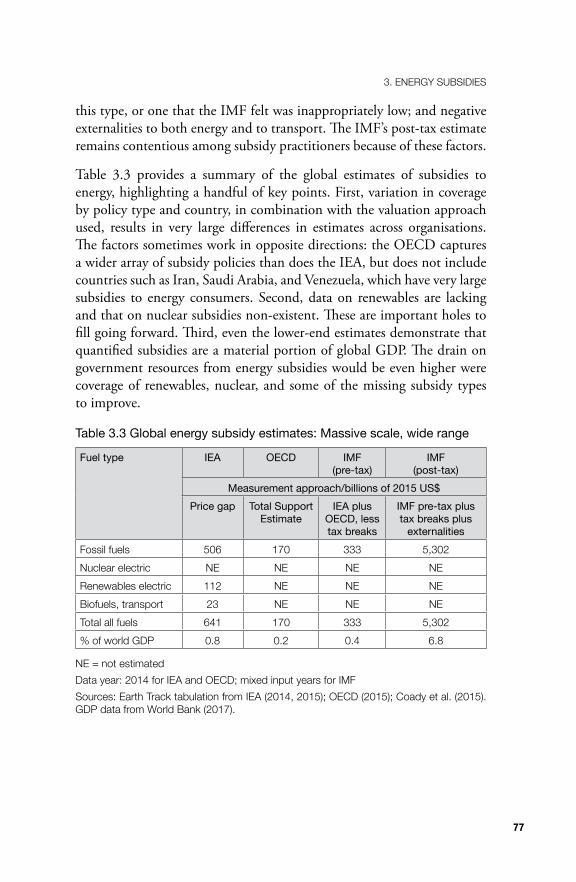
Table 3.3 provides a summary of the global estimates of subsidies to energy, highlighting a handful of key points. First, variation in coverage by policy type and country, in combination with the valuation approach used, results in very large differences in estimates across organisations. The factors sometimes work in opposite directions: the OECD captures a wider array of subsidy policies than does the IEA, but does not include countries such as Iran, Saudi Arabia, and Venezuela, which have very large subsidies to energy consumers. Second, data on renewables are lacking and that on nuclear subsidies non-existent. These are important holes to fill going forward. Third, even the lower-end estimates demonstrate that quantified subsidies are a material portion of global GDP. The drain on government resources from energy subsidies would be even higher were coverage of renewables, nuclear, and some of the missing subsidy types to improve.
Table 3.3 Global energy subsidy estimates: Massive scale, wide range
Fuel type IEA OECD IMF(pre-tax)
IMF(post-tax)
Measurement approach/billions of 2015 US$Price gap Total Support
EstimateIEA plus
OECD, less tax breaks
IMF pre-tax plus tax breaks plus
externalitiesFossil fuels 506 170 333 5,302Nuclear electric NE NE NE NERenewables electric 112 NE NE NEBiofuels, transport 23 NE NE NETotal all fuels 641 170 333 5,302% of world GDP 0 .8 0 .2 0 .4 6 .8
NE = not estimatedData year: 2014 for IEA and oECD; mixed input years for IMFSources: Earth Track tabulation from IEA (2014, 2015); oECD (2015); Coady et al . (2015) . GDP data from World Bank (2017) .
LEARNING FRoM FuKuSHIMA
78
Overview of global subsidies to the nuclear fuel cycleDespite growing coverage of global subsidies to fossil fuels, there is no global estimate for support to nuclear power and very few national level estimates either. As there are far fewer nuclear facilities than oil and gas, estimating nuclear subsidies would seem a manageable task; a host of other attributes may help explain the lack of coverage. Worries about climate change, in combination with potential fiscal windfalls from subsidy reform, may have provided the needed focus and funding for fossil fuel subsidy research. The coverage by IEA of renewable subsidies is perhaps structural: purchase mandates (feed-in tariffs or renewable portfolio standards) form the bulk of support to renewables and show up well in price gap calculations.
In contrast, heavy government involvement in many aspects of the nuclear fuel cycle complicates subsidy tracking. Many reactors, nuclear construction firms, fuel cycle facilities, research programs, and (potential) waste repositories are partially or entirely government-owned. Subsidy evaluation for SOEs remains an area of particular weakness in current global data, and support to electrical power generation and transmission infrastructure has also been more challenging to estimate than subsidies to frequently traded fuels.
Further, governments may have little interest in compiling subsidy data on their nuclear sector. Key players in the new wave of reactor construction such as China and Russia view the industry as building strategic capabilities and international influence.3 Profitability may also be a goal, but it is not the only, or perhaps even the main, one. Countries purchasing these reactors may have some mixed interests as well, such as the potential to gain skills and know-how that could be deployed in military initiatives. Indeed, in a recent review of the most likely pathways to a highly proliferated world, four of the six new post-2030 nuclear states are expected to use militarisation of their civilian programs to get there (Murdock et al. 2016: 16).
3 Thomas (2017) provides an overview of China’s nuclear export plans, and some of the challenges the country is facing. Reuters (2016) notes the goal of the Russian government to use energy policy to achieve national political objectives.
79
3 . ENERGy SuBSIDIES
Even current nuclear states see continued investments in the civilian sector as a necessary contributor to keeping their military capabilities active. A review of the United Kingdom’s strong commitment to build a new reactor despite very large fiscal contributions from the state relative to the value of the power concluded that ‘it is difficult fully to comprehend the persistent intensity of official UK attachments to nuclear power, without also considering the role of parallel commitments to maintaining national military nuclear submarine capabilities’ (Cox, Johnstone, and Stirling 2016: 3). Continued investment in India’s breeder reactor program is also focused on retaining a ‘minimal credible deterrent’ (Ramana 2016a). Making public the substantial subsidies to the civilian nuclear sector runs counter to these interests, while also increasing the political risks to sponsors if projects run into trouble.
Complexity is a final factor likely driving the lack of data. The most important subsidies to the nuclear fuel cycle involve complicated risk-shifting from industry onto taxpayers or plant neighbours: accident risks, cost overruns on decommissioning, nuclear waste, and plant financing. All of these areas entail a mixture of significant government involvement, long timescales, and a lack of systematic tabulation within countries. All also have enough uncertainty on potential outcomes to provide wide latitude for industry and nuclear boosters within governments to develop alternative narratives on the programs.
Regardless of the cause, the lack of global data on nuclear subsidies is both striking and likely to prove quite expensive to taxpayers and competing energy sources alike. The IEA and the Nuclear Energy Agency (NEA) recently called for US$4.4 trillion invested into new reactors by 2050 in order to stay within 2 degrees Celsius of warming (IEA/NEA 2015: 23). Much of this amount would involve direct or indirect (for example, via credit or power price guarantees) government support.
The industry has been pushing hard to position nuclear energy as a key strategy to address climate change as well. They have been supported by prominent scientists such as James Hansen, who wrote that ‘nuclear power paves the only viable path forward on climate change’ (Hansen et al. 2015, emphasis added). Yet, there are many ways to pull carbon out of our economy, both in the power sector and beyond. Nuclear industry proponents have been far more enthusiastic about proclaiming the centrality of nuclear in any climate change plan than they have been
LEARNING FRoM FuKuSHIMA
80
about exposing projects to real market tests. Large subsidies to trillions of dollars’ worth of new, long-lived nuclear reactors will skew greenhouse gas reduction strategies away from quicker, cheaper, and lower-risk solutions.
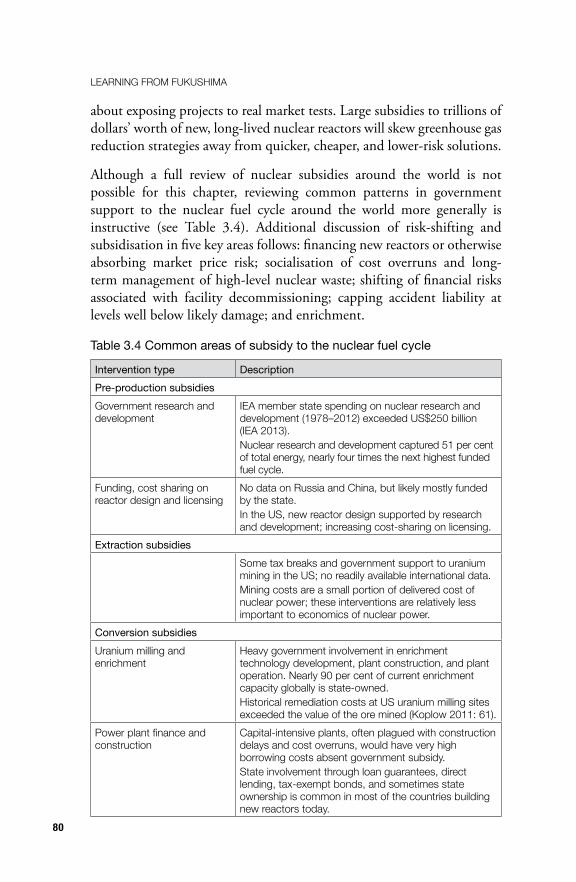
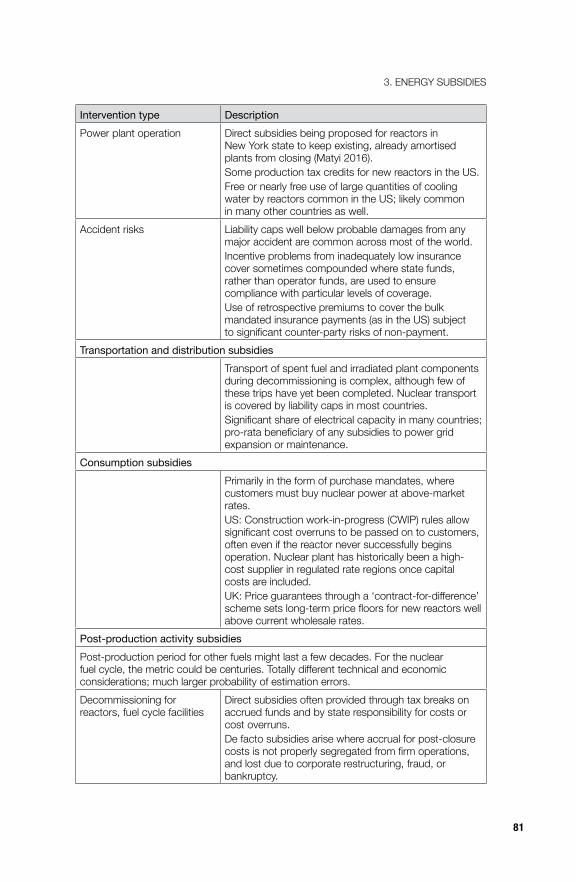
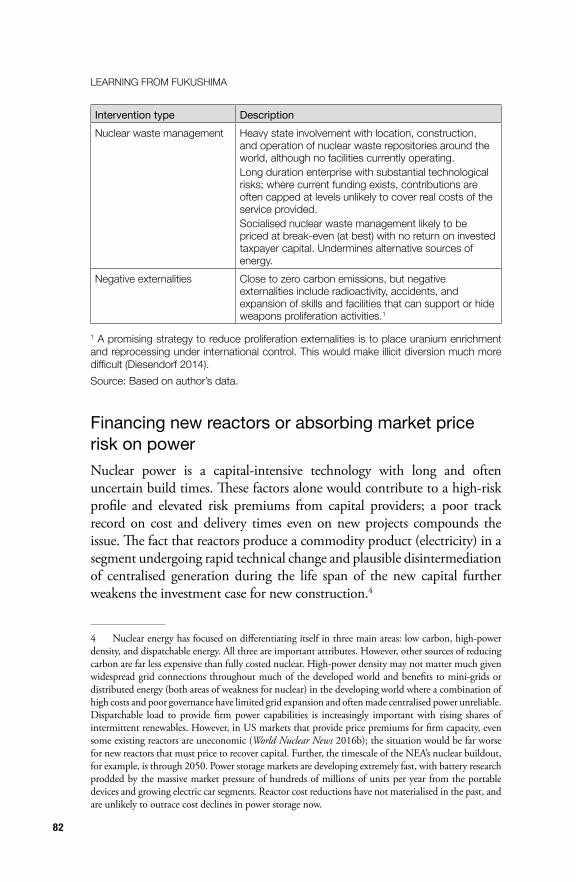
Although a full review of nuclear subsidies around the world is not possible for this chapter, reviewing common patterns in government support to the nuclear fuel cycle around the world more generally is instructive (see Table 3.4). Additional discussion of risk-shifting and subsidisation in five key areas follows: financing new reactors or otherwise absorbing market price risk; socialisation of cost overruns and long-term management of high-level nuclear waste; shifting of financial risks associated with facility decommissioning; capping accident liability at levels well below likely damage; and enrichment.
Table 3.4 Common areas of subsidy to the nuclear fuel cycle
Intervention type DescriptionPre-production subsidiesGovernment research and development
IEA member state spending on nuclear research and development (1978–2012) exceeded uS$250 billion (IEA 2013) .Nuclear research and development captured 51 per cent of total energy, nearly four times the next highest funded fuel cycle .
Funding, cost sharing on reactor design and licensing
No data on Russia and China, but likely mostly funded by the state .In the uS, new reactor design supported by research and development; increasing cost-sharing on licensing .
Extraction subsidiesSome tax breaks and government support to uranium mining in the uS; no readily available international data . Mining costs are a small portion of delivered cost of nuclear power; these interventions are relatively less important to economics of nuclear power .
Conversion subsidiesuranium milling and enrichment
Heavy government involvement in enrichment technology development, plant construction, and plant operation . Nearly 90 per cent of current enrichment capacity globally is state-owned .Historical remediation costs at uS uranium milling sites exceeded the value of the ore mined (Koplow 2011: 61) .
Power plant finance and construction
Capital-intensive plants, often plagued with construction delays and cost overruns, would have very high borrowing costs absent government subsidy .State involvement through loan guarantees, direct lending, tax-exempt bonds, and sometimes state ownership is common in most of the countries building new reactors today .
81
3 . ENERGy SuBSIDIES
Intervention type DescriptionPower plant operation Direct subsidies being proposed for reactors in
New york state to keep existing, already amortised plants from closing (Matyi 2016) .Some production tax credits for new reactors in the uS .Free or nearly free use of large quantities of cooling water by reactors common in the uS; likely common in many other countries as well .
Accident risks Liability caps well below probable damages from any major accident are common across most of the world .Incentive problems from inadequately low insurance cover sometimes compounded where state funds, rather than operator funds, are used to ensure compliance with particular levels of coverage .use of retrospective premiums to cover the bulk mandated insurance payments (as in the uS) subject to significant counter-party risks of non-payment.
Transportation and distribution subsidiesTransport of spent fuel and irradiated plant components during decommissioning is complex, although few of these trips have yet been completed . Nuclear transport is covered by liability caps in most countries .Significant share of electrical capacity in many countries; pro-rata beneficiary of any subsidies to power grid expansion or maintenance .
Consumption subsidiesPrimarily in the form of purchase mandates, where customers must buy nuclear power at above-market rates .uS: Construction work-in-progress (CWIP) rules allow significant cost overruns to be passed on to customers, often even if the reactor never successfully begins operation . Nuclear plant has historically been a high-cost supplier in regulated rate regions once capital costs are included .UK: Price guarantees through a ‘contract-for-difference’ scheme sets long-term price floors for new reactors well above current wholesale rates .
Post-production activity subsidiesPost-production period for other fuels might last a few decades . For the nuclear fuel cycle, the metric could be centuries. Totally different technical and economic considerations; much larger probability of estimation errors .Decommissioning for reactors, fuel cycle facilities
Direct subsidies often provided through tax breaks on accrued funds and by state responsibility for costs or cost overruns .De facto subsidies arise where accrual for post-closure costs is not properly segregated from firm operations, and lost due to corporate restructuring, fraud, or bankruptcy .
LEARNING FRoM FuKuSHIMA
82
Intervention type DescriptionNuclear waste management Heavy state involvement with location, construction,
and operation of nuclear waste repositories around the world, although no facilities currently operating . Long duration enterprise with substantial technological risks; where current funding exists, contributions are often capped at levels unlikely to cover real costs of the service provided .Socialised nuclear waste management likely to be priced at break-even (at best) with no return on invested taxpayer capital . undermines alternative sources of energy .
Negative externalities Close to zero carbon emissions, but negative externalities include radioactivity, accidents, and expansion of skills and facilities that can support or hide weapons proliferation activities .1
1 A promising strategy to reduce proliferation externalities is to place uranium enrichment and reprocessing under international control . This would make illicit diversion much more difficult (Diesendorf 2014).Source: Based on author’s data .
Financing new reactors or absorbing market price risk on powerNuclear power is a capital-intensive technology with long and often uncertain build times. These factors alone would contribute to a high-risk profile and elevated risk premiums from capital providers; a poor track record on cost and delivery times even on new projects compounds the issue. The fact that reactors produce a commodity product (electricity) in a segment undergoing rapid technical change and plausible disintermediation of centralised generation during the life span of the new capital further weakens the investment case for new construction.4
4 Nuclear energy has focused on differentiating itself in three main areas: low carbon, high-power density, and dispatchable energy. All three are important attributes. However, other sources of reducing carbon are far less expensive than fully costed nuclear. High-power density may not matter much given widespread grid connections throughout much of the developed world and benefits to mini-grids or distributed energy (both areas of weakness for nuclear) in the developing world where a combination of high costs and poor governance have limited grid expansion and often made centralised power unreliable. Dispatchable load to provide firm power capabilities is increasingly important with rising shares of intermittent renewables. However, in US markets that provide price premiums for firm capacity, even some existing reactors are uneconomic (World Nuclear News 2016b); the situation would be far worse for new reactors that must price to recover capital. Further, the timescale of the NEA’s nuclear buildout, for example, is through 2050. Power storage markets are developing extremely fast, with battery research prodded by the massive market pressure of hundreds of millions of units per year from the portable devices and growing electric car segments. Reactor cost reductions have not materialised in the past, and are unlikely to outrace cost declines in power storage now.
83
3 . ENERGy SuBSIDIES
Investors recognise that the market value of the power their new reactors produce could be much lower in five or 10 years when the reactor comes online than what they would have assumed, and that its value over the 50 or more years between the start of plant construction and when it closes is impossible to guess. These characteristics have led capital providers to largely abandon the private nuclear finance market.5 Funding strategies have shifted largely to state-supported, non-competitive capital. Consider the IEA’s and the NEA’s take: ‘Governments have a role to play in ensuring a stable, long-term investment framework that allows capital-intensive projects to be developed and provides adequate electricity prices over the long-term for all low-carbon technologies’ (IEA/NEA 2015: 5). Approaches to provide this ‘stable’ framework all involve shifting core financial risks from the investor to the state. This includes favourable state-backed credit packages, long-term state-guaranteed price floors, and broadly worded allowances to shift advance financing and cost overrun risk to ratepayers. Direct state ownership of nuclear facilities is also common.
State credit packagesOf the 56 reactors under construction (according to IAEA PRIS 2016),6 seven are in Russia and 20 in China. The Russian reactors are all state-financed and owned; Chinese state involvement in its domestic reactors is also pervasive. Rosatom, Russia’s state-owned reactor developer, has bundled multibillion-dollar credit programs with proposed or pending reactor export deals as well, including in Bangladesh, US$12.7 billion (World Nuclear News 2016b); Egypt, US$25 billion (Russia Times 2015); Finland, €5 billion (Rosatom 2016); and Hungary, €10 billion (Rosatom 2016). Although many of these projects are unlikely to move to construction, the centrality of credit provision in deal structure is nonetheless instructive. Similarly, in China, ‘[t]he huge financial reserves of the Chinese government meant that its vendors would be able to provide finance as well as equipment, a big advantage in most potential markets’
5 Moody’s Investors Service (2013: 20) noted that ‘new construction of nuclear power plants is generally credit negative’, that cost overruns on nuclear projects were more frequent than for other technologies, and that ‘European power markets in their current state don’t support new construction’ of reactors.6 The International Atomic Energy Agency (IAEA) Power Reactor Information System (PRIS) database listed 60 units under construction as of 1 November 2016. Two units have been under construction since 1999, and another two since the late 1980s; these have been excluded from the totals.
LEARNING FRoM FuKuSHIMA
84
(Thomas 2017). This includes the UK’s Hinkley Point C where Chinese state-owned entities are, along with France’s Électricité de France (EDF), taking a one-third interest in the £18 billion project (Ruddick 2016).
Guaranteed price floorsTo address the significant risk that electricity prices will be too low when a new reactor finally comes online, utilities often implement power purchase agreements for at least a sizeable portion of its capacity. The price and timing for nuclear kilowatt hours (kWh) is so uncertain that counter-parties on these transactions for new reactors are often the state. On the Hinkley Point C project in the UK, the government is guaranteeing project developers a minimum price three times the current wholesale price of power for 35 years. The cost to UK taxpayers of this price support has been estimated to be as much as £300 billion (The Week UK 2016; Ruddick 2016).
China set a wholesale floor price for power produced from all new nuclear projects in the country ‘to promote the healthy development of nuclear power and guide investment into the sector’ (WNA 2016a). Future upward adjustments may be needed, as some feel the current price floor is too low (WNA 2016a). A tender for a reactor project in the Czech Republic worth up to US$15 billion was scrapped in 2014 due to weakening prices for power and a refusal by the government to guarantee power prices (Lopatka 2014).
Ratepayer interest-free finance and exposure to cost overrunsThe four new reactor projects in the United States (Summer 2 & 3 and Vogtle 3 & 4) are all in districts with favourable construction work-in-progress (CWIP) rules. CWIP allows reactor owners to increase rates prior to a new project entering production, effectively using ratepayers as a source of interest-free capital. In addition, CWIP shifts much of the risk of cost escalation from the investors and builders onto customers. While local rate boards can sometimes reject the pass-through of plant cost increases, in most cases customers end up paying.
Both attributes are enormously valuable to nuclear investors and plant owners. Vogtle 3 & 4 is nearly four years late and facing cost escalation of US$6 billion (43 per cent, to an expected total cost of more than US$20 billion). Still, all costs, including incremental financing costs on the delays, were deemed prudent and allowed to be billed through to ratepayers (SACE 2016). Interest-free pre-funding of the Vogtle reactors
85
3 . ENERGy SuBSIDIES
through October 2016 exceeded US$1.8 billion (SACE 2016). While not setting a price floor, plant investors have agreed to ‘hell or high water’ clauses in their wholesale power purchase agreements with Vogtle that do the same thing: they require their customers to buy power even if they do not need it in their districts, and at whatever price it is delivered even if that price is well above other supplier options (MEAG Power 2016: 10–12). The two Summer reactors are US$4 billion over initial cost estimates (40 per cent), and interest-free pre-funding of the project accounts for more than 16 per cent of customers’ monthly bills (Wren 2016).
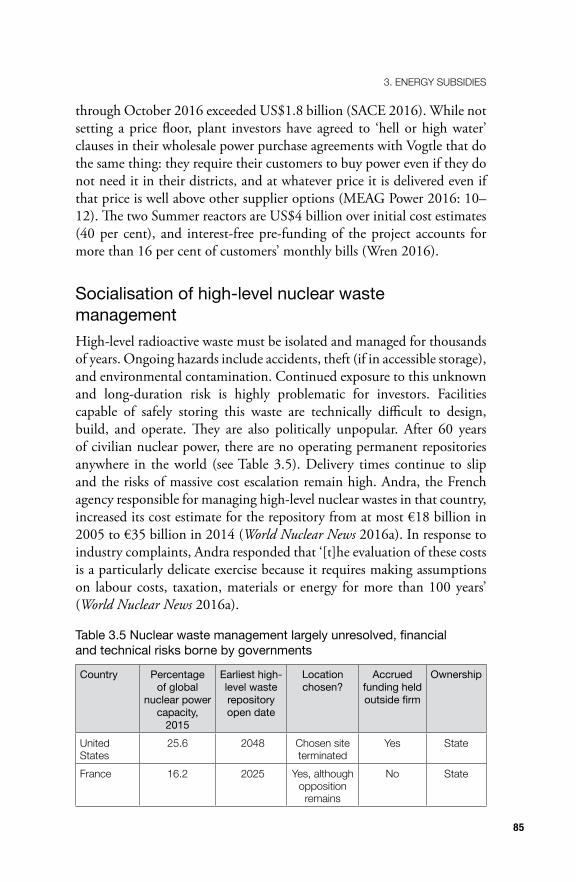
Socialisation of high-level nuclear waste managementHigh-level radioactive waste must be isolated and managed for thousands of years. Ongoing hazards include accidents, theft (if in accessible storage), and environmental contamination. Continued exposure to this unknown and long-duration risk is highly problematic for investors. Facilities capable of safely storing this waste are technically difficult to design, build, and operate. They are also politically unpopular. After 60 years of civilian nuclear power, there are no operating permanent repositories anywhere in the world (see Table 3.5). Delivery times continue to slip and the risks of massive cost escalation remain high. Andra, the French agency responsible for managing high-level nuclear wastes in that country, increased its cost estimate for the repository from at most €18 billion in 2005 to €35 billion in 2014 (World Nuclear News 2016a). In response to industry complaints, Andra responded that ‘[t]he evaluation of these costs is a particularly delicate exercise because it requires making assumptions on labour costs, taxation, materials or energy for more than 100 years’ (World Nuclear News 2016a).
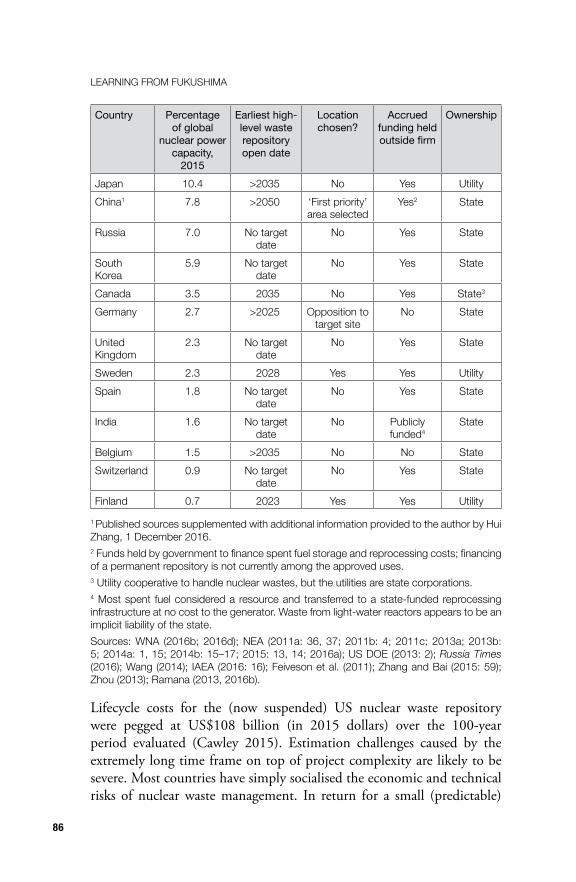
Table 3.5 Nuclear waste management largely unresolved, financial and technical risks borne by governments
Country Percentage of global
nuclear power capacity,
2015
Earliest high-level waste repository open date
Location chosen?
Accrued funding held outside firm
Ownership
united States
25 .6 2048 Chosen site terminated
yes State
France 16 .2 2025 yes, although opposition
remains
No State
LEARNING FRoM FuKuSHIMA
86
Country Percentage of global
nuclear power capacity,
2015
Earliest high-level waste repository open date
Location chosen?
Accrued funding held outside firm
Ownership
Japan 10 .4 >2035 No yes utilityChina1 7 .8 >2050 ‘First priority’
area selectedyes2 State
Russia 7 .0 No target date
No yes State
South Korea
5 .9 No target date
No yes State
Canada 3 .5 2035 No yes State3
Germany 2 .7 >2025 opposition to target site
No State
united Kingdom
2 .3 No target date
No yes State
Sweden 2 .3 2028 yes yes utilitySpain 1 .8 No target
dateNo yes State
India 1 .6 No target date
No Publicly funded4
State
Belgium 1 .5 >2035 No No StateSwitzerland 0 .9 No target
dateNo yes State
Finland 0 .7 2023 yes yes utility
1 Published sources supplemented with additional information provided to the author by Hui Zhang, 1 December 2016 .2 Funds held by government to finance spent fuel storage and reprocessing costs; financing of a permanent repository is not currently among the approved uses .3 utility cooperative to handle nuclear wastes, but the utilities are state corporations .4 Most spent fuel considered a resource and transferred to a state-funded reprocessing infrastructure at no cost to the generator . Waste from light-water reactors appears to be an implicit liability of the state .Sources: WNA (2016b; 2016d); NEA (2011a: 36, 37; 2011b: 4; 2011c; 2013a; 2013b: 5; 2014a: 1, 15; 2014b: 15–17; 2015: 13, 14; 2016a); uS DoE (2013: 2); Russia Times (2016); Wang (2014); IAEA (2016: 16); Feiveson et al . (2011); Zhang and Bai (2015: 59); Zhou (2013); Ramana (2013, 2016b) .
Lifecycle costs for the (now suspended) US nuclear waste repository were pegged at US$108 billion (in 2015 dollars) over the 100-year period evaluated (Cawley 2015). Estimation challenges caused by the extremely long time frame on top of project complexity are likely to be severe. Most countries have simply socialised the economic and technical risks of nuclear waste management. In return for a small (predictable)
87
3 . ENERGy SuBSIDIES
fee, responsibility for the long-term management of the nuclear waste—including developing workable technical solutions, and building and operating a repository—has been shifted to the state. In some cases, the state has taken on partial or total funding of these liabilities already. Even where rules require a polluter-pays system, shortfalls in financial accruals will be common. Some waste collections remain within firms, and therefore are at risk in a corporate action or bankruptcy. However, most countries now move accrued funds outside of corporate control.
Many of the waste-generating reactors will be shuttered long before repository funding shortfalls materialise. Post-closure fee adjustments will be impossible. Funding shortages are likely even in externally held waste funds. These financial problems will fall to taxpayers to deal with, and the problems are likely to be very large. Cost overruns in excess of 50 per cent on so-called ‘megaprojects’ are common (Flyvbjerg 2014: 9). Nuclear megaprojects had cost overruns nearly two-and-a-half times their initial budget, higher than all of the other sectors evaluated (Locatelli 2015: 11). Even assuming cost projections used to assess fees today are correct, the repositories are often assumed to operate at break-even, generating significant subsidies to nuclear. Simply applying the average return on investment for US utilities (a less complex, less risky investment than a nuclear waste repository) would have doubled the annual waste fee levied on US reactors (Koplow 2011: 97).
Subsidies to decommissioning costsClosure costs are far more significant for nuclear than for other technologies. Decommissioning radioactive nuclear plants and fuel cycle facilities at the end of their operating lives is a major expense. The ability to delay decommissioning far into the future by leaving plants idle for many decades under some decommissioning strategies opens the door to a bit of financial engineering to make the problem seem to go away: large costs are pushed far into the future then discounted to the present using a variety of inflation and discount rate assumptions. The result is a manageable present value cost, which once adjusted to a cost per kWh generated can make decommissioning costs seem immaterial to plant economics.
Real-world outcomes are unlikely to be so predictable: the complexity, duration, and variability in the decommissioning process suggest that large costs to taxpayers are likely. The number of reactors decommissioned
LEARNING FRoM FuKuSHIMA
88
to date and thereby providing real cost experience is small. Since the regulatory and physical conditions that drive costs vary widely by installation, the available experience may not be indicative of future costs.
Some countries already subsidise accruals for decommissioning. Favourable tax treatment for decommissioning funds in the US, for example, was worth more than US$1 billion per year according to government estimates (Koplow 2011: 95). Further, although countries often try to ensure that operators accrue adequate funds for decommissioning over the facility’s operating life, the practical challenges mirror those for nuclear waste disposal and management. Accrual rates may be too low to cover actual costs, shortfalls will not be known until the facility is already closed and unable to pay more, premature closure of plants due to market or other factors will trigger immediate decommissioning shortfalls, and assumptions on financial returns or period of fund growth may not match reality, with associated undershooting of funding targets.
In some cases, accrual rates may not be based on sound estimates of expected liabilities to begin with. For example, India’s Comptroller and Auditor General noted that the decommissioning levy was last adjusted two decades earlier, and that the Atomic Energy Regulatory Board ‘had not worked out the decommissioning cost formula in any of its documents’ (Comptroller and Auditor General of India 2012: 66).
Collected funds of whatever scale can at least be protected from misuse or firm bankruptcy by mandating they be held in external trusts, and used only for the purposes for which they were set aside. Although this is required for nuclear power plants in the US, a review of practices within Europe found that only about half of the countries instituted this basic protection. Restricted external funds were even less common for other European fuel cycle facilities, such as uranium mining, milling and enrichment sites, and reprocessing plants (Wuppertal Institute for Climate, Environment and Energy and its Partners and Subcontractors 2007: 37).
These distinctions matter: £6 billion that was collected from ratepayers in the UK between 1990 and 1996 under the country’s fossil fuel levy was presented to parliament as being for the purposes of decommissioning old and unsafe power stations. However, funds were not properly restricted and segregated, resulting in roughly half the collections being used to fund operations of Nuclear Electric. Most of the remainder was eventually
89
3 . ENERGy SuBSIDIES
appropriated by the UK Treasury following the nationalisation of nuclear decommissioning liabilities associated with British Nuclear Fuels Limited (Thomas 2007: 21–8). As of 2007, and despite ‘more than 25 years of contributions, there [was] only about £800m in identified funds to pay for a liability of more than £75bn’ (Thomas 2007: 1).
Capping accident liability at levels well below likely damageLiability for off-site damage from nuclear reactors is set by domestic statute and supplemented by a series of international conventions that aim to standardise minimum liability levels. Under all of the existing frameworks, liability cover remains well below the likely damages from even a moderate-sized accident. Total coverage in the US (the largest accident pool in the world) is less than US$14 billion. In contrast, the cost of the Fukushima accident to Japanese taxpayers has already reached US$118 billion (Harding 2016), with significant costs left to be paid.
Rules on mandated coverage often contain different tiers of policies, with the first tier being most similar to conventional insurance where each reactor owner buys its own insurance policy to cover the initial portion of accident risk. Although titled ‘operator liability’ in summaries produced by the NEA (2016b), the first tier values sometimes mix in coverage from other reactors or backstopped by governments. The coverage paid for directly by the reactor owner provides the most direct price signals to operators on their risk levels; it would therefore be helpful to see cleaner data on that specific coverage. Directly funded policies can positively influence siting decisions as well as incentivise higher spending on facility and operator risk reduction.
A second tier of coverage often involves risk pooling amongst all reactors or additional coverage offered by the state. This approach dominates the insurance pool in the United States: retrospective premiums levied on all reactors should an accident exhaust the primary operator’s coverage limit (US$450 million) comprise more than 95 per cent of available funding. The approach has some structural challenges, however. It is paid in annual installments over more than six years post-accident, bringing the present value of the coverage much lower than its face value. In addition, the pool declines as reactors close down, and payments are subject to counterparty risks should remaining reactors be in financial distress (fairly likely after a major accident). Concentrated reactor ownership worsens
LEARNING FRoM FuKuSHIMA
90
counterparty risks since multiple retrospective premium payments would be due at once. Exelon alone owns 23 reactors, or nearly one-quarter of the US nuclear fleet (Exelon Generation 2016).
Additional tiers of coverage are sometimes available from other countries under convention agreements, although the amounts are relatively small (less than US$100 million). Even tallying all reliable tiers of coverage together, the amount available can be surprisingly low. The NEA (2016b) indicates liability coverage in Russia of only US$5 million under formal conventions. Additional coverage may be available but, as with many other countries, would be at the discretion of the state or of legislative bodies. Even in a country with as much nuclear power as France, the NEA indicates available accident coverage of less than US$1 billion.
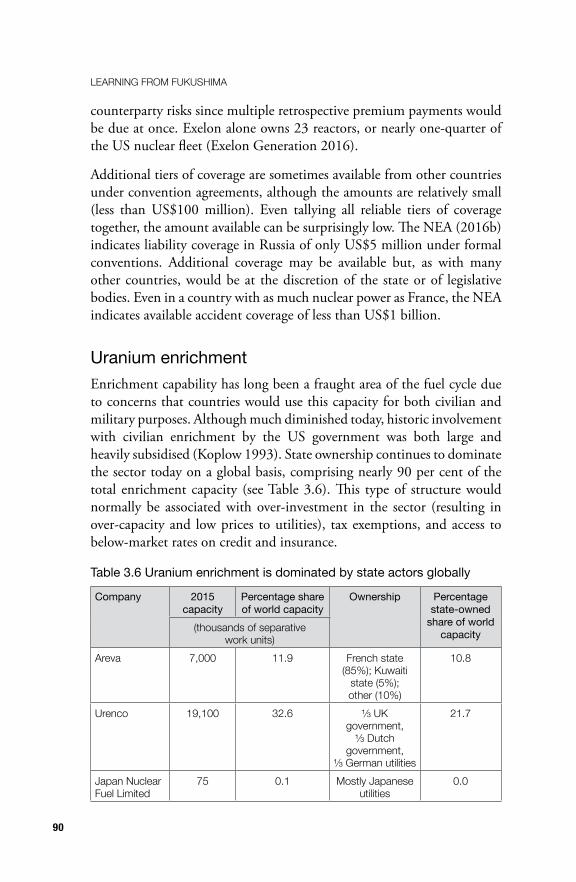
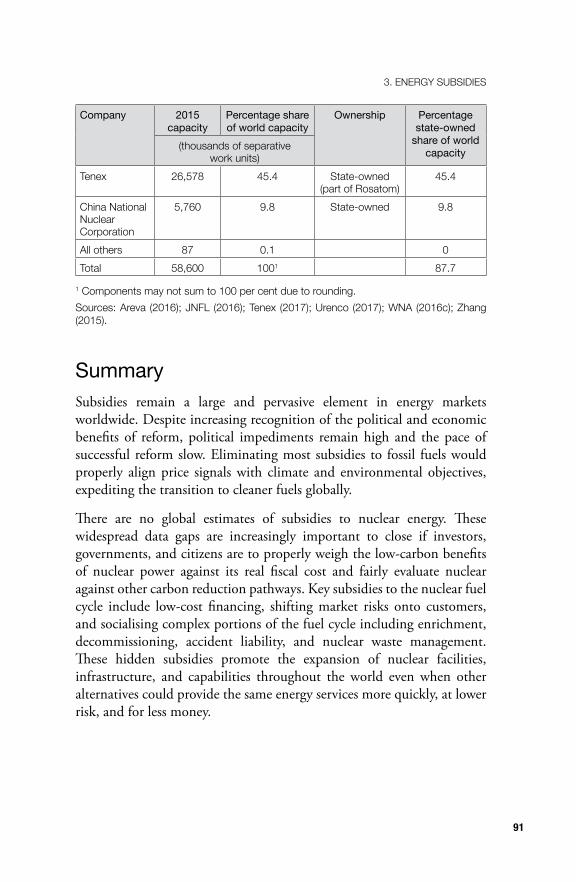
Uranium enrichmentEnrichment capability has long been a fraught area of the fuel cycle due to concerns that countries would use this capacity for both civilian and military purposes. Although much diminished today, historic involvement with civilian enrichment by the US government was both large and heavily subsidised (Koplow 1993). State ownership continues to dominate the sector today on a global basis, comprising nearly 90 per cent of the total enrichment capacity (see Table 3.6). This type of structure would normally be associated with over-investment in the sector (resulting in over-capacity and low prices to utilities), tax exemptions, and access to below-market rates on credit and insurance.
Table 3.6 Uranium enrichment is dominated by state actors globally
Company 2015 capacity
Percentage share of world capacity
Ownership Percentage state-owned
share of world capacity(thousands of separative
work units)Areva 7,000 11 .9 French state
(85%); Kuwaiti state (5%); other (10%)
10 .8
urenco 19,100 32 .6 ⅓ UK government,
⅓ Dutch government,
⅓ German utilities
21 .7
Japan Nuclear Fuel Limited
75 0 .1 Mostly Japanese utilities
0 .0
91
3 . ENERGy SuBSIDIES
Company 2015 capacity
Percentage share of world capacity
Ownership Percentage state-owned
share of world capacity(thousands of separative
work units)Tenex 26,578 45 .4 State-owned
(part of Rosatom)45 .4
China National Nuclear Corporation
5,760 9 .8 State-owned 9 .8
All others 87 0 .1 0Total 58,600 1001 87 .7
1 Components may not sum to 100 per cent due to rounding .Sources: Areva (2016); JNFL (2016); Tenex (2017); urenco (2017); WNA (2016c); Zhang (2015) .
SummarySubsidies remain a large and pervasive element in energy markets worldwide. Despite increasing recognition of the political and economic benefits of reform, political impediments remain high and the pace of successful reform slow. Eliminating most subsidies to fossil fuels would properly align price signals with climate and environmental objectives, expediting the transition to cleaner fuels globally.
There are no global estimates of subsidies to nuclear energy. These widespread data gaps are increasingly important to close if investors, governments, and citizens are to properly weigh the low-carbon benefits of nuclear power against its real fiscal cost and fairly evaluate nuclear against other carbon reduction pathways. Key subsidies to the nuclear fuel cycle include low-cost financing, shifting market risks onto customers, and socialising complex portions of the fuel cycle including enrichment, decommissioning, accident liability, and nuclear waste management. These hidden subsidies promote the expansion of nuclear facilities, infrastructure, and capabilities throughout the world even when other alternatives could provide the same energy services more quickly, at lower risk, and for less money.
LEARNING FRoM FuKuSHIMA
92
ReferencesAreva, 2016. Shareholder structure December 31, 2015. www.areva.
com/EN/finance-1166/shareholding-structure-of-the-world-leader-in-the-nuclear-industry-and-major-player-in-bioenergies.html? XTCR=1,58&XTMC=CATITAL%20 STRUCTURE? XTMC=A LTERNA%20 RADIOPROTECTION (accessed 30 January 2017).
Arze del Granado, Javier, David Coady, and Robert Gillingham, 2010. The unequal benefits of fuel subsidies: A review of evidence for developing countries. IMF WP/10/202. Washington, DC: International Monetary Fund.
Cawley, Kim, 2015. The federal government’s responsibilities and liabilities under the Nuclear Waste Policy Act. Testimony before the Subcommittee on Environment and the Economy, Committee on Energy and Commerce, US House of Representatives, 3 December. Washington, DC: US Congressional Budget Office.
CIA (Central Intelligence Agency), 2013. Government revenues. The World Factbook. www.cia.gov/library/publications/the-world-factbook/fields/2056.html (accessed 6 March 2013).
Coady, David, Ian Parry, Louis Sears, and Baoping Shang, 2015. How large are global energy subsidies? WP/15/105. Washington, DC: International Monetary Fund.
Comptroller and Auditor General of India, 2012. Report of the Comptroller and Auditor General of India on activities of Atomic Energy Regulatory Board for the year ended March 2012. Report No. 9 of 2012–13, Performance Audit. New Delhi: Union Government, Department of Atomic Energy.
Comstock, Stephen, 2014. The truth on oil and natural gas ‘subsidies’. Energy Tomorrow, 29 January.
Cox, Emily, Phil Johnstone, and Andy Stirling, 2016. Understanding the intensity of UK policy commitments to nuclear power. SWPS 2016–16. Brighton: Science Policy Research Unit, University of Sussex.
Diesendorf, Mark, 2014. Sustainable Energy Solutions for Climate Change. Sydney: UNSW Press.
93
3 . ENERGy SuBSIDIES
Doward, Jamie, 2016. Secret government papers show taxpayers will pick up costs of Hinkley nuclear waste storage. Guardian, 30 October.
Erickson, Pete, Adrian Downs, Michael Lazarus, and Doug Koplow, 2017. Effect of government subsidies for upstream oil infrastructure on US oil production and global CO2 emissions. Working Paper 2017-02. Stockholm: Stockholm Environment Institute.
Exelon Generation, 2016. Exelon nuclear fact sheet.
Feiveson, Harold, Zia Mian, M. V. Ramana, and Frank von Hippel, eds, 2011. Managing Spent Fuel from Nuclear Power Reactors: Experience and Lessons from Around the World. Princeton, NJ: International Panel on Fissile Materials, Program on Science and Global Security, Princeton University.
Flyvbjerg, Bent, 2014. What you should know about megaprojects and why: An overview. Project Management Journal 45(2): 6–19. doi.org/10.1002/pmj.21409
Governmental Accounting Standards Board, 2015. Statement No. 77 of the Governmental Accounting Standards Board: Tax abatement disclosures. No. 353. Norwalk, CT: Governmental Accounting Standards Board.
Guardian, 2012. Datablog: Healthcare spending around the world, country by country, 30 June. Extract of health care spending data collected by the World Health Organization.
Hansen, James, Kerry Emanuel, Ken Caldeira, and Tom Wigley, 2015. Nuclear power paves the only viable path forward on climate change. Guardian, 4 December.
Harding, Robin, 2016. Japan taxpayers foot $100bn bill for Fukushima disaster: Costs shouldered by public despite government claims Tokyo Electric would pay. Financial Times, 6 March.
IAEA (International Atomic Energy Agency), 2016. Country profiles: India. Vienna: IAEA.
LEARNING FRoM FuKuSHIMA
94
IAEA (International Atomic Energy Agency) PRIS (Power Reactor Information System), 2016. Country statistics: Number of power reactors by country and status. 2 November. www.iaea.org/PRIS/Country Statistics/CountryStatisticsLandingPage.aspx (accessed 5 January 2017).
IEA (International Energy Agency), 2011. World Energy Outlook 2011. Paris: International Energy Agency.
IEA (International Energy Agency), 2012. World Energy Outlook 2012. Paris: International Energy Agency.
IEA (International Energy Agency), 2013. RD&D statistics database. www.iea.org/statistics/rddonlinedataservice/ (accessed 1 October 2013).
IEA (International Energy Agency), 2014. World Energy Outlook 2014. Paris: International Energy Agency.
IEA (International Energy Agency), 2015. World Energy Outlook 2015. Paris: International Energy Agency.
IEA (International Energy Agency)/NEA (Nuclear Energy Agency), 2015. Technology roadmap: Nuclear energy, 2015 edition. Paris: IEA/NEA.
IEA (International Energy Agency), OPEC (Organization of the Petroleum Exporting Countries), OECD (Organisation for Economic Co-operation and Development), and the World Bank, 2010. Analysis of the scope of energy subsidies and suggestions for the G-20 initiative: IEA, OPEC, OECD, World Bank joint report. Prepared for submission to the G-20 Summit Meeting (26–27 June), Toronto, 16 June.
JNFL (Japan Nuclear Fuel Limited), 2016. Corporate profile. April. www.jnfl.co.jp/en/about/company/ (accessed 30 January 2017).
Kojima, Masami, and Doug Koplow, 2015. Fossil fuel subsidies: Approaches and valuation. Policy Research Working Paper WPS7220. Washington, DC: World Bank Group.
Koplow, Doug, 1993. Federal energy subsidies: Energy, environmental and fiscal impacts—Report and appendices. Washington, DC: Alliance to Save Energy.
95
3 . ENERGy SuBSIDIES
Koplow, Doug, 1998. Quantifying impediments to fossil fuel trade: An overview of major producing and consuming nations. Paper prepared for the OECD Trade Directorate.
Koplow, Doug, 2009. Measuring energy subsidies using the price-gap approach: What does it leave out? Geneva: International Institute for Sustainable Development.
Koplow, Doug, 2011. Nuclear Power: Still Not Viable without Subsidies. Cambridge, MA: Union of Concerned Scientists.
Koplow, Doug, 2015a. Global energy subsidies: Scale, opportunity costs, and barriers to reform. In Energy Poverty: Global Challenges and Local Solutions, edited by Antoine Halff, Benjamin K. Sovacool, and Jon Rozhon, 316–37. Oxford: Oxford University Press.
Koplow, Doug, 2015b. Subsidies to energy industries. In Reference Module in Earth Systems and Environmental Sciences, edited by Scott Elias, 1–16. Amsterdam: Elsevier. doi.org/10.1016/B978-0-12-409548-9.09269-1
Locatelli, Giorgio, 2015. Cost‐time project performance in megaprojects in general and nuclear in particular. Presentation to the Technical Meeting on the Economic Analysis of HTGR and SMR, International Atomic Energy Agency, 25–28 August.
Lopatka, Jan, 2014. 2-CEZ scraps Temelin nuclear plant explosion, shares up. Reuters, 10 April.
Lucas, Deborah, 2013. Evaluating the cost of government credit support: The OECD context. Paper prepared for Economic Policy, Fifty-eighth Panel Meeting, Vilnius, 25–26 October.
Matyi, Bob, 2016. New York nuclear plant subsidies fuel controversy. Platts, 10 October.
MEAG Power, 2016. Annual Information Statement of Municipal Electric Authority of Georgia, MEAG Power, for the Fiscal Year Ended December 31, 2015. Atlanta, GA: Municipal Electric Authority of Georgia.
Moody’s Investors Service, 2013. Nuclear generation’s effect on credit quality: Moody’s perspective on operating risks and new build. London: Moody’s Investors Service.
LEARNING FRoM FuKuSHIMA
96
Murdock, Clark, Thomas Karako, Ian Williams, and Michael Dyer, 2016. Thinking about the Unthinkable in a Highly Proliferated World. Lanham, MD: Rowman & Littlefield.
NEA (Nuclear Energy Agency), 2011a. Radioactive waste management programmes in OECD/NEA member countries: Switzerland. Profile. Paris: OECD.
NEA (Nuclear Energy Agency), 2011b. Radioactive waste management and decommissioning in the United Kingdom. Report. Paris: OECD.
NEA (Nuclear Energy Agency), 2011c. Radioactive waste management programmes in OECD/NEA member countries: United Kingdom. Profile. Paris: OECD.
NEA (Nuclear Energy Agecny), 2013a. Radioactive waste management programmes in OECD/NEA member countries: Spain. Profile. Paris: OECD.
NEA (Nuclear Energy Agency), 2013b. Radioactive waste management programmes in OECD/NEA member countries: Sweden. Profile. Paris: OECD.
NEA (Nuclear Energy Agency), 2014a. Radioactive waste management in Rep. of Korea. Report. Paris: OECD.
NEA (Nuclear Energy Agency), 2014b. Radioactive waste management programmes in OECD/NEA member countries: Russian Federation. Profile. Paris: OECD.
NEA (Nuclear Energy Agency), 2015. Radioactive waste management programmes in OECD/NEA member countries: Canada. Profile. Paris: OECD.
NEA (Nuclear Energy Agency), 2016a. Radioactive waste management programmes in OECD/NEA member countries: France. Profile. Paris: OECD.
NEA (Nuclear Energy Agency), 2016b. Nuclear operator liability amounts and financial security limits. Paris: OECD, November.
OECD (Organisation for Economic Co-operation and Development), 2011. Inventory of Estimated Budgetary Support and Tax Expenditures for Fossil Fuels. Paris: OECD.
97
3 . ENERGy SuBSIDIES
OECD (Organisation for Economic Co-operation and Development), 2015. OECD Companion to the Inventory of Support Measures for Fossil Fuels 2015. Paris: OECD.
Ramana, M. V., 2013. Power of Promise: Examining Nuclear Energy in India. New Delhi: Penguin Global.
Ramana, M. V., 2016a. A fast reactor at any cost: The perverse pursuit of breeder reactors in India. Bulletin of the Atomic Scientists, 3 November.
Ramana, M. V., 2016b. Email communication with Doug Koplow, Earth Track, 30 November.
Reuters, 2016. Rosatom’s global nuclear ambition cramped by Kremlin politics. 26 June.
Rosatom, 2016. Projects. www.rosatom.ru/en/investors/projects/ (accessed 1 November 2016).
Ruddick, Graham, 2016. China plans central role in UK nuclear industry after Hinkley Point approval. Guardian, 16 September.
Russia Times, 2015. Russia to loan Egypt $25bn for nuclear plant construction. 30 November.
Russia Times, 2016. ‘Underground Chernobyl’: French parliament OKs nuclear waste facility despite protests. 13 July.
SACE (Southern Alliance for Clean Energy), 2016. Proposed agreement would reward southern company for bungled, massively over budget and 45-month delayed Plant Vogtle reactors. 22 October.
Tenex (Techsnabexport), 2017. Company profile. www.tenex.ru/wps/wcm/connect/tenex/site.eng/company/ (accessed 30 January 2017).
The Week UK, 2016. Hinkley Point: Bold move or white elephant? 16 September.
Thomas, Steve, 2007. Final country report: United Kingdom. In Comparison Among Different Decommissioning Funds Methodologies for Nuclear Installations, edited by Wuppertal Institute for Climate, Environment and Energy and its Partners and Subcontractors. Final report on behalf of the European Commission Directorate-General Energy and Transport, H2, Service Contract TREN/05/NUCL/S07.55436.
LEARNING FRoM FuKuSHIMA
98
Thomas, Steve, 2017. China’s nuclear export drive: Trojan horse or Marshall Plan? Energy Policy 101, February: 683–91. doi.org/10.1016/j.enpol.2016.09.038
Urenco, 2017. Company structure, Urenco Ltd. www.urenco.com/about-us/company-structure/ (accessed 30 January 2017).
US DOE (Department of Energy), 2013. Strategy for the management and disposal of used nuclear fuel and high-level radioactive waste. January.
Wang, Ju, 2014. On area-specific underground research laboratory for geological disposal of high-level radioactive waste in China. Journal of Rock Mechanics and Geotechnical Engineering 6(2): 99–104. doi.org/10.1016/j.jrmge.2014.01.002
WNA (World Nuclear Association), 2016a. Nuclear power in China. 5 November.
WNA (World Nuclear Association), 2016b. Radioactive waste management: National policies and funding. September.
WNA (World Nuclear Association), 2016c. Uranium enrichment. September.
WNA (World Nuclear Association), 2016d. World nuclear power reactors & uranium requirements. 1 September.
World Bank, 2010. Addressing the electricity access gap. Background Paper. June.
World Bank, 2013a. Gross domestic product by country. Databank data series. databank.worldbank.org/data/reports.aspx?source= 2&series= NY.GDP.MKTP.CD&country= (accessed 24 January 2017).
World Bank, 2013b. Total population, by country. Databank data series. databank.worldbank.org/data/reports.aspx?source=2&series=SP.POP.TOTL&country= (accessed 24 January 2017).
World Bank, 2017. Gross domestic product by country. Databank data series. databank.worldbank.org/data/reports.aspx?source=2 &series= NY.GDP.MKTP.CD&country= (accessed 24 January 2017).
World Nuclear News, 2016a. French repository costs disputed. 12 January.
99
3 . ENERGy SuBSIDIES
World Nuclear News, 2016b. Illinois rallies as nuclear plants fail in capacity auction. 25 May.
World Nuclear News, 2016c. Rosatom explains benefits of state backing to plant projects. 11 February.
Wren, David, 2016. Power surge: Cost overruns at nuclear plant a growing part of SCE&G customers’ bills. The Post and Courier, 17 June.
Wuppertal Institute for Climate, Environment and Energy and its Partners and Subcontractors, eds, 2007. Comparison among different decommissioning funds methodologies for nuclear installations. Final report on behalf of the European Commission Directorate-General Energy and Transport, H2, Service Contract TREN/05/NUCL/S07.55436.
Zhang, Hui, 2015. China’s uranium enrichment capacity: Rapid expansion to meet commercial needs. Cambridge, MA: Belfer Center for Science and International Affairs, Harvard University.
Zhang, Hui, and Yunsheng Bai, 2015. China’s access to uranium resources. Cambridge, MA: Belfer Center for Science and International Affairs, Harvard University.
Zhou, Yen, 2013. China’s nuclear waste: Management and disposal. Presentation, Managing the Atom Project, Belfer Center for Science and International Affairs, Harvard University, Cambridge, MA, 28 May.
This text is taken from Learning from Fukushima: Nuclear power in East Asia, edited by Peter Van Ness and Mel Gurtov, published 2017 by
ANU Press, The Australian National University, Canberra, Australia.
dx.doi.org/10.22459/LF.09.2017.03