energy, sustainability and development
TRANSCRIPT
Energy, Sustainability and DevelopmentEnergy, Sustainability and Development
Chris Llewellyn SmithChris Llewellyn Smith
Part A – the energy challenge– what must be done?– can it add up to a solution?
Part B – what part can fusion play?
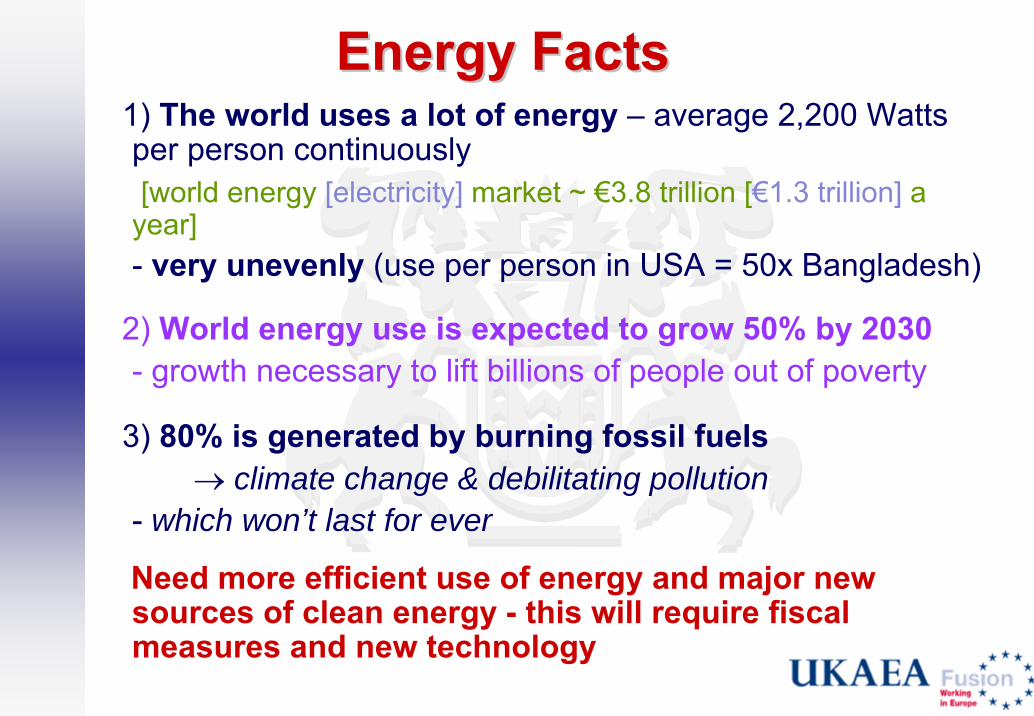
1) The world uses a lot of energy – average 2,200 Watts per person continuously[world energy [electricity] market ~ €3.8 trillion [€1.3 trillion] a
year]- very unevenly (use per person in USA = 50x Bangladesh)
2) World energy use is expected to grow 50% by 2030- growth necessary to lift billions of people out of poverty
3) 80% is generated by burning fossil fuels→ climate change & debilitating pollution
- which won’t last for ever
Need more efficient use of energy and major new sources of clean energy - this will require fiscal measures and new technology
Energy FactsEnergy Facts
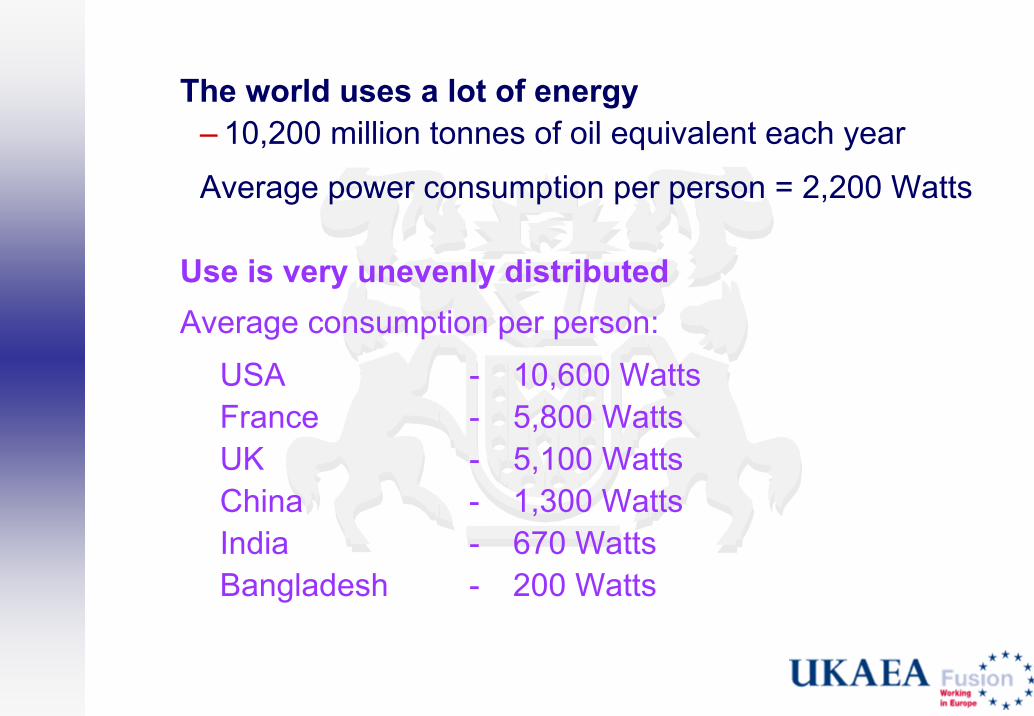
� The world uses a lot of energy– 10,200 million tonnes of oil equivalent each year
Average power consumption per person = 2,200 Watts
� Use is very unevenly distributedAverage consumption per person:
USA - 10,600 WattsFrance - 5,800 WattsUK - 5,100 WattsChina - 1,300 WattsIndia - 670 WattsBangladesh - 200 Watts

Future Energy UseFuture Energy Use� The International Energy Agency (IEA) expects the
world’s energy use to increase 50% by 2030 (while population expected to grow from 6.2 billion to 8.1 billion) -driven largely by growth of energy use and population in India and China
� There is a strong link between energy use and the Human Development Index (HDI ~ life expectancy at birth + adult literacy and school enrolment + gross national product per person at purchasing power parity)

HDI HDI ( ~ life expectancy at birth + adult literacy & school enrolment( ~ life expectancy at birth + adult literacy & school enrolment + + GNP per person at PPP)GNP per person at PPP) and Primary Energy Demand per person, 2002and Primary Energy Demand per person, 2002
For all developing countries to reach this point, would need world energy use to double with today’s population, or increase 2.6 fold with the 8.1 billion expected in 2030If also all developed countries came down to this point the factors would be 1.8 today, 2.4 in 2030
Goal (?)
To reach this goal seems need

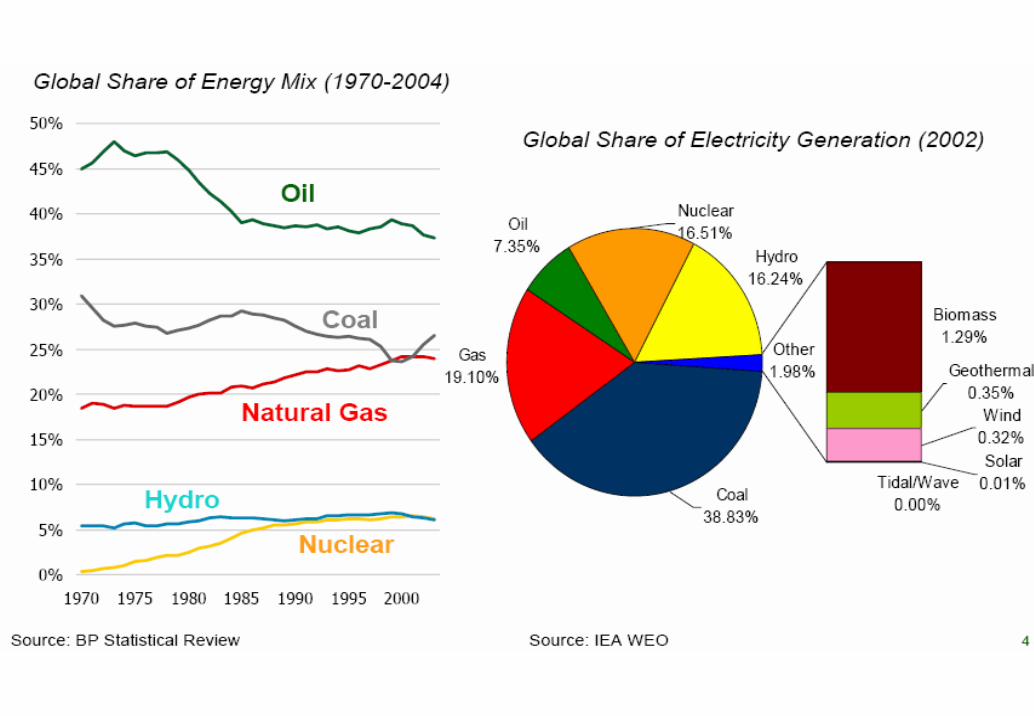
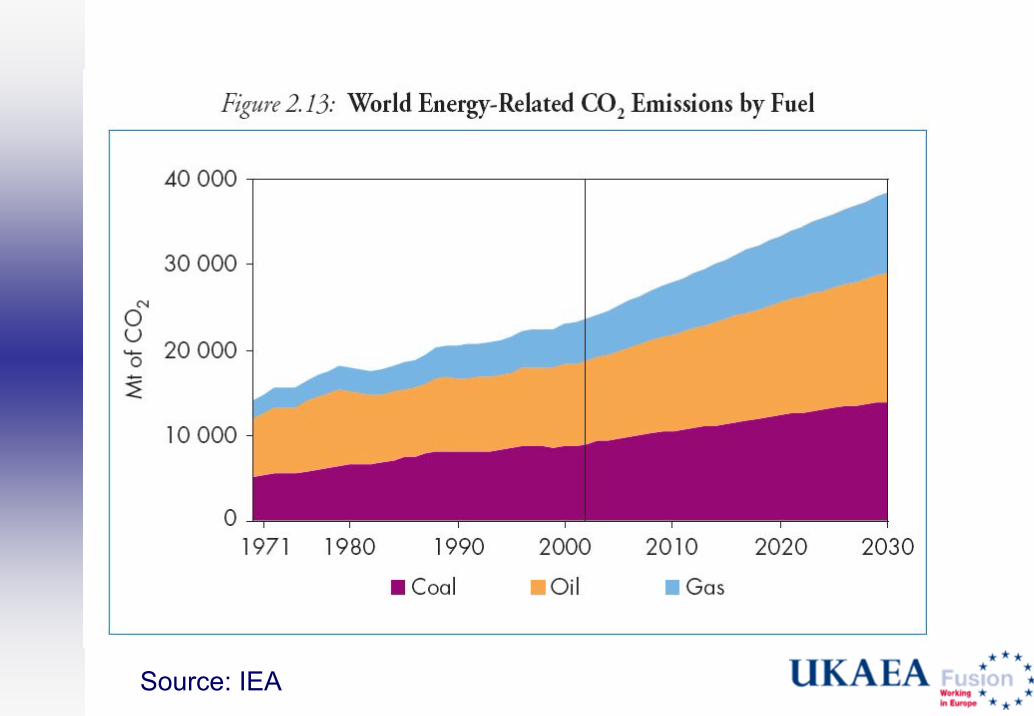
Sources of EnergySources of Energy�World’s primary energy supply (approximate):
80 % - burning fossil fuels (35% oil, 24% coal; 21% natural gas)
10% - burning combustible renewables and waste5% - nuclear5% - hydro0.5% - geothermal, solar, wind, . . .
NB Primary energy is a slippery/subtle concepte.g. also often see (e.g. on next slide)
nuclear – 6.8%, hydro – 2.2%

Source: IEA

�Note fossil fuels, which are–generating debilitating pollution (the World
Bank estimated that in 1995 air and water pollution cost China $54 billion - 7.4 million working person years lost every year due to pollution related illness)
–and driving potentially catastrophic climate change
will run out sooner or later

Saudi saying Saudi saying ““My father rode a camel. I drive a car. My son flies My father rode a camel. I drive a car. My son flies a plane. His son will ride a camela plane. His son will ride a camel””.. Is this true? PerhapsIs this true? Perhaps
US Geological Survey’s estimate (by far the biggest*) → enough conventional oil for 90 years at current rate of consumption (50 years with continued current 1.6% annual growth), but oil production peak in under 25 years (then fall ~ 3% p.a.??) *others: ~ 55 years without growth, ~ 40 years with growth, peak in ~ 10 yearsPost peak will increasingly have to rely on conversion to oil ofunconventional oil or coal (or use hydrogen!) – expensive, produces CO2
Enough natural gas for 150 years at current rate of consumption (65 years with continued 2.35% annual growth)
Enough coal for 200+ years at current rate of consumption (95+ years with continued 1.4% annual growth)
[UK – existing nuclear power stations closing, coal station closures foreseen to meet EU Directive, north sea oil and gas past peak]


Use of EnergyUse of Energy• Electricity production uses ~ 1/3 of primary energy*
(more in developed world; less in developing world)- this fraction could (and is likely in the future to) be higher* at ~ 35% efficiency
• End Use≈ 25% industry≈ 25% transport≈ 50% built environment ≈ 31% domestic in UK
(private, industrial, commercial)

electrical energy = 12.4% worldprimary energy
= 6.0% Bangladesh= 14.6% France= 13.8% UK
CO2 per unit of primary energy: UK = 1.01 x world averageFrance = 0.61x world average
CO2 per capita: UK = 2.30 x world averageFrance = 1.58 x world average

Agriculture
Iron and steel industry
Other industries
Railways
Road transport
Water transport
Air transport
Domestic
Public administration
Commercial and otherservices
Partition of Energy Consumption in the UK (2002)

Fuel used in UK electricity production Fuel used in UK electricity production ––contribution of contribution of renewablesrenewables 20032003
Other biofuels13%
Onshore wind17%
Offshore wind and solar PV
1%
Landfill gas43%
Sewage sludge digestion
5%
Municipal solid waste13%
Co-firing biofuels
8%
Coal35%
Other fuels3%
Nuclear22%
Gas37%
Imports1% Hydro
1%Oil1%

World’s second largest consumer of primary energy (after US)
Produced 1.6bn tonnes of coal in 2003
Coal dominant and set to remain so,although oil, natural gas and nuclear set to grow
Hard Coal76%
Liquid Fuels3%
Manufactured gases
1%
Natural gas0%
Nuclear2%
Hydro18%
Solid Biomass0%>1%>1%
Fuel used in electricity production Fuel used in electricity production –– China 2002China 2002

Carbon dioxide levels over the last 60,000 years
Source University of Berne and National Oceanic, and Atmospheric Administration

© Crown copyright 2004
CO 2 Concentration in Ice Core Samples andProjections for Next 100 Years
150
200
250
300
350
400
450
500
550
600
650
700
Years Before Present
Vostok RecordIPCC IS92a ScenarioLaw Dome RecordMauna Loa Record
Current(2001)
Projected(2100)
0100,000200,000300,000400,000
(BP 1950)
Projected (2100)
Current (2001)
CO
2C
once
ntra
tion
(ppm
v)
Projected levels of atmospheric CO2during the next 100 years would be higher than at anytime in the last 440,000 yrs
Source: IEA
© Crown copyright 2004
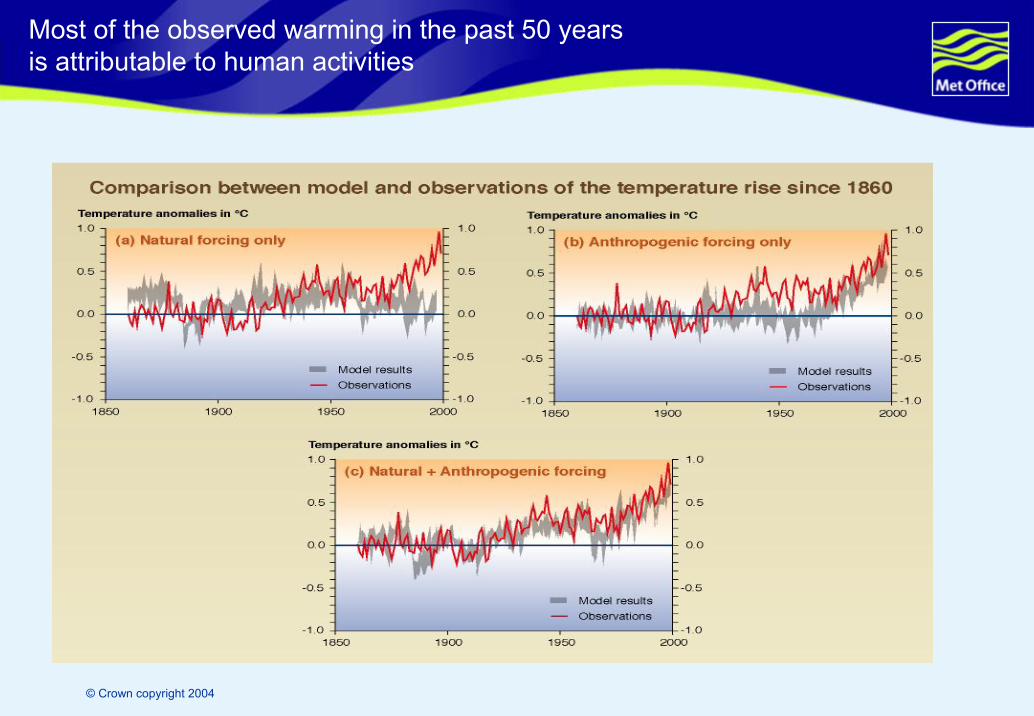
Most of the observed warming in the past 50 years is attributable to human activities

The Effects Of Climate ChangeThe Effects Of Climate Change
Ambitious goal for 2050 (when predicted total world power market is 30TW)
- limit CO2 to twice pre-industrial level; would need 20 TW of CO2-free power(compared to today’s world total power market of 13 TW)
US DoE “The technology to generate this amount of emission-free power does not exist”
Increased flooding and storm damage
Hotter and drier summers
Milder winter
Reduced snowfallReduced soil
moisture
Extreme events - heat waves, droughts, tornadoes
Sea Level Rise
Disrupted transport
Changed stream flows
Tourism IndustryAgriculture
Disrupted energy demand patterns
Reduced water supply
Coastal erosion

Thames Barrier Now Closed Frequently to Thames Barrier Now Closed Frequently to Counteract Increasing Flood RiskCounteract Increasing Flood Risk

Conclusions on Energy ChallengeConclusions on Energy ChallengeLarge increase in energy use expected, and needed to lift world
out of povertySeems (IEA World Energy Outlook) that it will require an increased
use of fossil fuels– which will drive potentially catastrophic climate change*– will run out sooner or later
There is therefore an urgent need to reduce energy use (or at least curb growth), and seek cleaner ways of producing energy on a large scaleIEA: “Achieving a truly sustainable energy system will call for radical breakthroughs that alter how we produce and use energy”
*Ambitious goal for 2050 - limit CO2 to twice pre-industrial level. To do this while meeting expected growth in power consumptionwould need 50% more CO2-free power than today’s total power
US DoE “The technology to generate this amount of emission-free power does not exist”

Meeting the Energy Challenge Meeting the Energy Challenge ––what must be done? Iwhat must be done? I
Introduce fiscal measures and regulation to change behaviour of consumers, provide incentives to encourage the market to expand use of low carbon technologies, stimulate R&D by industry
Recognise that new/improved technology will be essential + increased investment in energy research*Note: energy market ~ £2.5 trillion a year, so 10% cost increase → £250,000 million a year*public funding down 50% globally since 1980 in real terms; world’s energy R&D budget ~ 0.3% of energy market
Note – when considering balance of R&D funding should bring market incentives/subsidies (designed to encourage deployment of renewables) into the picture

Coal44.5%
Oil and gas30%
Fusion1.5%
Fission6%
Renewables18%
Energy subsidies Energy subsidies ((€€28 28 bnbn pa)pa) + R&D + R&D ((€€2 2 bnbn papa**))in the EU~ 30 Billion Euro (per year)in the EU~ 30 Billion Euro (per year)
Source : EEA, Energy subsidies in the European Union: A brief overview, 2004. Fusion and fission are displayedseparately using the IEA government-R&D data base and EURATOM 6th framework programme data
*€2bn R&D: 37% fission, 24% fusion,18% renewables, 18% efficiency, 3% other

Meeting the Energy Challenge IIMeeting the Energy Challenge IIRecognise that the solution will be a cocktail (there is no silver bullet), including■ Actions to improve efficiency (domestic, transport,…, grid)■ Use of renewables where appropriate (although individually not hugely significant globally, except in principle solar)
BUT only four sources capable in principle of meeting a large fraction of the world’s energy needs:
• Burning fossil fuels* (currently 80%) - develop & deploy CO2 capture and storage
* must try to slow down, but remaining fossil fuels will be used• Solar - seek breakthroughs in production and storage• Nuclear fission - hard to avoid if we are serious about reducing fossil
fuel burning (at least until fusion available)• Fusion - with so few options, we must develop fusion as fast as
possible, even if success is not 100% certain

Energy EfficiencyEnergy EfficiencyProduction e.g. – world average power plant efficiency ~ 30% →
45% (state of the art) would save 4% of anthropic carbon dioxide– use of flared gas in Africa could produce 20 GW ( = half Africa’s current electricity)
Distribution – typically 10% of electricity lost → 50% in some countries: need better metering
Use: better insulated homes, CHP (40% → 85-90% use of energy)smart/interactive gridmore efficient transport
Huge scope (e.g. WEC – 25% by 2020, – 40% by 2050%) but demand is rising fasterEfficiency is a key component of the solution, but cannot meet the energy challenge on its own

The Built EnvironmentThe Built Environment
Consumes ~ 50% of energy(transport 25% and industry 25%)
→ nearly 50% of UK CO2emissions due to constructing, maintaining, occupying buildings
Improvements in design could have a big impact
e.g. could cut energy used to heat homes by ~ 3
Tools: better information, regulation, financial instruments
Source: Foster and Partners

Smart/interactive grid: washing machine (etc) should turn on/off to optimise electricity production/minimise cost

The Economist 29/5/04

Source: IEA

Source: IEA
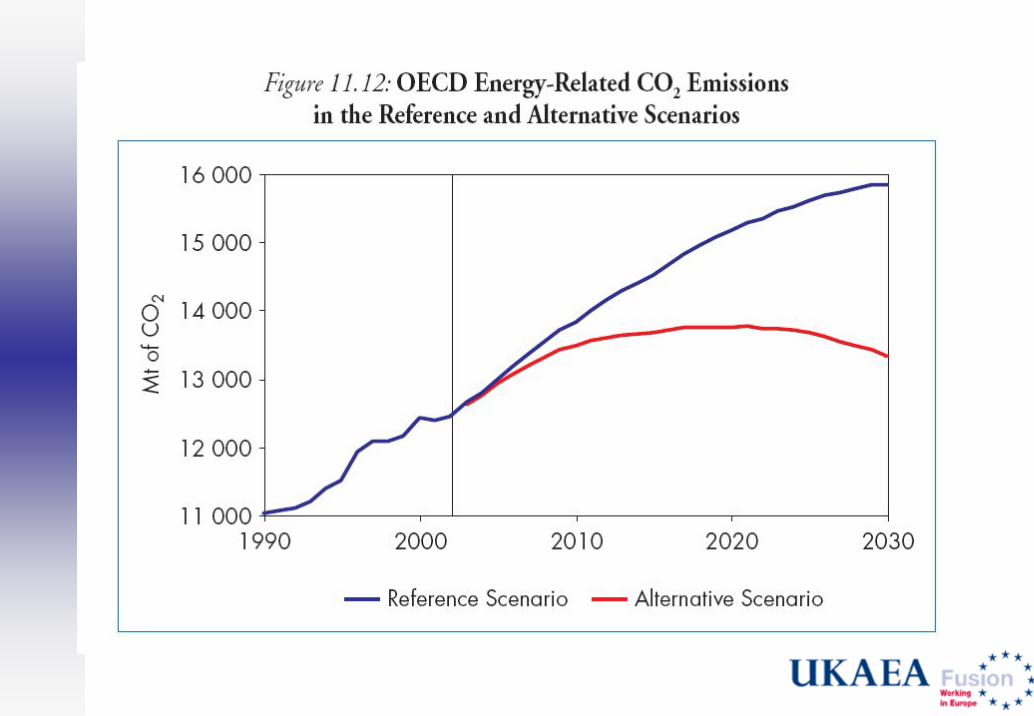

Source: IEA

RenewablesRenewables –– Introduction and SummaryIntroduction and SummaryEstimating the potential of renewables ~ many assumptions
Some are easy to express/understand (e.g. how much of the solar power falling on the earth’s surface can be captured), but others (e.g. how much of wind energy can be captured) are not - treat statements on the following slides with care!
The conclusions (relative to world’s consumption ~ 14 TW) are• Solar could in principle power the world – given breakthroughs in energy storage and costs (which should be sought)• Hydro is already significant and could probably be expanded to ~ 1 TW• Wind and burning biomass are capable in principle of contributing on the TW scale• Geothermal, tidal and wave energy will not contribute on this scale, but should be fully exploited where sensible
Conclusions are very location dependent, e.g. geothermal is a major player in Iceland, Kenya,…; the UK has 40% of Europe’s wind potential and is well placed for tidal and waves; the US south west is much better than the UK for solar; there is big hydro potential in the Congo;…

Potential of Potential of RenewablesRenewables II(S(Seeking significant fraction of worldeeking significant fraction of world’’s 14 TW consumption)s 14 TW consumption)
Solar - 85,000 TW reaches earth’s surface → 25,000 TW on land⇒ capture of 1% at 10% efficiency ⇒ 25 TW ~ 2x current total usebut: cost, location, timing → storage? [note – loose (conversion efficiency)2]Poor in UK (100 Wm-2): to produce UK’s total power consumption (300 GW) need (56x56) km2 – with 100% efficiency and not allowing for access
Tidal - input 3 TW; at reasonable sites - 0.2 TW peak/0.06 TW average (for barrages: underwater tidal streams could do better)Favourable in UK – underwater tidal streams (few GWs at good sites); Severn barrage ⇒ 8 GW peak/2 GW average (but very expensive)
Waves - 1 TW available in principle on continental shelves, 0.1 TW in shallow waterFavourable in UK - up to 10 GW in principle (but this assumes 100% efficient, using whole coast, cost no object)
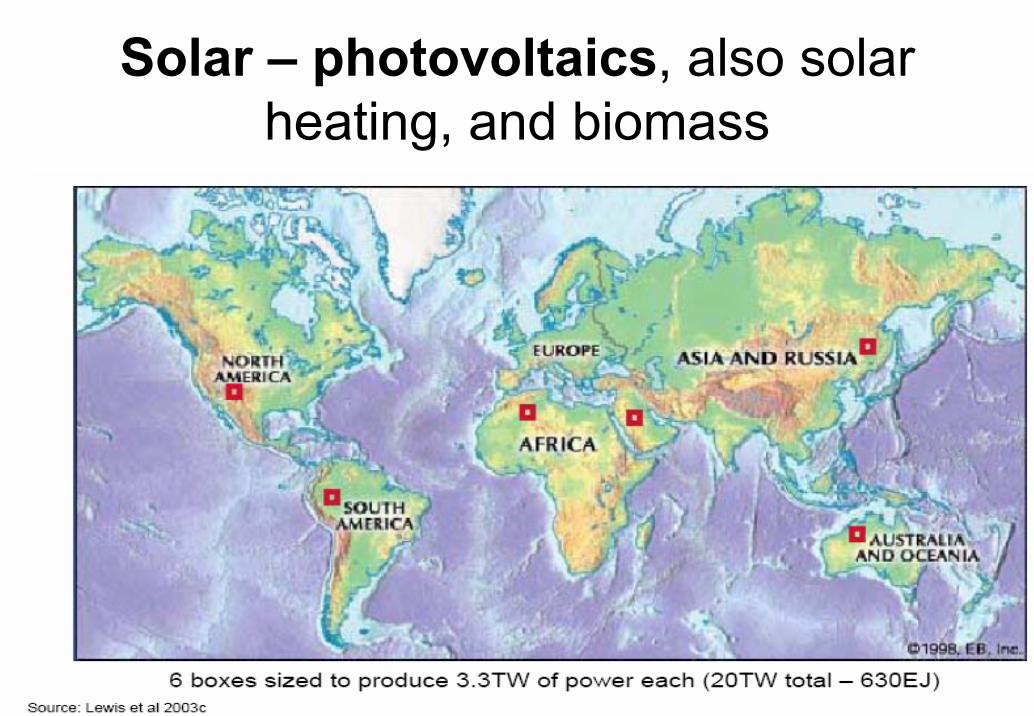
Solar – photovoltaics, also solar heating, and biomass

Projected cost of photovoltaic solar power?
$1/WpAC → 2.6 €-cents/kWhr in California (4.7 in Germany)
- requires cost ~ cost of glass!
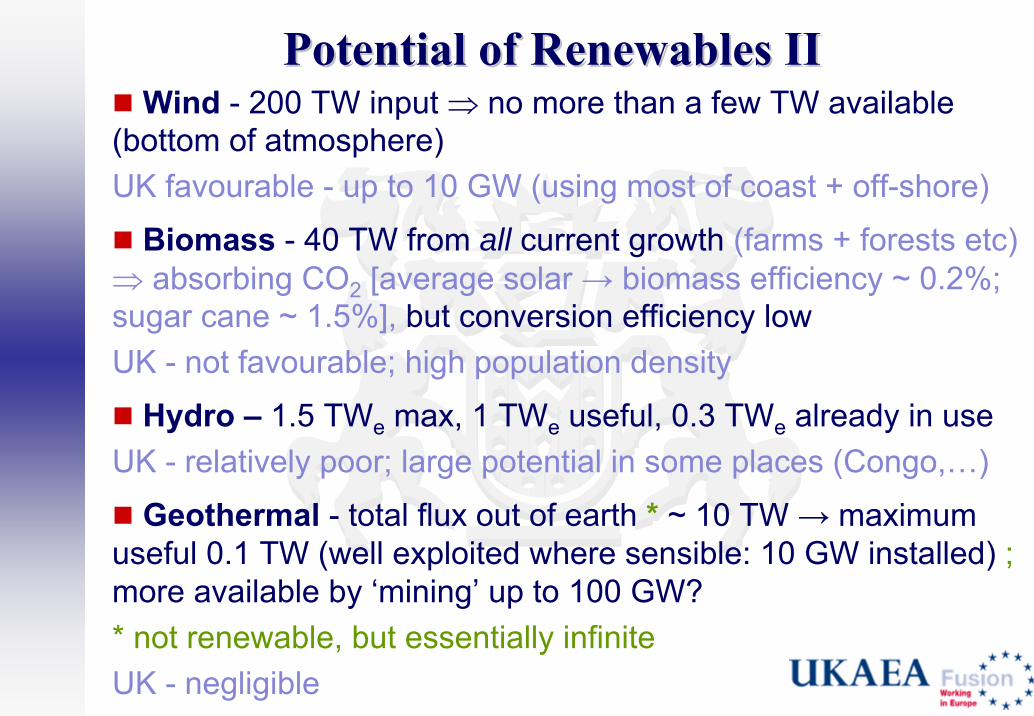
Potential of Potential of RenewablesRenewables IIIIWind - 200 TW input ⇒ no more than a few TW available
(bottom of atmosphere)UK favourable - up to 10 GW (using most of coast + off-shore)
Biomass - 40 TW from all current growth (farms + forests etc)⇒ absorbing CO2 [average solar → biomass efficiency ~ 0.2%; sugar cane ~ 1.5%], but conversion efficiency low UK - not favourable; high population density
Hydro – 1.5 TWe max, 1 TWe useful, 0.3 TWe already in useUK - relatively poor; large potential in some places (Congo,…)
Geothermal - total flux out of earth * ~ 10 TW → maximum useful 0.1 TW (well exploited where sensible: 10 GW installed) ; more available by ‘mining’ up to 100 GW? * not renewable, but essentially infiniteUK - negligible


Carbon Capture and StorageCarbon Capture and Storage(Scale: world CO(Scale: world CO22 production currently 25 production currently 25 GtGt pa)pa)
In principle could capture CO2 from power stations (35% of total) and from some industrial plants (not from cars, domestic…), and CO2 extracted from natural gas and released when making hydrogen
Capture - would add at least $1.5c/kWh to cost (gas - more for coal)Storage – could (when location appropriate) be in depleted gas fields (<690 Gt*), depleted oil fields (<120 Gt*), deep saline acquifers (10,000 Gt*??)*based on injection costs of up to $20 per tonne of CO2 stored (current world average for all sources is one tonne of CO2 produced for every $120 spent on energy)
With current technology: capture, transmission and storage would ~ double cost of production for coal
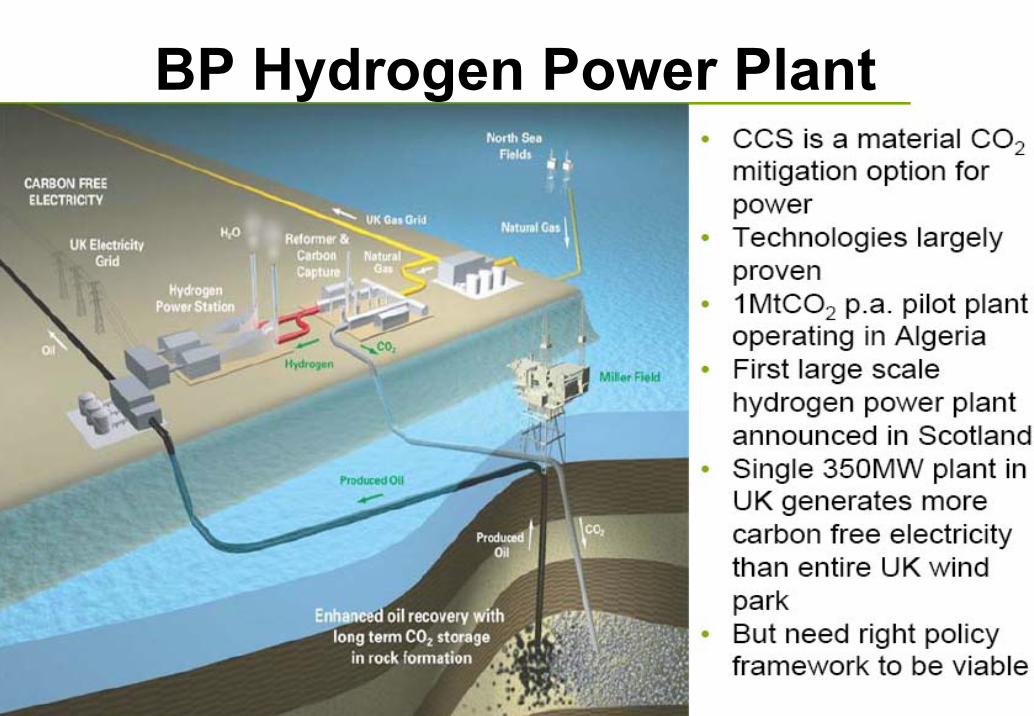
BP Hydrogen Power Plant

Nuclear PowerNuclear PowerRecent performance impressive – construction on time and
budget, excellent safety record, cost looks OK
Non-political constraints on expansion- waste storage space breeders*, reprocessing,- exhaustion of lower cost Uranium* incineration?* in ~ 50?? years with present use*U/Pu cycle: large plutonium inventory – slow ramp up N(LWRs) → N(LWRs + FBRs) ~ 40 yearsOrTh/U cycle – faster ramp up but large 233U inventory (also fissile)
Note: 4 of 6 ‘Generation 4’ models are breeders


FusionFusionD + T D + T →→ He + N + 17.6 He + N + 17.6 MeVMeVChallengesChallenges::
1)1) Heat DHeat D--T plasma to over 100 M T plasma to over 100 M 00CC = 10xtemperature of= 10xtemperature ofcore of sun, core of sun, while keeping it from touching the wallswhile keeping it from touching the wallsThis has been done using a This has been done using a ‘‘magnetic bottlemagnetic bottle’’ ((tokamaktokamak))The Joint European Torus (JET) at Culham in the UK has produced 16 MW of fusion power
2) Make a robust container (able to withstand huge neutron bombardment)
The raw fuels are lithium (→ T) and water (→ D)The lithium in one laptop battery + half a bath of water would produce 200,000 kW-hours of electricity= (total UK electricity production)/population for 30 years
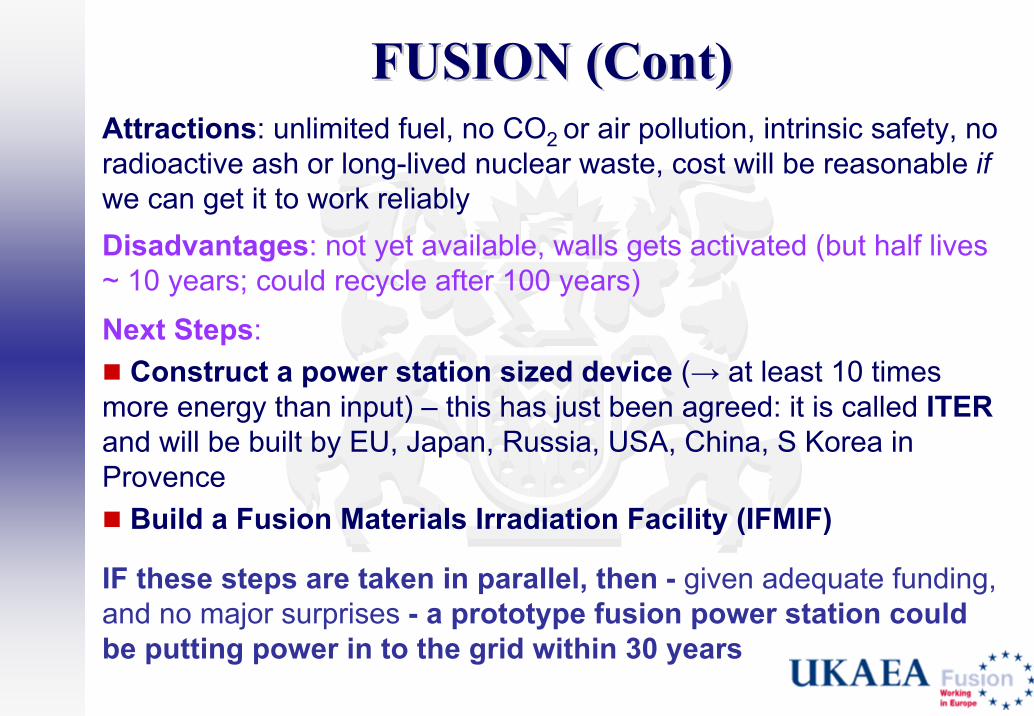
FUSION (Cont)FUSION (Cont)Attractions: unlimited fuel, no CO2 or air pollution, intrinsic safety, no radioactive ash or long-lived nuclear waste, cost will be reasonable ifwe can get it to work reliablyDisadvantages: not yet available, walls gets activated (but half lives ~ 10 years; could recycle after 100 years)
Next Steps: Construct a power station sized device (→ at least 10 times
more energy than input) – this has just been agreed: it is called ITER and will be built by EU, Japan, Russia, USA, China, S Korea in Provence
Build a Fusion Materials Irradiation Facility (IFMIF)
IF these steps are taken in parallel, then - given adequate funding, and no major surprises - a prototype fusion power station could be putting power in to the grid within 30 years

Conclusions on Meeting the Energy Challenge IConclusions on Meeting the Energy Challenge IMajor contributions possible/necessary from improved
efficiency (domestic, …, grid), and renewables (although individually not hugely significant, except solar in principle)
Only four sources capable in principle of meeting a large fraction of the world’s energy needs:• Burning fossil fuels (currently 80%) - must see if large-scale CO2 capture and storage is possible, and can be made safe and cheap• Solar - must seek fundamental breakthroughs in production and storage• Nuclear fission - cannot avoid if we are serious about reducing fossil fuel burning (at least until fusion available)• Fusion - with so few options, we must develop fusion as fast as possible, even if success is not 100% certain
Need alternatives for transport(hydrogen, electric,…)

Could what is available add up to a solution?Could what is available add up to a solution?
‘Wedges’ – reduce a heroic challenge to a limited set of monumental tasks (Pacala & Socolow)
What is needed to stabilise emissions over next 50 years ( ~ life time of power plant!)?
Assume (present trend) without action rising consumption would double CO2 emissions → extra 7 Gt/year of carbon
Look for strategies/‘wedges’ ~ technologies which exist (efficiency, renewables, nuclear,…), although many need scaling up, that might each save1/7th of projected increase (1Gt/year in 2056; integrated saving of 25 Gt)


Possible WedgesPossible WedgesEfficiency – 2 billion cars 30 → 60 mpg (or half use)
– 25% less in all buildings– all new coal power plants → 60% efficient (high T)
Nuclear – +700 GW (2xpresent; phase out of nuclear →need half an extra wedge)
Renewables – 2 million 1 MWe windmills replacing coal (50xpresent) or 4 million → hydrogen for cars
– 2000 GWe solar (700xpresent) replacing coal– 100xcurrent bio-ethanol (1/6 world’s crop land)
CCS – on 800 GWe from coal (or 1600 GW gas)
……note after 50 years need 5 more wedges (more unless existing wedges can continue to grow) + oil and gas running out →problem exacerbated by increasing use of coal?

Conclusions of Parts AConclusions of Parts A■ Large increase in energy use expected; huge increase needed to lift world out of poverty
■ Challenge of meeting demand in an environmentally responsible manner is enormous■ No silver bullet - need a portfolio approach (‘wedges’)■ Need fiscal incentives, regulation, economic* and political* ideas, more R&D…
The time for action is nowThe time for action is now
* climate change is an ‘externality’ generated locally (mostly in developing countries up to now) but felt globally (worst effectsin developing countries) in the future

Part B Part B –– what part can fusion play? what part can fusion play? SummarySummary
Fusion works (it powers the sun and stars; JET has produced 16 MW of fusion power) and has many potential attractionsThere are big challenges, and more time is needed for development, but– no obvious barriers to rate of growth once fusion has
passed threshold of viability– fusion could play an important role in second half of
this century
Role in 2100 will depend on cost of fusion vs cost of carbon/cost of alternatives – models suggest it could be substantial

WHAT IS FUSION ?WHAT IS FUSION ?
A “magnetic bottle” called a tokamak keeps the hot gas away from the wall
Challenges: make an effective “magnetic bottle” (now done ?)a robust container, and a reliable system
* ten million times more than in the chemical reactions in burning fossil fuels ⇒ a 1 GW fusion power station would use 1 Kg of D + T in a day, compared to 10,000 tonnes of coal in a coal power station
Fusion is the process that produces energy in the core of the sun and stars
It involves fusing light nuclei (while fission ⇒ splitting heavy nuclei)
The most effective fusion process involves deuterium (heavy hydrogen) and tritium (super heavy hydrogen) heated to above 100 million °C :
Deuterium
Tritium Neutron
Helium
+ energy + energy (17.6 MeV*)
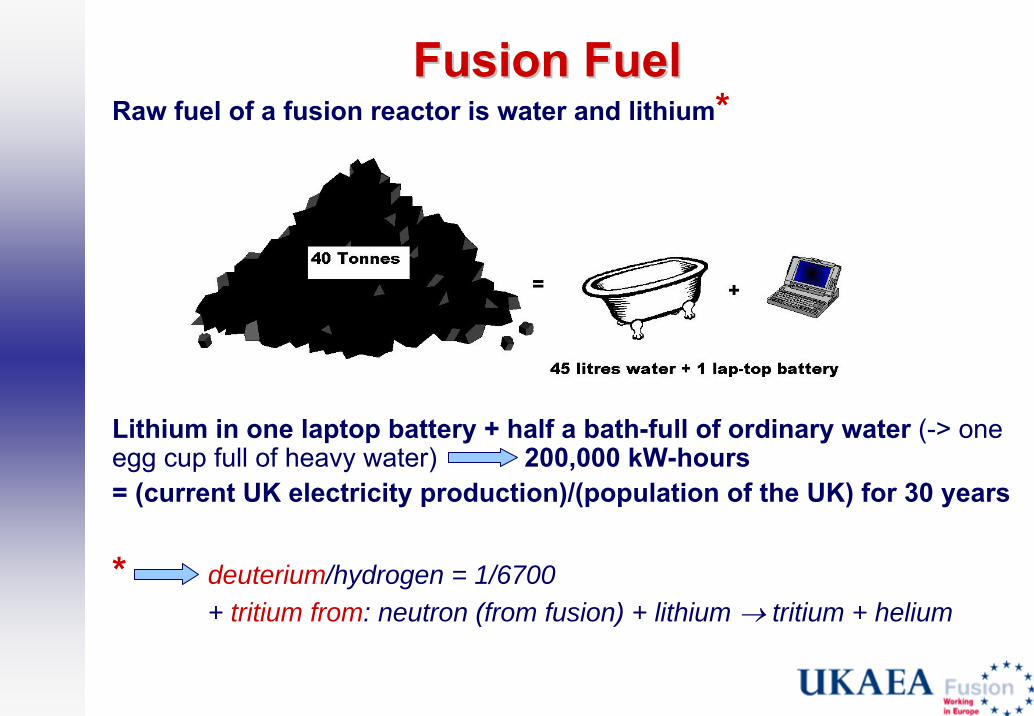
Fusion FuelFusion FuelRaw fuel of a fusion reactor is water and lithium*
Lithium in one laptop battery + half a bath-full of ordinary water (-> one egg cup full of heavy water) 200,000 kW-hours = (current UK electricity production)/(population of the UK) for 30 years
* deuterium/hydrogen = 1/6700+ tritium from: neutron (from fusion) + lithium → tritium + helium

Lithium compound
Not to scale !
A Fusion power plant would be like a conventional one,A Fusion power plant would be like a conventional one,but with different fuel and furnacebut with different fuel and furnace

FUSION ATTRACTIONSFUSION ATTRACTIONS– unlimited fuel
– no CO2 or air pollution
– Intrinsic safety
– no radioactive “ash” and no long-lived radioactive waste
– competitive electricity generation cost, if reasonable availability (e.g 75%) can be achieved (and essentially zero “external” cost [impact on health, climate])
– would meet an urgent need

FUSION DISADVANTAGESFUSION DISADVANTAGES
Material categorisation after 100 years
10801
30417
7743
00
5000
10000
15000
20000
25000
30000
35000
Mas
s (to
nnes
)
Non-active materialSimple recycling materialComplex recycling materialPermanent disposal waste
More research and development needed
Residual radioactivity in the blanket:
No waste for permanent repository disposal: no long-term waste burden on future generations (right hand figure for Model B – others very similar)
1.0E-07
1.0E-06
1.0E-05
1.0E-04
1.0E-03
1.0E-02
1.0E-01
1.0E+00
1.0E+01
0 100 200 300 400 500 600 700 800 900 1000
Time after final shutdown (y)
Rad
ioto
xici
ty In
dex
(Inge
stio
n)
CoalPWREFR AEFR BModel AModel BModel CModel DModel AB
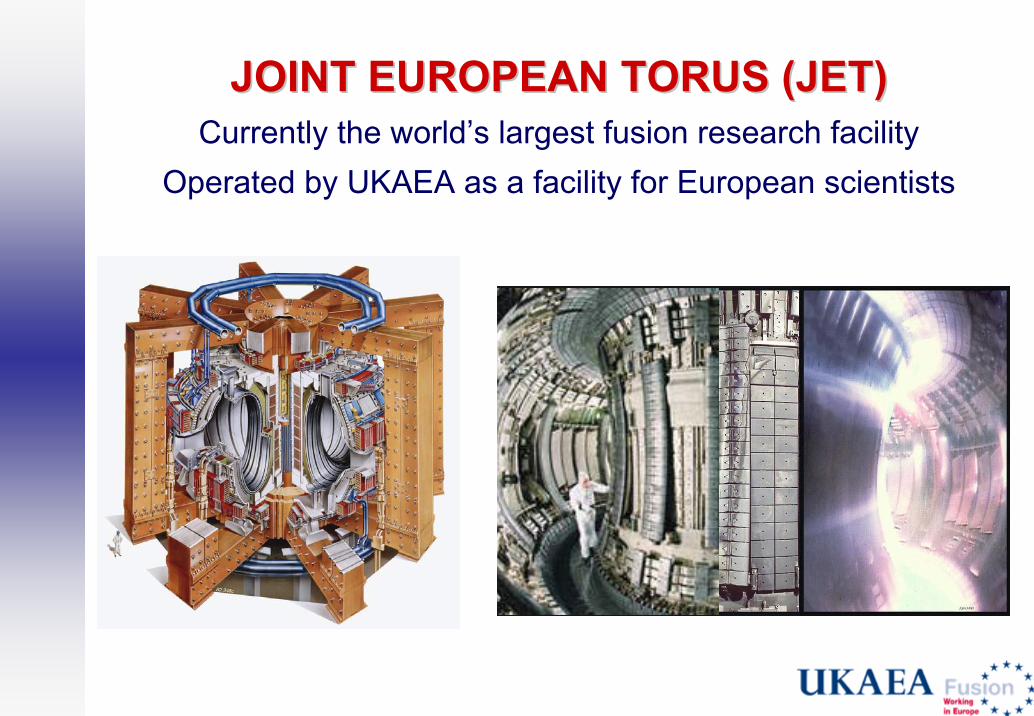
JOINT EUROPEAN TORUS (JET)JOINT EUROPEAN TORUS (JET)Currently the world’s largest fusion research facility
Operated by UKAEA as a facility for European scientists

MAST
Major progress in recent yearsMajor progress in recent years• Huge strides in physics, engineering, technology
• JET: 16 MW of fusion power ~ equal to heating power. 21 MJ of fusion energy in one pulse
• Ready to build a Giga Watt-scale tokamak: ITER– which (see next slide) is expected to achieve desired performance
[Pi =pressure in plasma;
τE = (energy in plasma)/(power supplied to keep it hot)]

Prediction of ITER (International Tokamak Experimental Reactor) performance
Cross sections of present EU D-shape tokamaks compared to the cross section of ITER
On basis of scaling up results from existing tokamaks(e.g. Compass →ASDEX-U → JET →ITER):ITER is expected to produce 500 MW of fusion power (10xpower input)
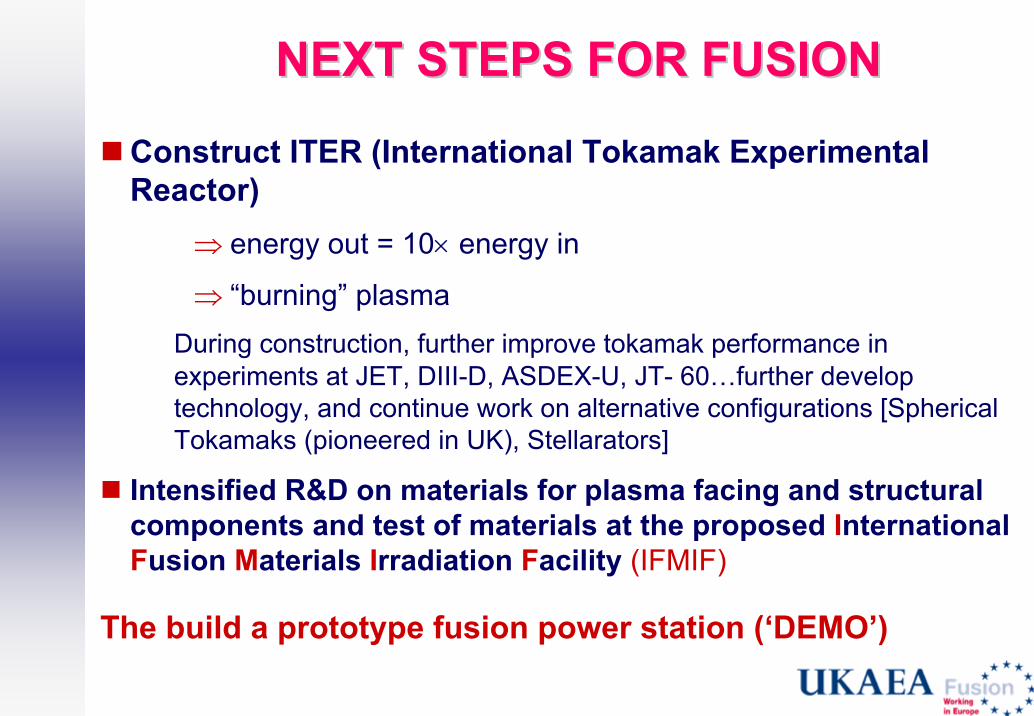
NEXT STEPS FOR FUSIONNEXT STEPS FOR FUSION
Construct ITER (International Tokamak Experimental Reactor)
⇒ energy out = 10× energy in
⇒ “burning” plasmaDuring construction, further improve tokamak performance in experiments at JET, DIII-D, ASDEX-U, JT- 60…further develop technology, and continue work on alternative configurations [Spherical Tokamaks (pioneered in UK), Stellarators]
Intensified R&D on materials for plasma facing and structural components and test of materials at the proposed International Fusion Materials Irradiation Facility (IFMIF)
The build a prototype fusion power station (‘DEMO’)

T3: Vol ~1 m3
established tokamak as best configuration (1969): temperature ~ 3 M 0C
Progress in FusionProgress in Fusion
JET: Vol ~100 m3: temperature ~ 150 M 0C; world record (16 MW) for fusion power (1997)

Next steps for FusionNext steps for Fusion
JET (now)~ 100 m3
16 MW
ITER ~ 800 m3
(2016) Should produce at
least 500 MW
Proto-type Power Plant (‘DEMO’)3,000 MW before 2035?
This model assumes big advances: first models could be somewhat
bigger)

• Aim is to demonstrate integrated physics and engineering on the scale of a power station• Key ITER technologies fabricated and tested by industry• 4.5 Billion Euro construction cost• Partnership between Europe, Japan, Russia, US, China, South Korea, India • Will be built at Cadarache in France
ITERITER

Plasma Physics IssuesPlasma Physics IssuesMajor positive developments (1980s and 90s)
‘Bootstrap’ plasma current (predicted at Culham) → much less external power needed than previously thought
High confinement mode (serendipitous discovery at Garching) →higher pressure + more fusion power with given magnetic field
Potential ProblemsNew instabilities in burning plasmas?
Steady state operation in power station conditions (looks possible with help of bootstrap current: if not, could → pulsed machine, or stellarator)
Potential improvementBetter control of potential instabilites to allow higher pressure

Structural materials – subjected to bombardment of 2 MW/m2 from 14 MeV neutrons
Plasma facing materials subjected to an additional 500 kW/m2 from hot particles and electromagnetic radiation (much more on ‘divertor’)
Various materials have been considered, and there are good candidates, BUT:
Further modelling + experiments essential:
Only a dedicated (€800M) accelerator-based test facility - the International Fusion Materials Irradiation Facility (IFMIF) - can reproduce reactor conditions: results from IFMIF will be needed before a prototype commercial reactor can be licensed and built
MATERIALSMATERIALS

Materials IssuesMaterials IssuesMajor positive development (1990s)
Body-centred cubic low activation steels seem able to withstand neutron damage
Potential problemsEffect of helium generation in the materials
Heat on ‘divertor’ (can be reduced by compromising design)
Potential improvementDevelopment of advanced materials (SiC ceramics,…)
for much higher temperature operation

Swelling resistant alloys have been developed via Swelling resistant alloys have been developed via international collaborationsinternational collaborations
Lowest swelling is observed in body-centered cubic alloys (V alloys, ferritic steel)
0
2
4
6
8
10
12
14
0 50 100 150 200
Volu
met
ric S
wel
ling
(%)
Damage Level (dpa)
Ferritic steel
Ti-modified 316 stainless steel
316 stainless steel
T irr =400-500ÞC0

European Power Plant Conceptual Study European Power Plant Conceptual Study (input to (input to CulhamCulham ‘‘Fast TrackFast Track’’ study)study)
Results (used as input to timetable study reported above)Confirm good safety and environmental features of fusionGive encouraging range for the expected cost of fusion
generated electricity9 €-cents/kW-hour for early near-term (water cooled steel) model 5 €-cents/kW-hour for early advanced (Li-Pb cooled SiC composite) model – costs will fall with maturity
Note Economics favours large fusion power plants → major centres of
population (complementary to renewables)Capital intensive; very low operating cost – lots of cheap off
peak power → hydrogen?

ONE BLANKET DESIGNONE BLANKET DESIGN

HeliumHelium--cooledcooled pebblepebble bedbed blanketblanket
Beryllium pebbles
Lithium silicate pebbles
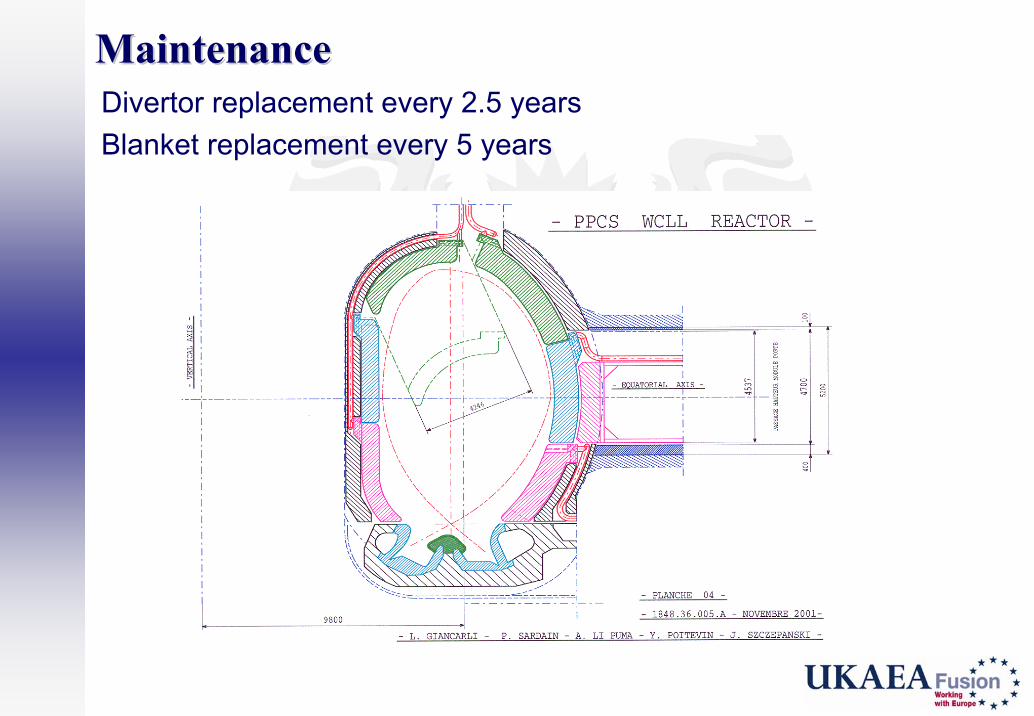
MaintenanceMaintenanceDivertor replacement every 2.5 yearsBlanket replacement every 5 years

FUSION FUSION ‘‘FAST TRACKFAST TRACK’’• During ITER construction
– operate JET, DIII-D, JT60… → speed up/improve ITER operation
• In parallel intensify materials work, approve and build IFMIF
•Then, having assimilated results from ITER and IFMIF,
build a Prototype Power Plant (‘DEMO’)
⇒ Fusion a reality in our lifetimes

Fast Track Fast Track -- Pillars OnlyPillars Onlyyear 0
2005 2010 2015 2020 2025 2030 2035 2040 2045 2050
4525 30 35 405 10 15 20
conceptual design
operation: priority materials
conceptual design
construction
construction
upgrade,construct operateTodays
expts.
licensing
H & D operation
low-duty D-T operation high-duty D-T operation
TBM: checkout and characterisation
TBM performance tests & post-exposure tests
second D-T operation phaseITER
EVEDA (design) other materials testingIFMIF
engineering designconstruction phase 1
blanket construction
phase 2blanket
construction &installation
operation phase 1operation phase 2
blanket design
phase 2 blanket design
licensing
DEMO(s)
engineering designconstruction operate
licensing
Commercial Power plants
blanket optimisation
plasma performance confirmation
design confirmation
technology issues (e.g. plasma-surface interactions)
plasma issues
single beam
licensing licensingplasma confirmation
materials optimisation
plasma optimisation
mobilis-ation
materials characterisation
R & D on alternative concepts and advanced materials
impacts of advances impacts of advances impacts of advances impacts of advances impacts of advances

From ITER and IFMIF to DEMO to From ITER and IFMIF to DEMO to Commercial Fusion PowerCommercial Fusion Power
DEMO could be putting power into the grid within 30 years, given• Funding* to begin IFMIF in parallel with ITER, and to maintain a strong
on-going programme, including technology development, and start on design of DEMO
• No major adverse surprises
* minute on scale of world energy [electricity] market ~ $4.5 [1.5] trillion p.a.
Commercial fusion power on a significant scale could follow (say) 15 years later
Henceforth assume commercial fusion power really takes off in 2050
There seem to be no resource limitations on the speed with which fusion power could be rolled out – the question is: will it be economically viable?

Role of Fusion in 2100?Role of Fusion in 2100?A 1998 study (using MARKAL) by the Netherlands Energy
Research Foundation (ECN) looked at potential role of fusion in the European Energy market** a ‘world study’ is currently being made in the framework of the European Fusion Development Agreement
Some of the assumptions (e.g. on 2100 cost of oil) no longer look reasonable, others still valid (e.g. expected cost of fusion energy) – all such modelling is of course subject to enormous uncertainties (especially on discount rate and environmental targets)modelling = exploration of what might happen, not prediction of what will happen

Outcome of ECN modellingOutcome of ECN modellingWith no constraint on carbon, coal is dominant
Fusion plays an important role with atmospheric CO2 limited to ~ 600 ppm or less, or a carbon tax of €30/tonne or more
This conclusion is relatively insensitive to other assumptions – it is very hard to meet expected demand with carbon constrainede.g. changing assumptions to allow more fission reduces gas, not
fusion*
* unless unlimited fission allowed at ~ current uranium price/without fast breeders – which seems unlikely

CONCLUSIONSCONCLUSIONSMeeting growing energy demand (= need in developing countries)
while reducing carbon emissions is a huge challenge – need portfolio approach (no magic bullet)→ urgent need for new and improved technologies (production, distribution, consumption)
Fusion now progressing to power station scale– has potential to improve security of supply and meet environmental constraints– should (?) be available on a commercial scale by 2050– models suggest major role in 2100
Energy challenge + potential of fusion argue for developing fusion as rapidly as reasonably possible (even if success is not 100% certain)