enhanced field surveillance through real-time … field surveillance through real-time visualization...
TRANSCRIPT
Enhanced Field Surveillance through Real-Time Visualization
Abstract
With a renewed mandate to optimize the production from
offshore assets, an oil and gas company is in the process of
deploying a field-wide well performance monitoring system based
on Well Performance Monitor. The pilot project implemented in
one of the field’s facilities validated the fact that Well
Performance Monitor will assist engineers in their well
surveillance tasks. Well Performance Monitor is Powered by
Matrikon, which represents vendor neutrality. This product works
with third-party control systems and applications.
Well performance monitoring enabled production engineers to
optimize the use of their time by being able to quickly pin-point
issues and initiative corresponding actions in less time than
previously required.
Based on cleansed real-time measurements and updated well
performance curves obtained from well models, Well
Performance Monitor gathers the real-time and production data
and determines a wells operational mode and estimated real-time
well flow rates.
All results are presented in a colour-coded two dimensional map
of the entire field that allows the quick identification of production
losses or well instability. Users intuitively drill down
to access process variable trends and schematic displays
that are presented in the context of the well as part of a field-wide
hierarchy.
Process signal cleansing and filtering is also an important
component of well performance monitoring and its influence on
the outcome of the real-time rate calculations can be illustrated.
Maintaining production levels in large and mature gas-lifted fields
is challenging in the face of typical problems such as artificial lift
equipment faults, sub-optimal water injection rates, scale
build-up and high water-cut producers. In these circumstances,
the real-time visualization capabilities of Well Performance
Monitor play a key role in reducing the amount of time that
engineers use for data gathering and issue identification.
As a result of the initial successes, Well Performance Monitor
implementation is in the process of being expanded to the entire
field of over 300 wells.
Introduction
Large and mature onshore and even offshore fields are
becoming more and more prevalent. A frequent solution to
maintaining production from wells with declining reservoir
pressure or increased water-cut, is the deployment of gas lift as a
method for artificial lift. However, gas lift is not without issues of
its own.
Compression plant constraints and unplanned shutdowns,
hydrate formation and gas lift equipment faults all contribute to
unexpected production losses that require constant surveillance
from field production engineers. In addition, typical field problems
such as scaling and water breakthrough can also have a long
term impact on well production.
In the face of these problems, production engineers are often
challenged to identify, analyze and solve problems at well and
field levels in the most efficient manner and in the least amount
of time. The oil and gas company identified the need to provide
their engineers with the tools necessary to gain visibility into their
operational status and as a result, well performance monitoring
technology was deployed at one of their offshore facilities.
Well performance monitoring allows engineers and production
managers to focus on the problem wells that may be showing
signs of performance problems. The technology also provides
users with real-time trends and displays required to analyze and
diagnose problems in a prioritized and time efficient manner. The
hope was that engineers and managers’ valuable time would be
optimized in problem solving rather than spending it manually
gathering information for the necessary analysis.
It should also be noted that the SCADA system console that was
available onshore at the time of the pilot project was neither user-
friendly nor re-configurable and therefore a more robust, realtime
data monitoring and visualization system was deemed
necessary.

Enhanced Field Surveillance through Real-Time Visualization 2
Well Performance Monitoring
The pilot system was deployed for all 42 wells of one of the field’s
oil gathering facilities. Real-time data was gathered through an
interface with the automation system and stored in a
commercially available process data historian. The system was
connected to the historian and relevant production databases to
gather all the information in the context of pre-configured
“well objects”.
Process Data Cleansing
Real-time data is pre-processed with a proprietary algorithm
simply known as “data cleansing” in which all non-natural real
time signal values are removed. By using data cleansing as
opposed to traditional filtering techniques is important in order to
preserve the real-time pattern of behavior of the process signals.
The process signals reveal the true nature of the underlying
process dynamics of the operational asset, in this case the real
time behaviour of the producer and injector wells. The
importance of these non-traditional data cleansing techniques is
illustrated in the sections below.
Real-time cleansed data is written back to the process historian
so it can be accessed by all realtime data consumers and data
visualization users. Using the cleansed data, certain calculations
and behaviour estimations are performed by the system to aid in
the detection of changes that could be considered as potential
production losses or well problems.
Well Mode Calculation
Using a cleansed pressure signal, the wells “Mode” is calculated
based on the amount of variation of the pressure during a defined
time period. If the production wing valve is open, the well can be
considered to be in “Stable” or “Unstable” well production mode.
“Stable” if a certain variability threshold based on the same well’s
typical behaviour is not exceeded and alternatively “Unstable” if
it is exceeded. If the well choke is closed, the well is marked as
“Shut-In”. This basic configuration can be enhanced based on
particular field’s behaviour and real time signal availability.
Real-Time Well-Rate Estimation
Using the cleansed data, the wells oil, gas and water rates are
estimated based on the wells performance curves. These
performance curves have been extracted using a third-party well
modeling (nodal analysis) application in the form of a flat text file,
known as well performance curves or sensitivity curves,
containing the performance of each well for each well head
pressure and gas lift rate setting. The well performance curves
are generated by the field’s optimization engineers using
calibrated well models.
Figure 1 illustrates a typical performance curve set with each
curve representing the production rate corresponding to one well
head pressure and the Xaxis
representing gas lift rate in MMscf/day.
Figure1-Real Time Well Rate Calculation
Well Performance Monitor performs a bi-linear interpolation into
these curves with each pair of valid (cleansed) well head
pressure and gas lift rate point sampled from the field to produce
an oil, gas or water rate estimation.
A set of curves can be derived for oil, gas and water rates. The
end result is a trend of the real time calculated rates according to
the real time signals and the well’s performance curves.
Examples from two wells are shown in Figure 2 with the oil, gas
and water rates represented in red, black and blue respectively.
Note the discontinuity in the rate estimations in the middle of the
trend corresponding to the point in time where the well model
performance curves were updated by the field engineer. The
system continued calculating the rates in real-time using the new
performance curve files.
Figure 2-Calculated Well Rate Trends
Enhanced Field Surveillance through Real-Time Visualization 3
This calculation method is not complex, performance curves and
interpolation techniques are common concepts in engineering
calculations. This is important because the calculations
performed by the system can be easily understood and
interpreted by production engineers who do not need to regard
the system as a “black box” type device, which makes
implementation and deployment of these types of technologies
more difficult to adopt.
This rate calculation technique is also computationally efficient ,
several times faster than the simulation tools used to generate
sensitivity files, making the scale-up of the system to a large
number of wells feasible without compromising the frequency of
execution of the calculations.
Well models are validated and if necessary calibrated at regular
frequencies using latest production well tests. The output from a
well model is the set of well performance curves and from this,
textbased performance curves can be extracted. The rate
calculations will be accurate so long as the well model remains
valid and the real-time signals are accurate.
Of course, a sudden change in water cut or GOR will completely
invalidate the well model assumptions and the resulting rates;
however, changing conditions in the well behavior or composition
will definitively make the well’s process variables and the well
rate calculation trend change with a specific pattern that can be
recognized by engineers. These patterns are also subject to
characterization and Well Performance Monitor’s rule-based
engine could be configured to alert in such cases. An example of
this is the signal characterization in wells “watering out”,
presented as a case for the use of intelligent agents by Randi-
Helene Halmøy et al in the 2008 SPE Intelligent Energy
Conference.
Well Capacity and Well KPIs
Well Performance Monitor also has the capability to connect to
relational databases in order to map time-indexed relational
database data as process data tags. This feature was used to tap
into the production database and obtain the well capacity (or
potential) and the trend of well test results for every well. This
data can now be displayed and trended within the system as any
other real-time process variable.
Well capacities are revised for each well on a weekly basis and
any changes made to the database are automatically captured by
the system for the purposes of well surveillance. Capacities
represent an average production rate for the well and are
adjusted based on performance changes observed from
production well tests.
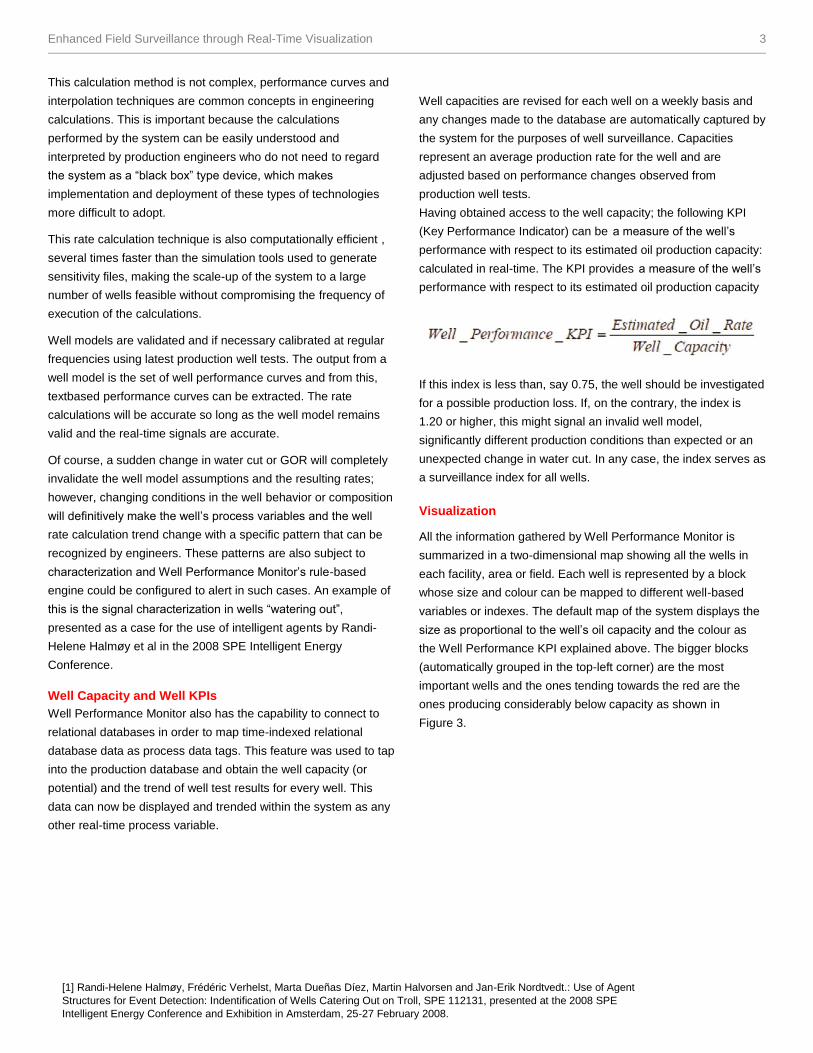
Having obtained access to the well capacity; the following KPI
(Key Performance Indicator) can be a measure of the well’s
performance with respect to its estimated oil production capacity:
calculated in real-time. The KPI provides a measure of the well’s
performance with respect to its estimated oil production capacity
If this index is less than, say 0.75, the well should be investigated
for a possible production loss. If, on the contrary, the index is
1.20 or higher, this might signal an invalid well model,
significantly different production conditions than expected or an
unexpected change in water cut. In any case, the index serves as
a surveillance index for all wells.
Visualization
All the information gathered by Well Performance Monitor is
summarized in a two-dimensional map showing all the wells in
each facility, area or field. Each well is represented by a block
whose size and colour can be mapped to different well-based
variables or indexes. The default map of the system displays the
size as proportional to the well’s oil capacity and the colour as
the Well Performance KPI explained above. The bigger blocks
(automatically grouped in the top-left corner) are the most
important wells and the ones tending towards the red are the
ones producing considerably below capacity as shown in
Figure 3.
[1] Randi-Helene Halmøy, Frédéric Verhelst, Marta Dueñas Díez, Martin Halvorsen and Jan-Erik Nordtvedt.: Use of Agent
Structures for Event Detection: Indentification of Wells Catering Out on Troll, SPE 112131, presented at the 2008 SPE
Intelligent Energy Conference and Exhibition in Amsterdam, 25-27 February 2008.

Enhanced Field Surveillance through Real-Time Visualization 4
Figure 3 - Overview Display Map Example
Figure 4 – Well Schematic Display
Clicking on each well block allows the user to drill down to well-specific schematics displays and trends that can be used to
perform more in-depths analyses on the behaviour of each well, as illustrated in Figures 4 and 5.
Enhanced Field Surveillance through Real-Time Visualization 5
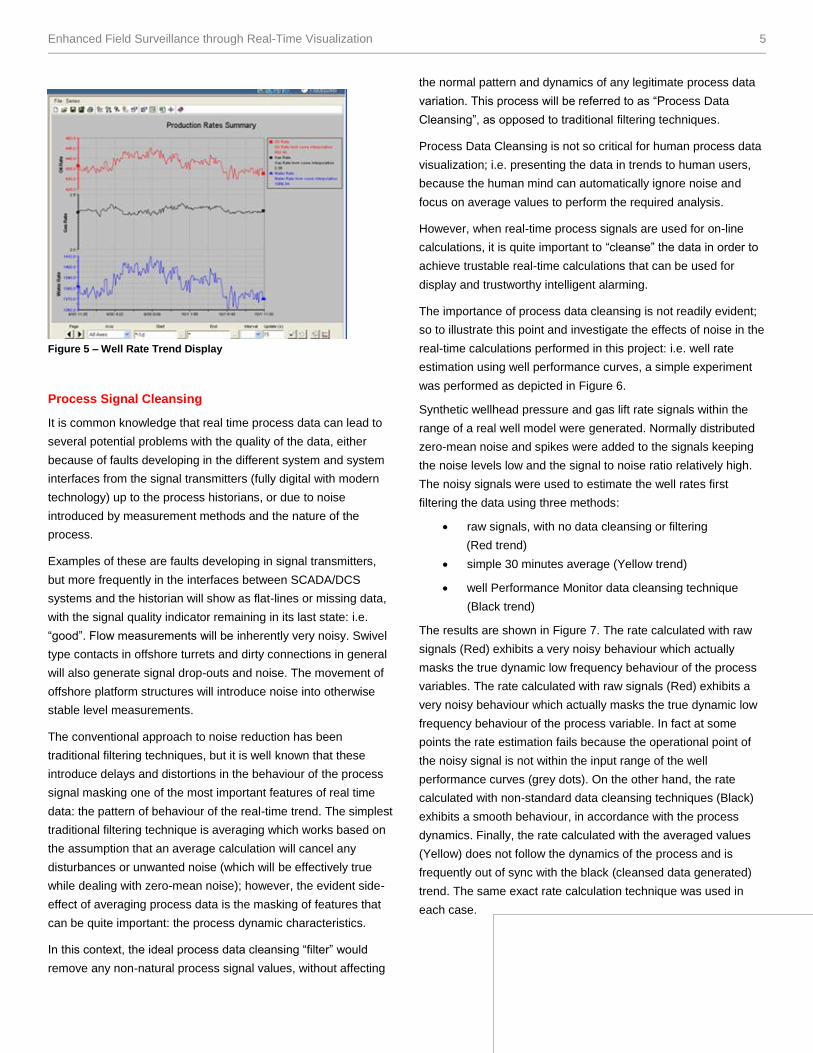
Figure 5 – Well Rate Trend Display
Process Signal Cleansing
It is common knowledge that real time process data can lead to
several potential problems with the quality of the data, either
because of faults developing in the different system and system
interfaces from the signal transmitters (fully digital with modern
technology) up to the process historians, or due to noise
introduced by measurement methods and the nature of the
process.
Examples of these are faults developing in signal transmitters,
but more frequently in the interfaces between SCADA/DCS
systems and the historian will show as flat-lines or missing data,
with the signal quality indicator remaining in its last state: i.e.
“good”. Flow measurements will be inherently very noisy. Swivel
type contacts in offshore turrets and dirty connections in general
will also generate signal drop-outs and noise. The movement of
offshore platform structures will introduce noise into otherwise
stable level measurements.
The conventional approach to noise reduction has been
traditional filtering techniques, but it is well known that these
introduce delays and distortions in the behaviour of the process
signal masking one of the most important features of real time
data: the pattern of behaviour of the real-time trend. The simplest
traditional filtering technique is averaging which works based on
the assumption that an average calculation will cancel any
disturbances or unwanted noise (which will be effectively true
while dealing with zero-mean noise); however, the evident side-
effect of averaging process data is the masking of features that
can be quite important: the process dynamic characteristics.
In this context, the ideal process data cleansing “filter” would
remove any non-natural process signal values, without affecting
the normal pattern and dynamics of any legitimate process data
variation. This process will be referred to as “Process Data
Cleansing”, as opposed to traditional filtering techniques.
Process Data Cleansing is not so critical for human process data
visualization; i.e. presenting the data in trends to human users,
because the human mind can automatically ignore noise and
focus on average values to perform the required analysis.
However, when real-time process signals are used for on-line
calculations, it is quite important to “cleanse” the data in order to
achieve trustable real-time calculations that can be used for
display and trustworthy intelligent alarming.
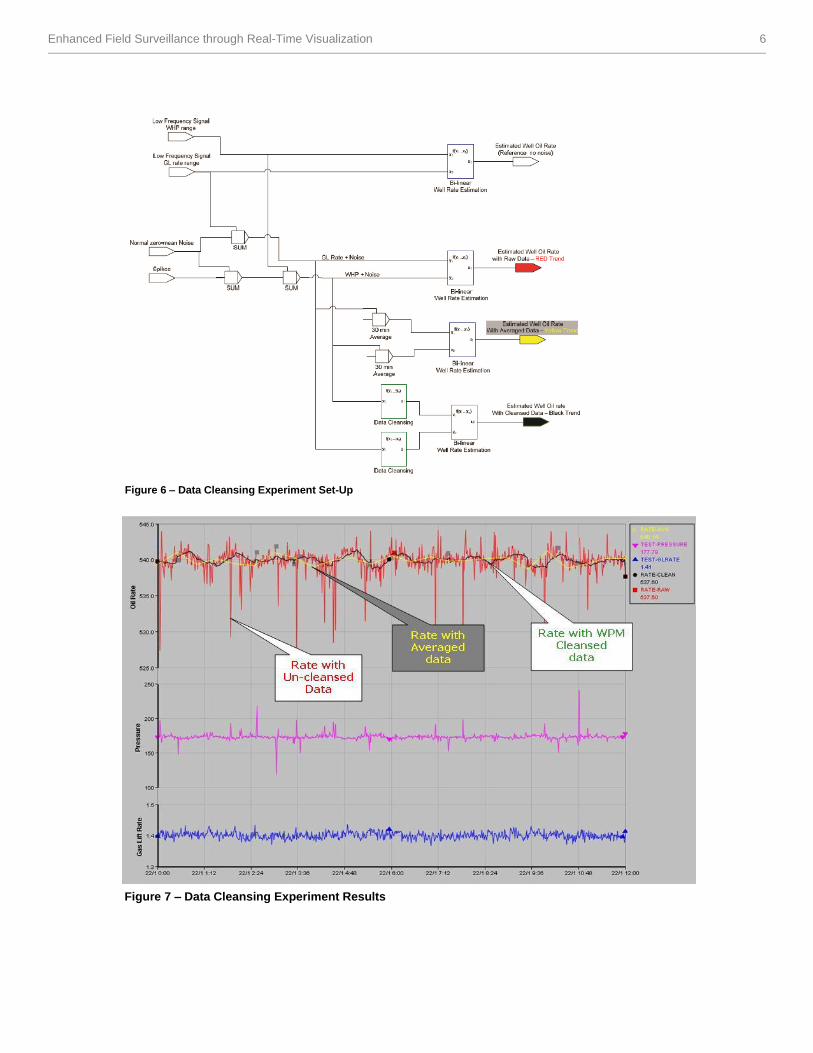
The importance of process data cleansing is not readily evident;
so to illustrate this point and investigate the effects of noise in the
real-time calculations performed in this project: i.e. well rate
estimation using well performance curves, a simple experiment
was performed as depicted in Figure 6.
Synthetic wellhead pressure and gas lift rate signals within the
range of a real well model were generated. Normally distributed
zero-mean noise and spikes were added to the signals keeping
the noise levels low and the signal to noise ratio relatively high.
The noisy signals were used to estimate the well rates first
filtering the data using three methods:
raw signals, with no data cleansing or filtering
(Red trend)
simple 30 minutes average (Yellow trend)
well Performance Monitor data cleansing technique
(Black trend)
The results are shown in Figure 7. The rate calculated with raw
signals (Red) exhibits a very noisy behaviour which actually
masks the true dynamic low frequency behaviour of the process
variables. The rate calculated with raw signals (Red) exhibits a
very noisy behaviour which actually masks the true dynamic low
frequency behaviour of the process variable. In fact at some
points the rate estimation fails because the operational point of
the noisy signal is not within the input range of the well
performance curves (grey dots). On the other hand, the rate
calculated with non-standard data cleansing techniques (Black)
exhibits a smooth behaviour, in accordance with the process
dynamics. Finally, the rate calculated with the averaged values
(Yellow) does not follow the dynamics of the process and is
frequently out of sync with the black (cleansed data generated)
trend. The same exact rate calculation technique was used in
each case.
Enhanced Field Surveillance through Real-Time Visualization 6
Figure 6 – Data Cleansing Experiment Set-Up
Figure 7 – Data Cleansing Experiment Results
Enhanced Field Surveillance through Real-Time Visualization 7
Comparing the results of the totalized volume in 12 hours with
the total volume of the rate calculated with the signals before the
noise was added (reference rate) results in the following errors:
rate from raw signals: 15%
rate from averaged signals: 0.3%
rate from Cleansed signals: 0.03%
Although the use of average signals does significantly reduce the
error due to noise in the presence of the zero-mean noise
introduced, it fails to represent the true well process dynamics.
Initial Results
The field operator engineers were thrilled to have the real-time
data of process measurements for each well available at their
desk in a web-enabled tool. Previous initiatives to make this data
available consisted of a control system console in one of the
offices. The console, being for the purpose of process monitoring
and control and being in a remote location from the operations
had a slow response time and did not have displays suitable to
the needs of the engineers.
Access to the data on the new system on a well by well basis
was easy and intuitive and the surveillance of field well conditions
was performed in a fraction of the time.
The well rate calculation for a good number of wells was
intermittently failing because the well’s operational point was not
lying within the input domain of the well performance curves. This
can be for one of two reasons: the well performance curves were
generated with a too narrow operational range or the well models
are altogether outdated and need to be updated with the current
well operational state and conditions. This unexpected result
provided focus to those engineers charged with validating and
calibrating the well models.
Another important group of wells was seen performing according
to capacity and as such appeared as “green” blocks in the well
performance visualization map. It was observed by one of the
users that the system effectively combined information from three
systems: the real-time database, the relational databases and the
well model files, to produce a single vision of the field where
discrepancies can be analyzed. In the case of the “green” wells,
no major discrepancies were found: effectively the real-time
estimated oil rate using the well models and the real-time
measurements were in agreement with the wells officially
estimated capacity stored in the production database.
The engineering team is only starting to realize the full potential
of the system and have mainly focused on the use and trending
of real-time measured variables. But the use of higher degree
calculations for the well rates and mode and the automatically
calculated well performance KPI will come with time, as they
seek new ways of interacting with the system to characterize
changes in well behaviour that represent typical failure modes.
The fact that these calculations are easily understood will help in
the process of adopting their use.
In spite of the short time using the new system, the field
operator’s management team is convinced of the key advantages
of the new system and has already commissioned the extension
of the system to all the field wells.
Key System Advantages: Simplicity and Configurability
For successful use of optimization tools for the upstream oil and
gas industry, it has been observed that upstream asset
optimization tools need to be as simple as possible, robust and
easy to learn and use.2 This is true for the implementation of any
upstream real-time information system. The use of technology in
upstream operations has been challenging if compared with the
extensive deployment of higher-level control and optimization
techniques used in downstream process operations. Based on
field experience, black-box type approaches are being
discontinued because the users will not understand how
calculations and results are being achieved and they will tend to
distrust such results.
The system deployed in this field is simple and easy to use
based on the fact that:
it can be accessed from a common web-browser
it is intuitive to use and places all related information in
the context of the production asset being analyzed; in
this case, the well
performs simple, easy to understand calculations such
as the Mode, Real-Time Rates and the Well
Performance KPI
[2] B. Stenhouse.: Modelling and Optimisation in BP Exploration and Production; Case Studies and Learnings, SPE 112148, presented at the 2008 SPE Intelligent Energy Conference and Exhibition in Amsterdam, 25-27 February 2008.
Enhanced Field Surveillance through Real-Time Visualization 8
For more information:
For more information about Well
Performance Monitor, visit our website
www.honeywellprocess.com or contact
your Honeywell account manager.
www.matrikon.com
Honeywell Process Solutions
2500 W. Union Hills Dr.
Phoenix, AZ 85027
Tel: 877.466.3993 or 602.313.6665
www.honeywellprocess.com
At the same time, the system is also highly configurable, and can
grow with the growing demands for higher level analyses and
calculations expected from the more mature and demanding
users. When users have been accustomed to using the basic
features, the system could be developed further to include
for example:
intelligent alarms to warn of failure modes characterized
as changes in the real-time operational conditions.
real-time performance maps; where the operational
point is seen moving in historically and in real-time in
the well performance curve plane
extensions into Production Operations workflows such
as executing and analyzing well tests and requesting
well work-overs.
Recommendations
Based on this experience and similar projects, the recommended
roadmap for new technology deployment projects as applied to
upstream operations is as follows:
Stage 1: Deploy a productized solution in a limited, but
representative area of the field. The solution must contain all
standard features applicable to the field with little or no
requirements gathering from field personnel. This stage will also
highlight data communication infrastructure issues or other
technical constraints that may exist in the current systems.
Stage 2: Allow users to experience and use the new technology
and propose enhancements and features that will increase the
benefits of the new technology in their daily operations. Users will
acquire hands-on knowledge of the possibilities of the new
technology. The data cleansing algorithms can also be validated
and fine-tuned at this stage using dynamic modeling if necessary.
Stage 3: Incorporate a rationalized new set of features into the
solution before extending its use in the rest of the field.
Stage 4: Continue to incorporate more elaborate features and
workflows in parallel with the growth in the use of the solution.
Complex solution features are not deemed feasible if users are
not prepared to take advantage of them or will actually deter new
users from adopting the use of the new technology.
TIN 742
Mar 2012
© 2012 Honeywell International Inc.