enhancing the thermal conductivity of ethylene-vinyl
TRANSCRIPT
Enhancing the thermal conductivity of ethylene-vinyl acetate (EVA) in a photovoltaicthermal collectorJ. Allan, H. Pinder, and Z. Dehouche Citation: AIP Advances 6, 035011 (2016); doi: 10.1063/1.4944557 View online: http://dx.doi.org/10.1063/1.4944557 View Table of Contents: http://scitation.aip.org/content/aip/journal/adva/6/3?ver=pdfcov Published by the AIP Publishing Articles you may be interested in Prestrain relaxation in non-covalently modified ethylene-vinyl acetate | PyChol | multiwall carbon nanotubenanocomposites APL Mater. 2, 066105 (2014); 10.1063/1.4884216 Study on thermal properties and crystallization behavior of electron beam irradiated ethylene vinyl acetate(EVA)/waste tyre dust (WTD) blends in the presence of polyethylene graft maleic anhydride (PEgMAH) AIP Conf. Proc. 1571, 146 (2013); 10.1063/1.4858645 Diffusion of mineral oils in ethylene-vinyl acetate copolymer AIP Conf. Proc. 1459, 42 (2012); 10.1063/1.4738392 Ethylene-vinyl Alcohol Copolymer (EvOH) by XPS Surf. Sci. Spectra 6, 137 (1999); 10.1116/1.1247918 Thermally stimulated currents in polyethylene and ethylene–vinyl‐acetate copolymers J. Appl. Phys. 48, 2408 (1977); 10.1063/1.324003
Reuse of AIP Publishing content is subject to the terms at: https://publishing.aip.org/authors/rights-and-permissions. Download to IP: 134.83.1.242 On: Fri, 22 Apr
2016 09:38:28
AIP ADVANCES 6, 035011 (2016)
Enhancing the thermal conductivity of ethylene-vinylacetate (EVA) in a photovoltaic thermal collector
J. Allan,1,2,a H. Pinder,1 and Z. Dehouche11School of Engineering and Design, Brunel University, London, UB8 3PH, United Kingdom2ChapmanBDSP, Saffron House, 6-10 Kirby Street, London, EC1N 8EQ, United Kingdom
(Received 7 November 2015; accepted 1 March 2016; published online 15 March 2016)
Samples of Ethylene-Vinyl Acetate (EVA) were doped with particles of BoronNitride (BN) in concentrations ranging from 0-60% w/w. Thermal conductivity wasmeasured using a Differential Scanning Calorimetery (DSC) technique. The thermalconductivity of parent EVA was increased from 0.24W/m·K to 0.80W/m·K for the60% w/w sample. Two PV laminates were made; one using the parent EVA theother using EVA doped with 50% BN. When exposed to a one directional heat fluxthe doped laminate was, on average, 6% cooler than the standard laminate. A finitedifference model had good agreement with experimental results and showed that theuse of 60% BN composite achieved a PV performance increase of 0.3% compared tothe standard laminate. C 2016 Author(s). All article content, except where otherwisenoted, is licensed under a Creative Commons Attribution 3.0 Unported License.[http://dx.doi.org/10.1063/1.4944557]
NOMENCLATURE
A Area [m2]D Disc Thickness [m]g Volumetric heat generation [W/m3]h Convective heat transfer coefficient W/m2·Kk Thermal conductivity [W/m·K]Keb Thermal conductivity of back EVA layer [W/m·K]Ke f Thermal conductivity of front EVA layer [W/m·K]Kg Thermal conductivity of glass [W/m·K]Kpv Thermal conductivity of PV cell [W/m·K]Kt Thermal conductivity of tedlar [W/m·K]M Gradient of slopeT Temperature [K]V Volume [m3]W Weight [kg]xeb Thickness of back EVA layer [m]xe f Thickness of front EVA layer [m]xg Thickness of glass layer [m]xpv Thickness of PV layer [m]xt Thickness of tedlar layer [m]δ Thickness [m]αg Thermal diffusivity of PV layer [m2/s]αpv Thermal diffusivity of glass layer [m2/s]λ Thermal Conductivity [W/m·K]φ Volume fraction
aCorresponding author [email protected]
2158-3226/2016/6(3)/035011/9 6, 035011-1 ©Author(s) 2016
Reuse of AIP Publishing content is subject to the terms at: https://publishing.aip.org/authors/rights-and-permissions. Download to IP: 134.83.1.242 On: Fri, 22 Apr
2016 09:38:28

035011-2 Allan, Pinder, and Dehouche AIP Advances 6, 035011 (2016)
FIG. 1. The layers of a PV laminate and their respective thicknesses and thermal conductivities. Thickness and thermalconductivity from Ref. 3.
BACKGROUND
As the temperature of a PV cell increases, its electrical efficiency decreases. Estimates of theannual losses in performance due to temperature vary from 2.2 to 17.5%.1 This loss is influenced byinstallation method; it has been shown that free-standing and ground mounted systems experienceless temperature losses than those that are building integrated.2
EVA is used to encapsulate PV cells and prevent environmental degradation; however thesematerials have low thermal conductivity. The multiple layers found in a typical PV laminate areshown in Figure 1.
The composite conductivity through the collector can be calculated using (1.1).
ktotal =δtotal
δevakeva+
δsiksi+
δtedkted+
δalukalu
(1.1)
Using the values in Figure 1, the calculated conductivity of the composite is 0.82W/(m·K). If theconductivity of the EVA layer on the backside of the PV cell is increased from 0.23W/(m·K) to2.85W/(m·K),3 the overall composite conductivity increases by nearly 25% to 1.02W/(m·K).
Enhancing the Thermal Conductivity of EVA
EVA can be mixed with other materials to form composites with intrinsically different prop-erties to the parent material. The mixing of ceramic powders and polymers, to increase thermalconductivity, is used in microelectronics, where heat needs to be efficiently dissipated away fromsensitive chips and processors.4
The same concept can be applied to photovoltaic cells. A previous study by Lee et al.3 revealedthat filler materials increase the thermal conductivity of EVA from 0.23 to 2.85W/(m·K) . For arange of different filler materials, a concentration of 20% v/v resulted in a -0.97% to +5.05% changein power output compared to the parent material.. Kemaloglu et al.5 used Boron Nitride filler witha particle size of approximately 10µm; the conclusion was that conductivity increases with reducedparticle size and that nano-sized particles hold promise for the future.
Measuring Thermal Conductivity
Thermal conductivity can be measured using the method outlined in ASTM E1952.6 Thismethod uses modulated differential scanning calorimetery (mDSC) to determine the specific heatcapacity, which is then used to calculate the thermal conductivity. Thermal conductivity can alsobe measured using DSC by placing a ‘melting standard’ on top of the specimen.7 When heat issupplied from the DSC furnace, the specimen’s conductivity is proportional to the melting rate ofthe standard and can be quantified through comparison with a reference material. The method wasdeveloped using metals such as gallium and indium as the melting reference material and has sincebeen applied to a number of other materials.8–11
Reuse of AIP Publishing content is subject to the terms at: https://publishing.aip.org/authors/rights-and-permissions. Download to IP: 134.83.1.242 On: Fri, 22 Apr
2016 09:38:28

035011-3 Allan, Pinder, and Dehouche AIP Advances 6, 035011 (2016)
FIG. 2. Twin screw extrusion of the composite material.
METHODOLOGY
Sample Preparation
BN powder (Carbotherm, Saint-Gobain, France) was mixed with EVA granules, in concen-trations ranging from 10-60% w/w, using twin screw extrusion (HAAKE MiniLab II, ThermoScientific, US) see Figure 2. The resulting extrusions were compression molded, to form sheets witha thickness of 1 mm.
Measuring Thermal Conductivity
6 mm discs were punched from the compressed sheets and placed into a DSC sample pan.The thermal interface resistance between the pan and the sample was reduced using a thin film ofsilicone oil, applied directly to the underside of the sample. Crodatherm-25 phase change material(PCM) (Croda, UK) was used as the melting standard because its melting point (25◦C) is well belowthat of EVA (89◦C). The thermophysical properties of Crodatherm are provided in Table III of theAppenidx. Approximately 2mg of the PCM melting standard was deposited on the surface of thesample disc. This was achieved by gently heating the PCM material above its melting point in aglass pipette, before releasing it and allowing it to recrystallise on the surface of the sample. Themethod assumes unidirectional heat flow from the DSC furnace, through the sample and into themelting standard. Care had to be taken to ensure that there was no contact between the aluminumpan and the melting standard. The sample pan was then placed, un-crimped, into the sample cham-ber of the DSC (Perkin Elmer, US), the DSC process is illustrated in Figure 3. The sample wascooled to -10◦C before being heated to 40◦C at 5◦C/min. The graph of heat flux vs. temperature, pro-duced by the DSC was analyzed to determine melting rate of the sample. Low Density Polyethylene
Reuse of AIP Publishing content is subject to the terms at: https://publishing.aip.org/authors/rights-and-permissions. Download to IP: 134.83.1.242 On: Fri, 22 Apr
2016 09:38:28
035011-4 Allan, Pinder, and Dehouche AIP Advances 6, 035011 (2016)
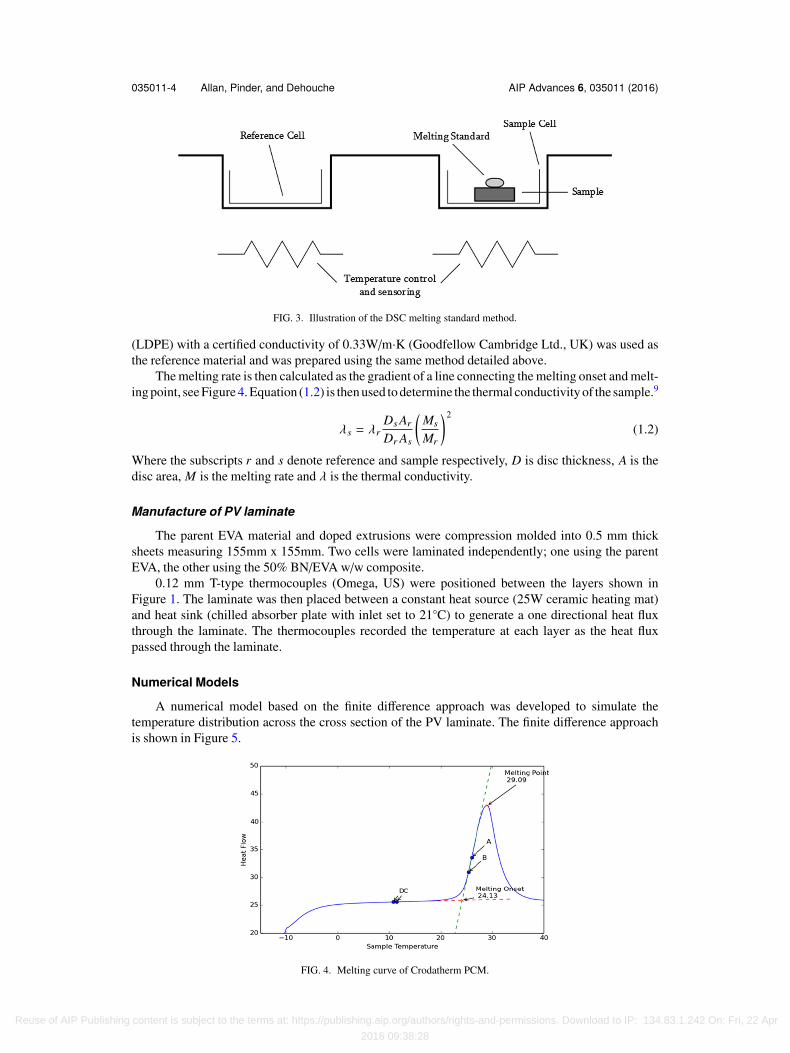
FIG. 3. Illustration of the DSC melting standard method.
(LDPE) with a certified conductivity of 0.33W/m·K (Goodfellow Cambridge Ltd., UK) was used asthe reference material and was prepared using the same method detailed above.
The melting rate is then calculated as the gradient of a line connecting the melting onset and melt-ing point, see Figure 4. Equation (1.2) is then used to determine the thermal conductivity of the sample.9
λs = λrDsAr
Dr As
(Ms
Mr
)2
(1.2)
Where the subscripts r and s denote reference and sample respectively, D is disc thickness, A is thedisc area, M is the melting rate and λ is the thermal conductivity.
Manufacture of PV laminate
The parent EVA material and doped extrusions were compression molded into 0.5 mm thicksheets measuring 155mm x 155mm. Two cells were laminated independently; one using the parentEVA, the other using the 50% BN/EVA w/w composite.
0.12 mm T-type thermocouples (Omega, US) were positioned between the layers shown inFigure 1. The laminate was then placed between a constant heat source (25W ceramic heating mat)and heat sink (chilled absorber plate with inlet set to 21◦C) to generate a one directional heat fluxthrough the laminate. The thermocouples recorded the temperature at each layer as the heat fluxpassed through the laminate.
Numerical Models
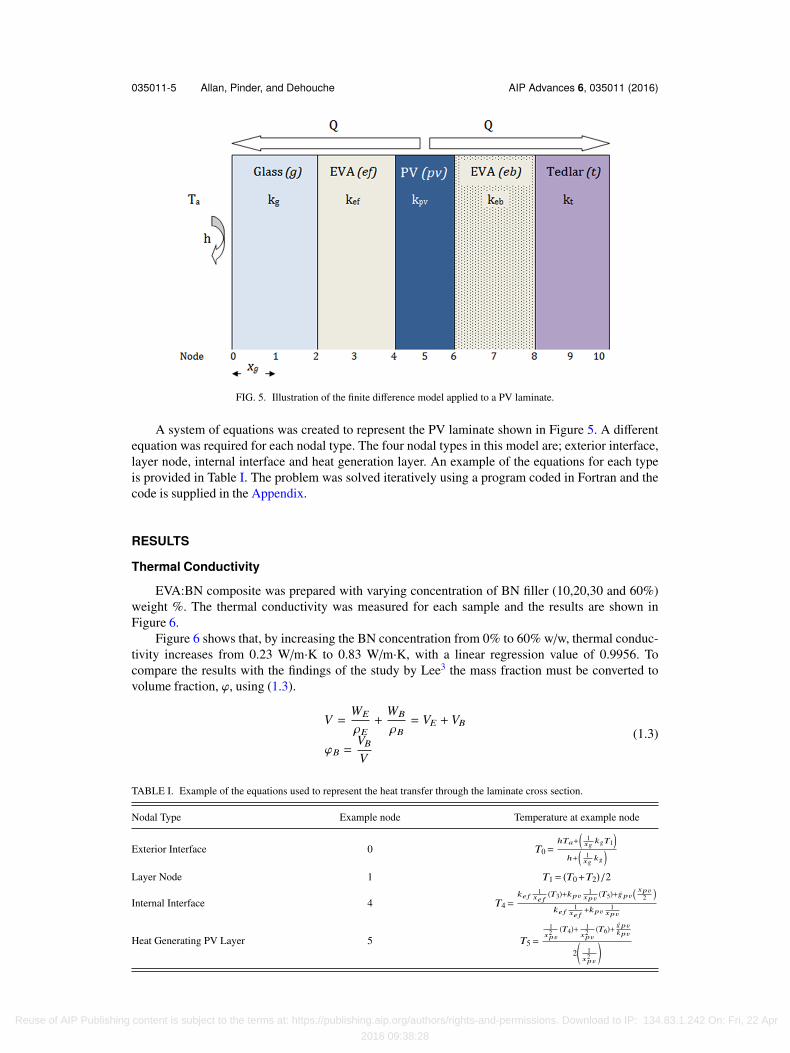
A numerical model based on the finite difference approach was developed to simulate thetemperature distribution across the cross section of the PV laminate. The finite difference approachis shown in Figure 5.
FIG. 4. Melting curve of Crodatherm PCM.
Reuse of AIP Publishing content is subject to the terms at: https://publishing.aip.org/authors/rights-and-permissions. Download to IP: 134.83.1.242 On: Fri, 22 Apr
2016 09:38:28
035011-5 Allan, Pinder, and Dehouche AIP Advances 6, 035011 (2016)
FIG. 5. Illustration of the finite difference model applied to a PV laminate.
A system of equations was created to represent the PV laminate shown in Figure 5. A differentequation was required for each nodal type. The four nodal types in this model are; exterior interface,layer node, internal interface and heat generation layer. An example of the equations for each typeis provided in Table I. The problem was solved iteratively using a program coded in Fortran and thecode is supplied in the Appendix.
RESULTS
Thermal Conductivity
EVA:BN composite was prepared with varying concentration of BN filler (10,20,30 and 60%)weight %. The thermal conductivity was measured for each sample and the results are shown inFigure 6.
Figure 6 shows that, by increasing the BN concentration from 0% to 60% w/w, thermal conduc-tivity increases from 0.23 W/m·K to 0.83 W/m·K, with a linear regression value of 0.9956. Tocompare the results with the findings of the study by Lee3 the mass fraction must be converted tovolume fraction, ϕ, using (1.3).
V =WE
ρE+
WB
ρB= VE + VB
ϕB =VB
V
(1.3)
TABLE I. Example of the equations used to represent the heat transfer through the laminate cross section.
Nodal Type Example node Temperature at example node
Exterior Interface 0 T0=hTa+
(1xg
kgT1
)h+
(1xg
kg
)Layer Node 1 T1= (T0+T2)/2
Internal Interface 4 T4=ke f
1xe f
(T3)+kpv1
xpv(T5)+g pv
( xpv2
)ke f
1xe f+kpv
1xpv
Heat Generating PV Layer 5 T5=
1x2pv
(T4)+ 1x2pv
(T6)+ g pvkpv
2*,
1x2pv
+-
Reuse of AIP Publishing content is subject to the terms at: https://publishing.aip.org/authors/rights-and-permissions. Download to IP: 134.83.1.242 On: Fri, 22 Apr
2016 09:38:28

035011-6 Allan, Pinder, and Dehouche AIP Advances 6, 035011 (2016)
FIG. 6. Thermal conductivity vs. boron nitride concentration.
Where W , V and ρ are the weight, volume and density respectively; and subscripts, E and B denoteEVA and BN respectively.
For 60% w/w Boron Nitride to EVA, the corresponding volume fraction is approximately 40%v/v as shown in Table II. For 40% v/v BN concentration Lee et al. reported a thermal conductivityof approximately 0.75 W/m·K3 which is agreement with the 0.83W/ m·K measured in this study.Lee et al. continued to increase the BN concentration up to 60% v/v; however it was found thatincreased filler increased the stiffness of the material, which could cause problems for manufactureand durability. The same issue was experienced in this study.
Interface Temperature
The thermocouples did not embed seamlessly between the layers; instead air bubbles formedaround each thermocouple. An attempt was made to reduce the thickness of the thermocouple wireto 0.12 mm; however air bubbles were still present. To compensate for this variation, an averagelaminate temperature was calculated. A comparison of the doped vs standard EVA case is shown inFigure 7. The doped laminate was consistently around 6% cooler than the standard laminate, underthe same conditions.
Numerical Models
The temperature profile across the external, interior and interface nodes were plotted for twocases and three conductivities of backing-EVA. In Case 1 the rear surface temperature of the lami-nate, T10, was fixed at a 25◦C. This case resembles the temperature controlled absorber plate of aPVT collector. The top surface was assigned an overall loss coefficient of 11W/m2·◦C
In Case 1, shown in Figure 8, the temperature of the PV cell, T5, is highest for the un-dopedEVA. As the thermal conductivity of the backing-EVA increases, the PV cell temperature reduces.A temperature reduction of 0.7◦C in PV cell temperature is seen when thermal conductivity of thebacking-EVA is increased from 0.23W/m·K to 0.83W/m·K. Using the power temperature coeffi-cient for a crystalline cell, as supplied by the manufacturer (-0.42%/K), this would enhance theperformance by 0.3%. Further increasing the thermal conductivity to 2.85 W/m·K, the PV celltemperature is reduced by an additional 0.2◦C indicating a non-linear relationship between the
TABLE II. Calculation of volume fraction.
Weight [%] Density (g/cm3) Volume [cm3] Volume Fraction
EVA 40 0.93512 42.78 62.1%Boron Nitride 60 2.313 26.09 37.9%
Reuse of AIP Publishing content is subject to the terms at: https://publishing.aip.org/authors/rights-and-permissions. Download to IP: 134.83.1.242 On: Fri, 22 Apr
2016 09:38:28

035011-7 Allan, Pinder, and Dehouche AIP Advances 6, 035011 (2016)
FIG. 7. A comparison of the average laminate temperature for the enhanced and standard material.
conductivity of the backing-EVA and PV cell temperature. The increased conductivity of the back-ing encapsulant also reduces the overall temperature of the laminate. The front surface of the panelis hottest for the 0.23W/m·K and coldest for the 2.85W/m·K backing-EVA.
In Case 2, a heat loss coefficient was applied to both the top surface and the rear surfaceof the laminate; resembling a PV module that is evenly ventilated on each surface. The ambienttemperature was kept at 20◦C.
In Case 2, shown in Figure 9, the temperature of the PV cell highest for the standard EVA;however, when the thermal conductivity is increased from 0.23 W/m·K to 0.83 W/m·K, the temper-ature difference is much smaller than Case 1 at 0.1◦C, equating to a power improvement of 0.04%.The temperature difference between 0.83 W/m·K and 2.85 W/m·K is negligible. The rear surfacetemperature, T10, is lowest for the 0.23 W/m·K backing-EVA and highest for the 2.85 W/m·K . Thisis due to the low thermal conductivity of the backing material reducing heat flow and insulating thePV cell. This results in a higher PV cell temperature and lower surface temperature.
The PV cell temperature for Case 2 is higher (49.6◦C) than that of Case 1 (26.7◦C); which is a10% improvement in power output from the PV cell; thus showing the ability of a PVT collector tomaintain the operating efficiency of the PV cell.
FIG. 8. Temperature profile for Case 1; PV laminate in contact with PVT absorber.
Reuse of AIP Publishing content is subject to the terms at: https://publishing.aip.org/authors/rights-and-permissions. Download to IP: 134.83.1.242 On: Fri, 22 Apr
2016 09:38:28

035011-8 Allan, Pinder, and Dehouche AIP Advances 6, 035011 (2016)
FIG. 9. Temperature profile for Case 2; naturally ventilated PV laminate.
The Carbotherm filler costs 240e/kg; it is believed that the improvements in both Case 1 and 2do not justify the additional material and manufacturing costs.
CONCLUSION
Doping EVA with boron nitride increased the thermal conductivity by a factor of 4; which isin agreement with previous studies. However it was noticed that the material became stiffer andmore brittle with increasing filler content. Further work is required to determine how this willinfluence the manufacture and lifetime of the PV module. A numerical model showed improvementin performance was 0.3% for a PVT collector. Considering the high price of thermal fillers, furtherresearch should focus on whether they are worth the cost for such a small increase in performance.Perhaps their use would be more suited to concentrator systems where higher temperatures areexperienced.
ACKNOWLEDGEMENTS
This work was sponsored by ChapmanBDSP, London, UK and the Engineering and PhysicalResearch Council, UK.
APPENDIX
TABLE III. Thermophysical properties of CrodaTherm 25, as provided by the manufacturer.
Test Typical Value Units
Melting Temperature 25 ◦CLatent Heat, Melting 186 kJ/kgCrystallisation temperature 22 ◦CLatent Heat, Crystallisation -184 kJ/kgVolumetric Heat Capacity 170 C(mJ/m3)Specific Heat Capacity, Solid 1.9 kJ/(kg·◦C)Specific Heat Capacity, Liquid 2.3 kJ/(kg·◦C)Thermal conductivity, solid 0.21 W/(m·◦C)Thermal conductivity, liquid 0.15 W/(m·◦C)
Reuse of AIP Publishing content is subject to the terms at: https://publishing.aip.org/authors/rights-and-permissions. Download to IP: 134.83.1.242 On: Fri, 22 Apr
2016 09:38:28
035011-9 Allan, Pinder, and Dehouche AIP Advances 6, 035011 (2016)
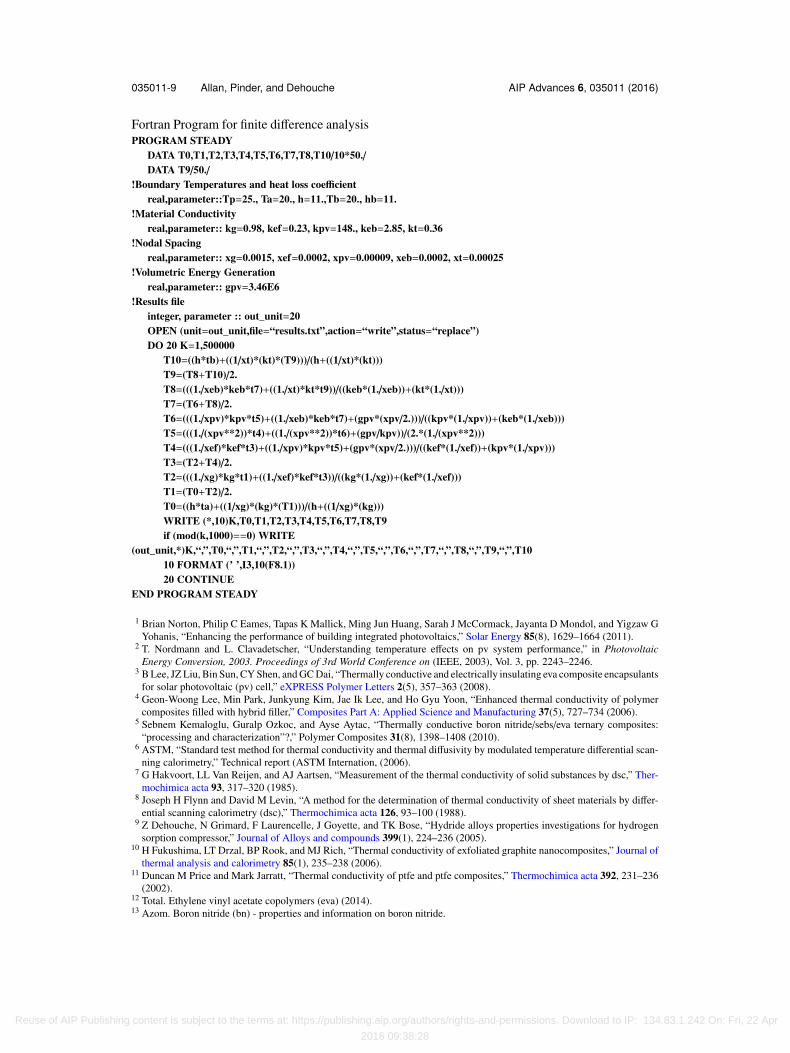
Fortran Program for finite difference analysisPROGRAM STEADY
DATA T0,T1,T2,T3,T4,T5,T6,T7,T8,T10/10*50./DATA T9/50./
!Boundary Temperatures and heat loss coefficientreal,parameter::Tp=25., Ta=20., h=11.,Tb=20., hb=11.
!Material Conductivityreal,parameter:: kg=0.98, kef=0.23, kpv=148., keb=2.85, kt=0.36
!Nodal Spacingreal,parameter:: xg=0.0015, xef=0.0002, xpv=0.00009, xeb=0.0002, xt=0.00025
!Volumetric Energy Generationreal,parameter:: gpv=3.46E6
!Results fileinteger, parameter :: out_unit=20OPEN (unit=out_unit,file=“results.txt”,action=“write”,status=“replace”)DO 20 K=1,500000
T10=((h*tb)+((1/xt)*(kt)*(T9)))/(h+((1/xt)*(kt)))T9=(T8+T10)/2.T8=(((1./xeb)*keb*t7)+((1./xt)*kt*t9))/((keb*(1./xeb))+(kt*(1./xt)))T7=(T6+T8)/2.T6=(((1./xpv)*kpv*t5)+((1./xeb)*keb*t7)+(gpv*(xpv/2.)))/((kpv*(1./xpv))+(keb*(1./xeb)))T5=(((1./(xpv**2))*t4)+((1./(xpv**2))*t6)+(gpv/kpv))/(2.*(1./(xpv**2)))T4=(((1./xef)*kef*t3)+((1./xpv)*kpv*t5)+(gpv*(xpv/2.)))/((kef*(1./xef))+(kpv*(1./xpv)))T3=(T2+T4)/2.T2=(((1./xg)*kg*t1)+((1./xef)*kef*t3))/((kg*(1./xg))+(kef*(1./xef)))T1=(T0+T2)/2.T0=((h*ta)+((1/xg)*(kg)*(T1)))/(h+((1/xg)*(kg)))WRITE (*,10)K,T0,T1,T2,T3,T4,T5,T6,T7,T8,T9if (mod(k,1000)==0) WRITE
(out_unit,*)K,“,”,T0,“,”,T1,“,”,T2,“,”,T3,“,”,T4,“,”,T5,“,”,T6,“,”,T7,“,”,T8,“,”,T9,“,”,T1010 FORMAT (’ ’,I3,10(F8.1))20 CONTINUE
END PROGRAM STEADY
1 Brian Norton, Philip C Eames, Tapas K Mallick, Ming Jun Huang, Sarah J McCormack, Jayanta D Mondol, and Yigzaw GYohanis, “Enhancing the performance of building integrated photovoltaics,” Solar Energy 85(8), 1629–1664 (2011).
2 T. Nordmann and L. Clavadetscher, “Understanding temperature effects on pv system performance,” in PhotovoltaicEnergy Conversion, 2003. Proceedings of 3rd World Conference on (IEEE, 2003), Vol. 3, pp. 2243–2246.
3 B Lee, JZ Liu, Bin Sun, CY Shen, and GC Dai, “Thermally conductive and electrically insulating eva composite encapsulantsfor solar photovoltaic (pv) cell,” eXPRESS Polymer Letters 2(5), 357–363 (2008).
4 Geon-Woong Lee, Min Park, Junkyung Kim, Jae Ik Lee, and Ho Gyu Yoon, “Enhanced thermal conductivity of polymercomposites filled with hybrid filler,” Composites Part A: Applied Science and Manufacturing 37(5), 727–734 (2006).
5 Sebnem Kemaloglu, Guralp Ozkoc, and Ayse Aytac, “Thermally conductive boron nitride/sebs/eva ternary composites:“processing and characterization”?,” Polymer Composites 31(8), 1398–1408 (2010).
6 ASTM, “Standard test method for thermal conductivity and thermal diffusivity by modulated temperature differential scan-ning calorimetry,” Technical report (ASTM Internation, (2006).
7 G Hakvoort, LL Van Reijen, and AJ Aartsen, “Measurement of the thermal conductivity of solid substances by dsc,” Ther-mochimica acta 93, 317–320 (1985).
8 Joseph H Flynn and David M Levin, “A method for the determination of thermal conductivity of sheet materials by differ-ential scanning calorimetry (dsc),” Thermochimica acta 126, 93–100 (1988).
9 Z Dehouche, N Grimard, F Laurencelle, J Goyette, and TK Bose, “Hydride alloys properties investigations for hydrogensorption compressor,” Journal of Alloys and compounds 399(1), 224–236 (2005).
10 H Fukushima, LT Drzal, BP Rook, and MJ Rich, “Thermal conductivity of exfoliated graphite nanocomposites,” Journal ofthermal analysis and calorimetry 85(1), 235–238 (2006).
11 Duncan M Price and Mark Jarratt, “Thermal conductivity of ptfe and ptfe composites,” Thermochimica acta 392, 231–236(2002).
12 Total. Ethylene vinyl acetate copolymers (eva) (2014).13 Azom. Boron nitride (bn) - properties and information on boron nitride.
Reuse of AIP Publishing content is subject to the terms at: https://publishing.aip.org/authors/rights-and-permissions. Download to IP: 134.83.1.242 On: Fri, 22 Apr
2016 09:38:28