eni jpda 06-105 identification cd 01 -...
TRANSCRIPT

Rev. index. Validity Status
Rev. No.
Eni JPDA 06-105
Company document identification
00177_DV_CD.HSE.0206.000_01
Owner document
identification
CD 01
Sheet of sheets
APPENDIX C
Produced Formation Water Modelling Study

ENI-JPDA-06-105 PTY LTD
KITAN DEVELOPMENT PRODUCED FORMATION WATER MODELLING
Document No. ENI046-KitanPFWDischarge
20 January 2010
105 PTY LTD
KITAN DEVELOPMENT PRODUCED FORMATION WATER
KitanPFWDischargeModelling-RevA
KITAN DEVELOPMENT PRODUCED FORMATION WATER

ENI-JPDA-06-105 PTY LTD
KITAN DEVELOPMENT PRODUCED FORMATION WATER MODELLING 20 January 2010
Revision Author Review Approval Date
Rev A
Draft for internal review J Nielsen J Miragliotta J Miragliotta 7 Dec 2009
Rev 0 Final report for issue to
client
J Nielsen J Miragliotta J Miragliotta 20 Jan 2010

ENI-JPDA-06-105 PTY LTD
KITAN DEVELOPMENT PRODUCED FORMATION WATER MODELLING 20 January 2010
TABLE OF CONTENTS
EXECUTIVE SUMMARY .......................................................................................................... 5
1.1 BACKGROUND ...................................................................................................................... 7
1.2 KITAN LOCATION ................................................................................................................. 8
1.3 OBJECTIVE .......................................................................................................................... 8
1.4 SCOPE OF THE STUDY .......................................................................................................... 8
2. PRODUCED FORMATION WATER SYSTEM ................................................................... 9
2.1 GENERAL ............................................................................................................................. 9
2.2 KITAN PFW TREATMENT ....................................................................................................... 9
3. DESCRIPTION OF RECEIVING ENVIRONMENT .......................................................... 11
3.1 CLIMATE ............................................................................................................................ 11
3.2 WINDS .............................................................................................................................. 11
3.3 TIDAL RANGES ................................................................................................................... 13
3.4 CURRENTS ......................................................................................................................... 13
3.5 WAVES .............................................................................................................................. 14
3.6 WATER TEMPERATURES ..................................................................................................... 14
3.7 SENSITIVE ENVIRONMENTAL AREAS ................................................................................... 14
4. METHODS ................................................................................................................... 17
4.1 MODEL OVERVIEW ............................................................................................................. 17
4.2 RISK ASSESSMENT ............................................................................................................. 18
4.3 MODEL OUTPUT ................................................................................................................. 21
5. RESULTS ..................................................................................................................... 22
6. EVALUATION OF ENVIRONMENTAL RISK .................................................................. 30
6.1 ENVIRONMENTAL RISK ....................................................................................................... 30
6.2 BENTHOS ........................................................................................................................... 30
6.3 PLANKTON ......................................................................................................................... 30
6.4 SESSILE MARINE INVERTEBRATES ...................................................................................... 31
6.5 MOTILE ORGANISMS .......................................................................................................... 31
6.6 MARINE MAMMALS ............................................................................................................. 32
6.7 SEABIRDS .......................................................................................................................... 32
7. REFERENCES .............................................................................................................. 33
8. ABBREVIATIONS ........................................................................................................ 35

ENI-JPDA-06-105 PTY LTD
KITAN DEVELOPMENT PRODUCED FORMATION WATER MODELLING 20 January 2010
FIGURES
Figure 1.1 Location of Kitan in relation to other production facilities .......................................... 7
Figure 1.2 Kitan FPSO and field layout ..................................................................................... 7
Figure 2.1 Kitan production process (PFW discharge is indicated with a blue arrow) ................. 10
Figure 2.2 Indicative production profile for the Kitan Project (PFW is shown in blue) ................ 10
Figure 3.1 Seasonal wind roses for the Timor Sea (Saipem Energy Services, 2009). ................. 12
Figure 3.2 Major shoals and banks of the Sahul Shelf in the region of the Kitan
Development........................................................................................................ 15
Figure 3.3 Dominant epibenthic communities on the Big Bank Shoals (from
Heyward et. al. 1997) ........................................................................................... 16
Figure 3.4 Big Bank Shoal (from Heyward et. al. 1997) ........................................................... 16
Figure 4.1: Timor Sea model grid. .......................................................................................... 19
Figure 4.2 Model Bathymetry ................................................................................................ 20
Figure 5.1 Predicted PFW concentrations for maximum design discharge rates (250m3) at various times of the tide cycle ............................................................. 23
Figure 5.2 Predicted PFW concentrations at 200m from the discharge point for
maximum discharge rate (250m3) ......................................................................... 25
Figure 5.3 Maximum predicted PFW concentrations for the duration of the model run (maximum design discharge rates, 250m3/hr) ................................................. 28
Figure 5.4 PEC/PNEC ratios for average PFW concentration recorded over the
duration of the model run ..................................................................................... 29
Figure 6.1 Exposure times to the PFW plume for passive and motile organisms........................ 31
TABLES
Table 3.1 Standard tide levels for Kitan (Saipem Energy Services 2009). ................................ 13
Table 4.1 Discharge parameters. .......................................................................................... 18
Table 5.2 Maximum, mean and 95th percentile concentration at 200m from the discharge point .................................................................................................... 22

ENI-JPDA-06-105 PTY LTD
KITAN DEVELOPMENT PRODUCED FORMATION WATER MODELLING
20 January 2010 Page 5
EXECUTIVE SUMMARY
ENI-JPDA-06-105 PTY LTD is planning to develop the Kitan oilfield, which is located in the
region of the Sahul Banks in the Timor Sea, approximately 170km south of the coast of
Timor-Leste and 360km north of the coast of Australia. It is located on an area of the
Australian continental shelf known as the Sahul Banks, in water depths of approximately
300m. The main environmentally sensitive areas in the vicinity of Kitan are the Big Bank
Shoals, which stretch approximately 50 km in a NE-SW direction along the edge of the Sahul
Shelf. This report presents the findings of a modelling study aimed at assessing the likely
environmental impact from Produced Formation Water (PFW) discharge from the proposed
Kitan Oilfield Development.
PFW is the water mixed in well fluids extracted from oil and gas production wells. It
originates from fossil water found inside the geological reservoir with the oil and gas
(formation water) and water that condenses in pipes due to the pressure drop between the
reservoir and surface (condensed water). It is common practice throughout the offshore
industry to physically separate the PFW from the well fluids and then dispose of the water
directly to the ocean. This separation is not 100% effective and the PFW often contains
small amounts of contaminants including dispersed oil, dissolved organic compounds
(aliphatic and aromatic hydrocarbons, organic acids and phenols), inorganic compounds
(metals and salt ions) and residual process chemicals. The field basis of design (BOD) is to
treat PFW to an oil in water content ≤ 15ppm by volume and discharge it to the sea at a
maximum rate of 250m3/hour.
Once PFW is discharged to sea, it is subject to dilution, dispersion and physical, chemical and
biological degradation. After discharge, the PFW stream rises to the surface under its own
buoyancy and spreads laterally. The plume is then advected away from the discharge point
by ambient currents whilst mixing both horizontally and vertically into the receiving waters.
Modelling of the PFW plume predicted that it would extend up to 6km from the FPSO albeit
as discontiguous patches and at the low concentrations of 0.01% – 0.1% of the initial
concentration i.e. 1,000 times to 10,000 times dilution. The plume was also predicted to
remain in the top 7m of the water column.

ENI-JPDA-06-105 PTY LTD
KITAN DEVELOPMENT PRODUCED FORMATION WATER MODELLING
20 January 2010 Page 6
Records of maximum PFW concentrations occurring around the FPSO location during the 25
day simulation period indicated that the PFW plume would be advected predominantly
towards the east-northeast (away from the Big Bank Shoals). The maximum concentration
at 200m from the FPSO was predicted to be 1.64%PFW. Using a conservative PNEC of
≥0.1%PFW, PFW at potentially toxic concentrations could occur at up to 7km from the FPSO
and down to a depth of 7m at sometime during the life of the field. Thus, whilst the
maximum PFW concentration was 1.64%, the mean and 95th percentile concentrations were
predicted to be 0.03% and 0.19%, respectively, highlighting that PFW would generally be
expected to occur at very low concentrations beyond 200m of the FPSO.
The model predicted that a PEC/PNEC ratio >1 (where the PEC exceeds the PNEC) would
only occur within 250m of the FPSO and only within the top 1m of the water column.
Beyond 250m and deeper than 1m, the PEC/PNEC ratio was predicted to be <1 so no
adverse effects would be expected to occur. This means, with a PNEC set at 0.1% PFW,
that dilutions of over 1000 times of the initial PFW concentration would be expected to occur
by the time the plume has travelled 250m from its discharge point and also at depths greater
than 1m.
Importantly, the model simulation indicated that PFW would not reach the Big Bank Shoals,
either laterally or vertically, at concentrations that would be toxic to marine biota. The
maximum PFW concentration in the vicinity of the Big Bank Shoals was predicted to be
0.01% 0.05% i.e. a dilution of between 2,000 and 10,000 times of its initial
concentration. Consequently, the PFW is predicted to represent little risk to the marine
environment in general and in particular, pose no risk to the marine biota inhabiting the Big
Bank Shoals.

ENI-JPDA-06-105 PTY LTD
KITAN DEVELOPMENT PRODUCED FORMATION WATER MODELLING
20 January 2010 Page 7
1. INTRODUCTION
1.1 BACKGROUND
Eni-JPDA-06-105 Pty Ltd (Eni) is developing the Kitan oil field in the Timor Sea (Figure 1.1
and Figure 1.2). The Kitan Development will consist of a Floating Production Storage and
Offloading (FPSO) facility in conjunction with a sub-sea production facility. This report
presents the findings of a hydrodynamic modelling study of produced formation water (PFW)
to be discharged from the development. The results from this work will form part of Eni’s
Environment Impact Statement (EIS) for submission to the Timor Leste Regulatory Authority.
Figure 1.1 Location of Kitan in relation to other production facilities
Figure 1.2 Kitan FPSO and field layout
3-off 6” flex prod (tot 12Km)3-off 2” flex gas lift
Control umbilical
Kitan 4 Kitan 3 Kitan 2-ST
3-off 6” flex prod (tot 12Km)3-off 2” flex gas lift
Control umbilical
Kitan 4 Kitan 3 Kitan 2-ST

ENI-JPDA-06-105 PTY LTD
KITAN DEVELOPMENT PRODUCED FORMATION WATER MODELLING
20 January 2010 Page 8
1.2 KITAN LOCATION
The Kitan oilfield is situated in Joint Production Development Area (JPDA) in the Timor Sea,
approximately 170km south of the coast of Timor-Leste and 360km north of the coast of
Australia. It is located on an area of the Australian continental shelf known as the Sahul
Banks, in water depths of approximately 300m. The coordinates of the Kitan FPSO are
shown in Table 1.1.
Table 1.1 Coordinates of the Kitan FPSO
Location Easting Northing
FPSO 191815 8825599
The coordinates are provided in reference to the UTM system (GDA94/MGA Zone 52 (EPSG 28352), GRS 1980 spheroid.
Shallow shoals and small sea mounts occur along the edge of the shelf including:
• Big Bank, 6km to the southwest of the FPSO location;
• Karmt, 50km to the southwest;
• Echo, 90km to the northeast; and
• Pea Shoals, 200km to the southwest.
Most of these shoals and reefs support extensive areas of coral, and some of the islands and
large reefs support endangered turtles and seabirds. The nearest emergent reefs, Ashmore,
Cartier and Hibernia, are located on the southwest end of Sahul Shelf. The nearest, Hibernia
reef, is more than 300 km to the southwest of the Kitan oilfield.
1.3 OBJECTIVE
The objective of the study is to determine the potential ecotoxicological risks that Kitan PFW
poses to marine biota likely to inhabit the area.
1.4 SCOPE OF THE STUDY
The scope of work for this study is to:
• simulate the discharge of PFW from the Kitan Development at Basis of Design (BOD)
maximum discharge rate of 250 m3/hour;
• determine the vertical and horizontal dispersal and dilution of PFW; and
• evaluate the risks to marine biota based on predicted effect concentrations (PEC),
predicted no effect concentration (PNEC) with distance from the discharge point.

ENI-JPDA-06-105 PTY LTD
KITAN DEVELOPMENT PRODUCED FORMATION WATER MODELLING
20 January 2010 Page 9
2. PRODUCED FORMATION WATER SYSTEM
2.1 GENERAL
PFW is the water mixed in well fluids extracted from oil and gas production wells. It
originates from:
• fossil water found inside the geological reservoir with the oil and gas (formation water);
and
• water that condenses in pipes due to the pressure drop between the reservoir and
surface (condensed water).
It is common practice throughout the offshore industry to physically separate the PFW from
the well fluids and then dispose of the water directly to the ocean. This separation is not
100% effective and the PFW often contains small amounts of contaminants including
dispersed oil, dissolved organic compounds (aliphatic and aromatic hydrocarbons, organic
acids and phenols), inorganic compounds (metals and salt ions) and residual process
chemicals. Although only small concentrations of these compounds are released, the
continuous discharge of large PFW volumes gives rise to environmental concern.
Accordingly, most of the world’s national or regional regulatory authorities set limits on the
concentration of petroleum hydrocarbons (or total oil and grease) that can remain in
produced water for ocean disposal. Many regulators also require that environmental impact
assessments be undertaken to fully evaluate the risk.
The chemical composition of produced formation water varies from field to field and depends
mainly on attributes of the reservoir geology. The composition of produced water may also
change slightly through the production lifetime of the reservoir. Compared to oil production
fields, produced water from gas/condensate fields generally have higher hydrocarbon
contents due to technical difficulties in separating condensate and water and also due to the
higher aromatic content of condensate. However, the total volume of water produced from
gas fields is much smaller than from oil production fields. Many gas fields discharge less
than 10 cubic metres of produced water per day whilst most oil fields discharge hundreds or
even thousands of cubic metres per day.
2.2 KITAN PFW TREATMENT
The Kitan production process is shown in Figure 2.1 and the PFW production curve over the
life of the field is shown in Figure 2.2. The PFW treatment system for Kitan includes:
• a flash vessel;
• hydrocyclone units;
• gas induced flotation vessel; and

ENI-JPDA-06-105 PTY LTD
KITAN DEVELOPMENT PRODUCED FORMATION WATER MODELLING
20 January 2010 Page 10
• produced formation water cooler.
After treatment the PFW will have:
• Oil content in water: ≤ 15 ppm by volume (Less than 30 ppm by volume required by
JPDA Draft Rules); and
• Discharge Temperature: max 3°C sea water temperature increase @ 100m from
discharge point.
The maximum basis of design PFW discharge flow rate is given as 250 m3/hour (Tecnomare
2009).
Figure 2.1 Kitan production process (PFW discharge is indicated with a blue arrow)
Figure 2.2 Indicative production profile for the Kitan Project (PFW is shown in blue)
Excess GasFlared
ProductionProcess
Ocean
TradingTanker
Atmosphere
Water Clean-up
Cargo Tanks
GasCompression
ProductionWells Gas
OilWater
Oil exported
Water tosea
Gas to safety flare
Fuel
Normal Operation
Temporary Operation
Kitan Production Profile
0
5
10
15
20
25
30
35
40
45
0 10 20 30 40 50 60 70 80 90 100
Months
Oil
Rat
e (K
ST
B/D
ay)
0
5
10
15
20
25
30
35
40
Wat
er R
ate
(KS
TB
/Day
)
Oil
Water
ENI-JPDA-06-105 PTY LTD
KITAN DEVELOPMENT PRODUCED FORMATION WATER MODELLING
20 January 2010 Page 11
3. DESCRIPTION OF RECEIVING ENVIRONMENT
3.1 CLIMATE
The Timor Sea has two distinct seasons: “winter” from April to September and “summer”
from October to March. The short period between the two seasons is termed the transition
season. During this period, either winter or summer regimes could dominate.
3.1.1 Winter
The “winter” dry season (April to September) is characterised by steady easterly (northeast
to southeast) winds of 5ms-1 to 13ms-1 driven by the South East Trade Winds over Australia.
3.1.2 Summer
The “summer” season (October to March) is the period of the predominant North West
Monsoon. It is characterised by mostly westerly (west-southwest) winds of 5ms-1 for periods
of 5 to 10 days with surges in the airflow of 10ms-1 to 18ms-1 for the period of 1 to 3 days.
Tropical cyclones can develop between November and April resulting in short lived, severe
storm events often with strong but variable winds.
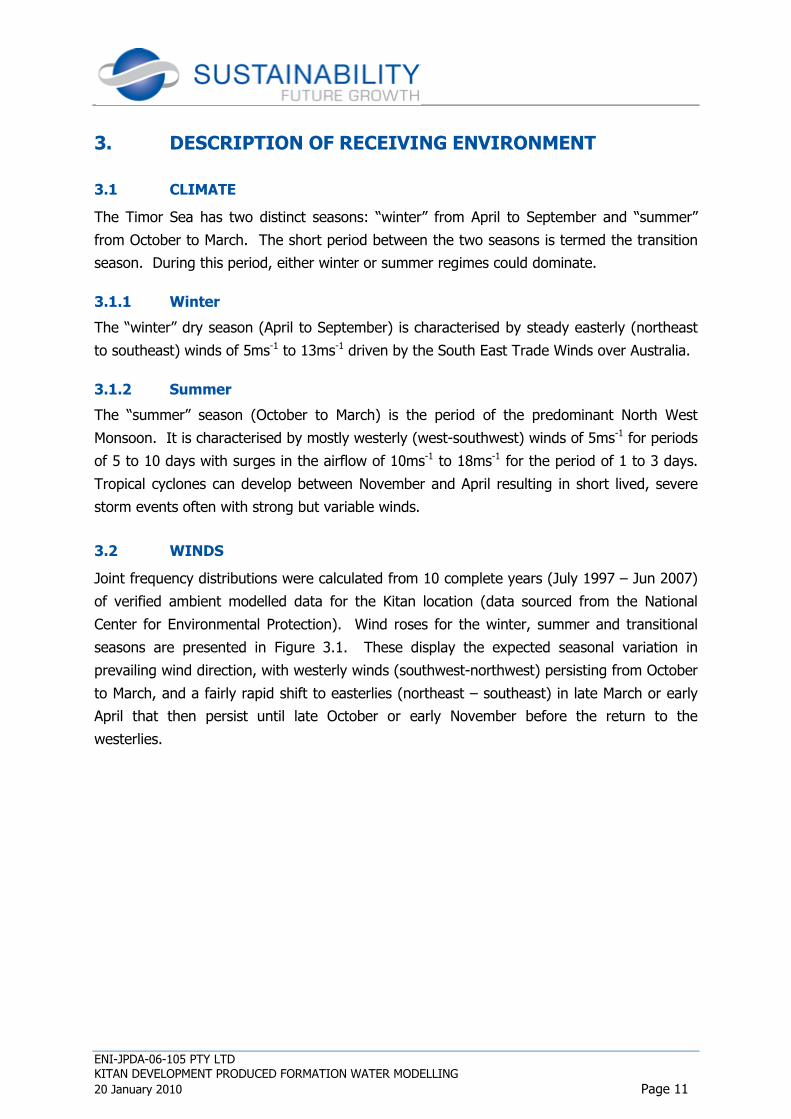
3.2 WINDS
Joint frequency distributions were calculated from 10 complete years (July 1997 – Jun 2007)
of verified ambient modelled data for the Kitan location (data sourced from the National
Center for Environmental Protection). Wind roses for the winter, summer and transitional
seasons are presented in Figure 3.1. These display the expected seasonal variation in
prevailing wind direction, with westerly winds (southwest-northwest) persisting from October
to March, and a fairly rapid shift to easterlies (northeast – southeast) in late March or early
April that then persist until late October or early November before the return to the
westerlies.
ENI-JPDA-06-105 PTY LTD
KITAN DEVELOPMENT PRODUCED FORMATION WATER MODELLING
20 January 2010 Page 12
Figure 3.1 Seasonal wind roses for the Timor Sea (Saipem Energy Services 2009).

ENI-JPDA-06-105 PTY LTD
KITAN DEVELOPMENT PRODUCED FORMATION WATER MODELLING
20 January 2010 Page 13
3.3 TIDAL RANGES
The tides in the vicinity of the Kitan Development are semidiurnal (two highs and lows each
day) with a slight diurnal inequality (difference in heights between successive highs and
low). There is a well defined spring-neap lunar cycle, with spring tides occurring 2 days
after the new and full moon. Table 3.1 provides the standard tidal levels for the Kitan Field.
Highest Astronomical Tide (HAT) is 3.46m and the mean ranges for spring and neap tides
are 2.07m and 0.29m, respectively.
Table 3.1 Standard tide levels for Kitan (Saipem Energy Services 2009).
Northern Endeavour Level (m)
Highest Astronomic Tide (HAT) 3.46
Mean High Water Springs (MHWS) 3.12
Mean High Water Neaps (MHWN) 1.97
Mean Sea Level (MSL) 1.82
Mean Low Water Neaps (MLWN) 1.68
Mean Low Water Springs (MLWS) 0.39
3.4 CURRENTS
The main forces contributing to surface water motions in the Kitan Development location
are:
• general oceanic circulation
• astronomical tides; and
• wind stress.
The Pacific – Indian Throughflow flows south through the Indonesian Archipelago and into
the Eastern Indian Ocean bathing the Browse Basin in warm, relatively low salinity seawater.
At the Kitan location, this may add a small westerly component to the current regime.
Current speeds vary depending on the season. Lowest speeds would occur in April at the
end of the northwest monsoon when winds blow towards the Pacific whilst highest speeds
would occur in September associated with the southeast monsoon (Wijffels et. al. 1996).
Near-surface tidal currents in the region are anti-clockwise rotational, flooding towards the
NE and ebbing towards the SW. Speeds range from about 0.2ms-1 on neap tides to 0.4 ms-1
on springs.
For wind driven surface currents, the typical “rule of thumb” is 2% to 4% of the wind speed.
Surface currents are expected to reflect seasonal wind regimes. Local wind-driven surface
currents may attain maximum speeds of 0.7ms-1 during extreme monsoonal or Trade Wind
surges. More typically speeds would be in the range of 0.2ms-1 to 0.4 ms-1.

ENI-JPDA-06-105 PTY LTD
KITAN DEVELOPMENT PRODUCED FORMATION WATER MODELLING
20 January 2010 Page 14
3.5 WAVES
Waves at the Kitan Development location will comprise contributions from:
• Southern Ocean swells;
• summer monsoonal swells;
• winter easterly swells; and
• locally generated seas.
The most persistent swell will arrive from the south and southwest with typical heights of 2m
in winter and 1m in summer. Since longer period swell suffer less dissipation, periods of
long-travelled swell commonly reach 18 seconds and occasionally exceed 20 seconds.
Shorter period swell (6 to 10 seconds), may result from tropical cyclone, winter easterlies
over the Arafura Sea and the eastern portions of the Timor Sea, and summer westerlies over
the western portions of the Timor Sea. Local wind generated sea is highly variable but
typically range in period from 2 to 6 seconds with heights of up to 6m in strong persistent
forcing at some locations.
3.6 WATER TEMPERATURES
Surface sea temperatures in the vicinity of Kitan are expected to range from about 30°C in
summer to 27°C in winter.
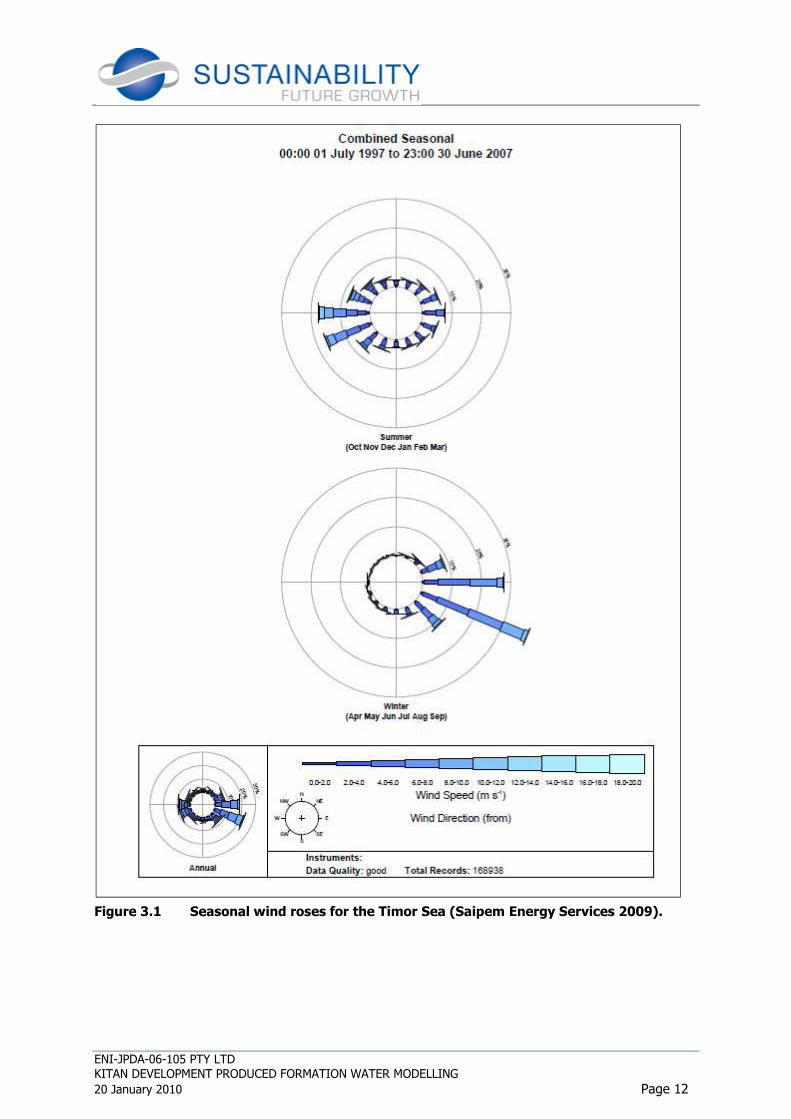
3.7 SENSITIVE ENVIRONMENTAL AREAS
The main environmentally sensitive areas in the region are the shoals and banks of the Sahul
Shelf. The major shoals and banks in the region (Figure 3.2) include:
• Karmt Shoals, approximately 45km to the southwest of the Kitan Development;
• Big Bank Shoals, approximately 6km southwest of the Kitan Development; and
• Echo Shoals, approximately 85km to the northeast of the Kitan Development.
The submerged banks of the region vary in their habitat and species composition, but are
generally characterised by mixed Halimeda algae, sponge and soft coral communities with
some hard corals on the more consolidated sediments.
The nearest shoals to the Kitan Development are the Big Bank Shoals (Figure 3.2). They
comprise some 13 significant submerged banks, ranging in size from 0.05km2 to 40 km2.
The banks emerge from a water-depth of 200m to 300m and rise steeply to within 20m
below the water surface.
ENI-JPDA-06-105 PTY LTD
KITAN DEVELOPMENT PRODUCED FORMATION WATER MODELLING
20 January 2010 Page 15
Figure 3.2 Major shoals and banks of the Sahul Shelf in the region of the Kitan
Development
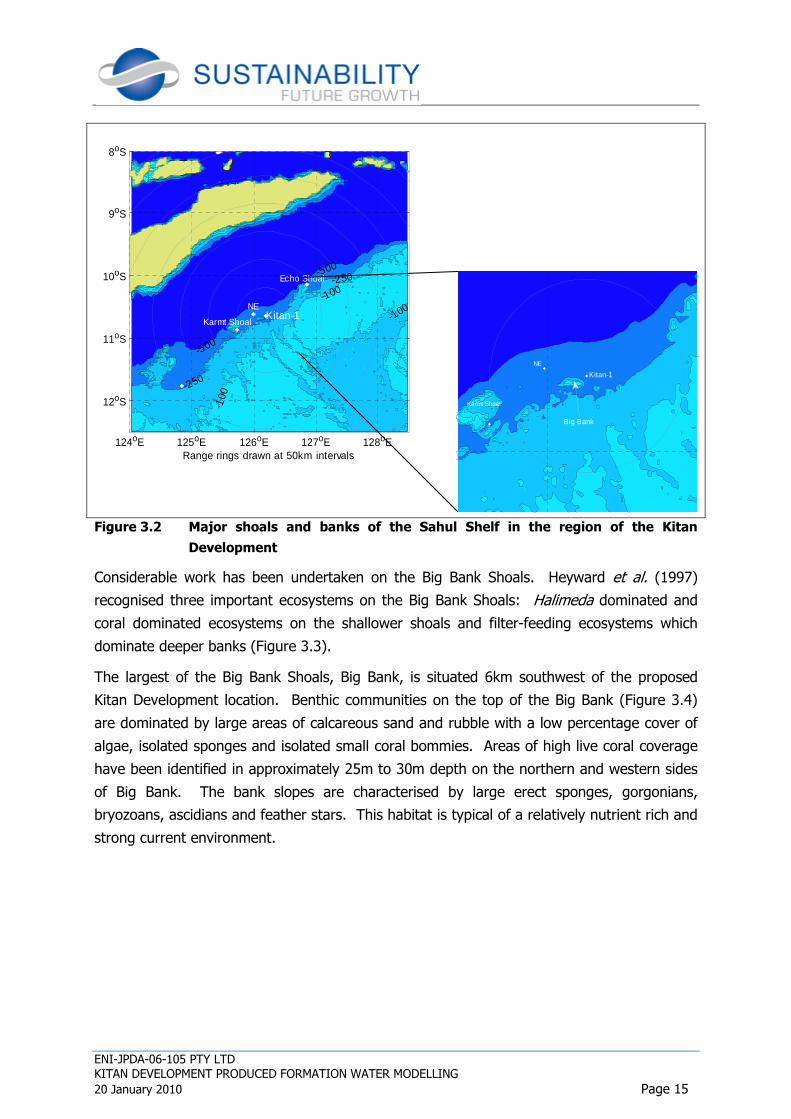
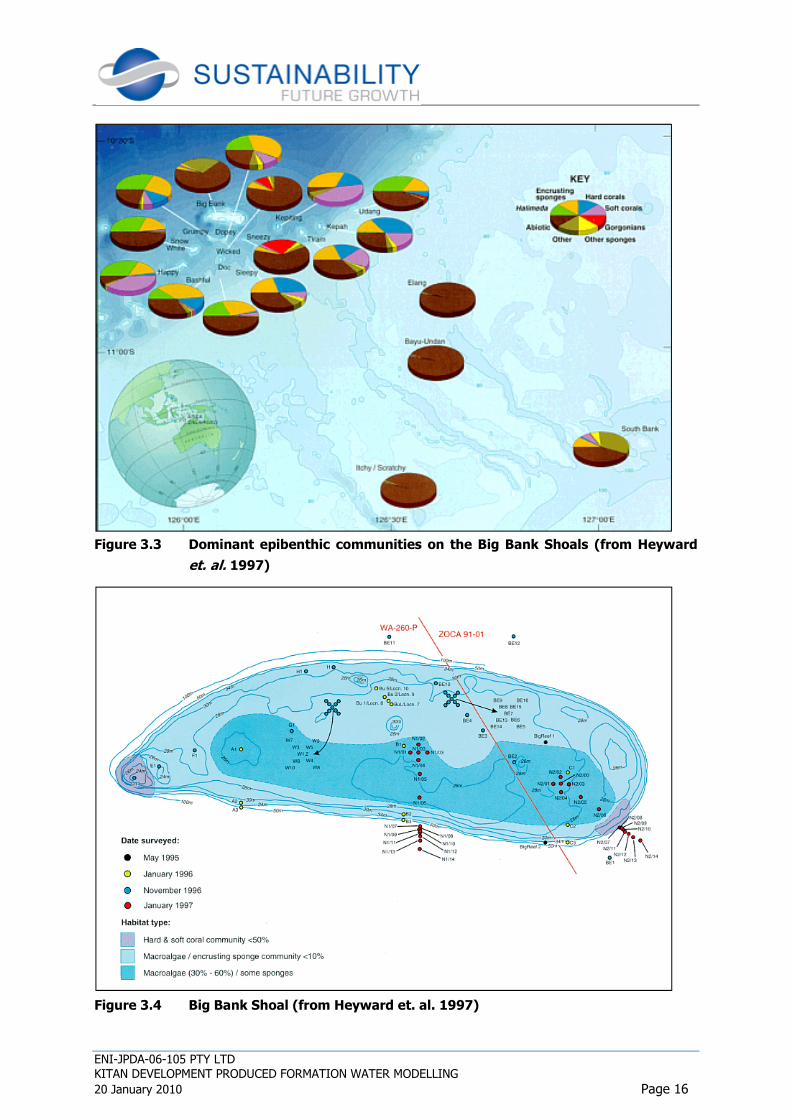
Considerable work has been undertaken on the Big Bank Shoals. Heyward et al. (1997)
recognised three important ecosystems on the Big Bank Shoals: Halimeda dominated and
coral dominated ecosystems on the shallower shoals and filter-feeding ecosystems which
dominate deeper banks (Figure 3.3).
The largest of the Big Bank Shoals, Big Bank, is situated 6km southwest of the proposed
Kitan Development location. Benthic communities on the top of the Big Bank (Figure 3.4)
are dominated by large areas of calcareous sand and rubble with a low percentage cover of
algae, isolated sponges and isolated small coral bommies. Areas of high live coral coverage
have been identified in approximately 25m to 30m depth on the northern and western sides
of Big Bank. The bank slopes are characterised by large erect sponges, gorgonians,
bryozoans, ascidians and feather stars. This habitat is typical of a relatively nutrient rich and
strong current environment.
Range rings drawn at 50km intervals 124oE 125oE 126oE 127oE 128oE
12oS
11oS
10oS
9oS
8oS
-500
-500-250
-100
-100
-100
-250
NE
Echo Shoal
Karmt Shoal
Holothuria Banks
Kitan-1
NE
Karmt Shoal
Kitan-1
Big Bank
ENI-JPDA-06-105 PTY LTD
KITAN DEVELOPMENT PRODUCED FORMATION WATER MODELLING
20 January 2010 Page 16
Figure 3.3 Dominant epibenthic communities on the Big Bank Shoals (from Heyward
et. al. 1997)
Figure 3.4 Big Bank Shoal (from Heyward et. al. 1997)

ENI-JPDA-06-105 PTY LTD
KITAN DEVELOPMENT PRODUCED FORMATION WATER MODELLING
20 January 2010 Page 17
4. METHODS
4.1 MODEL OVERVIEW
4.1.1 Far Field Dispersion Modelling
The dispersion module applied in this study is based on the classic random walk particle
tracking method (Elliot 1992) and assumes that the discharge can be idealised as a large
number of particles that move independently under the action of tide and wind.
The motion of the particles is the sum of two effects:
• advection by the tidal currents; and
• dispersion due to turbulence and current shear effects.
Advection is calculated by stepping through the variations in the current field in time.
Dispersion is included by subjecting each particle to a random displacement at each time
step. The dispersive displacement (random step) of each particle at each time step (dt) is
scaled by the square root of the increment in the variance of the effluent plume which is
given by the product:
(increment in variance) = 2Kdt
where K is the horizontal (Kxy ) or vertical ( Kz) diffusion coefficient. The actual step length
taken by each particle is also determined by a random number selected from a normal
distribution with zero mean and unit variance which is scaled by the product (2Kdt). Steps in
the x, y and z co-ordinate directions are made independently. Steps in the vertical plane
allow for reflection of the particle from the seabed and surface. The current velocity applied
to each particle is corrected according to its level in the water column using a power law
relationship. Full details of the model are provided in RPC (2007). The model has been
verified against a dye dispersion study from the North Rankin platform on the North West
Shelf of Australia (RPC 2007).
4.1.2 Hydrodynamic Model
The hydrodynamics applied in the present study were computed using a combination of
HYbrid Coordinate Ocean Model (HYCOM) and QUODDY. HYCOM is a data-compiled hybrid
generalised coordinate ocean model, sponsored by the National Ocean Partnership Program
as part of the U. S. Global Ocean Data Assimilation Experiment. Computations are carried
out on a cylindrical map projection grid between 78°S and 47°N (1/12° equatorial
resolution), where the horizontal dimensions of the global grid are 4500 x 3298 grid points
resulting in ~7 km spacing on average. Daily hindcast values are available from 3 November
2003 to the present day.

ENI-JPDA-06-105 PTY LTD
KITAN DEVELOPMENT PRODUCED FORMATION WATER MODELLING
20 January 2010 Page 18
QUODDY solves the time dependent, free surface circulation problems in three dimensions
(Ip and Lynch 1995). The algorithms that comprise QUODDY utilise the finite element
method in space and the model can be applied to computational domains encompassing the
Deep Ocean, continental shelves, coastal seas and estuarine systems.
Model grid and bathymetry are shown in Figure 4.1 and Figure 4.2, respectively. The
bathymetry was interpolated from the Australian Geological Survey Office database. The
model was forced from the open boundary by tidal elevations calculated from the M2, S2,
N2, O1 and K1 tidal constituents. Amplitudes and phases for these were taken from the
FES-95.2 global ocean model (Le Provost et. al. 1998). The model has undergone extensive
validation and found to compare favourably against measured currents and tidal elevations
in the Timor Sea.
Table 4.1 summarises the discharge parameters for the model scenario. The model was run
for 25 days using transitional season hydrodynamics.
Table 4.1 Discharge parameters.
Parameter Value
Flow (m3/hr) 250
Temp (°C) 40
Salinity (psu) 20
Discharge Depth (m below sea surface) 5
Discharge Conc. (%PFW) 100
4.2 RISK ASSESSMENT
The ratio of the Predicted Environmental Concentration (PEC) to the Predicted No Effect
Concentration (PNEC) (PEC/PNEC ratio) was used to provide a measure of the toxicological
risk of the PFW. This is an established technique used to screen chemicals in offshore
discharges (EC 1996) and forms the basis of the OSPAR Harmonised Notification Scheme
(OSPAR, 2000). It is also used in the Environmental Impact Factor (EIF) tool (Johnsen et. al.
2000) applied in the North Sea to assess the effect of PFW discharge.
The PNEC is derived from ecotoxicity data and is the concentration below which it is believed
there will be no detrimental effect on the environment. It relies upon the assumption that a
single value captures the concentration at which no toxic response (acute or chronic) is
expected in the target population of marine biota. Dispersion models, such as that used in
the present study, provide spatially and temporally varying PECs for either the whole effluent
or individual compounds.

ENI-JPDA-06-105 PTY LTD
KITAN DEVELOPMENT PRODUCED FORMATION WATER MODELLING
20 January 2010 Page 19
Figure 4.1: Timor Sea model grid.
122 124 126 128 130 132 134 136
−22
−20
−18
−16
−14
−12
−10
−8
−6
−4
−2

ENI-JPDA-06-105 PTY LTD
KITAN DEVELOPMENT PRODUCED FORMATION WATER MODELLING
20 January 2010 Page 20
Figure 4.2 Model Bathymetry
122 124 126 128 130 132 134 136
−20
−18
−16
−14
−12
−10
−8
−6
−4
1000 1000
1000
1000
500 100 10050
50
50
1000
500
100
100100
50
500500
500500
1000 100
50
100
50
50
50
5050
Easting (m)
Nor
thin
g(m
)

ENI-JPDA-06-105 PTY LTD
KITAN DEVELOPMENT PRODUCED FORMATION WATER MODELLING
20 January 2010 Page 21
If the spatial scale of the effect is limited to the immediate area around an offshore facility
and the significance of the effect is considered to be low, then the risk is likely to be
acceptable (Terrens and Tait 1996). Conversely, if the spatial scale of the effect is
widespread and the survival or reproductive capacity of marine organisms is significantly
reduced then the risk is likely to be considered unacceptable. Where risks are unacceptable,
management actions are required to reduce risk to an acceptable level.
As the Kitan field is not yet producing it is not possible to directly undertake ecotoxicological
tests on Kitan PFW. Thus, a conservative PNEC value of 0.1%PFW (1:1000 dilution) has
been used in the modelling. This is based on knowledge of ecotoxicological results from
PFW discharges on the North West Shelf and in the Timor Sea.
4.3 MODEL OUTPUT
Model results were presented as:
• plan views of PFW concentrations in the discharge plume;
• time series of PFW concentrations and excess temperature at 200m from the discharge
in any direction; and
• maximum and averaged predicted PFW concentrations and associated ratio of the
Predicted Environmental Concentration to the Predicted No Effect Concentration
(PEC/PNEC ratio) over the duration of the simulation.
Plan views of PFW concentrations were plotted for various stages of the tidal cycle. As
plume concentrations vary through the water column, the maximum temperature from each
layer in the model was plotted rather than results from one particular layer or a depth
averaged value. A time series of the maximum predicted concentration and temperature at
200m and in any direction from the discharge was also plotted.
To identify the highest PFW concentration occurring over the duration of the simulation, the
model recorded the maximum instantaneous values occurring in each cell. These values
were plotted to present surface and vertical distributions through a transect along the length
of the plume. Similar plots were presented for time averaged values over the duration of the
simulation.
PEC/PNEC ratios were calculated using the average concentration over the duration of the
simulation. The PEC/PNEC ratio is an established technique to screen chemicals in offshore
discharges (EC 1996). A chemical is assessed to be environmentally compatible if the PEC
i.e. the concentration predicted to occur in the environment is lower than the PNEC, which is
the concentration at which no adverse environment effects occur. If the PEC/PNEC ratio is
greater than 1 i.e. PEC>PNEC, then the chemical is assessed to potentially cause adverse
environmental effects. Sublethal ecotoxicological test data from tests conducted over
durations of at least 24 hours were used to calculate PNEC.

ENI-JPDA-06-105 PTY LTD
KITAN DEVELOPMENT PRODUCED FORMATION WATER MODELLING
20 January 2010 Page 22
5. RESULTS
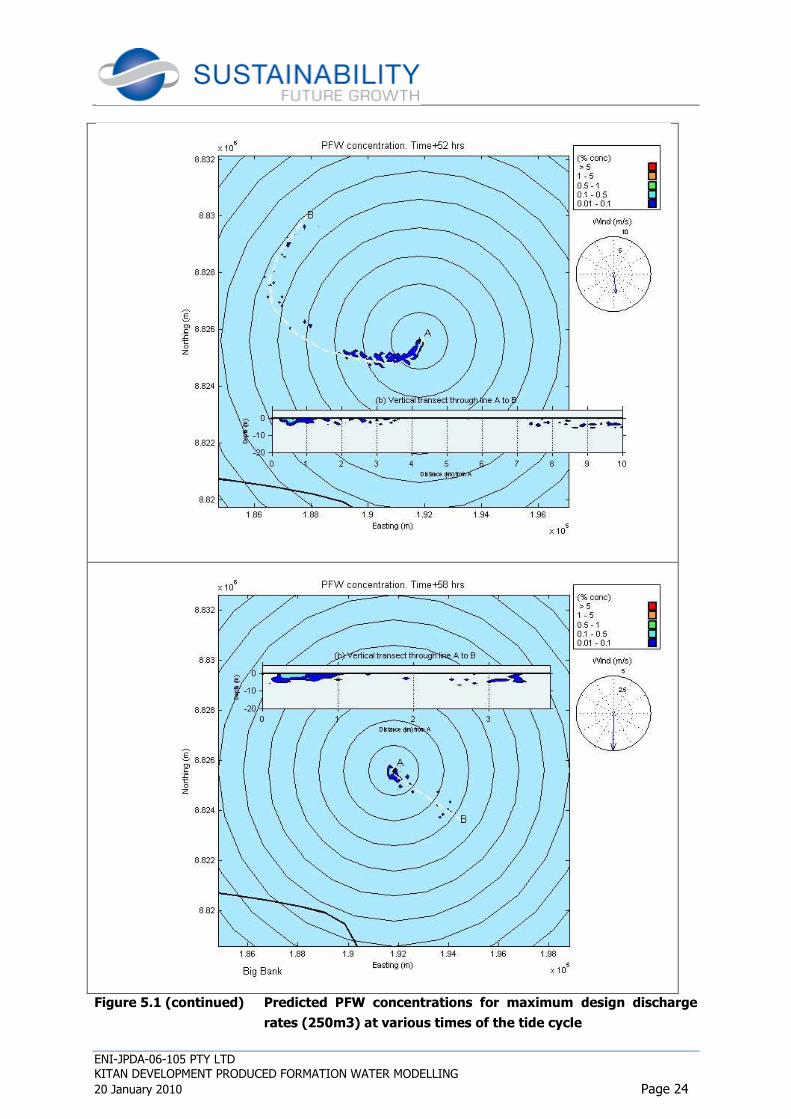
Once PFW is discharged to sea, it is subject to dilution, dispersion and physical, chemical and
biological degradation. Figure 5.1 shows the predicted PFW concentrations at various stages
of the tidal cycle for the chosen period. The location of the Big Bank Shoals in relation to the
FPSO and the PFW plume is shown in the bottom left hand corner of each figure. After
discharge, the PFW stream rises to the surface under its own buoyancy and spreads laterally.
The plume is then advected away from the discharge point by ambient currents whilst
mixing both horizontally and vertically into the receiving waters. The PFW plume is predicted
to extend up to 6km from the FPSO albeit as discontiguous patches and at the low
concentrations of 0.01% – 0.1% of the initial concentration i.e. 1,000 times to 10,000 times
dilution. Figure 5.1 also indicates that during the course of this particular model simulation,
the PFW was constrained to within the top 7m of the water column.
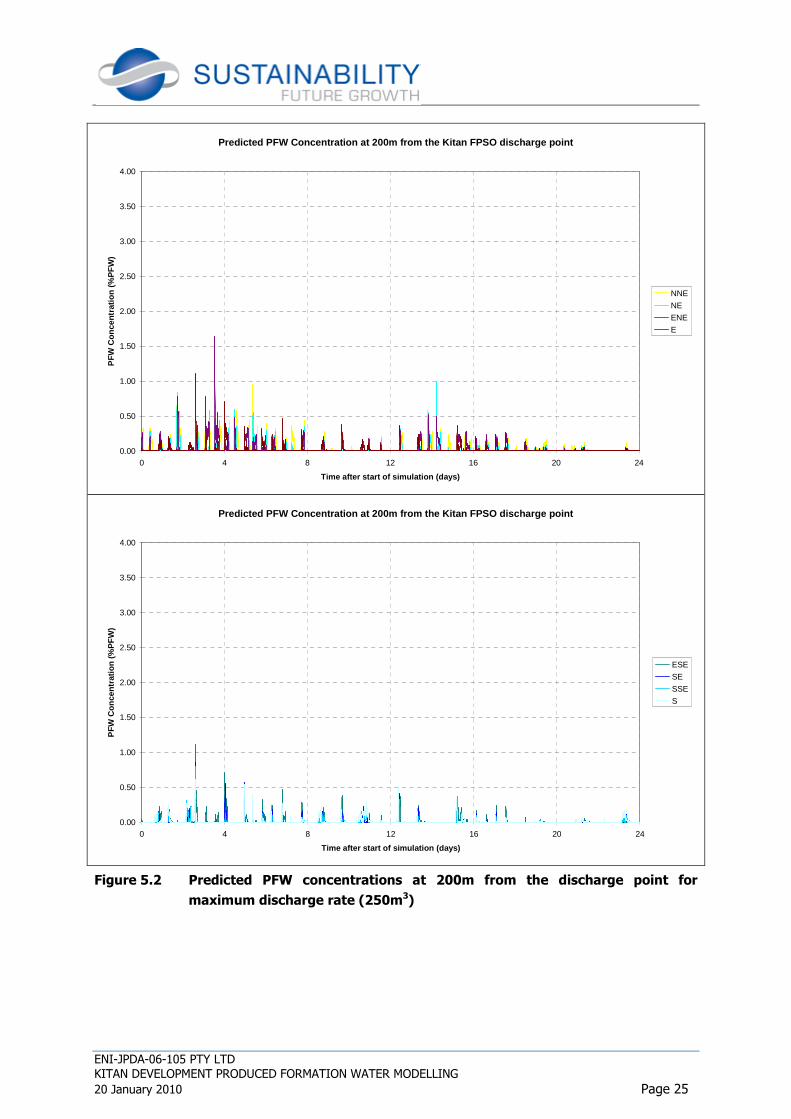
Figure 5.2 shows the time series of PFW concentrations at 16 compass points, 200m from
the discharge point. Concentrations are highly variable in time and space as a result of
ambient currents. Ambient currents fluctuate with tide and prevailing wind conditions:
during low current speeds, the plume pools and concentrations increase; conversely during
strong currents, concentrations decrease as dilution of the plume is enhanced.
The maximum, mean and 95th percentile predicted PFW concentrations at 200m from the
FPSO along 16 compass points are summarised in Table 5.1. Maximum concentrations are
predicted to the east-northeast. Whilst the maximum concentration in this direction was
predicted to be 1.64%PFW, the mean and 95th percentile concentrations were predicted to
be 0.03% and 0.19%, respectively, highlighting that PFW would generally be expected to
occur at very low concentrations beyond 200m of the FPSO.
Table 5.1 Maximum, mean and 95th percentile concentration at 200m from the
discharge point
NNE NE ENE E ESE SE SSE S SSW SW WSW W WNW NW NNW N
Max 0.95 0.99 1.64 1.11 1.11 0.85 0.79 0.61 0.61 0.41 0.72 0.60 0.60 0.68 0.73 0.95
Mean 0.02 0.02 0.03 0.01 0.01 0.01 0.01 0.01 0.01 0.01 0.02 0.04 0.04 0.03 0.03 0.02
95%ile 0.17 0.10 0.19 0.08 0.08 0.03 0.04 0.07 0.07 0.06 0.14 0.17 0.17 0.16 0.18 0.17

ENI-JPDA-06-105 PTY LTD
KITAN DEVELOPMENT PRODUCED FORMATION WATER MODELLING
20 January 2010 Page 23
Figure 5.1 Predicted PFW concentrations for maximum design discharge rates (250m3)
at various times of the tide cycle
ENI-JPDA-06-105 PTY LTD
KITAN DEVELOPMENT PRODUCED FORMATION WATER MODELLING
20 January 2010 Page 24
Figure 5.1 (continued) Predicted PFW concentrations for maximum design discharge
rates (250m3) at various times of the tide cycle
ENI-JPDA-06-105 PTY LTD
KITAN DEVELOPMENT PRODUCED FORMATION WATER MODELLING
20 January 2010 Page 25
Figure 5.2 Predicted PFW concentrations at 200m from the discharge point for
maximum discharge rate (250m3)
Predicted PFW Concentration at 200m from the Kitan FPSO discharge point
0.00
0.50
1.00
1.50
2.00
2.50
3.00
3.50
4.00
0 4 8 12 16 20 24
Time after start of simulation (days)
PF
W C
on
cen
trat
ion
(%
PF
W)
NNE
NE
ENE
E
Predicted PFW Concentration at 200m from the Kitan FPSO discharge point
0.00
0.50
1.00
1.50
2.00
2.50
3.00
3.50
4.00
0 4 8 12 16 20 24
Time after start of simulation (days)
PF
W C
on
cen
trat
ion
(%
PF
W)
ESE
SE
SSE
S

ENI-JPDA-06-105 PTY LTD
KITAN DEVELOPMENT PRODUCED FORMATION WATER MODELLING
20 January 2010 Page 26
Figure 5.2 (continued) Predicted PFW concentrations at 200m from the discharge point
for maximum discharge rate (250m3)
Predicted PFW Concentration at 200m from the Kitan FPSO discharge point
0.00
0.50
1.00
1.50
2.00
2.50
3.00
3.50
4.00
0 4 8 12 16 20 24
Time after start of simulation (days)
PF
W C
on
cen
trat
ion
(%
PF
W)
SSW
SW
WSW
W
Predicted PFW Concentration at 200m from the Kitan FPSO discharge point
0.00
0.50
1.00
1.50
2.00
2.50
3.00
3.50
4.00
0 4 8 12 16 20 24
Time after start of simulation (days)
PF
W C
on
cen
trat
ion
(%
PF
W)
WNW
NW
NNW
N

ENI-JPDA-06-105 PTY LTD
KITAN DEVELOPMENT PRODUCED FORMATION WATER MODELLING
20 January 2010 Page 27
Figure 5.3 shows the maximum predicted %PFW concentration recorded laterally and
vertically around the proposed FPSO location over the 25 days of the model simulation.
Using a conservative PNEC of ≥0.1%PFW, indicates that PFW at potentially toxic
concentrations could occur at some time at a distance of up to 7km from the FPSO. Figure
5.3 also indicates that potentially toxic concentrations could occur at some time at a depth of
up to 7m from the FPSO. The maximum %PFW concentration provides a prediction of the
highest PFW that may occur at any given point but is not indicative of the conditions that
would generally prevail around the FPSO.
Figure 5.4 shows the predicted PEC/PNEC ratio based on average %PFW concentrations
recorded around the FPSO over the 25 days of the model simulation. A PEC/PNEC ratio >1
i.e. where the PEC exceeds the PNEC was only observed to occur within 250m of the FPSO.
Beyond 250m, the PEC/PNEC ratio was predicted to be <1 so no adverse effects would be
expected to occur. This means, with a PNEC set at 0.1% PFW, that dilutions of over 1000
times of the initial PFW concentration would be expected to occur by the time the plume has
travelled 250m from its discharge point.
A PEC/PNEC ratio >1 was predicted to be constrained to within 1m water depth from the
surface (Figure 5.4). Thus, with a PNEC set at 0.1% PFW, dilutions of over 1000 times of
the initial PFW concentration would be expected to occur within the top 1m of the plume.
Importantly, the model simulation indicated that PFW would not reach the Big Bank Shoals,
either laterally or vertically, at concentrations that would be toxic to marine biota. The
maximum PFW concentration in the vicinity of the Big Bank Shoals was predicted to be
0.01% 0.05% i.e. a dilution of between 2,000 and 10,000 times of its initial
concentration.

ENI-JPDA-06-105 PTY LTD
KITAN DEVELOPMENT PRODUCED FORMATION WATER MODELLING
20 January 2010 Page 28
Figure 5.3 Maximum predicted PFW concentrations for the duration of the model run
(maximum design discharge rates, 250m3/hr)
Notes: Discharge flow = 250,m3/day; Discharge temperature (T0) = 45°C; Discharge depth = 5m below the surface; Ambient temperature = 30°C PNEC = 0.1% PFW; Range rings drawn at 1km intervals

ENI-JPDA-06-105 PTY LTD
KITAN DEVELOPMENT PRODUCED FORMATION WATER MODELLING
20 January 2010 Page 29
Figure 5.4 PEC/PNEC ratios for average PFW concentration recorded over the duration
of the model run
Notes: Discharge flow = 250,m3/day; Discharge temperature (T0) = 45°C; Discharge depth = 5m below the surface; Ambient temperature = 30°C PNEC = 0.1% PFW; Range rings drawn at 1km intervals

ENI-JPDA-06-105 PTY LTD
KITAN DEVELOPMENT PRODUCED FORMATION WATER MODELLING
20 January 2010 Page 30
6. EVALUATION OF ENVIRONMENTAL RISK
6.1 ENVIRONMENTAL RISK
To present a more intuitive assessment of the risk posed from the PFW being discharged
from the Kitan FPSO, the impact to individual biological communities is examined. These
communities include:
• benthos;
• plankton;
• sessile invertebrates (communities attached to the facility);
• fish;
• marine mammals; and
• seabirds.
6.2 BENTHOS
Benthos communities are found in or around the seabed. They are highly unlikely to be
affected due to the deep water and the fact that the plume disperses rapidly in the water
column and does not impact directly on the seabed. Furthermore adsorption of organic
compounds onto suspended sediment particles will be low as the compounds discharged will
be low molecular weight, limiting the extent of sedimentation to the seabed.
6.3 PLANKTON
Planktonic organisms live freely in the water column and drift with the water currents.
Plankton may also include the early stages (e.g. egg, larva and spores) of non-planktonic
species (fish, benthic invertebrates and algae). Figure 6.1 illustrates the typical exposure
periods for passive floating organisms. Once discharged to the receiving environment,
dilution reduces the concentration of potentially toxic chemicals in the PFW. Under the
present discharge rate and configuration, initial dilutions are high. For a “worst-case”
scenario, a freely floating organism passing directly beneath the discharge pipe may be
exposed to PFW concentrations above the PNEC value for up to 48 hours. There is therefore
the potential for impact, however, the exposure concentration will be continually diluting and
only organisms residing directly in the plume would be impacted, which constitutes a small
proportion of the community.

ENI-JPDA-06-105 PTY LTD
KITAN DEVELOPMENT PRODUCED FORMATION WATER MODELLING
20 January 2010 Page 31
Figure 6.1 Exposure times to the PFW plume for passive and motile organisms
6.4 SESSILE MARINE INVERTEBRATES
Sessile marine invertebrates are those that are attached to the substrata and infrastructure
surrounding the discharge. These do not have the opportunity to move to avoid toxic affects
and potentially are the most exposed communities to the plume. Even though these
organisms cannot move, the plume would be continually moving around them depending on
the direction and speed of ambient currents. Sessile invertebrates that are attached to the
FPSO (i.e. biofouling) may therefore be sporadically exposed to high concentrations of PFW,
with the potential for accumulation of hydrocarbons in their tissues. The impact of this
process would be limited by measures undertaken to control biofouling of the vessel and by
natural depuration during periods when these organisms are positioned in clean seawater.
6.5 MOTILE ORGANISMS
Figure 6.1 shows the typical exposure periods for motile organisms such as fish. These have
the ability to swim and might move in and out of the plume. Exposure periods are likely to
be sporadic and short lived and therefore unlikely to be at levels which would harm the
organism. Moreover, the volume of water exposed to concentrations above PNEC values is
relatively small both under present and projected discharge rates.
Con
cent
ratio
n
Time
Motile organism
Passive floatingorganism
A/B B' A'
AA'
B B'
PNEC
DischargeLocation
Dispersion of PFW plume
ENI-JPDA-06-105 PTY LTD
KITAN DEVELOPMENT PRODUCED FORMATION WATER MODELLING
20 January 2010 Page 32
6.6 MARINE MAMMALS
As marine mammals feed on fish and/or plankton, they are most likely to be affected by
trophic transfer (i.e. bioaccumulation of chemicals from food) and potential biomagnification.
However, vertebrates are able to metabolise and excrete the type of chemicals that
contribute most to the risk. They are also generally migratory so their exposure period is
expected to be low and individuals would not be likely to be affected by any localised
contamination that may occur.
6.7 SEABIRDS
Seabirds are harmed mainly by the physical properties of floating oil and not the toxicity
(Furness and Camphuysen 1997). The PFW plume is not expected to create surface slicks at
concentrations that could be harmful through direct coating of feathers, or through ingestion
during preening. As with the marine mammals, there is the potential for trophic transfer and
indirect effects such as changes in the availability of food sources. As the food source is not
likely to be impacted, the risk to sea birds is low.
ENI-JPDA-06-105 PTY LTD KITAN DEVELOPMENT PRODUCED FORMATION WATER MODELLING
14 January 2010 Page 33
7. REFERENCES
EC. (1996). Technical guidance document in support of commission directive 93/67/EEC on
risk assessment for new notified substances and commission regulation (EC) No.
1488/94 on risk assessment for existing substances. Part I to iv, Office for official
publications of the European Communities, ISBN 92-827-8011-2.
Elliot, T.J. (Ed.) (1992). Methods for determining pollutant dispersion in tidal waters. UCES
Rpt U89-5(I:3).
Furness, R., and C. Camphysen. (1997). Seabirds as monitors of the marine environment.
ICES Journal of Marine Science. 54: 726-737.
Heyward, A., Pinceratto, E. and Smith L. (1997). Big Bank Shoals of the Timor Sea: an
Environmental Resource Atlas. AIMS, Townsville.
Johnsen, S., T.K. Frost, M. Hjelsvold and T.R. Utvik. (2000). The environmental impact
factor – a proposed tool for produced water impact reduction, management and
regulation. SPE Paper 61178.
Ip, J.T.C. and D.R. Lynch. (1995). Comprehensive Coastal Circulation Simulation using
Finite Elements: Nonlinear Prognostic Time-Stepping Model, QUODDY3 User's Manual.
NML 95-1.
Le Provost, C., A. F. Bennett, and D. E. Cartwright. (1995). Ocean tides for and from
TOPEX/POSEIDON. Science, Vol. 267, 639-642.
Saipem Energy Services. (2009). Kitan Field Development Project Metocean Design And
Operational Criteria. Doc. A-050-GR-71500 Rev 0.
OSPAR. 2000. Recommendations 2000/4 on a harmonised pre-screening scheme for
offshore chemicals. Ospar Commission.
RPC (2007). Cumulative Environmental Impact Study Produced Formation Water Modelling.
RPC-REP-05-006-001 REV 0.
Terrens G.W. and R.D. Tait. (1993). Effects on the marine environment of produced
formation water discharges from Esso/BHPP’s Bass Strait Platforms. Esso Australia
Ltd., Melbourne, Australia. 25 pp.
Tecnomare. (2009). Kitan Field Development. Basis of Design. 007105.00.B.G.RB.00001.
Rev CD-BF 01

ENI-JPDA-06-105 PTY LTD KITAN DEVELOPMENT PRODUCED FORMATION WATER MODELLING
14 January 2010 Page 34
Wijffels, S.E., Bray, N., Hautala, S., Meyers, G. and Morawitz, W.M.L. (1996). The WOCE
Indonesian Throughflow Repeat Hydrography Sections: I10 and IR6. WOCE, 24.

ENI-JPDA-06-105 PTY LTD KITAN DEVELOPMENT PRODUCED FORMATION WATER MODELLING
14 January 2010 Page 35
8. ABBREVIATIONS
AHD Australian Height Datum
BOD Basis of Design
Eni ENI-JPDA-06-105 PTY LTD
EIF Environmental Impact Factor
EIS Environmental Impact Statement
FPSO Floating Production Storage and Offloading facility
HAT Highest Astronomic Tide
HYCOM HYbrid Coordinate Ocean Model
JPDA Joint Petroleum Development Authority
LAT Lowest Astronomical Tide
MHWN Mean High Water Neaps
MHWS Mean High Water Springs
MLWN Mean Low Water Neaps
MLWS Mean Low Water Springs
MSL Mean Sea Level
PEC Predicted Environmental Concentration
PFW Produced Formation Water
PNEC Predicted No Effect Concentration
PPM Parts Per Million