enterprise planning - ohio department of...
TRANSCRIPT

Department of Administrative Services Office of Information Technology Investment and Governance Division Office for State IT Investment Management
F I S C A L Y E A R S 2 0 1 0 - 2 0 1 1
ENTE R P R I S E
P L ANNI N G

Statewide IT Investment Summary and Analysis E-ii
Fiscal Years 2010-2011
Enterprise IT Planning
Acknowledgements
The data and observations contained in this report were made through the analysis of agency IT plans. We wish to express our thanks to the: Accountancy Board of
Ohio; Board of Examiners of Architects; Board of Speech-Language Pathology and Audiology; Bureau of Workers‘ Compensation; Department of Veteran Services;
Industrial Commission of Ohio; Ohio Arts Council; Ohio Arts and Facilities
Commission; Ohio Athletic Commission; Ohio Board of Dietetics; Ohio Board of Motor Vehicle Collision Repair Registration; Ohio Board of Nursing; Ohio Board of
Tax Appeals; Ohio Career Colleges and Schools Board; Ohio Chemical Dependency Professionals Board; Ohio Civil Rights Commission; Ohio Commission on Dispute
Resolution; Ohio Commission on Minority Health; Ohio Consumers Counsel; Ohio
Counselor, Social Worker and Marriage and Family Therapist Board; Ohio Department of Administrative Services; Ohio Department of Alcohol and Drug
Addiction Services; Ohio Department of Aging; Ohio Department of Agriculture; Ohio Department of Commerce; Ohio Department of Development; Ohio
Department of Developmental Disabilities; Ohio Department of Education; Ohio
Department of Health; Ohio Department of Insurance; Ohio Department of Job and Family Services; Ohio Department of Mental Health; Ohio Department of
Natural Resources; Ohio Department of Public Safety; Ohio Department of Rehabilitation and Correction; Ohio Department of Taxation; Ohio Department of
Transportation; Ohio Department of Youth Services; Ohio Environmental Protection Agency; Ohio Environmental Review Appeals Commission; Ohio Ethics
Commission; Ohio Expositions Commission; Ohio Legal Rights Services; Ohio
Library Board; Ohio Liquor Control Commission; Ohio Lottery Commission; Ohio Manufactured Homes Commission; Ohio Medical Transportation Board; Ohio
Occupational Therapy, Physical Therapy and Athletic Trainers Board; Ohio Office of Budget and Management; Ohio Office of Inspector General; Ohio Optical
Dispensers Board; Ohio Personnel Board of Review; Ohio Public Defender; Ohio
Public Works Commission; Ohio Rehabilitation Services Commission; Ohio Respiratory Care Board; Ohio School Facilities Commission; Ohio State Barber
Board; Ohio State Board of Cosmetology; Ohio State Board of Embalmers and Funeral Directors; Ohio State Board of Optometry; Ohio State Board of Pharmacy;
Ohio State Board of Psychology; Ohio State Board of Sanitarian Registration; Ohio State Chiropractic Examiners Board; Ohio State Dental Board; Ohio State
Employment Relations Board; Ohio State Racing Commission; Ohio Tuition Trust
Authority; Ohio Veterinary Medical Licensing Board; Public Utilities Commission of Ohio; State Board of Orthotics, Prosthetics and Pedorthics; State Board of
Registration for Professional Engineers and Surveyors; and the State Medical Board of Ohio. Without their participation, this report would not have been possible.

Statewide IT Investment Summary and Analysis E-iii
Fiscal Years 2010-2011
Enterprise IT Planning
Organization of the Statewide IT Investment Summary and Analysis
Report The biennial Statewide IT Investment Summary and Analysis Report for the planning period for fiscal years 2010-2011 consists of five sub-reports. These are: Executive Summary Enterprise IT Planning Strategic IT Planning Tactical IT Planning IT Project Planning A series of appendices details supporting data and analysis. Appendices are listed under ―Contents‖ for a particular sub-report.

Statewide IT Investment Summary and Analysis E-iv
Fiscal Years 2010-2011
Enterprise IT Planning
Contents
List of Figures ...................................................................................... v
List of Appendices .............................................................................. vii
Overview ............................................................................................. 1
1. IT Budgets....................................................................................... 2
1.1 Budget Categories and Time Periods for IT Projects ..................... 2
1.2 The Enterprise IT Project Portfolio .............................................. 3
1.3 Maintenance Budget................................................................. 11
1.4 Consolidated Budget ................................................................ 16
2. Business Reference Model (BRM) Alignments ........................... 26
2.1 Level 1 BRM - Business Area Alignments ................................... 27
2.2 Level 2 BRM - Line of Business Alignments ................................ 28
3. Service Reference Model (SRM) Alignments .............................. 36
3.1 Level 1 SRM – Service Domain Alignments .................................. 37
3.2 Level 2 SRM - Service Type Alignments ..................................... 40
3.3 Observations on IT Project & Application Alignments to the SRM 43
4. Project Alignment by Technical Reference Model (TRM) .......... 46
4.1 Level 1 TRM – Service Area Alignments ..................................... 47
4.2 Level 2 TRM – Service Category Alignments ............................... 48
4.3 Observations on IT Project Alignments to the TRM ..................... 50
4.4 FEA Reference Models: Targets of Opportunity .......................... 52
5. Project Alignment by Initiatives and Collaboration ................... 55
5.1 Enterprise Initiatives ................................................................ 56
5.2 Collaborative Agencies ............................................................. 57
6. Project Alignments to Turnaround Ohio Goals ........................... 58
6.1 IT Project Alignments with Turnaround Ohio Goals .................... 58
6.2 IT Project Alignment with Turnaround Ohio Goals FY10/11 and FY 08/09 Comparison .................................................................... 60
7. Observations from a Consolidated Enterprise Perspective ....... 61

Statewide IT Investment Summary and Analysis E-v
Fiscal Years 2010-2011
Enterprise IT Planning
List of Figures
Figure E-1 IT Projects – FY10/11 Budget Groups .................................. 4
Figure E-2 IT Projects – FY10/11 Budget Category Breakdown .............. 5
Figure E-3 IT Project Budget Category Comparisons ............................. 6
Figure E-4 IT Project Budget Category Trends ...................................... 7
Figure E-5 IT Project Budget Category Distribution ............................... 8
Figure E-6 IT Project Budget Estimate Distribution by Planning Period
with Year 1 & 2 ............................................................................. 9
Figure E-7 IT Project Budget Estimate Distribution by Planning Period with the Biennium ....................................................................... 10
Figure E-8 Application Maintenance Budget – FY10/11 ........................ 11
Figure E-9 Application Maintenance Budget by Category – FY10/11 ..... 12
Figure E-10 Infrastructure Maintenance Budget – FY 10/11 ................. 13
Figure E-11 Infrastructure Maintenance by Budget Category – FY10/11 14
Figure E-12 Total Planned Maintenance .............................................. 15
Figure E-13 FY10/11 Consolidated Approved Budget ........................... 16
Figure E-14 Consolidated Budget Dollars by Biennial Planning Period ... 17
Figure E-15 Consolidated Budget Percentages by Biennial Planning Period.................................................................................................. 19
Figure E-16 Consolidated Expenditures Biennial Budget by Budget Group
.................................................................................................. 20
Figure E-17 Consolidated Expenditures Biennial Budget by Budget
Category .................................................................................... 21
Figure E-18 Consolidated Expenditures by Biennial Planning Period -
Projects ...................................................................................... 22
Figure E-19 Consolidated Expenditures by Biennial Planning Period -
Application ................................................................................. 23
Figure E-20 Consolidated Expenditures by Biennial Planning Period - Infrastructure ............................................................................. 24
Figure E-21 Total of Budget Categories .............................................. 25
Figure E-22 IT Project Alignments to BRM Business Areas ................... 27
Figure E-23 Agency Project Alignment to BRM Services for Citizens LoBs
.................................................................................................. 28
Figure E-24 Agency Project Alignment to BRM Mode of Delivery LoBs ... 29
Figure E-25 Agency Project Alignment to BRM Support Delivery of Services LoBs .............................................................................. 30
Figure E-26 Agency Project Alignment to BRM Management of Government Resources LoBs........................................................ 31
Figure E-27 Services for Citizens to Mode of Delivery Breakdown ......... 33
Figure E-28 Mode of Delivery to Services for Citizens Breakdown ......... 34
Figure E-29 IT Project Alignments to SRM Domains ............................. 37

Statewide IT Investment Summary and Analysis E-vi
Fiscal Years 2010-2011
Enterprise IT Planning
Figure E-30 Supporting IT Application Alignments to SRM Domains ...... 38
Figure E-31 Combined Alignment to SRM Service Domains, IT Projects &
Applications ................................................................................ 39
Figure E-32 Customer Services Service Domain Service Types – IT
Projects & Apps .......................................................................... 40
Figure E-33 Process Automation Services Service Domain Service Types
– IT Projects & Apps ................................................................... 40
Figure E-34 Business Management Services Service Domain Service Types – IT Projects & Apps.......................................................... 41
Figure E-35 Digital Asset Services Service Domain Service Types – IT Projects & Apps .......................................................................... 41
Figure E-36 Business Analytical Services Service Domain Service Types –
IT Projects & Apps ...................................................................... 42
Figure E-37 Back Office Services Service Domain Service Types – IT
Projects & Apps .......................................................................... 42
Figure E-38 Support Services Service Domain Service Types – IT Projects
& Apps ....................................................................................... 43
Figure E-39 IT Project Alignments to TRM Service Areas ..................... 47
Figure E-40 Service Access & Delivery Service Area Service Categories –
IT Projects .................................................................................. 48
Figure E-41 Service Platform & Infrastructure Service Area Service
Categories – IT Projects .............................................................. 48
Figure E-42 Component Framework Service Area Service Categories – IT
Projects ...................................................................................... 49
Figure E-43 Service Interface & Integration Service Area Service Categories – IT Projects .............................................................. 49
Figure E-44 Agency Program Areas Mapped to BRM Framework........... 52
Figure E-45 Biennial Comparison of Service Types............................... 53
Figure E-46 Enterprise Initiative Priorities Project Count ...................... 56
Figure E-47 Projects with Collaborating Agencies ................................ 57
Figure E-48 IT Projects with Turnaround Ohio Alignment ..................... 59
Figure E-49 Projects with Turnaround Ohio Alignment, Comparison with Previous Biennium ...................................................................... 60

Statewide IT Investment Summary and Analysis E-vii
Fiscal Years 2010-2011
Enterprise IT Planning
List of Appendices
Appendix E-A……………………………BRM Lines of Business Alignments Appendix E-B………………………………..SRM Service Types Alignments Appendix E-C………………………….TRM Service Standards Alignments Appendix E-D………….……………………………………….FEA RM Overview Appendix E-E…………………………FEA SRM Detailed Alignment Tables Appendix E-F…………………………FEA TRM Detailed Alignment Tables Appendix E-G…………………..Enterprise-Wide IT Initiative Alignments Appendix E-H……………………………………Agency Collaboration Tables Appendix E-I………………Turnaround Ohio Detailed Alignment Tables

Statewide IT Investment Summary and Analysis E-1
Fiscal Years 2010-2011
Enterprise IT Planning
Overview
This part of the Statewide IT Investment Summary and Analysis Report presents and analyzes information and concerns stated in the agency IT plans from an enterprise-wide perspective. The document contains seven major sections, as follows:
IT Budgets. Consolidated information about IT project and maintenance activity budgets.
Business Reference Model (BRM). Alignment of IT projects to the four business areas in the BRM.
Service Reference Model (SRM). Alignment of IT projects and supporting IT applications to the SRM service domains and service types.
Technical Reference Model (TRM). Alignment of IT projects to the TRM service areas and service categories.
Enterprise Initiatives & Collaborative Efforts. Alignment of IT projects to Enterprise Initiatives, and a summary of collaboration efforts identified by project planners in the agencies.
Turnaround Ohio Plan Alignment. Alignment of IT with the Governor‘s Turnaround Ohio goals.
Observations: A Consolidated Enterprise Perspective. Summary of observations from the enterprise perspective of agency plans.

Statewide IT Investment Summary and Analysis E-2
Fiscal Years 2010-2011 Enterprise IT Planning
1 IT Budgets
Each agency plan contains three high-level budget areas for two types of IT funding — planned IT projects and IT maintenance activities for applications and infrastructure. These three budget areas are:
Planned IT Projects Application Maintenance Infrastructure Maintenance
Each budget area is divided into three general IT budget groups that expand into nine budget categories. The budgets also span four time periods. This section presents summary results for each budget area, and offers a brief, consolidated summary of the three areas. From an enterprise planning perspective, the timing, amount, and type of budget funding provide a profile that helps formulate important questions about Ohio‘s IT investments and the business solutions those investments offer. During project development and implementation, this information also helps pinpoint any major funding that requires further investigation.
1.1 Budget Categories and Time Periods for IT Projects
Budgets for the budget area planned IT projects have two dimensions, budget categories and time periods. These are described in 1.1.1 and 1.1.2 below.
1.1.1 BUDGET CATEGORIES
There are nine budget categories, which can be collapsed into three budget groups — software, application/project support, and hardware. All actual expenditures and planned funding were placed according to related budget categories, listed according to their budget group below.
Software
Software Purchases and Licenses
Software Maintenance Contracts
Software Lease

Statewide IT Investment Summary and Analysis E-3
Fiscal Years 2010-2011 Enterprise IT Planning
Application/Project Support
Staff
Purchased Personal Services
Other Services and Fees
Hardware
Hardware Maintenance Contracts
Hardware Purchase
Hardware Leases
1.1.2 TIME PERIODS
Funding/Expenditures in the plans are separated into four time periods:
Expenses (i.e. prior to fiscal year 2010)
Fiscal year 2010
Fiscal year 2011
Expected (after fiscal year 2011)
The Expenses time period shows actual project costs through June 30, 2009. The amounts shown in the fiscal year 2010 and fiscal year 2011 time periods represent the budget for the project during this planning biennial, and the total for the two periods reflects the agency‘s 2010/2011 budget for the project. The amounts shown in the Expected time period are estimates of remaining project costs.
1.2 The Enterprise IT Project Portfolio
When considered in the aggregate, all IT projects in an agency plan make up the IT project portfolio for that agency. This portfolio of projects represents how state agencies plan to spend IT funds to satisfy business objectives. The same is true at an enterprise level: Combined, agency projects comprise the enterprise IT portfolio. The 75 agency IT plans that have been submitted document 370 projects either underway or planned for the 2010/2011 biennium. This enterprise portfolio of IT projects represents more than $654.4 million in funding for fiscal years 2010-2011.

Statewide IT Investment Summary and Analysis E-4
Fiscal Years 2010-2011 Enterprise IT Planning
1.2.1 IT PROJECT PORTFOLIO BY BUDGET GROUP AND CATEGORY
Figure E-1 illustrates the distribution of the total IT project portfolio and the percentage of the budget allocated to each budget group. Seventy-eight percent of the $654.4 million budget for agency IT projects is expected to be used for Application/Project Support. Software and Hardware, combined, claim just 22 percent of the budget.
Figure E-1 IT Projects – FY10/11 Budget Groups

Statewide IT Investment Summary and Analysis E-5
Fiscal Years 2010-2011 Enterprise IT Planning
Figure E-2 IT Projects – FY10/11 Budget Category Breakdown
Separating these three amounts by budget category, as is done in Figure E-2, offers additional insights:
Three categories in the Application/Project Support group — Staff, Purchased Personal Services, and Other Services and Fees — have a combined budget ($512.2M) that is slightly more than three and one-half times higher than the other six categories combined ($142.2M).
The two Lease budget categories (i.e., Hardware Lease and Software Lease) together account for zero dollars.
The budget for Purchased Personal Services category is 42.9% ($280.9M) of the total IT project funding ($654.4M) and it is approximately two times more than the next highest budgetary category, Staff (21.8% at $142.6M).
(Note: Although these figures are neither a positive nor a negative trend, the personnel mixture is a policy decision and is often influenced by temporary conditions (e.g., a large, enterprise-level program such as OAKS), organizational structures (e.g., no or very small IT staff), and other factors that may exist outside of strategic or tactical planning and decision-making.)

Statewide IT Investment Summary and Analysis E-6
Fiscal Years 2010-2011 Enterprise IT Planning
1.2.2 TRENDS BY BUDGET CATEGORY
Planning comparisons across multiple planning periods can be informative. To account for the somewhat different terminology used for the budget categories in each planning period, Figure E-3 offers a mapping table.
FY04/05 FY06/07 FY08/09 FY10/11
Hardware Data Processing and Telecommunications
Equipment
Hardware
(All categories) Hardware
(All categories)
Software
Data Processing and Telecommunications
Software
Software
(All categories) Software
(All categories)
Internal Staff Payroll Staff Staff
Purchased Solutions and Staff
Augmentation
Purchased Personal Services
Purchased Personal Services
Purchased Personal Services
Other
Other
Intrastate - OIT Services
Telecommunications Services
Other Services and Fees
Other Services and Fees
Figure E-3 IT Project Budget Category Comparisons
During the initial FY04/05 planning period, data was collected at the budget group level (e.g., hardware). Over the years as planning practices progressed within the state, a more detailed level evolved into budget categories (e.g., hardware purchases). This new level further defined agency IT plan information. Aside from the last budget category, where the Other in fiscal years 2004-2005 was split into three categories in fiscal years 2006-2007, the budget categories match closely across the four planning periods and invite comparison. Comparisons across the four planning periods are shown in Figure E-4.

Statewide IT Investment Summary and Analysis E-7
Fiscal Years 2010-2011 Enterprise IT Planning
Figure E-4 IT Project Budget Category Trends
Two particular trends can be observed from Figure E-4:
The budget for Hardware has steadily decreased over the last four planning periods from $120M in FY04/05 to $78.8M in FY10/11, a difference of $41.2M.
As a percent of the total budget, Staff experienced a greater increase (13.6% in FY04/05 to 21.8% in FY10/11) than any other budget category representing an 8.2% growth in Staff over the last four planning periods.

Statewide IT Investment Summary and Analysis E-8
Fiscal Years 2010-2011 Enterprise IT Planning
Figure E-5 IT Project Budget Category Distribution
Taking the amount in each budget category as a percentage of the total budget for a given planning period yields the results shown in Figure E-5. The analysis illustrated in Figure E-5 indicates that:
Purchased Services decreased 7.6% from 50.5% in FY08/09 to 42.9% in FY10/11 for the first time during the four planning periods that is a difference of $92.7M from $373.6M to $280.9M respectively.
The Hardware percent is 12.0% in FY10/11 which is a .9% increase from 11.1% in FY08/09.
The hardware budget dollar amount actually decreased in FY10/11 to $78.8M from $82.3M in FY08/09 due to the variance in the total budget amounts ($654.5M in FY10/11 and $739.2M in FY08/09) (See Figure E-4).

Statewide IT Investment Summary and Analysis E-9
Fiscal Years 2010-2011 Enterprise IT Planning
1.2.3 IT PROJECT PORTFOLIO BY TIME PERIOD
This section compares the distribution of the budget for IT projects in four time periods for FY06/07, FY08/09 and FY10/11. The time periods examined were the Expenses period (the period before the biennium), Year1 and Year2 (the first and second fiscal years of each planning period), and the Expected plan period (the period after the biennium). The figures beside each column bar indicate its budget estimate and its budget percentage value.
Figure E-6 IT Project Budget Estimate Distribution by Planning Period with Year 1 & 2

Statewide IT Investment Summary and Analysis E-10
Fiscal Years 2010-2011 Enterprise IT Planning
The following graph, Figure E-7, depicts the same information as Figure E-6. The difference being Figure E-7 combines Year1 and Year2 to represent the biennium (i.e. one bar for each of the three biennia).
Figure E-7 IT Project Budget Estimate Distribution by Planning Period with the Biennium
Figure E-6 and/or E-7 reveal:
There is a significant difference between Expenses at $845.9M in the FY10/11 planning period and both previous planning periods ($472.8M in FY06/07 and $351.2M in FY08/09). This would indicate one or more very large projects are nearing completion in the FY10/11 planning period (e.g. OAKS).
The FY10/11 Expected constitutes only 1.6% or $23.7 million in remaining project costs. This amount is significantly lower than the previous two Expected planning periods. One possible factor could be there was a smaller percentage of long term projects beginning during the FY10/11 biennium and carrying over into FY12/13. There are possibly more projects starting and ending during the biennium therefore not carrying over into the next biennium.

Statewide IT Investment Summary and Analysis E-11
Fiscal Years 2010-2011 Enterprise IT Planning
1.3 Maintenance Budget
The IT planning process includes identifying and budgeting for routine IT maintenance activities. Maintenance activities include all IT operations routinely performed to maintain the functionality of existing application software and IT infrastructure, and to maintain agency and user service levels. The two maintenance planning areas are Application Maintenance and Infrastructure Maintenance.
1.3.1 APPLICATION MAINTENANCE BUDGET
Application Maintenance includes all agency-IT staff activities performed to:
Maintain or update the functionality of current application software. This includes applications developed with databases, spreadsheets, word processors, etc.
Maintain service levels for the agency and its user community.
The budget breakdown for the three Application Maintenance groups is shown in Figure E-8. The breakdown shows that:
The two budget groups, Hardware and Software, combined, represent 25% of the total Application Maintenance budget.
Application/Project Support (mostly Staff and Purchased Personal Services) constitutes a significant portion of the total application maintenance budget (75% of the total).
Figure E-8 Application Maintenance Budget – FY10/11
Statewide IT Investment Summary and Analysis E-12
Fiscal Years 2010-2011 Enterprise IT Planning
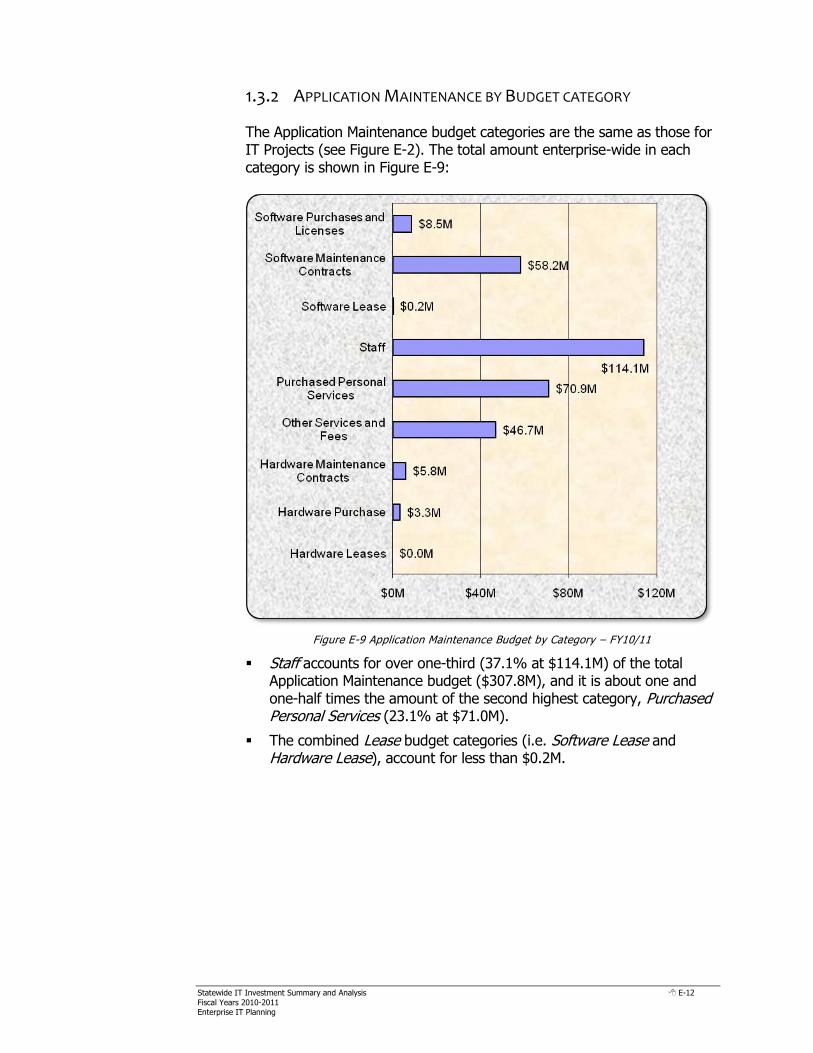
1.3.2 APPLICATION MAINTENANCE BY BUDGET CATEGORY
The Application Maintenance budget categories are the same as those for IT Projects (see Figure E-2). The total amount enterprise-wide in each category is shown in Figure E-9:
Figure E-9 Application Maintenance Budget by Category – FY10/11
Staff accounts for over one-third (37.1% at $114.1M) of the total Application Maintenance budget ($307.8M), and it is about one and one-half times the amount of the second highest category, Purchased Personal Services (23.1% at $71.0M).
The combined Lease budget categories (i.e. Software Lease and Hardware Lease), account for less than $0.2M.

Statewide IT Investment Summary and Analysis E-13
Fiscal Years 2010-2011 Enterprise IT Planning
1.3.3 INFRASTRUCTURE MAINTENANCE BUDGET
Infrastructure Maintenance comprises all agency IT staff activities regularly performed to maintain the functionality of the current IT infrastructure, such as maintaining physical computing resources and updating system software. These activities include the three maintenance budget groups: Application/Project Support, Hardware, and Software. Maintenance or upgrades of the current computing infrastructure to sustain existing service levels for the user community also is considered an infrastructure maintenance activity. Hardware and Software budget groups fall solely within this activity.
Figure E-10 Infrastructure Maintenance Budget – FY 10/11
As shown in Figure E-10, the Infrastructure Maintenance budget breakdown is somewhat reflective of the Application Maintenance budget breakdown. More specifically, the following can be observed:
The two pure infrastructure budget groups, Hardware and Software, constitute 39% of the total infrastructure maintenance budget.
Application/Project Support (mostly Staff and Purchased Personal Services) makes up a significant portion, 61%, of the total infrastructure maintenance budget.

Statewide IT Investment Summary and Analysis E-14
Fiscal Years 2010-2011 Enterprise IT Planning
1.3.4 INFRASTRUCTURE MAINTENANCE BY BUDGET CATEGORY
Infrastructure Maintenance budget categories are identical to the budget categories for IT Projects and for Application Maintenance. Figure E-11 breaks down the Infrastructure Maintenance budget by category. The following can be observed in Figure E-11:
Figure E-11 Infrastructure Maintenance by Budget Category – FY10/11
Staff accounts for approximately one-third of the total Infrastructure Maintenance budget (32%).
Other Services and Fees accounts for almost one-quarter of the total Infrastructure Maintenance budget (22.75%).
The combined Lease budget categories (i.e., Software Lease and Hardware Lease), account for $120K.

Statewide IT Investment Summary and Analysis E-15
Fiscal Years 2010-2011 Enterprise IT Planning
1.3.5 CONSOLIDATED MAINTENANCE BUDGET
Figure E-12 displays the total planned maintenance for the biennium by individual fiscal year:
MAINTENANCE
FY 10
FY 11
TOTAL
Application ($)
$153.0M
$154.7M
$307.8M
(%) 49.7% 50.3% 100%
Infrastructure ($)
$224.0M
$227.5M
$451.4M
(%) 49.6% 50.4% 100%
Total ($)
$377.0M
$382.2M
$759.2M
(%) 49.7% 50.3% 100%
Figure E-12 Total Planned Maintenance
The following can be observed from this table:
When comparing all maintenance between fiscal years [total fiscal year 2010 approved funding ($377.0M) and total fiscal year 2011 approved funding ($382.2M)] the difference is so small that no significant observations can be made relative to the two fiscal years.
When combining the total biennium dollar amounts for Application Maintenance ($307.8M) and Infrastructure Maintenance ($451.4M), infrastructure represents 59% of the maintenance total ($759.2M).

Statewide IT Investment Summary and Analysis E-16
Fiscal Years 2010-2011 Enterprise IT Planning
1.4 Consolidated Budget
This section combines the budget data presented in the three previous sections on IT Projects, Application Maintenance, and Infrastructure Maintenance. Figure E-13 below displays the total approved budget for these three major budget areas.
Figure E-13 FY10/11 Consolidated Approved Budget
The largest share of the budget is allocated for Planned IT Projects ($654.4M), followed by Infrastructure Maintenance ($451.4M), then Applications Maintenance ($307.8M). Figure E-13 also makes clear the following:
The consolidated, approved budget for IT projects is over twice as much as the budget for maintenance of existing applications.
The consolidated, approved budget for IT maintenance is approximately 54% of the entire consolidated budget for all planning categories.
Statewide IT Investment Summary and Analysis E-17
Fiscal Years 2010-2011 Enterprise IT Planning
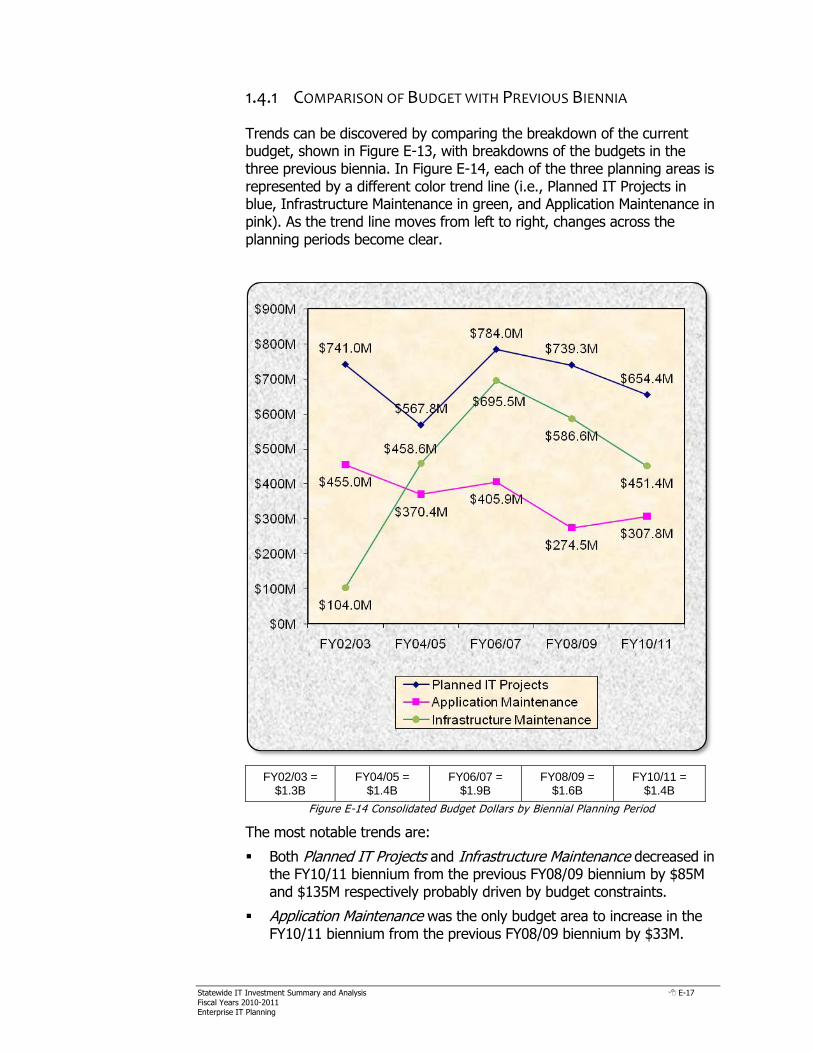
1.4.1 COMPARISON OF BUDGET WITH PREVIOUS BIENNIA
Trends can be discovered by comparing the breakdown of the current budget, shown in Figure E-13, with breakdowns of the budgets in the three previous biennia. In Figure E-14, each of the three planning areas is represented by a different color trend line (i.e., Planned IT Projects in blue, Infrastructure Maintenance in green, and Application Maintenance in pink). As the trend line moves from left to right, changes across the planning periods become clear.
FY02/03 = $1.3B
FY04/05 = $1.4B
FY06/07 = $1.9B
FY08/09 = $1.6B
FY10/11 = $1.4B
Figure E-14 Consolidated Budget Dollars by Biennial Planning Period
The most notable trends are:
Both Planned IT Projects and Infrastructure Maintenance decreased in the FY10/11 biennium from the previous FY08/09 biennium by $85M and $135M respectively probably driven by budget constraints.
Application Maintenance was the only budget area to increase in the FY10/11 biennium from the previous FY08/09 biennium by $33M.

Statewide IT Investment Summary and Analysis E-18
Fiscal Years 2010-2011 Enterprise IT Planning
Application Maintenance has the most stable budget pattern across the four planning periods with the lowest biennium budget variance ($180M) from the highest (FY02/03 - $455M) to lowest (FY08/09 - $274.5M).
Biennia total trends are:
The total FY10/11 IT budget is $1.4B which was the same amount as the total FY04/05 IT budget.
The first biennium represented on Figure E-14, FY02/03, has the lowest budget at $1.3B. The third of the five biennia listed, FY06/07, has the highest budget at $1.9B.
The largest total biennial budget increase was $.5 billion dollars realized between FY 04/05 at $1.4B and FY06/07 at $1.9.

Statewide IT Investment Summary and Analysis E-19
Fiscal Years 2010-2011 Enterprise IT Planning
Figure E-15 considers the consolidated, approved budget for each planning period and displays the breakdown for each of the three areas by the percentage of the total IT budget it received. Infrastructure Maintenance is shown in gold; Application Maintenance, in red; and Planned IT Projects, in purple.
Figure E-15 Consolidated Budget Percentages by Biennial Planning Period
Comparisons across the four biennia show that:
The percentage of spending for Application Maintenance increased for the first time from FY08/09 to FY10/11 after consecutive decreases in the four previous planning cycles.
The percentage of approved spending for Infrastructure Maintenance has been steady in the mid-30s during the last four planning periods with the largest decline (almost 5%) from FY08/09 to FY10/11.
The percentage of spending for Planned IT Projects averages out to approximately 46% of the IT budget for a planning period with almost no change between FY08/09 and FY10/11.

Statewide IT Investment Summary and Analysis E-20
Fiscal Years 2010-2011 Enterprise IT Planning
1.4.2 COMPARISON BY BUDGET GROUP
Estimated amounts for the biennium in the three budget groups — Software, Hardware, and Application/Project Support — were consolidated across the three planning areas discussed in section 1.4.1 to provide a clearer picture of how money will be spent.
Figure E-16 Consolidated Expenditures Biennial Budget by Budget Group
The results, displayed in Figure E-16, show that:
The combined Hardware and Software budget categories account for about one-quarter (28%) of the total IT budget.
Application/Project Support accounts for about three-quarters (72%) of the total IT budget.

Statewide IT Investment Summary and Analysis E-21
Fiscal Years 2010-2011 Enterprise IT Planning
1.4.3 COMPARISON BY BUDGET CATEGORY
Comparisons of budget categories also can be made across the three planning areas.
Figure E-17 Consolidated Expenditures Biennial Budget by Budget Category
As Figure E-17 shows, comparison offers the following information:
Staff was allocated the highest dollar amount ($401M) or more than one-quarter (28.6%) of the entire IT budget ($1.4B).
Purchased Personal Services was allocated the second highest dollar amount ($380.8M) representing over one-quarter (27.2%) of the total IT budget. Purchased Personal Services for IT projects alone accounts for one-fifth (20%) of the total IT budget.
The Other Services and Fees budget category is the third highest budget total (17% at $238.1M) behind the other two Application/Project Support budget categories - Staff and Purchased Personal Services.
In all but two budget categories (Purchased Personal Services and Software Lease), the amounts for Infrastructure Maintenance exceed the amounts for Application Maintenance.

Statewide IT Investment Summary and Analysis E-22
Fiscal Years 2010-2011 Enterprise IT Planning
1.4.4 COMPARISON TO PREVIOUS BIENNIUM BY BUDGET CATEGORY
AND A TOTAL OF BUDGET CATEGORIES
Cost comparisons of budget categories also can be made between FY08/09 and FY10/11 for each budget group. Figure E-18 displays projects, Figure E-19 displays applications and Figure E-20 displays infrastructure. Figure E-21 represents totals for budget categories that include all three budget groups.
Figure E-18 Consolidated Expenditures by Biennial Planning Period - Projects
The following comparisons are identified:
For projects -
The FY10/11 Software Purchases and Licenses budget category decreased from the previous biennium by over 50% while Software Maintenance Contracts increased.
The FY10/11 Staff budget category increased from the previous biennium while Purchased Personal Services decreased significantly.
Both FY10/11 Hardware Maintenance Contracts and Hardware Purchase budget categories remained approximately the same from the previous biennium.

Statewide IT Investment Summary and Analysis E-23
Fiscal Years 2010-2011 Enterprise IT Planning
Figure E-19 Consolidated Expenditures by Biennial Planning Period - Application
For applications -
The FY10/11 Software Purchases and Licenses budget category decreased from the previous biennium by 55% while Software Maintenance Contracts approximately doubled in cost.
The FY10/11 Staff budget category decreased from the previous biennium while Purchased Personal Services increased.
The FY10/11 Hardware Maintenance Contracts increased slightly from the previous biennium and Hardware Purchase decreased slightly.

Statewide IT Investment Summary and Analysis E-24
Fiscal Years 2010-2011 Enterprise IT Planning
Figure E-20 Consolidated Expenditures by Biennial Planning Period - Infrastructure
For infrastructure -
The FY10/11 Software Purchases and Licenses budget category decreased significantly from the previous biennium with a slight decrease in Software Maintenance Contracts.
Both FY10/11 Staff and Purchased Personal Services budget categories decreased from the previous biennium.
The FY10/11 Hardware Maintenance Contracts increased slightly from the previous biennium and Hardware Purchase decreased.

Statewide IT Investment Summary and Analysis E-25
Fiscal Years 2010-2011 Enterprise IT Planning
Figure E-21 Total of Budget Categories
Comparing the previous FY08/09 biennium with the FY10/11 biennium budget category total amounts provides the following information:
Only two (2) of the nine (9) budget category total amounts increased from the previous biennium. These are both Software Maintenance Contracts (24% increase - $127.2M up to $157.6M) and Hardware Maintenance Contracts (7% increase - $59.1M up to $63M).
Except for the two minimally budgeted lease categories (i.e., Software Lease and Hardware Lease) that had the largest percentage decreases from FY08/09 to FY10/11, 67% and 77% respectively, Software Purchases and Licenses experienced the most significant decrease (60% - $111.1M down to $44.7M).
Staff remained the most consistent across both biennia with a decrease of only 1%, that is, from $406.3M in FY08/09 down to $400.9M in FY10/11.

Statewide IT Investment Summary and Analysis E-26
Fiscal Years 2010-2011 Enterprise IT Planning
2 Business Reference Model (BRM)
Alignments
The BRM consists of a logical structure of government business functions, as defined by the federal government‘s Federal Enterprise Architecture (FEA) Reference Model (RM). It took little effort to adapt to this structure for Ohio as this transition was initiated in the previous biennium. In many ways, the BRM provides a grouping mechanism similar in scope and purpose to the previously-used Communities of Interest (COI) structure identified in some prior Summary and Analysis documents, although the BRM has more detail and is more clearly defined. An overview of the Federal Enterprise Architecture (FEA) Reference Model (RM) can be found in Appendix E – D. In the BRM, government business functions are placed under one of four basic Business Areas. These Business Areas then consists of 39 Lines of Business (LoB), which break down into 167 sub-functions. The four high level Business Areas are as follows:
Services for Citizens – describes the mission and purpose of the federal government in terms of the services it provides both to, and on behalf of, the American citizen (e.g., Energy, Education)
Mode of Delivery – the vehicle the government utilizes to deliver its Services for Citizens (e.g., Knowledge Creation and Management, Credit and Insurance)
Support Delivery of Services – provides the critical policy, programmatic, and managerial foundation to support federal government operations (e.g., Planning and Budgeting, Revenue Collection)
Management of Government Resources – support activities enabling the government to operate effectively and efficiently (e.g., Information and Technology Management, Financial Management)
The first two levels (Business Area and Lines of Business) were agency selections in the planning tool; therefore agency IT plans included a section for BRM alignments of IT projects. These alignments were defined by the agencies. Alignments of applications were not made at the BRM level.

Statewide IT Investment Summary and Analysis E-27
Fiscal Years 2010-2011 Enterprise IT Planning
2.1 Level 1 BRM - Business Area Alignments
2.1.1 IT PROJECT ALIGNMENTS TO BUSINESS AREAS
Figure E-22 below graphs the number of IT project alignments to each Business Area. Note that a project may be aligned to more than one Business Area.
Figure E-22 IT Project Alignments to BRM Business Areas
Findings from this graph include:
Most IT projects are aligned to the Management of Government Resources Business Area (IT projects=397). This number constitutes approximately 43% of the total number of project alignments.
This represents approximately 18% more IT project alignments than the second highest Business Area, Services for Citizens, at 232 IT project alignments or 25%.
A close third is Support Delivery of Services at 201 IT project alignments or 22%.
Mode of Delivery is aligned to the fewest number of IT projects at 96 or 10%.

Statewide IT Investment Summary and Analysis E-28
Fiscal Years 2010-2011 Enterprise IT Planning
2.2 Level 2 BRM - Line of Business Alignments
2.2.1 IT PROJECT ALIGNMENTS TO LINES OF BUSINESS
The first four graphs in this section chart the second level of the BRM – Lines of Business. The Lines of Business for each Business Area are displayed. Also displayed is the number of projects aligned to each Line of Business. Note that a project may be aligned to more than one Line of Business. Appendix E-A contains a chart listing the project alignment counts to each Line of Business within each Business Area by Agency.
Figure E-23 below graphs the number of IT projects aligned to the Lines of Business for the Services for Citizens Business Area.
Figure E-23 Agency Project Alignment to BRM Services for Citizens LoBs
Findings from this graph include:
The Lines of Business, Health and Education, have the two highest number of IT project alignments in the Services for Citizens Business Area.
The Lines of Business, General Science and Innovation and International Affairs and Commerce, have the two lowest number of IT project alignments in the Services for Citizens Business Area.

Statewide IT Investment Summary and Analysis E-29
Fiscal Years 2010-2011 Enterprise IT Planning
Figure E-24 below graphs the number of IT projects aligned to the Lines of Business for the Mode of Delivery Business Area.
Figure E-24 Agency Project Alignment to BRM Mode of Delivery LoBs
Findings from this graph include:
The Lines of Business, Regulatory Compliance and Enforcement, and Direct Services for Citizens, have the two highest number of IT project alignments in the Mode of Delivery Business Area.
The Lines of Business, Public Goods Creation and Management and Credit and Insurance, have the two lowest number of IT project alignments in the Mode of Delivery Business Area.

Statewide IT Investment Summary and Analysis E-30
Fiscal Years 2010-2011 Enterprise IT Planning
Figure E-25 below graphs the number of IT projects aligned to the Lines of Business for the Support Delivery of Services Business Area.
Figure E-25 Agency Project Alignment to BRM Support Delivery of Services LoBs
Findings from this graph include:
The Lines of Business, Controls and Oversight and General Government, have the two highest number of IT project alignments in the Support Delivery of Services Business Area.
The Lines of Business, Legislative Relations and Public Affairs, have the two lowest number of IT project alignments in the Support Delivery of Services Business Area.

Statewide IT Investment Summary and Analysis E-31
Fiscal Years 2010-2011 Enterprise IT Planning
Figure E-26 below graphs the number of IT projects aligned to the Lines of Business for the Management of Government Resources Business Area.
Figure E-26 Agency Project Alignment to BRM Management of Government Resources LoBs
Findings from this graph include:
The Lines of Business, Administrative Management and Information Technology Management, have the two highest number of IT project alignments to the Management of Government Resources Business Area.
The Lines of Business, Human Resource Management and Supply Chain Management, have the two lowest number of IT project alignment to the Management of Government Resources Business Area.

Statewide IT Investment Summary and Analysis E-32
Fiscal Years 2010-2011 Enterprise IT Planning
2.2.2 COMPARING THE RELATIONSHIP BETWEEN SERVICES FOR CITIZENS
AND MODE OF DELIVERY BUSINESS AREAS
The Services for Citizens Business Area describes the mission and purpose of the state government in terms of the services it provides both to and on behalf of Ohio citizens. The Mode of Delivery Business Area is tightly coupled with the Services for Citizens Business Area; it represents the vehicle by which the state government delivers its services to citizens.
For FY10/11, agencies were not required to make a project connection between Services for Citizens and Mode of Delivery in the planning tool. However, some agencies did make the connections which are represented in the following graphs. Figure E-27 below compares the relationship between Services for Citizens and Mode of Delivery Business Areas from the Services for Citizens perspective.

Statewide IT Investment Summary and Analysis E-33
Fiscal Years 2010-2011 Enterprise IT Planning
Figure E-27 Services for Citizens to Mode of Delivery Breakdown

Statewide IT Investment Summary and Analysis E-34
Fiscal Years 2010-2011 Enterprise IT Planning
Figure E-28 reverses the previous graph to compare the relationship between Mode of Delivery and Services for Citizens Business Areas from the Mode of Delivery perspective.
Figure E-28 Mode of Delivery to Services for Citizens Breakdown

Statewide IT Investment Summary and Analysis E-35
Fiscal Years 2010-2011 Enterprise IT Planning
Observations:
According to Figure E-27 the Environmental Management Line of Business under the Services for Citizens Business Area has the highest number of projects related to the Regulatory Compliance and Enforcement Line of Business under the Mode of Delivery Business Area. Figure E-28 is the mirrored version of this observation. The Regulatory Compliance and Enforcement Line of Business under the Mode of Delivery Business Area has the highest number of projects related to the Environmental Management Line of Business under the Services for Citizens Business Area.
Community and Social Services and Education Lines of Business had the biggest spread of Mode of Delivery Lines of Business with each relating to six out of the seven Mode of Delivery LoBs.
Regulatory Compliance and Enforcement Lines of Business had the most relationships with Services for Citizens Lines of Business relating to sixteen out of the seventeen Services for Citizens LoBs. The Mode of Delivery LoB with the next highest number of relationships to Services for Citizens LoBs was Direct Services for Citizens with fourteen relationships.

Statewide IT Investment Summary and Analysis E-36
Fiscal Years 2010-2011 Enterprise IT Planning
3 Service Reference Model (SRM)
Alignments
The SRM consists of a logical structure of services that can be provided within the context of any of the government business functions defined in the BRM. The SRM consists of 7 Service Domains, 30 Service Types, and 173 Service Components. The seven high-level Service Domains are as follows:
Customer Services
Process Automation Services
Business Management Services
Digital Asset Services
Business Analytical Services
Back Office Services
Support Services
Agency IT plans included a section for SRM alignments of IT projects. These alignments were defined by the agencies. This information is organized into two levels – Service Domains and Service Types within each Service Domain.
The IT applications catalogued in AM-I contained agency-provided descriptions. These descriptions normally had enough information for OIT to align each application to one or more Service Domain and Service Type.
Each alignment to a Service Type was counted within the higher-level Service Domain, occasionally resulting in some IT projects and applications being counted multiple times at the higher level.
IT project and application alignment results for Service Domains and Service Types are presented in the charts on the following pages in this section.
Appendix E – D Part I contains definitions of each element found in all three levels of the SRM (Service Domains, Service Types, and Service Components).

Statewide IT Investment Summary and Analysis E-37
Fiscal Years 2010-2011 Enterprise IT Planning
3.1 Level 1 SRM – Service Domain Alignments
3.1.1 IT PROJECT ALIGNMENTS TO SERVICE DOMAINS
An SRM alignment was performed against current IT projects by the agency planners. Each alignment of an IT project to the lower-level Service Type was counted once for each lower-level alignment, and where applicable, more than once at the higher-level Service Domain. This occasionally resulted in some IT projects being counted multiple times within the same higher level Service Domain. The high-level results are presented in Figure E-29.
Figure E-29 IT Project Alignments to SRM Domains
It is clear that Back Office Services continues to be the most prevalent capability provided by the IT projects.
Customer Services had the fewest alignments to SRM Domains.

Statewide IT Investment Summary and Analysis E-38
Fiscal Years 2010-2011 Enterprise IT Planning
3.1.2 IT APPLICATION ALIGNMENTS TO SERVICE DOMAINS
IT application alignments were based on simple search criteria that fit the Service Domain definitions. Each alignment of an IT application to the lower-level Service Type was counted once for each lower-level alignment, and where applicable, more than once at the higher-level Service Domain. This occasionally resulted in some IT applications being counted multiple times within the same higher level Service Domain. The high-level results are presented in Figure E-30.
Figure E-30 Supporting IT Application Alignments to SRM Domains
A significant number of the 1,500+ supporting IT application alignments can be considered Back Office Services.
Support Services, Back Office Services, and Customer Services combined make up 72% of all IT Application alignments.
Process Automation Services has the smallest percentage of IT Application alignments, which is 5%, although two other Service Domains had statistically similar alignments: Business Analytical Services and Business Management Services.

Statewide IT Investment Summary and Analysis E-39
Fiscal Years 2010-2011 Enterprise IT Planning
3.1.3 IT PROJECT AND APPLICATION ALIGNMENT CONSOLIDATED
The graph below, Figure E-31, shows the consolidation of the number of IT project and application alignments, grouped by Service Domain.
Figure E-31 Combined Alignment to SRM Service Domains, IT Projects & Applications
IT projects are more evenly aligned across the 7 Service Domains than the Applications. Back Office Services and Customer Services Service Domains have 972 application alignments, which is 62% of all application alignments.
The high variance between Customer Services and Back Office Services indicates a high degree of stability and most likely a satisfaction with applications in this group.
Service Domains with more projects than applications indicate increased implementation of capabilities in these areas.

Statewide IT Investment Summary and Analysis E-40
Fiscal Years 2010-2011 Enterprise IT Planning
3.2 Level 2 SRM - Service Type Alignments
3.2.1 IT PROJECT AND APPLICATION ALIGNMENTS TO SERVICE TYPES, CONSOLIDATED
The next 7 charts, Figures E-32 through E-38, show how many IT projects and applications are aligned with each Service Type within each Service Domain for FY 10/11. Observations for these charts follow immediately in Section 3.3. Specific IT project counts to SRM Service Types by agency are detailed in Appendix E-B. Specific project mappings to each SRM Service Type, by agency, are detailed in Appendix E-E.
Figure E-32 Customer Services Service Domain Service Types – IT Projects & Apps
Figure E-33 Process Automation Services Service Domain Service Types – IT Projects & Apps

Statewide IT Investment Summary and Analysis E-41
Fiscal Years 2010-2011 Enterprise IT Planning
Figure E-34 Business Management Services Service Domain Service Types – IT Projects & Apps
Figure E-35 Digital Asset Services Service Domain Service Types – IT Projects & Apps

Statewide IT Investment Summary and Analysis E-42
Fiscal Years 2010-2011 Enterprise IT Planning
Figure E-36 Business Analytical Services Service Domain Service Types – IT Projects & Apps
Figure E-37 Back Office Services Service Domain Service Types – IT Projects & Apps

Statewide IT Investment Summary and Analysis E-43
Fiscal Years 2010-2011 Enterprise IT Planning
Figure E-38 Support Services Service Domain Service Types – IT Projects & Apps
3.3 Observations on IT Project & Application Alignments to the SRM
The following high level observations, relative to cumulative numbers of agency IT project and application alignments are offered here:
Service Type categories with high alignments with IT project, IT application, or IT project budget totals are candidates for statewide initiatives (potential service consolidation or best practice identification) and additional IT governance. Alignments with their lower level Service Component categories may suggest a more targeted effort in this regard.
Service Type categories with low alignments with IT project, IT application, or IT project budget totals are also candidates for statewide initiatives. Low service alignment in those areas may indicate a service that requires the attention and efforts larger than is practical from a few agencies.
HIGH/LOW ALIGNMENT SUMMARY:
The top five Service Type categories by IT project count follow:
Data Management (98)
Reporting (75)
Records Management (72)
Tracking and Workflow (71)

Statewide IT Investment Summary and Analysis E-44
Fiscal Years 2010-2011 Enterprise IT Planning
Management of Process (53)
The top five Service Type categories by IT application count follow:
Customer Relationship Management (259)
Financial Management (237)
Human Resources (198)
Customer Initiated Assistance (99)
Tracking and Workflow (73)
The top five Service Type categories by combined IT project and
application count follow (Total – IT project # / application #):
Financial Management (272 – 35 / 237)
Customer Relationship Management (284 – 25 / 259)
Human Resources (208 – 10 / 198)
Data Management (150 – 98 / 52)
Tracking and Workflow (144 – 71 / 73)
The top five Service Type categories by IT project FY10/11 budget follow (FY10/11 / Lifecycle budget):
Data Management ($319M / $777M)
Document Management ($263M / $653M)
Financial Management ($257M / $592M)
Management of Process ($211M / $483M)
Records Management ($202M / $500M)
The bottom five Service Type categories by IT project count follow: Customer Preferences (3)
Investment Management (3)
Visualization (4)
Supply Chain Management (7)
Knowledge Discovery (9)
The bottom five Service Type categories by IT application count follow:
Organizational Management (6)
Forms Management (6)
Knowledge Discovery (7)
Visualization (8)
Search (11)
The bottom five Service Type categories by combined IT project and
application count follow (Total – IT project # / application #):
Visualization (12 – 4 / 8)
Knowledge Discovery (16 – 9 / 7)
Investment Management (20 – 3 / 17)
Routing & Scheduling (24 – 15 / 9)
Customer Preferences (26 – 3 / 23)

Statewide IT Investment Summary and Analysis E-45
Fiscal Years 2010-2011 Enterprise IT Planning
The bottom five Service Type categories by IT project FY10/11 budget follow (FY10/11 / Lifecycle budget):
Investment Management ($1M / $2M)
Knowledge Discovery ($3M / $5M)
Supply Chain Management ($4M / $7M)
Human Resources ($5M / $10M)
Visualization ($9M / $10M)
Specific observations relative to the service categories presented in the above section follow:
From the high alignment perspective, the Tracking and Workflow and Data Management Service Types appeared in three of the four top five sections. These two Service Types support two areas where agencies reported progress in their plans: security upgrades to safeguard information and increasing the data exchange between agencies.
From the low alignment perspective, Visualization and Knowledge Discovery Service Types appeared in all four of the bottom five sections. Both of these Service Types are found in the Business Analytical Services Service Domain. This Service Domain refers to defining the set of capabilities supporting the extraction, aggregation, and presentation of information to facilitate decision analysis and business evaluation. Combined with the high alignment of Data Management, this indicates the current focus of most agencies is on Data Management and Reporting than using the data to inform and drive decisions.
A point should be made regarding the meaning of the budgetary figures in these alignments. An IT project can have multiple SRM alignments and it is rare that most of a budgetary value should be exclusively associated with a specific SRM service component or service type. However, the budgetary figures are important. For example, an IT project that provides three significant services for $12M should be viewed differently by decision-makers than an IT project providing one of those services for $500K. Both should be considered in any decision, but the scale and impact of the larger IT project should carry more weight in any decision.

Statewide IT Investment Summary and Analysis E-46
Fiscal Years 2010-2011 Enterprise IT Planning
4 Project Alignment by Technical Reference
Model (TRM)
The TRM consists of a logical structure of technologies that can be provided in support of the services defined in the SRM. The TRM consists of 4 Service Areas, 17 Service Categories, 53 Service Standards, and 179 Service Specifications. The four high-level Service Areas are as follows:
Service Access and Delivery
Service Platform and Infrastructure
Component Framework
Service Interface and Integration
Agency IT plans included a section for TRM alignments of IT projects. These alignments were defined by the agencies at the Service Standard level (level 3 of the TRM). This information was then rolled up into the second level, Service Categories, and then rolled up again into the first level, Service Areas.
The IT applications catalogued in the AM-I Application Portfolio database occasionally contained enough information to allow an alignment with a technology component. Since this condition existed infrequently, analysis against the TRM for IT applications did not occur. Each alignment to a Service Standard was counted within the higher-level Service Category, and again at the Service Area level, occasionally resulting in some IT projects being counted multiple times at the higher levels.
IT project alignment results for Service Areas and Service Categories are presented in the charts on the following pages in this section.
Appendix E – D Part II contains definitions of each element found in three of the four levels of the TRM (Service Areas, Service Categories, and Service Standards). Definitions for the 179 Service Specifications are not included.

Statewide IT Investment Summary and Analysis E-47
Fiscal Years 2010-2011 Enterprise IT Planning
4.1 Level 1 TRM – Service Area Alignments
4.1.1 IT PROJECT ALIGNMENTS TO SERVICE AREAS
A TRM alignment was performed against current IT projects by the agency planners. Each alignment of an IT project to the lower-level Service Standard was counted once for each lower-level alignment, and where applicable, more than once at the higher-level Service Category and Service Area. This occasionally resulted in some IT projects being counted multiple times within the same higher level Service Category and Service Area. The high-level Service Area results are presented in Figure E-39.
Figure E-39 IT Project Alignments to TRM Service Areas
Results show:
Most IT projects are aligned with the Service Platform and Infrastructure Service Area.
The fewest IT projects are aligned with the Service Interface and Integration Service Area.

Statewide IT Investment Summary and Analysis E-48
Fiscal Years 2010-2011 Enterprise IT Planning
4.2 Level 2 TRM – Service Category Alignments
4.2.1 IT PROJECT ALIGNMENTS TO SERVICE CATEGORIES
The next 4 charts, Figures E-40 through E-43, show how many IT projects are aligned with each Service Category within each TRM Service Area for FY 10/11. Observations for these charts follow immediately in section 4.3. Specific agency IT project mappings to TRM Service Standard categories are detailed in Appendix E-C. Specific agency IT project mappings to TRM Service Specification categories within each Service Standard are detailed in Appendix E-F.
Figure E-40 Service Access & Delivery Service Area Service Categories – IT Projects
Figure E-41 Service Platform & Infrastructure Service Area Service Categories – IT Projects

Statewide IT Investment Summary and Analysis E-49
Fiscal Years 2010-2011 Enterprise IT Planning
Figure E-42 Component Framework Service Area Service Categories – IT Projects
Figure E-43 Service Interface & Integration Service Area Service Categories – IT Projects

Statewide IT Investment Summary and Analysis E-50
Fiscal Years 2010-2011 Enterprise IT Planning
4.3 Observations on IT Project Alignments to the TRM
The following high-level observations relative to cumulative numbers of agency IT project alignments are offered here:
Service Standard categories with high alignments with IT project or IT project budget totals are candidates for statewide initiatives (potential service consolidation or best practice identification) and additional IT governance. Alignments with lower level Service Specification categories may require a more targeted effort to achieve similar benefits.
Service Standard categories with low alignments with IT project or IT project budget totals are also candidates for statewide initiatives. Low service alignment in those areas may indicate a service that requires attention and effort greater than is practical from a few agencies.
High/Low Alignment Summary:
The top five Service Standard categories by IT project count follow:
Database (125)
Application Servers (122)
Servers/Computers (112)
Internet (92)
Web Servers (76)
The top five Service Standard categories by IT project FY10/11 budget follow (FY10/11 / Lifecycle budget):
Database ($332M / $801M)
Database Connectivity ($240M / $619M)
Internet ($260M / $588M)
Web Servers ($240M / $586M)
Application Servers ($247M / $575M)
A number of IT projects had no alignment with a TRM Service Standard or Service Specification. Consequently, those Service Standards with five or fewer IT project alignments are listed below:
Other Electronic Channels (1)
Static Display (1)
Peer to Peer (P2P) (2)
(Supporting Platforms) Platform Dependent (2)
Media Servers (3)
Embedded Technology Devices (3)
Service Description/Interface (3)
Service Discovery (3)
Dynamic/Server-Side Display (5)
Statewide IT Investment Summary and Analysis E-51
Fiscal Years 2010-2011 Enterprise IT Planning
Middleware (5)
Video Conferencing (5)
A few TRM Service Standards had a small number of IT projects with alignments, and correspondingly, had a small financial impact in those technology areas. The IT project FY10/11 and lifecycle budget follows for these projects (FY10/11 / Lifecycle budget):
Peer to Peer (P2P) ($160K / $220K)
Static Display ($383K / $383K)
Service Discovery ($415K / $1.3M)
Platform Dependent (Business Logic) ($1.1M / $4.1M)
Embedded Technology Devices ($1.2M / $1.2M)
Media Servers ($3.4M / $12.9M)
Platform Independent (Business Logic) ($4M / $8M) Specific observations relative to the service categories presented above follow:
From the high alignment perspective, it is obvious the majority of state IT projects and applications has moved onto the web browser platform and has strong ties to database capabilities. The budget estimates reinforce this conclusion, with the Database Connectivity Service Standard highlighting the emphasis on database technologies and capabilities. Finally, the high number of IT projects and budget estimates for Application Servers should be noted. Although these numbers do not indicate the degree of variance among vendors and tools, some procurement and contracting opportunities may exist here.
From the low alignment perspective, it is obvious that Service Oriented Architecture (SOA) technologies still have little presence in the State of Ohio. The low alignments to the Service Description/Interface and Service Discovery Service Standards show little activity in this technology space.
A high number of Service Type categories are related to infrastructure-related issues. Decisions that determine whether a particular IT effort should be a maintenance activity or an IT project remain inconsistent across the agencies and limit the conclusions that can be reached from the current data available.
A point should be made regarding the meaning of the budgetary figures in these alignments. An IT project can have multiple TRM alignments and it is rare that most of a budgetary value should be exclusively associated with a specific TRM Service Component or Service Type. However, the budgetary figures are important. For example, an IT project that provides three significant services for $12M should be viewed differently by decision-makers than an IT project providing one of those services for $500K. Both should be considered in any decision, but the scale and impact of the larger IT project should carry more weight in any decision.

Statewide IT Investment Summary and Analysis E-52
Fiscal Years 2010-2011 Enterprise IT Planning
4.4 FEA Reference Models: Targets of Opportunity
The initial alignments of current agency planning components to the selected FEA reference models are preliminary and should not be considered definitive. However, this first series of associations identifies some targets of opportunity for further analysis and potential collaboration.
4.4.1 BUSINESS REFERENCE MODEL (BRM)
Agency business program areas, as identified in their IT plans, were mapped to the BRM framework. Although these associations are tentative and need to be validated with the agencies, the following chart, Figure E-44, illustrates these alignments:
Business Area Line of Business Agencies Aligned
Services for Citizens
Disaster Management 11
Community & Social Services 9
Workforce Management 9
Mode of Delivery
Knowledge Creation and Management 18
Direct Services for Citizens 15
Regulatory Compliance and Enforcement
13
Support Delivery of Services
Controls and Oversight 17
General Government 15
Planning and Budgeting 11
Management of Government Resources
Administrative Management 28
Information and Technology Management
26
Financial Management 16
Figure E-44 Agency Program Areas Mapped to BRM Framework
The BRM and other components of the FEA model have the potential of yielding important and useful information on the use of IT across the enterprise. First, however, taking the following steps is suggested:
The preliminary mappings of agency business program areas to BRM lines of business should be reviewed by agencies and validated for accuracy.
The sub-function layer (the layer immediately below Line of Business) of the BRM framework should be added to the next planning cycle for agency self-alignment.
To strengthen the line of sight view of PRM to BRM to SRM to TRM, the business objectives should be linked to the business program area, and/or to the line of business or sub-function category in the BRM.
4.4.2 SERVICE REFERENCE MODEL (SRM)
Two different planning components — the supporting IT applications and IT projects — were mapped to the SRM framework. In addition to the biennial comparisons, this mapping provided an opportunity to compare

Statewide IT Investment Summary and Analysis E-53
Fiscal Years 2010-2011 Enterprise IT Planning
existing IT projects and applications with anticipated IT projects and applications.
Increases and Decreases in Alignments - Biennial comparisons, shown in Figure E-45, indicate the following service types had the largest increases and decreases in aligned IT projects:
Service Type # of Projects FY2008-2009
# of Projects FY2010-2011
Percent Change
Systems Management 3 47 1466%
Reporting 7 75 971%
Analysis and Statistics 10 50 400%
Customer Preferences 24 3 -88%
Development and Integration 205 30 -85%
Visualization 25 4 -84%
Figure E-45 Biennial Comparison of Service Types
The biennial comparisons suggest agency direction for service implementation. Increases usually indicate an unfulfilled requirement or purposeful planning, while decreases usually indicate fulfilled requirements or redirected priorities. For additional details about the SRM and the alignment to supporting IT applications and IT projects, refer to Appendix E-E. Highest Potential of Low Service Stability - The comparison between IT projects and supporting IT applications shows the highest potential of low service stability in the following service types:
Records Management (72 projects and 14 applications)
Reporting (75 projects and 20 applications)
Data Management (98 projects and 52 applications)
Organizational Management (31 projects and 6 applications)
Management of Process (53 projects and 26 applications)
Highest Potential of High Service Stability - Considering the comparison between IT projects and supporting IT applications, the following service types have the highest potential of high service stability:
Human Resources (10 projects and 198 applications)
Financial Management (35 projects and 237 applications)
Customer Relationship Management (25 projects and 259 applications)
Additional Observations - Ranking the results of the alignment effort (refer to the analysis presented in 3.3), the following additional observations are offered:
Tracking and Workflow (71 projects and 73 applications). With a high number of projects and applications, and the fact the numbers for both are very close there is a high potential for an overlap of services in this Service Type.

Statewide IT Investment Summary and Analysis E-54
Fiscal Years 2010-2011 Enterprise IT Planning
Knowledge Management (21 projects and 22 applications). There is the potential for an overlap of services with this Service Type just because the number of projects and applications are very close.
4.4.3 TECHNICAL REFERENCE MODEL (TRM)
Agencies mapped their IT projects to the TRM Service Standards. There was insufficient information about the supporting IT applications to align with the TRM framework. However, observations can be offered about the IT project alignments.
Increases in Alignments - Considering the biennial comparisons, the following service categories experienced the largest increase in aligned IT projects:
Application Servers (from 9 to 122 projects)
Reporting and Analysis (from 1 to 75 projects)
Database Connectivity (from 1 to 72 projects)
Web Servers (from 6 to 76 projects)
Wide Area Network (WAN) (from 6 to 48 projects)
Supporting Security Services (from 0 to 37 projects)
Data Transformation (from 0 to 32 projects)
Data Types / Validation (from 1 to 32 projects)
Portal Servers (from 3 to 27 projects)
Wireless / Mobile (from 0 to 19 projects)
Wireless / Mobile / Voice (from 0 to 9 projects)
Decreases in Alignments - Again considering the biennial comparisons, the following service categories showed the largest decrease in aligned IT projects:
Enterprise Application Integration (from 149 to 31 projects)
Independent Platform (from 53 to 6 projects)
Other Electronic Channels (from 19 to 1 project)
Static Display (from 13 to 1 project)
Dependent Platform (from 13 to 2 projects)
The biennial comparisons indicate agency direction for the implementation of technologies. The increases usually indicate an aging technical environment or purposeful planning, while decreases usually indicate incremental technical adjustments or redirected priorities. For additional details about the TRM and the alignment to IT projects, refer to Appendix E-F.

Statewide IT Investment Summary and Analysis E-55
Fiscal Years 2010-2011 Enterprise IT Planning
5 Project Alignment by Initiatives and
Collaboration
Some agency plans contained information relevant to IT initiatives and efforts that extend beyond organizational boundaries and into collaborative efforts with other agencies. Two different types of agency collaboration are addressed in this section. These two types are as follows:
Enterprise Initiatives IT project alignment with strategic activities and initiatives driven by statewide and high-level management.
Agency-Driven Collaborations recognized and actively pursued to facilitate success for specific IT projects.
The number of projects aligned to an initiative or strategic principle indicates the level of effort required for successful completion of the projects and the initiatives. The cost associated with the projects that are aligned to initiatives suggests the financial impact if prerequisite deliverables are not ready in time to meet the schedule of the aligned project.

Statewide IT Investment Summary and Analysis E-56
Fiscal Years 2010-2011 Enterprise IT Planning
5.1 Enterprise Initiatives
The increased emphasis on standardization and synergy of technology investments across agencies has resulted in the identification of nine enterprise initiatives. Enterprise IT initiatives focus on an enterprise-level approach to improve efficiencies, decrease costs, maximize use of resources, improve services to customers, and reduce redundancies.
Figure E-46 Enterprise Initiative Priorities Project Count
Figure E-46 shows the number of IT project alignments to each enterprise initiative. A few observations can be made from this figure: The enterprise initiative with the highest percentage of project
alignment, 21%, is the Data Privacy and Security Improvements initiative.
Enterprise initiatives ‗Enterprise Disaster Readiness Program‘ and ‗OAKS Integration or Migration‘ have the second and third highest project alignment percentages of 17% and 16% respectively.
The total number of project alignments between the two information sharing enterprise initiatives, ‗Criminal or Juvenile Justice Information Sharing‘ and ‗Electronic Health Records/Information Sharing‘, represents 15% of the projects.
Appendix E-G contains a complete listing of Enterprise-Wide IT Initiative Alignments by agency.

Statewide IT Investment Summary and Analysis E-57
Fiscal Years 2010-2011 Enterprise IT Planning
5.2 Collaborative Agencies
The last plan section for IT projects allowed agency planners to identify collaborating agencies for a project. Agency planners were allowed to identify as many agencies as applicable. For example, Figure E-41 shows there were 15 projects with 3 agencies collaborating together on each one.
Figure E-47 Projects with Collaborating Agencies
Analysis of collaboration, illustrated in Figure E-47, shows:
Seven or more collaborating agencies were identified for 19 projects. This represents an increase of 5 projects requiring the collaboration of 6 or more agencies when compared to the FY08-09 report.
The total number of projects with 2 - 5 agency collaborations decreased from 62 projects in FY08-09 to 46 projects in FY10-11.
Zero collaboration with other agencies existed for more than 80% of the IT projects. Therefore, 80% of all IT projects had no collaboration going on between agencies; only one agency worked on the project.
Appendix E-H contains a chart listing agency collaboration by project.
Statewide IT Investment Summary and Analysis E-58
Fiscal Years 2010-2011 Enterprise IT Planning
6 Project Alignments to Turnaround Ohio
Goals
6.1 IT Project Alignments with Turnaround Ohio Goals
A final perspective for an enterprise-wide view of IT planning consists of analysis of agency plan sections that address goals of the Governor‘s Turnaround Ohio Plan. In preparation for the biennial updates of the plans for fiscal years 2010-2011, OIT instructed agencies to align their IT projects with Turnaround Ohio goals and objectives. Agency planners could identify as many Turnaround Ohio objectives as applicable. Figure E-48 presents the results.

Statewide IT Investment Summary and Analysis E-59
Fiscal Years 2010-2011 Enterprise IT Planning
Figure E-48 IT Projects with Turnaround Ohio Alignment
Turnaround Ohio Goals
Goal A Restoring Transparency and Accountability to the Bureau of Workers' Compensation
Goal B Revitalizing Our Cities and Towns
Goal C Improving our Healthcare System to Benefit All Ohioans
Goal D Making Ohio a Place that Our Past and Present Military Want to Call Home
Goal E The Turnaround Ohio Government Accountability Plan
Goal F Learning for Life: High-Quality Education for High-Quality Jobs
Goal G Jobs Worthy of Ohioans
Goal H Broadband Ohio
Goal I Learning for Life: Skills for High-Quality Jobs
Goal J A Fair Start for Every Ohio Child
Goal K Powering Ohio's Energy
Thirty percent of all alignments, or 186 projects, were aligned with
‗The Turnaround Ohio Accountability Plan‘ goal.
Twenty-three percent of all alignments, or 141 projects, were aligned with ‗Restoring Transparency and Accountability to the Bureau of Workers' Compensation‘ goal.
Over half of all project alignments were aligned to the above two goals.
Appendix E-I contains a listing of Turnaround Ohio Detailed Alignments by agency and their projects.

Statewide IT Investment Summary and Analysis E-60
Fiscal Years 2010-2011 Enterprise IT Planning
6.2 IT Project Alignment with Turnaround Ohio Goals FY10/11 and FY 08/09 Comparison
Figure E-49 represents a comparison with FY2008-2009 with respect to the number of project alignments to Turnaround Ohio Goals.
Figure E-49 Projects with Turnaround Ohio Alignment, Comparison with Previous Biennium
Turnaround Ohio Goals
Goal A Restoring Transparency and Accountability to the Bureau of Workers' Compensation
Goal B Revitalizing Our Cities and Towns
Goal C Improving our Healthcare System to Benefit All Ohioans
Goal D Making Ohio a Place that Our Past and Present Military Want to Call Home
Goal E The Turnaround Ohio Government Accountability Plan
Goal F Learning for Life: High-Quality Education for High-Quality Jobs
Goal G Jobs Worthy of Ohioans
Goal H Broadband Ohio
Goal I Learning for Life: Skills for High-Quality Jobs
Goal J A Fair Start for Every Ohio Child
Goal K Powering Ohio's Energy
Between FY08/09 and FY10/11, the total number of project alignments more than tripled. One likely explanation for such a significant increase might be due to the fact that in FY10/11 agencies made alignments at the beginning of the plan development period and well in advance of the beginning of the biennium (allowing more time for review); whereas the FY08/09 alignments were made after the start of the biennium (reducing the review time).

Statewide IT Investment Summary and Analysis E-61
Fiscal Years 2010-2011 Enterprise IT Planning
7 Observations from a Consolidated
Enterprise Perspective
The following summary of observations from this document highlights the more critical issues from the enterprise perspective of agency plans. Each observation ends with a reference to the supporting report section.
There was a noticeable drop in the Purchased Services budget category, both in budget amount and percentage of the total IT budget from the previous planning periods. (1.2.2)
Previous expenses for IT projects had a much higher distribution of the IT project lifecycle budget than in previous planning periods, probably a consequence of the continued budgetary constraints. (1.2.3)
The increased alignments in the Tracking and Workflow and Data Management Services SRM categories indicate increased use of technologies and services directly related to OAKS, and highlight the benefits obtained by that initiative. (3.3 and 4.4.2)

Contact
For further information concerning items found in this report, please contact: Nadine Williams Sr. IT Planning Analyst Ohio Department of Administrative Services, Office of Information Technology [email protected] 614.466.7468

Statewide IT Investment Summary & Analysis
Fiscal Years 2010-2011
Enterprise IT Planning
Ohio Department of Administrative Services
Office of Information Technology
Ted Strickland, Governor
Hugh Quill, Director
H. Samuel Orth III, State Chief Information Officer
Published by
The Ohio Department of Administrative Services
Office of Information Technology
Investment and Governance Division
Office for State IT Investment Management
30 East Broad Street, 39th Floor
Columbus, Ohio 43215