entrepreneurial value creation: three essays …
TRANSCRIPT

ENTREPRENEURIAL VALUE CREATION: THREE ESSAYS
EXAMINING HOW ENTREPRENEURS CREATE VALUE
UNDER CONDITIONS OF UNCERTAINTY
by
Ryan Winn Angus
A dissertation submitted to the faculty of The University of Utah
in partial fulfillment of the requirements for the degree of
Doctor of Philosophy
in
Business Administration
David Eccles School of Business
The University of Utah
May 2018

Copyright © Ryan Winn Angus 2018
All Rights Reserved

T h e U n i v e r s i t y o f U t a h G r a d u a t e S c h o o l
STATEMENT OF DISSERTATION APPROVAL
The dissertation of Ryan Winn Angus
has been approved by the following supervisory committee members:
Jay Barney , Chair March 5, 2018
Date Approved
Sharon Alvarez , Member March 6, 2018
Date Approved
William Schulze , Member March 5, 2018
Date Approved
Jason Snyder , Member March 5, 2018
Date Approved
Todd Zenger , Member March 5, 2018
Date Approved
and by William Hesterly , Associate
Dean of David Eccles School of Business
and by David B. Kieda, Dean of The Graduate School.

ABSTRACT
This dissertation consists of three essays examining how entrepreneurs create
value under conditions of uncertainty. The first essay theoretically examines the process
of stakeholder enrollment through which entrepreneurs acquire critical resources for their
endeavors under informational conditions of risk and uncertainty. The second essay uses
text-based analysis methodologies to empirically examine how far entrepreneurial mobile
application developers attempting to create value do, and should, pivot in response to
performance feedback. The third essay uses text-based analysis methodologies to
empirically examine the optimal level of differentiation from the prototypical and
exemplar category members for apps published by de novo mobile application
developers.

This dissertation is dedicated to my patient and understanding wife, Mandy, my fun-
loving children Ellie, Cameron, and Spencer, and my parents, Brad and Julie.

TABLE OF CONTENTS
ABSTRACT ....................................................................................................................... iii LIST OF TABLES ............................................................................................................ vii LIST OF FIGURES ......................................................................................................... viii ACKNOWLEDGEMENTS ............................................................................................... ix Chapters 1. INTRODUCTION ...........................................................................................................1 2. ENROLLING STAKEHOLDERS UNDER CONDITIONS OF RISK AND UNCERTAINTY .................................................................................................................5
Introduction ..................................................................................................................5
Stakeholder Enrollment ...............................................................................................7
Theory Development .................................................................................................11
Discussion ..................................................................................................................17 3. ENTREPRENEURIAL PIVOTING ..............................................................................25
Introduction ................................................................................................................25
Theory and Hypotheses..............................................................................................28
Methods......................................................................................................................35
Results ........................................................................................................................40
Discussion ..................................................................................................................48
Conclusion .................................................................................................................53 4. GETTING LOST IN THE CROWD: OPTIMAL DISTINCTIVENESS STRATEGIC CATEGORIZATION, AND NEW ENTRY ON THE GOOGLE PLAY APP PLATFORM MARKET ....................................................................................................67
Introduction ................................................................................................................67
Empirical Context ......................................................................................................71
Theory and Hypotheses..............................................................................................73
Methods......................................................................................................................90
Results ........................................................................................................................99

vi
Discussion and Conclusion ......................................................................................103 5. CONCLUSION ............................................................................................................118 REFERENCES ................................................................................................................122

LIST OF TABLES
Tables
3.1 Example word vectors………………………..………………………………......55
3.2 Summary statistics…………………………………………………………….….56
3.3 Correlation coefficients…………………………….………………………….....57
3.4 Regressions on pivot distance and major pivot…..………………………….…...58
3.5 OLS regressions on app two installs………………………………………….….59
4.1 Correlations and summary statistics ……………………………………….…...110
4.2 GEE regression models with robust standard errors clustered at the developer level; dependent variable is log review counts ……………………………..….111
4.3 Logistic regression models with robust standard errors clustered at the developer
level; dependent variable is a binary indicator for apps reaching 100,000 or more downloads………………………………………………………………………113

LIST OF FIGURES
Figures
3.1 Pivot distance illustration………………………….……………………………..60
3.2 Kernel density plot of pivot distance scores…….…………………………….…61
3.3 Kernel density plot of app one installs……..………………………………….....62
3.4 Probability of a major pivot by app one installs.……...……………………...…..63
3.5 Hypothesized relationships………….…………………………………………...64
3.6 App two installs by app one installs and pivot distance…………………………65
3.7 App two installs by pivot distance and app one installs…………………………66
4.1 Scatterplot of similarity to the category prototype (centered) versus similarity to a category exemplar (centered)…………………………………………………...114
4.2 Performance analysis (predicted review count) for various levels of similarity to
the category prototype category and to an exemplary category member………115 4.3 3-Dimensional plot showing app average predicted performance (review count)
versus both prototypical and exemplar similarity scores (centered)…................116 4.4 Probability of achieving 100,000 or more downloads by prototypical and
exemplar similarity scores (centered)……………...…………………………...117

ACKNOWLEDGEMENTS
I would like to express my sincere gratitude for the time, effort, patience, and
mentoring provided by my world-class dissertation committee: Sharon Alvarez, Jay
Barney, Bill Schulze, Jason Snyder, and Todd Zenger. I would also like to thank my
outstanding co-authors Matt Barlow, Barclay Burns, Heidi Herrick, and J. Cameron
Verhaal for their efforts in helping me complete this dissertation.

CHAPTER 1
INTRODUCTION
There is growing interest among entrepreneurship and strategic management
scholars in developing a deeper understanding of how value can be created through the
introduction of new products and services. This dissertation contains three essays which
examine several different aspects of the value creation process in the context of
entrepreneurship.
The first essay theoretically examines entrepreneurial stakeholder enrollment.
Most entrepreneurial endeavors do not initially possess all of the resources they need to
successfully create a valuable opportunity. Some of the needed resources can be acquired
through simple contracts. However, other resources require the resource provider to
provide a level of effort that goes beyond that which is contractible. Such efforts often
require the resource provider to form deep psychological bonds with the entrepreneurial
endeavor. Stakeholder enrollment is the process of forming these bonds with
entrepreneurial endeavors. The target of these bonds can be either the entrepreneur
herself or the entrepreneurial opportunity being pursued. In entrepreneurial settings, these
bonds are typically formed under conditions of risk or uncertainty. Under both risk and
uncertainty, information about the entrepreneur’s experience, reputation, personality,
trustworthiness, charisma, and leadership style is available to stakeholders. However, one

2
important difference between these conditions is that, under risk, information about the
value of the opportunity is available to stakeholders whereas under uncertainty, this
information is not available. Thus, this essay first proposes that under conditions of risk,
the initial target with which a stakeholder forms psychological bonds can be the
entrepreneur, the opportunity, or a combination of both. The essay then proposes that
under conditions of uncertainty, the initial target with which a stakeholder forms
psychological bonds should be the entrepreneur—not the opportunity. These propositions
generate important implications for scholars and practitioners alike. For example, one
practical implication is that under conditions of uncertainty, the opportunity is likely to
evolve and change substantially during the creation process. If stakeholders enroll in an
uncertain opportunity (instead of enrolling in the entrepreneur), then each time
entrepreneurs engaged in a “pivot,” they would have to re-enroll stakeholders. This
implication leads directly into the second essay.
The second essay empirically examines entrepreneurial pivoting. Pivoting is
widely believed to be an important ingredient for entrepreneurial success under
conditions of uncertainty. However, it remains unclear how far entrepreneurs do—and
should—pivot to improve their chances of successfully creating value. This essay draws
on problemistic search and resource-based theory to empirically examine entrepreneurial
pivoting in the context of the Google Play app store. This empirical context allows for the
construction of a continuous measure of pivot distance using text-based analysis.
Consistent with problemistic search theory, the lower the performance (installs) of a
developer’s first app, the further the developer will pivot for its second app. And,
consistent with resource-based theory, pivot distance negatively moderates the

3
relationship between app one installs and app two installs. Further analysis reveals that
this moderating effect of pivot distance takes an inverted-u form: minor pivots
outperform major pivots and not pivoting at all. Taken together, these findings suggest
that app development entrepreneurs tend to “over-pivot” in response to negative
performance feedback and that over-pivoting has a negative effect on performance. These
findings highlight the need for caution when advising entrepreneurs to pivot without
noting the potentially harmful effects of pivoting too far.
The third essay empirically examines how entrepreneurial organizations
competing on a two-sided platform can position new products to maximize value
creation. Platforms, such as internet search engines, Amazon, Netflix, Uber, Airbnb,
video game consoles, YouTube, eBay, iTunes, and the Google Play app store are
important competitive environments in today’s economy. At least two arguments for how
a de novo organization should position its new products on platforms can be derived from
the extant literature. On the one hand, some work suggests that entrepreneurs should
conform by positioning new products in a way that is similar to other products in a
market category to obtain the benefits of legitimacy. On the other hand, another body of
work suggests that entrepreneurs should differentiate by positioning new products in a
way that is different from other products to obtain a competitive advantage. As a result,
de novo organizations competing on a two-sided platform often face uncertainty
regarding how to position their products within a market category. Furthermore, prior
work does not clearly articulate which other products within a market category should be
used as reference points when making this conformity versus differentiation decision.
This essay argues that there are two important judgment devices that organizations can

4
use to strategically categorize themselves within product market categories: the
prototypical category member and the exemplar category member. Using a unique dataset
from the Google Play mobile application store, this essay finds that the optimally distinct
point for a de novo developer’s first app is at low levels of similarity to the prototypical
app, but at high levels of similarity to an exemplar app. Moreover, the essay finds that
prototype similarity negatively moderates the positive effect of exemplar similarity such
that the more an organization aligns with the prototype, the more the organization loses
the competitive advantage gained from similarity to the exemplar. The findings have
important implications for our understanding of competitive dynamics within and across
product markets, strategic positioning at the time of market entry, and the
interdependence of strategic categorization decisions.

CHAPTER 2
ENROLLING STAKEHOLDERS UNDER CONDITIONS
OF RISK AND UNCERTAINTY1
Introduction
Entrepreneurs often need resources they do not control in order to form and
exploit opportunities (Cooper, Woo, & Dunkelberg, 1989). These resources range from
financial to human capital, from technical and marketing expertise to accounting
capabilities, and from direct social ties to indirect networks and affiliations (Freeman,
1984). Some of these resources can be obtained through simple contracts between an
entrepreneur and the stakeholders who control these resources (Argyres & Mayer, 2007).
However, other resources can be acquired only when those providing them are more
deeply committed (Klein, Molloy, & Brinsfield, 2012) to an entrepreneurial endeavor
(Shane, 2000). In entrepreneurial settings, the process of creating this deeper level of
commitment can be called stakeholder enrollment.
A substantial literature describes the various types, antecedents, and outcomes of
commitment in established organizations (Klein et al., 2012; Meyer & Herscovitch,
2001). However, none of this previous literature has examined the special challenges
associated with inducing commitment in entrepreneurial settings. These challenges
1 Reprinted with permission from John Wiley and Sons. License number 4262710670121.

6
reflect, among other things, the informational context within which enrollment occurs.
For example, recent research has identified two informational settings that have an
important impact on the opportunity-formation process—risk (where decision makers
know the possible outcomes of their choices and the probability of those outcomes) and
uncertainty (where decision makers know neither the possible outcomes nor their
probability) (Alvarez & Barney, 2007a). It may well be the case that the process of
enrolling stakeholders in entrepreneurial endeavors varies depending on whether a setting
is risky or uncertain.
The purpose of this article is to examine how the process of enrolling stakeholders
varies as a function of the informational setting within which an entrepreneur is
operating—risky or uncertain. The theory developed here suggests that different
approaches to enrollment will be more or less effective depending on whether an
entrepreneur is operating under conditions of risk or uncertainty. The article also suggests
that under conditions of risk, the ability of entrepreneurs to analyze and describe
opportunities will have a significant impact on their ability to enroll key stakeholders,
while under conditions of uncertainty, the enrollment process cannot be based on the
attributes of opportunities, but instead must be based on the attributes of the entrepreneur,
e.g., his/her charisma, trustworthiness, and reputation.
The article begins by examining the concept of stakeholder enrollment and then
suggests that the process of enrollment—both the bases upon which entrepreneurs enroll
stakeholders and the timing of the enrollment process—varies depending on the
informational context within which an entrepreneur is operating. The article generates a
series of testable propositions and concludes with a discussion of the implications of

7
these propositions for a variety of issues in the field of entrepreneurship—including the
theory of the entrepreneurial firm. In sum, this article addresses three important
theoretical gaps in the literature: (1) the role of enrollment in acquiring certain critical
resources for an entrepreneur; (2) how the enrollment process varies between conditions
of risk and uncertainty; and (3) the relationship between entrepreneurial enrollment and
more traditional research on organizational commitment (Klein et al., 2012).
Stakeholder Enrollment
The concept of stakeholder enrollment is closely related to the concept of
workplace commitment (Klein et al., 2012). However, where workplace commitment
examines the causes and consequences of psychological bonds of individuals to various
aspects of an established workplace, stakeholder enrollment focuses on these bonds in
entrepreneurial settings, where workplaces may not yet exist.
Commitment to existing workplaces
An extensive literature has explored the psychological bonds or attachments that
individuals form with organizations, groups, individual leaders, projects, goals, or even
abstract concepts within the workplace (Klein et al., 2012; Meyer & Herscovitch, 2001),
as well as the antecedents (Basu & Green, 1997; Becker, 1992; Cheng, Jiang, & Riley,
2003; Ferris et al., 2003; Guthrie & Hollensbe, 2004; Hollenbeck & Klein, 1987; Johnson
& Yang, 2010; Lok, Westwood, & Crawford, 2005; Silverthorne, 2004) and
consequences (Hollenbeck & Klein, 1987; Klein, Wesson, Hollenbeck, & Alge, 1999;
Mathieu & Zajac, 1990; Meyer, Becker, & Vandenberghe, 2004; Meyer, Stanley,

8
Herscovitch, & Topolnytsky, 2002; Rich, Lepine, & Crawford, 2010) of such bonds.
Klein et al. (2012), for example, identify four types of psychological bonds that
individuals can form with a target in the workplace, each with different behavioral
implications: acquiescence (when bonds form because individuals see few other options),
instrumental (when bonds form because individuals calculate that such bonds reduce the
risks associated with prior investments), commitment (when individuals choose to
dedicate themselves to the success of the target), and identification (when individuals
merge their identity with the identity of a target). The first two types of bonds—
acquiescence and instrumental—lead to mostly in-role behaviors with minimal extra-role
behaviors. The last two types of bonds—commitment and identification—are generally
associated with higher levels of extra-role behaviors. In this literature, extra-role
behaviors are defined as discretionary acts that go ‘above and beyond the call of duty’
when stakeholders provide resources to a target (Meyer & Herscovitch, 2001). In-role
behaviors, however, refer to a series of expected actions typically contracted for in
advance.
Despite the diverse theoretical and empirical literature on the psychological bonds
that underpin workplace commitment, to date, this work has focused on understanding
these phenomena only in the context of established workplaces (Becker, 2012). In
particular, the causes and consequences of these bonds in entrepreneurial settings have
yet to be addressed. This is the case even though entrepreneurs often need access to
stakeholder resources they do not control and even though extra-role behaviors associated
with higher levels of commitment may be important if stakeholders are going to make
their resources available to entrepreneurs under conditions of risk or uncertainty. This

9
article focuses on these issues.
Enrollment in entrepreneurial settings
It is often the case that the same kinds of deep psychological bonds that emerge
between an individual and an established workplace can also emerge between
stakeholders and an entrepreneurial endeavor. When such bonds exist and when they help
an entrepreneur gain access to critical resources, the stakeholder who has made these
resources available is said to be enrolled in this entrepreneurial endeavor.
Of course, entrepreneurs can acquire many of the resources they need from actors
who have not formed any deep psychological bonds with an entrepreneurial endeavor.
For example, fuel for an entrepreneur’s delivery van can be secured through a simple
market exchange without forming such bonds. Moreover, the first two types of bonds
identified by Klein et al. (2012)—acquiescence and instrumental bonds—do not involve
deep psychological commitments and, thus, do not typically lead to important stakeholder
extra-role behaviors. In this sense, those with these psychological bonds with an
entrepreneurial endeavor can be thought of as only weakly enrolled.
However, there are times when all that must be done for a stakeholder to make
resources available to an entrepreneurial endeavor cannot be specified ex ante.
Sometimes, for example, stakeholders and those associated with an entrepreneurial
endeavor may not know precisely which resources will be most valuable for that
endeavor, when those resources need to be made available, how they might need to be
modified, and so forth. In these settings, stakeholder actions to make resources available
to an entrepreneurial endeavor must, by definition, involve extra-role behaviors because,

10
in this setting, all the relevant roles and responsibilities in this exchange are yet to be
fully specified.
Work on organizational commitment suggests that these extra-role behaviors are
likely only when stakeholders have strong psychological bonds with an entrepreneurial
endeavor—including commitment and identity bonds (Klein et al., 2012). Stakeholders
with these deep psychological bonds can be thought of as being strongly enrolled in an
entrepreneurial endeavor. Moreover, these deep psychological bonds, to the extent that
they are valuable and rare, may also be a source of sustained competitive advantage.
Because of their socially complex nature, it may be difficult for others to imitate them at
a low cost (J. Barney, 1991).
Enrollment targets
Of the many targets of the psychological bonds to existing workplaces identified
in the organizational behavior literature (Becker, 2012; Klein et al., 2012; Meyer &
Herscovitch, 2001; Reichers, 1985), two are particularly important in an entrepreneurial
enrollment setting: the individual entrepreneur and the entrepreneurial opportunity. An
individual entrepreneur is an example of a leader as the target of these psychological
bonds (Klein et al., 2012). In practice, an entrepreneur might be a single individual or a
small team with whom stakeholders form psychological bonds. An entrepreneurial
opportunity is an example of an abstract concept as a target of these bonds (Meyer &
Herscovitch, 2001).
Alvarez and Barney (2007) define an opportunity as competitive imperfections in
product or factor markets. However, when stakeholders are enrolled to an entrepreneurial

11
endeavor, whether or not these competitive imperfections actually exist is typically not
known with certainty. In this sense, the psychological bonds that emerge between
stakeholders and an opportunity focus more on the potential for competitive
imperfections, rather than the existence of these imperfections.
Theory Development
Prior work has identified a variety of activities that entrepreneurs can engage in to
gain access to the resources they need to form and exploit opportunities. For example,
Aldrich (1999) and others (Davidsson & Honig, 2003; P. W. Roberts & Sterling, 2012;
Shane & Cable, 2002) show that entrepreneurs can use their direct and indirect social ties
to attract employees and secure external financial investments. Also, entrepreneurs can
use their business plans (Brinckmann, Grichnik, & Kapsa, 2010; Delmar & Shane, 2003),
secured intellectual property (E. B. Roberts, 1991; Shane & Stuart, 2002), external
accreditations and endorsements (Drori & Honig, 2013; Zott & Huy, 2007), and their
willingness to invest their own funds in a project (Carter & Van Auken, 1990; Gartner,
Frid, & Alexander, 2012) to obtain the resources needed to form and exploit an
opportunity. In addition, entrepreneurs can use a variety of financial incentives (Arcot,
2014; Gompers & Lerner, 1999; Kaplan & Strömberg, 2003; Kotha & George, 2012;
Ravid & Spiegel, 1997) and communication strategies to gain access to these resources
(Cable & Shane, 1997; Cornelissen & Clarke, 2010; Parhankangas & Ehrlich, 2014).
However, this prior work has failed to distinguish between access to resources
that requires simple contracts or weak form enrollment, on the one hand, and strong form
enrollment on the other hand. This work has also failed to examine the impact of the

12
informational context of an entrepreneurial endeavor on the enrollment process.
Risk and uncertainty
The distinction between risk and uncertainty was first introduced by Knight
(1921). Knight defined an informational setting as risky when those making decisions in
the setting did not know, for sure, how a decision would turn out, but did know the
possible outcomes associated with a decision and the probability of those different
outcomes occurring. An uncertain informational setting, however, is a setting where the
decision maker cannot know the possible outcomes and, thus, cannot know the
probability of these outcomes occurring. In an entrepreneurial context, risk and
uncertainty exist about whether or not an opportunity exists, the actions required to form
and exploit that opportunity, the entrepreneurial skills required to form and exploit an
opportunity, the potential for that opportunity to generate economic profits, and so forth.
Stakeholder enrollment under risk
Rarely are the outcomes of entrepreneurial endeavors known with certainty ex
ante. Thus, in this sense, stakeholder enrollment typically takes place in conditions that
are at least risky. Under conditions of risk, information about both the opportunity and
the ability of the entrepreneur to exploit that opportunity does exist, but only
probabilistically. Thus, for example, under conditions of risk, the possible outcomes
associated with an opportunity, and their probabilities, can be known ex ante, but not the
level of return an endeavor will actually generate. Moreover, while stakeholders can often
directly observe some things about an entrepreneur, such as his/her experience,

13
reputation, personality, trustworthiness, charisma, and leadership style (Gupta,
MacMillan, & Surie, 2004), they can know only probabilistically whether or not these
attributes of the entrepreneur will enable that entrepreneur to exploit a particular
opportunity.
Even though the outcomes associated with enrolling under risk can only be known
probabilistically, it is nevertheless possible for stakeholders to develop psychological
bonds with both opportunities and entrepreneurs in these settings. Stakeholders develop
these bonds with opportunities when they develop a sense of commitment and identity
with an opportunity, even if the full dimensions of that opportunity are not yet known.
Stakeholders develop these bonds with entrepreneurs when they develop a commitment
and identity with entrepreneurs even when their ultimate success (or failure) cannot be
known with certainty. These observations lead to the first proposition.
Proposition 1: Under conditions of risk, the target of stakeholder
enrollment can be the opportunity, or the entrepreneur, or both.
Later, it will be shown that Proposition 1 does not hold under conditions of
uncertainty.
It follows from Proposition 1 that the enrollment process may begin with the
entrepreneur as a target or with the opportunity as the target. This is because, under risk,
at the time enrollment takes place, stakeholders can have some information about an
opportunity or some information about an entrepreneur. These observations lead to
Proposition 2:
Proposition 2: Under conditions of risk, stakeholder enrollment may begin
with the opportunity as a target or with the entrepreneur as a target.

14
As with Proposition 1, it will be shown that Proposition 2 does not hold under
conditions of uncertainty.
Stakeholder enrollment under uncertainty
Of course, not all entrepreneurial settings are risky. When neither the possible
outcomes associated with a decision nor the probability of those outcomes is known, a
decision-making setting is uncertain (Knight, 1921). Stakeholder enrollment is very
different under conditions of uncertainty compared to conditions of risk.
Even under conditions of uncertainty, stakeholders can still know some things
about the attributes of an entrepreneur. For example, a prospective stakeholder can often
directly observe an entrepreneur’s experience, reputation, personality, trustworthiness,
charisma, and leadership style.
However, stakeholders cannot know, even probabilistically, whether these
attributes of an entrepreneur will enable him/her to exploit a particular opportunity—
because the opportunity in this uncertain setting does not yet exist. In uncertain settings,
Alvarez and Barney (2007) suggest that entrepreneurs engage in actions to endogenously
create the opportunities they ultimately exploit. One of the challenges entrepreneurs face
in this setting is that in order to act in ways that ultimately may create an opportunity to
be exploited, they may need resources they themselves do not control. Thus, to act to
create an opportunity, entrepreneurs need to enroll important stakeholders, and they must
do this before the opportunity they will ultimately exploit is known, even
probabilistically. Such opportunities are cocreated through the joint actions of
entrepreneurs and enrolled stakeholders. Only after engaging in these actions does an

15
opportunity emerge with dimensions that can be known or measured probabilistically.
It follows that to enroll stakeholders before the nature of entrepreneurial
opportunities are understood, entrepreneurs must rely on attributes of themselves, as
individuals, independent of the impact these attributes might ultimately have on their
ability to exploit an opportunity. This can happen in at least two ways (Alvarez &
Barney, 2005). First, entrepreneurs can seek to enroll stakeholders with whom they
already have prior trusting relationships. Trust is important in this context because
entrepreneurs are typically asking stakeholders to make specific investments in them—
investments that generate the potential for opportunism on the part of entrepreneurs
(Williamson, 1985). And because of uncertainty, the sources of this threat of opportunism
cannot be known ex ante and, thus, appropriate contractual protections cannot be devised.
In this setting, enrolling stakeholders who already have prior trusting relationships with
an entrepreneur set aside opportunism concerns, which can enable an entrepreneur to get
access to the resources needed to create an opportunity.
Second, stakeholders may become willing to invest in an entrepreneur in this
setting because of that entrepreneur’s charisma (Dobrev & Barnett, 2005). There is a
substantial literature in sociology and organizational behavior on the ability of dynamic
and charismatic individuals to enroll others in highly uncertain enterprises (Bass &
Riggio, 2005; Weber, 1949). Charismatic leaders are able to enroll stakeholders by
conveying a compelling vision of how the future might be created (Alvarez & Barney,
2005). Charisma is, therefore, likely to be particularly effective under conditions of
uncertainty (Weber, 1949).
These observations lead to the following proposition:

16
Proposition 3: Under conditions of uncertainty, the entrepreneur, and not
the opportunity, is the target of stakeholder enrollment.
Note that entrepreneurs, under conditions of uncertainty, are not likely to abandon
their efforts to describe the opportunities they believe they are going to exploit as a way
to enroll stakeholders. However, given uncertainty, the nature and dimensions of this
opportunity are likely to change dramatically as entrepreneurs create it. If stakeholder
enrollment relied only on these descriptions of opportunities, then each time
entrepreneurs engaged in a ‘pivot’ (Arteaga & Hyland, 2013), they would have to re-
enroll all their key stakeholders. Some re-enrollment is probably likely whenever the
espoused opportunity is changed. But with trust and charisma in place, this enrollment
process is much simpler post-pivot than would be the case if enrollment were based
solely on attributes of the espoused opportunity.
This logic has an important impact on the processes by which enrollment takes
place. For example, because entrepreneurs cannot reliably anticipate the return potential
of opportunities under conditions of uncertainty, they cannot use the opportunity as the
target of enrollment. This means that, under uncertainty, enrollment in an opportunity
must come after enrollment in an entrepreneur. This logic leads to the last proposition:
Proposition 4: Under conditions of uncertainty, enrollment in an
entrepreneur precedes enrollment in an opportunity.
Evolution of uncertainty and risk
Of course, uncertain situations can evolve into risky situations. This can happen
as entrepreneurs gain additional information about the opportunities they are seeking to

17
exploit. Risky situations may also evolve into uncertain situations. This can happen when
changes in technology, consumer tastes, or other environmental conditions generate
settings where neither the possible outcomes associated with a decision nor their
probability can now be known ex ante.
The fact that the informational conditions associated with an opportunity can
change suggests that enrollment processes that enable access to resources during one time
period may actually reduce the chances for success in another time period. For example,
entrepreneurs who are very skilled at enrolling stakeholders under conditions of risk may
find those same skills to be less effective if a risky situation becomes uncertain. The same
is true for those skilled in these activities under conditions of uncertainty who find
themselves under conditions of risk. Thus, the skills that can make an entrepreneur
successful in enrolling stakeholders under conditions of uncertainty—including personal
charisma and the ability to learn quickly and pivot—may be ineffective as the decision-
making situation evolves from uncertainty to risk. This may be one reason it is not
uncommon for sources of later stage funding to insist that founders—individuals with
uncertainty-appropriate enrollment skills—be replaced by more professional managers—
individuals with more risk-appropriate enrollment skills—as the informational context of
an opportunity changes (Hellmann & Puri, 2002).
Discussion
This article began by acknowledging the importance of stakeholder enrollment in
the success of entrepreneurial endeavors. The article then reviewed the information
conditions of risk and uncertainty under which entrepreneurs commonly operate and

18
developed a series of propositions. These general arguments fill several important
theoretical gaps in the literature and have a variety of implications for the study of
entrepreneurship, for the practice of entrepreneurship, and for related academic
disciplines.
Implications for entrepreneurship process research
Much entrepreneurship research focuses on the attributes of entrepreneurs
(Nicolaou, Shane, Cherkas, Hunkin, & Spector, 2008) or entrepreneurial organizations
(Lumpkin & Dess, 1996) and the implications of these attributes for a variety of
entrepreneurial outcomes—including survival, the level of innovation, profitability, and
so forth. Relatively less attention has been focused on the processes that link the
attributes of entrepreneurs and entrepreneurial organizations with entrepreneurial
outcomes. The process of enrollment, contingent on the informational context an
entrepreneur is operating in, is largely determinative of entrepreneurial outcomes.
Enrollment under risk focuses on the attributes of the opportunity to be exploited,
the valuable, rare, and costly to imitate capabilities of the entrepreneur, or both. Under
conditions of risk, the process of enrollment to an opportunity may precede enrollment to
an entrepreneur, or vice versa. Both these conclusions depend on information about the
opportunity and/or the entrepreneur being known, probabilistically, ex ante.
Under conditions of uncertainty, enrollment in an entrepreneur precedes
enrollment in an opportunity and builds on prior trusting relationships and the personal
charisma of an entrepreneur. Thus, in this setting, stakeholders enroll—with the
entrepreneur as the target—before the opportunity they will ultimately exploit is known,

19
even probabilistically.
Of course, the enrollment process is more difficult to study than the attributes of
entrepreneurs and entrepreneurial organizations, on the one hand, and entrepreneurial
outcomes on the other hand. However, these processes are the underlying causal
mechanisms that link inputs to outputs and, thus, their study is essential to enhancing our
understanding of entrepreneurial performance, broadly defined.
Not surprisingly, the emphasis on process also implies an emphasis on the social
underpinnings of entrepreneurial activities. Much of the current entrepreneurship research
focuses on the implications of technological innovation. The theory developed in this
article suggests that such innovation is, in fact, an outcome of an entrepreneurial process
of enrolling the stakeholders needed to exploit that opportunity. In this sense,
technological innovation is the effect of an entrepreneurial process, not the cause of that
process or the cause of entrepreneurial outcomes.
And the stakeholder enrollment process—especially under conditions of
uncertainty—grows out of deeply social roots. Enrollment under uncertainty builds on
trusting social relations and charismatic leadership. In this sense, it is the essentially
social elements of relationships that make technological innovation possible, especially
under conditions of uncertainty. That is, the study of entrepreneurship—especially under
uncertainty—is the study of how social groups are formed, how they evolve, and,
ultimately, how they perform.

20
Implications for the theory of the entrepreneurial firm
Discussion of the process of enrolling critical stakeholders in order to form and
exploit an opportunity link the theory developed here with broader questions about the
entrepreneurial theory of the firm, i.e., when entrepreneurial firms will be formed, what
their size and scope will be, etc. Under conditions of risk, most extant theories of the
firm—including transactions cost economics (Williamson, 1985), incomplete contract
theory (Hart & Moore, 1990), and resource-based theories of the firm (Conner, 1991)—
seem likely to apply. This is because under conditions of risk, enrollment in an
opportunity may precede enrollment to an entrepreneur, or vice versa. This means that
the enrollment process unfolds in a setting where the value of an opportunity can be
known, at least probabilistically, and, thus, that many of the transactional hazards that
might be associated with collaborating with an entrepreneur to exploit an opportunity can
also be known ex ante, at least probabilistically. In this setting, decisions about whether
or not to create a firm can be based on knowable threats of opportunism (consistent with
transactions cost logic), knowledge about who has the most to gain from a particular
transaction (consistent with incomplete contracts logic), and knowledge about who has
the most valuable, rare, and costly to imitate capabilities (consistent with resource-based
logic). Under risk, all this information can be known, probabilistically, ex ante, and
appropriate decisions about firm boundaries can be made.
This is not likely to be the case under conditions of Knightian uncertainty. Under
uncertainty, the value of a transaction is not known ex ante and, thus, potential sources of
opportunism in exploiting that opportunity cannot be known ex ante. Under uncertainty,
the thing that is not known is who has the most to gain from an opportunity; the value,

21
rarity, and inimitability of resources and capabilities cannot be known either. Under
Knightian uncertainty, an entirely different basis for forming an entrepreneurial firm may
be required.
Alvarez and Barney (2005) show that transactions cost and incomplete contracts
theories of the firm can be modified to apply under conditions of Knightian uncertainty.
However, the implications of these modifications for our understanding of how
entrepreneurial firms arise—if they arise—have not yet been fully discussed. The
arguments developed in this article parallel Alvarez and Barney (2005) in their emphasis
on trusting prior relationships and entrepreneurial charisma which, taken together, may
ultimately lead to the creation of a theory of the entrepreneurial firm (under uncertainty)
as opposed to the theory of the entrepreneurial firm (under risk).
Implications for workplace commitment research
Although the term enrollment is not used, organizational behavior scholars
provide insight about the psychological bonds that individuals form with various targets
in the workplace. In particular, organizational behavior scholars consider different types
of bonds that vary in degree of psychological involvement or emotional and cognitive
association. All types of psychological bonds between an individual and a target can be
weak or strong. Although the role of psychological bonds in entrepreneurial settings has
yet to be studied, the theory developed in this article suggests that different approaches to
enrollment will be more or less effective depending on whether the entrepreneur is
operating under conditions of risk or uncertainty.
It can be difficult to facilitate the development of a particular type of bond even

22
under conditions of risk. This challenge is exacerbated under conditions of uncertainty
where neither the possible outcomes associated with a decision nor the probability of
those outcomes is known. Indeed, it is this uncertainty that excludes instrumental bonds
(Klein et al., 2012) from consideration as enrolled—or at best only weakly enrolled—in
uncertain entrepreneurial endeavors.
The entrepreneur’s challenge under uncertainty, then, is to develop strong—
identification or commitment (Klein et al., 2012)—bonds between stakeholders and some
aspect of their entrepreneurial endeavor. Moreover, this article suggests that under
uncertainty, this target must be, at least initially, the entrepreneur. This is because the
entrepreneur needs stakeholders who are willing to make resources available in order to
create opportunities and, thus, cannot use opportunities to enroll those stakeholders. It is
through these strong bonds that stakeholders engage in extra-role behaviors crucial to an
entrepreneurial endeavor.
Implications for precommitment
The arguments presented in this article also have important implications for the
concept of precommitment (Sarasvathy, 2001). In her (2001) work, Sarasvathy states that
precommitments from stakeholders are an important way to help entrepreneurs reduce
uncertainty and establish barriers to entry. According to this view, entrepreneurs do not
sell a predetermined vision or goal to stakeholders but instead allow stakeholders who
choose to make precommitments to participate in the shaping of the entrepreneurial
endeavor (Sarasvathy, 2008). Thus, precommitments are a way that stakeholders can
make resources available to entrepreneurs creating opportunities.

23
But why do these stakeholders precommit? This article develops a theory of why
stakeholders may precommit to an entrepreneurial endeavor—precommitments are the
result of strong psychological bonds that can emerge between stakeholders and
entrepreneurial endeavors, i.e., the stakeholder enrollment process is the cause of
precommitment. The theory developed here also suggests what the targets of enrollment
might be (i.e., the opportunity or the entrepreneur) and how this process is likely to
change under conditions of risk versus uncertainty.
There is little doubt that precommitment, as discussed by Sarasvathy (2008), is
important in many entrepreneurial settings. But understanding why stakeholders might
precommit, who (or what) they might precommit to, and how the process of
precommitment varies in different informational settings is central to understanding the
cocreation and exploitation of entrepreneurial opportunities.
Empirical implications
The propositions derived from the theory developed in this article are inherently
testable. Future empirical work will need to identify conditions that are risky and
conditions that are uncertain and then examine the process by which enrollment occurs in
these different settings and the outcomes of these processes. It is likely that this research
will include both quantitative and qualitative dimensions—the quantitative to measure,
for example, the outcomes of the enrollment process, and the qualitative to examine the
process of enrollment (Alvarez & Barney, 2013; Alvarez, Young, & Woolley, 2015).

24
Implications for entrepreneurial practice
These arguments also have important implications for entrepreneurial practice.
First, they suggest that there is no ‘one best way’ of doing entrepreneurship. While it is
possible for enrollment in an opportunity to precede enrollment in an entrepreneur under
conditions of risk, stakeholder enrollment to an entrepreneur precedes enrollment to an
opportunity under conditions of uncertainty. While focusing on the attributes of the
opportunity and/or entrepreneur in order to enroll stakeholders is perfectly reasonable
under conditions of risk, using preexisting trusting relationships and personal charisma to
enroll people under conditions of uncertainty is perfectly reasonable under conditions of
uncertainty. Any prescription that fails to recognize these informational contingencies
seems destined to be misleading, at least some of the time.
Of course, this article has examined just one contingency that can have an impact
on the efficacy of entrepreneurial processes—risk versus uncertainty. It seems likely that
many other such contingencies exist for entrepreneurs. Ultimately, the advice given to
entrepreneurs and the content of the class material students read, need to be much more
contextual than is often the case.
CHAPTER 3
ENTREPRENEURIAL PIVOTING
Introduction
There is increasing interest among scholars (Grimes, 2018; Navis & Ozbek, 2016;
Teece, 2014) and practitioners (Blank & Dorf, 2012; Ries, 2011) in the role “pivoting”
plays in the development of entrepreneurial endeavors. Although the term has yet to be
precisely defined, pivoting logic suggests that because entrepreneurship is often an
uncertain undertaking (Alvarez & Barney, 2010; Alvarez, Barney, & Anderson, 2013),
entrepreneurs are likely to receive negative performance feedback (Eggers & Song, 2015;
Hall & Woodward, 2010). When they receive negative feedback, this logic suggests that
entrepreneurs must pivot by making changes to products, strategies, and/or business
models to improve performance (Navis & Ozbek, 2016; Ries, 2011; Teece, 2014). Thus,
this logic implies that pivoting is often an essential element of entrepreneurial success.
Unfortunately, absent an empirical measure of pivot distance, it remains unclear
how far entrepreneurs do—and should—pivot. Moreover, extant theory fails to provide
clear answers, particularly with regard to how far entrepreneurs should pivot to improve
their chances of success. On the one hand, problemistic search theory suggests that the
lower an endeavor’s initial performance is, the more distant its subsequent search (i.e.,
pivot) will be (Baum & Dahlin, 2007; Cyert & March, 1963; Desai, 2016; Greve, 1998;

26
Levinthal, 1997; March & Simon, 1958). This literature further implies that such a
response is optimal: distant, nonlocal search (called “major pivots” in this paper) should
be particularly beneficial to low-performing endeavors in rugged search landscapes
(Baum & Dahlin, 2007; Cyert & March, 1963; Desai, 2016; Greve, 1998; Levinthal,
1997; March & Simon, 1958). On the other hand, resource-based theory implies that
major, unrelated pivots will often fail to exploit any potentially valuable knowledge,
capabilities, or other resources an endeavor may have developed in its early efforts (J.
Barney, 1991; Chatterjee & Wernerfelt, 1991; Peteraf, 1993; Wernerfelt, 1984). Instead,
“minor pivots” that are related to the endeavor’s early efforts should increase the chances
of success more than major pivots.
The purpose of this paper is to empirically examine how far entrepreneurs do, and
should, pivot in the context of the Google Play mobile application store. This context
enables the creation of a pivot distance measure. Using text-based analysis (Hoberg &
Phillips, 2010), a continuous measure of product pivot distance is constructed by
determining how different a development endeavor’s second app is from its first app.
This measure reliably enables the calculation of product pivot distance both within and
between app developers and shows that developers tend to make distant, major product
pivots.
The paper first hypothesizes and provides evidence that an endeavor’s initial
performance and pivot distance are negatively related. The probability of a major product
pivot decreases from 51.1% to 40.9% depending on whether a developer’s first app has
100 or 10,000 installs, respectively. This finding, coupled with the observation that the
average first app has 100 installs, helps explain developers’ tendency to make distant,

27
major product pivots. Thus, app developers generally behave in a way that is consistent
with problemistic search theory’s implication that the lower the initial performance, the
greater the pivot (Cyert & March, 1963; March & Simon, 1958).
The paper then develops a set of competing hypotheses to explore how pivot
distance moderates the relationship between an endeavor’s initial performance and its
post-pivot performance. Consistent with resource-based theory (J. Barney, 1991;
Wernerfelt, 1984), it is first shown that pivot distance negatively moderates the positive
relationship between first app installs and second app installs. Further analysis reveals
that the moderating effect of pivot distance takes an inverted-u form. Minor product
pivots are associated with higher second app installs than major pivots or not pivoting in
any meaningful way. Developers that make minor product pivots publish second apps
that have up to 3.8 times more installs than developers that make major product pivots
and up to 2.4 times more installs than developers that do not pivot in any meaningful
way. Thus, consistent with problemistic search theory (Cyert & March, 1963; March &
Simon, 1958), some degree of pivoting is beneficial. However, consistent with resource-
based theory (J. Barney, 1991; Wernerfelt, 1984), pivoting too far can have harmful
effects.
Together, these findings show that app developers tend to “over-pivot” in
response to negative performance feedback and that over-pivoting has a negative effect
on future performance outcomes. Thus, this paper cautions against advising entrepreneurs
to pivot without noting the potentially harmful effects of pivoting too far.

28
Theory and Hypotheses
Prior work on pivoting
Entrepreneurial pivoting was popularized by Eric Ries’ (2011) book The Lean
Startup. In his book, Ries develops a lean startup methodology through which
entrepreneurs experiment, learn, pivot, and experiment again until they eventually
(hopefully) succeed. He defines a pivot as “a structured course correction designed to test
a new fundamental hypothesis about the product, strategy, and engine of growth” (Ries,
2011, p. 149). Thus, Ries’ work argues that fundamental (i.e., major) pivots can
systematically improve an entrepreneur’s odds of success. This perspective has been
widely adopted by the popular press (Arteaga & Hyland, 2013; Blank & Dorf, 2012;
Chapman, 2012; Furr & Ahlstrom, 2011; McGinn, 2012; Zwilling, 2011) and the
university classroom (Blank, 2013).
Interest in entrepreneurial pivoting is also growing in the scholarly literature (Al-
Aali & Teece, 2014; Bhawe, Rawhouser, & Pollack, 2016; Burns, Barney, Angus, &
Herrick, 2016; Grimes, 2018; Navis & Ozbek, 2016; Pontikes & Barnett, 2015, 2016;
Teece, 2014; Toft-Kehler, Wennberg, & Kim, 2016; Vogel, 2016). For example, recent
work on dynamic capabilities suggests that pivoting is critical to success in the volatile
environments that often characterize entrepreneurship (Al-Aali & Teece, 2014; Teece,
2014). And, in their work on entrepreneurial personality traits, entry, and opportunity
realization, Navis and Ozbek (2016) suggest that pathways to success are clouded by the
uncertainty that often characterizes entrepreneurship (Alvarez & Barney, 2007). Because
of this uncertainty, they suggest that success often hinges on entrepreneurs’ ability to
“substantively ‘pivot’ or radically transform how they enact opportunities” (Navis &

29
Ozbek, 2016). In general, prior scholarly work implies, like Ries (2011), that major
pivots are often essential to entrepreneurial success.
Pivot distance definition
Although a precise definition of pivot distance has not yet been put forth, prior
work suggests that since entrepreneurs commonly operate under uncertainty (Alvarez et
al., 2013), their initial theories of value creation often turn out to be incorrect (Felin &
Zenger, 2009). Entrepreneurs are likely to perceive the need to modify their current
theory of value creation when their current theory is performing poorly or when they
believe that a different theory would be more valuable, regardless of their current level of
performance. One way in which entrepreneurs can modify their theories of value creation
is to pivot, or make changes to their products, strategies, and/or business models (Navis
& Ozbek, 2016; Ries, 2011; Teece, 2014).
It is important to note that the word pivot assumes a fulcrum—the fixed point
around which a lever turns (Tipler & Mosca, 2007). In the case of entrepreneurial
pivoting, the fulcrum can be thought of as an endeavor’s past products, strategies, and/or
business models. Pivoting therefore implies within endeavor change. Changes made to
products, strategies, and/or business models between endeavors (as in the serial
entrepreneurship literature) are therefore not considered pivots.
Building on the points above, this paper defines pivot distance as the degree to
which an endeavor changes search direction relative to its most similar past product,
strategy, and/or business model in an attempt to increase future performance.
Thus, unlike prior work, this paper argues that pivoting is a continuous, rather

30
than a discrete choice. Entrepreneurs can choose to alter their search direction on a
continuous scale ranging from 0 degrees (no pivot) to 90 degrees (orthogonal pivot), or
anywhere in between as shown in Figure 3.1.
Of course, entrepreneurs may choose to keep pursuing their current, poorly
performing theory or give up entirely instead of pivoting. However, this paper explicitly
focuses on examining how far entrepreneurs do, and should, pivot—conditional on
having chosen to pivot. The paper draws on problemistic search and resource-based
theory to facilitate this examination. Although neither theory was developed to explain or
predict pivoting, important implications for pivoting can be derived from both.
Problemistic search theory
Problemistic search theory suggests that the lower an endeavor’s current
performance, the more distant its subsequent search efforts will be (Cyert & March,
1963; March & Simon, 1958). In other words, the less valuable a current search location
is to an endeavor, the more valuable distant search will appear to be. Thus, low
performance can help endeavors overcome local search biases in favor of more distant,
nonlocal search (Cyert & March, 1963; Levitt & March, 1988; March & Simon, 1958).
The theoretical argument that past performance and search distance are negatively related
has received considerable empirical support (Baum & Dahlin, 2007; Desai, 2016; Greve,
1998, 2003, 2008; Khanna, Guler, & Nerkar, 2016).
Problemistic search theory further suggests that distant, nonlocal search can help
entrepreneurs avoid local optima in a rugged search landscape (Baum & Dahlin, 2007;
Cyert & March, 1963; Desai, 2016; Greve, 1998; Levinthal, 1997; March & Simon,

31
1958). When an endeavor fails to discover a valuable peak at its initial search location,
searching locally is presumed to lead to similarly low performance. By engaging in
nonlocal search, an endeavor can increase its odds of discovering a valuable peak
elsewhere. This increase in odds does not require the endeavor to possess distant
foresight. It merely assumes that searching locally is likely to lead to similarly poor
performance while searching nonlocally can at least lead to the same odds of discovering
a valuable peak as a de novo entrant. Thus, this work suggests that increasing search
distance improves expected future performance.
Resource-based theory
Resource-based theory does not explicitly articulate how far an entrepreneurial
endeavor is likely to alter its search direction in response to negative performance
feedback. Instead, this theory has most often been used to explain and predict how extant
firms with resources of known value can gain and sustain competitive advantage (J.
Barney, 1991; Chatterjee & Wernerfelt, 1991; Peteraf, 1993).
However, resource-based theory does suggest that related diversification should
outperform unrelated diversification (J. Barney, 1991; Peteraf, 1993; Wernerfelt, 1984).
This is because a firm’s knowledge, capabilities, or other resources are more easily
exploited when applied to a related, rather than an unrelated, context. By building on its
existing resources, an endeavor may be able to increase its odds of creating a valuable
opportunity near its previous search location. This theoretical argument has received
considerable empirical support (Campa & Kedia, 2002; Chatterjee & Wernerfelt, 1991;
Miller, 2006). Thus, this work suggests that the more related the diversification, the

32
higher the expected performance.
Hypotheses
The first hypothesis draws on problemistic search theory to answer the question:
How far do entrepreneurs pivot? If product pivot distance is defined as the degree to
which an entrepreneurial endeavor changes the search direction for its second product
relative to its first product, then problemistic search theory implies that the lower the
endeavor’s initial performance is, the greater its pivot distance will be, on average. Thus,
Hypothesis 1. The lower the performance of an entrepreneurial endeavor’s first
product, the further it will pivot for its second product.
The second set of hypotheses seeks to answer the question: How far should
entrepreneurs pivot? More specifically, these hypotheses seek to identify the moderating
effect of pivot distance on future performance, assuming a positive relationship between
initial and future performance. Thus, these hypotheses account for past performance—an
important source of endogeneity when predicting future performance.
On the one hand, the problemistic search literature suggests that increasing search
distance should improve expected future performance. However, it remains ambiguous at
what point on a continuous scale search transitions from harmful local to beneficial
nonlocal. Additionally, it remains unclear whether an increase in search distance within
the nonlocal category would produce an increasingly positive effect or whether the
benefits of nonlocal search are constant, provided the endeavor searches a sufficient
distance away from the previous location. Thus, it is difficult to derive a precise
hypothesis for the effect of pivot distance on future performance from this literature.
33
However, this work can be interpreted to imply that searching too locally can harm future
performance outcomes and that there is little downside to searching too distantly. In other
words, there should be a generally positive relationship between search distance and
expected performance outcomes. If product pivot distance is defined as the degree to
which an entrepreneurial endeavor changes the search direction for its second product
relative to its first product, then problemistic search theory implies the following
hypothesis,
Hypothesis 2a. Pivot distance positively moderates the relationship between the
performance of an entrepreneurial endeavor’s first and second products.
On the other hand, the resource-based literature suggests that the more related the
diversification, the higher the expected performance. This is because an endeavor’s
valuable knowledge, capabilities, or other resources are more easily exploited when
applied to a related, rather than an unrelated, context. However, in the case of a nascent
entrepreneurial endeavor seeking to create value, it is unclear whether its resources are
valuable or not, particularly when the endeavor initially performs poorly. Such an
endeavor possesses only potentially valuable resources. Thus, it is also difficult to derive
a precise hypothesis for the effect of pivot distance on future performance from this
literature. However, this work can be interpreted to imply that unrelated diversification
will often fail to exploit any potentially valuable resources an endeavor may have
developed through its early efforts. Thus, resource-based theory implies that, for
endeavors with potentially valuable resources, there is no downside to diversifying in too
related a context but that diversifying in too unrelated a context can have a negative
effect on performance. In other words, there should be a generally positive relationship

34
between relatedness and expected performance outcomes. To the extent that relatedness
decreases with pivot distance, resource-based theory implies that,
Hypothesis 2b. Pivot distance negatively moderates the relationship between the
performance of an entrepreneurial endeavor’s first and second products.
An attempt to integrate the pivoting implications of problemistic search and
resource-based theory reveals two key distinctions. First, problemistic search theory
implies that making very small pivots (not pivoting in any meaningful way) should
negatively affect expected future performance while resource-based theory implies the
opposite. This implication of resource-based theory is potentially problematic. For
example, resource-based theory seems to imply that introducing a nearly identical second
product is the optimal strategy for an endeavor to increase its chances of success—even
when the first product performed exceptionally poorly. This prediction of resource-based
theory may be due, at least in part, to the fact that they theory does not provide much
guidance on the question of why, or how far, entrepreneurs choose to pivot. Intuitively,
and consistent with problemistic search theory, it seems reasonable to assume that the
endeavor will recognize the need to search in a different location if it learns that its
resources have little to no value in a specific context. In this case, resource-based theory
could be interpreted to imply that the endeavor’s resources are only potentially valuable
if applied in a different, but still related, context. Drawing on this revised interpretation of
resource-based theory, and the original interpretation of problemistic search theory:
making minor (but still related) pivots should outperform making very small pivots (not
pivoting in any meaningful way).
Second, problemistic search theory implies that endeavors cannot pivot too far

35
while resource-based theory implies that pivoting too far can negatively affect expected
future performance. This implication of problemistic search is potentially problematic.
For example, it seems to imply that the cost of sacrificed resource productivity is
negligible when pivoting to a distant, unrelated search location in which an endeavor’s
existing knowledge, skills, capabilities, and resources are not at all applicable. Intuitively,
and consistent with resource-based theory, it seems reasonable to assume that the
endeavor may be better-served by leveraging at least some of its existing resources rather
than discarding them completely and having to engage in the costly acquisition or
development of all new resources when pivoting. Thus, it could be argued that making
minor (but still related) pivots should outperform making very major, unrelated pivots.
Combining these two key distinctions between the problemistic search and
resource based theories leads to the final hypothesis,
Hypothesis 3. Pivot distance moderates the relationship between the performance
of an entrepreneurial endeavor’s first and second products. The performance of
an endeavor’s second product increases with pivot distance, but only to a point,
beyond which pivot distance has a negative effect on performance.
Methods
Data
The data source for this study is the Google Play app store
(play.google.com/store/apps), the official mobile application store for phones and tablets
running the Android operating system. Google Play is currently the world’s largest app
store in terms of number of apps offered and number of developers, generating tens of

36
billions of dollars in revenues annually (App Annie, 2017). Google Play publicly
provides rich data for each app, including the number of downloads, review score, the
number of reviews, product-market category, version updating history, and, importantly
for this study, a complete text description for each app. These data were collected on
nearly the entire contents of the Google Play app store 16 times between February, 2015
and September, 2016.
These data allow for the creation of an objective, comparable, and reliable
measure of pivot distance. Using text-based analysis (Hoberg & Phillips, 2010), a
continuous measure of product pivot distance is constructed by determining how different
a developer’s second app is relative to its first app. This setting also allows for the
observation of the sequential pivoting actions of thousands of nascent app development
endeavors within a single marketplace in a manner that is largely free from survivorship
bias. Additionally, the setting enables the study of pivoting in a dynamic, volatile
environment with a low cost of failure—precisely the type of setting in which pivoting is
believed to be a particularly valuable strategy (Ries, 2011; Teece, 2014).
This study’s sample consists of all first-time Google Play app developers that
begin by publishing one app and subsequently publish at least one additional app during
the data collection period. Only developers with “clean” data and developers that publish
apps in the English language are included. The end result is a sample consisting of
170,544 app-month observations from a cohort of 10,369 first-time app development
endeavors.

37
Measures
Dependent variables. Pivot distance is calculated by determining the distance
between the text descriptions of a developer’s first and second apps. This is done by
using basic cosine similarity, a widely accepted method for calculating the similarity
between two text documents (Hoberg & Phillips, 2010; Hoberg, Phillips, & Prabhala,
2014; Kwon & Lee, 2003). Basic cosine similarity measures the angular distance between
two non-zero vectors. Thus, each app’s text description must first be transformed into a
word vector before cosine similarities can be calculated.
To create a vector for each app’s text description, Python was used to identify
each description’s language, remove punctuation and numbers, remove stop words (e.g.,
the, a, and, etc.), remove non-English words, and stem words to their root (e.g., simulator,
simulators, simulate, simulation, simulations, all stem to ‘simul’). The end result of this
natural language processing is a vector for each app comprised of a count of the number
of times each word in an app’s text description is used. For example, Table 3.1 shows the
word vectors for the hypothetical app descriptions “The sky was bluer than blue in 1978”
and “The sky was greyish blue in 1980.”
The cosine similarity between two apps, A and B, is calculated using formula (1):
∑ ���������∑ ������ �∑ ������
(1)
In this formula, A represents the word vector for a developer’s first app, B
represents the word vector for the developer’s second app, i represents each unique word
used in the two apps’ descriptions, and n represents the total number of unique words
used in the two apps’ descriptions.

38
In order to calculate the pivot distance between apps A and B, the basic cosine
similarity is subtracted from one as shown in formula (2):
1 − ∑ ���������∑ ������ �∑ ������
(2)
Pivot distance ranges from 0.0 to 1.0. A score of 0.0 indicates that the developer’s
first and second app text descriptions are identical and that no pivot was made. A 1.0
indicates that the developer’s first and second app text descriptions do not share any
common words and that an orthogonal pivot was made. In the case of the example from
Table 3.1, the pivot distance is 0.225 – suggesting a small pivot.
Major pivot is a dummy variable indicating whether pivot distance is above or
below 0.850, the median pivot distance value.
App two installs is the number of installs a developer’s second app had generated
at the time it was last observed. Google Play provides data on how many times each app
has been installed. These data are provided in categorical format, with 19 categories of
app installs (e.g., 0, 1 to 5, 5 to 10, 10 to 50, …1 billion to 5 billion). To create this
measure, the lowest number in the categorical installs range is identified, one is added to
this number (to correct for cases with zero installs), and then this number is logged to
account for skewness. For example, if Google Play reports that a developer’s second app
has 100 to 500 installs, app two installs would be coded as log(100 + 1) = 4.615.
Independent variables. App one installs is the logged number of installs a
developer’s first app had the month before publishing its second app. The lower the
installs of a developer’s first app, the lower the performance (i.e., the more negative the
performance feedback) is assumed to be. To the extent that past performance predicts

39
future performance, it is important to account for this source of endogeneity in models
that predict app two installs.
Pivot Distance is also used as an independent variable to explain its effect on app
two installs.
Control variables. This study also includes a number of control variables.
Description length is the logged count of characters in an app’s cleansed description. App
size is the size of an app in megabytes. Free is a dummy variable indicating whether the
app is free (1) or not (0). In-app is a dummy variable indicating whether the app offers in-
app purchases (1) or not (0). App age is the number of days since an app was originally
published on Google Play. Game is a dummy variable indicating whether the app is a
game (1) or not (0). Time between apps is the number of days between when the
developer published its first app and its second app. Second apps is a count of the number
of second apps a developer publishes simultaneously after publishing its first app.
Developer max apps is the maximum number of apps a developer ends up publishing
during the data collection period. Abandoned first app is a dummy variable indicating
whether a developer released a new version of its first app (1) or not (0) after publishing
its second app. Category switch is a dummy variable indicating whether a developer’s
second app is in a category that is the same (0) or different (1) than its first app.
Controls for category effects using Google Play’s 41 unique category classifications (at
the time of this study) are included. The study also includes month fixed effects for each
time data were collected from the Google Play app store.

40
Results
Descriptive statistics
Summary statistics for this study’s measures are provided in Table 3.2 and
correlations are provided in Table 3.3.
The distribution of pivot distance scores for the second apps included in this study
is illustrated in Figure 3.2. The mean of the pivot distance distribution is 0.728 and the
median is 0.850. The left hand side of the distribution contains a small bulge,
representing cases where the developer’s first and second apps are nearly identical, with
pivot distances of less than 0.2. When interpreting pivot distance, cases with a value of
0.0 to 0.2 are called “no pivot.” The middle of the distribution, ranging from 0.2 to
0.8500 (median), is called “minor pivot.” And the right hand side of the distribution,
ranging from 0.8500 (median) to 1.0, is called “major pivot.” As shown in Figure 3.2,
app developers in this sample tend to make distant, major pivots.
Figure 3.3 presents a kernel density plot of app one installs. This measure of
installs is logged and is measured the month before publication of a developer’s second
app. The mean app one installs is 5.300 (200 installs), the median value is 4.615 (100
installs), and the maximum value is 16.118 (10 million installs). Thus, app one installs
outcomes are highly skewed. Low first app performance (i.e., negative performance
feedback) is a common occurrence in this study.
How far do entrepreneurs pivot?
To test the first hypothesis, ordinary least squares (OLS) and logistic regression
are used to assess the effect of app one installs (initial performance) on pivot distance.

41
These results are presented in Table 3.4. Robust standard errors are clustered at the
developer level. Multicollinearity is not an issue with VIF scores below 4.0. Model 1
introduces the control model and uses OLS regression to predict pivot distance. Model 2
adds the independent variable of app one installs to the OLS regression. Model 3 adds a
measure of developer ability (discussed in the alternative explanations section below).
Models 4 through 6 replicate models 1 through 3, but use logistic regression to predict the
probability of making a major pivot.
As hypothesized, the coefficient for app one installs is negative in all of the
models in Table 3.4. For example, Model 2 shows that a one unit increase in app one
installs is associated with a 0.011 decrease in pivot distance (p < 0.001). Similarly,
Model 5 finds that the relationship between app one installs and the binary major pivot
measure is also negative (beta = -0.102, p < 0.001). A one unit increase in app one
installs is associated with a 9.7% decrease in the probability of making a major pivot.
In order to aid in the interpretation of this nonlinear logistic regression (Hoetker,
2007), Figure 3.4 plots the marginal effects for Model 5 at different values of app one
installs. The marginal effects indicate that a developer with app one installs of 4.6 (100
installs) has a 51.1% probability of making a major pivot while a developer with app one
installs of 9.2 (10,000 installs) has a 40.9% probability of making a major pivot.
Together, the models from Table 3.4 show that app one installs and pivot distance are
negatively related and lend strong support to Hypothesis 1.

42
How far should entrepreneurs pivot?
To test Hypotheses 2a, 2b, and 3, ordinary least squares (OLS) regression is used
to assess the moderating effect of pivot distance on app two installs, controlling for the
positive main effect of app one installs on app two installs. This moderating effect is
illustrated in Figure 3.5 which shows the hypothesized relationships between the key
explanatory variables in this study. Table 3.5 presents the results for analysis of how far
entrepreneurs should pivot in response to negative performance feedback. These models
only include second apps that were listed on Google Play for 60 or more days to ensure
that sufficient time passed to observe variation in second app performance outcomes.
Robust standard errors are clustered at the developer level. To reduce the potential for
multicollinearity in the interaction terms included in these models, the app one installs
and pivot distance measures are mean-centered at 5.300 and 0.724, respectively. The
pivot distance squared measure is the square of the mean-centered pivot distance
measure. Multicollinearity is not an issue in these models, with VIF scores below 4.0.
Model 1 introduces the control model which includes app one installs as a predictor of
app two installs. Models 2 adds the pivot distance variable. Model 3 interacts the pivot
distance and app one installs measures to show the moderating effect of pivot distance on
app two installs. Models 4 and 5 use the binary measure major pivot instead of the
continuous measure of pivot distance. Models 6 and 7 include the effects of pivot
distance and pivot distance squared to test for the presence of a curvilinear relationship.
As expected, app one installs has a substantial and positive effect on app two
installs in Model 1 (beta = 0.354, p < 0.001), as well as the rest of the models in Table
3.5. Past performance is an important predictor of future performance.

43
Consistent with Hypothesis 2b, and contrary to Hypothesis 2a, the interaction
between app one installs and pivot distance is negative (beta = -0.109, p < 0.01) in Model
3. In addition to this moderating effect, pivot distance also has a negative main effect on
app two installs in Model 3 (beta = -0.275, p < 0.05). Similarly, in Model 5, the
interaction between app one installs and major pivot is negative (beta = -0.107, p <
0.001) and the main effect of major pivot is also negative (beta = -0.295, p < 0.001).
Thus, pivot distance negatively moderates the relationship between app one installs and
app two installs, as predicted by Hypothesis 2b.
And, consistent with Hypothesis 3, this moderating effect takes an inverted-u
shape as shown in Model 7. Figures 3.6 and 3.7 aid in the interpretation of the effects
from Model 7, given the complexities of interpreting the interactions in this model.
As shown in Figure 3.6, a mean-centered pivot distance of -0.224 (which
translates to a raw pivot distance of 0.5, a minor pivot) is associated with higher app two
installs than a pivot distance of -0.724 (raw pivot distance of 0.0, no pivot) or a pivot
distance of 0.276 (raw pivot distance of 1.0, a major pivot) when logged, mean-centered
app one installs is greater than -2.7 (which translates to 10 first app installs). When app
one installs is below -2.7, major pivots outperform minor pivots, but the effect size is
neither substantial nor meaningful.
Figure 3.7 is also derived from Model 7 and more clearly illustrates the inverted-u
moderating effect of pivot distance on app two installs, for a particular level of app one
installs. In this figure, the solid line represents an app developer that had -0.5 logged,
mean-centered app one installs (100 installs). This developer would be expected to
generate 5.366 app two installs (214 installs) if its mean-centered pivot distance was -

44
0.724 (raw pivot distance of 0.0, no pivot), 5.750 app two installs (314 installs) if its
pivot distance was -0.224 (raw pivot distance of 0.5, minor pivot), and 5.226 app two
installs (186 installs) if its pivot distance was 0.276 (raw pivot distance of 1.0, major
pivot).
The dashed line in Figure 3.7 represents an app developer that had 1.8 logged,
mean-centered app one installs (1,000 installs). This developer would be expected to
generate 6.106 app two installs (449 installs) if its mean-centered pivot distance was -
0.724 (raw pivot distance of 0.0, no pivot), 6.742 app two installs (847 installs) if its
pivot distance was -0.224 (raw pivot distance of 0.5, minor pivot), and 5.810 app two
installs (334 installs) if its pivot distance was 0.276 (raw pivot distance of 1.0, major
pivot).
The solid line with the square marker in Figure 3.7 represents an app developer
that had 4.1 logged, mean-centered app one installs (10,000 installs). This developer
would be expected to generate 6.845 app two installs (939 installs) if its mean-centered
pivot distance was -0.724 (raw pivot distance of 0.0, no pivot), 7.735 app two installs
(2,287 installs) if its pivot distance was -0.224 (raw pivot distance of 0.5, minor pivot),
and 6.392 app two installs (597 installs) if its pivot distance was 0.276 (raw pivot
distance of 1.0, major pivot). In this case, a minor pivot would produce 2.4 times more
installs than no pivot and 3.8 times more installs than a major pivot.
In sum, the results presented in Table 3.4 provide strong support for Hypothesis 1.
The lower the app one installs, the further the pivot distance. This finding, coupled with
the high probability of publishing a first app that has low app one installs (as shown in
Figure 3.3), helps explain why app developers tend to make distant, major pivots (as

45
shown in Figure 3.2).
The results presented in Table 3.5 support the rejection of Hypothesis 2a in favor
of Hypothesis 2b. Pivot distance negatively moderates the relationship between app one
installs and app two installs. At a more detailed level, and consistent with Hypothesis 3,
this moderating relationship takes an inverted-u shape. App two installs increase with
pivot distance, but only to a certain point, after which increasing pivot distance has a
negative impact on app two installs. Minor pivots outperform major pivots and not
pivoting at all.
Post hoc: alternative explanations
Selection bias. It could be argued that the results in Models 2 and 5 of Table 3.4
are driven by selection bias if low ability developers who publish less successful apps are
more likely to make major pivots than high ability developers. To account for this
alternative explanation, Models 3 and 6 add a measure of developer ability measure to the
OLS and logistic regressions. Developer ability measures a developer’s ability to
generate installs relative to its 10 closest competitors. This measure is constructed using
basic cosine similarity and app text descriptions. The text description of a developer’s
first app is compared to the text descriptions of all extant apps in its same category. The
average logged installs of the app’s 10 nearest neighbors represents the “predicted”
performance for a developer’s first app. For example, if a developer’s first app generated
6.2 logged installs (500 installs) and the average logged installs of its 10 nearest
neighbors was 2.7 (100 installs), then this developer’s ability would be 6.2 – 2.7 = 3.5,
suggesting that this is a high ability developer. If a developer’s first app generated 6.2

46
logged installs (500 installs) and the average logged installs of its 10 nearest neighbors
was 8.5 (5,000 installs), then this developer’s ability would be 6.2 – 8.5 = -2.3,
suggesting that this is a low ability developer. This measure of developer ability
complements the app one installs measure by identifying when a given number of
installs, say 500, represents a good, bad, or average outcome.
Consistent with this alternative explanation, both models show that the lower the
developer ability, the greater the pivot distance (beta = -0.006, p < 0.001 in Model 3; beta
= -0.044, p < 0.001 in Model 6). However, both models also show that the negative main
effect of app one installs on holds even when controlling for developer ability (beta = -
0.008, p < 0.001 in Model 3; beta = -0.074, p < 0.001 in Model 6). In Model 6, a one unit
increase in app one installs is associated with a 7.1% decrease in the probability of
making a major pivot when controlling for developer ability. Although low ability
developers are more likely to make major pivots than high ability developers, all
developers are less likely to make a major pivot as app one installs increase. Thus, the
main results hold even when controlling for this alternative explanation.
Major pivots and high second app installs. While Table 3.5 clearly shows that
distant, major pivots are associated with lower average second app performance than
minor pivots, it could be argued that major pivots might have a positive effect on a
developer’s odds of producing a highly successful second app. To investigate this
alternative explanation, the models in Table 3.5 were replicated using app two installs
100k as the dependent variable. This variable is coded as a one if a second app had
100,000 or more installs at its last observation and a zero if not. Replication of Table 3.5
using logistic regression on app two installs 100k did not produce significant main or

47
moderating effects for any of the pivot distance measures. Given the difficulty of
interpreting interaction terms—particularly nonlinear second order interaction terms—in
logistic regressions (Hoetker, 2007; Zelner, 2009), Table 3.5 was also replicated using
OLS regression on app two installs 100k. This OLS replication produced results that were
substantially similar to those presented in Table 3.5 and suggest that distant, major pivots
are negatively related to the probability of publishing a highly successful second app.
Thus, these results do not contradict, and may even be largely consistent with the main
average app two installs results presented in Table 3.5. Compared to minor pivots, major
pivots do not increase, and may even decrease, the probability of publishing a second app
with 100,000 or more installs. These replications are available upon request.
Robustness checks
These results are robust to a number of alternative specifications. For example,
the results from Tables 3.4 and 3.5 hold when: the square root transformation is not
applied to pivot distance, the pivot distance measure only allows each word in an app’s
description to be counted once, cases where pivot distance is equal to 1.0 are dropped,
apps with a description length of less than 50 characters are dropped, developers with
second apps greater than one are dropped, cases where developer max apps is greater
than or equal to five are dropped, and cases where a developer’s first app had more than
10,000 installs are dropped. Additionally, the logistic regression results are robust to
splitting the major pivot measure at 0.60, 0.95, or anywhere in between.
The results from Table 3.5 are also substantively the same if ordered logistic
regression is used instead of OLS. Additionally, these results hold if logged review count

48
is used in place of the categorical app two installs variable (these measures share a 0.89
correlation) in the OLS regressions. The results are also substantively the same when
second apps less than 60 days old at the time they were last observed are included in the
regression and when the independent variables are centered and standardized.
Discussion
This paper examines how far entrepreneurs do—and should—pivot in response to
negative performance feedback in the context of the Google Play app store. The paper
defines pivot distance and develops a measure of product pivot distance based on textual
analysis of app descriptions. The paper draws on problemistic search and resource-based
theory to develop its hypotheses. Consistent with problemistic search theory, the paper
finds that the lower the installs of an entrepreneurial app developer’s first app, the further
the developer will pivot, on average, for its second app. This finding, coupled with the
high likelihood of publishing a first app that has low installs, helps explain the tendency
of app developers to make major product pivots.
The paper also finds that, consistent with resource-based theory, pivot distance
negatively moderates the relationship between first app installs and second app installs.
More specifically, this relationship takes an inverted-u form in which minor product
pivots are associated with higher second app installs than major pivots and not pivoting in
any meaningful way. This finding is consistent with problemistic search theory’s
implication that minor pivots should outperform not pivoting and consistent with
resource-based theory’s implication that minor pivots should outperform major pivots.
Taken together, these findings suggest that app development entrepreneurs tend to

49
“over-pivot” in response to negative performance feedback, and that over-pivoting has a
negative effect on performance. These findings have important implications for scholars
and practitioners alike.
Entrepreneurial pivoting
In general, prior work on entrepreneurial pivoting suggests that ‘fundamental,’
‘substantial,’ or ‘radical’ (i.e., major) pivots are often an essential ingredient for success
under conditions of uncertainty (Blank & Dorf, 2012; Navis & Ozbek, 2016; Ries, 2011;
Teece, 2014). However, prior work relies on a handful of wildly successful, retrospective
case studies and has yet to produce compelling empirical data in support of this
suggestion.
This paper’s empirical findings tell a different story. By adopting a continuous
measure of pivot distance, the paper shows that entrepreneurs can, and often do, pivot too
far. Compared to minor pivots, major product pivots can actually decrease app
development entrepreneurs’ odds of succeeding. Prescribing pivoting as a means of
achieving entrepreneurial success under uncertainty, without noting the potentially
harmful effects of pivoting too far, may not be sound advice. This caution is especially
warranted given entrepreneurs’ tendency to make major pivots in response to the negative
performance feedback that is all-too-common in entrepreneurial contexts (Eggers &
Song, 2015; Hall & Woodward, 2010).

50
Problemistic search theory
This paper’s findings lend support to problemistic search theory’s suggestions that
pivot distance should increase as performance decreases and that minor pivots should
outperform not pivoting when initial performance is low (Cyert & March, 1963; March &
Simon, 1958). By implementing a continuous measure of pivot distance, which is closely
related to search distance, the paper is able to show how far from the initial search
location entrepreneurs must pivot to capture the benefits of nonlocal search.
However, the paper also produces findings that contradict the implicit assumption
in the problemistic search and strategic change literatures that nonlocal search is
preferable to local search, or that more strategic change is better when an organization’s
performance is low (Baum & Dahlin, 2007; Desai, 2016; Greve, 1998, 2003, 2008).
Much of this work only examines how much organizations change in response to
negative performance feedback without considering what the performance implications
of these strategic changes might be. This paper shows that nonlocal search is not
necessarily superior to local search when initial performance is low—entrepreneurs can
search too distantly. Instead, these findings lend support to closely related work which
assumes that organizations lack ‘distant foresight’ and that they can increase their odds of
success when they already possess most of the resources necessary to spot and seize
local, nearby opportunities (Denrell, Fang, & Winter, 2003; Gavetti & Menon, 2016).
Resource-based theory
This paper’s findings lend support to resource-based theory’s argument that minor
product pivots are more likely than major product pivots to exploit any knowledge,

51
resources, or capabilities an entrepreneurial endeavor may have developed as a result of
its past experience (J. Barney, 1991; Campa & Kedia, 2002; Chatterjee & Wernerfelt,
1991; Miller, 2006; Peteraf, 1993; Wernerfelt, 1984). In this empirical context, minor,
related product pivots improve future performance more than major, unrelated product
pivots.
Importantly, this finding suggests that endeavors can create value by making
minor pivots that leverage knowledge, resources, and capabilities of previously unproven
value. In other words, even when an endeavor tries (and initially fails) to create value, it
may develop potentially valuable knowledge, resources, and capabilities. And, according
to related diversification logic, unlocking this potential value is more likely when these
resources are redeployed in related, rather than unrelated, contexts (Chatterjee &
Wernerfelt, 1991; Wernerfelt, 1984).
The paper’s findings also suggest that resources and capabilities may be more
important than pivoting, or learning strategies, to entrepreneurial success. These findings
show that pivoting does not, on average, help low performing developers “catch up” to
high performing developers. For example, a developer whose first app has 100 installs
(reflecting low capabilities) would be expected to generate fewer second app installs than
a developer whose first app had 100,000 installs (reflecting high capabilities), regardless
of pivot distance. Thus, although pivot distance has substantial and significant effects for
developers within a given capability level, pivoting does not, on average, lead to the
development of superior capabilities. Thus, this paper questions the wisdom of advising
entrepreneurs to fail fast and fail often (H. E. Aldrich & Kenworthy, 1999; Khanna et al.,
2016; Sarasvathy, 2001). It may be the case that entrepreneurs operating under

52
uncertainty are more likely to learn how to fail than how to succeed as a result of their
past failures.
Limitations and research opportunities
Although well-suited for the study of entrepreneurial product pivoting, the
findings derived from the Google Play app store are not likely to generalize to all other
settings. This dynamic, knowledge-based, high technology empirical context is
characterized by low barriers to entry, low costs of failure, rapid development times, and
short product life cycles. These findings may not generalize well to settings that differ on
one or more of these dimensions. Additional work in different empirical contexts is
needed to develop a more thorough understanding of the causes and consequences of
pivoting.
This paper explicitly focuses on a particular type of pivoting: product pivoting.
Thus, it remains unclear whether these findings generalize to other types of pivoting such
as strategy pivoting or business model pivoting. Future work investigating the causes and
consequences of different types of pivoting is therefore warranted.
In order to overcome endogeneity concerns, this paper focuses on the past
performance of an entrepreneurial endeavor as the key driver of pivoting behavior and
consequences. However, it may be the case that there are other explanatory variables that
could broaden our understanding of entrepreneurial pivoting. For example, varying levels
of demand and environmental uncertainty may affect pivoting behavior and outcomes in
important ways. Exploring additional explanatory variables also has the potential to
broaden our understanding of pivoting.

53
The paper purposefully excludes the examination of the pivoting behavior of
established app development endeavors in favor of nascent, entrepreneurial endeavors.
Future work could examine the causes and consequences of pivoting among established
endeavors. Additionally, in order to facilitate the cleanest possible identification of
pivoting causes and consequences, the paper only examined a developer’s first two apps.
Future work could also look at how an endeavor’s pivoting behavior changes when it has
more than a single past product around which it can pivot. This paper also intentionally
excludes comparing the effects of pivoting to the effects of commitment strategies
(updating the first app instead of publishing a second app) and pure exit strategies
(neither updating the first app nor publishing a second). Future work exploring the
relative effects of these different strategies could also prove fruitful.
Finally, this study’s measure of performance, installs, may not be perfectly
correlated with the amount of revenue an app generates. However, it seems reasonable to
assume that installs and revenue are positively related. The more installs an app has, the
more revenue-generating potential it can potentially generate through fees to install the
app, advertisements inside the app, and in-app purchases. Future work can also build on
this paper by more directly examining the financial causes and effects of pivoting.
Conclusion
Despite the growing popularity of entrepreneurial pivoting strategies, it remains
unclear how far entrepreneurs do, and should, pivot. This paper finds that app
development entrepreneurs tend to over-pivot in response to negative performance
feedback and that over-pivoting has a negative effect on future performance outcomes.

54
Together, these findings suggest the need for caution when advising entrepreneurs to
pivot as a means of achieving success without noting the potentially harmful effects of
pivoting too far.

55
Table 3.1
Example word vectors
Hypothetical app description 1: "The sky was bluer than blue in 1978"
Hypothetical app description 2: "The sky was greyish blue in 1980"
blue grey sky
App description #1 word vector 2 0 1
App description #2 word vector 1 1 1
Pivot distance = 0.225
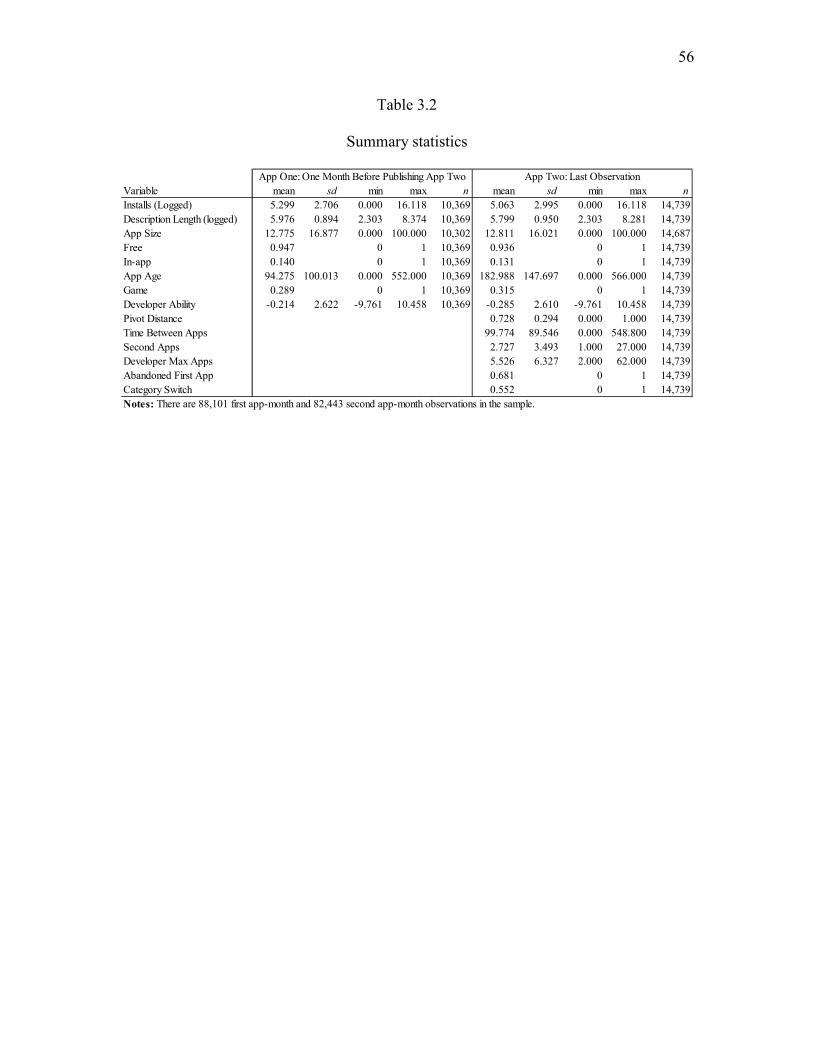
56
Table 3.2
Summary statistics
Variable mean sd min max n mean sd min max n
Installs (Logged) 5.299 2.706 0.000 16.118 10,369 5.063 2.995 0.000 16.118 14,739
Description Length (logged) 5.976 0.894 2.303 8.374 10,369 5.799 0.950 2.303 8.281 14,739
App Size 12.775 16.877 0.000 100.000 10,302 12.811 16.021 0.000 100.000 14,687
Free 0.947 0 1 10,369 0.936 0 1 14,739
In-app 0.140 0 1 10,369 0.131 0 1 14,739
App Age 94.275 100.013 0.000 552.000 10,369 182.988 147.697 0.000 566.000 14,739
Game 0.289 0 1 10,369 0.315 0 1 14,739
Developer Ability -0.214 2.622 -9.761 10.458 10,369 -0.285 2.610 -9.761 10.458 14,739
Pivot Distance 0.728 0.294 0.000 1.000 14,739
Time Between Apps 99.774 89.546 0.000 548.800 14,739
Second Apps 2.727 3.493 1.000 27.000 14,739
Developer Max Apps 5.526 6.327 2.000 62.000 14,739
Abandoned First App 0.681 0 1 14,739
Category Switch 0.552 0 1 14,739
App One: One Month Before Publishing App Two App Two: Last Observation
Notes: There are 88,101 first app-month and 82,443 second app-month observations in the sample.

57
Table 3.3
Correlation coefficients
Variable 1 2 3 4 5 6 7 8 9 10 11 12 13 14
1 App Two Installs (logged)2 App One Installs (logged) 0.502
3 Description Length (logged) 0.269 0.1504 App Size 0.106 0.070 0.166
5 Free? 0.221 0.061 -0.080 -0.0526 In-app? 0.152 0.134 0.138 0.280 0.042
7 App Age 0.337 -0.010 0.036 -0.031 -0.033 0.0028 Game? 0.082 0.085 0.063 0.395 0.058 0.308 -0.014
9 Developer Ability 0.352 0.693 0.033 -0.008 0.047 0.057 0.149 -0.04510 Pivot Distance -0.089 -0.141 -0.296 -0.087 0.204 -0.043 0.007 0.037 -0.087
11 Time Between Apps -0.100 -0.022 -0.059 0.013 0.013 0.012 -0.152 -0.105 0.172 0.04012 Second Apps -0.050 0.019 0.102 0.006 -0.023 -0.082 -0.111 0.036 -0.064 -0.040 -0.153
13 Developer Max Apps 0.060 0.063 0.098 -0.004 0.007 -0.050 0.036 0.039 0.011 -0.028 -0.157 0.73314 Abandoned First App? -0.210 -0.247 -0.087 0.018 0.042 -0.029 -0.258 0.083 -0.272 0.148 0.049 -0.001 -0.079
15 Category Switch -0.032 -0.049 -0.090 -0.017 0.129 0.016 -0.014 0.097 -0.073 0.477 0.027 -0.026 -0.010 0.111
Notes: Correlations > 0.02 are significant at the p < 0.05 level. Correlations are for the last scrape of a developer's second app.

58
Table 3.4
Regressions on pivot distance and major pivot
Variable Model 1 Model 2 Model 3 Model 4 Model 5 Model 6App One Installs (logged) -0.011*** -0.008*** -0.102*** -0.074***
[0.001] [0.002] [0.011] [0.014]
Developer Ability -0.006*** -0.044***[0.002] [0.013]
Description Length (app one) -0.021*** -0.017*** -0.017*** -0.201*** -0.166*** -0.170***[0.004] [0.004] [0.004] [0.032] [0.033] [0.033]
Description Length (app two) -0.072*** -0.071*** -0.072*** -0.480*** -0.475*** -0.477***
[0.003] [0.003] [0.003] [0.028] [0.029] [0.029]App Size (app one) -0.001** -0.000* -0.001*** -0.010*** -0.009*** -0.009***
[0.000] [0.000] [0.000] [0.002] [0.002] [0.002]Free (app one) 0.194*** 0.223*** 0.219*** 0.751*** 1.019*** 1.077***
[0.020] [0.020] [0.019] [0.114] [0.118] [0.118]
In-app (app one) -0.002 0.008 0.002 0.029 0.111 0.112[0.009] [0.009] [0.009] [0.067] [0.069] [0.069]
Time Between Apps 0.000 0.000*** 0.000*** 0.001* 0.002*** 0.002***[0.000] [0.000] [0.000] [0.000] [0.000] [0.000]
Second Apps -0.002 -0.003 -0.003 -0.017 -0.025 -0.026
[0.003] [0.003] [0.003] [0.018] [0.019] [0.019]Developer Max Apps 0.001 0.001 0.001 0.006 0.007 0.008
[0.001] [0.001] [0.001] [0.008] [0.008] [0.007]Abandoned First 0.078*** 0.068*** 0.055*** 0.521*** 0.439*** 0.408***
[0.008] [0.009] [0.008] [0.056] [0.058] [0.059]
Month Fixed Effects Included? Yes Yes Yes Yes Yes YesCategory Effects Included? Yes Yes Yes Yes Yes Yes
Constant 1.019*** 1.003*** 1.060*** 3.171*** 3.102*** 3.016***[0.038] [0.038] [0.044] [0.312] [0.314] [0.314]
Observations 14,693 14,693 14,693 14,693 14,693 14,693R-squared 0.134 0.142 0.169
Pseudo R-squared 0.097 0.106 0.107
OLS on Pivot Distance Logit on Major Pivot
Notes: Robust standard errors clustered at the developer level in brackets. *** p <0.001, ** p <0.01, * p <0.05.
The app one measures are from the month before app two was published. The app one installs and description
length measures are logged. Models 1-3 use OLS regression to predict the continuous measure of pivot distance . Models 4-6 use logit regression to predict the probability of a major pivot (distance >= 0.850).

59
Table 3.5
OLS regressions on app two installs
Variable Model 1 Model 2 Model 3 Model 4 Model 5 Model 6 Model 7
App One Installs (logged, centered) 0.354*** 0.352*** 0.346*** 0.350*** 0.394*** 0.348*** 0.388***[0.018] [0.018] [0.019] [0.018] [0.020] [0.018] [0.020]
Pivot Distance (centered) -0.298** -0.275* -1.085*** -1.114***
[0.111] [0.111] [0.170] [0.170]Pivot Distance Squared -2.048*** -2.099***
[0.322] [0.321]App One Installs X Pivot Distance -0.109** -0.327***
[0.040] [0.058]
App One Installs X Pivot Distance Squared -0.577***[0.126]
Major Pivot -0.293*** -0.295***
[0.060] [0.060]App One Installs X Major Pivot -0.107***
[0.023]
Developer Ability 0.119*** 0.118*** 0.119*** 0.118*** 0.120*** 0.118*** 0.120***[0.016] [0.016] [0.016] [0.016] [0.016] [0.016] [0.016]
Description Length (app one) -0.119** -0.126*** -0.119** -0.132*** -0.124*** -0.144*** -0.136***
[0.037] [0.037] [0.037] [0.037] [0.037] [0.037] [0.037]Description Length (app two) 0.773*** 0.755*** 0.753*** 0.746*** 0.743*** 0.738*** 0.736***
[0.034] [0.034] [0.035] [0.034] [0.035] [0.035] [0.035]
App Size (app two) 0.010*** 0.009*** 0.010*** 0.009*** 0.009*** 0.009*** 0.009***[0.002] [0.002] [0.002] [0.002] [0.002] [0.002] [0.002]
Free (app two) 3.077*** 3.122*** 3.114*** 3.104*** 3.090*** 3.069*** 3.044***
[0.086] [0.088] [0.087] [0.085] [0.085] [0.087] [0.086]In-app (app two) 0.309*** 0.307*** 0.304*** 0.309*** 0.294*** 0.301*** 0.282***
[0.084] [0.084] [0.085] [0.084] [0.084] [0.084] [0.084]App Age (app two) 0.003*** 0.003*** 0.003*** 0.003*** 0.003*** 0.003*** 0.003***
[0.000] [0.000] [0.000] [0.000] [0.000] [0.000] [0.000]
Time Between Apps -0.005*** -0.005*** -0.005*** -0.005*** -0.005*** -0.005*** -0.005***[0.000] [0.000] [0.000] [0.000] [0.000] [0.000] [0.000]
Second Apps -0.053* -0.053* -0.053* -0.053* -0.051* -0.052* -0.049*
[0.021] [0.022] [0.022] [0.022] [0.022] [0.021] [0.021]Developer Max Apps 0.031*** 0.031*** 0.031*** 0.031*** 0.032*** 0.031*** 0.031***
[0.009] [0.009] [0.009] [0.009] [0.009] [0.009] [0.009]
Abandoned First -0.065 -0.054 -0.057 -0.048 -0.050 -0.044 -0.045[0.062] [0.062] [0.062] [0.062] [0.062] [0.062] [0.062]
Category Switch -0.176** -0.102 -0.113 -0.060 -0.068 -0.029 -0.032
[0.055] [0.064] [0.064] [0.061] [0.061] [0.063] [0.063]Month Effects for App Two Included? Yes Yes Yes Yes Yes Yes YesCategory Effects Included? Yes Yes Yes Yes Yes Yes Yes
Constant -0.460 -0.403 -0.467 -0.164 -0.229 -0.021 -0.074[0.368] [0.369] [0.368] [0.371] [0.369] [0.369] [0.366]
Observations 10,711 10,711 10,711 10,711 10,711 10,711 10,711R-squared 0.427 0.428 0.429 0.429 0.432 0.431 0.434
Notes. Robust standard errors clustered at the developer level in brackets. *** p <0.001, ** p <0.01, * p <0.05. App one measures are from the month before app two was published. App two measures are from the time the app was last observed. The app one installs, app
two installs, and description length measures are logged. The app one installs, pivot distance, and pivot distance squared measures
are mean-centered. Only includes second apps that were listed on Google Play for 60+ days.

60
Figure 3.1 Pivot distance illustration.
first product
minor pivot
major pivot
no pivot

61
Figure 3.2 Kernel density plot of pivot distance scores. Kernel = epanechnikov,
bandwidth = 0.0250. This measure of product pivot distance is derived from the basic
cosine similarity between the text descriptions of a developer's first and second apps.
Pivot distance can range from 0.0 (no pivot at all) to 1.0 (orthogonal, major pivot). This
distribution has a mean of 0.728 and a median of 0.850. This distribution can be
categorized as no pivot (0.00 to 0.200), minor pivot (0.200 to 0.850), and major pivot
(0.850 to 1.000).

62
Figure 3.3 Kernel density plot of app one installs. Epanechnikov kernel, bandwidth = 1.5.
This histogram shows the distribution of developers' logged app one installs 1 month
prior to publishing their second apps. The mean of this distribution is 5.300 (200 installs),
the median is 4.615 (100 installs), and the maximum is 16.118 (10 million installs). Thus,
low first app installs is a common occurrence among the developers in this study.

63
Figure 3.4 Probability of a major pivot by app one installs. In this figure, the logged app
one installs of a developer's first app, 1 month before publishing its second app, is used to
predict the probability of making a major pivot (pivot distance >= 0.850). The more
successful a developer's first app is, the less likely the developer is to make a major pivot.
Marginal effects with a 95% shaded confidence interval. Logged app one installs key:
2.4=10 installs, 4.6=100 installs, 6.9=1k installs, 9.2=10k installs, 11.5=100k installs,
13.8=1 million installs).

64
Figure 3.5 Hypothesized relationships.
Initial Performance
(App One Installs)
PivotDistance
Subsequent Performance
(App Two Installs)
H1: –
+
H2a: +H2b: –H3:
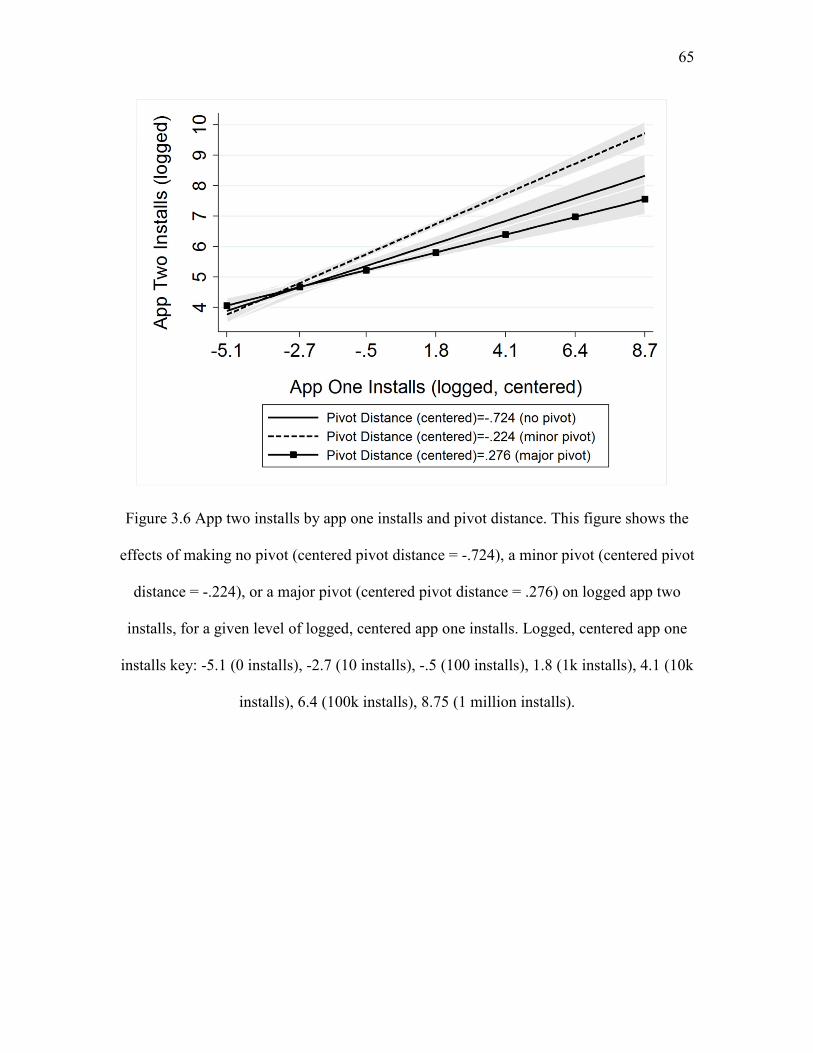
65
Figure 3.6 App two installs by app one installs and pivot distance. This figure shows the
effects of making no pivot (centered pivot distance = -.724), a minor pivot (centered pivot
distance = -.224), or a major pivot (centered pivot distance = .276) on logged app two
installs, for a given level of logged, centered app one installs. Logged, centered app one
installs key: -5.1 (0 installs), -2.7 (10 installs), -.5 (100 installs), 1.8 (1k installs), 4.1 (10k
installs), 6.4 (100k installs), 8.75 (1 million installs).

66
Figure 3.7 App two installs by pivot distance and app one installs.

CHAPTER 4
GETTING LOST IN THE CROWD: OPTIMAL DISTINCTIVENESS
STRATEGIC CATEGORIZATION, AND NEW ENTRY ON
THE GOOGLE PLAY APP PLATFORM MARKET
Introduction
Organizational scholars have long been interested in the inherent tension
organizations face in balancing a need to conform to consumer expectations, while at the
same time differentiating themselves from their competitors (Deephouse, 1999;
Dimaggio & Powell, 1983; Haveman, 1993; Oliver, 1997). Indeed, a broad range of
disciplines has studied the question of whether it is more advantageous for organizations
to fit in or stand out, including: strategic management (Deephouse, 1999; Oliver, 1991),
organizational sociology (Goldberg, Srivastava, Manian, Monroe, & Potts, 2016; Hsu &
Grodal, 2015), entrepreneurship (Boone, Wezel, & van Witteloostuijn, 2013), and
organization theory (Durand & Kremp, 2016; Rao, Monin, & Durand, 2003; Zuckerman,
1999). Much of this work draws implicitly, and often explicitly, from psychological and
socio-cognitive perspectives (Brewer, 1991) of individual social identification, which is
then aggregated up to the level of the organization to make inferences about organization-
level outcomes. More recent work (Zhao, Fisher, Lounsbury, & Miller, 2017) has sought
to integrate much of this literature, and calls for greater scholarly attention to the concept
68
of optimal distinctiveness. Typically, this process is conceptualized as a balancing act,
akin to a zero-sum proposition, where greater differentiation inherently means less
conformity, and that the point of optimal distinctiveness is therefore an exercise in
finding the balance at the midpoint between two countervailing forces. Yet, in line with
this recent call, we view the process of achieving optimal distinctiveness to be “multi-
faceted and mutually enabling” (Durand & Paolella, 2013; Zhao, Fisher et al., 2017).
An important challenge that remains in improving our understanding of
competitive dynamics related to optimal distinctiveness is the deceptively simple
question: to whom or to what do organizations conform, and differentiate from, in order
to gain a competitive advantage? While broadly defined market categories serve as
useful classification devices (Hsu & Hannan, 2005; Zuckerman, 1999) towards this end,
individual market categories are potentially complex and multidimensional competitive
spaces (Cattani, Porac, & Thomas, 2017) in their own right. Thus, positioning within a
given market category may be as strategically important as positioning across different
market categories. For example, organizations may choose to align themselves with the
most representative member in a market space (i.e., the category prototype) in order to
signal their legitimacy. Alternatively, organizations may choose to align themselves with
the most salient member, or a clear market leader (i.e., the category exemplar), as a
means of demonstrating that they stand out from the norm (Vergne & Wry, 2014). This
challenge of optimal alignment is particularly relevant for de novo market entrants who
may not have the requisite experience to fully understand the nuances of the
conformity/distinctiveness paradox, and may be even more problematic for these new
entrants in highly competitive markets such as today’s platform ecosystems (McIntyre &

69
Srinivasan, 2017; Thomas, Autio, & Gann, 2015). The complexity of these competitive
landscapes makes understanding how organizations optimally position themselves at
entry a critical question with significant performance implications.
The goal of this paper, then, is to use the theoretical lens of strategic
categorization (Pontikes & Kim, 2017) to investigate the degree to which de novo
entrants competing in highly competitive, two-sided, platform markets should align
themselves with, or differentiate from, either the prototype or the exemplar of a given
product market category. Strategic categorization allows organizations to explicitly align
themselves (or aspects of organizational design or identity) to an existing categorical
schema for the purposes of gaining a competitive advantage within that market category.
We believe that strategic categorization serves as a useful tool to understand these entry
choices because it can effectively reconcile the inherent agency that organizations
leverage in market entry decisions (Kennedy, 2005; Navis & Glynn, 2010; Vergne &
Wry, 2014), with the external pressures that market categories can impose (Hsu, Hannan,
& Koçak, 2009; Leung & Sharkey, 2013; Negro, Koçak, & Hsu, 2010).
Drawing on this perspective, we argue and find support for the notion that in two-
sided platform markets, strategically aligning oneself with the category prototype may
not confer the same legitimizing benefits as in more traditional markets, while aligning
oneself with the category exemplar leads to higher performance. Further, we argue and
find that alignment with the prototype may actually hurt new entrants and mitigate the
positive benefits associated with aligning oneself with the category exemplar. The logic
underpinning these predictions is two-fold. First, platform ecosystems are highly
competitive and crowded market spaces. As a result, entrants that align themselves with

70
the category prototype, even if done for the purposes of garnering legitimacy, run the risk
of immediately being lost in the crowd. Second, two-sided markets are structured such
that producers and consumers are more efficiently able to interact with one another, and
as a result, processes of endogenous demand may ameliorate the need for external signals
of legitimacy. Endogenous demand entails the ability of organizations to “influence
consumer interest in niches through the products that they offer” (Barroso, Giarratana,
Reis, & Sorenson, 2016, p. 566), ultimately shaping the development and competitive
dynamics of product market categories from within. This emphasis on the demand-side
factors that shape competitive advantage is an important factor in understanding how new
entrants can compete in highly competitive market spaces and offers an alternative to the
supply-side perspective that focus on organization-centric factors, such as dynamic
capabilities (Eisenhardt & Martin, 2000; Teece, Pisano, & Shuen, 1997).
We test our hypotheses in the Google Play app platform market. Leveraging a
unique dataset of over 107,000 apps from over 82,000 new app developers, we utilize
natural language processing of the apps’ text descriptions to identify similarity scores for
a focal app, relative to both a category prototype and category exemplar within each of
Google Play’s 41 app categories. The results suggest that developers can utilize strategic
categorization to position themselves within a highly competitive platform market in
order to gain a tangible competitive advantage.

71
Empirical Context
Platform ecosystems
A growing body of literature has noted the importance of platform ecosystems to
today’s economy (McIntyre & Srinivasan, 2017; Thomas et al., 2015). Examples of
platforms include: internet search engines, Amazon, Netflix, Uber, Airbnb, video game
consoles, YouTube, eBay, iTunes, and the Google Play app store. Platforms are
intermediaries that facilitate transactions between consumers and producers2 in a two-
sided business model (Cennamo & Santalo, 2013; McIntyre & Srinivasan, 2017; Zhu &
Iansiti, 2012). Consumers use platforms to search for and acquire products and services
developed by producers. Producers use platforms to gain immediate access to large
numbers of consumers who may be interested in acquiring these products and services.
Platforms benefit from indirect network effects, becoming more valuable as the
number of both consumers and producers increases (Cennamo & Santalo, 2013; McIntyre
& Srinivasan, 2017; Thomas et al., 2015; Zhu & Iansiti, 2012). In order to foster the
development of indirect network effects, many platforms adopt open architectures which
minimize entry barriers and encourage large numbers of producers to offer their products
and services as a means of attracting consumers to the platform (Thomas et al., 2015). As
a result, competition can be particularly intense on successful platforms with a large
number of producers competing for the attention of millions (or even billions) of
consumers. Indeed, a key benefit for de novo producers entering a successful platform
market is that they are immediately exposed to a large number of consumers without
having to develop the requisite scope and scale economies that traditional markets require
2 In the literature on platform markets, the term “complementor” is often used as the counterpart to consumers. Here we use the term “producer” as a substitute for the term “complementor.”

72
for this same level of exposure. However, these same de novo entrants simultaneously
face the real possibility of immediately becoming “lost in a crowd” of other producers
who also operate on the platform. Thus, strategic positioning at entry can be critically
important to a de novo producer’s survival prospects in platform markets.
Google Play app store platform
The empirical context for this study is the Google Play mobile application store
(https://play.google.com/store/apps) for phones and tablets running the Android operating
system. Google Play generated an estimated $17 billion in revenues in 2016 and this
number is projected to reach $42 billion by 2021.3 In 2016, this platform had over 1
billion active monthly consumers,4 700,000 producers (mobile application development
organizations),5 and 2 million apps.6
Many Google Play consumers discover apps through an organic search process.7
For example, a consumer looking for a task management app might enter the text “task
manager” into Google Play’s search bar. Google Play then executes a search algorithm—
which draws on the developer-provided text description for each app8—and presents the
consumer with a list of apps matching the search criterion. Obtaining a high rank order in
this list of search results can help an app receive more consumer attention and generate
more installs. Alternatively, a consumer might browse through Google Play’s lists of top
apps, click on a popular app, and see a list of similar apps. Building on the same logic as
3 App Annie Market Forecast 2016—2021 4 https://mashable.com/2015/09/29/google-play-1-billion-users/#sS85m8FZsPqq 5 There were 707,831 unique app development organizations in our data set 6 https://www.statista.com/statistics/266210/number-of-available-applications-in-the-google-play-store/ 7 https://www.tune.com/blog/app-store-optimization-win-google-play-app-store-search/ 8 https://support.google.com/googleplay/android-developer/answer/4448378?hl=en

73
above, obtaining a high rank order in the list of apps similar to a highly popular app is
another way in which producers can receive more consumer attention and generate more
installs. Thus, one way in which Google Play app producers can strategically position
themselves to receive more attention and generate more installs is through the crafting of
an app’s text description.
By collecting over 22 million app-month observations between February 2015
and August 2016, we are able to identify 107,106 initial app publications by 82,149 de
novo app producers and measure the degree to which these apps are aligned with both
prototypical and exemplar apps within Google Play’s 41 product market categories.
These measures are constructed using natural language processing techniques applied to
the text descriptions of all apps in the full dataset. Through these descriptions, producers
are able to directly communicate to consumers the features or characteristics that they
consider most important, and in the process, position themselves within a given product
market category vis-à-vis their direct competitors. Performance outcomes are measured
based on the number of times each app was both installed and reviewed by users.
Theory and Hypotheses
Optimal distinctiveness and positioning during market entry
Under certain conditions, the process of achieving optimal distinctiveness can be
thought of as a two-stage process: in order to succeed, an organization must first make it
into a consumer’s consideration set (i.e., be considered a legitimate option), and second,
distinguish itself from the others in that set in order to ultimately gain the favor of
consumers (Zuckerman, 1999). In other words, an organization should conform just

74
enough to gain legitimacy, and then differentiate to gain attention (Deephouse, 1999).
Organizations (and their product offerings) are able to conform by adhering to identity-
based codes or labels attached to market categories (Hannan, Pólos, & Carroll, 2007; Hsu
& Hannan, 2005), which communicate information to audience members and consumers,
reducing uncertainty and ultimately impacting appeal. Yet, an important step in this
process that remains less clear is the optimal way an organization differentiates itself
within the consideration set (Rindova & Petkova, 2007), and what it uses as the
benchmark or anchor from which it differentiates.
Two perspectives have emerged to help explain how organizations might position
themselves within a product market category and how audience members make sense of
and interpret different categorical paradigms—prototype and exemplar based models
(Durand & Paolella, 2013; Vergne & Wry, 2014). The prototype model builds on early
work in cognitive psychology (Rosch & Lloyd, 1978; Rosch & Mervis, 1975) that sought
to interpret categorical distinctions through a process of grouping attributes or features of
a given category. These groupings help to explain how “internal structure arises” (Rosch
& Mervis, 1975, p. 574), and serve as judgment devices for individuals to make
attributions about other actors. Thus, those features that are deemed to be the most central
or representative in the mind of the audience emerge as the prototype for a given category
(Hannan et al., 2007; Vergne & Wry, 2014). Moreover, these enduring prototypes
generate external codes or schemas (Hsu, 2006a, 2006b) that organizations ostensibly
benefit from adopting because they reduce confusion among consumers about an
organization’s place in the market, and whether they belong there or not.
In contrast, the exemplar model builds on self-categorization which offers a

75
perspective on how labeling practices inform category dimensionality, and subsequent
organization positioning within that category. Self-categorization is driven by a shared
understanding among actors of how they fit together and what the salient attributes that
define their place within a category or market space are (Vergne & Wry, 2014). A great
deal of emphasis is placed on an actor’s ability to create or construct their own identity,
which bolsters not only the emergence of a shared understanding (Kennedy & Fiss,
2013), but also their place within it. These shared understandings are legitimated through
dynamic actions such as storytelling (Wry, Lounsbury, & Glynn, 2011), cultural
entrepreneurship (Lounsbury & Glynn, 2001), and linguistic frames (Navis & Glynn,
2010). One example of how these manifest is through the emergence of exemplars as
accepted judgment devices (Cohen & Basu, 1987; Dekker, 2016). Exemplars can be
understood as those offerings that stand out as particularly salient or exceptional
representations of a category. Often, they can be understood as the most well-known, or
highest performing members of a group. Exemplars, then, can serve as reference point to
de novo entrants who aspire to achieve the same levels of success.
A key decision a new organization faces in gaining a competitive advantage is
that of positioning at the time of market entry. De novo entrants can position themselves
within a product category across a number of different dimensions which can have long
lasting consequences (i.e., imprinting effects) even if they reposition themselves later on
(Stinchcombe, 1965). These processes, and their consequences, may be strategically
manageable in certain environments, such as in the nascent stages of an industry or
market (Anthony, Nelson, & Tripsas, 2016; Moeen, 2017; Zhao, Ishihara, Jennings, &
Lounsbury, 2017) because a shared understanding of what the product category

76
represents has yet to fully emerge (Kahl & Grodal, 2016; Kennedy & Fiss, 2013).
Moreover, organizations may also be able to strategically time their entry into a market in
order to take full advantage of favorable environmental or market conditions (Lieberman
& Montgomery, 1988; Suarez & Lanzolla, 2007). Nevertheless, positioning at time of
entry is likely to have a disproportionate impact on organization or product performance
over time, particularly in established, highly competitive markets. This is, in part,
because de novo organizations which enter highly competitive or crowded market spaces
likely do not have the time or resources to “learn as they go.”
A number of factors have been found to impact the relative number and success of
new market entrants. For example, market level characteristics such as spatial
heterogeneity (i.e., the density and intensity of the competitive environment) and
temporal factors have been shown to impact the rate of market entry (Boone et al., 2013;
Cattani, Pennings, & Wezel, 2003). Additionally, the level of contrast (i.e., how “fuzzy”
a category’s boundaries are) can also influence market entry (Carnabuci, Operti, &
Kovács, 2015). Different imitation strategies can also drive relative success of new
market entrants (Ethiraj & Zhu, 2008; Posen & Levinthal, 2012), as well as whether an
organization enters a market as a de novo (entrepreneurial start up) or a de alio (lateral
entrant from another industry) organization (Carroll, Bigelow, Seidel, & Tsai, 1996;
Khessina & Carroll, 2008).
Optimal distinctiveness and endogenous demand
We suggest that analyzing competitive positioning at the time of market entry
within the context of optimal distinctiveness can serve as a valuable lens to extend this

77
research. Recent work has argued that there is not one single convergence point for which
organizations can attempt to achieve strategic balance within a market category (Zhao,
Fisher, et al., 2017). Thus, while singular organizational attributes, or specific
environmental conditions, are important in understanding organization performance and
heterogeneity, it is critical to understand the multi-dimensionality of a given market and
how organizations are positioned relative to these multiple competitive reference points.
Understanding competitive positioning through an optimal distinctiveness lens places
increased emphasis on demand-side factors (such as how consumers and audience
members perceive organizations), as opposed to supply-side factors (such as efficiencies
that organizations gain through scope and scale economies) when attempting to explain
competitive advantage. In other words, we suggest that markets across an increasing
number of industries are being shaped by endogenous demand (Barroso et al., 2016), or
an iterative process between producer organizations and consumers that shapes market
dynamics and organization performance (Rosa, Porac, Runser-Spanjol, & Saxon, 1999).
Processes of endogenous demand are particularly salient in markets where
product offerings differ on dimensions that are difficult to compare directly or
systematically (Barroso et al., 2016), such as cultural products (i.e., music, art, video
games, etc…) in rapidly innovating markets. Structural alignment theory (Gentner &
Markman, 1994; Markman & Gentner, 1993) suggests that the reason for this is that these
types of offerings predominantly differ on nonalignable attributes, which can be defined
as attributes that cannot be easily compared between offerings. In contrast, alignable
attributes can be easily compared between offerings, for example when comparing the
memory, processing speed, or size of different optical disk drives for computers.

78
Therefore, in markets where nonalignable product attributes are prevalent, organizations
should benefit from the ability to directly engage the consumer and increase interest in
their position in a market space (based on the attributes they possess).
Two-sided platform markets, then, are particularly well suited for these processes
of endogenous demand because they are structured to facilitate producer-consumer
interaction, and also because they are often based on offerings which possess
nonalignable attributes. For example, on the Google Play app platform, individual games
within the game category clearly possess some alignable attributes. Different games can
easily be compared by app size (in megabytes when installed on your device), which
version of the Android operating system they work on, whether they are free vs. paid, and
if they offer in-app purchases. However, the popularity of different games is likely
driven more by the nonaligable features, such as the functionality or specific features of
the game, which may vary dramatically between games. For example, the attributes that
make the military game ‘Call of Duty’ popular compared to those that make ‘Candy
Crush’ popular are very different. Desirable attributes for Call of Duty might be a
multiplayer online functionality, incorporating the latest weaponry and drone technology,
or how realistic the violence appears in terms of the graphics. For Candy Crush, the
relevant attributes might be the ability to collect sugar drops or ‘spin the daily booster
wheel for a delicious prize’ (for example, a lollipop hammer or bubblegum troll).
In these instances, endogenous demand offers producers the ability to directly
engage consumers and highlight the relevant attributes that are relevant to each app. By
doing this, producers are able to reduce possible confusion by consumers and help them
to make sense of these nonalignable features within a product market category. In this

79
context, the app descriptions on the Google Play offer provide one important avenue to
accomplish this. It also allows producers to position apps upon entry relative to
competitors, and align themselves with a prototypical game app, an exemplar game app,
both, or neither. Importantly, because of the sheer size of platform markets such as
Google Play, the highly competitive and crowded nature of each app category makes
positioning at entry particularly important.
Strategic categorization
This study focuses on the positioning choices that de novo producer entrants face
within a product category on the Google Play App Store platform. Importantly, it builds
on the assumption that there is more than one anchor that organizations can use to
position themselves in a competitive environment (Durand & Kremp, 2016). We identify
two possible judgment devices, prototypical members and exemplar members of a given
market category, that are both rooted in the categories and organization theory literature,
yet are rarely considered in conjunction with one another (Durand & Paolella, 2013;
Vergne & Wry, 2014). Moreover, there is little empirical evidence demonstrating that
both of these judgment devices can operate concomitantly to aid market position and
entry choices by de novo organizations. This section addresses this theoretical and
empirical lacuna by suggesting that de novo entrants can use both prototype and
exemplar perspectives to identify the optimal strategic positioning within a given product
category space. In order to accomplish this, we build the theoretical concept of strategic
categorization (Pontikes & Kim, 2017).
Organizations typically make strategic choices in an attempt to gain a sustained

80
competitive advantage against rivals. Often, these choices manifest as internal structural
characteristics (i.e., vertical integration, diversification, or the development of key
resources and capabilities) that allow organizations to capture valuable efficiencies based
on scope and scale economies (Barney, 1991). Increasingly, however, competitive
rivalry is being shaped by endogenous market dynamics that arise when producers and
consumers engage in an iterative process of categorization and competitive sensemaking
(Cattani et al., 2017; Rosa et al., 1999). One specific way that organizations can engage
in this process, and directly influence consumer perceptions of their products and actions
(Barroso et al., 2016), is by strategic categorization. We define strategic categorization as
explicitly aligning or linking an organization (or aspects of organizational design or
identity) to an existing categorical schema for the purpose of gaining a competitive
advantage over competitors within that category. Pontikes and Kim identify two
fundamental benefits of strategic categorization for organizations: “to communicate
information and to position themselves favorably with respect to competitors” (2017, p.
73).
Strategic categorization offers a key advantage in that it allows organizations to
shape the narrative of their positioning in a competitive landscape. Typically, these
narratives are left to third-party market intermediaries who take the form of industry
experts or analysts (Zuckerman, 1999), the media (Kennedy, 2008), or professional
critics (Rao et al., 2003). While third-party participation often aids organizations by
making sense of categorical distinctions and helping “to penetrate opaque buyer-supplier
interfaces” (Cattani et al., 2017, p. 78), these third-parties can also use categorical
membership as a sanctioning mechanism for organizations that deviate from accepted

81
categorical codes or schemas (Zuckerman, 1999). Strategic categorization can allow
organizations to bypass third-party actors that serve as sanctioning mechanisms, or
emphasize other third-party actors that benefit them, ultimately using categorization as a
means to intentionally achieve a specific goal or objective (Pontikes & Kim, 2017;
Vergne & Wry, 2014). This can be particularly valuable in market categories that exhibit
high levels of diversity in terms of offerings, or heterogeneity in consumer preferences.
The implication is that organizations can actively distinguish between different
consumers as much within market categories as across them. For example, in the beer
industry, brewers of mass produced beer (i.e., Budweiser and Miller) often adopt
different strategies depending on their target audience. Specifically, they will categorize
or align themselves with the prototypical American beer style (a pale lager) when trying
to reach mainstream beer consumers, and alternatively align themselves with other types
of beer (Belgian witbier or German weiss beer) when attempting to court craft beer
consumers, who have different preferences from consumers who prefer mass-produced
beers (Barlow, Verhaal, & Hoskins, 2016; Carroll & Swaminathan, 2000). In the latter
case, mass-producers strategically categorize their offerings as being artisanal or
handcrafted and typically hide the fact that their offerings are mass-produced and owned
by giant international beverage conglomerates (Howard, 2017).
Up to this point, we have argued that organizations can use strategic
categorization to both directly communicate information to audience members and
effectively position themselves within a product category. Yet, a key question that
remains is how to go about accomplishing this. In other words, what are the actual tools
that organizations have at their disposal to shape and influence market demand for their

82
goods or services? We identify one potential practice that organizations can leverage –
drawing on an existing categorical nomenclature (Cattani et al., 2017). Categorical
nomenclatures serve as a semantic tool for “labeling, codifying, and diffusing category
relevant market conversations” (Cattani et al., 2017, p. 78). Moreover, categorical
nomenclatures can aid in transferring the two key benefits of strategic categorization:
communicating information and positioning an organization favorably vis-à-vis its rivals.
Over time, these nomenclatures also help to clarify category schemas (Hannan et al.,
2007) which may not yet be fully developed (in the case of nascent categories or
industries), or schemas that may mislead or distort consumers as to the actual
characteristics of a given organization (Hsu & Grodal, 2015). Categorical nomenclatures
can manifest through direct communication with consumers, advertising, or product
descriptions – in effect, anything that the organization uses to communicate information
or strategically position itself within the category.
Strategic categorization and similarity to an exemplar
We suggest that in platform-based markets, strategic categorization is a
particularly useful tool for producers to directly engage and influence consumers and
audience members. Producers can accomplish this by positioning themselves relative to
category prototypes and exemplars. We argue that positioning based on conformity to a
category exemplar will ultimately be beneficial for de novo producers. The logic
underpinning this is that conformity to the exemplar is conducive to a goal-based
approach to category positioning that is driven by positive rewards as opposed to penalty
avoidance (Durand & Paolella, 2013; Pontikes & Kim, 2017). Exemplars stand out, and

83
while they may run the risk of being questioned in terms of their legitimacy, the benefit
from their ability to stand out from the crowd is particularly important in crowded or
competitive environments.
Extending this logic to markets (such as platform ecosystems) where producers
are immediately exposed to large number of potential consumers, we believe that
producers will be more successful by aligning with exemplars at the time of entry
because they are more likely to gain attention from and be found by consumers looking at
the exemplar products. In other words, processes of endogenous demand in two-sided
markets, where producers and consumers have more direct control over shaping market
demand themselves, reduces the need for legitimacy from external actors while
simultaneously increasing the attention the producer can gain from the audience. This
allows producers to focus their positioning choices on goal and reward-based strategies
over penalty avoidance strategies. As a result, the categorical nomenclature that they use
to strategically categorize themselves should align them more heavily with category
exemplars in an attempt to stand out from the crowd and gain the attention of the
audience.9
For example, in our empirical context, the Google Play app market, producers
have significant freedom to strategically categorize themselves and create a categorical
narrative (or nomenclature) that can endogenously influence consumer demand.10 They
9 This does not mean that market intermediaries do not still play an important, and sometimes deciding, role in market outcomes. Yet, endogenous demand and strategic categorization in two-sided markets should allow them to reap the benefits of market intermediaries that serve as facilitators in the process of endogenous demand, without being penalized by those that play a sanctioning role (relative to more traditional markets). 10 Compared to Apple’s App Store, Google Play employs a much less rigorous prepublication review and approval process. As long as a proposed app does not contain malware or offensive material and does not infringe on copyrights, the app is likely to be approved as a member of whatever category the producer has

84
also face a highly crowded and heterogeneous market space. During the time of this study
Google Play’s “Communication” category had over 35,000 unique apps, and included an
incredibly diverse set of web browser, social media, direct messaging, email, video chat,
and caller ID apps. To illustrate the benefits of exemplar conformity, consider a de novo
app producer entering Google Play’s Communication category with a new web browser
app. This category has exemplar web browser apps with hundreds of millions of
downloads such as Firefox. The nomenclature of these exemplars includes words that are
not part of the category prototype’s nomenclature such as: bookmark, browse, engine,
fast, incognito, intuitive, page, privacy, and web. We argue that a de novo app producer
that crafts the text description of its web browser app in a way that aligns it closely with
the exemplar nomenclature will be well-positioned to capture the attention of consumers
and potentially generate a high level of installs for a number of reasons. This is because
the similarity of the new app’s text description to the exemplar nomenclature increases
the likelihood that the new app will appear in search results when consumers search for
web browsers using Google Play’s search bar. Moreover, even if consumers first click on
one of the exemplar apps, the new app’s similarity to the exemplar increases the
likelihood that it will show up in Google’s list of similar apps displayed within the
exemplar app’s product details screen. In either case, the new app’s similarity to one or
more exemplars increases the likelihood that it will be seen by and subsequently
downloaded by consumers.
Therefore, we argue that in crowded two-sided platform markets,
alignment with a category exemplar enables producers to stand out from the
chosen in a matter of hours (https://android-developers.googleblog.com/2015/03/creating-better-user-experiences-on.html).

85
crowd and achieve higher performance. This leads to the following hypothesis:
Hypothesis 1. The more an app conforms to a market category exemplar at the
time of entry, the greater the performance of that app.
Strategic categorization and similarity to the prototype
Given the argument that there are multiple reference points organizations can use
to position themselves at entry, and our suggestion that conformity to the exemplar
should drive attention and increased performance in highly crowded and competitive
market categories, a logical conclusion is that de novo entrants can simply focus their
attention on strategic categorization around the exemplar and ignore its positioning vis-à-
vis the category prototype. However, we believe these two alternatives to be more
interdependent than previously recognized in the literature, and that achieving a truly
optimal strategic position within a given product category requires accounting for both
positions in tandem. This creates a more complex market space, but also more accurately
reflects the competitive dynamics that organizations actually face. Indeed, organizations
often engage in multiple strategies simultaneously, and also attempt to position
themselves in different parts of the market, or toward different sets of consumers at the
same time. For example, it is becoming increasingly popular for high-end chefs to open
up fast-casual restaurants, in an attempt to leverage their reputation and reach a broader
audience, without compromising their high-status credentials.11 This can occur when
organizations reinterpret existing category labels (Negro, Hannan, & Rao, 2011), causing
rivals to make differing claims about the same labels, or audience members interpreting
11
“Why Fine Dining Chefs Are Getting into the Chain Game”, by Erin DeJesus. https://www.eater.com/2014/10/6/6896297/why-fine-dining-chefs-are-launching-fast-casual-concepts

86
similar claims differently.
The implication is that de novo entrants can potentially position themselves near a
prototype and an exemplar simultaneously. Of course, this assumes that both of these
reference points already exist within the market category. For example, in nascent
markets a true category prototype may be too difficult to identify because the structures,
codes, and categorical nomenclature have not had sufficient time to develop (Navis &
Glynn, 2010; Zhao, Ishihara, et al., 2017). However, a potential problem with this
strategy is that strategic categorization is not an infinite resource. Consumers can become
overloaded with information, and this may negatively impact appeal. Moreover,
organizations may have limits to the amount of communication they are afforded with
consumers. For example, on platform-based markets (such as Google Play) producers
may be limited by the amount of space to write their product descriptions. Finally, in line
with the well-known penalty for category spanning (Hsu, 2006a; Hsu et al., 2009; Leung
& Sharkey, 2013), being positioned as both a prototype and an exemplar within the same
category can sow confusion about the true identity of a producer if consumers in that
category are more or less homogenous. Nevertheless, in highly competitive and
heterogeneous market category spaces, organizations can ostensibly position themselves
differently in order to engage different customers within the same category.
In addition, successful strategic categorization is not necessarily only a
function of alignment within a certain market category. Indeed, organizations can
strategically avoid certain categorical nomenclature in order to intentionally
position themselves away from a category prototype and/or exemplar. For
example, strategic categorization can entail conformity to the exemplar and
87
nonconformity to the prototype. The potential benefit of this is that it creates
clarity in the information being communicated through strategic categorization. It
also creates greater degrees of contrast between organizations. Past research has
shown that high levels of contrast can benefit organizations (Kovács & Hannan,
2010) and that new entrants fare better in high contrast environments (Carnabuci
et al., 2015).
To illustrate the drawbacks of prototype conformity, consider a de novo
producer entering Google Play’s Communication category with an app for
delivering personalized communications, news, and notifications to employees of
large corporations. Assuming there are no exemplar, highly successful,
personalized corporate communication apps in Google Play’s Communication
category, how should this app strategically categorize itself upon entry in this
competitive market category? The prototypical nomenclature for this category
includes words such as: message, notify, connect, contact, chat, inform, and share
– all of which are words this producer might use to describe a personalized
corporate communication app and suggest that the app is a legitimate member of
the Communication app category. Yet, these words also apply to a whole host of
other Communication apps, and if consumers were to search based on these
words, the app could quickly run the risk of being completely overwhelmed by
other offerings, effectively being lost in the crowd. While using some of these
terms in the personalized corporate communication app’s text description may be
inevitable, the more heavily they are used, the more the Google Play algorithm
will group them in the search results with thousands of other apps that offer these

88
features as well. In the event that this app does not reach the first page of a
consumer’s search results on the platform, the producer is likely to be at a severe
disadvantage. In this instance, then, the need to stand out from the crowd should
outweigh the need to signal legitimacy by explicitly stating that an app is a true
member of the Communication app category.
Particularly for idiosyncratic and unique apps (such as the personalized
corporate communications app), the need to stand out from the crowd is acute.
One of the key benefits of platform markets is that they facilitate outreach to, and
communication with, an extremely scattered and diffuse target market. In more
traditional product markets, the producer of this app would struggle to generate
the marketing budget or economies of scale to reach these consumers. But
through the direct interaction inherent in the process of endogenous demand on
two-sided markets, these unique products are potentially able to reach consumers
and thrive. The key, then, becomes strategically categorizing an app in a way that
reaches this broad and diffuse consumer set without getting lost in the crowd in
the process.
Therefore, we argue that in crowded two-sided platform markets,
alignment with the category prototype will not produce the performance benefits
related to legitimacy and will instead lead to lower performance due to getting
lost in the crowd. This leads to the following hypothesis:
Hypothesis 2. The more an app conforms to its category prototype at the
time of entry, the lower the performance of that app.
Up to this point we have argued that in competitive two-sided markets

89
strategic alignment with the category exemplar will lead to higher performance
because it helps new entrants stand out in a crowded market space. Furthermore,
because of the nature of these markets and the ability of producers to directly
engage consumers through processes of endogenous demand, the need to conform
to a category prototype as a means of garnering legitimacy is less important. In
fact, we suggest that new entrants will perform significantly worse the closer they
align themselves to these prototypes. Indeed, so strong is the need to stand out
from the crowd that we also argue that alignment with the category prototype can
actually negate other successful positioning strategies taken by de novo entrants.
Market categories can be complex multidimensional spaces, and organizations
may pursue more than one strategy in order to reach different sets of consumers
within the same market category. The example above of mass production
breweries attempting to court both mainstream beer consumers and craft beer
consumers simultaneously is just one example. Yet, it is difficult to completely
disentangle or separate these actions from one another. As a result, new entrants
who position themselves near prototypical offerings in order to fit in may
inadvertently impair their ability to be perceived as unique and stand out from
competitors.
For example, a de novo producer entering Google Play’s Communication
category with a video calling app would likely be similar not only to an exemplar
with billions of downloads (such as Facebook Messenger), but also to the
category’s prototype. The text description of the new video call app would likely
include nomenclature such as: call, video, chat, contact, message, send, and

90
connect. These words are all part of the nomenclature of exemplar video call
apps—but they are also part of the category’s prototypical nomenclature used by
many thousands of apps. Thus, even if the new app were to appear in Google
Play’s search ranking list (or the list of apps related to an exemplar), it stands the
risk of being lost in the crowd and ending up so far down the list that it is unlikely
to be discovered by consumers. As shown in this example, similarity to a
category’s prototype can negate the benefits of similarity to a category exemplar
in highly competitive platform markets. The key, then, would be for this producer
to invoke a categorical nomenclature that strategically aligns it with the exemplar,
without simultaneously invoking a prototypical nomenclature.
Ultimately, we argue that the need to stand out in highly crowded platform
market categories is so important that the penalty for alignment with the prototype
will negate the strategic benefits of alignment with an exemplar. This leads to our
final hypothesis:
Hypothesis 3. The greater an app’s conformity to its category prototype at
the time of entry, the smaller the performance benefit of that app’s
conformity to a category exemplar.
Methods
Data
Google Play publicly provides rich data for each app, including the number of
downloads, the number of reviews received, a category classification, a history of version
changes, and – importantly for this study – a complete text description of each app

91
written by the developer. These descriptions represent a key tool for developers to
communicate directly with potential consumers and, in our study, serve as a means to
identify and measure variation in strategic categorization across developers. Google
advises developers that it is imperative to use a strong description to help their app get
found in the market.12
To create the sample, we collected data on over 1 million apps on a monthly basis
between February 2015 and August 2016. In this setting, thousands of new apps are
published every month as developers attempt to generate economic value in a single
marketplace. This makes it relatively easy to identify a sample of nascent app
development organizations entering the market for the first time and track the
performance of the apps published by these developers over time. To test this study’s
hypotheses, we restrict the sample to include only developers who published their first
app between March 2015 and July 2016. We exclude any developers who publish more
than 10 apps during our collection period, since those developers are more likely to be
larger companies or even contract development organizations, which we are not
theorizing about, and may have very different market strategies compared to new
developers.
Importantly, we only examine the first set of apps each developer places on the
market. For example, if a developer builds and places three apps on the market in t=1 (the
first month of observation), and then introduces two more apps on the market at t=2, we
only examine the developer’s first three apps. We do this because the developer could
have learned from their experiences with the first set of apps that they apply to this
12 http://www.adweek.com/digital/google-discloses-how-search-for-google-play-works-for-the-first-time-12-percent-of-dau-search-for-apps-daily/

92
second set of apps, which introduces organizational learning processes, which may
confound the interpretations of our results. We do include developer-level controls to
account for these new apps, but this paper specifically theorizes about how to optimally
place products upon initial entry of developers, leaving questions of learning from these
choices for other studies.
We also exclude developers that did not publish apps with an English text
description and developers with data collection gaps. Finally, because we include a
lagged review score measure to control for app quality, any apps with either no review
score in the prior month or that were only on the market for only 1 month are dropped
from the final analysis (although our results hold with these apps included by unlagging
the measure). Our final sample consists of 470,728 app-month observations, with
107,106 unique apps, and 82,149 unique developers.
Our hypotheses argue that app developers achieve better performance for their
initial apps at high levels of similarity to a category exemplar, and low levels of similarity
to the category prototype. Initial analyses of the data reveal that most developers do not
appear to follow either of these two strategies. Figure 4.1 shows a scatterplot of the
similarity scores for each app in the dataset. This figure clearly shows most apps are
clustered in the area where they are low in similarity to both prototypes and exemplars.
This suggests that, if our hypotheses are correct, most app developers are not optimally
positioning their apps for competitive advantage and high levels of performance.

93
Measures
Dependent variable. We use Review Count (ln), the logged count of reviews for
each app-month observation as our primary dependent variable. The logged count of
downloads would also be a logical measure of app performance. However, the downloads
measure obtained from Google Play is ordered and categorical (e.g., 0, 1-5, 5-10, 10-50,
etc.). We therefore favor the use of the continuous measure of logged count of reviews,
although our results hold when using either measure of performance. This consistency in
results is not surprising since the review count and installs measures are highly correlated
(0.80). Only users who have downloaded an app are able to give it a review score in
Google Play. We chose a logged measure because the distribution of review counts on
the Google Play app store is highly skewed, with the median number of reviews (9) well
less than the average (588.7). Further, over 90% of the apps in our sample have less than
237 reviews (while the maximum number of reviews is 5,662,447). We add 0.01 to all
review counts before logging to account for apps that have not yet received a review.
Independent variables. We draw on the text descriptions of the apps in our
sample to produce this study’s two key explanatory variables. When publishing an app on
the Google Play platform, developers must write a text description of their product,
offering an opportunity for the developers to highlight what they view as the key
characteristics or features of their app. In our sample, the mean cleansed description
length is 486.48 characters. We use natural language processing methodologies to
identify the primary language for each app’s text description (ensuring that only English
apps are included in the sample), remove stop words (e.g., ‘the,’ ‘your,’ ‘for,’ etc.), and
stem words to their root form (e.g., ‘fish’ would be the stem for ‘fishing,’ ‘fisher,’ and

94
‘fished’) before producing our explanatory measures. It is important to note that our two
explanatory variables measure the similarity of each focal app to its category prototype
and category exemplars the month prior to publishing the new app. In other words,
although our regression sample only includes de novo app developers publishing their
first app, we create these explanatory measures by comparing the text description of each
new focal app to all of extant apps that were available for download in its category by
drawing on our larger dataset with over 22 million app-month observations.
First, we calculate Prototype Similarity, which measures how similar the focal
app in our sample is compared to the representative, or prototypical app in the focal app’s
category. To accomplish this, we identify the 50 most commonly used words contained in
the descriptions of all of the apps (not just the apps within our subsample of de novo
developers) in each of Google Play’s 41 app categories on a monthly basis. This measure
is based on the top 50 words used in the focal app’s category the month before it was first
published. By looking at the prior month, we are able to capture the competitive
environment at entry. We calculate the prototype similarity measure by dividing the
count of words in a focal app’s text description that are also words from the category’s
top 50 words by the total number of words in the focal app’s text description. Thus, a
score of 0.0 would indicate that the focal app does not use any of its category’s top 50
words and differs significantly from that category’s prototypical or most representative
app. A score of 1.0 would indicate that an app only uses words from its category’s top 50
words list in its text description and is highly similar to the prototypical app. In our
sample, the mean prototype similarity score is 0.22. Importantly, the prototype of each
category is not necessarily an actual app in the category. Rather, it is a measure of fit

95
with the characteristics or features that most commonly define that category space. For
example, for apps in the Health and Fitness category, some of the most commonly used
words in the descriptions include: track, schedule, calculate, program, diet, calorie, and
store. Thus, a prototypical app in this category will likely offer the ability to track your
progress, create a workout schedule, track calorie intake, and store your workout results.
A new entrant can align themselves with this prototype by communicating or highlighting
these features in their own description.
The second explanatory variable, Exemplar Similarity, measures how similar the
description of the focal app is to its nearest neighbor among its category’s list of the top
100 most installed apps (the exemplar apps) in the month prior to the app being
introduced. Again, this measure is created by comparing the focal app’s text description
to all extant apps that were available in the focal app’s Google Play category the month
before the focal app was first published. This ensures that we are capturing the
competitive environment as the de novo app developer would have seen it when
positioning their new app on the market. To calculate the measure, we follow prior
literature (Hoberg & Phillips, 2010), and calculate the cosine of the angle between two
vectors to determine how similar the two vectors are. In this case, we first create a unique
vector for each app in our sample. These vectors represent a list of all the words used in a
particular app’s cleansed text description (which includes only the stemmed words with
stop words removed for apps with English text descriptions). We also create a unique
vector for each of the top-100 apps in each of Google Play’s 41 categories. We then
calculate the dot product between the focal app’s vector (A) and the vector for each of the
top-100 exemplar apps (B) per Formula 1:

96
∑ ���������∑ ������ �∑ ������
(1)
Finally, we identify the focal app’s nearest top-100 neighbor (single highest
cosine similarity score) from this list of 100 scores and use this as our measure of
exemplar similarity. For example, an exemplar similarity score of 0.0 would indicate that
the focal app does not contain any of the same words as any of the top-100 apps. An
exemplar similarity score of 1.0 would indicate that the focal app has a text description
that is identical to at least one of its category’s top-100 apps. In our sample, the mean
exemplar similarity score is 0.33.
Control variables. We include a number of control variables to account for
potential omitted variable bias and to control for other factors that may impact an app’s
performance on the market. We include several variables at the app level. First, we
include the number of category name words used in the app’s description (i.e., an app
from the Books and Reference category that used the stemmed words “book” and “refer”
in its description would contain a value of 2 for this variable). Second, we include the
order of the app’s entry on the market. This variable is measured by examining the ‘last
updated date’ for the app. Since these apps are all new on the market in the month we
began our data collection, this variable is a proxy for the date when the app was uploaded
to the marketplace. We also include the age of the app, which is the number of days
between each wave and the first ‘last updated’ date for each app. Also included is a
binary indicator to identify if the app is free (versus a paid app), and another to show if
the app offers in-app purchases. Both of these variables are indicators that the app
developer is trying to create value (although in-app advertising is also an important and

97
growing source of revenue). We also control for the total length of each app’s description
(in characters), and the app size (in megabytes). We also include a binary variable that
indicates if the developer ever changed their description in the future. About 65% of the
apps in our sample never changed descriptions. However it is important to control for
future changes in our models. Finally, we also include a control for the review score for
each app. To calculate this variable, we take the average of all reviews (between 1 to 5
stars) for each app in a given month. We lag this variable by 1 month to reduce potential
endogeneity.
At the developer level, we first control for the percentage of a developer’s apps
that use category name words. Second, we control for the number of other categories the
developer has apps in for each month. This variable can vary from 1 (no spanning), to 10
(all apps in different categories, capped at 10 because we exclude de novo developers that
enter Google Play with more than 10 apps). We also include a binary variable that
indicates whether or not the developer entered with two or more apps in their initial entry
month.
We also include a number of controls at the category and market levels. These
measures are calculated by drawing on our larger dataset and are not restricted to just the
subsample of de novo app developers. First, we include the competitive density of each
app category, which is the count of the total number of apps in each category in each
observation month. Second, we include a measure of category contrast, as this has been
shown to impact the performance of category members (Kovács & Hannan, 2010; Negro
et al., 2010). To measure this, we first calculate the total number of cleansed words for
all apps in a given category, and then determine how many of these words (at the
98
category level) are in the top 50 category words list. Lower scores on this variable
indicate that the category has higher contrast (the apps within the category are more
similar). This variable is lagged by 1 month to reduce endogeneity. We also include
category-level fixed effects to control for all other factors that do not change within a
given category over time. At the market level, we also include month level fixed effects
to account for temporal factors.
Analysis technique
Our data consist of repeated measures of app performance over time, so we used
panel-data modeling techniques. Standard fixed effects regression models are
inappropriate, since our main independent variables do not vary over time (they measure
similarity at app entry). Therefore, to test our hypotheses, we utilize time-series
generalized estimating equations originally developed by Liang and Zeger (1986), which
account for potential autocorrelation in the data and calculate population average results.
Our data include apps nested within a developer, and this could lead our errors to be
correlated between different apps from the same developer. Therefore, we also follow
Cameron, Gelbach and Miller (2011) and utilize cluster-robust standard errors at the
developer level, as the developer is the highest level of nesting within our data. We
further tested our models using the two-way clustered errors described by Cameron,
Gelbach and Miller (2011), but found similar results to the GEE regression models. We
also ran standard random effects regression models, with errors clustered at the developer
level, as well as cross-sectional regression models keeping only the last wave of data for
each app and clustering the errors at the developer level. Finally, we ran a linear mixed-

99
effect model that allowed the intercept to vary for each developer (random intercept
model). Results from all of these tests were consistent with our findings using the GEE
models. Since all of our modeling techniques led to similar results, we have chosen to
present to GEE models for simplicity. All additional models tested are available from the
authors. To test the fit of our GEE models we employ the quasi-likelihood under the
independence model criterion command created by Cui (2007). With this method, lower
values of the outcome indicate a better model fit. We tested all of our models and found
that the model including all of our controls and predictors (including the interaction) is
the best fitting model.
Results
Correlations and summary statistics are provided in Table 4.1. When examining
the correlations, results show that our two predictor variables (prototype and exemplar
similarity) are positively correlated (0.56). The scatterplot pattern in Figure 4.1 also
highlights this correlation, with a large number of apps positioned low on both of these
similarity measures. However, when only these main effects are included, we see no
evidence of multicollinearity (with variance inflation factors below 2). Since we are
hypothesizing a multiplicative interaction, which increases the variance inflation factors
(to a max of about 10), we mean-center our independent variables and include the
interaction of the centered variables in our models. Models using the uncentered variables
give substantively the same results as using the centered variables, but the centered
variables lead to much lower variance inflation factors (below 2). Therefore, we see no
evidence of multicollinearity biasing our results.

100
Results for the hypothesized effects are shown in Table 4.2. Model 1 introduces
the control variables, which act in the expected ways. It is interesting to note that the
lagged review score coefficient is negative and significant. One explanation for this is
that most apps start with high review scores (likely reviews from friends and family) and
tend to drop as more people (who are likely to be more objective) install and review the
app. Model 2 introduces the main effects of both similarity scores, while Model 3 tests
the interactive effect. For testing H1 and H2, we see in Model 3 that the coefficient for
prototype similarity is negative (b=-0.663, p=0.000) and that the coefficient for exemplar
similarity is positive (b=0.793, p=0.000). Figure 4.2 shows the average performance
effect results for both similarity measures, holding all other variables constant. The
dependent variable for this plot is review count (as opposed to the log of review count) to
ease interpretation. As shown, apps positioned closer to the prototype perform worse
than those positioned away from the prototype. An app that has a centered prototype
similarity score of 0.0 (the mean prototype similarity score) has an average of 15.5
reviews while an app with a centered prototype similarity score of 0.6 has an average of
10.5 reviews. Thus, a 0.6 increase in the prototype similarity score decreases the expected
count of reviews by 5, or 32%, all else being equal. In contrast, positioning close to the
exemplar leads to higher performance. An app that has a centered exemplar similarity
score of 0.0 has an average of 15.5 reviews while an app with a centered exemplar
similarity score of 0.6 has an average of 25.0 reviews. Thus, a 0.6 increase in the
exemplar similarity score increases the expected count of reviews by 9.5, or 61%. This
lends support to both H1 and H2.
Turning to H3, we see that the interaction effect between the two similarity

101
measures is negative (b=-1.003, p=0.006) in Model 3. To explore this effect in greater
detail, Figure 4.3 plots the performance of an app with all control variables held at their
means versus both prototype and exemplar similarity measures (interacted) in 3-
dimensional space. As before, the outcome variable is review count to ease interpretation.
As shown, the highest levels of performance are at low levels of similarity to the
prototype (-0.2) and high levels of similarity to an exemplar (0.6) where an app can
reach, on average, 40 reviews. However, the beneficial effect of similarity to the
exemplar diminishes considerably across the range of similarity to the prototype. Apps
with high exemplar similarity (0.6) and high prototype similarity (0.6) receive, on
average, only 10 reviews (a performance decrease of 75%). This is a large effect, since
the median number of reviews for apps in our dataset is 9, and the 75th percentile is 43
reviews. In other words, by adopting an optimal positioning strategy, a de novo app
developer can improve their expected performance from the median level to the 75th
percentile. Put differently, high levels of similarity to the prototype almost completely
erases the advantages of alignment with an exemplar. Indeed, the results in Figure 4.2
show that apps that have high centered scores (0.6) for both similarity measures fare
worse (10 reviews), on average, than apps with low centered scores (-0.2) for both
similarity measures (15 reviews). This highlights the interdependent nature of these two
reference points and suggests that it is not sufficient to attempt to identify optimal
positioning based on a single reference point within a market category. New entrants can
benefit from developing an understanding of the multidimensional and complex nature of
the market category they are entering. Overall, these results provide support for H3.

102
Robustness checks
We ran several additional models to further test our results. First, since our
models (and many econometric techniques) predict average performance, we sought an
empirical test that could predict superior performance. On the app store, the distribution
of downloads is highly skewed, with only a small number of apps (approximately 4% of
our sample) ever generating 100,000 or more downloads. Therefore, we created a binary
variable for all apps that reach the 100,000 download level. We then ran a logistic
regression model, with robust standard errors clustered at the developer level. We only
keep the last month’s observation for each app, which would likely be the app’s highest
level of performance. Table 4.3 shows this model, and the results indicate that our main
findings still hold. High exemplar similarity coupled with low prototype similarity leads
to the highest chance of reaching 100,000 or more downloads. Figure 4.4 shows the
predicted probabilities of reaching this level of performance depending on prototype and
exemplar similarity scores. As shown, low levels of similarity to the prototype and high
levels of similarity to the exemplar leads to a 20% chance of achieving 100,000 or more
downloads. This is a large effect, since a randomly chosen app has only a 4% chance of
reaching this level of performance. Moreover, as a focal app that is highly similar to an
exemplar increases its similarity to the prototype, it loses essentially all of its increased
probability of superior performance. This effect is consistent with the main models
predicting average performance. Therefore, being properly aligned relative to both
prototype and exemplar category judgement devices not only improves a developer’s
chances to achieve better than average performance, but also increases a developer’s
likelihood of achieving superior performance.

103
As a second robustness check, we run our original tests with an alternative
dependent variable: the logged number of downloads. Consistent with our main models,
we find that similarity to the prototype leads to lower downloads, that being more similar
to the exemplar leads to an increase in downloads, and that there is a strong negative
interactive effect. These results are available from the authors.
Finally, because of the increased power associated with a large number of
observations, we test to see if our results hold only looking at the first month an app is on
the market. This avoids the possibility that a few high performing app, which are in our
sample multiple times (across a number of months), are not driving our results. We show
this by running a cross-sectional regression model with the first month that each app is on
the marketplace. These models include all of our controls from our main regression
models (with the exception of lagged review score, as this is the first month each app has
been on the market). These results, also available from the authors, show that our results
hold. This indicates that being optimally positioned relative to the prototype and
exemplar category members has an immediate impact on performance, and coupled with
our main models in Table 4.2, suggests that this positive benefit persists over time. The
cross-sectional model also holds in the expected directions with the log of downloads as
the dependent variable.
Discussion and Conclusion
This paper provides an answer to the deceptively simple question: To whom or to
what do organizations conform to, and differentiate from, in order to gain a competitive
advantage on platform markets? To answer this question, we draw on the strategic

104
categorization literature and identify two judgment devices organizations can align with
or differentiate themselves from: the category prototype and a category exemplar. Our
findings show that these two judgment devices are interdependent and highlight the
importance of considering both in tandem when making entry positioning decisions. We
argue and find support for the notion that organizations can strategically categorize
themselves and endogenously influence demand for their products in two-sided platform
ecosystems such as the Google Play app store. In particular, we find that alignment with
the category prototype in a platform market may not confer the same legitimizing
benefits as in more traditional markets. We also find that aligning with a category
exemplar leads to higher performance outcomes for producers but that this effect is fully
negated when alignment with the prototype is also high. Thus, this research investigates
the multi-dimensionality and interdependence of different strategic positions within a
product market category at the time of entry and shows the importance of optimizing
relative to multiple judgment devices simultaneously to gain competitive advantage.
This paper adds to several current research streams. First, we make contributions
to the literature on optimal distinctiveness (Deephouse, 1999; Zhao, Fisher, et al., 2017)
and organizational positioning at market entry (Boone et al., 2013). This research shows
that an organization’s decision to optimize product positioning at entry is more nuanced
than previous literature suggests. Positioning within a market category is not simply a
zero-sum game that consists of making tradeoffs between conformity to and
differentiation from a single reference point. Instead, there are multiple judgment devices
that organizations can think about when positioning their products. In particular, we
highlight the importance of considering positioning relative to category prototypes and

105
exemplars and show that these two judgment devices are more interdependent than
previous work suggests. Even if an organization is optimally balanced against one of
these judgment devices, it may not be optimally positioned relative to the other. Thus, our
findings suggest that organizations can potentially increase their odds of achieving
optimal distinctiveness and superior performance when they use multiple judgment
devices to inform entry positioning—particularly when the organization is a de novo
entrant into a highly competitive platform ecosystem like the Google Play app store.
Second, we add to the emerging literature on strategic categorization (Cattani et
al., 2017; Pontikes & Kim, 2017; Vergne & Wry, 2014). This research argues that
categories are used by audiences to gain information and that organizations can
strategically leverage semantic cues and categorical nomenclature in order to
communicate with and help shape how consumers view them, thereby endogenously
influencing and shaping consumer demand (Barroso et al., 2016). In our empirical
setting, app developers choose how to describe their app, highlighting the features or
characteristics that they perceive to be most important or salient, ultimately signaling to
consumers how they fit within the competitive framework of a given market category.
Our results show that this process has a tangible impact on the app’s level of competitive
advantage, both with respect to average performance and superior performance. This
supports the notion that organizations can use strategic categorization “to communicate
information and to position themselves favorably with respect to competitors” (Pontikes
& Kim, 2017, p. 73). Our results suggest that in two-sided platform markets such as
Google Play, producers can adopt strategic categorization strategies to endogenously
shape and influence consumer demand within a product category. This emphasis on the

106
demand-side factors that shape competitive advantage is an important factor in
understanding how new entrants can compete in highly competitive market spaces and
offers an alternative to the supply-side perspective that focus on organization-centric
factors (Barney, 1991; Eisenhardt & Martin, 2000; Teece et al., 1997).
Third, we add to the nascent and growing literature on platform ecosystems
(McIntyre & Srinivasan, 2017). To date, this literature has primarily has adopted the
platform as the unit of analysis and has tended to focus on either strategies a platform can
adopt to achieve competitive advantage vis-à-vis rivals or strategies a platform can enact
to solve the “chicken-or-the-egg” problem associated with two-sided business models
(Cennamo & Santalo, 2013; McIntyre & Srinivasan, 2017; Zhu & Iansiti, 2012). Our
study is among the first to specifically examine intraplatform competition among
producers. We show that, in these intensely competitive environments, the entry
positioning choices of de novo producers can have a substantial effect on their
performance outcomes. More specifically, we show that de novo producers can increase
their chances for success by identifying a category exemplar that is distant from the
category prototype and positioning themselves close to this exemplar. By so doing, new
producers can simultaneously increase their odds of getting noticed and avoid getting lost
in the crowd.
Finally, we add to the literature on market categorization (Durand & Paolella,
2013; Hannan et al., 2007; Hsu & Hannan, 2005; Leung & Sharkey, 2013; Negro et al.,
2011; Pontikes & Kim, 2017; Vergne & Wry, 2014; Zuckerman, 1999). Specifically, we
find an important boundary condition in the understanding of how and when
organizations should position themselves within market categories. Typically, research

107
in this area suggests that organizations should fit in just enough to gain legitimacy, and
then differentiate to stand out (Deephouse, 1999). However, in our empirical setting,
platform-based markets, we suggest that the ability of organizations to directly engage
consumers directly through strategic categorization allows them to avoid the penalties
related to deviating from the prototype for the purposes of garnering legitimacy. Instead,
in these contexts, organizations can focus more on goal-based categorical associations
rendering alignment with the category exemplar, and distance from the prototype, the
optimal entry strategy.
This research also has important managerial implications. For example, managers
would be well-advised to understand the overall competitive context of a given market
category prior to entry. Focusing on a single positioning strategy relative to one
judgment device is likely to be less effective than a strategy that considers multiple
judgment devices. Additionally, we provide evidence suggesting that managers can take
control of how information about their organization’s products are communicated to
consumers and that this information can be used to ultimately influence demand for these
products. This can be done by utilizing semantic cues and adopting categorical
nomenclatures in order to engage consumers. Ultimately, we argue that, in platform
market environments, the ability of producers and consumers to iteratively and
endogenously shape demand is increasingly driving competitive advantage.
This research can be generalized beyond the Google Play app store. As noted
above, platform ecosystems are becoming an increasingly important part of today’s
economy. Platforms already create a tremendous amount of value and are operated by
multibillion dollar organizations such as Airbnb, Alphabet (Google search engine,

108
Google Play, YouTube), Amazon, Apple (iTunes), eBay, Microsoft (X-box), Netflix,
Nintendo, Sony (PlayStation), and Uber. As competition on these platforms becomes
fiercer, it will become increasingly important for producers to pay close attention to their
positioning choices to gain attention and avoid getting lost in the crowd. Understanding
how to position products so that they appear higher in the platform’s search rankings
increases the probability that a product will gain attention from, and ultimately be chosen
by, consumers who may tend to satisfice and stop searching once they find a suitable
product that fits their needs. We see fruitful avenues for future research which tests these
findings in different, nonplatform settings where producers also are also able to
communicate directly with consumers in an attempt to endogenously influence demand
by strategically positioning themselves within a market category. Moreover, developing a
deeper understanding of different types of semantic cues and nomenclatures that
organizations can use to strategically categorize themselves in platform (and other)
settings is an important theoretical question to unpack with important implications for
helping organizations understand how to gain competitive advantage.
As with all research, there are limitations in our study that open avenues for future
research. While we posit that our results generalize outside of the Google Play app store,
more research is needed to substantiate our findings in other contexts. Second, while we
show how developers can align their apps relative to category prototypes and exemplars,
we do not fully know the extent to which producers actually consider these judgment
devices when publishing a new app. Future research could build on these findings by
qualitatively gauging how strategic producers are in their categorization and positioning
decisions. Finally, prior research has shown that different audiences can view the same

109
category differently (Durand & Paolella, 2013), so it is possible that the optimal position
for critics, or other audiences, is different from the optimal position for consumers.
Future research could examine this question as well.

110
Table 4.1
Correlations and summary statistics
Variable Mean S.D. Min Max (1) (2) (3) (4) (5) (6) (7) (8) (9) (10) (11) (12) (13) (14) (15) (16)
(1) Review Count (ln) 3.06 2.06 -4.61 15.55
(2) Prototype Similarity 0.22 0.13 0.00 1.00 0.01
(3) Exemplar Similarity 0.33 0.17 0.00 1.00 0.16 0.56
(4)Category Density (*10^-
3)72.06 45.94 1.19 173.97 -0.08 -0.23 -0.20
(5) Category Contrast 0.21 0.05 0.14 0.36 0.07 0.36 0.33 -0.49
(6)Developer Category
Spanning1.38 0.80 0.00 9.00 -0.10 0.08 0.10 -0.05 0.09
(7) Uses Category Names 0.45 0.50 0.00 1.00 0.08 0.26 0.28 -0.37 0.33 0.06
(8)Percent Developer Apps
w/ Category Names37.58 42.16 0.00 100.00 0.07 0.21 0.24 -0.33 0.28 0.06 0.86
(9) Review Average (lag) 4.28 0.72 0.00 5.00 -0.13 0.00 -0.04 0.02 -0.03 -0.04 0.00 -0.01
(10) App Age (days) 236.27 132.78 0.00 571.00 0.04 -0.02 -0.07 0.10 0.00 -0.06 -0.02 -0.06 -0.08
(11) Free App 0.96 0.20 0.00 1.00 0.12 0.04 0.02 0.01 -0.06 0.06 0.01 0.01 -0.02 -0.02
(12) Offer In-App Purchases 0.12 0.32 0.00 1.00 0.17 0.02 0.06 -0.13 0.10 -0.04 0.16 0.14 -0.01 -0.02 0.03
(13)Cleansed Descript ion
lenth (char)486.58 416.53 0.00 4636.00 0.15 -0.09 0.20 -0.04 0.01 -0.05 0.19 0.19 -0.04 -0.06 -0.08 0.12
(14) App Size (MB) 13.20 34.46 0.00 2355.20 0.08 -0.02 0.00 -0.10 0.05 -0.03 0.12 0.11 0.00 -0.01 -0.10 0.15 0.08
(15) App Entry Order 1.63 1.29 0.00 10.00 -0.09 0.07 0.09 0.01 0.08 0.45 0.04 0.03 -0.10 -0.08 0.03 -0.06 -0.01 -0.03
(16) Changes Description 0.35 0.48 0.00 1.00 0.16 0.00 0.04 -0.02 0.02 -0.07 -0.01 -0.02 0.01 0.08 -0.06 0.06 0.09 0.02 -0.06
(17)Developer Enters with >1
App0.46 0.50 0.00 1.00 -0.12 0.11 0.11 0.00 0.12 0.50 0.05 0.01 -0.08 -0.06 -0.02 -0.07 -0.06 -0.04 0.53 -0.06

111
Table 4.2
GEE regression models with robust standard errors clustered at the developer level;
dependent variable is log review counts.
VARIABLES Model 1 Model 2 Model 3
Prototype Similarity (centered) -0.700 -0.663[0.089] [0.089](0.000) (0.000)
Exemplar Similarity (centered) 0.780 0.793
[0.070] [0.070](0.000) (0.000)
Prototpye Sim. X Exemplar Sim. -1.003[0.361]
(0.006)
Category Density (*10^-3, centered) 0.000 0.000 0.000[0.000] [0.000] [0.000](0.265) (0.221) (0.213)
Category Contrast 1.616 1.598 1.610[0.360] [0.361] [0.361](0.000) (0.000) (0.000)
Developer Category Spanning -0.191 -0.193 -0.193[0.012] [0.012] [0.012]
(0.000) (0.000) (0.000)
App Uses Category Name -0.024 -0.034 -0.036[0.024] [0.025] [0.025](0.320) (0.172) (0.147)
Percent Developer Apps w/ Category Names 0.001 0.001 0.001[0.000] [0.000] [0.000](0.000) (0.000) (0.000)
Review Average (lagged) -0.184 -0.183 -0.183[0.010] [0.010] [0.010]
(0.000) (0.000) (0.000)
App Age (days) 0.001 0.001 0.001[0.000] [0.000] [0.000](0.000) (0.000) (0.000)
Free App 1.669 1.662 1.662[0.041] [0.041] [0.041](0.000) (0.000) (0.000)
Offer In-App Purchases 0.458 0.456 0.455
[0.033] [0.033] [0.033](0.000) (0.000) (0.000)
Cleansed Description Length (characters) 0.001 0.001 0.001[0.000] [0.000] [0.000](0.000) (0.000) (0.000)
App Size (MB) 0.002 0.002 0.002[0.000] [0.000] [0.000](0.000) (0.000) (0.000)

112
Table 4.2 continued
Note: Robust standard errors clustered at the developer level in brackets; p-value in
parentheses.
VARIABLES Model 1 Model 2 Model 3
App Entry Order -0.026 -0.026 -0.026[0.006] [0.006] [0.006](0.000) (0.000) (0.000)
Changes Description 0.405 0.402 0.402[0.021] [0.021] [0.021](0.000) (0.000) (0.000)
Developer Enters with >1 App -0.295 -0.305 -0.304[0.018] [0.018] [0.018]
(0.000) (0.000) (0.000)
Category Fixed Effects Included Included Included
Wave Fixed Effects Included Included Included
Constant 1.107 1.171 1.184
[0.105] [0.105] [0.105](0.000) (0.000) (0.000)
Observations 470,728 470,728 470,728Number of Developers 82,149 82,149 82,149
chi2 27261 27436 27451p 0 0 0QIC 1,729,571 1,707,863 1,706,729

113
Table 4.3
Logistic regression models with robust standard errors clustered at the developer level;
dependent variable is a binary indicator for apps reaching 100,000 or more downloads.
VARIABLES Model 1
Prototype Similarity (centered) -1.338 [0.178] (0.000)
Exemplar Similarity (centered) 2.752 [0.110] (0.000)
Prototype Sim. X Exemplar Sim. -1.791 [0.662] (0.007)
Controls Included
Category Fixed Effects Included
Wave Fixed Effects Included
Constant -3.976 [1.259]
(0.002)
Observations 107,106 Pseudo R-Squared 0.133 Log Likelihood -18,268
Note: Robust standard errors clustered at the developer level in brackets; p-value in
parentheses.

114
Figure 4.1 Scatterplot of similarity to the category prototype (centered) versus similarity
to a category exemplar (centered).

115
Figure 4.2 Performance analysis (predicted review count) for various levels of similarity
to the category prototype category and to an exemplary category member.

116
Figure 4.3 3-Dimensional plot showing app average predicted performance (review
count) versus both prototypical and exemplar similarity scores (centered).

117
Figure 4.4 Probability of achieving 100,000 or more downloads by prototypical and
exemplar similarity scores (centered). Low exemplar similarity = -0.15 (centered); high
exemplar similarity = 0.65 (centered).

CHAPTER 5
CONCLUSION
In this dissertation, three essays were presented which shed light on how
entrepreneurs create value through the introduction of new products and services under
conditions of uncertainty. This research contributes to a growing body of
entrepreneurship and strategic management scholarly work investigating the process of
value creation.
The first essay theoretically examines entrepreneurial stakeholder enrollment.
Most entrepreneurial endeavors do not initially possess all of the resources they need to
successfully create a valuable opportunity. Some of the needed resources can be acquired
through simple contracts. However, other resources require the resource provider to
provide a level of effort that goes beyond that which is contractible. Such efforts often
require the resource provider to form deep psychological bonds with the entrepreneurial
endeavor. Stakeholder enrollment is the process of forming these bonds with
entrepreneurial endeavors. The target of these bonds can be either the entrepreneur
herself or the entrepreneurial opportunity being pursued. In entrepreneurial settings, these
bonds are typically formed under conditions of risk or uncertainty. Under both risk and
uncertainty, information about the entrepreneur’s experience, reputation, personality,
trustworthiness, charisma, and leadership style is available to stakeholders. However, one

119
important difference between these conditions is that, under risk, information about the
value of the opportunity is available to stakeholders whereas under uncertainty, this
information is not available. Thus, this essay first proposes that under conditions of risk,
the initial target with which a stakeholders forms psychological bonds can be the
entrepreneur, the opportunity, or a combination of both. The essay then proposes that
under conditions of uncertainty, the initial target with which a stakeholders forms
psychological bonds should be the entrepreneur—not the opportunity. These propositions
generate important implications for scholars and practitioners alike. For example, one
practical implication is that under conditions of uncertainty, the opportunity is likely to
evolve and change substantially during the creation process. If stakeholders enroll in an
uncertain opportunity (instead of enrolling in the entrepreneur), then each time
entrepreneurs engaged in a “pivot,” they would have to re-enroll stakeholders. This
implication leads directly into the second essay.
The second essay empirically examines entrepreneurial pivoting. Pivoting is
widely believed to be an important ingredient for entrepreneurial success under
conditions of uncertainty. However, it remains unclear how far entrepreneurs do—and
should—pivot to improve their chances of successfully creating value. This essay draws
on problemistic search and resource-based theory to empirically examine entrepreneurial
pivoting in the context of the Google Play app store. This empirical context allows for the
construction of a continuous measure of pivot distance using text-based analysis.
Consistent with problemistic search theory, the lower the performance (installs) of a
developer’s first app, the further the developer will pivot for its second app. And,
consistent with resource-based theory, pivot distance negatively moderates the

120
relationship between app one installs and app two installs. Further analysis reveals that
this moderating effect of pivot distance takes an inverted-u form: minor pivots
outperform major pivots and not pivoting at all. Taken together, these findings suggest
that app development entrepreneurs tend to “over-pivot” in response to negative
performance feedback and that over-pivoting has a negative effect on performance. These
findings highlight the need for caution when advising entrepreneurs to pivot without
noting the potentially harmful effects of pivoting too far.
The third essay empirically examines how entrepreneurial organizations
competing on a two-sided platform can position new products to maximize value
creation. Platforms, such as internet search engines, Amazon, Netflix, Uber, Airbnb,
video game consoles, YouTube, eBay, iTunes, and the Google Play app store are
important competitive environments in today’s economy. At least two arguments for how
a de novo organization should position its new products on platforms can be derived from
the extant literature. On the one hand, some work suggests that entrepreneurs should
conform by positioning new products in a way that is similar to other products in a
market category to obtain the benefits of legitimacy. On the other hand, another body of
work suggests that entrepreneurs should differentiate by positioning new products in a
way that is different from other products to obtain a competitive advantage. As a result,
de novo organizations competing on a two-sided platform often face uncertainty
regarding how to position their products within a market category. Furthermore, prior
work does not clearly articulate which other products within a market category should be
used as reference points when making this conformity versus differentiation decision.
This essay argues that there are two important judgment devices that organizations can

121
use to strategically categorize themselves within product market categories: the
prototypical category member and the exemplar category member. Using a unique dataset
from the Google Play mobile application store, this essay finds that the optimally distinct
point for a de novo developer’s first app is at low levels of similarity to the prototypical
app, but at high levels of similarity to an exemplar app. Moreover, the essay finds that
prototype similarity negatively moderates the positive effect of exemplar similarity such
that the more an organization aligns with the prototype, the more the organization loses
the competitive advantage gained from similarity to the exemplar. The findings have
important implications for our understanding of competitive dynamics within and across
product markets, strategic positioning at the time of market entry, and the
interdependence of strategic categorization decisions.

REFERENCES
Al-Aali, A., & Teece, D. J. (2014). International entrepreneurship and the theory of the (long-lived) international firm: A capabilities perspective. Entrepreneurship
Theory and Practice, 38(1), 95–116.
Aldrich, H. (1999). Organizations evolving. Thousand Oaks, CA: SAGE Publications.
Aldrich, H. E., & Kenworthy, A. (1999). The accidental entrepreneur: Campbellian antinomies and organizational foundings. Variations in Organization Science: In
Honor of Donald T. Campbell, 19–33.
Alvarez, S. A., & Barney, J. B. (2005). How do entrepreneurs organize firms under conditions of uncertainty? Journal of Management, 31(5), 776–793.
Alvarez, S. A., & Barney, J. B. (2007). Discovery and creation: Alternative theories of entrepreneurial action. Strategic Entrepreneurship Journal, 1(1–2), 11–26.
Alvarez, S. A., & Barney, J. B. (2010). Entrepreneurship and epistemology: The philosophical underpinnings of the study of entrepreneurial opportunities. The
Academy of Management Annals, 4(1), 557–583.
Alvarez, S. A., & Barney, J. B. (2013). Epistemology, opportunities, and entrepreneurship: Comments on Venkataraman et al.(2012) and Shane (2012). Academy of Management Review, 38(1), 154–157.
Alvarez, S. A., Barney, J. B., & Anderson, P. (2013). Forming and exploiting opportunities: The implications of discovery and creation processes for entrepreneurial and organizational research. Organization Science, 24(1), 301–317.
Alvarez, S. A., Young, S. L., & Woolley, J. L. (2015). Opportunities and institutions: A co-creation story of the king crab industry. Journal of Business Venturing, 30(1), 95–112.
Anthony, C., Nelson, A. J., & Tripsas, M. (2016). “Who Are You?…I Really Wanna Know”: Product Meaning and Competitive Positioning in the Nascent Synthesizer Industry. Strategy Science, 1(3), 163–183. https://doi.org/10.1287/stsc.2016.0015
App Annie. (2017). App Annie Market Forecast 2016–2021. Retrieved from www.appannie.com/intelligence

123
Arcot, S. (2014). Participating convertible preferred stock in venture capital exits. Journal of Business Venturing, 29(1), 72–87.
Argyres, N., & Mayer, K. J. (2007). Contract design as a firm capability: An integration of learning and transaction cost perspectives. Academy of Management Review, 32(4), 1060–1077.
Arteaga, R., & Hyland, J. (2013). Pivot: How top entrepreneurs adapt and change course
to find ultimate success. Hoboken, NJ: John Wiley & Sons.
Barlow, M. A., Verhaal, J. C., & Hoskins, J. D. (2016). Guilty by association: Product-level category stigma and audience expectations in the US craft beer industry. Journal of Management. https://doi.org/DOI: 10.1177/0149206316657593
Barney, J. (1991). Firm resources and sustained competitive advantage. Journal of
Management, 17(1), 99–120.
Barroso, A., Giarratana, M. S., Reis, S., & Sorenson, O. (2016). Crowding, satiation, and saturation: The days of television series’ lives. Strategic Management Journal, 37(3), 565–585. https://doi.org/10.1002/smj.2345
Bass, B. M., & Riggio, R. E. (2005). Transformational leadership. Mahwah, NJ: Lawrence Erlbaum Associates.
Basu, R., & Green, S. G. (1997). Leader-member exchange and transformational leadership: An empirical examination of innovative behaviors in leader-member dyads. Journal of Applied Social Psychology, 27(6), 477–499.
Baum, J. A., & Dahlin, K. B. (2007). Aspiration performance and railroads’ patterns of learning from train wrecks and crashes. Organization Science, 18(3), 368–385.
Becker, T. E. (1992). Foci and bases of commitment: Are they distinctions worth making? Academy of Management Journal, 35(1), 232–244.
Becker, T. E. (2012). Interpersonal commitments. In Commitment in organizations:
Accumulated wisdom and new directions (pp. 159–200). New York: Routledge/Taylor & Francis.
Bhawe, N., Rawhouser, H., & Pollack, J. M. (2016). Horse and cart: The role of resource acquisition order in new ventures. Journal of Business Venturing Insights, 6, 7–13.
Blank, S. (2013). Why the lean start-up changes everything. Harvard Business Review, 91(5), 63–72.
Blank, S., & Dorf, B. (2012). The startup owner’s manual: the step-by-step guide for
building a great company. Pescadoro, CA: K&S Ranch, Incorporated.

124
Boone, C., Wezel, F. C., & van Witteloostuijn, A. (2013). Joining the pack or going solo? A dynamic theory of new firm positioning. Journal of Business Venturing, 28(4), 511–527. https://doi.org/10.1016/j.jbusvent.2012.07.006
Brewer, M. (1991). The social self: On being the same and different at the same time. Personality and Social Psychology Bulletin, 17(5), 475–482.
Brinckmann, J., Grichnik, D., & Kapsa, D. (2010). Should entrepreneurs plan or just storm the castle? A meta-analysis on contextual factors impacting the business planning–performance relationship in small firms. Journal of Business Venturing, 25(1), 24–40.
Burns, B., Barney, J., Angus, R., & Herrick, H. (2016). Enrolling stakeholders under conditions of risk and uncertainty. Strategic Entrepreneurship Journal, 10, 97–106.
Cable, D. M., & Shane, S. (1997). A prisoner’s dilemma approach to entrepreneur-venture capitalist relationships. Academy of Management Review, 22(1), 142–176.
Cameron, A. C., Gelbach, J. B., & Miller, D. L. (2011). Robust inference with multiway clustering. Journal of Business & Economic Statistics, 29(2), 238–249. https://doi.org/10.1198/jbes.2010.07136
Campa, J. M., & Kedia, S. (2002). Explaining the diversification discount. The Journal of
Finance, 57(4), 1731–1762.
Carnabuci, G., Operti, E., & Kovács, B. (2015). The categorical imperative and structural reproduction: Dynamics of technological entry in the semiconductor industry. Organization Science, 26(6), 1734–1751. https://doi.org/10.1287/orsc.2015.1011
Carroll, G. R., & Swaminathan, A. (2000). Why the microbrewery movement? Organizational dynamics of resource partitioning in the US brewing industry. American Journal of Sociology, 106(3), 715–762.
Carter, R. B., & Van Auken, H. E. (1990). A comparison of small business and large corporations: Interrelationships among position statement accounts. Journal of
Business and Entrepreneurship, 2(1), 73–80.
Cattani, G., Pennings, J. M., & Wezel, F. C. (2003). Spatial and temporal heterogeneity in founding patterns. Organization Science, 14(6), 670–685. https://doi.org/10.1287/orsc.14.6.640.24874
Cattani, G., Porac, J. F., & Thomas, H. (2017). Categories and competition. Strategic
Management Journal, 38(1), 64–92. https://doi.org/10.1002/smj.2591
Cennamo, C., & Santalo, J. (2013). Platform competition: Strategic trade-offs in platform markets. Strategic Management Journal, 34(11), 1331–1350. https://doi.org/10.1002/smj.2066

125
Chapman, L. (2012, April 26). “Pivoting” pays off for tech entrepreneurs. The Wall Street
Journal.
Chatterjee, S., & Wernerfelt, B. (1991). The link between resources and type of diversification: Theory and evidence. Strategic Management Journal, 12(1), 33–48.
Cheng, B.-S., Jiang, D.-Y., & Riley, J. H. (2003). Organizational commitment, supervisory commitment, and employee outcomes in the Chinese context: Proximal hypothesis or global hypothesis? Journal of Organizational Behavior, 24(3), 313–334.
Cohen, J. B., & Basu, K. (1987). Alternative models of categorization: Toward a contingent processing framework. Journal of Consumer Research, 13(4), 455–472.
Conner, K. R. (1991). A historical comparison of resource-based theory and five schools of thought within industrial organization economics: Do we have a new theory of the firm? Journal of Management, 17(1), 121–154.
Cooper, A. C., Woo, C. Y., & Dunkelberg, W. C. (1989). Entrepreneurship and the initial size of firms. Journal of Business Venturing, 4(5), 317–332.
Cornelissen, J. P., & Clarke, J. S. (2010). Imagining and rationalizing opportunities: Inductive reasoning and the creation and justification of new ventures. Academy
of Management Review, 539–557.
Cui, J. (2007). QIC program and model selection in GEE analyses. Stata Journal, 7(2), 209.
Cyert, R. M., & March, J. G. (1963). A behavioral theory of the firm. Englewood Cliffs, NJ: Prentice-Hall Inc.
Davidsson, P., & Honig, B. (2003). The role of social and human capital among nascent entrepreneurs. Journal of Business Venturing, 18(3), 301–331.
Deephouse, D. L. (1999). To be different, or to be the same? It’s a question (and theory) of strategic balance. Strategic Management Journal, 20(2), 147–166.
Dekker, E. (2016). Exemplary goods: Exemplars as judgment devices. Valuation Studies, 4(2), 103–124.
Delmar, F., & Shane, S. (2003). Does business planning facilitate the development of new ventures? Strategic Management Journal, 24(12), 1165–1185.
Denrell, J., Fang, C., & Winter, S. G. (2003). The economics of strategic opportunity. Strategic Management Journal, 24(10), 977–990.

126
Desai, V. M. (2016). The behavioral theory of the (governed) firm: Corporate board influences on organizations’ responses to performance shortfalls. Academy of
Management Journal, 59(3), 860–879.
DiMaggio, P. J., & Powell, W. W. (1983). The iron cage revisited: Institutional isomorphism and collective rationality in organizational fields. American
Sociological Review, 48(2), 147–160.
Dobrev, S. D., & Barnett, W. P. (2005). Organizational roles and transition to entrepreneurship. Academy of Management Journal, 48(3), 433–449.
Drori, I., & Honig, B. (2013). A process model of internal and external legitimacy. Organization Studies, 34(3), 345–376.
Durand, R., & Kremp, P.-A. (2016). Classical deviation: Organizational and individual status as antecedents of conformity. Academy of Management Journal, 59(1), 65–89. https://doi.org/10.5465/amj.2013.0767
Durand, R., & Paolella, L. (2013). Category stretching: Reorienting research on categories in strategy, entrepreneurship, and organization theory: reorienting research on categories. Journal of Management Studies, 50(6), 1100–1123. https://doi.org/10.1111/j.1467-6486.2011.01039.x
Eggers, J. P., & Song, L. (2015). Dealing with failure: Serial entrepreneurs and the costs of changing industries between ventures. Academy of Management Journal, 58(6), 1785–1803.
Eisenhardt, K. M., & Martin, J. A. (2000). Dynamic capabilities: What are they? Strategic Management Journal, 21, 1105–1121.
Ethiraj, S. K., & Zhu, D. H. (2008). Performance effects of imitative entry. Strategic
Management Journal, 29(8), 797–817. https://doi.org/10.1002/smj.696
Felin, T., & Zenger, T. R. (2009). Entrepreneurs as theorists: On the origins of collective beliefs and novel strategies. Strategic Entrepreneurship Journal, 3(2), 127–146.
Ferris, G. R., Blass, F. R., Douglas, C., Kolodinsky, R. W., Treadway, D. C., & Greenburg, J. (2003). Personal reputation in organizations. Organizational
Behavior: A Management Challenge, 201.
Fisher, G., Kotha, S., & Lahiri, A. (2016). Changing with the times: An integrated view of identity, legitimacy, and new venture life cycles. Academy of Management
Review, 41(3), 383–409.
Freeman, R. E. (1984). Strategic management: A stakeholder approach. Cambridge, UK: Cambridge University Press.

127
Furr, N., & Ahlstrom, P. (2011). Nail it then scale it: The entrepreneur’s guide to
creating and managing breakthrough innovation. Provo, UT: NISI Institute.
Gartner, W. B., Frid, C. J., & Alexander, J. C. (2012). Financing the emerging firm. Small Business Economics, 39(3), 745–761.
Gavetti, G., & Menon, A. (2016). Evolution cum agency: Toward a model of strategic foresight. Strategy Science, 1(3), 207–233.
Gentner, D., & Markman, A. B. (1994). Structural alignment in comparison: No difference without similarity. Psychological Science, 5(3), 152–158.
Goldberg, A., Srivastava, S. B., Manian, V. G., Monroe, W., & Potts, C. (2016). Fitting in or standing out? The tradeoffs of structural and cultural embeddedness. American Sociological Review, 81(6), 1190–1222.
Gompers, P. A., & Lerner, J. (1999). What drives venture capital fundraising? National Bureau of Economic Research.
Greve, H. R. (1998). Performance, aspirations, and risky organizational change. Administrative Science Quarterly, 58–86.
Greve, H. R. (2003). A behavioral theory of R&D expenditures and innovations: Evidence from shipbuilding. Academy of Management Journal, 46(6), 685–702.
Greve, H. R. (2008). A behavioral theory of firm growth: Sequential attention to size and performance goals. Academy of Management Journal, 51(3), 476–494.
Grimes, M. (2018). The pivot: How founders respond to feedback through idea and identity work. Academy of Management Journal, forthcoming.
Gupta, V., MacMillan, I. C., & Surie, G. (2004). Entrepreneurial leadership: Developing and measuring a cross-cultural construct. Journal of Business Venturing, 19(2), 241–260.
Guthrie, J. P., & Hollensbe, E. C. (2004). Group incentives and performance: A study of spontaneous goal setting, goal choice and commitment. Journal of Management, 30(2), 263–284.
Hall, R. E., & Woodward, S. E. (2010). The burden of the nondiversifiable risk of entrepreneurship. The American Economic Review, 100(3), 1163–1194.
Hannan, M. T., Polós, L., & Carroll, G. R. (2007). Logics of organization theory. Princeton, NJ: Princeton University Press.
Hart, O., & Moore, J. (1990). Property Rights and the Nature of the Firm. Journal of
Political Economy, 1119–1158.

128
Haveman, H. A. (1993). Follow the leader: Mimetic isomorphism and entry into new markets. Administrative Science Quarterly, 38(4), 593–627.
Hellmann, T., & Puri, M. (2002). Venture capital and the professionalization of start-up firms: Empirical evidence. The Journal of Finance, 57(1), 169–197.
Hoberg, G., & Phillips, G. (2010). Product market synergies and competition in mergers and acquisitions: A text-based analysis. Review of Financial Studies, 23(10), 3773–3811.
Hoberg, G., Phillips, G., & Prabhala, N. (2014). Product market threats, payouts, and financial flexibility. The Journal of Finance, 69(1), 293–324.
Hoetker, G. (2007). The use of logit and probit models in strategic management research: Critical issues. Strategic Management Journal, 28(4), 331.
Hollenbeck, J. R., & Klein, H. J. (1987). Goal commitment and the goal-setting process: Problems, prospects, and proposals for future research. Journal of Applied
Psychology, 72(2), 212.
Howard, P. (2018). Craftwashing in the U.S. beer industry. Beverages, 4(1), 1. https://doi.org/10.3390/beverages4010001
Hsu, G. (2006). Evaluative schemas and the attention of critics in the US film industry. Industrial and Corporate Change, 15(3), 467–496. https://doi.org/10.1093/icc/dtl009
Hsu, G. (2006). Jacks of all trades and masters of none: Audiences’ reactions to spanning genres in feature film production. Administrative Science Quarterly, 51(3), 420–450.
Hsu, G., & Grodal, S. (2015). Category taken-for-grantedness as a strategic opportunity: The case of light cigarettes, 1964 to 1993. American Sociological Review, 80(1), 28–62.
Hsu, G., & Hannan, M. T. (2005). Identities, genres, and organizational forms. Organization Science, 16(5), 747–490.
Hsu, G., Hannan, M. T., & Koçak, Ö. (2009). Multiple category memberships in markets: An integrative theory and two empirical tests. American Sociological Review, 74(1), 150–169. https://doi.org/10.1177/000312240907400108
Johnson, R. E., & Yang, L.-Q. (2010). Commitment and motivation at work: The relevance of employee identity and regulatory focus. Academy of Management
Review, 35(2), 226–245.

129
Kahl, S. J., & Grodal, S. (2016). Discursive strategies and radical technological change: Multilevel discourse analysis of the early computer (1947-1958). Strategic
Management Journal, 37(1), 149–166. https://doi.org/10.1002/smj.2453
Kaplan, S. N., & Strömberg, P. (2003). Financial contracting theory meets the real world: An empirical analysis of venture capital contracts. The Review of Economic
Studies, 70(2), 281–315.
Kennedy, M. T. (2005). Behind the one-way mirror: Refraction in the construction of product market categories. Poetics, 33(3–4), 201–226.
Kennedy, M. T. (2008). Getting counted: Markets, media, and reality. American
Sociological Review, 73(2), 270–295. https://doi.org/10.1177/000312240807300205
Kennedy, M. T., & Fiss, P. C. (2013). An ontological turn in categories research: From standards of legitimacy to evidence of actuality. Journal of Management Studies, 50(6), 1138–1154. https://doi.org/10.1111/joms.12031
Khanna, R., Guler, I., & Nerkar, A. (2016). Fail often, fail big, and fail fast? Learning from small failures and R&D performance in the pharmaceutical industry. Academy of Management Journal, 59(2), 436–459.
Khessina, O. M., & Carroll, G. R. (2008). Product demography of de novo and de alio firms in the optical disk drive industry, 1983–1999. Organization Science, 19(1), 25–38. https://doi.org/10.1287/orsc.1070.0301
Klein, H. J., Molloy, J. C., & Brinsfield, C. T. (2012). Reconceptualizing workplace commitment to redress a stretched construct: Revisiting assumptions and removing confounds. Academy of Management Review, 37(1), 130–151.
Klein, H. J., Wesson, M. J., Hollenbeck, J. R., & Alge, B. J. (1999). Goal commitment and the goal-setting process: Conceptual clarification and empirical synthesis. Journal of Applied Psychology, 84(6), 885.
Knight, F. H. (1921). Risk, uncertainty and profit. New York: Hart, Schaffner and Marx.
Kotha, R., & George, G. (2012). Friends, family, or fools: Entrepreneur experience and its implications for equity distribution and resource mobilization. Journal of
Business Venturing, 27(5), 525–543.
Kovács, B., & Hannan, M. T. (2010). The consequences of category spanning depend on contrast. In Research in the Sociology of Organizations (Vol. 31, pp. 175–201). Bingley, UK: Emerald Group Publishing.
Kwon, O.-W., & Lee, J.-H. (2003). Text categorization based on k-nearest neighbor approach for web site classification. Information Processing & Management, 39(1), 25–44.

130
Leung, M. D., & Sharkey, A. J. (2013). Out of sight, out of mind? Evidence of perceptual factors in the multiple-category discount. Organization Science, Articles in
Advance, 1–14. https://doi.org/10.1287/orsc.2013.0828
Levinthal, D. A. (1997). Adaptation on rugged landscapes. Management Science, 43(7), 934–950.
Levitt, B., & March, J. G. (1988). Organizational learning. Annual Review of Sociology, 319–340.
Liang, K.-Y., & Zeger, S. L. (1986). Longitudinal data analysis using generalized linear models. Biometrika, 73(1), 13–22.
Lok, P., Westwood, R., & Crawford, J. (2005). Perceptions of organisational subculture and their significance for organisational commitment. Applied Psychology, 54(4), 490–514.
Lounsbury, M., & Glynn, M. A. (2001). Cultural entrepreneurship: Stories, legitimacy, and the acquisition of resources. Strategic Management Journal, 22(6–7), 545–564. https://doi.org/10.1002/smj.188
Lumpkin, G. T., & Dess, G. G. (1996). Clarifying the entrepreneurial orientation construct and linking it to performance. Academy of Management Review, 21(1), 135–172.
March, J. G., & Simon, H. A. (1958). Organizations. Cambridge, MA: John Wiley & Sons.
Markman, A. B., & Gentner, D. (1993). Structural alignmnet during similarity comparisons. Cognitive Psychology, 25, 431–467.
Mathieu, J. E., & Zajac, D. M. (1990). A review and meta-analysis of the antecedents, correlates, and consequences of organizational commitment. Psychological
Bulletin, 108(2), 171.
McGinn, D. (2012). Too many pivots, too little passion: What’s wrong with today’s entrepreneurism. Harvard Business Review, 134-135.
McIntyre, D. P., & Srinivasan, A. (2017). Networks, platforms, and strategy: Emerging views and next steps. Strategic Management Journal, 38(1), 141–160. https://doi.org/10.1002/smj.2596
Meyer, J. P., Becker, T. E., & Vandenberghe, C. (2004). Employee commitment and motivation: A conceptual analysis and integrative model. Journal of Applied
Psychology, 89(6), 991.
Meyer, J. P., & Herscovitch, L. (2001). Commitment in the workplace: Toward a general model. Human Resource Management Review, 11(3), 299–326.

131
Meyer, J. P., Stanley, D. J., Herscovitch, L., & Topolnytsky, L. (2002). Affective, continuance, and normative commitment to the organization: A meta-analysis of antecedents, correlates, and consequences. Journal of Vocational Behavior, 61(1), 20–52.
Miller, D. J. (2006). Technological diversity, related diversification, and firm performance. Strategic Management Journal, 27(7), 601–619.
Moeen, M. (2017). Entry into nascent industries: Disentangling a firm’s capability portfolio at the time of investment versus market entry. Strategic Management
Journal. https://doi.org/10.1002/smj.2642
Navis, C., & Glynn, M. A. (2010). How new market categories emerge: Temporal dynamics of legitimacy, identity, and entrepreneurship in satellite radio, 1990–2005. Administrative Science Quarterly, 55(3), 439–471.
Navis, C., & Ozbek, O. V. (2016). The right people in the wrong places: The paradox of entrepreneurial entry and successful opportunity realization. Academy of
Management Review, 41(1), 109–129.
Negro, G., Hannan, M. T., & Rao, H. (2010). Categorical contrast and audience appeal: Niche width and critical success in winemaking. Industrial and Corporate
Change, 19(5), 1397–1425. https://doi.org/10.1093/icc/dtq003
Negro, G., Hannan, M. T., & Rao, H. (2011). Category reinterpretation and defection: Modernism and tradition in Italian winemaking. Organization Science, 22(6), 1449–1463. https://doi.org/10.1287/orsc.1100.0619
Negro, G., Koçak, Ö., & Hsu, G. (2010). Research on categories in the sociology of organizations. In Research in the Sociology of Organizations (Vol. 31, pp. 3–35). Bingley: Emerald Group Publishing.
Nicolaou, N., Shane, S., Cherkas, L., Hunkin, J., & Spector, T. D. (2008). Is the tendency to engage in entrepreneurship genetic? Management Science, 54(1), 167–179.
Oliver, C. (1991). Strategic responses to institutional processes. Academy of Management
Review, 16(1), 145. https://doi.org/10.2307/258610
Oliver, C. (1997). The influence of institutional and task environment relationships on organizational performance: The Canadian construction industry. Journal of
Management Studies, 34(1), 99–124.
Parhankangas, A., & Ehrlich, M. (2014). How entrepreneurs seduce business angels: An impression management approach. Journal of Business Venturing, 29(4), 543–564.
Peteraf, M. A. (1993). The cornerstones of competitive advantage: A resource-based view. Strategic Management Journal, 14(3), 179–191.

132
Pontikes, E. G., & Barnett, W. P. (2015). The persistence of lenient market categories. Organization Science, 26(5), 1415–1431.
Pontikes, E. G., & Barnett, W. P. (2016). The non-consensus entrepreneur organizational responses to vital events. Administrative Science Quarterly, 1839216661150.
Pontikes, E. G., & Kim, R. (2017). Strategic Categorization. In R. Durand, N. Granqvist, & A. Tyllström (Eds.), Research in the Sociology of Organizations (Vol. 51, pp. 71–111). Emerald Publishing Limited.
Posen, H. E., & Levinthal, D. A. (2012). Chasing a moving target: Exploitation and exploration in dynamic environments. Management Science, 58(3), 587–601. https://doi.org/10.1287/mnsc.1110.1420
Rao, H., Monin, P., & Durand, R. (2003). Institutional change in Toque Ville: Nouvelle cuisine as an identity movement in French gastronomy. American Journal of
Sociology, 108(4), 795–843.
Ravid, S. A., & Spiegel, M. (1997). Optimal financial contracts for a start-up with unlimited operating discretion. Journal of Financial and Quantitative Analysis, 32(3), 269–286.
Reichers, A. E. (1985). A review and reconceptualization of organizational commitment. Academy of Management Review, 10(3), 465–476.
Rich, B. L., Lepine, J. A., & Crawford, E. R. (2010). Job engagement: Antecedents and effects on job performance. Academy of Management Journal, 53(3), 617–635.
Ries, E. (2011). The lean startup: How today’s entrepreneurs use continuous innovation
to create radically successful businesses. Random House LLC.
Rindova, V. P., & Petkova, A. P. (2007). When is a new thing a good thing? Technological change, product form design, and perceptions of value for product innovations. Organization Science, 18(2), 217–232.
Roberts, E. B. (1991). Entrepreneurs in high technology: Lessons from MIT and beyond. New York, NY: Oxford University Press.
Roberts, P. W., & Sterling, A. D. (2012). Network progeny? Prefounding social ties and the success of new entrants. Management Science, 58(7), 1292–1304.
Rosa, J. A., Porac, J. F., Runser-Spanjol, J., & Saxon, M. S. (1999). Sociocognitive dynamics in a product market. Journal of Marketing, 63, 64. https://doi.org/10.2307/1252102
Rosch, E., & Lloyd, B. B. (1978). Cognition and categorization (Vol. 1). Hillsdale, NJ: Lawrence Erlbaum Associates.
133
Rosch, E., & Mervis, C. B. (1975). Family resemblances: Studies in the internal structure of categories. Cognitive Psychology, 7(4), 573–605.
Sarasvathy, S. D. (2001). Causation and effectuation: Toward a theoretical shift from economic inevitability to entrepreneurial contingency. Academy of Management
Review, 26(2), 243–263.
Sarasvathy, S. D. (2008). Effectuation: Elements of entrepreneurial expertise. Cheltenham, U.K.: Edward Elgar Publishing.
Shane, S. (2000). Prior knowledge and the discovery of entrepreneurial opportunities. Organization Science, 11(4), 448–469.
Shane, S., & Cable, D. (2002). Network ties, reputation, and the financing of new ventures. Management Science, 48(3), 364–381.
Shane, S., & Stuart, T. (2002). Organizational endowments and the performance of university start-ups. Management Science, 48(1), 154–170.
Silverthorne, C. (2004). The impact of organizational culture and person-organization fit on organizational commitment and job satisfaction in Taiwan. Leadership &
Organization Development Journal, 25(7), 592–599.
Stinchcombe, A. L. (1965). Social structure and organizations. In J. G. March (Ed.), Handbook of Organizations (Vol. 7, pp. 142–193). New York, NY: Routledge.
Suarez, F. F., Grodal, S., & Gotsopoulos, A. (2015). Perfect timing? Dominant category, dominant design, and the window of opportunity for firm entry. Strategic
Management Journal, 36(3), 437–448. https://doi.org/10.1002/smj.2225
Teece, D. J. (2014). The foundations of enterprise performance: Dynamic and ordinary capabilities in an (economic) theory of firms. The Academy of Management
Perspectives, 28(4), 328–352.
Teece, D. J., Pisano, G. P., & Shuen, A. (1997). Dynamic capabilities and strategic management. Strategic Management Journal, 18(7), 509–533.
Thomas, L. D., Autio, E., & Gann, D. M. (2015). Architectural leverage: Putting platforms in context. The Academy of Management Perspectives, 28(2), 198–219.
Tipler, P. A., & Mosca, G. (2007). Physics for scientists and engineers. New York, NY: W. H. Freeman Company.
Toft-Kehler, R. V., Wennberg, K., & Kim, P. H. (2016). A little bit of knowledge is a dangerous thing: Entrepreneurial experience and new venture disengagement. Journal of Business Venturing Insights, 6, 36–46.

134
Vergne, J.-P., & Wry, T. (2014). Categorizing categorization research: Review, integration, and future directions. Journal of Management Studies, 51(1), 56–94. https://doi.org/10.1111/joms.12044
Vogel, P. (2016). From venture idea to venture opportunity. Entrepreneurship Theory
and Practice, 41(6), 943-971.
Weber, M. (1949). Methodology of social sciences. Glencoe, IL: Free Press.
Wernerfelt, B. (1984). A resource-based view of the firm. Strategic Management
Journal, 5(2), 171–180.
Williamson, O. E. (1985). The economic institutions of capitalism. New York: Free Press.
Wry, T., Lounsbury, M., & Glynn, M. A. (2011). Legitimating nascent collective identities: Coordinating cultural entrepreneurship. Organization Science, 22(2), 449–463. https://doi.org/10.1287/orsc.1100.0613
Zelner, B. A. (2009). Using simulation to interpret results from logit, probit, and other nonlinear models. Strategic Management Journal, 30(12), 1335–1348.
Zhao, E., Ishihara, M., Jennings, P., & Lounsbury, M. (2017). An exemplar-based model of proto-category evolution: Strategic differentiation and performance in console video game industry. Indiana University Working Paper.
Zhao, E. Y., Fisher, G., Lounsbury, M., & Miller, D. (2017). Optimal distinctiveness: Broadening the interface between institutional theory and strategic management. Strategic Management Journal, 38(1), 93–113. https://doi.org/10.1002/smj.2589
Zhu, F., & Iansiti, M. (2012). Entry into platform-based markets. Strategic Management
Journal, 33(1), 88–106. https://doi.org/10.1002/smj.941
Zott, C., & Huy, Q. N. (2007). How entrepreneurs use symbolic management to acquire resources. Administrative Science Quarterly, 52(1), 70–105.
Zuckerman, E. W. (1999). The categorical imperative: Securities analysts and the illegitimacy discount. American Journal of Sociology, 104(5), 1398–1438.
Zwilling, M. (2011, September 16). Top 10 Ways Entrepreneurs Pivot a Lean Startup. Retrieved May 9, 2017, from https://www.forbes.com/sites/martinzwilling/2011/09/16/top-10-ways-entrepreneurs-pivot-a-lean-startup/#4bd45ae2d2bd