entropy and the second and third laws of thermodynamics
TRANSCRIPT

5.1 The Universe Has a NaturalDirection of Change
5.2 Heat Engines and the SecondLaw of Thermodynamics
5.3 Introducing Entropy
5.4 Calculating Changes inEntropy
5.5 Using Entropy to Calculatethe Natural Direction of aProcess in an Isolated System
5.6 The Clausius Inequality
5.7 The Change of Entropy in theSurroundings and =
5.8 Absolute Entropies and theThird Law of Thermodynamics
5.9 Standard States in EntropyCalculations
5.10 Entropy Changes in ChemicalReactions
5.11 (Supplemental) EnergyEfficiency: Heat Pumps,Refrigerators, and RealEngines
5.12 (Supplemental) Using the Factthat S Is a State Function toDetermine the Dependenceof S on V and T
5.13 (Supplemental) TheDependence of S on T and P
5.14 (Supplemental) TheThermodynamicTemperature Scale
¢S + ¢Ssurroundings
¢Stotal
Entropy and theSecond and Third Laws
of Thermodynamics
Real-world processes have a natural direction of change. Heat flows
from hotter bodies to colder bodies, and gases mix rather than separate.
Entropy, designated by S, is the state function that predicts the direction
of natural, or spontaneous, change and entropy increases for a sponta-
neous change in an isolated system. For a spontaneous change in a system
interacting with its environment, the sum of the entropy of the system
and that of the surroundings increases. In this chapter, we introduce
entropy, derive the conditions for spontaneity, and show how S varies with
the macroscopic variables P, V, and T.
5.1 The Universe Has a Natural Direction ofChange
To this point, we have discussed q and w, as well as U and H. The first law of thermody-namics states that in any process, the total energy of the universe remains constant.However, it does not predict which of several possible energy conserving processes willoccur. Consider the following two examples. A metal rod initially at a uniform tempera-ture could, in principle, undergo a spontaneous transformation in which one end becomeshot and the other end becomes cold without being in conflict with the first law, as long asthe total energy of the rod remains constant. However, experience demonstrates that thisdoes not occur. Similarly, an ideal gas that is uniformly distributed in a rigid adiabaticcontainer could undergo a spontaneous transformation such that all of the gas moves toone-half of the container, leaving a vacuum in the other half. For an ideal gas,
, therefore the energy of the initial and final states is the same. Neither ofthese transformations violates the first law of thermodynamics—and yet neither occurs.
Experience tells us that there is a natural direction of change in these twoprocesses. A metal rod with a temperature gradient reaches a uniform temperature atsome time after it has been isolated from a heat source. A gas confined to one-half of acontainer with a vacuum in the other half distributes itself uniformly throughout thecontainer if a valve separating the two parts is opened. The transformations describedin the previous paragraph are unnatural transformations. The word unnatural is
(0U>0V)T = 0
85
5 CH
AP
TE
R
05 Chapter 47503.qxd 11/28/11 4:23 PM Page 85

86 CHAPTER 5 Entropy and the Second and Third Laws of Thermodynamics
used to indicate that such an energy-conserving process can occur but is extremelyunlikely. By contrast, the reverse processes, in which the temperature gradient alongthe rod disappears and the gas becomes distributed uniformly throughout the con-tainer, are natural transformations, also called spontaneous processes, which areextremely likely. Spontaneous does not mean that the process occurs immediately, butrather that it will occur with high probability if any barrier to the change is overcome.For example, the transformation of a piece of wood to CO2 and H2O in the presence ofoxygen is spontaneous, but it only occurs at elevated temperatures because an activa-tion energy barrier must be overcome for the reaction to proceed.
Our experience is sufficient to predict the direction of spontaneous change for thetwo examples cited, but can the direction of spontaneous change be predicted in lessobvious cases? In this chapter, we show that there is a thermodynamic function calledentropy that allows us to predict the direction of spontaneous change for a system in agiven initial state. For example, assume that a reaction vessel contains a given numberof moles of N2, H2, and NH3 at 600 K and at a total pressure of 280 bar. An iron cata-lyst is introduced that allows the mixture of gases to equilibrate according to
. What is the direction of spontaneous change, and whatare the partial pressures of the three gases at equilibrium? The answer to this question isobtained by calculating the entropy change in the system and the surroundings.
Most students are initially uncomfortable when working with entropy becauseentropy is further removed from direct experience than energy, work, or heat.Historically, entropy was introduced by Clausius in 1850, several decades beforeentropy was understood at a microscopic level by Boltzmann. Boltzmann’s explanationof entropy will be presented in Chapter 32, and we briefly state his conclusions here. Atthe microscopic level, matter consists of atoms or molecules that have energeticdegrees of freedom (i.e., translational, rotational, vibrational, and electronic), each ofwhich is associated with discrete energy levels that can be calculated using quantummechanics. Quantum mechanics also characterizes a molecule by a state associatedwith a set of quantum numbers and a molecular energy. Entropy is a measure of thenumber of quantum states accessible to a macroscopic system at a given energy.Quantitatively, , where W is the number of states accessible to the system,and . As demonstrated later in this chapter, the entropy of an isolated systemis maximized at equilibrium. Therefore, the approach to equilibrium can be envisionedas a process in which the system achieves the distribution of energy among moleculesthat corresponds to a maximum value of W and, correspondingly, to a maximum in S.
5.2 Heat Engines and the Second Law ofThermodynamics
The development of entropy presented here follows the historical route by which thisstate function was first introduced. The concept of entropy arose as 19th-century scien-tists attempted to maximize the work output of engines. An automobile engine operatesin a cyclical process of fuel intake, compression, ignition and expansion, and exhaust,which occurs several thousand times per minute and is used to perform work on the sur-roundings. Because the work produced by such an engine is a result of the heat releasedin a combustion process, it is referred to as a heat engine. An idealized version of a heatengine is depicted in Figure 5.1. The system consists of a working substance (in this casean ideal gas) confined in a piston and cylinder assembly with diathermal walls. Thisassembly can be brought into contact with a hot reservoir at Thot or a cold reservoir atTcold. The expansion or contraction of the gas caused by changes in its temperature drivesthe piston in or out of the cylinder. This linear motion is converted to circular motion asshown in Figure 5.1, and the rotary motion is used to do work in the surroundings.
The efficiency of a heat engine is of particular interest in practical applications.Experience shows that work can be converted to heat with 100% efficiency. Consideran example from calorimetry discussed in Chapter 4, in which electrical work is doneon a resistive heater immersed in a water bath. We observe that all of the electrical workdone on the heater has been converted to heat, resulting in an increase in the temperature
k = R>NA
S = k ln W
1>2 N2 + 3>2 H2 Δ NH3
05 Chapter 47503.qxd 11/28/11 4:23 PM Page 86

5.2 HEAT ENGINES AND THE SECOND LAW OF THERMODYNAMICS 87
of the water and the heater. What is the maximum theoretical efficiency of the reverseprocess, the conversion of heat to work? As shown later, it is less than 100%. There is anatural asymmetry in the efficiency of converting work to heat and converting heat towork. Thermodynamics provides an explanation for this asymmetry.
As discussed in Section 2.7, the maximum work output in an isothermal expansionoccurs in a reversible process. For this reason, we next calculate the efficiency of areversible heat engine, because the efficiency of a reversible engine is an upper boundto the efficiency of a real engine. This reversible engine converts heat into work byexploiting the spontaneous tendency of heat to flow from a hot reservoir to a cold reser-voir. It does work on the surroundings by operating in a cycle of reversible expansionsand compressions of an ideal gas in a piston and cylinder assembly. We discuss auto-motive engines in Section 5.11.
The cycle for a reversible heat engine is shown in Figure 5.2 in a P–V diagram. Theexpansion and compression steps are designed so that the engine returns to its initial stateafter four steps. Recall from Section 2.7 that the area within the cycle equals the work doneby the engine. As discussed later, four separate isothermal and adiabatic steps are needed tomake the enclosed area in the cycle greater than zero. Beginning at point a, the first segmentis a reversible isothermal expansion in which the gas absorbs heat from the reservoir at Thot,and does work on the surroundings. In the second segment, the gas expands further, thistime adiabatically. Work is also done on the surroundings in this step. At the end of the sec-ond segment, the gas has cooled to the temperature Tcold. The third segment is an isother-mal compression in which the surroundings do work on the system and heat is absorbed bythe cold reservoir. In the final segment, the gas is compressed to its initial volume, this timeadiabatically. Work is done on the system in this segment, and the temperature returns toits initial value, Thot. In summary, heat is taken up by the engine in the first segment atThot, and released to the surroundings in the third segment at Tcold. Work is done on the
Thot
Tcold
FIGURE 5.1A schematic depiction of a heat engine isshown. Changes in temperature of theworking substance brought about by con-tacting the cylinder with hot or cold reser-voirs generate a linear motion that ismechanically converted to a rotarymotion, which is used to do work.
Thot
Tcold
Thot
Tcold
Thot
Tcold
Thot
Tcold
Adiabatic expansion
Isothermal compression
Volume
Pre
ssur
e
Adiabaticcompression
Isothermal expansion
Va Vd Vb Vc
a
d
b
c
Pa
Pb
Pd
Pc
0
FIGURE 5.2A reversible Carnot cycle for a sample ofan ideal gas working substance is shownon an indicator diagram. The cycle con-sists of two adiabatic and two isothermalsegments. The arrows indicate the direc-tion in which the cycle is traversed. Theinsets show the volume of gas and thecoupling to the reservoirs at the beginningof each successive segment of the cycle.The coloring of the contents of the cylin-der indicates the presence of the gas andnot its temperature. The volume of thecylinder shown is that at the beginning ofthe appropriate segment.
05 Chapter 47503.qxd 11/28/11 4:23 PM Page 87
88 CHAPTER 5 Entropy and the Second and Third Laws of Thermodynamics
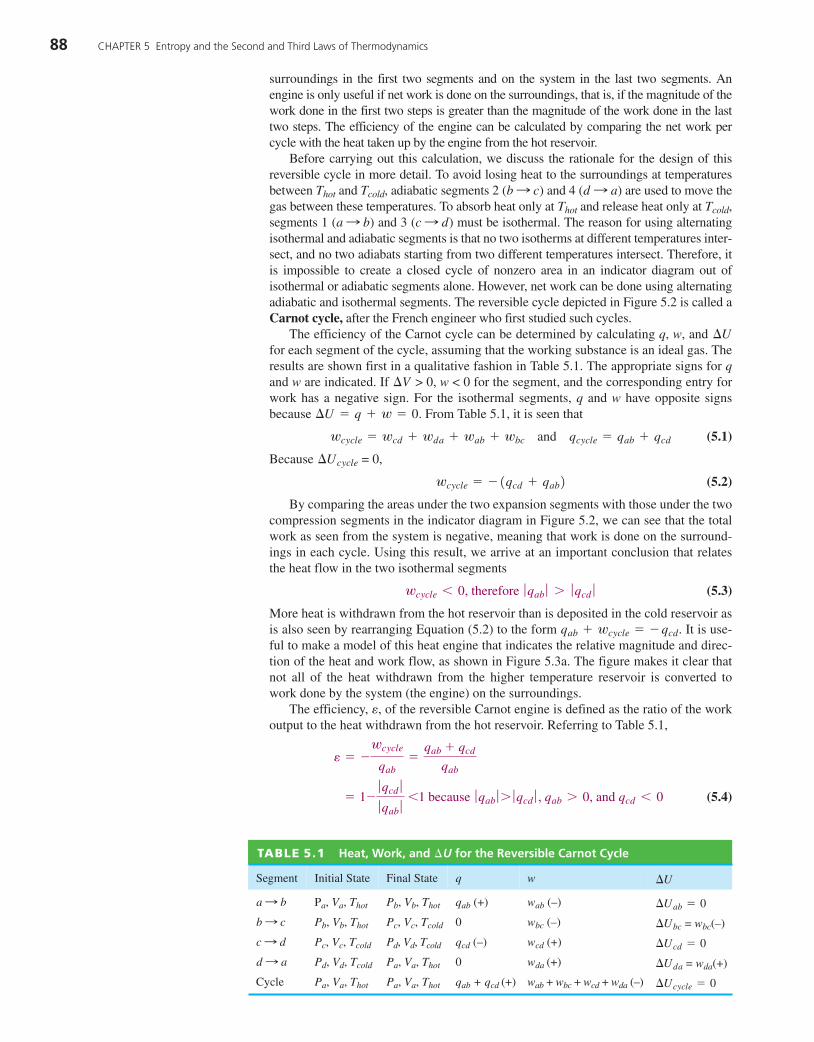
surroundings in the first two segments and on the system in the last two segments. Anengine is only useful if net work is done on the surroundings, that is, if the magnitude of thework done in the first two steps is greater than the magnitude of the work done in the lasttwo steps. The efficiency of the engine can be calculated by comparing the net work percycle with the heat taken up by the engine from the hot reservoir.
Before carrying out this calculation, we discuss the rationale for the design of thisreversible cycle in more detail. To avoid losing heat to the surroundings at temperaturesbetween Thot and Tcold, adiabatic segments 2 and 4 are used to move thegas between these temperatures. To absorb heat only at Thot and release heat only at Tcold,segments 1 and 3 must be isothermal. The reason for using alternatingisothermal and adiabatic segments is that no two isotherms at different temperatures inter-sect, and no two adiabats starting from two different temperatures intersect. Therefore, itis impossible to create a closed cycle of nonzero area in an indicator diagram out ofisothermal or adiabatic segments alone. However, net work can be done using alternatingadiabatic and isothermal segments. The reversible cycle depicted in Figure 5.2 is called aCarnot cycle, after the French engineer who first studied such cycles.
The efficiency of the Carnot cycle can be determined by calculating q, w, and for each segment of the cycle, assuming that the working substance is an ideal gas. Theresults are shown first in a qualitative fashion in Table 5.1. The appropriate signs for qand w are indicated. If > 0, w < 0 for the segment, and the corresponding entry forwork has a negative sign. For the isothermal segments, q and w have opposite signsbecause . From Table 5.1, it is seen that
(5.1)
Because = 0,
(5.2)
By comparing the areas under the two expansion segments with those under the twocompression segments in the indicator diagram in Figure 5.2, we can see that the totalwork as seen from the system is negative, meaning that work is done on the surround-ings in each cycle. Using this result, we arrive at an important conclusion that relatesthe heat flow in the two isothermal segments
(5.3)
More heat is withdrawn from the hot reservoir than is deposited in the cold reservoir asis also seen by rearranging Equation (5.2) to the form . It is use-ful to make a model of this heat engine that indicates the relative magnitude and direc-tion of the heat and work flow, as shown in Figure 5.3a. The figure makes it clear thatnot all of the heat withdrawn from the higher temperature reservoir is converted towork done by the system (the engine) on the surroundings.
The efficiency, , of the reversible Carnot engine is defined as the ratio of the workoutput to the heat withdrawn from the hot reservoir. Referring to Table 5.1,
(5.4) = 1-
ƒ qcd ƒ
ƒ qab ƒ
61 because ƒ qab ƒ 7 ƒ qcd ƒ , qab 7 0, and qcd 6 0
e = -
wcycle
qab=
qab + qcd
qab
e
qab + wcycle = - qcd
wcycle 6 0, therefore ƒ qab ƒ 7 ƒ qcd ƒ
wcycle = - (qcd + qab)
¢Ucycle
wcycle = wcd + wda + wab + wbc and qcycle = qab + qcd
¢U = q + w = 0
¢V
¢U
(c : d)(a : b)
(d : a)(b : c)
TABLE 5.1 Heat, Work, and for the Reversible Carnot Cycle¢U
Segment Initial State Final State q w ¢U
a : b Pa, Va, Thot Pb, Vb, Thot qab (+) wab (–) ¢Uab = 0
b : c Pb, Vb, Thot Pc, Vc, Tcold 0 wbc (–) = wbc(–)¢Ubc
c : d Pc, Vc, Tcold Pd, Vd, Tcold qcd (–) wcd (+) ¢Ucd = 0
d : a Pd, Vd, Tcold Pa, Va, Thot 0 wda (+) = wda(+)¢Uda
Cycle Pa, Va, Thot Pa, Va, Thot qab + qcd (+) wab + wbc + wcd + wda (–) ¢Ucycle = 0
05 Chapter 47503.qxd 11/28/11 4:23 PM Page 88

5.2 HEAT ENGINES AND THE SECOND LAW OF THERMODYNAMICS 89
Both qab and qcd are nonzero because the corresponding processes are isothermal.Equation (5.4) shows that the efficiency of a heat engine operating in a reversibleCarnot cycle is always less than one. Equivalently, not all of the heat withdrawnfrom the hot reservoir can be converted to work. This conclusion is valid for allengines and illustrates the asymmetry in converting heat to work and work to heat.
These considerations on the efficiency of reversible heat engines led to theKelvin–Planck formulation of the second law of thermodynamics:
It is impossible for a system to undergo a cyclic process whose sole effects arethe flow of heat into the system from a heat reservoir and the performance of anequal amount of work by the system on the surroundings.
The second law asserts that the heat engine depicted in Figure 5.3b cannot beconstructed. Any heat engine must eject heat into the cold reservoir as shown inFigure 5.3a. The second law has been put to the test many times by inventors whohave claimed that they have invented an engine that has an efficiency of 100%. Nosuch claim has ever been validated. To test the assertion made in this statement ofthe second law, imagine that such an engine has been invented. We mount it on aboat in Seattle and set off on a journey across the Pacific Ocean. Heat is extractedfrom the ocean, which is the single heat reservoir, and is converted entirely to workin the form of a rapidly rotating propeller. Because the ocean is huge, the decreasein its temperature as a result of withdrawing heat is negligible. By the time wearrive in Japan, not a gram of diesel fuel has been used, because all the heat neededto power the boat has been extracted from the ocean. The money that was saved onfuel is used to set up an office and begin marketing this wonder engine. Does thisscenario sound too good to be true? It is. Such an impossible engine is called aperpetual motion machine of the second kind because it violates the second lawof thermodynamics. A perpetual motion machine of the first kind violates thefirst law.
The first statement of the second law can be understood using an indicator dia-gram. For an engine to produce work, the area of the cycle in a P–V diagram must begreater than zero. However, this is impossible in a simple cycle using a single heatreservoir. If Thot = Tcold in Figure 5.2, the cycle collapses to aline, and the area of the cycle is zero. An arbitrary reversible cycle can be con-structed that does not consist of individual adiabatic and isothermal segments.However, as shown in Figure 5.4, any reversible cycle can be approximated by asuccession of adiabatic and isothermal segments, an approximation that becomesexact as the length of each segment approaches zero. It can be shown that the effi-ciency of such a cycle is also given by Equation (5.9) so that the efficiency of allheat engines operating in any reversible cycle between the same two temperatures,Thot and Tcold, is identical.
A more useful form than Equation (5.4) for the efficiency of a reversible heatengine can be derived by assuming that the working substance in the engine is an idealgas. Calculating the work flow in each of the four segments of the Carnot cycle usingthe results of Sections 2.7 and 2.9,
(5.5)
As derived in Section 2.10, the volume and temperature in the reversible adiabatic seg-ments are related by
(5.6)ThotV g-1b = TcoldVg-1
c and TcoldVg-1d = ThotV
g-1a
wab = -nRThot ln Vb
Vawab 6 0 because Vb 7 Va
wbc = nCV,m(Tcold - Thot) wbc 6 0 because Tcold 6 Thot
wcd = -nRTcold ln Vd
Vc wcd 7 0 because Vd 6 Vc
wda = nCV,m(Thot - Tcold) wda 7 0 because Thot 7 Tcold
a : b : c : d : a
Cold reservoir
Work
Work
Hot reservoir
Hot reservoir
(a)
(b)
FIGURE 5.3(a) A schematic model of the heat engineoperating in a reversible Carnot cycle.The relative widths of the two paths leav-ing the hot reservoir show the partitioningbetween work and heat injected into thecold reservoir. (b) The second law of ther-modynamics asserts that it is impossibleto construct a heat engine that operatesusing a single heat reservoir and convertsthe heat withdrawn from the reservoir intowork with 100% efficiency as shown.
Volume
Pre
ssur
e
FIGURE 5.4An arbitrary reversible cycle, indicated bythe ellipse, can be approximated to anydesired accuracy by a sequence of alter-nating adiabatic and isothermal segments.
05 Chapter 47503.qxd 11/28/11 4:23 PM Page 89

90 CHAPTER 5 Entropy and the Second and Third Laws of Thermodynamics
You will show in the end-of-chapter problems that Vc and Vd can be eliminated fromthe set of Equations (5.5) to yield
(5.7)
Because , the heat withdrawn from the hot reservoir is
(5.8)
and the efficiency of the reversible Carnot heat engine with an ideal gas as the workingsubstance can be expressed solely in terms of the reservoir temperatures.
(5.9)
The efficiency of this reversible heat engine can approach one only as , neither of which can be accomplished in practice. Therefore, heat can
never be totally converted to work in a reversible cyclic process. Because wcycle for anengine operating in an irreversible cycle is less than the work attainable in a reversiblecycle, .eirreversible 6 ereversible 6 1
or Tcold : 0Thot : q
e =
ƒ wcycle ƒ
qab=
Thot - Tcold
Thot= 1 -
Tcold
Thot6 1
qab = -wab = nRThot ln Vb
Va
¢Ua:b = 0
wcycle = -nR(Thot - Tcold) ln Vb
Va6 0
EXAMPLE PROBLEM 5.1
Calculate the maximum work that can be done by a reversible heat engine operatingbetween 500. and 200. K if 1000. J is absorbed at 500. K.
Solution
The fraction of the heat that can be converted to work is the same as the fractional fallin the absolute temperature. This is a convenient way to link the efficiency of anengine with the properties of the absolute temperature.
e = 1 -
Tcold
Thot= 1 -
200. K
500. K= 0.600
w = eqab = 0.600 * 1000. J = 600. J
In this section, only the most important features of heat engines have been discussed.It can also be shown that the efficiency of a reversible heat engine is independent of theworking substance. For a more in-depth discussion of heat engines, the interested readeris referred to Heat and Thermodynamics, seventh edition, by M. W. Zemansky andR. H. Dittman (McGraw-Hill, 1997). We will return to a discussion of the efficiency ofengines when we discuss refrigerators, heat pumps, and real engines in Section 5.11.
5.3 Introducing EntropyEquating the two formulas for the efficiency of the reversible heat engine given inEquations (5.4) and (5.9),
(5.10)
The last expression in Equation (5.10) is the sum of the quantity qreversible T around theCarnot cycle. This result can be generalized to any reversible cycle made up of anynumber of segments to give the important result stated in Equation (5.11):
(5.11)C
d qreversible
T= 0
>
Thot - Tcold
Thot=
qab + qcd
qab or qab
Thot+
qcd
Tcold= 0
05 Chapter 47503.qxd 11/28/11 4:23 PM Page 90

5.4 CALCULATING CHANGES IN ENTROPY 91
This equation can be regarded as the mathematical statement of the second law.What conclusions can be drawn from Equation (5.11)? Because the cyclic integral of
is zero, this quantity must be the exact differential of a state function.This state function is called the entropy, and given the symbol S
(5.12)
For a macroscopic change,
(5.13)
Note that whereas is not an exact differential, multiplying this quantity bymakes the differential exact.1>T d qreversible
¢S =
L
d qreversible
T
dS K
d qreversible
T
d qreversible>T
EXAMPLE PROBLEM 5.2
a. Show that the following differential expression is not an exact differential:
b. Show that , obtained by multiplying the function in part (a) by P,is an exact differential.
Solution
a. For the expression to be an exact differential, the condi-tion must be satisfied as discussed inSection 3.1. Because
the condition is not fulfilled.
b. Because , is an exact differential.
RTdP + RPdT(0(RT)>0T)P = R and (0(RP)>0P)T = R
P 0 aRT
Pb
0TQ
P
=
R
P and
0R
0P= 0
(0f(P,T)>0T)P = (0g(P,T)>0P)T
f(P,T)dP + g(P,T)dT
RTdP + PRdT
RT
PdP + RdT
Keep in mind that it has only been shown that S is a state function. It has notyet been demonstrated that S is a suitable function for measuring the naturaldirection of change in a process that the system may undergo. We will do so inSection 5.5.
5.4 Calculating Changes in EntropyThe most important thing to remember in doing entropy calculations using Equation (5.13)is that must be calculated along a reversible path. In considering an irreversibleprocess, must be calculated for a reversible process that proceeds between the sameinitial and final states corresponding to the irreversible process. Because S is a state func-tion, is necessarily path independent, provided that the transformation is between thesame initial and final states in both processes.
We first consider two cases that require no calculation. For any reversible adiabaticprocess, qreversible = 0, so that . For any cyclic process,¢S = 1( d qreversible>T) = 0
¢S
¢S¢S
, because the change in any state function for a cyclicprocess is zero.¢S = A( d qreversible>T) = 0
05 Chapter 47503.qxd 11/28/11 4:23 PM Page 91

92 CHAPTER 5 Entropy and the Second and Third Laws of Thermodynamics
Next consider for the reversible isothermal expansion or compression of anideal gas, described by , , . Because for this case,
(5.14)
(5.15)
Note that for an expansion (Vf > Vi) and for a compression (Vf < Vi).Although the preceding calculation is for a reversible process, has exactly the samevalue for any reversible or irreversible isothermal path that goes between the same ini-tial and final volumes and satisfies the condition Tf = Ti. This is the case because S is astate function.
Why does the entropy increase with increasing V at constant T if the system is viewedat a microscopic level? As discussed in Section 15.2, the translational energy levels foratoms and molecules are all shifted to lower energies as the volume of the systemincreases. Therefore, more states of the system can be accessed at constant T as Vincreases. This is a qualitative argument that does not give the functional form shown inEquation (5.15). The logarithmic dependence arises because S is proportional to the loga-rithm of the number of states accessible to the system rather than to the number of states.
Consider next for an ideal gas that undergoes a reversible change in T at constantV or P. For a reversible process described by , , , , and
(5.16)
For a constant pressure process described by , , , , and
(5.17)
The last expressions in Equations (5.16) and (5.17) are valid if the temperature intervalis small enough that the temperature dependence of CV,m and CP,m can be neglected.Again, although has been calculated for a reversible process, Equations (5.16) and(5.17) hold for any reversible or irreversible process between the same initial and finalstates for an ideal gas.
We again ask what a microscopic model would predict for the dependence of S on T.As discussed in Chapter 30, the probability of a molecule accessing a state with energy Eiis proportional to . This quantity increases exponentially as T increases, sothat more states become accessible to the system as T increases. Because S is a measureof the number of states the system can access, it increases with increasing T. Again, thelogarithmic dependence arises because S is proportional to the logarithm of the number ofstates accessible to the system rather than to the number of states.
The results of the last two calculations can be combined in the following way.Because the macroscopic variables V,T or P,T completely define the state of an idealgas, any change , , can be separated into two segments, , ,and , , . A similar statement can be made about P and T. Because S is aTfTi : VfVf
TiTi : VfViTfTi : VfVi
exp(-Ei>kBT)
¢S
¢S =
L
d qreversible
T=
L
nCP,m dT
TL nCP,m ln
Tf
Ti
d qreversible = CPdTTfTi : PiPi
¢S =
L
d qreversible
T=
L
nCV,m dT
TL nCV,m ln
Tf
Ti
d qreversible = CVdTTfTi : ViVi
¢S
¢S¢S 6 0¢S 7 0
¢S =
L
d qreversible
T=
1
T* qreversible = nR ln
Vf
Vi
qreversible = -wreversible = nRT ln Vf
Vi and
¢U = 0TiTi : VfVi
¢S
state function, is independent of the path. Therefore, any reversible or irreversibleprocess for an ideal gas described by , , can be treated as consisting ofTfTi : VfVi
¢S
two segments, one of which occurs at constant volume and the other of which occurs atconstant temperature. For this two-step process, is given by
(5.18)
Similarly, for any reversible or irreversible process for an ideal gas described by , ,
(5.19)¢S = -nR ln Pf
Pi+ nCP,m ln
Tf
Ti
TfTi : PfPi
¢S = nR ln Vf
Vi+ nCV,m ln
Tf
Ti
¢S
05 Chapter 47503.qxd 11/28/11 4:23 PM Page 92

5.4 CALCULATING CHANGES IN ENTROPY 93
In writing Equations (5.18) and (5.19), it has been assumed that the temperaturedependence of CV,m and CP,m can be neglected over the temperature range of interest.
EXAMPLE PROBLEM 5.3
Using the equation of state and the relationship between CP,m and CV,m for an ideal gas,show that Equation (5.18) can be transformed into Equation (5.19).
Solution
= -nR ln Pf
Pi+ n(CV,m + R) ln
Tf
Ti= -nR ln
Pf
Pi+ nCP,m ln
Tf
Ti
¢S = nR ln Vf
Vi+ nCV,m ln
Tf
Ti= nR ln
TfPi
TiPf+ nCV,m ln
Tf
Ti
Next consider for phase changes. Experience shows that a liquid is con-verted to a gas at a constant boiling temperature through heat input if the process iscarried out at constant pressure. Because , for the reversible processis given by
(5.20)
Similarly, for the phase change solid liquid,
(5.21)
Finally, consider for an arbitrary process involving real gases, solids, and liq-uids for which the isobaric volumetric thermal expansion coefficient and the isother-mal compressibility , but not the equation of state, are known. The calculation of for such processes is described in Supplemental Sections 5.12 and 5.13, in which theproperties of S as a state function are fully exploited. The results are stated here. For thesystem undergoing the change , , ,
(5.22)
In deriving the last result, it has been assumed that and are constant over the tem-perature and volume intervals of interest. For the system undergoing a change ,
, ,
(5.23)
For a solid or liquid, the last equation can be simplified to
(5.24)
if CP, V, and are assumed constant over the temperature and pressure intervals ofinterest. The integral forms of Equations (5.22) and (5.23) are valid for ideal and realgases, liquids, and solids. Examples of calculations using these equations are given inExample Problems 5.4 through 5.6.
b
¢S = CP ln Tf
Ti- Vb(Pf - Pi)
¢S =
3
Tf
Ti
CP
T dT -
3
Pf
Pi
Vb dP
TfTi : Pf
Pi
bk
¢S =
3
Tf
Ti
CV
T dT +
3
Vf
Vi
b
k dV = CV ln
Tf
Ti+
b
k(Vf - Vi)
TfTi : VfVi
¢Sk
b
¢S
¢Sfusion =
L
d qreversible
T=
qreversible
Tfusion=
¢Hfusion
Tfusion
:
¢Svaporization =
L
d qreversible
T=
qreversible
Tvaporization=
¢Hvaporization
Tvaporization
¢SqP = ¢H
¢S
05 Chapter 47503.qxd 11/28/11 4:23 PM Page 93

94 CHAPTER 5 Entropy and the Second and Third Laws of Thermodynamics
EXAMPLE PROBLEM 5.4
One mole of CO gas is transformed from an initial state characterized by Ti = 320. Kand Vi = 80.0 L to a final state characterized by Tf = 650. K and Vf = 120.0 L. UsingEquation (5.22), calculate for this process. Use the ideal gas values for and .For CO,
Solution
For an ideal gas,
Consider the following reversible process in order to calculate . The gas is firstheated reversibly from 320. to 650. K at a constant volume of 80.0 L. Subsequently, thegas is reversibly expanded at a constant temperature of 650. K from a volume of 80.0 Lto a volume of 120.0 L. The entropy change for this process is obtained using the inte-gral form of Equation (5.22) with the values of and cited earlier. The result is
= 24.4 J K-1
- 1.207 J K-1+ 3.371 J K-1
= 22.025 J K-1 - 4.792 J K-1 + 5.028 J K-1
+ 1 mol * 8.314 J K-1 mol-1* ln
120.0 L
80.0 L
1 mol *
3
650.
320.
(31.08 - 0.01452 T
K+ 3.1415 * 10-5
T2
K2 - 1.4973 * 10-8 T3
K3)
T
K
dT
K
¢S =
¢S =
3
Tf
Ti
CV
T dT + nR ln
Vf
Vi
kb
¢S
k = - 1
Va 0V
0Pb
T= -
1
Va 03nRT>P4
0Pb
T=
1
P
b =
1
Va 0V
0Tb
P=
1
Va 03nRT>P4
0Tb
P=
1
T and
CV, m
J mol-1 K-1 = 31.08 - 0.01452
T
K+ 3.1415 * 10-5
T2
K2 - 1.4973 * 10-8 T3
K3
kb¢S
EXAMPLE PROBLEM 5.5
In this problem, 2.50 mol of CO2 gas is transformed from an initial state characterizedby Ti = 450. K and Pi = 1.35 bar to a final state characterized by Tf = 800. K and Pf =3.45 bar. Using Equation (5.23), calculate for this process. Assume ideal gasbehavior and use the ideal gas value for . For CO2,
Solution
Consider the following reversible process in order to calculate . The gas is firstheated reversibly from 450. to 800. K at a constant pressure of 1.35 bar. Subsequently,the gas is reversibly compressed at a constant temperature of 800. K from a pressure of
¢S
CP,m
J mol-1 K-1 = 18.86 + 7.937 * 10-2
T
K- 6.7834 * 10-5
T2
K2 + 2.4426 * 10-8 T3
K3
b
¢S
05 Chapter 47503.qxd 11/28/11 4:23 PM Page 94

5.4 CALCULATING CHANGES IN ENTROPY 95
1.35 bar to a pressure of 3.45 bar. The entropy change for this process is obtainedusing Equation (5.23) with the value of from Example Problem 5.4.
= 48.6 J K-1
-19.50 J K-1
= 27.13 J K-1+ 69.45 J K-1
- 37.10 J K-1+ 8.57 J K-1
-2.50 mol * 8.314 J K-1mol-1* ln
3.45 bar
1.35 bar
= 2.50 *3
800.
450.
a18.86 + 7.937 * 10-2 T
K- 6.7834 * 10-5
T2
K2 + 2.4426 * 10-8 T3
K3 bT
K
dT
K
¢S =3
Tf
Ti
CP
T dT -
3
Pf
Pi
Vb dP =3
Tf
Ti
CP
T dT - nR
3
Pf
Pi
dP
P =3
Tf
Ti
CP
T dT - nR ln
Pf
Pi
b = 1>T
EXAMPLE PROBLEM 5.6
In this problem, 3.00 mol of liquid mercury is transformed from an initial state charac-terized by Ti = 300. K and Pi = 1.00 bar to a final state characterized by Tf = 600. Kand Pf = 3.00 bar.
a. Calculate for this process; = 1.81 � 10–4 K–1, = 13.54 g cm–3, and CP,mfor Hg(l) = 27.98 J mol–1K–1.
b. What is the ratio of the pressure-dependent term to the temperature-dependentterm in ? Explain your result.
Solution
a. Because the volume changes only slightly with temperature and pressure over therange indicated,
b. The ratio of the pressure-dependent to the temperature-dependent term is –3 � 10–5. Because the volume change with pressure is very small, the contribution of the pressure-dependent term is negligible in comparison with the temperature-dependent term.
= 58.2 J K-1 - 1.61 * 10-3 J K-1
= 58.2 J K-1
* 105 Pa bar-1
-3.00 mol *
200.59 g mol-1
13.54 g cm-3*
106 cm3
m3
* 1.81 * 10-4 K-1
* 2.00 bar
= 3.00 mol * 27.98 J mol-1 K-1
* ln600. K
300. K
¢S =
3
Tf
Ti
CP
T dT -
3
Pf
Pi
Vb dP L nCP,m ln Tf
Ti- nVm,ib(Pf - Pi)
¢S
rb¢S
As Example Problem 5.6 shows, for a liquid or solid as both P and T change isdominated by the temperature dependence of S. Unless the change in pressure is verylarge, for liquids and solids can be considered to be a function of temperature only.¢S
¢S
05 Chapter 47503.qxd 11/28/11 4:23 PM Page 95

96 CHAPTER 5 Entropy and the Second and Third Laws of Thermodynamics
5.5Using Entropy to Calculate the NaturalDirection of a Process in an IsolatedSystem
To show that is useful in predicting the direction of spontaneous change, we nowreturn to the two processes introduced in Section 5.1. The first process concerns thenatural direction of change in a metal rod with a temperature gradient. Will the gradientbecome larger or smaller as the system approaches its equilibrium state? To model thisprocess, consider the isolated composite system shown in Figure 5.5. Two systems, inthe form of metal rods with uniform, but different, temperatures T1 > T2, are broughtinto thermal contact.
In the following discussion, heat is withdrawn from the left rod. (The same reason-ing would hold if the direction of heat flow were reversed.) To calculate for thisirreversible process using the heat flow, one must imagine a reversible process in whichthe initial and final states are the same as for the irreversible process. In the imaginaryreversible process, the rod is coupled to a reservoir whose temperature is lowered veryslowly. The temperatures of the rod and the reservoir differ only infinitesimallythroughout the process in which an amount of heat, qP, is withdrawn from the rod. Thetotal change in temperature of the rod, , is related to qP by
(5.25)
It has been assumed that is small enough that CP is constant over theinterval.
Because the path is defined (constant pressure), is independent of how rapidlythe heat is withdrawn (the path); it depends only on CP and . More formally, because
and because H is a state function, qP is independent of the path between theinitial and final states. Therefore, if the temperature increment isidentical for the reversible and irreversible processes.
Using this result, the entropy change for this irreversible process in which heatflows from one rod to the other is calculated. Because the composite system is isolated,
. The entropy change of the composite system is thesum of the entropy changes in each rod
(5.26)
Because T1 > T2, the quantity in parentheses is negative. This process has two possibledirections:
• If heat flows from the hotter to the colder rod, the temperature gradient will becomesmaller. In this case, < 0 and > 0.
• If heat flows from the colder to the hotter rod, the temperature gradient will becomelarger. In this case, > 0 and < 0.
Note that has the same magnitude, but a different sign, for the two directions ofchange. appears to be a useful function for measuring the direction of naturalchange in an isolated system. Experience tells us that the temperature gradient willbecome less with time. It can be concluded that the process in which S increases is thedirection of natural change in an isolated system.
Next, consider the second process introduced in Section 5.1 in which an idealgas spontaneously collapses to half its initial volume without a force acting on it.This process and its reversible analog are shown in Figure 5.6. Recall that U isindependent of V for an ideal gas. Because U does not change as V increases, and Uis a function of T only for an ideal gas, the temperature remains constant in the irre-versible process. Therefore, the spontaneous irreversible process shown in Figure 5.6ais both adiabatic and isothermal and is described by , , . The imagi-nary reversible process that we use to carry out the calculation of is shown in¢S
TiTi : 1/2ViVi
¢S¢S
¢SqP
¢SqP
¢S =
qreversible,1
T1+
qreversible,2
T2=
q1
T1+
q2
T2= qPa 1
T1-
1
T2b
q1 + q2 = 0, and q1 = -q2 = qP
¢TqP = qreversible
qP = ¢H¢T
1 d qP
¢T = T2 - T1
d qP = CPdT or ¢T =
1
CPL d qP = qP
CP
¢T
¢S
¢SqP
T2T1
FIGURE 5.5Two systems at constant P, each consistingof a metal rod, are placed in thermal con-tact. The temperatures of the two rods differby . The composite system is containedin a rigid adiabatic enclosure (not shown)and is, therefore, an isolated system.
¢T
Piston
Ti,ViTi,
1/2 Vi
Ti,Vi
Ti,1/2 Vi
Piston
Initial state Final state
(a)
Initial state Final state
(b)
Irreversible process
Reversible process
FIGURE 5.6(a) An irreversible process is shown inwhich an ideal gas confined in a containerwith rigid adiabatic walls is spontaneouslyreduced to half its initial volume. (b) Areversible isothermal compression is shownbetween the same initial and final states asfor the irreversible process. Reversibility isachieved by adjusting the rate at which thebeaker on top of the piston is filled withwater relative to the evaporation rate.
05 Chapter 47503.qxd 11/28/11 4:23 PM Page 96

5.6 THE CLAUSIUS INEQUALITY 97
Figure 5.6b. In this process, which must have the same initial and final states as theirreversible process, water is slowly and continuously added to the beaker on thepiston to ensure that P = Pexternal. The ideal gas undergoes a reversible isothermaltransformation described by , , . Because , q = –w. We cal-culate for this process:
(5.27)
For the opposite process, in which the gas spontaneously expands so that it occupiestwice the volume, the reversible model process is an isothermal expansion for which
(5.28)
Again, the process with is the direction of natural change in this isolatedsystem. The reverse process for which is the unnatural direction of change.
The results obtained for isolated systems are generalized in the following statement:
For any irreversible process in an isolated system, there is a unique direction ofspontaneous change: for the spontaneous process, for theopposite or nonspontaneous direction of change, and only for areversible process. In a quasi-static reversible process, there is no direction ofspontaneous change because the system is proceeding along a path, each step ofwhich corresponds to an equilibrium state.
We cannot emphasize too strongly that is a criterion for spontaneouschange only if the system does not exchange energy in the form of heat or work with itssurroundings. Note that if any process occurs in the isolated system, it is by definitionspontaneous and the entropy increases. Whereas U can neither be created nor destroyed,S for an isolated system can be created , but not destroyed .
5.6 The Clausius InequalityIn the previous section, it was shown using two examples that provides a crite-rion to predict the natural direction of change in an isolated system. This result can alsobe obtained without considering a specific process. Consider the differential form ofthe first law for a process in which only P–V work is possible
(5.29)
Equation (5.29) is valid for both reversible and irreversible processes. If the process isreversible, we can write Equation (5.29) in the following form:
(5.30)
Because U is a state function, dU is independent of the path, and Equation (5.30) holdsfor both reversible and irreversible processes, as long as there are no phase transitionsor chemical reactions, and only P–V work occurs.
To derive the Clausius inequality, we equate the expressions for dU in Equations (5.29)and (5.30):
(5.31)
If , the system will spontaneously expand, and dV > 0. If, the system will spontaneously contract, and dV < 0. In both possi-
ble cases, . Therefore, we conclude that
(5.32) d qreversible - d q = TdS - d q Ú 0 or TdS Ú d q
(P - Pexternal)dV 7 0P - Pexternal 6 0
P - Pexternal 7 0
d qreversible - d q = (P - Pexternal)dV
dU = d qreversible - P dV = T dS - P dV
dU = d q - Pexternal dV
¢S 7 0
(¢S 6 0)(¢S 7 0)
¢S 7 0
¢S = 0¢S 6 0¢S 7 0
¢S 6 0¢S 7 0
¢S = nR ln 2Vi
Vi= nR ln 2 7 0
¢S =L
d qreversible
T=
qreversible
Ti= -
wreversible
Ti= nR ln
12Vi
Vi= -nR ln 2 6 0
¢S¢U = 0TiTi : 1/2ViVi
05 Chapter 47503.qxd 11/28/11 4:23 PM Page 97

98 CHAPTER 5 Entropy and the Second and Third Laws of Thermodynamics
The equality holds only for a reversible process. We rewrite the Clausius inequality inEquation (5.32) for an irreversible process in the form
(5.33)
For an irreversible process in an isolated system, . Therefore, we have againproved that for any irreversible process in an isolated system, .
How can the result from Equations (5.29) and (5.30) thatbe reconciled with the fact that work and heat
are path functions? The answer is that and , where the equali-ties hold only for a reversible process. The result states thatthe amount by which the work is greater than –PdV and the amount by which the heat isless than TdS in an irreversible process involving only PV work are exactly equal.Therefore, the differential expression for dU in Equation (5.30) is obeyed for bothreversible and irreversible processes. In Chapter 6, the Clausius inequality is used to gen-erate two new state functions, the Gibbs energy and the Helmholtz energy. These func-tions allow predictions to be made about the direction of change in processes for whichthe system interacts with its environment.
The Clausius inequality is next used to evaluate the cyclic integral for anarbitrary process. Because , the value of the cyclic integral is zerofor a reversible process. Consider a process in which the transformation from state 1 tostate 2 is reversible, but the transition from state 2 back to state 1 is irreversible:
(5.34)
The limits of integration on the first integral can be interchanged to obtain
(5.35)
Exchanging the limits as written is only valid for a state function. Because
(5.36)
where the equality only holds for a reversible process. Note that the cyclic integral ofan exact differential is always zero, but the integrand in Equation (5.36) is only an exactdifferential for a reversible cycle.
5.7The Change of Entropyin the Surroundings and
As shown in Section 5.6, the entropy of an isolated system increases in a spontaneousprocess. Is it always true that a process is spontaneous if for the system is positive?As shown later, this statement is only true for an isolated system. In this section, a crite-rion for spontaneity is developed that takes into account the entropy change in both thesystem and the surroundings.
In general, a system interacts only with the part of the universe that is very close.Therefore, one can think of the system and the interacting part of the surroundings asforming an interacting composite system that is isolated from the rest of the universe.The part of the surroundings that is relevant for entropy calculations is a thermal reser-voir at a fixed temperature, T. The mass of the reservoir is sufficiently large that its tem-perature is only changed by an infinitesimal amount dT when heat is transferred
¢S
¢Stotal = ¢S + ¢Ssurroundings
C
d q
T… 0
d qreversible 7 d qirreversible
C
d q
T= -
3
1
2
d qreversible
T+
3
1
2
d qirreversible
T
C
d q
T=
3
2
1
d qreversible
T+
3
1
2
d qirreversible
T
dS = d qreversible>T A d q>T
d q + d w = TdS - PdV d q … TdS d w Ú -PdV
TdS - PdVdU = d q - PexternaldV =
¢S 7 0 d q = 0
dS 7
d q
T
05 Chapter 47503.qxd 11/28/11 4:23 PM Page 98

5.7 THE CHANGE OF ENTROPY IN THE SURROUNDINGS AND 99¢Stotal = ¢S + ¢Ssurroundings
between the system and the surroundings. Therefore, the surroundings always remainin internal equilibrium during heat transfer.
Next consider the entropy change of the surroundings, whereby the surroundingsare at either constant V or constant P. We assume that the system and surroundings areat the same temperature. If this were not the case, heat would flow across the boundaryuntil T is the same for system and surroundings, unless the system is surrounded by adi-abatic walls, in which case qsurroundings = 0. The amount of heat absorbed by the sur-roundings, qsurroundings, depends on the process occurring in the system. If thesurroundings are at constant V, , and if the surroundingsqsurroundings = ¢Usurroundingsare at constant . Because H and U are state functions,the amount of heat entering the surroundings is independent of the path; q is the samewhether the transfer occurs reversibly or irreversibly. Therefore,
(5.37)
Note that the heat that appears in Equation (5.37) is the actual heat transferred becausethe heat transferred to the surroundings is independent of the path as discussed earlier.By contrast, in calculating for the system, for a reversible process thatconnects the initial and final states of the system must be used, not the actual for theprocess. It is essential to understand this reasoning in order to carry out calculationsfor and .
This important difference is discussed in calculating the entropy change of the systemas opposed to the surroundings with the aid of Figure 5.7. A gas (the system) is enclosedin a piston and cylinder assembly with diathermal walls. The gas is reversibly compressedby the external pressure generated by droplets of water slowly filling the beaker on top ofthe piston. The piston and cylinder assembly is in contact with a water bath thermal reser-voir that keeps the temperature of the gas fixed at the value T. In Example Problem 5.7,
and are calculated for this reversible compression.¢Ssurroundings¢S
¢Ssurroundings¢S
d q d qreversible¢S
¢Ssurroundings =
qsurroundings
T
dSsurroundings =
d qsurroundings
T or for a macroscopic change,
P, qsurroundings = ¢Hsurroundings
FIGURE 5.7A sample of an ideal gas (the sys-tem) is confined in a piston andcylinder assembly with diathermalwalls. The assembly is in contactwith a thermal reservoir that holdsthe temperature at a value of 300 K.Water dripping into the beaker on thepiston increases the external pressureslowly enough to ensure a reversiblecompression. The value of the pres-sure is determined by the relativerates of water filling and evaporationfrom the beaker. The directions ofwork and heat flow are indicated.
Piston
P,VT
q
w
EXAMPLE PROBLEM 5.7
One mole of an ideal gas at 300. K is reversibly and isothermally compressed from avolume of 25.0 L to a volume of 10.0 L. Because the water bath thermal reservoir inthe surroundings is very large, T remains essentially constant at 300. K during theprocess. Calculate , , and .
Solution
Because this is an isothermal process, , and qreversible = –w. From Section 2.7,
The entropy change of the system is given by
The entropy change of the surroundings is given by
¢Ssurroundings =
qsurroundings
T= -
qsystem
T=
2.285 * 103 J
300. K = 7.62 J K-1
¢S =
L
d qreversible
T=
qreversible
T=
-2.285 * 103 J
300. K= - 7.62 J K-1
= 1.00 mol * 8.314 J mol-1K-1* 300. K * ln
10.0 L
25.0 L = - 2.285 * 103
J
qreversible = -w = nRT3
Vf
Vi
dV
V= nRT ln
Vf
Vi
¢U = 0
¢Stotal¢Ssurroundings¢S
05 Chapter 47503.qxd 11/28/11 4:23 PM Page 99

100 CHAPTER 5 Entropy and the Second and Third Laws of Thermodynamics
Because the process in Example Problem 5.7 is reversible, there is no direction ofspontaneous change and, therefore, . In Example Problem 5.8, this calcula-tion is repeated for an irreversible process that goes between the same initial and finalstates of the system.
¢Stotal = 0
The total change in the entropy is given by
¢Stotal = ¢S + ¢Ssurroundings = -7.62 J K-1+ 7.62 J K-1
= 0
EXAMPLE PROBLEM 5.8
One mole of an ideal gas at 300. K is isothermally compressed by a constant externalpressure equal to the final pressure in Example Problem 5.7. At the end of the process,P = Pexternal. Because P Pexternal at all but the final state, this process is irreversible.The initial volume is 25.0 L and the final volume is 10.0 L. The temperature of the sur-roundings is 300. K. Calculate , , and .
Solution
We first calculate the external pressure and the initial pressure in the system
Because Pexternal > Pi, we expect that the direction of spontaneous change will be thecompression of the gas to a smaller volume. Because ,
The entropy change of the surroundings is given by:
The entropy change of the system must be calculated on a reversible path and has thevalue obtained in Example Problem 5.7
It is seen that , and . The total change in the entropy isgiven by
¢Stotal = ¢S + ¢Ssurroundings = -7.62 J K-1+ 12.47 J K-1
= 4.85 J K-1
¢Ssurroundings 7 0¢S 6 0
¢S =
L
d qreversible
T=
qreversible
T=
-2.285 * 103 J
300. K= -7.62 J K-1
¢Ssurroundings =
qsurroundings
T= -
q
T=
3.741 * 103 J
300. K = 12.47 J K-1
* (10.0 * 10-3 m3- 25.0 * 10-3 m3) = -3.741 * 103 J
q = -w = Pexternal(Vf - Vi) = 2.494 * 105 Pa
¢U = 0
Pi =
nRT
V=
1 mol * 8.314 J mol-1K-1* 300. K
25.0 L *
1 m3
103 L
= 9.977 * 104 Pa
Pexternal =
nRT
V=
1 mol * 8.314 J mol-1K-1* 300. K
10.0 L *
1 m3
103 L
= 2.494 * 105 Pa
¢Stotal¢Ssurroundings¢S
Z
The previous calculations lead to the following conclusion: if the system and the partof the surroundings with which it interacts are viewed as an isolated composite system,the criterion for spontaneous change is . A¢Stotal = ¢S + ¢Ssurroundings 7 0decrease in the entropy of the universe will never be observed, because forany change that actually occurs. Any process that occurs in the universe is by definitionspontaneous and leads to an increase of Stotal. Therefore, as time increases,which defines a unique direction of time. Consider the following example to illustrate theconnection between entropy and time: we view a movie in which two ideal gases aremixed, and then run the movie backward, separation of the gases occurs. We cannotdecide which direction corresponds to real time (the spontaneous process) on the basis ofthe first law. However, using the criterion , the direction of real time can be¢Stotal Ú 0
¢Stotal 7 0
¢Stotal Ú 0
05 Chapter 47503.qxd 11/28/11 4:23 PM Page 100
5.8 ABSOLUTE ENTROPIES AND THE THIRD LAW OF THERMODYNAMICS 101
established. The English astrophysicist Eddington coined the phrase “entropy is time’sarrow” to emphasize this relationship between entropy and time.
Note that a spontaneous process in a system that interacts with its surroundings is notcharacterized by , but by . The entropy of the system can decrease ina spontaneous process, as long as the entropy of the surroundings increases by a greateramount. In Chapter 6, the spontaneity criterion willbe used to generate two state functions, the Gibbs energy and the Helmholtz energy.These functions allow one to predict the direction of change in systems that interact withtheir environment using only the changes in system state functions.
5.8 Absolute Entropies and the Third Law ofThermodynamics
All elements and many compounds exist in three different states of aggregation. One ormore solid phases are the most stable forms at low temperature, and when the tempera-ture is increased to the melting point, a constant temperature transition to the liquidphase is observed. After the temperature is increased further, a constant temperaturephase transition to a gas is observed at the boiling point. At temperatures higher thanthe boiling point, the gas is the stable form.
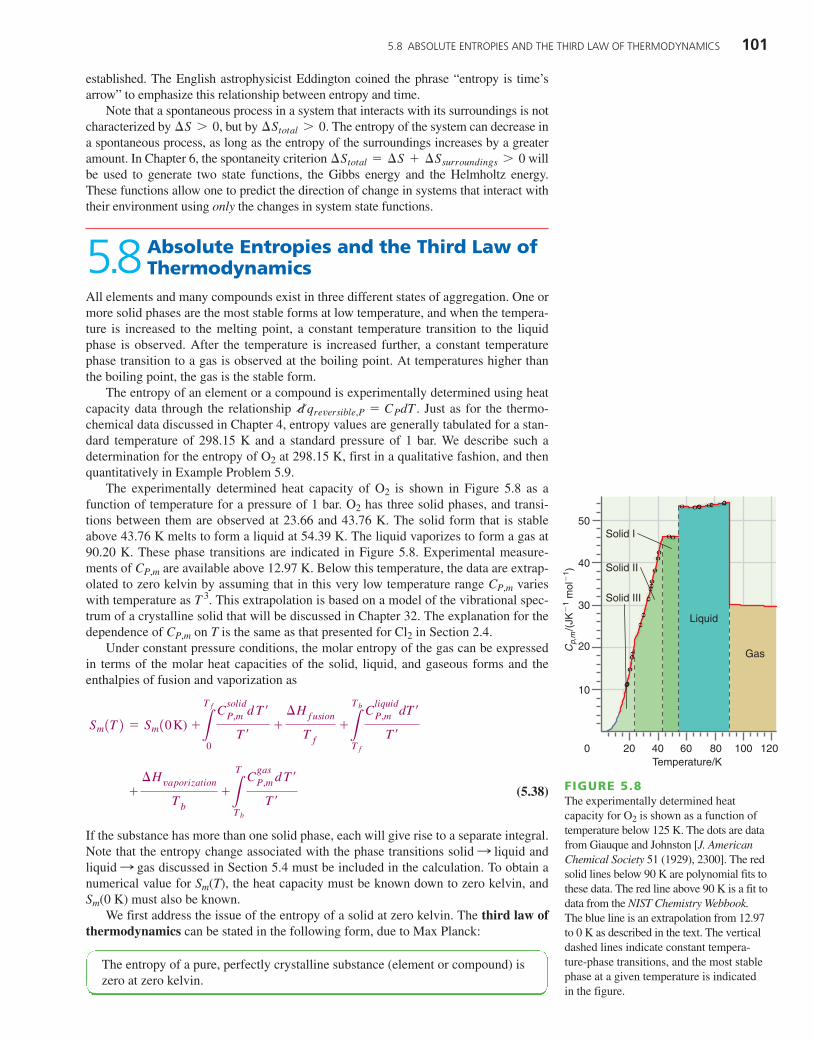
The entropy of an element or a compound is experimentally determined using heatcapacity data through the relationship . Just as for the thermo-chemical data discussed in Chapter 4, entropy values are generally tabulated for a stan-dard temperature of 298.15 K and a standard pressure of 1 bar. We describe such adetermination for the entropy of O2 at 298.15 K, first in a qualitative fashion, and thenquantitatively in Example Problem 5.9.
The experimentally determined heat capacity of O2 is shown in Figure 5.8 as afunction of temperature for a pressure of 1 bar. O2 has three solid phases, and transi-tions between them are observed at 23.66 and 43.76 K. The solid form that is stableabove 43.76 K melts to form a liquid at 54.39 K. The liquid vaporizes to form a gas at90.20 K. These phase transitions are indicated in Figure 5.8. Experimental measure-ments of CP,m are available above 12.97 K. Below this temperature, the data are extrap-olated to zero kelvin by assuming that in this very low temperature range CP,m varieswith temperature as T 3. This extrapolation is based on a model of the vibrational spec-trum of a crystalline solid that will be discussed in Chapter 32. The explanation for thedependence of CP,m on T is the same as that presented for Cl2 in Section 2.4.
Under constant pressure conditions, the molar entropy of the gas can be expressedin terms of the molar heat capacities of the solid, liquid, and gaseous forms and theenthalpies of fusion and vaporization as
(5.38)
If the substance has more than one solid phase, each will give rise to a separate integral.Note that the entropy change associated with the phase transitions solid liquid andliquid gas discussed in Section 5.4 must be included in the calculation. To obtain anumerical value for Sm(T), the heat capacity must be known down to zero kelvin, andSm(0 K) must also be known.
We first address the issue of the entropy of a solid at zero kelvin. The third law ofthermodynamics can be stated in the following form, due to Max Planck:
The entropy of a pure, perfectly crystalline substance (element or compound) iszero at zero kelvin.
::
+
¢Hvaporization
Tb
+3
T
Tb
CgasP,m d T¿
T¿
Sm(T) = Sm(0 K) +3
Tf
0
CsolidP,m d T¿
T¿
+
¢Hfusion
Tf
+3
Tb
Tf
CliquidP,m dT¿
T¿
d qreversible,P = CPdT
¢Stotal = ¢S + ¢Ssurroundings 7 0
¢Stotal 7 0¢S 7 0
FIGURE 5.8The experimentally determined heatcapacity for O2 is shown as a function oftemperature below 125 K. The dots are datafrom Giauque and Johnston [J. AmericanChemical Society 51 (1929), 2300]. The redsolid lines below 90 K are polynomial fits tothese data. The red line above 90 K is a fit todata from the NIST Chemistry Webbook.The blue line is an extrapolation from 12.97to 0 K as described in the text. The verticaldashed lines indicate constant tempera-ture-phase transitions, and the most stablephase at a given temperature is indicatedin the figure.
200 40 60 80 100 120
10
20
30
40
50
Liquid
Gas
Temperature/K
Cp,
m/(
JK�
1 m
ol�
1 )
Solid I
Solid II
Solid III
05 Chapter 47503.qxd 11/28/11 4:23 PM Page 101

102 CHAPTER 5 Entropy and the Second and Third Laws of Thermodynamics
A more detailed discussion of the third law using a microscopic model will be presentedin Chapter 32. Recall that in a perfectly crystalline atomic (or molecular) solid, the positionof each atom is known. Because the individual atoms are indistinguishable, exchanging thepositions of two atoms does not lead to a new state. Therefore, a perfect crystalline solid hasonly one state at zero kelvin and . The importance of the thirdlaw is that it allows calculations of the absolute entropies of elements and compounds to becarried out for any value of T. To calculate S at a temperature T using Equation (5.38), theCP,m data of Figure 5.8 are graphed in the form CP, m T as shown in Figure 5.9.
The entropy can be obtained as a function of temperature by numerically integratingthe area under the curve in Figure 5.9 and adding the entropy changes associated withphase changes at the transition temperatures. Calculations of for O2 at 298.15 K arecarried out in Example Problem 5.9 and is shown in Figure 5.10.
One can also make the following general remarks about the relative magnitudes ofthe entropy of different substances and different phases of the same substance. Theseremarks will be justified on the basis of a microscopic model in Chapter 32.
• Because in a single phase region and for melting and vaporization arealways positive, Sm for a given substance is greatest for the gas-phase species. Themolar entropies follow the order .
• The molar entropy increases with the size of a molecule because the number ofdegrees of freedom increases with the number of atoms. A non-linear gas-phasemolecule has three translational degrees of freedom, three rotational degrees of free-dom, and 3n – 6 vibrational degrees of freedom. A linear molecule has three transla-tional, two rotational, and 3n – 5 vibrational degrees of freedom. For a molecule in aliquid, the three translational degrees of freedom are converted to local vibrationalmodes because of the attractive interaction between neighboring molecules.
Sgasm 7 7 Sliquid
m 7 Ssolidm
¢SCP>T
S°m(T)
S°m
>
S = k ln W = k ln 1 = 0
500 100 150 200 250 300
0.2
0.4
0.6
0.8
1
Solid I
SolidII
SolidIII
Liquid
Gas
Temperature/K
CP
,m T /(
JK�
2 m
ol�
1 )
FIGURE 5.9CP T as a function of temperature for O2.The vertical dashed lines indicate constanttemperature-phase transitions, and themost stable phase at a given temperatureis indicated in the figure.
>
50 100 150 200 250 300
50
0
100
150
200
Temperature/K
Solid III
Solid II
Solid I
Liquid
Gas
S� m
/(JK
�1
mol
�1 )
FIGURE 5.10The molar entropy for O2 is shown as afunction of temperature. The verticaldashed lines indicate constant temperature-phase transitions, and the most stablephase at a given temperature is indicatedin the figure.
05 Chapter 47503.qxd 11/28/11 4:23 PM Page 102
5.8 ABSOLUTE ENTROPIES AND THE THIRD LAW OF THERMODYNAMICS 103
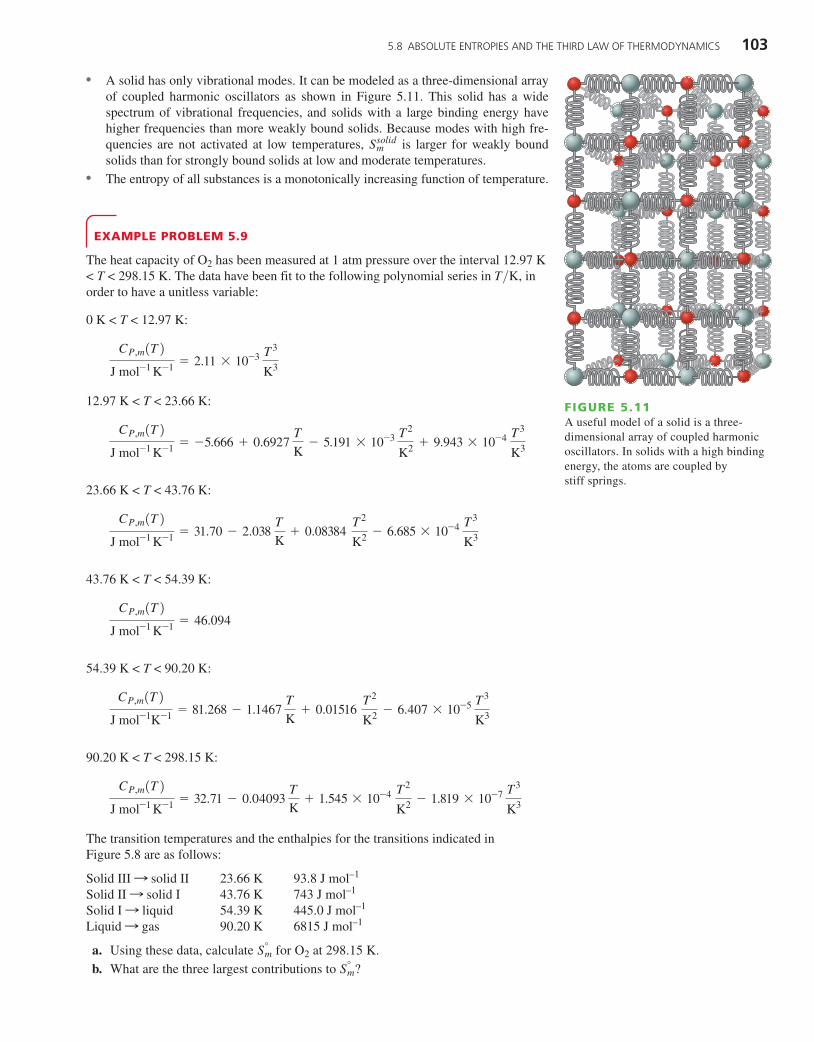
• A solid has only vibrational modes. It can be modeled as a three-dimensional arrayof coupled harmonic oscillators as shown in Figure 5.11. This solid has a widespectrum of vibrational frequencies, and solids with a large binding energy havehigher frequencies than more weakly bound solids. Because modes with high fre-quencies are not activated at low temperatures, is larger for weakly boundsolids than for strongly bound solids at low and moderate temperatures.
• The entropy of all substances is a monotonically increasing function of temperature.
Ssolidm
FIGURE 5.11A useful model of a solid is a three-dimensional array of coupled harmonicoscillators. In solids with a high bindingenergy, the atoms are coupled bystiff springs.
EXAMPLE PROBLEM 5.9
The heat capacity of O2 has been measured at 1 atm pressure over the interval 12.97 K< T < 298.15 K. The data have been fit to the following polynomial series in , inorder to have a unitless variable:
0 K < T < 12.97 K:
12.97 K < T < 23.66 K:
23.66 K < T < 43.76 K:
43.76 K < T < 54.39 K:
54.39 K < T < 90.20 K:
90.20 K < T < 298.15 K:
The transition temperatures and the enthalpies for the transitions indicated inFigure 5.8 are as follows:
Solid III solid II 23.66 K 93.8 J mol–1
Solid II solid I 43.76 K 743 J mol–1
Solid I liquid 54.39 K 445.0 J mol–1
Liquid gas 90.20 K 6815 J mol–1
a. Using these data, calculate for O2 at 298.15 K.
b. What are the three largest contributions to ?S°m
S°m
::::
CP,m(T)
J mol-1 K-1 = 32.71 - 0.04093
T
K+ 1.545 * 10-4
T2
K2 - 1.819 * 10-7 T3
K3
CP,m(T)
J mol-1K-1 = 81.268 - 1.1467 T
K+ 0.01516
T2
K2 - 6.407 * 10-5 T3
K3
CP,m(T)
J mol-1 K-1 = 46.094
CP,m(T)
J mol-1 K-1 = 31.70 - 2.038
T
K+ 0.08384
T2
K2 - 6.685 * 10-4 T3
K3
CP,m(T)
J mol-1 K-1 = -5.666 + 0.6927
T
K- 5.191 * 10-3
T2
K2 + 9.943 * 10-4 T3
K3
CP,m(T)
J mol-1 K-1 = 2.11 * 10-3
T3
K3
T>K
05 Chapter 47503.qxd 11/28/11 4:23 PM Page 103

104 CHAPTER 5 Entropy and the Second and Third Laws of Thermodynamics
Solution
a.
There is an additional small correction for nonideality of the gas at 1 bar. Thecurrently accepted value is (Linstrom, P. J.,and Mallard, W. G., eds. NIST Chemistry Webbook: NIST Standard ReferenceDatabase Number 69. Gaithersburg, MD: National Institute of Standards andTechnology. Retrieved from http://webbook.nist.gov.)
b. The three largest contributions to are for the vaporization transition, for the heating of the gas from the boiling temperature to 298.15 K, and forheating of the liquid from the melting temperature to the boiling point.
¢S¢S¢SS°
m
S°m(298.15 K) = 205.152 J mol-1
K-1
= 204.9 J mol-1 K-1
+ 35.27 J K-1
+ 10.13 J K-1+ 8.181 J K-1
+ 27.06 J K-1+ 75.59 J K-1
= 8.182 J K-1+ 3.964 J K-1
+ 19.61 J K-1+ 16.98 J K-1
+
3
298.15
90.20
CgasP,m dT
T
+
3
54.39
43.76
Csolid,IP,m dT
T+
445.0 J
54.39 K+
3
90.20
54.39
CliquidP,m dT
T+
6815 J
90.20 K
S°m(298.15 K) =
3
23.66
0
Csolid,IIIP,m dT
T+
93.80 J
23.66 K+
3
43.76
23.66
Csolid,IIP,m dT
T+
743 J
43.76 K
The preceding discussion and Example Problem 5.9 show how numerical values ofthe entropy for a specific substance can be determined at a standard pressure of 1 barfor different values of the temperature. These numerical values can then be used to cal-culate entropy changes in chemical reactions, as will be shown in Section 5.10.
5.9 Standard States in Entropy CalculationsAs discussed in Chapter 4, changes in U and H are calculated using the result that values for pure elements in their standard state at a pressure of 1 bar and a temperatureof 298.15 K are zero. For S, the third law provides a natural definition of zero, namely,the crystalline state at zero kelvin. Therefore, the absolute entropy of a compound as agiven temperature can be experimentally determined from heat capacity measurementsas described in the previous section. The entropy is a also a function of pressure, andtabulated values of entropies refer to a standard pressure of 1 bar. The value of S variesmost strongly with P for a gas. From Equation (5.19), for an ideal gas at constant T,
(5.39)
Choosing = 1 bar,
(5.40)
Figure 5.12 shows a plot of the molar entropy of an ideal gas as a function of pressure.It is seen that as , . This is a consequence of the fact that as ,
. As Equation (5.18) shows, the entropy becomes infinite in this limit.V : q
P : 0Sm : qP : 0
Sm(P) = S �m - R ln
P(bar)
P �
Pi = P �
¢Sm = R ln Vf
Vi= -R ln
Pf
Pi
¢Hf
1 2 3 4P/ bar
0
Sm
– S
� m
FIGURE 5.12The molar entropy of an ideal gas is shownas a function of the gas pressure. By defini-tion, at 1 bar, , the standard statemolar entropy.
Sm = S �m
05 Chapter 47503.qxd 11/28/11 4:23 PM Page 104
5.10 ENTROPY CHANGES IN CHEMICAL REACTIONS 105
Equation (5.40) provides a way to calculate the entropy of a gas at any pressure. Forsolids and liquids, S varies so slowly with P, as shown in Section 5.4 and ExampleProblem 5.6, that the pressure dependence of S can usually be neglected.
5.10 Entropy Changes in Chemical ReactionsThe entropy change in a chemical reaction is a major factor in determining the equilib-rium concentration in a reaction mixture. In an analogous fashion to calculating
for chemical reactions, is equal to the difference in the entropies ofproducts and reactants, which can be written as
(5.41)
In Equation (5.41), the stoichiometric coefficients vi are positive for products and nega-tive for reactants. For example, in the reaction
(5.42)
the entropy change under standard state conditions of 1 bar and 298.15 K is given by
For this reaction, is large and negative, primarily because gaseous species are con-sumed in the reaction, and none are generated. is generally positive for ,and negative for where is the change in the number of moles of gas in theoverall reaction.
Tabulated values of are generally available at the standard temperature of 298.15 K,and values for selected elements and compounds are listed in Tables 4.1 and 4.2 (seeAppendix B, Data Tables). However, it is often necessary to calculate at other temper-atures. Such calculations are carried out using the temperature dependence of S discussedin Section 5.4:
(5.43)
This equation is only valid if no phase changes occur in the temperature intervalbetween 298.15 K and T. If phase changes occur, the associated entropy changes mustbe included as they were in Equation (5.38).
¢S �R, T = ¢S �
R, 298.15 +
3
T
298.15
¢C �P
T¿
dT¿
¢S �
S �m
¢n¢n 6 0¢n 7 0¢S �
R
¢S �R
= -308.9 J K-1 mol-1
- 4 * 130.684 J K-1 mol-1
= 3 * 27.28 J K-1 mol-1
+ 4 * 69.61 J K-1 mol-1
- 146.4 J K-1 mol-1
¢S �R,298.15 = 3S �
298.15(Fe, s) + 4S �298.15 K(H2O, l) - S �
298.15(Fe3O4, s) - 4S �298.15(H2, g)
Fe3O4(s) + 4 H2(g) : 3 Fe(s) + 4 H2O(l)
¢S �R = a
iviS
�i
¢S �R¢H �
R and ¢U �R
EXAMPLE PROBLEM 5.10
The standard entropies of CO, CO2, and O2 at 298.15 K are
The temperature dependence of constant pressure heat capacity for CO, CO2, and O2is given by
CP,m(CO, g)
J K-1 mol-1 = 31.08 - 1.452 * 10-2
T
K+ 3.1415 * 10-5
T2
K2 - 1.4973 * 10-8 T3
K3
S �298.15(O2, g) = 205.138 J K-1
mol-1
S �298.15(CO2, g) = 213.74 J K-1
mol-1
S �298.15(CO, g) = 197.67 J K-1
mol-1
05 Chapter 47503.qxd 11/28/11 4:23 PM Page 105

106 CHAPTER 5 Entropy and the Second and Third Laws of Thermodynamics
Calculate for the reaction at 475.0 K.
Solution
The value of is negative at both temperatures because the number of moles ofgaseous species is reduced in the reaction.
¢S �R
= -86.50 J K-1 mol-1
- 1.757 J K-1 mol-1
= -88.26 J K-1 mol-1
= -86.50 J K-1 mol-1
+ (-12.866 + 17.654 - 7.604 + 1.0594) J K-1 mol-1
= -86.50 J K-1 mol-1
¢S �R, T = ¢S �
R 298.15 +
3
T
298.15
¢Cp
T¿
dT¿
= -86.50 J K-1 mol-1
= 213.74 J K-1 mol-1
- 197.67 J K-1 mol-1
-
1
2* 205.138 J K-1
mol-1
¢S �R = S �
R 298.15(CO2, g) - S �298.15(CO, g) -
1
2* S �
298.15(O2, g)
= -27.625 + 9.9825 * 10-2 T
K- 1.1123 * 10-4
T2
K2 + 3.9399 * 10-8 T3
K3
+ (2.4426 + 1.4973) * 10-8 T3
K3
- a6.7834 + 3.1415 +
1
2* 2.3968b * 10-5
T2
K2
+ a7.937 + 1.452 +
1
2* 1.187b * 10-2
T
K
¢CP,m
J K-1 mol-1 = a18.86 - 31.08 -
1
2* 30.81b
CO(g) + 1>2 O2(g) : CO2(g)¢S �R
CP,m(O2, g)
J K-1 mol-1 = 30.81 - 1.187 * 10-2
T
K+ 2.3968 * 10-5
T2
K2
CP,m(CO2, g)
J K-1 mol-1 = 18.86 + 7.937 * 10-2
T
K- 6.7834 * 10-5
T2
K2 + 2.4426 * 10-8 T3
K3
S U P P L E M E N T A L
5.11 Energy Efficiency: Heat Pumps,Refrigerators, and Real Engines
Thermodynamics provides the tools to study the release of energy through chemicalreactions or physical processes such as light harvesting to do work or generate heat. AsEarth’s population continues to increase in the coming decades and per capita energyconsumption also rises, the need for energy in various forms will rise rapidly.Electricity is a major component of this energy demand and fossil fuels are expected tobe the major source for electricity production for the foreseeable future. The increased
+
3
475
298.15
a-27.63 + 9.983 * 10-2 T
K - 1.112 * 10-4
T2
K2 + 3.940 * 10-8 T3
K3bT
K
dT
K J K-1
mol-1
05 Chapter 47503.qxd 11/28/11 4:23 PM Page 106
5.11 ENERGY EFFICIENCY: HEAT PUMPS, REFRIGERATORS, AND REAL ENGINES 107
combustion of fossil fuels will continue the rapid increase in the CO2 concentration inthe atmosphere that began with the Industrial Revolution.
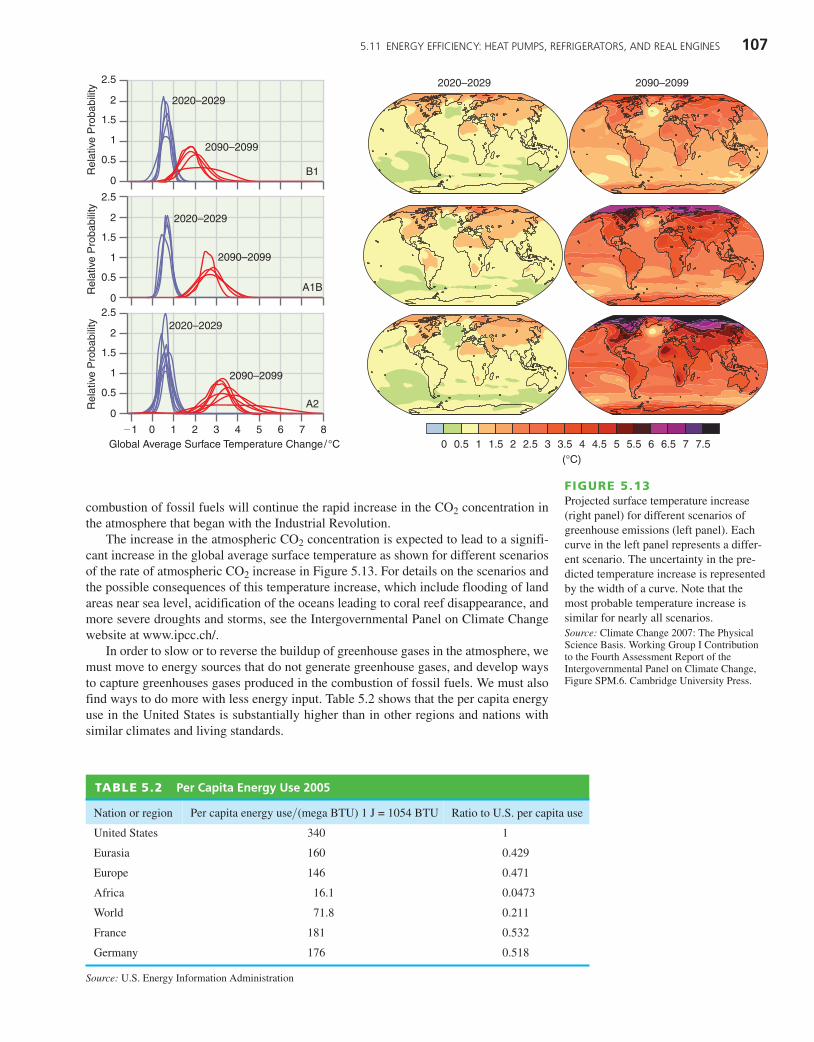
The increase in the atmospheric CO2 concentration is expected to lead to a signifi-cant increase in the global average surface temperature as shown for different scenariosof the rate of atmospheric CO2 increase in Figure 5.13. For details on the scenarios andthe possible consequences of this temperature increase, which include flooding of landareas near sea level, acidification of the oceans leading to coral reef disappearance, andmore severe droughts and storms, see the Intergovernmental Panel on Climate Changewebsite at www.ipcc.ch/.
In order to slow or to reverse the buildup of greenhouse gases in the atmosphere, wemust move to energy sources that do not generate greenhouse gases, and develop waysto capture greenhouses gases produced in the combustion of fossil fuels. We must alsofind ways to do more with less energy input. Table 5.2 shows that the per capita energyuse in the United States is substantially higher than in other regions and nations withsimilar climates and living standards.
0.5
2020–2029 2090–2099
1.5 2.5 3.5 4.5 5.5 6.5 7.51 2 3 4 5 6 70�1 0
0
0.5
1
1.5
2
2.50
0.5
1
1.5
2
2.5
0
0.5
1
1.5
2
2.5
1 2 3 4 5 6 7 8Global Average Surface Temperature Change/°C
(°C)
B1
2020–2029
2090–2099
2020–2029
2090–2099
2020–2029
2090–2099
A1B
A2Rel
ativ
e P
roba
bilit
yR
elat
ive
Pro
babi
lity
Rel
ativ
e P
roba
bilit
y
FIGURE 5.13Projected surface temperature increase(right panel) for different scenarios ofgreenhouse emissions (left panel). Eachcurve in the left panel represents a differ-ent scenario. The uncertainty in the pre-dicted temperature increase is representedby the width of a curve. Note that themost probable temperature increase issimilar for nearly all scenarios. Source: Climate Change 2007: The PhysicalScience Basis. Working Group I Contributionto the Fourth Assessment Report of theIntergovernmental Panel on Climate Change,Figure SPM.6. Cambridge University Press.
TABLE 5.2 Per Capita Energy Use 2005
Nation or region Per capita energy use (mega BTU) 1 J = 1054 BTU> Ratio to U.S. per capita use
United States 340 1
Eurasia 160 0.429
Europe 146 0.471
Africa 16.1 0.0473
World 71.8 0.211
France 181 0.532
Germany 176 0.518
Source: U.S. Energy Information Administration
05 Chapter 47503.qxd 11/28/11 4:23 PM Page 107
108 CHAPTER 5 Entropy and the Second and Third Laws of Thermodynamics
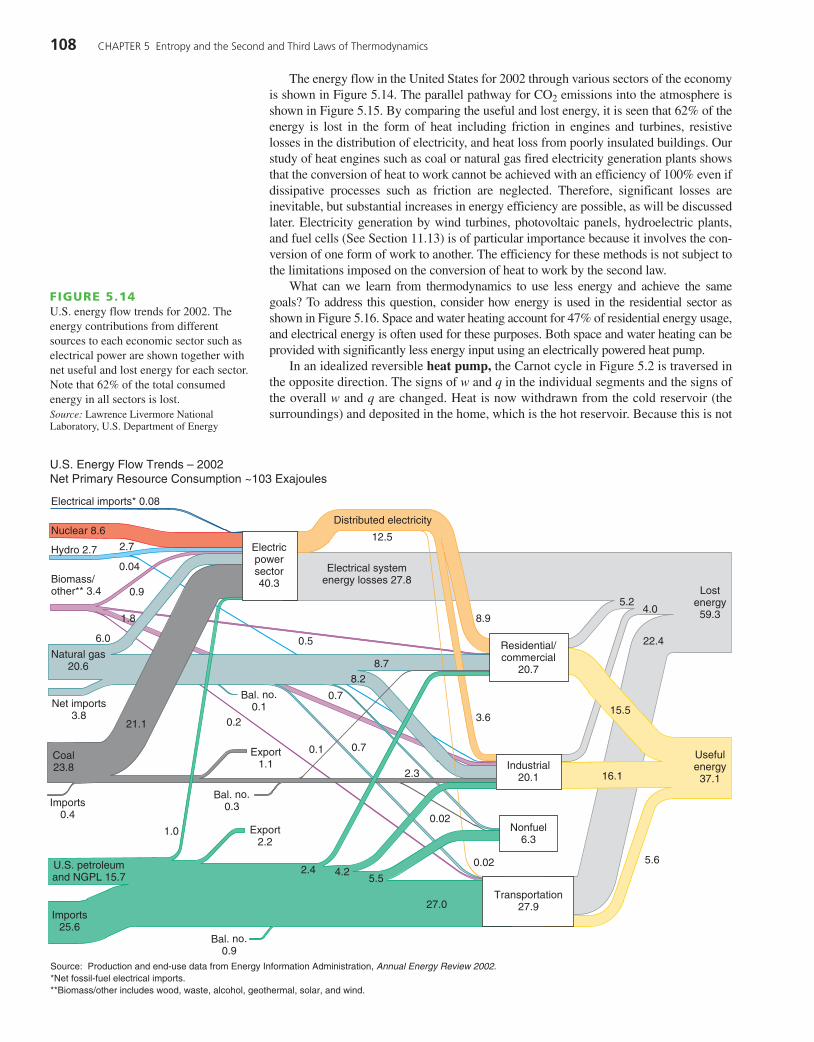
The energy flow in the United States for 2002 through various sectors of the economyis shown in Figure 5.14. The parallel pathway for CO2 emissions into the atmosphere isshown in Figure 5.15. By comparing the useful and lost energy, it is seen that 62% of theenergy is lost in the form of heat including friction in engines and turbines, resistivelosses in the distribution of electricity, and heat loss from poorly insulated buildings. Ourstudy of heat engines such as coal or natural gas fired electricity generation plants showsthat the conversion of heat to work cannot be achieved with an efficiency of 100% even ifdissipative processes such as friction are neglected. Therefore, significant losses areinevitable, but substantial increases in energy efficiency are possible, as will be discussedlater. Electricity generation by wind turbines, photovoltaic panels, hydroelectric plants,and fuel cells (See Section 11.13) is of particular importance because it involves the con-version of one form of work to another. The efficiency for these methods is not subject tothe limitations imposed on the conversion of heat to work by the second law.
What can we learn from thermodynamics to use less energy and achieve the samegoals? To address this question, consider how energy is used in the residential sector asshown in Figure 5.16. Space and water heating account for 47% of residential energy usage,and electrical energy is often used for these purposes. Both space and water heating can beprovided with significantly less energy input using an electrically powered heat pump.
In an idealized reversible heat pump, the Carnot cycle in Figure 5.2 is traversed inthe opposite direction. The signs of w and q in the individual segments and the signs ofthe overall w and q are changed. Heat is now withdrawn from the cold reservoir (thesurroundings) and deposited in the home, which is the hot reservoir. Because this is not
Electricpowersector40.3
Electrical systemenergy losses 27.8
Distributed electricity
Residential/commercial
20.7
Coal23.8
U.S. petroleumand NGPL 15.7
Imports0.4
Imports25.6
Source: Production and end-use data from Energy Information Administration, Annual Energy Review 2002.*Net fossil-fuel electrical imports.**Biomass/other includes wood, waste, alcohol, geothermal, solar, and wind.
Net imports3.8
Electrical imports* 0.08
U.S. Energy Flow Trends – 2002Net Primary Resource Consumption ~103 Exajoules
Nuclear 8.6
Hydro 2.7
Biomass/other** 3.4
Natural gas20.6
1.0
0.1 0.7
0.9
6.0
1.8
0.7
8.9
3.6
8.28.7
0.04
0.02
0.02
2.7
2.3
2.4 4.25.5
5.6
5.24.0
22.4
16.1
15.5
27.0
0.5
12.5
0.2
Export2.2
Export1.1
Bal. no.0.3
Bal. no.0.1
Bal. no.0.9
Industrial20.1
Usefulenergy37.1
Lostenergy59.3
Nonfuel6.3
Transportation27.9
21.1
FIGURE 5.14U.S. energy flow trends for 2002. Theenergy contributions from differentsources to each economic sector such aselectrical power are shown together withnet useful and lost energy for each sector.Note that 62% of the total consumedenergy in all sectors is lost. Source: Lawrence Livermore NationalLaboratory, U.S. Department of Energy
05 Chapter 47503.qxd 11/28/11 4:23 PM Page 108

5.11 ENERGY EFFICIENCY: HEAT PUMPS, REFRIGERATORS, AND REAL ENGINES 109
a spontaneous process, work must be done on the system to effect this direction of heatflow. The heat and work flow for a heat pump is shown in Figure 5.17b.
A heat pump is used to heat a building by extracting heat from a colder thermalreservoir such as a lake, the ground, or the ambient air. The coefficient of performanceof a heat pump, , is defined as the ratio of the heat pumped into the hot reservoir tothe work input to the heat pump:
(5.44)
Assume that Thot = 294 K and Tcold = 278 K, typical for a mild winter day. The maxi-mum value is calculated to be 18. Such high values cannot be attained for real heatpumps operating in an irreversible cycle with dissipative losses. Typical values forcommercially available heat pumps lie in the range of 3 to 4. This means that for everyjoule of electrical work supplied to the heat pump, 3 to 4 J of heat are made availablefor space heating.
Heat pumps become less effective as Tcold decreases, as shown by Equation (5.44).Therefore, geothermal heat pumps, which use ~55°F soil 6–10 feet below Earth’ssurface rather than ambient air as the cold reservoir, are much more efficient in coldclimates than air source heat pumps. Note that a coefficient of performance of 3.5for a heat pump means that a house can be heated using 29% of the electrical powerconsumption that would be required to heat the same house using electrical base-board heaters. This is a significant argument for using heat pumps for residentialheating. Heat pumps can also be used to heat water. Assuming a heat pump coeffi-cient of performance of 3.5, the energy usage of a typical household can be reducedby 35% simply by replacing electrical water heaters and electrical baseboard heatersby heat pumps, which pay for the increased initial cost by lower monthly electricitybills within a few years. The flow of CO2 into the atmosphere is reduced by the same
hhp
hhp =
qhot
w=
qhot
qhot + qcold=
Thot
Thot - Tcold
hhp
Residential/commercial
2,206
Electricitypower sector
2,249
U.S. 2002 Carbon Dioxide Emissions from EnergyConsumption – 5,682* Million Metric Tons of CO2**
1,875
Petroleum2,453
Coal2,070
Coal cake imports 6
Renewables 3***
Natural Gas1,203
Industrial1,674
Transportation1,850
1,811
413
15772
179
10 35643
1,503
433
437
3
Source: Energy Information Administration. Emissions ofGreenhouse Gases in the United States 2002. Tables 4–10.*Includes adjustments of 42.9 million metric tons of carbon dioxidefrom U.S. territories, less 90.2 MtCO2 from international and military bunker fuels.**Previous versions of this chart showed emissions in metric tons of carbon, not of CO2.***Municipal solid waste and geothermal energy.Note: Numbers may not equal sum of components because of independent rounding.
FIGURE 5.15U.S. carbon dioxide emissions fromenergy consumption for 2002. The path-ways of CO2 generation in three eco-nomic sectors are shown together with abreakdown in the three fossil fuel sourcesof natural gas, coal, and petroleum. Source: Lawrence Livermore NationalLaboratory, U.S. Department of Energy
Space heating34%
ElectricA/C11%
Refrigerator8%
Waterheating
13%
Appliancesand lighting
34%
FIGURE 5.16Distribution of U.S. residential energy useamong household needs. Source: U.S. Energy Information Agency
05 Chapter 47503.qxd 11/28/11 4:23 PM Page 109

110 CHAPTER 5 Entropy and the Second and Third Laws of Thermodynamics
amount. Houses can be designed to significantly reduce total energy use. The“Passive House” uses a small fraction of the energy needed to operate a typicalhouse. More than 15,000 of these houses have been built in Europe and as of 2010,only 13 have been built in the United States. For more information on the PassiveHouse concept, see http://www.passivehouse.us/passiveHouse/PHIUSHome.html.
A refrigerator is also a heat engine operated in reverse. (Figure 5.17a). The interiorof the refrigerator is the system, and the room in which the refrigerator is situated is thehot reservoir. Because more heat is deposited in the room than is withdrawn from theinterior of the refrigerator, the overall effect of such a device is to increase the tempera-ture of the room. However, the usefulness of the device is that it provides a cold volumefor food storage. The coefficient of performance, , of a reversible Carnot refrigeratoris defined as the ratio of the heat withdrawn from the cold reservoir to the work suppliedto the device:
(5.45)
This formula shows that as Tcold decreases from 0.9 Thot to 0.1 Thot, decreases from9 to 0.1. Equation (5.44) states that if the refrigerator is required to provide a lowertemperature, more work is required to extract a given amount of heat.
A household refrigerator typically operates at 255 K in the freezing compartment,and 277 K in the refrigerator section. Using the lower of these temperatures for the cold
hr
hr =
qcold
w=
qcold
qhot + qcold=
Tcold
Thot - Tcold
hr
Cold reservoir Cold reservoir
Work
Hot reservoir
Work
Hot reservoir
(a) (b)
FIGURE 5.17Reverse heat enginescan be used to induceheat flow from a coldreservoir to a hot reser-voir with the input ofwork. (a) Refrigerator:the cold reservoir is theinterior of a refrigerator,and the hot reservoir isthe room in which therefrigerator is located.(b) Heat pump: the coldreservoir is water-filledpipes buried in theground, and the hotreservoir is the interiorof the house to beheated. The relativewidths of the two pathsentering the hot reser-voir show that a smallamount of work inputcan move a largeramount of heat from thecold to the hot reservoir.In both cases, the engineis a compressor.
05 Chapter 47503.qxd 11/28/11 4:23 PM Page 110
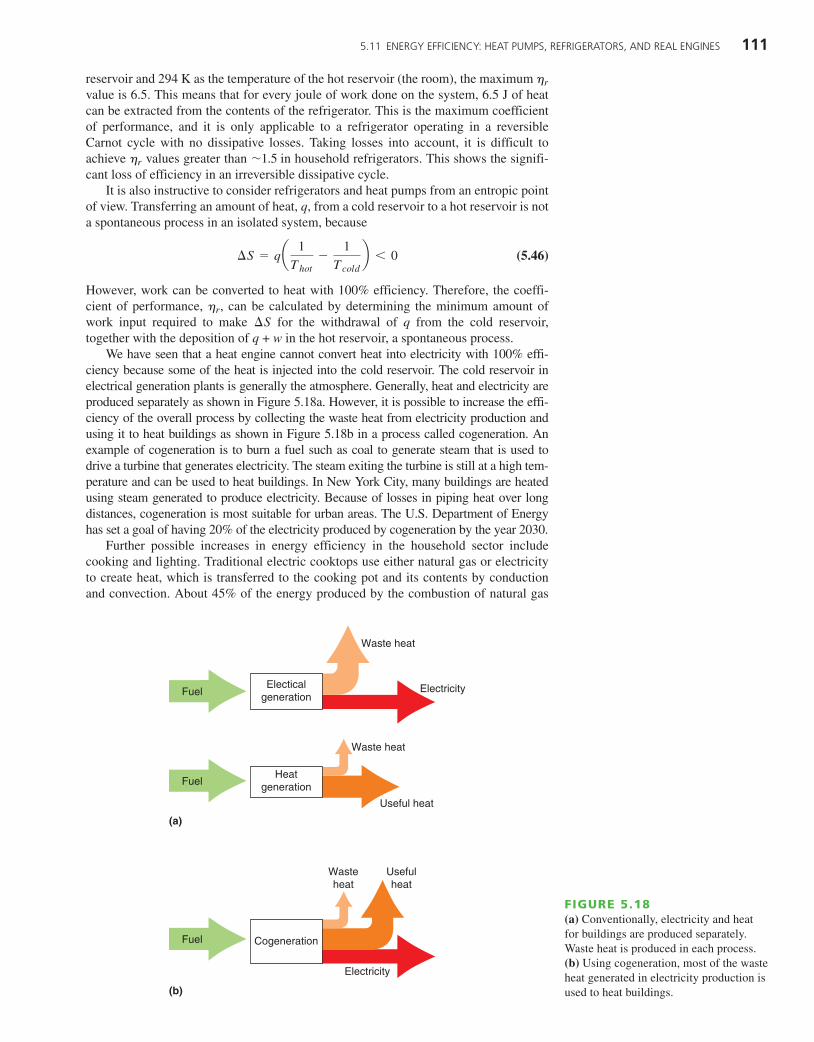
5.11 ENERGY EFFICIENCY: HEAT PUMPS, REFRIGERATORS, AND REAL ENGINES 111
reservoir and 294 K as the temperature of the hot reservoir (the room), the maximum value is 6.5. This means that for every joule of work done on the system, 6.5 J of heatcan be extracted from the contents of the refrigerator. This is the maximum coefficientof performance, and it is only applicable to a refrigerator operating in a reversibleCarnot cycle with no dissipative losses. Taking losses into account, it is difficult toachieve values greater than in household refrigerators. This shows the signifi-cant loss of efficiency in an irreversible dissipative cycle.
It is also instructive to consider refrigerators and heat pumps from an entropic pointof view. Transferring an amount of heat, q, from a cold reservoir to a hot reservoir is nota spontaneous process in an isolated system, because
(5.46)
However, work can be converted to heat with 100% efficiency. Therefore, the coeffi-cient of performance, , can be calculated by determining the minimum amount ofwork input required to make for the withdrawal of q from the cold reservoir,together with the deposition of q + w in the hot reservoir, a spontaneous process.
We have seen that a heat engine cannot convert heat into electricity with 100% effi-ciency because some of the heat is injected into the cold reservoir. The cold reservoir inelectrical generation plants is generally the atmosphere. Generally, heat and electricity areproduced separately as shown in Figure 5.18a. However, it is possible to increase the effi-ciency of the overall process by collecting the waste heat from electricity production andusing it to heat buildings as shown in Figure 5.18b in a process called cogeneration. Anexample of cogeneration is to burn a fuel such as coal to generate steam that is used todrive a turbine that generates electricity. The steam exiting the turbine is still at a high tem-perature and can be used to heat buildings. In New York City, many buildings are heatedusing steam generated to produce electricity. Because of losses in piping heat over longdistances, cogeneration is most suitable for urban areas. The U.S. Department of Energyhas set a goal of having 20% of the electricity produced by cogeneration by the year 2030.
Further possible increases in energy efficiency in the household sector includecooking and lighting. Traditional electric cooktops use either natural gas or electricityto create heat, which is transferred to the cooking pot and its contents by conductionand convection. About 45% of the energy produced by the combustion of natural gas
¢Shr
¢S = qa 1
Thot-
1
Tcoldb 6 0
'1.5hr
hr
Electicalgeneration
Heatgeneration
Cogeneration
Fuel
Waste heat
Waste heat
Wasteheat
Useful heat
Usefulheat
Electricity
Electricity
Fuel
Fuel
(a)
(b)
FIGURE 5.18(a) Conventionally, electricity and heatfor buildings are produced separately.Waste heat is produced in each process.(b) Using cogeneration, most of the wasteheat generated in electricity production isused to heat buildings.
05 Chapter 47503.qxd 11/28/11 4:23 PM Page 111

112 CHAPTER 5 Entropy and the Second and Third Laws of Thermodynamics
and 35% of the electrical energy is lost because the air rather than the pot is heated. Themost efficient method for cooking is induction cooking, in which an induction coil gen-erates a magnetic field that induces heating in metal cookware placed on top of it.Although the efficiency of this method is 90%, the initial investment is significantlygreater than for a gas or electric range. Traditional lighting technology is very ineffi-cient, with incandescent lights converting only 2% of the electrical work required toheat the tungsten filament to visible light. The remaining 98% of the radiated energyappears as heat. Fluorescent lights, which are much more efficient, contain a smallamount of Hg vapor that emits UV light from an excited state created by an electricaldischarge. The UV light is absorbed by a fluorescent coating on the surface of the bulb,which radiates the light in the visible spectrum. The fraction of the emitted light in thevisible spectrum is much larger than in incandescent lighting. For this reason, fluores-cent lighting is a factor of 5 to 6 more efficient. Australia has plans to ban the use ofincandescent lighting in favor of fluorescent lighting because of its low efficiency. LEDlighting (light emitting diodes) is a rapidly growing sector of lighting. LED lights havean efficiency similar to fluorescent lighting, but are more compact and can be highlydirected or diffuse sources of light.
Because the transportation sector is a major user of energy, we next discuss realengines, using the Otto engine, typically used in automobiles, and the diesel engine asexamples. The Otto engine is the most widely used engine in automobiles. Theengine cycle consists of four strokes as shown in Figure 5.19. The intake valve opensas the piston is moving downward, drawing a fuel–air mixture into the cylinder. Theintake valve is closed, and the mixture is compressed as the piston moves upward. Justafter the piston has reached its highest point, the fuel–air mixture is ignited by a sparkplug, and the rapid heating resulting from the combustion process causes the gas toexpand and the pressure to increase. This drives the piston down in a power stroke.Finally, the combustion products are forced out of the cylinder by the upward-movingpiston as the exhaust valve is opened. To arrive at a maximum theoretical efficiencyfor the Otto engine, the reversible Otto cycle shown in Figure 5.20a is analyzed,assuming reversibility.
The reversible Otto cycle begins with the intake stroke , which is assumed totake place at constant pressure. At this point, the intake valve is closed, and the pistoncompresses the fuel–air mixture along the adiabatic path in the second step. Thispath can be assumed to be adiabatic because the compression occurs too rapidly to allowmuch heat to be transferred out of the cylinder. Ignition of the fuel–air mixture takesplace at d. The rapid increase in pressure takes place at constant volume. In thisreversible cycle, the combustion is modeled as a quasi-static heat transfer from a seriesof reservoirs at temperatures ranging from Td to Ta. The power stroke is modeled as theadiabatic expansion . At this point, the exhaust valve opens and the gas isexpelled. This step is modeled as the constant volume pressure decrease . Theupward movement of the piston expels the remainder of the gas along the line ,after which the cycle begins again.
c : eb : c
a : b
c : d
e : c
Intake Compression Power Exhaust
FIGURE 5.19Illustration of the four-stroke cycle of anOtto engine, as explained in the text. Theleft valve is the intake valve, and the rightvalve is the exhaust valve.
05 Chapter 47503.qxd 11/28/11 4:23 PM Page 112

5.11 ENERGY EFFICIENCY: HEAT PUMPS, REFRIGERATORS, AND REAL ENGINES 113
The efficiency of this reversible cyclic engine can be calculated as follows.Assuming CV to be constant along the segments and , we write
(5.47)
The efficiency is given by
(5.48)
The temperatures and volumes along the reversible adiabatic segments are related by
(5.49)
because . Recall that . Ta and Tb can be eliminatedfrom Equation (5.48) to give
(5.50)
where Tc and Td are the temperatures at the beginning and end of the compressionstroke . Temperature Tc is fixed at , and the efficiency can be increasedonly by increasing Td. This is done by increasing the compression ratio, .However, if the compression ratio is too high, Td will be sufficiently high that the fuelignites before the end of the compression stroke. A reasonable upper limit for Td is 600 K,and for Tc = 300 K, . This value is an upper limit, because a real engine doesnot operate in a reversible cycle, and because heat is lost along the segment.Achievable efficiencies in Otto engines used in passenger cars lie in the range of 0.20 to0.30. However, additional losses occur in the drive chain, in tire deformation and in dis-placing air as the vehicle moves. As shown in Figure 5.14, the overall efficiency of thetransportation sector is only 20%.
In the diesel engine depicted in Figure 5.20b, higher compression ratios are possi-ble because only air is let into the cylinder in the intake stroke. The fuel is injectedinto the cylinder at the end of the compression stroke, thus avoiding spontaneous igni-tion of the fuel–air mixture during the compression stroke . Because for the compressed air, combustion occurs spontaneously without a spark plug alongthe constant pressure segment after fuel injection. Because the fuel is injectedover a time period in which the piston is moving out of the cylinder, this step can bemodeled as a constant-pressure heat intake. In this segment, it is assumed that heat isabsorbed from a series of reservoirs at temperatures between Ta and Tb in a quasi-static process. In the other segments, the same processes occur as described for thereversible Otto cycle.
The heat intake along the segment is given by
(5.51)
and qcold is given by Equation (5.47). Therefore, the efficiency is given by
(5.52)
Similarly to the treatment of the Otto engine, Tb and Tc can be eliminated fromEquation (5.52), and the expression
(5.53)
can be derived. For typical values , = 1.5, and .The higher efficiency achievable with the diesel cycle in comparison with the Ottocycle is a result of the higher temperature attained in the compression cycle. Realdiesel engines used in trucks and passenger cars have efficiencies in the range of0.30 to 0.35.
e = 0.64gVb>Vd = 0.2,Va>Vd = 1>15
e = 1 -
1
g
aVb
Vdbg - aVa
Vdbg
aVb
Vdb - aVa
Vdb
e = 1 -
1
gaTc - Td
Tb - Tab
qhot = Cp(Tb - Ta)
a : b
a : b
T'950 Kd : a
c : de = 0.50
Vc>Vd
'300 Kc : d
e = 1 -
Tc
Td
g = CP>CVVb = Vc and Vd = Ve
TcVg-1c = TdVg-1
d and TbVg-1c = TaVg-1
d
e =
qhot + qcold
qhot= 1 -
qcold
qhot= 1 - a Tb - Tc
Ta - Tdb
qhot = CV(Ta - Td) and qcold = CV(Tb - Tc)
b : cd : a
d
a
b
Volume
Pre
ssur
e
Adiabatic
Adiabatic
qcold
qhot
Otto cycle
e c
d
a b
Volume
(a)
(b)
Pre
ssur
e
Adiabatic
Adiabatic
qcold
qhotDiesel cycle
e
c
FIGURE 5.20Idealized reversible cycles of the (a) Ottoand (b) diesel engines.
05 Chapter 47503.qxd 11/28/11 4:23 PM Page 113

114 CHAPTER 5 Entropy and the Second and Third Laws of Thermodynamics
Just as for space heating, the energy usage in the U.S. transportation sector canbe drastically reduced. The U.S. personal vehicle fleet currently averages 27.5 milesper gallon of gasoline. The corresponding figure for the European Union, wheregasoline prices are more than twice as high as in the United States, is 43 miles pergallon, corresponding to 130 g CO2 emission per kilometer. Hybrid gasoline–electricvehicles (Figure 5.21b) that use electrical motors to power the vehicle at low speeds,switch automatically to an Otto engine at higher speeds, and use regenerative braking to capture the energy used to slow the vehicle are currently the most effi-cient vehicles, averaging more than 50 miles per gallon. Purely electric vehicles(Figure 5.21a) and plug-in hybrids, which will allow the batteries that power theelectrical operation mode to be recharged at the owner’s residence are expected tobe available in 2011. Advances in battery technology are likely to make the use ofelectrical vehicles more widespread in the near future.
Automobiles that use fuel cells (See Section 11.13) as a power source are of particu-lar interest for future development because the work arising from a chemical reactioncan be converted to work with 100% efficiency (ignoring dissipative losses), rather thanfirst capturing the heat from the reaction and subsequently (partially) converting the heatto work.
Reversing global climate change requires that energy be generated without alsoproducing CO2. Hydrogen meets this need and can be used in internal combustionengines without substantial modifications. Currently, 96% of the H2 consumedworldwide is produced using fossil fuels, primarily through steam reforming ofmethane. Reversing global climate change would require that H2 be produced usingwater electrolysis and electricity from renewable resources such as wind, solar,hydroelectric, or nuclear power. At present, such processes are not cost competitive,but rising oil prices and the falling cost of renewable energy may change this balance.A further unsolved problem for vehicular use is H2 storage. The volumetric energydensity of liquid H2 (boiling temperature 20 K) is a factor of 4 below that of gasoline,and solid hydrides from which H2 can be released at ambient temperature have amuch lower energy density.
A possible alternative to the current fossil fuel economy is a methanol economy(see G. A. Olah et al., Beyond Oil and Gas: The Methanol Economy, Wiley-VCH,2006). Methanol is a suitable fuel for internal combustion engines and has half the vol-umetric energy density of gasoline. It is also a good source for producing synthetichydrocarbons, which could replace petroleum feedstocks widely used in the chemicalindustry. As shown in Figure 5.22, methanol could be synthesized by recycling CO2 ifhydrogen generated using renewable energy were available in sufficient quantities. Aninitial source of CO2 could be coal-fired electrical plants, and it is conceivable that inthe future CO2 could be extracted from the atmosphere (See the previous reference fordetails.). These pathways would slow or reverse global climate change.
(a) Nissan Leaf (b) Chevrolet Volt
FIGURE 5.21The Nissan Leaf (a) is a purely electricvehicle with an estimated range between47 and 138 miles between rechargingcycles, depending on driving conditions.The Chevrolet Volt (b) is an electric vehi-cle that has a small gasoline motor that canrecharge the batteries used to power thevehicle. The U.S. EnvironmentalProtection Agency has given the Leaf andVolt energy consumption ratings of 99 and60 miles per gallon, respectively, using33.7 kW-hrs as being equivalent in energyto one gallon of gasoline.
05 Chapter 47503.qxd 11/28/11 4:23 PM Page 114
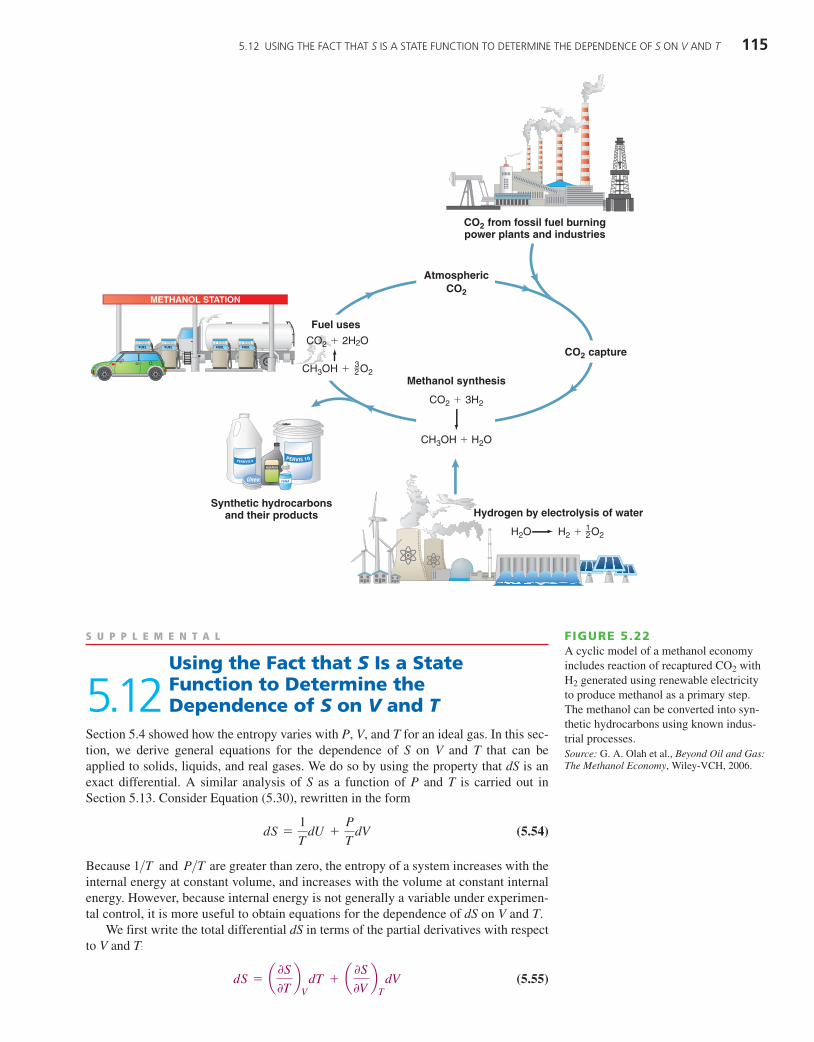
5.12 USING THE FACT THAT S IS A STATE FUNCTION TO DETERMINE THE DEPENDENCE OF S ON V AND T 115
S U P P L E M E N T A L
5.12Using the Fact that S Is a StateFunction to Determine theDependence of S on V and T
Section 5.4 showed how the entropy varies with P, V, and T for an ideal gas. In this sec-tion, we derive general equations for the dependence of S on V and T that can beapplied to solids, liquids, and real gases. We do so by using the property that dS is anexact differential. A similar analysis of S as a function of P and T is carried out inSection 5.13. Consider Equation (5.30), rewritten in the form
(5.54)
Because are greater than zero, the entropy of a system increases with theinternal energy at constant volume, and increases with the volume at constant internalenergy. However, because internal energy is not generally a variable under experimen-tal control, it is more useful to obtain equations for the dependence of dS on V and T.
We first write the total differential dS in terms of the partial derivatives with respectto V and T:
(5.55)dS = a 0S
0Tb
VdT + a 0S
0Vb
TdV
1>T and P>TdS =
1
TdU +
P
TdV
CO2 from fossil fuel burningpower plants and industries
H2O H2 � O2
Synthetic hydrocarbonsand their products
METHANOL STATION
CO2 � 3H2
CH3OH � H2O
CO2 capture
AtmosphericCO2
Fuel uses
CO2 � 2H2O
CH3OH � O223
Hydrogen by electrolysis of water
Methanol synthesis
21
FIGURE 5.22A cyclic model of a methanol economyincludes reaction of recaptured CO2 withH2 generated using renewable electricityto produce methanol as a primary step.The methanol can be converted into syn-thetic hydrocarbons using known indus-trial processes. Source: G. A. Olah et al., Beyond Oil and Gas:The Methanol Economy, Wiley-VCH, 2006.
05 Chapter 47503.qxd 11/28/11 4:23 PM Page 115
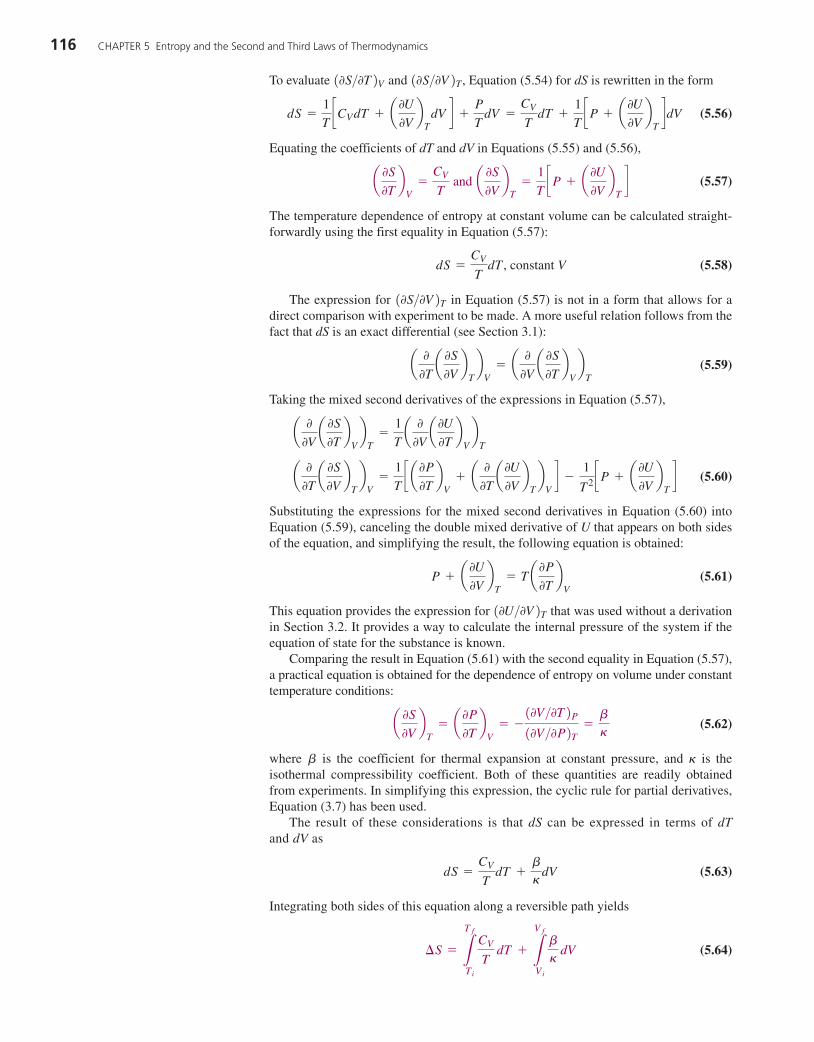
116 CHAPTER 5 Entropy and the Second and Third Laws of Thermodynamics
To evaluate , Equation (5.54) for dS is rewritten in the form
(5.56)
Equating the coefficients of dT and dV in Equations (5.55) and (5.56),
(5.57)
The temperature dependence of entropy at constant volume can be calculated straight-forwardly using the first equality in Equation (5.57):
, constant V (5.58)
The expression for in Equation (5.57) is not in a form that allows for adirect comparison with experiment to be made. A more useful relation follows from thefact that dS is an exact differential (see Section 3.1):
(5.59)
Taking the mixed second derivatives of the expressions in Equation (5.57),
(5.60)
Substituting the expressions for the mixed second derivatives in Equation (5.60) intoEquation (5.59), canceling the double mixed derivative of U that appears on both sidesof the equation, and simplifying the result, the following equation is obtained:
(5.61)
This equation provides the expression for that was used without a derivationin Section 3.2. It provides a way to calculate the internal pressure of the system if theequation of state for the substance is known.
Comparing the result in Equation (5.61) with the second equality in Equation (5.57),a practical equation is obtained for the dependence of entropy on volume under constanttemperature conditions:
(5.62)
where is the coefficient for thermal expansion at constant pressure, and is theisothermal compressibility coefficient. Both of these quantities are readily obtainedfrom experiments. In simplifying this expression, the cyclic rule for partial derivatives,Equation (3.7) has been used.
The result of these considerations is that dS can be expressed in terms of dTand dV as
(5.63)
Integrating both sides of this equation along a reversible path yields
(5.64)¢S =
3
Tf
Ti
CV
T dT +
3
Vf
Vi
b
k dV
dS =
CV
TdT +
b
kdV
kb
a 0S
0Vb
T= a 0P
0Tb
V= -
(0V>0T)P
(0V>0P)T=
b
k
(0U>0V)T
P + a 0U
0Vb
T= Ta 0P
0Tb
V
a 0
0Ta 0S
0Vb
Tb
V=
1
Tc a 0P
0Tb
V+ a 0
0Ta 0U
0Vb
Tb
Vd -
1
T2 cP + a 0U
0Vb
Td
a 0
0Va 0S
0Tb
Vb
T=
1
Ta 0
0Va 0U
0Tb
Vb
T
a 0
0Ta 0S
0Vb
Tb
V= a 0
0Va 0S
0Tb
Vb
T
(0S>0V)T
dS =
CV
TdT
a 0S
0Tb
V=
CV
T and a 0S
0Vb
T=
1
TcP + a 0U
0Vb
Td
dS =
1
TcCVdT + a 0U
0Vb
TdV d +
P
TdV =
CV
TdT +
1
TcP + a 0U
0Vb
TddV
(0S>0T)V and (0S>0V)T
05 Chapter 47503.qxd 11/28/11 4:23 PM Page 116

5.13 THE DEPENDENCE OF S ON T AND P 117
This result applies to a single-phase system of a liquid, solid, or gas that undergoes atransformation from the initial result Ti, Vi to Tf, Vf, provided that no phase changes orchemical reactions occur in the system.
S U P P L E M E N T A L
5.13 The Dependence of S on T and PBecause chemical transformations are normally carried out at constant pressure ratherthan constant volume, we need to know how S varies with T and P. The total differen-tial dS is written in the form
(5.65)
Starting from the relation U = H – PV, we write the total differential dU as
(5.66)
This equation can be rearranged to give an expression for dS:
(5.67)
The previous equation is analogous to Equation (5.54), but contains the variable Prather than V.
(5.68)
Substituting this expression for dH into Equation (5.67),
(5.69)
Because the coefficients of dT and dP must be the same on both sides of Equation (5.69),
(5.70)
The ratio is positive for all substances, allowing us to conclude that S is a mono-tonically increasing function of the temperature.
Just as for in Section 5.12, the expression for is not in a formthat allows a direct comparison with experimental measurements to be made. Just as inour evaluation of , we equate the mixed second partial derivatives of
and :
(5.71)
These mixed partial derivatives can be evaluated using Equation (5.70):
(5.72)
(5.73)
Equating Equations (5.72) and (5.73) yields
(5.74)1
Ta 0
0Ta 0H
0Pb
Tb
P=
1
Tc a 0
0Ta 0H
0Pb
Tb
P- a 0V
0Tb
Pd -
1
T2 c a 0H
0Pb
T- V d
a 0
0Ta 0S
0Pb
Tb
P=
1
Tc a 0
0Ta 0H
0Pb
Tb
P- a 0V
0Tb
Pd -
1
T2 c a 0H
0Pb
T- V d
a 0
0Pa 0S
0Tb
Pb
T=
1
Ta 0CP
0Pb
T=
1
Ta 0
0Pa 0H
0Tb
Pb
T
a 0
0Ta 0S
0Pb
Tb
P= a 0
0Pa 0S
0Tb
Pb
T
(0S>0P)T(0S>0T)P
(0S>0V)T
(0S>0P)T(0S>0V)T
CP>Ta 0S
0Tb
P=
CP
T and a 0S
0Pb
T=
1
Tc a 0H
0Pb
T- V d
dS =
CP
TdT +
1
Tc a 0H
0Pb
T- V ddP = a 0S
0Tb
PdT + a 0S
0Pb
TdP
dH = a 0H
0Tb
PdT + a 0H
0Pb
TdP = CPdT + a 0H
0Pb
TdP
dS =
1
T dH -
V
T dP
dU = T dS - P dV = dH - P dV - V dP
dS = a 0S
0Tb
PdT + a 0S
0Pb
TdP
05 Chapter 47503.qxd 11/28/11 4:23 PM Page 117

118 CHAPTER 5 Entropy and the Second and Third Laws of Thermodynamics
Simplifying this equation results in
(5.75)
Using this result and Equation (5.70), the pressure dependence of the entropy at con-stant temperature can be written in a form that easily allows an experimental determi-nation of this quantity to be made:
(5.76)
Using these results, the total differential dS can be written in terms of experimentallyaccessible parameters as
(5.77)
Integrating both sides of this equation along a reversible path yields
(5.78)
This result applies to a single-phase system of a pure liquid, solid, or gas that undergoesa transformation from the initial result Ti, Pi to Tf, Pf, provided that no phase changes orchemical reactions occur in the system.
S U P P L E M E N T A L
5.14 The Thermodynamic Temperature ScaleThe reversible Carnot cycle provides a basis for the thermodynamic temperaturescale, a scale that is independent of the choice of a particular thermometric substance.This is the case because all reversible Carnot engines have the same efficiency, regard-less of the working substance. The basis for the thermodynamic temperature scale isthe fact that the heat withdrawn from a reservoir is a thermometric property. Both onexperimental and theoretical grounds, it can be shown that
(5.79)
where is the thermodynamic temperature, and a is an arbitrary scale constant that setsnumerical values for the thermodynamic temperature. Using Equations (5.9) and (5.10)for the efficiency of the reversible Carnot engine,
(5.80)
This equation is the fundamental equation establishing an absolute temperature scale.To this point, we have no numerical values for this scale. Note, however, that as
, so that there is a natural zero for this temperature scale. Additionally, if wechoose one value of to be positive, all other values of must be greater than zero.Otherwise, we could find conditions under which the heats have the samesign. This would lead to a perpetual motion machine. Both of these characteristics fitthe requirements of an absolute temperature scale.
A numerical scale for the thermodynamic temperature scale can be obtained byassigning the value 273.16 to the value corresponding to the triple point of water, andby making the size of a degree equal to the size of a degree on the Celsius scale. With thischoice, the thermodynamic temperature scale becomes numerically equal to the absolutetemperature scale based on the ideal gas law. However, the thermodynamic temperaturescale is the primary scale because it is independent of the nature of the working substance.
u
qhot and qcold
uu
u: 0q : 0
e =
qhot + qcold
qhot=
uhot + ucold
uhot
u
q = au
¢S =
3
Tf
Ti
CP
T dT -
3
Pf
Pi
Vb dP
dS =
CP
TdT - Vb dP
a 0S
0Pb
T= - a 0V
0Tb
P= -Vb
a 0H
0Pb
T- V = -Ta 0V
0Tb
P
05 Chapter 47503.qxd 11/28/11 4:23 PM Page 118
CONCEPTUAL PROBLEMS 119
Q5.1 Under what conditions is for a sponta-neous process?
Q5.2 Why are and always positive?
Q5.3 An ideal gas in thermal contact with the surroundingsis cooled in an irreversible process at constant pressure. Are
, , and positive, negative, or zero?Explain your reasoning.
Q5.4 The amplitude of a pendulum consisting of a mass on along wire is initially adjusted to have a very small value. Theamplitude is found to decrease slowly with time. Is thisprocess reversible? Would the process be reversible if theamplitude did not decrease with time?
Q5.5 A process involving an ideal gas and in which thetemperature changes at constant volume is carried out. For afixed value of , the mass of the gas is doubled. Theprocess is repeated with the same initial mass and is dou-bled. For which of these processes is greater? Why?
Q5.6 You are told that for a process in which thesystem is coupled to its surroundings. Can you conclude thatthe process is reversible? Justify your answer.
Q5.7 Under what conditions does the equality hold?
Q5.8 Is the following statement true or false? If it is false,rephrase it so that it is true. The entropy of a system cannotincrease in an adiabatic process.
Q5.9 Which of the following processes is spontaneous?
a. The reversible isothermal expansion of an ideal gas.
b. The vaporization of superheated water at 102°C and 1 bar.
c. The constant pressure melting of ice at its normal freez-ing point by the addition of an infinitesimal quantityof heat.
d. The adiabatic expansion of a gas into a vacuum.
Q5.10 One Joule of work is done on a system, raising itstemperature by one degree centigrade. Can this increase intemperature be harnessed to do one Joule of work? Explain.
Q5.11 Your roommate decides to cool the kitchen byopening the refrigerator. Will this strategy work? Explainyour reasoning.
¢H>T ¢S =
¢S = 0
¢S¢T
¢T
¢Stotal¢Ssurroundings¢S
¢Svaporization¢Sfusion
¢S 6 0 Q5.12 An ideal gas undergoes an adiabatic expansion into avacuum. Are , , and positive, nega-tive, or zero? Explain your reasoning.
Q5.13 When a saturated solution of a salt is cooled, a pre-cipitate crystallizes out. Is the entropy of the crystalline pre-cipitate greater or less than the dissolved solute? Explain whythis process is spontaneous.
Q5.14 A system undergoes a change from one state toanother along two different pathways, one of which isreversible and the other of which is irreversible. What can yousay about the relative magnitudes of qreversible and qirreversible?
Q5.15 An ideal gas in a piston and cylinder assembly withadiabatic walls undergoes an expansion against a constantexternal pressure. Are , , and posi-tive, negative, or zero? Explain your reasoning.
Q5.16 Is the equation
valid for an ideal gas?
Q5.17 Why is the efficiency of a Carnot heat engine the upperbound to the efficiency of an internal combustion engine?
Q5.18 Two vessels of equal volume, pressure and temper-ature both containing Ar are connected by a valve. What isthe change in entropy when the valve is opened, allowingmixing of the two volumes? Is the same if one of thevolumes contained Ar, and the other contained Ne?
Q5.19 Without using equations, explain why for a liq-uid or solid is dominated by the temperature dependence of Sas both P and T change.
Q5.20 Solid methanol in thermal contact with the surround-ings is reversibly melted at the normal melting point at a pres-sure of 1 atm. Are , , and positive,negative, or zero? Explain your reasoning.
Q5.21 Can incandescent lighting be regarded as an exampleof cogeneration during the heating season? In a season whereair conditioning is required?
¢Stotal¢Ssurroundings¢S
¢S
¢S
¢S =
3
Tf
Ti
CV
T dT +
3
Vf
Vi
b
k dV = CV ln
Tf
Ti+
b
k(Vf - Vi)
¢Stotal¢Ssurroundings¢S
¢Stotal¢Ssurroundings¢S
Vocabulary
Carnot cycle
Clausius inequality
coefficient of performance
diesel engine
entropy
heat engine
heat pump
irreversible process
natural transformations
Otto engine
perpetual motion machine of thefirst kind
perpetual motion machine of thesecond kind
refrigerator
second law of thermodynamics
spontaneous process
thermodynamic temperature scale
third law of thermodynamics
unnatural transformations
Conceptual Problems
05 Chapter 47503.qxd 11/28/11 4:23 PM Page 119
120 CHAPTER 5 Entropy and the Second and Third Laws of Thermodynamics
T = 298K CO2 (g) H2O (l) C6H12O6(s) O2(g)
kJ mol–1¢H �
f –393.5 –285.8 –1273.1 0.0
J mol–1K–1S � 213.8 70.0 209.2 205.2
J mol–1K–1C �P,m 37.1 75.3 219.2 29.4
Problem numbers in red indicate that the solution to the prob-lem is given in the Student’s Solutions Manual.
P5.1 Consider the formation of glucose from carbon diox-ide and water (i.e., the reaction of the photosyntheticprocess): .
The following table of information will be useful in workingthis problem:
6CO2(g) + 6H2O(l) : C6H12O6(s) + 6O2(g)
P5.5 One mole of H2O(l) is compressed from a state describedby P = 1.00 bar and T = 350. K to a state described by P = 590.bar and T = 750. K. In addition, = 2.07 � 10–4 K–1 and thedensity can be assumed to be constant at the value 997 kg m–3.Calculate for this transformation, assuming that = 0.
P5.6 2.25 moles of an ideal gas with CV,m = 3R 2 undergoesthe transformations described in the following list from aninitial state described by T = 310. K and P = 1.00 bar.Calculate q, w, for each process.
a. The gas is heated to 675 K at a constant external pressureof 1.00 bar.
b. The gas is heated to 675 K at a constant volume correspon-ding to the initial volume.
c. The gas undergoes a reversible isothermal expansion at310. K until the pressure is one third of its initial value.
P5.7 Consider the reversible Carnot cycle shown in Figure 5.2with 1.25 mol of an ideal gas with CV = 5R 2 as the workingsubstance. The initial isothermal expansion occurs at the hotreservoir temperature of Thot = 740. K from an initial volume of3.75 L (Va) to a volume of 12.8 L (Vb). The system then under-goes an adiabatic expansion until the temperature falls to Tcold =310 K. The system then undergoes an isothermal compressionand a subsequent adiabatic compression until the initial statedescribed by Ta = 740. K and Va = 3.75 L is reached.
a. Calculate Vc and Vd.
b. Calculate w for each step in the cycle and for the total cycle.
c. Calculate and the amount of heat that is extracted fromthe hot reservoir to do 1.00 kJ of work in the surroundings.
P5.8 The average heat evolved by the oxidation of foodstuffsin an average adult per hour per kilogram of body weight is7.20 kJ kg–1 hr–1. Assume the weight of an average adult is62.0 kg. Suppose the total heat evolved by this oxidation is trans-ferred into the surroundings over a period lasting one week.Calculate the entropy change of the surroundings associated withthis heat transfer. Assume the surroundings are at T = 293 K.
P5.9 Calculate , , and when thevolume of 150. g of CO initially at 273 K and 1.00 barincreases by a factor of two in (a) an adiabatic reversibleexpansion, (b) an expansion against Pexternal = 0, and (c) anisothermal reversible expansion. Take CP,m to be constant atthe value 29.14 J mol–1K–1 and assume ideal gas behavior.State whether each process is spontaneous. The temperatureof the surroundings is 273 K.
P5.10 The maximum theoretical efficiency of an internalcombustion engine is achieved in a reversible Carnot cycle.Assume that the engine is operating in the Otto cycle andthat CV,m = 5R 2 for the fuel–air mixture initially at 273 K(the temperature of the cold reservoir). The mixture is com-pressed by a factor of 6.9 in the adiabatic compression step.What is the maximum theoretical efficiency of this engine?How much would the efficiency increase if the compression
>
¢Ssurroundings¢Stotal¢S
e
>
¢U, ¢H, and ¢S
>k¢S
b
Numerical Problems
Calculate the entropy and enthalpy changes for this chemicalsystem at T = 298 K and T = 310. K. Calculate also theentropy change of the surroundings and the universe at bothtemperatures, assuming that the system and surroundings areat the same temperature.
P5.2 The Chalk Point, Maryland, generating station sup-plies electrical power to the Washington, D.C., area. Units 1and 2 have a gross generating capacity of 710. MW (megawatt).The steam pressure is 25 � 106 Pa, and the superheater outlettemperature (Th) is 540.°C. The condensate temperature (Tc)is 30.0°C.
a. What is the efficiency of a reversible Carnot engine operat-ing under these conditions?
b. If the efficiency of the boiler is 91.2%, the overall effi-ciency of the turbine, which includes the Carnot efficiencyand its mechanical efficiency, is 46.7%, and the efficiencyof the generator is 98.4%, what is the efficiency of the totalgenerating unit? (Another 5.0% needs to be subtracted forother plant losses.)
c. One of the coal-burning units produces 355 MW. Howmany metric tons (1 metric ton = 1 � 106 g) of coal perhour are required to operate this unit at its peak output ifthe enthalpy of combustion of coal is 29.0 � 103 kJ kg–1?
P5.3 An electrical motor is used to operate a Carnot refrig-erator with an interior temperature of 0.00°C. Liquid water at0.00°C is placed into the refrigerator and transformed to ice at0.00°C. If the room temperature is 300. K, what mass of icecan be produced in one day by a 0.50-hp motor that is run-ning continuously? Assume that the refrigerator is perfectlyinsulated and operates at the maximum theoretical efficiency.
P5.4 An air conditioner is a refrigerator with the inside ofthe house acting as the cold reservoir and the outsideatmosphere acting as the hot reservoir. Assume that an airconditioner consumes 1.70 103 W of electrical power,and that it can be idealized as a reversible Carnot refrigera-tor. If the coefficient of performance of this device is 3.30,how much heat can be extracted from the house in a day?
*
05 Chapter 47503.qxd 11/28/11 4:23 PM Page 120

NUMERICAL PROBLEMS 121
ratio could be increased to 15? Do you see a problem indoing so?
P5.11 2.25 moles of an ideal gas with CV, m = 5R 2 are trans-formed from an initial state T = 680. K and P = 1.15 bar to a finalstate T = 298 K and P = 4.75 bar. Calculate for this process.
P5.12 1.10 moles of N2 at 20.5°C and 6.20 bar undergoes atransformation to the state described by 215°C and 1.75 bar.Calculate if
P5.13 Calculate for the isothermal compression of1.75 mole of Cu(s) from 2.15 bar to 1250. bar at 298 K.
, , and thedensity is 8.92g cm–3. Repeat the calculation assuming that
.
P5.14 Calculate for the reaction at 725 K. Omit terms in the temperature-dependent
heat capacities higher than .
P5.15 Using the expression ,
calculate the decrease in temperature that occurs if 2.25 molesof water at 310. K and 1650. bar is brought to a final pressure of1.30 bar in a reversible adiabatic process. Assume that .
P5.16 3.75 moles of an ideal gas with CV,m = 3 2R under-goes the transformations described in the following list froman initial state described by T = 298 K and P = 4.50 bar.Calculate q, w, for each process.
a. The gas undergoes a reversible adiabatic expansion untilthe final pressure is one third its initial value.
b. The gas undergoes an adiabatic expansion against a con-stant external pressure of 1.50 bar until the final pressure isone third its initial value.
c. The gas undergoes an expansion against a constant exter-nal pressure of zero bar until the final pressure is equal toone third of its initial value.
P5.17 The interior of a refrigerator is typically held at36°F and the interior of a freezer is typically held at 0.00°F.If the room temperature is 65°F, by what factor is it moreexpensive to extract the same amount of heat from thefreezer than from the refrigerator? Assume that the theoreti-cal limit for the performance of a reversible refrigerator isvalid in this case.
P5.18 Using your results from Problem P5.7, calculate q,, and for each step in the cycle and for the total cycle
described in Figure 5.2.
P5.19 At the transition temperature of 95.4°C, the enthalpy oftransition from rhombic to monoclinic sulfur is 0.38 kJ mol–1.
a. Calculate the entropy of transition under these conditions.
¢H¢U
¢U, ¢H, and ¢S
>k = 0
dS =
CP
TdT - VbdP
T2>K22NH3(g)
3H2(g) + N2(g) :¢S �
k = 0
k = 0.78 * 10-6 bar-10.492 * 10-4 K-1b =
¢S
CP, m
J mol-1 K-1 = 30.81 - 11.87 * 10-3T
K+ 2.3968 * 10-5T2
K2
-1.0176 * 10-8T3
K3
¢S
¢U, ¢H, and ¢S
>b. At its melting point, 119°C, the enthalpy of fusion of
monoclinic sulfur is 1.23 kJ mol–1. Calculate the entropyof fusion.
c. The values given in parts (a) and (b) are for 1 mol of sulfur;however, in crystalline and liquid sulfur, the molecule ispresent as S8. Convert the values of the enthalpy and entropyof fusion in parts (a) and (b) to those appropriate for S8.
P5.20 One mole of a van der Waals gas at 25.0°C is expandedisothermally and reversibly from an initial volume of 0.010 m3 toa final volume of 0.095 m3. For the van der Waals gas,
. Assume that a = 0.556 Pa m6 mol–2, and(0U>0V)T = a>V2m
T (K) (J K–1 mol–1)CP, m
10. 0.3020. 2.430. 7.040. 13.060. 25.180. 35.2
100. 43.2120. 50.0140. 56.0160. 61.6180. 67.0200. 72.2220. 77.4240. 82.8260. 88.4280. 94.0300. 99.7
P5.22 Calculate and if the temperature of1.75 moles of Hg(l) is increased from 0.00°C to 75.0°C at1 bar. Over this temperature range,
.
P5.23 Calculate if the temperature of 2.50 mol ofan ideal gas with CV = 5 2R is increased from 160. to675 K under conditions of (a) constant pressure and(b) constant volume.
P5.24 Beginning with Equation (5.5), use Equation (5.6)to eliminate Vc and Vd to arrive at the result
.
P5.25 Calculate for the reaction at 870. K. Omit terms in the temperature-dependent
heat capacities higher than .T2>K22HCl(g)
H2(g) + Cl2(g) :¢S �R
nR(Thot - Tcold) ln Vb>Va
wcycle =
>¢S
30.093 - 4.944 * 10-3T>K CP,m(J K-1 mol-1) =
¢S¢H
that b = 64.0 � 10–6 m3 mol–1. Calculate q, w, for the process.
P5.21 From the following data, derive the absolute entropyof crystalline glycine at T = 300. K.
You can perform the integration numerically using either aspreadsheet program or a curve-fitting routine and a graphingcalculator (see Example Problem 5.9).
and ¢S¢U, ¢H,
05 Chapter 47503.qxd 11/28/11 4:23 PM Page 121
P5.26 A 22.0 g mass of ice at 273 K is added to 136 g ofH2O(l) at 310. K at constant pressure. Is the final state of thesystem ice or liquid water? Calculate for the process. Isthe process spontaneous?
P5.27 Under anaerobic conditions, glucose is broken downin muscle tissue to form lactic acid according to the reaction
. Thermodynamic data atT = 298 K for glucose and lactic acid are given in the fol-lowing table:
C6H12O6 : 2CH3CHOHCOOH
¢S
122 CHAPTER 5 Entropy and the Second and Third Laws of Thermodynamics
By a graphical treatment, obtain the molar entropy of L-alanineat T = 300. K. You can perform the integration numericallyusing either a spreadsheet program or a curve-fitting routineand a graphing calculator (see Example Problem 5.9).
P5.32 Calculate and for the processesdescribed in parts (a) and (b) of Problem P5.16. Which of theprocesses is a spontaneous process? The state of the sur-roundings for each part is 298 K, 1.50 bar.
P5.33 A refrigerator is operated by a 0.25-hp (1 hp =746 watts) motor. If the interior is to be maintained at 4.50°Cand the room temperature on a hot day is 38°C, what is themaximum heat leak (in watts) that can be tolerated? Assumethat the coefficient of performance is 50% of the maximumtheoretical value. What happens if the leak is greater thanyour calculated maximum value?
P5.34 Using your results from Problems P5.18 and P5.7,calculate for each step in thecycle and for the total Carnot cycle described in Figure 5.2.
P5.35 Between 0°C and 100°C, the heat capacity of Hg(l) isgiven by
Calculate and if 2.25 moles of Hg(l) are raised intemperature from 0.00° to 88.0°C at constant P.
P5.36 Calculate for part (c) ofProblem P5.6. Is the process spontaneous? The state of thesurroundings is T = 310. K, P = 0.500 bar.
P5.37 Calculate the entropy of one mole of water vapor at175°C and 0.625 bar using the information in the data tables.
P5.38 The heat capacity of -quartz is given by
The coefficient of thermal expansion is given by = 0.3530 �10–4 K–1 and Vm = 22.6 cm3 mol–1. Calculate for thetransformation -quartz (15.0°C, 1 atm) (420. °C, 925 atm).
P5.39a. Calculate if 1.00 mol of liquid water is heated from
0.00° to 10.0°C under constant pressure and if CP,m =75.3 J K–1 mol–1.
b. The melting point of water at the pressure of interest is0.00°C and the enthalpy of fusion is 6.010 kJ mol–1. Theboiling point is 100.°C and the enthalpy of vaporization is40.65 kJ mol–1. Calculate for the transformationH2O(s, 0°C) H2O(g, 100.°C).:
¢S
¢S
: a-quartza
¢Sm
b
- 11.30 * 10-5 T2
K2
CP,m(a-quartz,s)
J K-1 mol-1 = 46.94 + 34.31 * 10-3T
K
a
¢Ssurroundings and ¢Stotal
¢S¢H
CP,m(Hg,l)
J K-1 mol-1 = 30.093 - 4.944 * 10-3T
K
¢S, ¢Ssurroundings, and ¢Stotal
¢Stotal¢Ssurroundings
≤H �f (kJ mol-1) CP,m(J K-1mol-1) S �
m(J K-1mol-1)Glucose –1273.1 219.2 209.2LacticAcid
–673.6 127.6 192.1
Glycine Glycylglycine Water
(kJ mol–1)¢H �f –537.2 –746.0 –285.8
S �m(J K-1mol-1) 103.5 190.0 70.0
T(K) 10. 20. 40. 60. 80. 100. 140. 180. 220. 260. 300.
(J K–1 mol–1)CP,m 0.49 3.85 17.45 30.99 42.59 52.50 68.93 83.14 96.14 109.6 122.7
Calculate, for the system, the surroundings, and the uni-verse at T = 325 K. Assume the heat capacities are constantbetween T = 298 K and T = 330. K.
P5.28 The amino acid glycine dimerizes to form the dipep-tide glycylglycine according to the reaction
Calculate , , and at T = 298 K. Usefulthermodynamic data follow:
¢Suniverse¢Ssurr¢S
2 Glycine(s) : Glycylglycine(s) + H2O(l)
¢S
P5.29 One mole of H2O(l) is supercooled to –3.75°C at1 bar pressure. The freezing temperature of water at thispressure is 0.00°C. The transformation is suddenly observed to occur. By calculating
, verify that this transformation isspontaneous at –3.75°C. The heat capacities are given byCP,m(H2O(l)) = 75.3 J K–1 mol–1 and CP,m(H2O(s)) = 37.7 J K–1
mol–1, and = 6.008 kJ mol–1 at 0.00°C. Assume thatthe surroundings are at –3.75°C. [Hint: Consider the twopathways at 1 bar: (a) H2O(l, –3.75°C) H2O(s, –3.75°C)and (b) H2O(l, –3.75°C) H2O(l, 0.00°C) H2O(s,0.00°C) H2O(s, –3.75°C). Because S is a state function,
must be the same for both pathways.]
P5.30 Calculate , , and per second for theair-conditioned room described in Problem 5.4. Assume that theinterior temperature is 65°F and the exterior temperature is 99°F.
P5.31 The following heat capacity data have been reportedfor L-alanine:
¢Suniverse¢Ssurr¢S
¢S:
:::
¢Hfusion
¢Ssurroundings, and ¢Stotal
¢S, H2O(l) : H2O(s)
05 Chapter 47503.qxd 11/28/11 4:23 PM Page 122
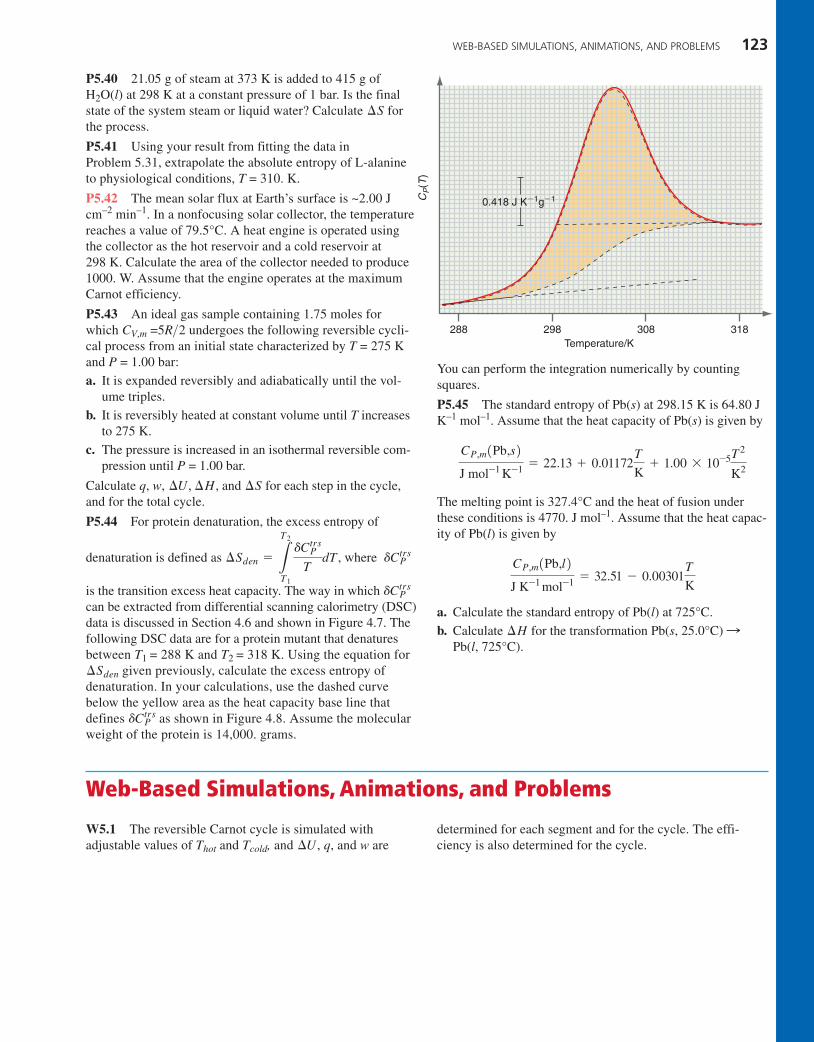
You can perform the integration numerically by countingsquares.
P5.45 The standard entropy of Pb(s) at 298.15 K is 64.80 JK–1 mol–1. Assume that the heat capacity of Pb(s) is given by
The melting point is 327.4°C and the heat of fusion underthese conditions is 4770. J mol–1. Assume that the heat capac-ity of Pb(l) is given by
a. Calculate the standard entropy of Pb(l) at 725°C.
b. Calculate for the transformation Pb(s, 25.0°C)Pb(l, 725°C).
:¢H
CP,m(Pb,l)
J K-1 mol-1 = 32.51 - 0.00301
T
K
CP,m(Pb,s)
J mol-1 K-1 = 22.13 + 0.01172
T
K+ 1.00 * 10-5T2
K2
WEB-BASED SIMULATIONS, ANIMATIONS, AND PROBLEMS 123
298288
0.418 J K�1g�1
308 318Temperature/K
CP(T
)
P5.40 21.05 g of steam at 373 K is added to 415 g ofH2O(l) at 298 K at a constant pressure of 1 bar. Is the finalstate of the system steam or liquid water? Calculate forthe process.
P5.41 Using your result from fitting the data inProblem 5.31, extrapolate the absolute entropy of L-alanineto physiological conditions, T = 310. K.
P5.42 The mean solar flux at Earth’s surface is ~2.00 Jcm–2 min–1. In a nonfocusing solar collector, the temperaturereaches a value of 79.5°C. A heat engine is operated usingthe collector as the hot reservoir and a cold reservoir at298 K. Calculate the area of the collector needed to produce1000. W. Assume that the engine operates at the maximumCarnot efficiency.
P5.43 An ideal gas sample containing 1.75 moles forwhich CV,m =5R 2 undergoes the following reversible cycli-cal process from an initial state characterized by T = 275 Kand P = 1.00 bar:
a. It is expanded reversibly and adiabatically until the vol-ume triples.
b. It is reversibly heated at constant volume until T increasesto 275 K.
c. The pressure is increased in an isothermal reversible com-pression until P = 1.00 bar.
Calculate q, w, for each step in the cycle,and for the total cycle.
P5.44 For protein denaturation, the excess entropy of
denaturation is defined as , where
is the transition excess heat capacity. The way in which can be extracted from differential scanning calorimetry (DSC)data is discussed in Section 4.6 and shown in Figure 4.7. Thefollowing DSC data are for a protein mutant that denaturesbetween T1 = 288 K and T2 = 318 K. Using the equation for
given previously, calculate the excess entropy ofdenaturation. In your calculations, use the dashed curvebelow the yellow area as the heat capacity base line thatdefines as shown in Figure 4.8. Assume the molecularweight of the protein is 14,000. grams.
dCtrsP
¢Sden
dCtrsP
dCtrsP¢Sden =
3
T2
T1
dCtrsP
TdT
¢U, ¢H, and ¢S
>
¢S
W5.1 The reversible Carnot cycle is simulated withadjustable values of Thot and Tcold, and , q, and w are¢U
determined for each segment and for the cycle. The effi-ciency is also determined for the cycle.
Web-Based Simulations, Animations, and Problems
05 Chapter 47503.qxd 11/28/11 4:23 PM Page 123

05 Chapter 47503.qxd 11/28/11 4:23 PM Page 124