· web viewthe four laws of thermodynamics define fundamental physical quantities...
TRANSCRIPT

Hospitals & Asylums
Weather Control Regulation HA-14-2-14
By Anthony J. [email protected]
Part I Climatic Conditions in the United States
Chapter 1 La Niña 2013-2014Chapter 2 Air Pollution Prevention and Control Act of 1970Chapter 3 Federal Water Pollution Control Act of 1972Chapter 4 Disaster Insurance
Part II Meteorology
Chapter 5 AtmosphereChapter 6 Winds and Air PressureChapter 7 Clouds and PrecipitationChapter 8 Meteorological Observation, Contrails and Cloud Seeding
Part III Oceanography
Chapter 9 OceansChapter 10 Plate TectonicsChapter 11 Oceanic Observation, Heat Pumps and Dead Zones
Charts
1-1 Satellite Image of Major Winter Storm Moving Eastward 1-2 US Temperature Regional Divisions December 2013 1-3 Low Temperature Forecast 21 January 20141-4 Fires in Los Angeles1-5 Drought Worsens, Map January 7 & 14, 20142-1 Gas Concentrations in the Atmosphere2-2 CO2 Concentration Projections3-1 Drivers of Climate Change3-2 The Four Laws of Thermodynamics3-3 Styrene Filled Car Combusts the Day Before Hurricane Katrina Landfall4-1 Annual Global Cost of Natural Disasters 1948-20034-2 Disaster Relief FY 1990 Though FY 2013 (millions of dollars)5-1 Layers of the Atmosphere5-2 Meteor Shower Calendar6-1 Santa Ana Winds6-2 Ocean Currents6-3 Semi-Permanent Pressure Systems: July
1

6-4 Pressure Systems in January6-5 Inter-Tropical Convergence Zone July and January6-6 Air Circulation Cells6-7 Pressure Departures El Niño/La Niña7-1 Cloud Types7-2 Orographic Effect: Rain Shadow7-3 Lightning Types Diagram7-4 Cold and Warm Fronts8-1 Global Temperatures May 5, 20139-1 Ocean Gyres9-2 Sargasso Sea9-3 Ocean Depth9-4 Wave Formation10-1 Layers of the Earth10-2 Earth's Lithospheric Plates10-3 California's San Andreas Fault10-4 Deep Ocean Trenches11-1 Marine Dead Zones11-2 Sea Surface Temperature11-3 Ocean Temperature Depth Profile11-4 Vertical Temperatures and Pressures in the North Atlantic at 47°N11-5 Vertical Temperature and Pressure Profile of the North Pacific11-6 Sea Surface Temperature Anomaly 13 February 2014
Part 1 Climatic Conditions in the United States
Chapter 1 La Niña 2013-2014
From 1940 to 1970 the earth cooled 0.18°F (0.1ºC) shielded from the sun by unregulated air pollution. A minor warming of a mere 0.34°F (0.19ºC) occurred between 1970 and 1998. The International Panel on Climate Change’s (IPCC) Third Assessment Report in 2001 stated the average global surface temperatures are projected to increase by anywhere between 1.4 and 5.8°C above pre-industrial levels over the period 1990 to 2100. However, average global temperatures have not warmed since 1998. As of 2007 temperature records indicates a warming since the mid-nineteenth century of slightly more than 1°F (0.7ºC) (Steward ’10: 17, 3) (Hamilton ’10: 60-61). While global warming may be hoax, weather control, in particular thermal pollution near coastal waters to intensity hurricanes and winter storms, has caused extensive damages, and in recent years the development and patenting of hydrocarbon fueled refrigeration has led to the extremely cold temperatures and winter weather on both sides of the Atlantic, Europe 2012-13 and North America 2013-14. According to the current NOAA Sea Surface Temperature Anomaly map the drought and high pressure system which has caused a drought emergency declaration in California seems to be caused by high levels of warming at around 47°N 100°W, out to sea off the southern coast of Alaska, which blows winds, including the Santa Ana's warmed in the mountains, towards a cooling along the California coast. The cooling on the California coast is theorized to have dissipated somewhat as the result of artificial warming of the waters off the coasts of Southern California and Baja Peninsula in response to the
2

declaration of drought emergency by California Governor Brown. This man-made warming has neutralized the drying Santa Anna winds and created a warm, humid northerly moving front that has been receptive to cloud seeding. The Gulf Stream seems to be getting artificially chilled as it moves up the continental shelf near the East Coast. Somewhat farther out to sea than the Gulf Stream, but still on the continental shelf, there is a strip of artificially warm water which causes moist winds to blow towards the cold belt which causes the powerful winter storms. The 105 mph hour winds on the western Coast of England are explained by the artificially cold waters of the Gulf Stream chilling the North Atlantic Current intensified by an artificial cooling off the coast of Wales, which is drawing winds from an artificial, or volcanic, warming off the eastern coast of Iceland at 65°N, 5°W, and prevented from blowing northward by even warmer water by Norway's Svalbard, Island northwest coast and north coast of Norway. Henceforth, any unpermitted placing of heating and cooling pumps, and resulting thermal pollution, is ruled pollution for the purposes of corporate liability and state responsibility under the Clean Water Act of 1972 and 1982 Law of the Sea. Cloud seeding is under-regulated by local weather modification boards and a system of mandatory public disclosure and national E.P.A. permission in response to natural disaster declarations is needed to better publish and regulate cloud seeding, and punish hostile cloud seeding. To prevent earthquakes, drilling, fracking and carbon capture storage technology, is not permitted on faults. As a rule of thumb, all legal weather control, and prosecutions of illegal weather control, shall be reported to the news media. To prevent earthquakes drilling, fracking and hydraulic dumping as used in carbon capture storage technology is not permitted. As a rule of thumb, all legal weather control shall be reported to the news media and all illicit weather control prohibited by law.
Satellite Image of Major Winter Storm Moving Eastward on December 6, 2013
Credit: NOAA NNVL During December 2013, numerous storm systems impacted the contiguous United States, bringing rain and heavy snowfall. According to NOAA's National Snow Analysis, at the beginning of December, 20.2 percent of the contiguous U.S. had snow on the ground — the high terrain of the Intermountain West, along the U.S.–Canadian border, interior regions of the Northeast, and the Central Appalachians. Monthly snow cover peaked on December 9th, when 66.9 percent of the Lower-48 had snow on the ground. By the end of December, 36.2 percent of the contiguous U.S. was snow covered — much of the Intermountain West, Northern Plains,
3

Midwest, interior regions of the Northeast, and northern New England. According to data form the Rutgers Global Snow Lab, the December snow cover extent for the contiguous U.S. was 1.5 million square miles, which was 317,000 square miles above the 1981-2010 average. This ranked as the eighth largest December snow cover extent on record, and the largest since December 2009. A large winter storm moved through the central United States between December 2–9. The storm dropped heavy snow across the Central Rockies, the Northern Plains and Rockies, and Upper Midwest and lighter snowfall was observed across the Southern Plains and Ohio Valley. Over 18 inches of snow was observed in parts of Colorado and Minnesota. Duluth, Minnesota received 23.3 inches of snow on December 2-4, which was the sixth highest 3-day snowfall accumulation for the city. The storm contributed to 39.9 inches of snow accumulating for the month in Duluth, marking the third highest December snowfall total behind December 1996 and 1950. Two Harbors, MN received 35.3 inches of snow. Nearly a foot of snow fell in southern Missouri, Illinois, and Indiana. Heavy ice accumulations were observed across parts of Texas, Oklahoma, and Arkansas. Fort Worth, TX received 1.5 inches of ice. At least 200,000 people in Texas lost power due to the ice event. By the time the storm ended, on December 9th, 66.9 percent of the contiguous U.S. had snow on the ground (NOAA '14).
A strong cold front dived southward from the Plains and Midwest on Monday January 20, 2104, to the East Coast and Southeast on Tuesday January 21, 2014. Bitter wind chills to 40 degrees below zero will impact the Upper Midwest. At the leading edge of the cold air, a winter storm is forecast to develop on Tuesday that will impact the Mid-Atlantic and Northeast Coast with snow and blowing snow. The Short Range Forecast Discussion of the National Weather Service Weather Prediction Center for Thu Jan 23 2014 predicted...Heavy snow for the Mid-Atlantic into Southern New England...Temperatures will be 10 to 25 degrees below average from the Mississippi Valley into the Northeast/Mid-Atlantic. A front moving off the Northeast/Mid-Atlantic Coast will develop a wave of low pressure over the Tennessee Valley that will intensify
4

rapidly moving off the North Carolina Coast by Tuesday afternoon/evening. The storm will continue to deepen Tuesday night into Wednesday morning moving just off the Mid-Atlantic Coast paralleling the Northeast Coast to just off Cape Cod by Wednesday morning. The system will produce light snow over parts of the Middle Mississippi Valley by Monday evening expanding into parts of the Ohio Valley by early Tuesday morning. As the storm moves into the Mid-Atlantic on Tuesday, moisture from the Atlantic will move inland aiding in the development of snow over the Mid-Atlantic to the Ohio Valley/Tennessee Valley. The system's dynamics will increase, producing an area of moderate to heavy snow over parts of the Mid-Atlantic by Tuesday evening, moving into Southern New England and Coastal Northern New England by Wednesday morning. In addition, rain will develop along parts of the Eastern Gulf Coast moving into the Southern tip of Florida by Tuesday evening, ending overnight Tuesday. Meanwhile, cold high pressure over the Northern Plains will move southward to the Central Gulf Coast by Wednesday. The associated cold air moving over the relatively warm waters of the Great Lakes will produce lake effect snow downwind from the Lakes through late Tuesday night. Another developing wave of low pressure over West-Central Canada, Tuesday morning, will move southeastward to the Upper Great Lakes by Wednesday morning. The system will produce snow over parts of the Northern Plains by Tuesday morning that will move into the Upper Great Lakes by Wednesday. Also on Wednesday morning, another area of cold high pressure over West-Central Canada will begin to move southward. A front over parts of the Northern High Plain/Northern Rockies will aid in focusing upslope flow to produce light snow over the area on Wednesday morning.
A wintry double whammy has descended on the Northeast on Tuesday, bringing as much as a foot of snow and another blast of arctic air. The storm began hammering the upper Midwest early Tuesday. Initially forecast to be a modest blurt of cold weather, the system is now packing a real punch. Blizzard conditions are expected along the heavily populated Interstate 95 corridor. Washington, D.C., is set to see about a half-foot of snow and wind gusts of 30 mph, while Boston could see around 8 inches and wind gusts up to 40 mph. A winter storm warning was in effect for New York City and the surrounding areas by the National Weather Service from noon
5

Tuesday through Wednesday morning, and Mayor Bill de Blasio said the city has activated all of its emergency preparation systems. The heaviest snow is expected in the later afternoon into the evening. Overnight lows could reach the single digits with the wind chill making it feel like 5 below. The storm has already led some school districts in Pennsylvania, New Jersey, Connecticut, Virginia, West Virginia and Kentucky to send students home early Tuesday or cancel classes ahead of time. It has also forced New Jersey Gov. Chris Christie to scrap a party Tuesday night on Ellis Island in celebration of his second inauguration. Federal workers in D.C. have been told to stay home. Coupled with the snow is another bone-chilling winter blast, but it’s not the same as the polar vortex that plunged temperatures to record lows two weeks ago. With the wind chill, the air will feel 10 degrees below zero or worse in some parts. When all is over, Southern Ohio is expected to get 3 to 5 inches, while the Central Appalachians — through West Virginia and western Maryland — could pick up 5 inches to a foot of snow. In anticipation of the storm, Ohio Gov. John Kasich followed the lead of officials in 17 other states — mostly in the Midwest and North — who declared energy emergencies and loosened rules for propane. In many of these states, residents are also being urged to cut down on propane use as supplies become limited. Air travel, meanwhile, turned tricky Tuesday as more than 600 flights were delayed and another 2,400 were canceled, according to FlightAware.com. An additional 450 flights for Wednesday have already been nixed. Chicago’s airports canceled about 180 flights Tuesday morning. While the eastern U.S. struggles with the snow, the West Coast will remain high and dry, Roth said. The ongoing drought in California has created ideal conditions for wildfires.
Gov. Jerry Brown declared a statewide drought emergency on Friday, January 17, 2014. The northern Sierra has a snowpack that's only 8% of normal for this date, according to the latest measurements released Thursday from the California Department of Water Resources. The central Sierra is at 16% of normal; the southern Sierra at 22%. Last year at this time, snowpack was normal or exceeded it. The mountain snowpack, while a boon for
Lake Tahoe ski resorts, also acts like a reservoir during winter and early spring, providing the state with its biggest and most reliable water supply. Brown's executive order directs state officials to offer extra help to farmers and California communities by allowing water managers to move water more quickly to rights-holders. And it qualifies agriculture interests for federal programs meant to help with unemployment and financial losses. Most of California's farmers rely on irrigation to grow hundreds of crops including broccoli, carrots, cauliflower, celery, melons, lettuce and tomatoes year-round that are shipped across the USA. Some growers have had to leave fields fallow as their water allocations have run dry, affecting crops and jobs. Across the state, agriculture is responsible for more than three-quarters of California's water use.
6

Drought conditions are wreaking havoc on farmers in California, especially in the San Joaquin Valley from south of Sacramento to Bakersfield. The situation is dire and requires the full attention of state and federal leaders, which is why the declaration is so important." The U.S. Department of Agriculture announced Wednesday that counties in 11 states qualify as primary natural disaster areas. The designation for some counties in Arkansas, California, Colorado, Hawaii, Idaho, Kansas, Nevada, New Mexico, Oklahoma, Texas and Utah means eligible farmers can qualify for low-interest emergency loans from the department. Brown also directed state agencies to use less water than they do now and to hire more firefighters for what already is a very dry winter. The state had six active wildfires Friday, including one that started as a campfire Thursday, destroyed five homes and threatened neighborhoods east of Los Angeles. State water experts have compared current conditions to the bleak 1976-77 drought season in California, one that Brown also oversaw during his first term in office. The governor fielded a question about the comparisons Friday and simply said it's a reminder that Californians need to look back at the conservation efforts of that era and how they use water in 2014 (Myers '14).
Brown was governor in 1976 and 1977, one of California's most severe dry periods in the 20th century. The most recent extended drought was from 1987 to 1992. The last governor to declare a drought emergency was Arnold Schwarzenegger, who did so during a period of low rainfall in 2008 and 2009. Brown lifted that declaration in 2011 after a wet winter. Gov. Jerry Brown again declared a drought emergency in California as the state struggles with the least amount of rainfall in its 153-year history, reservoir levels fall and firefighters remain on high alert. "We are in an unprecedented, very serious situation," said Brown, who asked California residents and businesses to voluntarily reduce their water consumption by 20 percent. "Hopefully, it will rain eventually. But in the meantime, we have to do our part." Brown's declaration also: Directs state agencies, led by the Department of Water Resources, to execute a statewide campaign to encourage and promote water conservation, with a goal of reducing water usage by 20 percent. Requires the Department of Forestry and Fire Protection to hire additional seasonal firefighters. Urges cities and water districts to update their water management and drought plans. Orders all state agencies to conserve water, including placing a moratorium on new, nonessential landscaping at public buildings and along highways. Requires state officials to speed approval for voluntary water sales and transfers between willing districts. Orders the Department of Water Resources to accelerate spending on water supply and conservation projects that can break ground this year. The drought outlook worsened, as the U.S. Drought Monitor, a weekly update of drought conditions by federal agencies and researchers at the University of Nebraska, classified large sections of Northern California, including the Bay Area, as the fourth most severe of five drought categories: "extreme drought." The update showed that 63 percent of California's land is at that level of drought now, including the Bay Area, up from 27 percent the week before. Worse, scientists at the National Weather Service's Climate Prediction Center in Maryland issued a 90-day precipitation outlook that said it is likely that California will continue to receive below-normal rainfall at least through April (Richman & Rogers '14).
These historic dry conditions—California is the driest it's been since record-keeping began in the 1890s—are an unfortunate consequence of a naturally occurring weather pattern that's gotten out of hand. Meteorologists say the drought is thanks largely to a dome of high pressure—or a region of sinking air in the atmosphere—that's been parked over the state for months, with no immediate end in sight. Storms that would normally soak a parched state—and build up
7

California's snowpack—are bouncing off the dome of high pressure, heading into southern Canada, then riding the jet stream south into the U.S. midwest. This is the wet time of year for the West Coast. "They should be harvesting the water and replenishing their reservoirs." Instead, the last time downtown Los Angeles saw an appreciable amount of rain was December 19. The city has received 23 percent of the precipitation it normally does between July 1 and December 31.The dome of high pressure is the latest in a series of high-pressure ridges that have prompted the drier-than-normal conditions plaguing California for the past two
years. High-pressure systems are not unusual for the West Coast. when a high-pressure dome wobbles to the west, low-pressure systems—regions where air is rising into the atmosphere—squeeze south down the Great Basin in Nevada. But that leads to additional high-pressure systems that bring ferocious winds called the Santa Anas. These dry, offshore winds really exacerbate the dry conditions."" The groundwater storage for southern California is still in pretty good shape. Officials build in a three-year buffer so that there is some protection against multiple dry years, but once reaching the third year, we run into problems." On the heels of California's driest calendar year on record, wildfires have charred almost 2,000 acres around the San Gabriel Mountains near Los Angeles, California (Lee '14).
Climatic factors such as temperature, rainfall, snowfall, cloudiness and winds have a significant impact on many aspects of the nation's economy as well as human health and quality of life. Ski resorts rely on cold temperatures and seasonal snow while families head for the beach on warm sunny days. Crop yields are higher when growing conditions are ideal. Housing and road construction progresses at a more rapid pace when temperatures are above minimum thresholds and conditions are dry. Energy usage is closely linked to seasonal temperatures so that demand for sources of energy such as natural gas, home heating oil and electricity increases during abnormally hot summers and extremely cold winters. The crop Moisture Stress Index reflects the influence of severe drought and catastrophic wetness on annual crop yield for corn and soybean crops, and the Residential Energy Demand Temperature Index provides quantitative information on the impact of seasonal temperatures on residential energy demand.
Record-breaking snowfall, cold temperatures, extended drought, high heat, severe flooding, violent tornadoes, and massive hurricanes have all combined to reach the greatest number of multi-billion dollar weather disasters in the nation’s history. While the danger from winter weather varies across the country, nearly all Americans, regardless of where they live, are likely to face some type of severe winter weather at some point in their lives. Winter storms can range from a moderate snow over a few hours to a blizzard with blinding, wind-driven snow that lasts for several days. Many winter storms are accompanied by dangerously low temperatures and sometimes by strong winds, icing, sleet and freezing rain. One of the primary concerns is the winter weather's ability to knock out heat, power and communications services to your home or office, sometimes for days at a time. Heavy snowfall and extreme cold can immobilize an entire region. The National Weather Service refers to winter storms as the “Deceptive Killers” because
8

most deaths are indirectly related to the storm. Instead, people die in traffic accidents on icy roads and of hypothermia from prolonged exposure to cold (Ucellini '13).
The climatic conditions of the US in the winter 2013-2014 were high pressure and drought over California and cold and snowy winter weather in the Eastern United States. The Santa Ana wind of southern California are a hot, dry, northeasterly that blows parchingly over the Los Angeles basin and is frequently linked to the wildfires that are a notorious risk for properties on the upwind flanks of that city (Reynolds '05: 63). This wind coincides with both a La Niña Southern Oscillation (SO) index with a high pressure zone over California and positive North Atlantic Oscillation (NAO). The El Niño/Southern Oscillation (ENSO) is a warming or cooling cycle of the waters across the central and eastern Pacific, leading to a drastic change in the orientation of the upper atmospheric storm track. Warming periods are noted as El Niño cycles, while cooling periods are known as La Niña cycles. During la Niña the central and eastern tropical Pacific waters tend to become much cooler than average. La Niña is also linked to generally cooler than average surface land temperatures across the tropics and subtropics in Asia. High pressure and temperature cause drought around the San Joaquin Valley in California. There is also evidence of increased tropical storm activity in the North Atlantic during la Niña and decreased activity during el Niño. Relatively wet weather occurs across large areas of Indonesia, Australia and southern Africa, while lower than average rainfall is observed over southern Brazil, Uruguay, northern Argentina and east Africa. The North Atlantic Oscillation (NAO) is a phenomenon that is essentially a "see-saw" in mass exchange between the North Atlantic's Azores High and Iceland Low during the winter season. A negative NAO index means much weaker than average flows across the Atlantic toward Europe, and cooler winters across much of that continent. A positive NAO index occurs when there is a large pressure difference between the Azores and Iceland; such a steep gradient is associate with stronger westerly flow into Europe and generally more vigorous starveling lows. It is linked to milder, wetter than average winters over much of Europe and also to cooler than average conditions across comparable eastern North American latitudes (Reynolds '05: 54, 27, 28).
Chapter 2 Air Pollution Prevention and Control Act of 1970
The world’s emissions of greenhouse gases from burning fossil fuels increased 2 percent per year in the 1970s and 80s under the Clean Air Act of 1970 42USC(85)(I)(A)§7401 et seq. At the 1992 Earth Summit in Rio de Janeiro, Brazil, it was agreed that by 2000, the emissions of carbon dioxide would be stabilized at 1990 levels to slow the rate of increase. To prevent further rises in atmospheric concentration, a global 60% cut would be required. By June 1993 a total of 166 nations had signed up to the "Framework Convention on Climate Change". The European Union as a whole must reduce emission by 8% averaged over the period from 2008 to 2012. The USA's reduction target was set at 7% for the same period. However, the Kyoto Protocol of December 1997 that laid down these principles will not come into force until at least 55 nations ratify it and the accumulated emissions from such nations must not reach less than 55% of the global total. By early July 2004, some 160 countries had ratified it but their emission totaled 44.2% of world output. The convention had not at that time been ratified, by, for example, Australia, Indonesia, the Russian Federation and the USA (Reynolds '05: 136). In the 1990s emission growth fell to 1 per cent under the UN Framework Convention on Climate Change (UNFCC) of June 3 to 14,
9

1992. Since 2000 the growth rate of the world’s CO2 emissions almost trebled to 3 per cent a year and President Bush. refused to sign Kyoto Protocol of 16 February 2005. Emission growth was slowed by the recession that arrived in late 2008, and in some countries reversed, growth in annual carbon emissions, but the volume of greenhouse gases in the atmosphere continues to rise. The Obama administration agrees rich country emission cuts of 25-40 per cent below 1990 levels by 2020, are necessary if the world is to aim for 450 ppm (Hamilton ’10: 4, 23, 25, 27).
Statistics compiled by the American Enterprise Institute reveal that in the 25 year period spanning 1980 to 2005: Fine particulate matter declined 40%. Ozone levels declined 20% and days per year exceeding the 8-hour ozone standard fell 79%. Nitrogen dioxide levels decreased 37%, sulfur dioxide dropped 63% and carbon monoxide concentrations were reduced by 74%. Lead levels were lowered by 96%. What makes these air quality improvements even more noteworthy is that they occurred during a period in which: Automobile miles driven each year nearly doubled to 93% and diesel truck miles more than doubled to 112%. Tons of coal burned for electricity production increased over 60%. The real dollar value of goods and services (gross domestic product) more than doubled to 114%. Despite more and more people and more cars on the road than ever, air pollution is no longer a growing issue in the United States (Sussman ’10: 179, 180, 168). In Massachusetts v. EPA No. 05-1220 the Supreme Court held, the Clean Air Act limited emissions from both stationary (industrial) sources and mobile (vehicle) sources. On December 7, 2009 Lisa Jackson EPA administrator announced, “the EPA has finalized its endangerment findings on greenhouse gas pollution, and is now authorized and obligated to take reasonable efforts to reduce greenhouse pollutants under the Clean Air Act (Sussman ’10: 78-79). Cap-and-trade limits the allowable amount of CO2 emissions oil refineries, natural gas producers, electric utility companies and other entities are allowed. The cap will decrease every year. Business will be assigned carbon permits by the EPA. Businesses able to maintain their emissions below the allotted permit cap will have surplus credits and thus will be able to trade those credits on the “carbon exchange”. Credits or “offsets” will also be awarded to major landowners who create or maintain carbon dioxide sinks by planting trees, not cutting down standing timber, or not plowing their fields. Those credits can also be trade on the exchange. Each year, the government will auction off new permits to carbon producers and re-award credits to the off-setters. With each transaction the feds will receive a transaction fee. According to the Congressional Budget Office by 2015, the federal government will be hauling in at least $104 billion a year from cap and trade (Sussman ’10: 203). The $1 trillion international development decade between 2000 and 2010 was achieved at the last minute only by the grace of carbon tax futures of the International Panel on Climate Change (IPCC) which was estimated to yield more than $100 billion for UN Official Development Assistance (ODA).
Economic collapse in the Soviet Union after the fall of the Berlin Wall in 1989 led to a decline in its greenhouse gas emissions of 5.2 per cent each year for a decade. During this period economic activity more than halved. When France embarked on an aggressive program of building nuclear capacity, a 40-fold increase in 25 years from the late 1970s, annual emissions form the electricity and heat sector fell by 6 per cent, but total fossil emissions declined by only 0.6 per cent annually. In the 1990s the dash for gas in Britain saw a large substitution of natural gas for coal in electricity generation. Total greenhouse gas emissions fell by 1 per cent each year in the decade. The Blair Government was keen to disprove the argument put by the governments of the United States and Australia that ratifying the Kyoto Protocol would be economically ruinous.
10

Depressingly reductions in emissions of more than 1 per cent over an extended period have historically been associated only with economic recession or upheaval. By 2005 China accounted for 18 per cent of the world’s greenhouse gas emissions; by 2030 it is expected to be responsible for 33 per cent. Over the last two centuries some 75 per cent of increased greenhouse gas emissions have been put into the atmosphere by rich countries; over the next century more than 90 per cent of the growth in global emissions is expected to occur in developing counties (Hamilton ’10: 20,51,5). Although China’s annual greenhouse gas emissions have recently surpassed those of the United States (each now accounts for nearly 20 percent of global emissions) it will be some decades before developing countries account for half of the increased concentrations of greenhouse gases in the atmosphere. While the profligate lifestyles of affluent nations must be the first target of emission-reduction policies, the gains of those policies will be more than offset over the next decades unless large developing nations, China, India, Brazil and a few others, begin soon to rein in their emissions. So it is worth considering the forces in play in those nations and particularly in China, whose 1.3 billion people comprise a fifth of the world’s population. The growth of China’s economy since the early 1980s has been extraordinary, averaging 9.5 per cent and accelerating to 11 per cent in 2006 before slowing to around 8 per cent in 2008. China’s fossil fuel emissions grew at 11-12 per cent each year in the first years of this century. Typically, growth rates like these slow considerably after two decades or so once the country makes the industrial transition. Even so China’s carbon dioxide emissions are expected to more than double by 2030 from a little over 5 billion metric tonnes in 2005 to just under 12 billion in 2030. Its greenhouse gas emissions are expected to account for one third of global emissions by that time (Hamilton ’10: 89).
Many of our ancestors of more than 10,000 years ago lived in harsh glacial conditions for 90 percent of the time. Going back farther in time, for nearly a million years, these 85,000 to 90,000 years of cold, windy weather persisted from all but a handful of briefer 10,000 to 15,000 years interglacial intervals of relative warmth and calm. Temperature norms in modern time can be found between the “Little Ice Age” and “Medieval Warm Period”. Commencing with the end of the Ice Age to approximately 900A.D. the earth stumbled out of its deep freeze. At the peak of the Medieval Warm Period, 900-1300 A.D. best estimates suggest the temperature rose to slightly more than 2°F (1.2ºC) warmer than today. The “Medieval Warm Period” of 1,000 years ago and the “Roman Warm Period” of 2,000 years ago saw humanity flourish and increase in population and well-being. The “Little Ice Age” lasted from about 1350 AD to about 1850 AD, with temperatures at one point about 2°F (1.2ºC) cooler than today. During this 500 year period there was plenty of disease, famine and death, accompanied by hangings or burnings of the “witches” who supposedly brought on these cold times. There was a 70 year long period (1645 to 1715 AD) the Mauder Minimum, that coincided with the coldest part of the Little Ice Age during which time sunspot activity decreased and the sun’s delivery of heat to Earth diminished about one half of one percent and Earth cooled. This Little Ice Age was nothing but a short interlude in the overall global warmth man has enjoyed for the last 10,000 years. Following the Little Ice Age, temperatures stabilized under mercantilism for approximately 50 years. At the height of the industrial revolution between 1850 and 1940 temperatures increased about 1°F (0.6ºC). From 1940 to 1970 the earth cooled 0.18°F (0.1ºC) shielded from the sun by unregulated air pollution. A minor warming of a mere 0.34°F (0.19ºC) occurred between 1970 and 1998. Average global temperatures have not warmed since 1998. As of 2007 temperature
11

records indicates a warming since the mid-nineteenth century of slightly more than 1°F (0.7ºC) (Steward ’10: 17, 3) (Hamilton ’10: 60-61).
IPAT equation says that the level of environmental impact depends on the population, the level of affluence (measured by GDP per person) and Technology. I = P x A x T. A country’s CO2 emissions depend on its population, its GDP per person and the technology that determines the amount of CO2 emitted per unit of GDP so CO2 = P x GDP/P x CO2/GDP. According to one study, over the 15 years to 1997 CO2 emissions in rich countries rose by around 20 per cent due to a 10 per cent increase in the number for people and a 40 percent increase in affluence, offset by a 30 per cent fall in carbon emissions per unit of economic output produced. In 2005 there were 6.6 billion humans (P) and their average level of income or affluence (A) was $5,900 per annum (very unequally distributed). The technology factor (T) is 0.76 tonnes of CO2 per thousand dollars of GDP. This gives rise to global annual CO2 emissions of just under 30 billion tonnes = 6.6 billion x 5.9 x 0.76 an average of around 4.5 tonnes person. Once the world recovers from the current recession, it is expected to average around 2.5 per cent over the next decades. At that rate, real global GDP will increase 2.9 times, from US$54.3 trillion in 2007 to US$157 trillion in 2050. If the world aimed to stabilize emissions at 450 ppm then the model indicates that global GDP in 2050 would be 5.5 per cent lower and would only reach US$150 trillion. Global population is expected to increase from 6.7 billion people in 2007 to 9.2 billion in 2050 (Hamilton ’10: 42, 44, 45, 51).
The “greenhouse effect” was first coined by scientists in the 1800s to describe the way crucial gases in our atmosphere absorb heat from the sun, thus maintaining an environment appropriate for human habitation. Water vapor accounts for 95% of all greenhouse gases. Water vapor is not mentioned by Department of Energy data. Following water vapor, the remaining 5% of the greenhouse gases are, in order, CO2, methane, nitrous oxide, ozone, and carbon monoxide. Methane is 21 times more potent than CO2 when it comes to the greenhouse effect and nitrous oxide is 310 times more capable of retaining the sun’s heat than CO2. Carbon dioxide is actually an insignificant contributor to the greenhouse effect. Humans exhale about 2.8 lbs of CO2 every day, which adds up to over a half-ton per person per year, multiplied by a 7 billion population. Human contribution of CO2 is our atmosphere is realized primarily through the burning of fossil fuels, but also through important processes like manufacturing cement and farming. Accounting for the individual concentrations and potencies of CO2 emissions created by human activity accounts for only 2.32% of the earth’s greenhouse effect. When water vapor is factored in the anthropogenic carbon dioxide footprint is reduced to a mere 0.116% of the greenhouse effect (Sussman ’10: 69-70).
There are a number of greenhouse gases, including carbon dioxide, methane, nitrous oxide and CFCs (their function as greenhouse gases is unconnected with their role in ozone depletion). The significant of these gases lies in their ability to absorb outgoing terrestrial long-wave radiation and re-radiate it in all directions, including back down to the surface. As the Sun's rays pass through the atmosphere on their way down to the Earth, some heat is absorbed, but much of the solar energy passes through and is absorbed by the Earth. This energy is reradiated by the Earth as long-wave (infrared, or heat) radiation, which cannot pass easily through the greenhouse gases in the atmosphere and is partially absorbed. Part of this absorbed heat is reradiated to space, but some is reradiated back down to Earth. The gases thus act rather like the glass in a greenhouse
12

and trap heat. Water vapor is also a powerful greenhouse gas, but at present its total global concentration is not changing significantly. If the surface warms as predicted, however, it would be expected to rise because of increased evaporation from the oceans. Industrialized society has been increasing the atmospheric concentration of these significant gases for the past century or more. Carbon dioxide levels in the atmosphere have increased in the last 200 years, from around 200 parts per million (ppm) to about 360 ppm in the late 1990s. This is attributed to the burning of fossil fuels. Additionally, the concentration f atmospheric methane has doubled during the last century, while nitrous oxide is increasing at about 0.25% a year. The increase is partly related to rice farming in paddy fields and to the by-product of cattle digestion. These three gases are increasing largely as a result of energy generation, transportation and agriculture. There has been an increase in these and other greenhouse gases, such as the halocarbons CFC-11 and HCFC-22. While an international ban has been imposed on such greenhouse gases, their residence time in the atmosphere has long-lasting consequences (Reynolds '05: 131, 132).
Gas Concentrations in the Atmosphere
Gas Concentration Gas Concentration Gas ConcentrationNitrogen 78.1% Oxygen 20.9% Water vapor 0.4% (1-4%
near earth’s surface
Argon 0.9% Carbon Dioxide
0.038% Neon 0.002%
Helium 0.0005% Methane 0.0002% Krypton 0.0001%Hydrogen 0.00005% Nitrous Oxide 0.00003% Ozone 0.000004%
Carbon Monoxide
trace
Source: Hamilton ’10: 66-67
Unlike other gases present in Earth’s atmosphere, such as nitrogen (78) percent and oxygen (21 percent), which trap almost none of the sun’s heat, the greenhouse gases trap non-visible, infrared heat that is radiated back into the atmosphere form Earth’s surface and thus helps warm the atmosphere. Without them Earth would be frozen, its global average temperature approximately minus 18 degrees Celsius or zero degrees Fahrenheit. We don’t however, want too much effect from the greenhouse gas content in the atmosphere, just as we don’t want too little of it. Mankind’s paradise for the 10,000 years has had just about the right amount of the combination of these gases to help keep the near-surface temperature at an average of 59 degrees Fahrenheit. Sources of greenhouse gases are 95% water vapor, approximately 4.7% ocean biologic activity, volcanoes decaying plants, animal activities, etc. and approximately 0.3% human activities, manufacturing, power generation, transportation, etc. Research indicates that the climate of Earth is not very sensitive to further increases in CO2 and doubling CO2 in the atmosphere from 300 to 600 ppm would probably be only about 0.4 of a degree Celsius. Without greenhouse gases Earth would be frozen solid (Steward ’10: 25, 27, 36, 97).
CO2 Concentration Projections
Level CO2 concentration in Corresponding CO2-e Eventual warming
13

the atmosphere (ppm) concentration (ppm) most likely associated with this concentration (°C)
Pre-industrial 280 0ºHansen target 350 445 2.0°CCurrent (2009) 387 455 2.2ºCEU target 380 450 2.0°CStern target 450 550 3.0ºCAnderson and Bowls optimistic scenario
530 650 4.0°C
Source: Hamilton ’10: pg. 228
Scientists are certain that increases in greenhouse gases such as carbon dioxide (CO2) in the atmosphere will lead to a significant rise in surface air temperature in the coming decades. This increase in gas concentration is almost certainly due to the large-scale industrial and agricultural activities of human society - for example factory emission and the clearing of large sections of the world's rain forests. Antarctic stratospheric ozone depletion - the so-called "hole" in the ozone layer - is another environmental problem caused by human activity. The discovery, some two decades ago, of the plunge in ozone concentrations during the southern-hemisphere spring, stimulated rapid and effective international action to ban the gases that scientists had shown to be the culprits. Industrial society has also managed to generate other types of important atmospheric problems. Like global warming and ozone depletion in the stratosphere, the fluidity of the atmosphere means that impacts can spread a long way from sources of, for example, industrial pollution. Acid rain is a case in point. Additionally, on a more local scale, low-level ozone creation can occasionally be a serious health concern (Reynolds '05: 130).
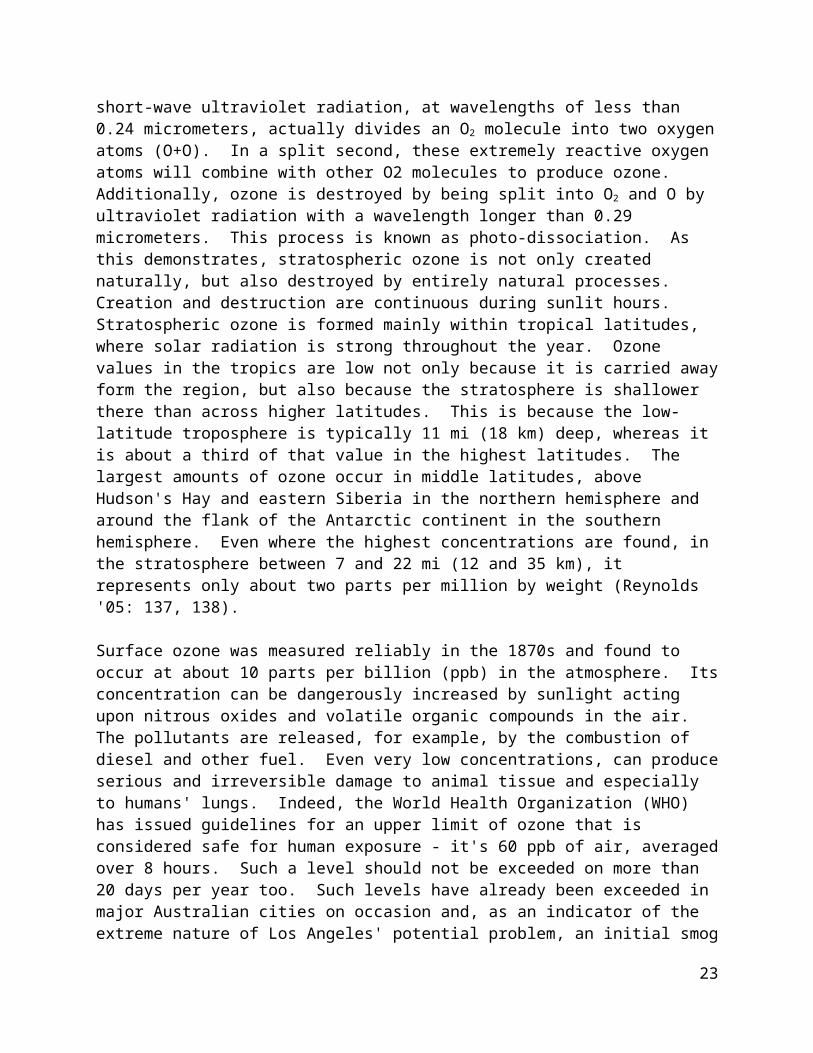
Oxygen is most frequently found in its diatomic form, O2, in the atmosphere, where it makes up slightly less than 21% by volume. It is the second most common gas in the atmosphere after nitrogen (N2) and is essential for the maintenance of life on our planet. Ozone, however, is the triatomic form of oxygen, O3, that is produced in the middle to lower atmosphere by the bonding of a single atom (O) and O2. Most of the solar radiation with wavelengths of up to 0.21 micrometers is absorbed above 30 mi (50 km) by nitrogen and oxygen. The absorption of the solar radiation warms the atmosphere within the ozone layer and also prevents this radiation which is harmful to life, from reaching the Earth's surface or the lower atmosphere. Absorption of incoming solar radiation in the range 0.21-0.31 micrometers is carried out principally by ozone within the stratosphere. Very short-wave ultraviolet radiation, at wavelengths of less than 0.24 micrometers, actually divides an O2 molecule into two oxygen atoms (O+O). In a split second, these extremely reactive oxygen atoms will combine with other O2 molecules to produce ozone. Additionally, ozone is destroyed by being split into O2 and O by ultraviolet radiation with a wavelength longer than 0.29 micrometers. This process is known as photo-dissociation. As this demonstrates, stratospheric ozone is not only created naturally, but also destroyed by entirely natural processes. Creation and destruction are continuous during sunlit hours. Stratospheric ozone is formed mainly within tropical latitudes, where solar radiation is strong throughout the year. Ozone values in the tropics are low not only because it is carried away form the region, but also because the stratosphere is shallower there than across higher latitudes. This
14

is because the low-latitude troposphere is typically 11 mi (18 km) deep, whereas it is about a third of that value in the highest latitudes. The largest amounts of ozone occur in middle latitudes, above Hudson's Hay and eastern Siberia in the northern hemisphere and around the flank of the Antarctic continent in the southern hemisphere. Even where the highest concentrations are found, in the stratosphere between 7 and 22 mi (12 and 35 km), it represents only about two parts per million by weight (Reynolds '05: 137, 138).
Surface ozone was measured reliably in the 1870s and found to occur at about 10 parts per billion (ppb) in the atmosphere. Its concentration can be dangerously increased by sunlight acting upon nitrous oxides and volatile organic compounds in the air. The pollutants are released, for example, by the combustion of diesel and other fuel. Even very low concentrations, can produce serious and irreversible damage to animal tissue and especially to humans' lungs. Indeed, the World Health Organization (WHO) has issued guidelines for an upper limit of ozone that is considered safe for human exposure - it's 60 ppb of air, averaged over 8 hours. Such a level should not be exceeded on more than 20 days per year too. Such levels have already been exceeded in major Australian cities on occasion and, as an indicator of the extreme nature of Los Angeles' potential problem, an initial smog alert is issued if the concentration exceeds 500 ppb, followed by second and third level alerts if 1,000 then 1,500 ppb are passed. Unhealthily high ozone concentrations can occur on hot, calm days in traffic-busy towns across middle latitudes. Problem gas doesn't stay put in urban areas and can drift, even on light winds, into rural regions (Reynolds '05: 145, 146).
Artificial compounds known as chlorofluorocarbons (CFCs) were developed in the 1920s from chlorine, fluorine and carbon. With an extremely stable molecular arrangement, they are nontoxic, noncorrosive, nonflammable and do not react with almost any other substances. These properties led to their use as coolants in refrigerators and air conditions, as trappers of heat in insulated cups and houses, as spray-can propellants, and as cleaners f delicate electronic components. By 1976 observations and computer simulations pointed to a serious depletion of stratospheric ozone due to the release of CFCs. The public called for governmental action, but it wasn't until 1979 that the United States stopped the sale of aerosol cans using CFCs as propellants. This led to a quick levelling off of CFC production because spray-cans were the largest consumers of these gases. The problem persisted however, because industry still used CFCs in other ways, and by 1985 production of CFCs was increasing at a rate of 3% annually. This significant change stimulated many governments to sign the Vienna Convention for the Protection of the Ozone Layer, which required the parties involved to formulate a plan for global action to curb CFCs. In May 1985 news spread that scientists had discovered a massive ozone depletion, a "hole" over parts of the Antarctic during the austral spring. Experiments confirmed that chlorine and bromine pollution had led to ozone depletion. The discovery of serious depletion over the Antarctic spurred governments into action. In September 1987, a meeting of environment ministers from 24 industrialized nations was convened in Montreal, Canada. They agreed to a plan of action to reduce CFCs so that the 1986 concentrations would be reduced by 20% by the end of 1994, and by 50% by the end of 1999. This binding agreement, embodies in the Montreal Protocol, represented a new step in intergovernmental collaboration on tackling environmental problems. It was also decided to reconvene in London, in 1990, to establish whether any modifications were needed. The dramatic springtime ozone depletion persisted, and not only for the austral pole. The June 1990 meeting in London declared a complete end t the
15

production of CFCs by 2000, of halons (except for absolutely essential use) by 2000, and of carbon tetrachloride by 2000 and methyl chloroform by 2005. A further meeting in Copenhagen, Denmark, in 1992 brought deadlines forward. Thus, all CFC, carbon tetrachloride and ethyl chloroform production was to cease by the end of 1995, and halon manufacture even earlier, by the end of 1993. Other harmful agents were to be phased out completely by the end of 2029. Although the Antarctic ozone hole shrank in the southern spring of 2001, it has recently attained its two largest ever extents in the austral springs of 2000 (12 mi2 [30 million km2]) and 2003 (10 million mi2 [26 million km2])(Reynolds '05: 142, 143, 144).
Deforestation currently accounts for 12-25 per cent of the world’s annual anthropogenic or human-induced CO2 emissions. Reducing deforestation will need to be a major focus of efforts to minimize the climate change. Optimistic assessment would see deforestation rates peak in 2015 and fall rapidly thereafter, to around half their current levels by 2040 and close to zero by 2060. If this happens then the total stock of carbon dioxide locked up in the world’s forests will fall from 1060 billion tonnes in the year 2000 to around 847 billion tonnes in 2100, a decline of 20 per cent. Over this century deforestation would add 213-319 billion tonnes of CO2 to the atmosphere. Only an estimated 3.207% of CO2 is produced by the activities of man. Since the end of the Little Ice Age (150 years ago) the amount of carbon dioxide has increased 35%, will within historical norms (Hamilton ’10: 17, 67, 70). Organically farmed soil stores carbon, a lot of carbon, in fact, if all the cultivated land in the world were farmed organically it would immediately reduce our climate crisis significantly. When we destroy the normal functioning of our soil and spew more carbon dioxide into the air than we can sequester, we are suffocating ourselves. Organic agricultural production requires 30 percent less fossil fuel than chemical production (Rodale ’10: 12, 93, 153).
Precipitation is naturally weakly acid. However, in modern times the acidity has been enhanced because of the injection into the atmosphere of artificially-produced sulfur dioxide and nitrous oxides. The former comes from coal-fired power stations and natural gas processing for example, while the latter is produced partly by vehicle emissions and industrial furnaces. Once these gases are emitted, they are transported on the wind and can ultimately combine with atmospheric water to produce weak sulfuric and nitric acid that falls out in the form of raindrops. It is therefore quite likely that the rain (or snow or fog) will fall or develop some hundreds or thousands of kilometers for the gaseous source. Acid rain has the worst impact if it falls on land where there is no natural way of neutralizing the acidity. The area of eastern Canada for example has a geology and soil type that means its lakes and vegetation suffer badly as a result of pollution that has come from "upstream" normally further west in Canada or form across the border with the USA. It has been estimated that about one half of the area's acid rain has origins in emission in the USA. The problem persists although the European Union has recently issued a directive to member states regarding the reductions in atmospheric pollutants that they must reach by 2010. These are sulfur dioxides, nitrous oxides, volatile organic compounds and ammonia. Each state has a set ceiling that it must not exceed by that year. This will not solve the problem of acid deposition across Europe, but is certainly a major step in the right direction (Reynolds '05: 146, 147).
Aircraft engines emit water vapor, carbon dioxide (CO2), small amounts of nitrogen oxides(NOx), hydrocarbons, carbon monoxide, sulfur gases, and soot and metal particles
16

formed by the high-temperature combustion of jet fuel during flight. Contrails, or condensation trails, are "streaks of condensed water vapor created in the air by an airplane or rocket at high altitudes." The term chemtrail is a portmanteau of the words "chemical" and "trail," just as contrail is a contraction of "condensation trail." These condensation trails are the result of normal emissions of water vapor from piston engines and jet engines at high altitudes in which the water vapor condenses into a visible cloud. Contrails are formed when hot humid air from the engines mixes with the colder surrounding air. The rate at which contrails dissipate is entirely dependent on weather conditions and altitude. If the atmosphere is near saturation, the contrail may exist for some time. Conversely, if the atmosphere is dry, the contrail will dissipate quickly. It is well established by atmospheric scientists that contrails can not only persist for hours, but it is a perfectly normal characteristic for them to spread out into cirrus sheets. Persistent contrails are of interest to scientists because they increase the cloudiness of the atmosphere (EPA '00).
Cloud seeding, a form of weather modification, is the attempt to change the amount or type of precipitation that falls from clouds, by dispersing substances into the air that serve as cloud condensation or ice nuclei, which alter the microphysical processes within the cloud. The most common chemicals used for cloud seeding include silver iodide and dry ice (frozen carbon dioxide). The expansion of liquid propane into a gas has also been used and can produce ice crystals at higher temperatures than silver iodide. The use of hygroscopic materials, such as salt, is increasing in popularity because of some promising research results. Seeding of clouds requires that they contain super-cooled liquid water—that is, liquid water colder than zero degrees Celsius. Introduction of a substance such as silver iodide, which has a crystalline structure similar to that of ice, will induce freezing nucleation. Dry ice or propane expansion cools the air to such an extent that ice crystals can nucleate spontaneously from the vapor phase. Seeding of warm-season or tropical cumulonimbus (convective) clouds seeks to exploit the latent heat released by freezing. This strategy of "dynamic" seeding assumes that the additional latent heat adds buoyancy, strengthens updrafts, ensures more low-level convergence, and ultimately causes rapid growth of properly selected clouds. Cloud seeding chemicals may be dispersed by aircraft (as in the second figure) or by dispersion devices located on the ground (generators, as in first figure, or canisters fired from anti-aircraft guns or rockets). For release by aircraft, silver iodide flares are ignited and dispersed as an aircraft flies through the inflow of a cloud. When released by devices on the ground, the fine particles are carried downwind and upwards by air currents after release (Sanders '10). Cloud seeding is under-regulated by local weather modification boards established under state statute and a system of mandatory public disclosure and national E.P.A. permission in response to natural disaster declarations is needed to better publish and regulate cloud seeding, and punish hostile cloud seeding.
Chapter 3 Federal Water Pollution Control Act of 1972
The Administrator of the Environmental Protection Agency (EPA) has primary federal responsibility for the Federal Water Pollution Act of 1972 33USC(26)(I)§1251 et seq. Three autonomous international organization were established by the United Nations Division on Ocean Affairs the Law of the Sea when the 1982 United Nations Convention on the Law of the Sea entered into force with the 1994 Agreement relating to the Implementation of Part XI. (1) The International Seabed Authority, which has its headquarters in Kingston, Jamaica, came into existence on 16 November 1994, upon the entry into force of the 1982 Convention. (2) The
17

Tribunal of the Law of the Sea came into existence following the entry into force of the Convention on 16 November 1994. After the election of the first judges on 1 August 1996, the Tribunal took up its work in Hamburg on 1 October 1996. The official inauguration of the Tribunal was held on 18 October 1996. (3) The Commission on the Limits of the Continental Shelf established a subsidiary body - the Standing Committee on provision of scientific and technical advice to coastal States, in June 1997, at its first session. In 1998, as part of the United Nation's International Year of the Ocean, the Department of Commerce and Department of the Navy cohosted the National Ocean Conference in Monterey, California. The participants found the United States should, join the 1982 U.N. Convention on the Law of the Sea and the accompanying 1994 Agreement to implement Part IX of the Convention on the Law of the Sea (incorrectly remembered by the U.S. as the Seabed Mining Agreement) to address issues such as military and commercial navigation, fishing, oil and gas development, offshore mining, and scientific research (Preger & Early '00: 282) which the United States President and appearing Senate have apparently not ratified as of 2014. The USA is party to the 1995 Agreement Relating to the Conservation and Management of Straddling Fish Stocks and Highly Migratory Fish Stocks. The significance of thermal pollution of the ocean on global warming has been neglected by the greenhouse gas obsessed Framework Convention much like oil exploration and dead zone producing fertilizer use have been neglected by the polymetallic nodule obsessed Law of the Sea. Nonetheless, in 1976 the nations of the world outlawed military manipulation of the weather by adopting the Convention on the Prohibition of Military or Any Other Hostile use of Environmental Modification Techniques (ENMOD) which has been ratified by the major powers, including China (Hamilton ’10: 187, 219).
Earth’s oceans are immense. Approximately 70 percent of the Earth’s surface is covered with water (Steward ’10: 37). They cover 71% of the planet and are incredibly deep. Whereas the average height of the earth’s land is 2,755 feet, the average depth of the world’s oceans is 12,450 feet. Two of the most important characteristics of ocean water are its temperature and salinity. Together they help govern the density of seawater, which is major factor controlling the ocean’s circulation, both horizontally and vertically. The continual, unstoppable circulation of water occurring below the ocean surface is known as thermohaline circulation (THC). In the case of the Atlantic and Gulf Stream currents, warm, salty water from tropical latitudes is transported northward, where the naturally colder weather extracts heat from the surface water, thereby allowing it to cool, increase in density and sink. That water then flows back toward the equator. Similar mechanisms take place across the globe. Occasionally perturbations in the various currents create alterations that impact weather patterns. One such shift is the periodic El Nino current, which is notorious for causing horrendous flooding on the West Coast. Likewise, its counterpart, La Nina, can cause cold temperature delays in the farming season in the Northern Plains and create conditions that can whip up a 100 year flood in the Missouri and Mississippi Valleys. In addition a variance known as the Pacific Decadal Oscillation can raise the temperature in the Arctic, melting summer ice. According to the IPCCs Fourth Assessment produced in 2007, over the past 20,000 years sea level has increased nearly 400 feet. Over the past century the average sea level rose a mere 1.8 millimeters per year (Sussman ’10: 107).
2013 was the 37th consecutive year of above average global temperatures. Using official data provided by the National Climatic Data Center (NCDC), combined land and ocean temperatures for the earth in 2013 averaged 0.62°C (1.11°F) above the long-term mean, making 2013 the
18

fourth warmest year ever recorded since official data on global temperatures began being kept back in 1880. The year 2010 remains the warmest on record, when the combined land/ocean global temperature was nearly 0.66°C (1.19°F) above NCDC’s 20th century average (1901-2000). The last below-average year for the globe occurred in 1976, when global temperatures registered 0.08°C (0.14°F) under the long-term average (Aon Benfield '14: 12). The models of the Intergovernmental Panel on Climate Change (PICC) have predicted a continuous rise in Earth’s temperature as CO2 levels increase, while, in fact, global temperatures have been falling since 2001 (Steward ’10: Xxii). Thermal and polar vessel de-icer pollution must be recognized as forms of pollution for the purposes of the Federal Water Pollution Control Act of 1972 and 1982 Law of the Sea. In the last 35 years of the twentieth century the Arctic Ocean ice thinned by 40 percent. In 2000, the polar ice at the top of the world melted for the first time in human memory. Many scientists believe there had not been so much open water in the polar region in 50 million years. Other scientists predicted that summer ice in the Arctic Ocean could disappear entirely by 2035. In 2000 it was announced that of the 25 hottest years that had occurred since Earth temperature record keeping began in 1866, 23 of them had occurred after 1975 (Robbins ’01: 263).
Art. 1 (4) of the United Nations Convention on the Law of the Sea of 1982 provides "pollution of the marine environment" means the introduction by man, directly or indirectly, of substances or energy into the marine environment, including estuaries, which results or is likely to result in such deleterious effects as harm to living resources and marine life, hazards to human health, hindrance to marine activities, including fishing and other legitimate uses of the sea, impairment of quality for use of sea water and reduction of amenities. The USA was brought to task on greenhouse gas emissions by the Earth Summit in Rio in 1992, but when the Law of the Sea came up again for ratification, in 1994, the USA did not immediately join, and when it did sign in 1995 the Agreement Relating to the Conservation and Management of Straddling Fish Stocks and Highly Migratory Fish Stocks, did so under the duress of an extremely expensive hurricane season. There is grave concern that since this time, circa 1995, there has been a sporadic, hostile program of marine thermal environmental modification, against the United States, to cause drought in Southern California, intensify Hurricanes in the Atlantic and Gulf of Mexico, melt the polar ice cap, and with the patenting of hydrocarbon fueled industrial heating and cooling pumps, cause bitterly cold winters on both sides of the Atlantic. It is not known whether this theoretical hostile oceanic warming are foreign enemies of the United States, are a self-inflicted injury by corrupt US oil industry executives and/or their Harvard lawyers (who have lost government jobs due to an undisguisable association with styrene hydrocarbon induced global warming and fracking induced earthquake and tsunami)? Whether or not the USA harbors any rebellion against the polymetallic mining obsession of the United Nations Convention on the Law of the Sea of 1982 the President and Senate should ratify the Convention to better control thermal dumping in the currents affecting the Atlantic and Pacific Coasts of the United States Art (5) of the Convention provides (a) "dumping" means: (i) any deliberate disposal of wastes or other matter from vessels, aircraft, platforms or other man-made structures at sea; (ii) any deliberate disposal of vessels, aircraft, platforms or other man-made structures at sea; (b) "dumping" does not include: (i) the disposal of wastes or other matter incidental to, or derived from the normal operations of vessels, aircraft, platforms or other man-made structures at sea and their equipment, other than wastes or other matter transported by or to vessels, aircraft, platforms or other man-made structures at sea, operating for the purpose of disposal of such matter or derived
19

from the treatment of such wastes or other matter on such vessels, aircraft, platforms or structures; (ii) placement of matter for a purpose other than the mere disposal thereof, provided that such placement is not contrary to the aims of this Convention. There are thus five environmental issues pertaining to oceanic dumping: (1) aircraft contrails and cloud seeding without mandatory public disclosure, (2) the dead zones from fertilizers washed out to sea by rivers in high population areas, (3) unregulated polar vessel de-icer use, (4) the hostile placement of heating and cooling pumps in the oceans to intensify natural weather patterns and (5) hydraulic fracturing "fracking" of faults is not permitted to prevent earthquakes.
As of 2008 there are now 405 identified dead zones worldwide, up from 49 in the 1960s. So-called dead zones are areas of large bodies of water—typically in the ocean but also occasionally in lakes and even rivers—that do not have enough oxygen to support marine life. The cause of such “hypoxic” (lacking oxygen) conditions is usually eutrophication, an increase in chemical nutrients in the water, leading to excessive blooms of algae that deplete underwater oxygen levels. Nitrogen and phosphorous from agricultural runoff are the primary culprits, but sewage, vehicular and industrial emissions and even natural factors also play a role in the development of dead zones. Dead zones occur around the world, but primarily near areas where heavy agricultural and industrial activity spill nutrients into the water and compromise its quality accordingly. Some dead zones do occur naturally, but the prevalence of them since the 1970s—when dead zones were detected in Chesapeake Bay off Maryland as well as in Scandinavia’s Kattegat Strait, the mouth of the Baltic Sea, the Black Sea and the northern Adriatic—hints at
20

mankind’s impact. A 2008 study found more than 400 dead zones worldwide, including in South America, China, Japan, southeast Australia and elsewhere. Perhaps the most infamous U.S. dead zone is an 8,500 square mile swath (about the size of New Jersey) of the Gulf of Mexico, not far from where the nutrient-laden Mississippi River, which drains farms up and down the Midwest, lets out. Besides decimating the region’s once teeming shrimp industry, low oxygen levels in the water there have led to reproductive problems for fish, leading to lack of spawning and low egg counts. Other notable U.S. dead zones today occur off the coasts of Oregon and Virginia. Fortunately, dead zones are reversible if their causes are reduced or eliminated. For example, a huge dead zone in the Black Sea largely disappeared in the 1990s following the fall of the Soviet Union, after which there was a huge spike in the cost of chemical fertilizers throughout the region. And while this situation was largely unintentional, the lessons learned have not been lost on scientists, policymakers and the United Nations, which has been pushing to reduce industrial emissions in other areas around the globe where dead zones are a problem. To wit, efforts by countries along the Rhine River to reduce sewage and industrial emissions have reduced nitrogen levels in the North Sea’s dead zone by upwards of 35 percent (Sheer & Moss '12).
Under Art. 145 of the United Nations Convention on the Law of the Sea of 1982 Necessary measures shall be taken to ensure effective protection for the marine environment. To this end the Authority shall adopt appropriate rules, regulations and procedures for inter alia: (a) the prevention, reduction and control of pollution and other hazards to the marine environment, including the coastline, and of interference with the ecological balance of the marine environment, particular attention being paid to the need for protection from harmful effects of such activities as drilling, dredging, excavation, disposal of waste, construction and operation or maintenance of installations, pipelines and other devices related to such activities; (b) the protection and conservation of the natural resources of the Area and the prevention of damage to the flora and fauna of the marine environment. Art. 207(1) States shall adopt laws and regulations to prevent, reduce and control pollution of the marine environment from land-based sources, including rivers, estuaries, pipelines and outfall structures, taking into account internationally agreed rules, standards and recommended practices and procedures. Art. 208(1) Coastal States shall adopt laws and regulations to prevent, reduce and control pollution of the marine environment arising from or in connection with seabed activities.
Drivers of Climate Change
Drive Principal Influence Impact CommentsSun’s heat and magnetic variation
Amount of sun’s heat and solar shielding variations over time
Strongest Amount retained modified by other drivers
Orbital eccentricity Determines distance from the sun at any given time
Strong Distance variations mean heat variation
Earth’s tilt Determines Earth’s seasons and heat received at high latitudes
Strong Additional tilt can affect polar ice melting
Earth’s wobble Determines season Strong Can be a positive or
21

(precession) closest to or farthest from the sun
negative feedback
Green House Gas (GHG) water vapor
Strongest GHG, Affects cloudiness, albedo, vegetation and precipitation volumes
Strongest of GHGs Net effect the least understood (predictable ) of the GHGs
GHG methane CH 4 Captures infrared heat radiated form Earth’s surface, reradiates some heat
Moderate (low volume in atmosphere)
Generated in wetlands, by industries and some animals
Ocean currents Distributes heat around Earth. Can change patterns quickly or very slowly
Very strong Largest reservoir of surface heat. Affects precipitation
Plate tectonics (seafloor spreading)
Causes volcanism, CO2 and sulfate particle input, subduction and mountain building
Strong long-term Affects ocean currents, sea levels, and CO2 volume
Location of continents Affects major ocean currents and heat and moisture to poles
Strong to weak Land over poles promotes more glaciation
Elevation of land masses
High elevations increase chemical weathering (CO2
removal and carbon sequestration
Moderate long term Little short-term effect on climate
Chemical weathering Affects CO2 removal and carbon sequestration
Moderate long-term Little short-term effect on climate
Volcanism Constant source of CO2 sulphate particles, and short-term soot
Moderate to strong short-term
Provides great lava and ash layers for age dating
Extraterrestrial impacts
Immediate fires, then cold for 1 to 5 years
Strong very short-term
Can create ocean and atmospheric toxicity
Albedo Determines how much solar heat is reflected or retained
Moderate to strong Affected by many drivers constantly changing
Fauna & Flora (animal life and vegetation)
Affects albedo and oxygen, CO2 and methane content of atmosphere
Moderate Abundance of type of flora track temperature CO2 and moisture changes
Atmospheric circulation
Distributes heat and moisture and affects upper ocean current
Moderate Distributes nutrients to oceans, affecting sea life abundance
22
patterns and carbon sequestration
Cosmic rays Suggested they create particulates that seed low level clouds (cooling)
To be determined More research needed to verify impact magnitude
Source: Steward ’10: Fig. 7 pg. 14
The four laws of thermodynamics define fundamental physical quantities (temperature, energy, and entropy) that characterize thermodynamic systems. The laws describe how these quantities behave under various circumstances, and forbid certain phenomena (such as perpetual motion).
The four laws of thermodynamics
Zeroth, If two thermodynamic systems are in thermal equilibrium with a third, they are also in thermal equilibrium with each other.
First (Conservation) states that energy is always conserved, it cannot be created or destroyed.
Second (Entropy) in all energy exchanges, if no energy enters or leaves the system, the potential energy of the state will always be less than that of the initial state.
Third (Absolute Zero) if all the thermal motion of molecules (kinetic energy) could be removed, a state called absolute zero would occur. Absolute zero results in a temperature of 0 Kelvins or -273.15° Celsius
Aside from the established four basic laws of thermodynamics described above, there is also the combined law of thermodynamics. The combined law of thermodynamics is essentially the 1st and 2nd law subsumed into a single concise mathematical statement as shown below:
23

Here, E is energy, T is temperature, S is entropy, p is pressure, and V is volume.
Temperature is measured with thermometers that may be calibrated to a variety of temperature scales. In most of the world (except for the United States, Jamaica, and a few other countries), the degree Celsius scale is used for most temperature measuring purposes. The entire scientific world (the U.S. included) measures temperature using the Celsius scale and thermodynamic temperature using the Kelvin scale, which is just the Celsius scale shifted downwards so that 0 K= −273.15°C, or absolute zero. In addition to redistributing heat around the globe, oceans play an important role in moderating local temperatures. One important property of water is that it heats up more slowly and cools down more slowly than land. Water is most dense at 3.98 °C (39.16 °F) at standard atmospheric pressure. Thus as water cools below 3.98 °C it decreases in density and will rise. As the temperature climbs above 3.98 °C, water density also decreases and causes the water to rise, which is why lakes are warmer on the surface during the summer. The combination of these two effects means that the bottom of most deep bodies of water located well away from the equatorial regions is at a constant 3.98 °C. Zeroth law of thermodynamics: If two systems are in thermal equilibrium with a third system, they must be in thermal equilibrium with each other. This law helps define the notion of temperature.
The water molecule - two hydrogen atoms and one oxygen atom - has some truly amazing properties. It has a large, positively charged oxygen atom on one end, and two negatively charged hydrogen atoms on the other. These oppositely charged ends act like a magnet, the positive side attracting particles with a negative charge and the negative side attracting particles with a positive charge. Water dissolves more substances in greater quantities than any other liquid. When water molecules move about freely, they are water vapor - a gas. An increase in temperature will cause the water molecules in the gas to move around faster, causing it to expand and become less dense. In cooler temperatures, the molecules slow down and some form weak bonds between their hydrogen atoms, thus forming a liquid - water. The ocean can store great amounts of heat, because lots of energy must be added before the water molecules break their bonds and evaporate as water vapor. In really cold temperatures, all of the hydrogen atoms within the water molecules attach to each other in a six-sided ring and form a solid - ice. Because the angle between oxygen and hydrogen in the ice crystal is greater than in its liquid form, it is slightly more open and therefore less dense; this is why ice floats in water When seawater freezes, salt crystals cannot quite squeeze into the ice structure, so they are excluded and the salinity of the surrounding water increases. The attraction of hydrogen atoms in water also produces a high surface tension. The only liquid with a higher surface tension is mercury, well-illustrated by its ability as a liquid to form small beads and roll around. Probably the most important properties of seawater is its density. The density of seawater increases when either temperature is lowered or salt is added; conversely its density decreases when heated or fresh water is added. An increase in salinity will raise seawater's boiling point and lower its freezing point and vice versa. The oceans transport warm water on the surface and cold water below. Winds transport heat, create waves, and drive currents on the ocean's surface (Prager & Early '00: 76, 77, 78). First law of thermodynamics: Heat and work are forms of energy transfer. While energy is invariably conserved, the internal energy of a closed system changes as heat and work are transferred in or out of it. Equivalently, perpetual motion machines of the first kind are impossible.
24

Second law of thermodynamics: The entropy of any closed system not in thermal equilibrium almost always increases. Closed systems spontaneously evolve towards thermal equilibrium -- the state of maximum entropy of the system -- in a process known as "thermalization". Equivalently, perpetual motion machines of the second kind are impossible. The fact that ice floats is due to the sudden reversal at 4o C of the general trend of decreasing temperature = increasing density. This is due to the ice crystals forming; the average distance between the water molecules in ice is greater than it is between water molecules at 4o C. The farther the molecules are apart, the fewer will fit in any given volume - that means less density (are you starting to appreciate density yet?). Ice formation is discouraged by molecules that get in the way of the water molecules - salt (Na+, Cl-), ethylene glycol, etc. These molecules lower the freezing temperatures of water, and allow some organisms to exist below the "freezing point" (of pure water). Furthermore, the freezing of water releases large amounts of heat. This means that water is very temperature stable at the freezing point. Winter weather is moderated to a great extent by this factor. Winter temperatures will stay near 0o C until all the local water is frozen. By the same token, it takes a lot of energy to melt ice, and local temperatures will not warm up until the ice is melted. Boiling is the rapid evaporation of water. Unlike freezing, which does not occur until all the water is at 0o C; evaporation can occur at any temperature as long as the atmosphere is not already saturated with water. The ability of air to hold gaseous water is also correlated to temperature; the warmer the air, the more water it can hold. In the winter, a house takes outside air, which is cold, and warms it. This warmer air can hold more water, and since it is "short" of water, water will evaporate from moist areas in the house (plants, people, etc.) more quickly. Therefore, you have to water plants more often, and you are more likely to catch cold, since your respiratory linings can dry out and be unprotected from viruses. When warm air is cooled, it can no longer hold water and water comes out of the air. If the ground cools off, it will pick up H2O from the adjacent air (dew); as water vapor rises through the atmosphere it cools and the water condenses and falls to the ground (fog, clouds, rain). Moist air also holds more heat and "feels" warmer to us (although moist air and dry air at the same temperature are at the same temperature we perceive the moist air as "warmer").
The large number of molecules per unit of volume (density) of water means that the overall kinetic energy of all those molecules combined (heat) will also be large. In addition to the "extra" heat that must be added or extracted when changing the physical state of water from solid to liquid to gas (or gas to liquid to solid); it takes a lot of energy (heat) to change the overall kinetic energy of the densely packed water molecules. It is important to realize the difference between heat and temperature, temperature is a quality, heat is a quantity. Temperature measures how fast (how much kinetic energy) a group of molecules is moving; heat measures how many molecules have that energy. Water, being dense, has a lot of molecules, therefore, a lot of heat, at least compared to air. The specific formula for heat is:
H = m x t x sh
Where H = heat, m = mass (grams), t = temperature (degrees C), and sh = specific heat, a constant that varies from material to material (and also varies with temperature).
Heat is measured in calories, with a calorie being defined as the heat needed to raise one gram (one ml) of H2O at 15o C one degree C. Thus, substituting 1 for H, m, and t in the equation
25

above, we can see that the sh for water at 15o C is also equal to 1. The same amount of heat will have a different effect on other materials, or on water at different temperatures. The calorie mentioned above is different from the caloric values assigned to food; these are roughly 1,000 calories and are thus known as kilocalories or Calories. You should also be aware that the calorie does not exist in the SI; it is replaced by J kg-1 K-1, or the number of joules it takes to raise 1 kilogram one degree Kelvin (the SI system is the official system of science and is not the same as the metric system, although it is closer to the metric system than the English system is). Water has more heat than air not only because it is more dense, but also because it has a higher specific heat - that is, if you had a kilogram of air and a kilogram of water, it would still take more heat to warm the water one degree than the air. The high specific heat of water, coupled with the amount of heat absorbed or released in changing its physical state, combined with the vast quantities of water on the planet, means that water plays a major role in climate and weather. Water is the greatest sink and conveyor of solar energy reaching the earth. For instance, heat carried by the Gulf Stream from the warm tropics keeps England and parts of Europe much warmer than they would otherwise be given their latitude. Organisms living in oceans may only encounter a 2 - 3o C temperature change over their lifetimes. Organisms living in sizable (pond-size) bodies of water do not experience diurnal temperature changes (except at the surface and edges), and only a 30o C change seasonally, spread out over a period of weeks. Terrestrial organisms may experience a 30o C temperature change daily - especially in deserts where there is little water vapor in the air to block heat transfer. Third law of thermodynamics: The entropy of a system approaches a constant value as the temperature approaches zero. The entropy of a system at absolute zero is typically zero, and in all cases is determined only by the number of different ground states it has.
The specific heat is the actual quantity of heat energy required to raise 1 gram of a substance 1° C and it is typically measured in J/g degrees C. Water has a much higher heat capacity, and specific heat, than air, meaning it takes more energy to heat water than it does to heat air. Water has a specific heat of 4.186 J/g degrees C, versus air, which has a specific heat of 1.005 J/g degrees C. The heat capacity of water has tremendous effects on the climate of the surrounding area. Because the water buffers the air temperature, the range of air temperature near water bodies is often smaller than the air temperature range further from large bodies of water. On a greater scale, because the ocean occupies over 70% of the Earth’s surface, it buffers the atmospheric temperature, providing a livable climate. In addition to keeping the Earth’s atmospheric temperature in check, water’s high heat capacity has numerous practical applications for humans. Water is used to prevent engines from overheating in automobiles, boats and power plants. This is also why water is used in fire-fighting; it absorbs the heat of the material it comes in contact with, dissipates the heat as it changes from liquid to gas, and actually lowers the temperature of the fire (Petrone '13).
26
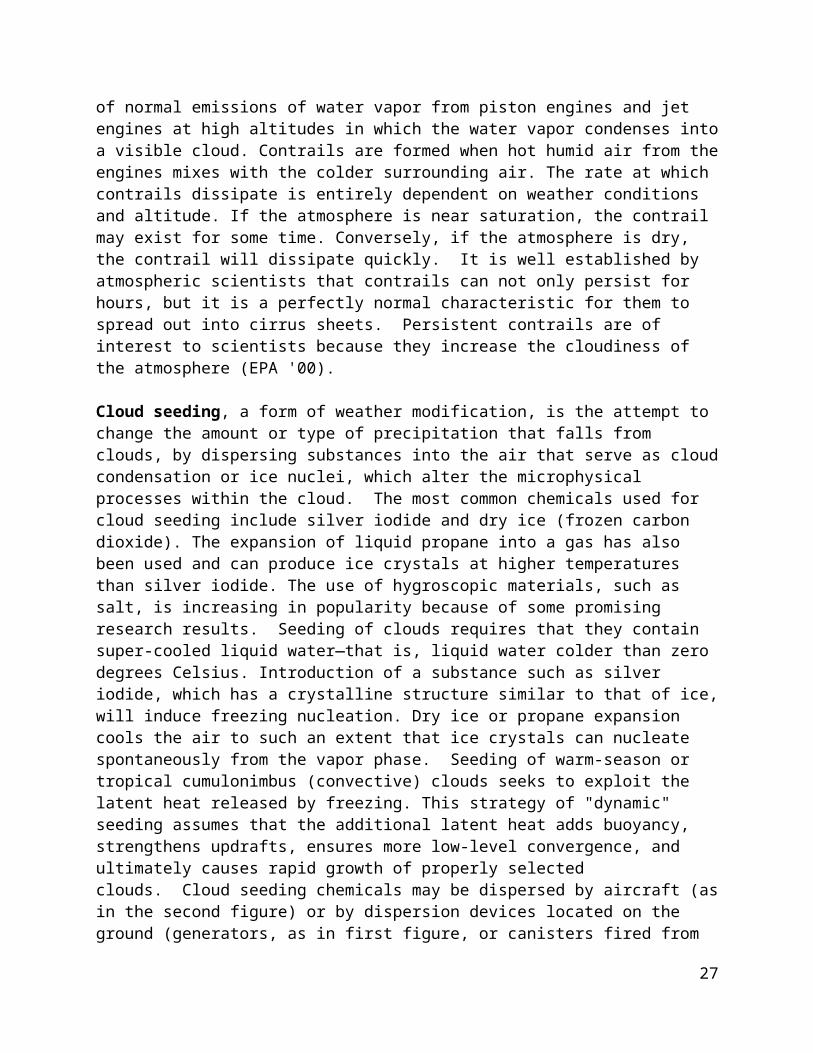
Styrene, also referred to as vinyl benzene or phenyl ethylene, is a hydrocarbon chemical used to manufacture Styrofoam, can release over 1,000°F of heat in a railcar container, and placed in a large body of water, is suspected as being used to intensify hurricanes and has the dual purpose of hydraulic fracturing, "fracking" which is known to have caused earthquakes and tsunami. Styrene is a clear, colorless liquid, derived from petroleum and natural gas by-products, that is a component of materials used to make thousands of everyday products. The diversified U.S. styrene industry is worth approximately $28-billion comprising hundreds of companies with thousands of facilities that provide directly some 128,000 well-paying jobs throughout the country. Polystyrene has long been known to cause serious negative impacts on workers producing it, mainly increased levels of chromosomal damage, abnormal pulmonary function and cancer in workers at polystyrene and styrene plants, as well as pass to food to result in 100% positive test results in human consumers and breast milk. In 1986, EPA ranked the 20 chemicals whose production generated the most hazardous wasted. Polystyrene was number five. In 1989, the Department of Interior banned polystyrene in its Washington, DC headquarters. The Canadian House of Commons switched from polystyrene cups to china cups in committee and caucus rooms, reducing the number of polystyrene cups used by 400,000 per year. GSA's Federal Supply Service's New Item Introductory Schedule Class #8135 offers a starch-based substitute for polystyrene packaging peanuts (Nader ’96). The Mayor of Cincinnati and the Styrene Information and Research Center (SIRC) joined together to extinguish a rail car full of styrene that reached temperatures exceeding 1,000 ºF for week after it was ignited the night of Hurricane Katrina, exposing a previously unknown threat to the environment. After a styrene gas leak near Lunken Airport, the city of Cincinnati filed a class action lawsuit against the rail line owner and the shipping company that sent the chemical (Aristatek '08).
Styrene Filled Railcar Combusts the Day Before Hurricane Katrina Landfall
27

On August 28, 2005, the day before Hurricane Katrina struck New Orleans on August 29, 2005, a parked railroad tanker car owned by Westlake Chemical Corp leaked styrene into the air; more than 800 people in Cincinnati's East End had to be evacuated for over two days and received a class action settlement for the cost of forced relocation. The venting occurred because of an increase in pressure inside the tank. Styrene has a boiling point of 145 degrees Celsius and exists as a liquid under standard conditions. The vapour pressure is small at 5 hPa = 5 mbar at standard conditions. The flash point is at 31 degrees Celsius and a mixture with air is ignitable within 1 to 9 Vol %. The increase in pressure was due to heat generated within the tank which was attributed to polymerization of the styrene monomer within the tank. Normally, a chemical inhibitor such as 15 parts per million of 4-tertiary-butyl-catechol (TBC) is added to the tank during transport to prevent polymerization, but this lasts only three months and the tanker was idle for 9 months. This inhibitor scavenges rust and other impurities within the tank that can act to initiate polymerization. Oxygen (about 10 ppm) is also required to be dissolved in the styrene monomer for the TBC to do its job. The TBC concentration decreases with time as it scavenges impurities; 15 ppm concentration would probably be mostly used up in possibly 3 months (even less time if ambient temperatures are warmer). Without the inhibitor, the styrene monomer can polymerize with oxygen to form a styrene-oxygen copolymer or benzaldehyde and/or formaldehyde and polymerize with the release of heat. The heat further accelerates the polymerization releasing more heat. While any hydrocarbon may been used to cause heating and cooling of bodies of water using modern heat pump technology, its dual use in fracking, drilling with expansive Styrofoam that further cracks the earth, styrene can cause earthquakes, and requires extra consideration in a national hazardous substance report on all hydrocarbons that could be diverted into oceanic heating and cooling under 42USC( 103)I§9605 . Other chemicals that can undergo self-polymerization releasing heat are: Hydrogen cyanide, UN1051, Vinyl acetate, UN1301, Furural or furfuraldehydes, UN1199, Propyleneimine, UN1921, and Ethyleneimine, UN1185, Ethylene oxide, UN1040, and Butadienes, UN1010 (Aristatek '08).
Heat pumps need a source of heat to transfer from, either the outside air, the ground, or a large body of water. Systems that transfer heat from the ground or water are called “geothermal heat pumps” and systems that transfer from the outside air are called “air-source heat pumps”. The vast majority of heat pumps installed today are air-source, as geothermal heat pumps require deep drilling, large land lots, or permitted access to a body of water. Hydrocarbon refrigerants include a number of products including R290 (propane), R600a (isobutane), R1150 (ethene/ethylene), R1270 (propene/propylene), R170 (ethane) and various blends of these products. Hydrocarbon refrigerants have a wide range of applications. This includes commercial refrigeration, chill cabinets and vending machines, cold storage and food processing, industrial refrigeration, transport refrigeration, small air conditioning systems, large air conditioning and chiller systems, heat pumps and water heaters. Hydrocarbon refrigerants have some different chemical properties than fluorocarbon refrigerants; the primary difference are their classification as extremely flammable. A.S. Trust & Holdings has been awarded a U.S. patent for the formula of a blend of pure hydrocarbons that has been designated R441A by the American Society of Heating, Refrigerating and Air-Conditioning Engineers (ASHRAE).R441A has been certified by independent testing laboratory Intertek (an) as having a very low Global Warming Potential (GWP) as well as a zero Ozone Depletion Potential (ODP). Illicitly placed in the ocean in large
28

quantities these industrial hydrocarbon fueled heating and cooling units do pose a serious threat to global warming. The new cooling function also presents an opportunity to prevent global warming and potentially dissipate hurricanes by cooling the water below 80°F, but is currently only suspected of hostile use off the Coast of California, Gulf of Mexico and Sargasso Sea in the middle of the North Atlantic.
Chapter 4 Disaster Insurance An event must meet at least one of the following criteria to be classified as a natural disaster: economic loss of $50 million insured loss of 25 million, 10 fatalities, 50 injured or 2,000 homes or structures damaged. Worldwide disasters during 2011 cost as much as $435 billion. In total, $107 billion of that cost was insured, according to the Annual Global Climate and Catastrophe Report for 2011, which was published by Impact Forecasting. Overall, the top-10 disasters around the world during the year comprised more than 80 percent of the total damage costs. Total insured losses were over two and a half times the losses from 2010 - which in turn were almost double the losses from 2009. In 2013, there were 296 separate natural disaster events that produced total economic losses of $192 billion – four percent below the 10-year average of $200 billion, but above the average 259 events. The natural disasters caused total insured losses of $45 billion – their lowest since 2009 and 22 percent below the 10-year average of $58 billion. In a reversal from 2012, the largest global events of 2013 were heavily concentrated in Europe and Asia, rather than in the United States. However, despite just 16 percent of all economic losses occurring in the U.S., the country accounted for 45 percent of all insured losses globally due to its greater insurance penetration. Flood events accounted for 35 percent of all global economic losses during the year, which marked their highest percentage of aggregate losses since 2010. Notable events included major flooding in Central Europe, Indonesia, the Philippines, China, and Australia. Meanwhile, severe drought conditions contributed to billion-dollar losses in Brazil, China, New Zealand, and the U.S. The number of human fatalities caused by natural disasters in 2013 was approximately 21,250; eight of the top ten events occurring in Asia. The other two events occurred in Africa. Although 2013 saw a notable uptick in natural disaster-related fatalities from those sustained in 2012, that number was 81% lower than the 2003-2012 average of 109,000. Although 2013 saw a notable uptick in natural disaster-related fatalities from those sustained in 2012, that number was 81% lower than the 2003-2012 average of 109,000. In the last ten years, major singular events (such as earthquakes in Haiti (2010), China (2008), and Indonesia (2004), Cyclone Nargis’ landfall in Myanmar (2008), and the major heatwave in Europe (2003) have skewed the annual average.
Annual Global Cost of Natural Disasters 1948-2003
29

The most deadly event of 2013 was Super Typhoon Haiyan, which struck the Philippines in November, leaving nearly 8,000 people dead or missing. The May/June floods in Central Europe were the costliest single event of the year, causing an estimated $5.3 billion insured loss and approximately $22 billion in economic losses. Most of the flood losses were sustained in Germany, which also endured record-level insured hail losses during multiple summer convective thunderstorm events. No hurricanes struck the U.S. during the year, as the country extended its record streak without a major (Category 3+) hurricane landfall to eight consecutive years. The previous record was set between September 1900 and October 1906. A total of 15 tropical cyclones (Category 1+) made landfall globally in 2013, slightly below the 1980-2012 average of 16. Thirteen of the landfalls were registered in the Northern Hemisphere, including nine in Asia. Europe, the Middle East and Africa (EMEA) and the Americas (Non-U.S.) each sustained aggregate insured losses above their 10-year averages in 2013. The United States and Asia-Pacific (APAC) regions both incurred below normal insured losses. The report also reveals that preliminary data indicates that 2013 was the fourth warmest year recorded since global land and ocean temperature records began in 1880 (AonBenfield '14).
Before 1950, state and local governments and non-governmental organizations – like the American Red Cross (ARC) and Salvation Army – were largely responsible for disaster relief assistance. Throughout the first half of the century, voluntary organizations, as well as the United States military, assisted in multiple disasters like the Galveston Hurricane and Storm Surge in 1900, San Francisco Earthquake in 1906, the Great Mississippi Flood of 1927, and the droughts of 1930-1931. Up until this point, Congress only funded relief efforts incident by incident. Congress believed that disaster relief was best left to charitable organizations. This inefficient and piecemeal approach to disaster assistance was partially remedied in 1950 when Congress passed the Federal Disaster Relief Program. This Program transferred power from Congress to the President to federally declare disasters. It also established the Federal government’s role as merely supplementing local and state efforts. The Federal Disaster Assistance Administration, established within the Department of Housing and Urban Development (HUD), provided major federal recovery and response in the 1960’s. The federal government was able to test this program in the Anchorage Alaska Earthquake in 1964. This disaster marks the beginning of serious federal involvement in disaster relief. In an executive order in 1979, President Carter created the Federal Emergency Management Agency (FEMA) which subsumed disaster-related responsibilities in the different federal agencies. FEMA absorbed agencies like the Federal Insurance Administration, the National Fire Prevention and Control Administration, the Federal Disaster Assistance Administration, etc.
The total budget authority appropriated for disaster relief the ten year period 2001-2011 was $130,756 billion. The low value was $1,852 in FY2003. The high value was $37,157 billion in FY2005 for Hurricane Katrina. The average funding provided for disaster relief over the 10 years 2001-2011 (excluding the highest and lowest years) is $11.5 billion for fiscal year 2011, and $11.3 billion for fiscal year 2012 (Lew '11). During FY 2011 and FY 2012, Lew and OMB Director and then Treasurer, seems to have been able to pay for the disaster relief using the Deepwater Horizon Overpayment (Sanders '11) On October 29, 2012, shortly after the beginning of FY2013, Hurricane Sandy made landfall in New Jersey. According to wire service reports a month afterwards, the storm killed at least 125 people in the United States and had $62 billion in damage attributed to it. In late November and early December 2012, official estimates
30

of the damage began to become public, and calls came from affected delegations for a supplemental appropriations package to provide assistance. Toward the end of November 2012, Senator Saxby Chambliss indicated that he expected disaster assistance to be offset,37 and House Majority Leader Eric Cantor indicated that disaster assistance should stay within the limits outlined by the BCA (Painter '12: 9). Ultimately the Disaster Relief Fund (DRF) administrated $8,444 million for Hurricane Sandy (Fugate '13:11).
Disaster Relief FY 1990 Though FY 2013 (millions of dollars)
Year Relief Year Relief
2002 $1,454 1990 $2,095
2003 $1,852 1991 $323
2004 $7,558 1992 $3,482
2005 $37,157 1993 $2,499
2006 $31,944 1994 $7,881
2007 $5,451 1995 $45,773
2008 $21,365 1996 $3,866
2009 $2,743 1997 $10,280
2010 $6,029 1998 $4,726
2011 $2,475 1999 $2,700
2012 $7,075 2000 $470
2013 $11,488 2001 $4,203
2002-2013 Budget Authority
$136,591 1990-2001 Budget Authority
$88,298
Low (FY 2003)
$1,852 Low (FY 1991)
$323
High (FY 2005)
$37,157 High (FY 1995)
$45,773
31

Average (dropping high/low) $
$9,750 $4,202
Lew '11: 3 There were no supplemental appropriations in FY 2011 or FY 2012. Painter '12: 14-17 Table A-1. Bills with Supplemental Appropriations and Rescissions 1990-2012 (low estimate)Hurricane Katrina struck the Gulf Coast on August 29, 2005. Ten days later, Congress had passed two laws that provided $60 billion in emergency funding to the DRF. Both measures were enacted one day after the requests were received.22 Preliminary cost estimates varied widely and lacked a basis in facts, which were still in short supply, as flood waters had yet to recede, preventing damage assessments and cost estimates from being made.23 After an initial spike in spending to meet emergency needs, as the recovery began to unfold, FEMA’s rate of spending slowed. One month after passage, roughly two-thirds of the funds Congress had provided for disaster relief in the wake of the storm had yet to be allocated to hurricane relief work.24 Congress began to reallocate the unspent dollars from the DRF to other disaster assistance programs, first to the Community Disaster Loan Program, and then more broadly. The Administration requested a $17.1 billion reallocation from the DRF to shore up non-FEMA disaster assistance programs in October 2005, but in December 2005 Congress approved a larger reallocation package included with the FY2006 Defense Appropriations Act that drew $23.4 billion from previously appropriated DRF monies and distributed them to several other agencies with storm-response needs (Painter '12: 7).
Hurricane Sandy struck the east coast of the United States on October 29, 2012. The storm made landfall in New Jersey and caused tens of billions of dollars in damage along the coast. As damage estimates became public in the weeks after the storm, calls for supplemental appropriations to help pay for recovery efforts were met with calls for offsets from some quarters. According to wire service reports a month afterwards, the storm killed at least 125 people in the United States and had $62 billion in damage attributed to it. In late November and early December 2012, official estimates of the damage began to become public, and calls came from affected delegations for a supplemental appropriations package to provide assistance. Toward the end of November 2012, Senator Saxby Chambliss indicated that he expected disaster assistance to be offset, and House Majority Leader Eric Cantor indicated that disaster assistance should stay within the limits outlined by the BCA (Painter '12: 9). Sandy struck the Mid-Atlantic and Northeast coasts with powerful winds, rain, and storm surges that caused unprecedented damages in some of the nation’s most populous areas. Sandy was unique in many ways. It merged with a weather system arriving from the west and transitioned into an extra-tropical cyclone creating a massive storm with impacts far and wide. The extent of its tropical-storm force winds were unusual, stretching from Maine to South Carolina. The storm, driven by wind gusts up to 60 mph, produced waves of up to 20 feet in the middle of the Great Lakes and dumped as much as 36 inches of snow in the central Appalachians. Across the Northeast, where the shoreline suffered devastating impacts, including flooding and beach erosion. During Sandy’s immediate aftermath, more than 23,000 people sought refuge in temporary shelters, and more than 8.5 million customers lost power. The storm flooded numerous roads and tunnels, blocked transportation corridors, and deposited extensive debris along the coastline (Ucellini '13). More than $1.4 billion in Individual Assistance has been provided to more than 182,000
32

survivors, and an additional $2.4 billion in low-interest disaster loans have been approved by the U.S. Small Business Administration. More than $7.9 billion in National Flood Insurance Program (NFIP) payments have been made to policy holders, and FEMA has approved more than $3.2 billion to fund emergency work, debris removal, and repair and replacement of infrastructure. Ultimately the Disaster Relief Fund (DRF) administrated $8,444 million for Hurricane Sandy (Fugate '13:11).
Sandy served as a reminder that tropical systems in the Atlantic are not just threats to the Southeast or Gulf Coast. Sandy Supplemental Appropriations Act provided NOAA with unprecedented opportunities to strengthen NWS. The Act provides $48 million in supplemental funding for Sandy recovery efforts and to improve response and recovery capability for future weather events. NOAA’s Weather-Ready Nation is about building community resilience in the face of increasing vulnerability to extreme weather and water events (Ucellini '13). Weather can be a serious natural hazard. Its impact may be short-lived - from the disastrous transit of a tornado, the devastating passage of severe gales lasting a day or so - or much more extensive, such as widespread flooding that may persist for weeks, or drought that may for a season or longer. The impact of hazardous weather can depend upon the economic health of the region or country affected Inevitably, developing areas with poor infrastructure are hit far harder by events like hurricanes and drought. Throughout the world, population and wealth tend to be concentrated in cities that are frequently in high-risk areas - by the coast. The predicted changes associated with global warming include the possibility that intense frontal storms in middle latitudes will become more frequent, while the inexorable rise in global sea levels will lead to increased flood risk in popular coastal areas (Reynolds '05: 148).
"Hurricane", "typhoon" and "cyclone" are some of the names used regionally to describe the same feature - tropical revolving storm that is typically 300-500 mi (500-800 km) across, which has a ten-minute averaged surface wind speed of 64 knots. A tropical storm has winds between 34 and 64 knots, and is given a name or a number depending on the ocean basin over which it originated. The term "hurricane" comes from the Spanish huracan and Portuguese huracao, which are also believed to originate from the Carib word urican, meaning "big wind". Similarly, typhoon is believed to originate from a Chinese dialect term tai feng, again meaning "big wind". These extremely hazardous weather systems occur most commonly across the low-latitude northwest Pacific and its "downstream" land areas, where just over a third of the global total of such storms develop. The northeast Pacific averages 17% of the world total, while the North Atlantic typically sees 12%. Of the remainder, around 12% affect Australia and surrounding areas (even North Island, New Zealand very occasionally) some 10% are found across the North Indian Ocean and about 7% occur over the South Indian and South Pacific Oceans. The busiest time for tropical cyclones in the northern hemisphere is between July and October, with a peak during August and September, partly because the sea surface temperatures are at their highest then. This feeds more water vapor into the weather systems through evaporation. Similarly, in the southern hemisphere, the peak season occurs when the sea is warmest, in January and February. Sea surface temperature must be warmer than about 81°F (27°C) down to a depth of some 200 ft (60 m).There are some more critical factors that have to be present before such storms can develop Firstly the atmosphere must be in a state that promotes the growth of convective cloud through the depth of the troposphere. Additionally, the layer of air between about 2 to 4 mi (3 to 6 km) up must be reasonably humid so that the growing clouds are not
33

eroded by dry air. The growing clouds that compose the initial disturbance can only "organize" in an environment where the wind speed does not change much with height - as in the case between the lower and upper troposphere. If there is a large difference in speed then the nascent disturbance is effectively "blown apart" and development of the storm is halted (Reynolds '05; 149, 150).
At the top of a hurricane, the air spirals out, in direct contrast to the inward swirling air in the lowest few miles (kilometers) of the troposphere. If the mass of air being thrown out in the highest reaches of a hurricane is greater than the rate at which it is being supplied in the lowest mile (kilometer) above the sea's surface, the surface pressure will fall and the winds will probably increase. The center of the hurricane storm system is known as the eye. It is typically 12-20 mi (20-30 km) across and experiences deeply subsiding air with generally cloud-free skies. Within the eye itself there is hardly any change of pressure across the surface. Very high winds occur where the horizontal pressure gradient is steep in the extreme, around the edge of the eye. Surrounding the eye is the eyewall cloud, which is like an upright cylinder and composed of extremely deep and vigorous cumulonimbus. It is across this zone that the worst winds and torrential rain occur. Extremely strong winds and heavy rain will also be encountered elsewhere within the circulation of a hurricane, especially in the spiral rainbands that are also composed of very deep cumulonimbus. Although tropical cyclones are quite large features, many of the terrible conditions they produce are related to extremely deep thunderstorms embedded in their spiral rainbands and eyewall cloud. The storm surge associated with a hurricane is caused by the sea's surface becoming domed beneath a low-pressure system. In contrast, the surface is "squashed" down by high pressure. This response of the sea's surface is called the inverse barometer effect, and for a 1 mbar change in air pressure, the sea level will rise or fall by roughly 0.4 in (1 cm). To compound the impact of the surge, the hurricane's direction of motion adds to its height, as does the force of the wind on its forward right quadrant. The same applies on the forward left quadrant of such systems in the southern hemisphere (Reynolds '05: 150-152).
Although the traditional definition of the strength of a hurricane is Beaufort Force 12 (air filled with foam, sea completely white with driving spray, visibility greatly reduced, nowadays the Saffir-Simpson scale is also used, especially along the East and Gulf Coasts of the United States. This scale, ranging 1 to 5, refers to the magnitude of the average wind speed, the storm surge plus the nature of likely damage. The damage associated with the rare Category 5 hurricanes is tremendously costly , in both economic and social terms. It is defined as follows: Most trees and signs blown down. Very severe and extensive roof, window and door damage. Complete failure of roof structures on most homes and many industrial buildings. Some large building suffer complete structural failure, while some smaller ones are overturned and may be blown away. Complete destruction of mobile homes. Surge creates major damage to lower floors of all structures less than 16 ft (5 m) above mean-sea-level and within ft (450 m) of the shore. Low-lying escape routes are cut by rising water three to five hours before the storm center arrives. Evacuation of residential areas situated n low ground within 5-10 mi (8-16 km) of the shore may be required. In the United States deaths due to hurricanes have declined in recent decades because of improved forecasting and better levels of preparation for disaster. The US National Weather Service regularly issues "watches" and "warnings" as a matter or routine, to alert the public to the risk of an impending serious weather hazard. A "hurricane watch" means that a specific region faces the threat of hurricane conditions within 24-36 hours. A "hurricane
34

warning" means severe weather has already been reported or is imminent, at which stage everyone in the vicinity should take the necessary precautions (Reynolds '05: 152, 153).
The word monsoon comes from the Arabic "mausam" meaning season. The essence of a monsoon climate is that, at the surface, there is a seasonal reversal of the wind direction and associated wet and dry seasons. The best known monsoon is that across southern Asia - India in particular is well known for its monsoon season. There is a less well-known monsoon across West Africa, and the term is used to define seasonal changes across the southwestern part of the USA. Across the Indian subcontinent, low-level winds usually blow for the southwest during the wet summer monsoon and from the northeast over the period of the dry winter monsoon. Over Indian and surrounding countries, the summer rains are essential for the national well-being. The same is true across West Africa. Above average rainfall is of course welcome in dry climates except that it can occasionally cause significant problems, particularly over southern Asia. Typhoons are also the most costly and the most deadly natural disaster to affect Japan, South Korea, Taiwan, the Philippines and other coastal areas of Southeast Asia. Across Southeast Asia, the mean annual cost of damage over the period 1990 to 2000 was US $3.2 billion and the average number of fatalities 700. Typhoons and weaker tropical cyclones that affect the Western Pacific Ocean are monitored and predicted by the Joint Typhoon Warning Service based in Guam. Europe never experiences true hurricanes. From time to time, mainly in the late summer and fall, a system that began as a hurricane brings strong winds and heavy rain to western Europe. By the time it reaches these shores, however, its tropical characteristics have died. Although winds may reach hurricane force on the Beaufort scale, they are produced by frontal depressions, not the systems that comprise of an eye and spiral rainbands that produce torrential rainfall (Reynolds '05: 156, 157, 153, 164).
Known as a seismic sea wave, or tsunami (not a tidal wave), from the Japanese term meaning "great harbor wave" these colossal waves bring to mind visions of sailors sharing the treetops with sharks and ocean liners stranded on mountain peaks. In 1883, on the island of Krakatoa in Indonesia, the eruption of a supposedly extinct volcano generated a series of great waves, one of which was 41 meters (133 feet) high and raced at 1130 kilometers per hour (700 mph) across the sea. The tsunamis swept over the coasts of Java and Sumatra, destroying 165 settlement and killing 36,000 people. New geologic evidence suggests that a massive tsunami struck the Pacific Northwest around 1700. The best protection against tsunamis and the potential disaster they harbor is to prepare and warn coastal communities of the risks and impending threats. Tsunamis can be caused by earthquakes, submarine landslides, asteroid impacts, or volcanic eruptions. Once triggered, they race across the ocean as a series of low, fast waves about 1 meter high, typically travelling at speed of 800 to 960 kph (500 to 600 mph). At sea, these mountains of water are benign beasts, virtually imperceptible to the human eye. A ship may sit completely unaware as a deadly tsunami passes beneath its hull. The danger lies in wait at the coast. Like any other wave approaching the shore, a tsunami entering shallow water begins to feel bottom, causing it to slow, "bunch up" and finally break in a mountainous cascade of water. Tsunamis are often preceded by a leading depression wave that causes a great lowering of sea level as water is sucked up into the growing wall of water. Tsunamis are triggered most commonly within the Pacific Ocean, where frequent earthquakes and volcanic activity occur. To prevent catastrophic disasters from tsunamis, scientists and emergency managers are working to establish an effective tsunami warning system throughout the Pacific Ocean. The warning system
35

currently consists of a series of seismometers on the seafloor and moored tide-gauge stations (Prager & Early '00: 105-108).
Severe convection refers to troposphere-deep cumulus cloud that produces dangerous weather like lightning, hail, extreme gustiness and the occasional tornado. In the USA, a severe thunderstorm is defined as one that produces winds on the ground of at least 58 mi/h (93 km/h) and hailstones that are at least 0.8 in (20 mm) in diameter. The largest hailstones are observed during late spring/early summer. Although surface heating is intense, this is also the season when overrunning cold air at upper levels can lead to deep overturning motions within the troposphere, expressed by deep convection; water vapor concentrations are also high due to enhanced evaporation caused by the high surface temperatures. These conditions reach their height across the North American high plains, stretching from Texas to Alberta. The number of hailstones reported in the USA peaks in May and June, although April and July are also busy months. Damage to property ensues when hail reaches some 0.8 in (20 mm) in diameter. An average May and June will each experience over 2,000 storms that produce hail with a diameter larger than 2 in (50 mm). In the USA, hail cause about $100 million worth of damage every year, to both property and crops. Many other parts of the world are affected by hailstorms, such as Australia, the wine producing area of Argentina and Uttar Pradesh in northeastern India (Reynolds '05: 158, 159).
Tornadoes are always linked to a parent cumulonimbus cloud. Although many people confuse them with hurricanes, they are actually very much smaller. The most frequently observed size of a tornado's damage path is about 50 m wide with a track of 103 mi (2-4 km). However the largest damage swathe can exceed 1 mi (2 km) in width, and the narrowest, 30 ft (10m) or so. Tornadoes are most notorious in North America, but, with the exception of Antarctica, can occur in all other continents. The US High Plains is the home of the notorious "tornado alley" that stretches north from Texas toward the northern Plains states. This is where the most damaging offenders are most likely to occur. A single tornado can last from a few seconds to over an hour. The typical duration is around five minutes. To be defined officially as a tornado, the vortex of rapidly spinning air must be in contact with the ground. The surface wind speeds are estimated form the nature of the damage produced - it is believed that they can reach up to 290 mi/h (460 km/h) in the most extreme cases. The way in which tornado intensity is conveyed to the public is by means of the Fujita (or F) scale. F0: up to 71 mi/h (115 km/h) light damage. F1 72-111 mi/h (116-179 km/h) moderate damage. F2 112-156 mi/h (180-251 km/h) considerable damage. F3 157-205 mi/h (252-330 km/h) severe damage. F4 206-258 mi/h (331-416 km/h) devastating damage. F5 over 259 mi/h (416 km/h) incredible damage. Currently forecasters in the USA can predict the risk of severe convection one day ahead, and based on this knowledge, they issue advice for areas that may encompass increased tornado risk (Reynolds '05: 162, 163).
Lightning occurs very widely - by definition it must occur whenever there's a thunderstorm. In general, lightning is more frequent in tropical areas or where surface heating is marked enough to produce tall convective cloud. There are flashes over the sea, but the vast majority are associated with deep convection over land. In general, the higher incidences of lightning flash are confined to the region east of the Rockies, where warm, humid air from the Gulf is an important ingredient in the formation of thunderstorms. In western USA, many fires, especially in forests, are started by lightning. Over a decade, over 15,000 such fires occurred across the USA. These
36

resulted in damage worth several hundred million dollars and the destruction of some two million acres of forest. In addition, on average lightning causes 93 deaths and 300 injuries a year in the USA. Drought conditions exacerbate the fire risk from lightning. Drought may result from atmospheric or oceanic anomalies that can be some distance from the suffering region. Recent work has indicated, for example, that higher than average sea surface temperature over parts of the Indian Ocean is probably related to the development of drought in the Sahel. Many regions of the world are susceptible to forest and bush fires. Particularly those that experience a significant dry season during the year when conditions are hot. The occurrence of an El Niño places tropical countries in the western Pacific region at a significantly higher risk than normal because of the enhanced, prolonged subsidence experienced there. Such subsidence is a characteristic of high pressure within which vast volumes of air sink gently toward the surface. During the period from 1990 to 2001, it is estimated that about 11% of all natural disasters in Australia were drought related (Reynolds '05: 160, 161, 166-169).
Flooding is the nation's most common natural disaster. The actual spot where the 2,541-mile Missouri River flows into the 2,320-mile Mississippi River is 10 miles to the north of St. Louis at Confluence Point State Park (Baker ’11). The Mississippi River flows 2,340 mi (3,765 km) from its source at Lake Itasca in the Minnesota North Woods. The Missouri is longer than the Mississippi, but it is the Mississippi’s tributary. The Missouri does not reach the sea; the Mississippi does, a little south of New Orleans. Rivers by definition have to drain into an ocean, or at least salty water. When the Mississippi River is mentioned in the record books, what statisticians really mean is the Missouri-Mississippi River, and their combined lengths from the beginning of the Missouri to the end of the Mississippi. The Missouri’s source generally is regarded as the Jefferson River, a 77-mile river that starts in Montana, so the third-longest river technically is the Jefferson-Missouri-Mississippi River. The Great Mississippi and Missouri Rivers Flood of 1993 (or "Great Flood of 1993") occurred in the American Midwest, along the Mississippi and Missouri rivers and their tributaries, from April to October 1993. The flood was among the most costly and devastating to ever occur in the United States, with $15 billion in damages, 50 people died, hundreds of levees failed, and thousands of people were evacuated, some for months. Approximately 100,000 homes were destroyed as a result of the flooding, 15 million acres (60,000 km²) of farmland inundated, and the whole towns of Valmeyer, Illinois, and Rhineland, Missouri, were relocated to higher ground. The hydrographic basin affected cover around 745 miles (1200 km) in length and 435 miles (700 km) in width, totaling about 320,000 square miles (840,000 km²). Within this zone, the flooded area totaled around 30,000 square miles (80,000 km²) and was the worst such U.S. disaster since the Great Flood of 1844, the Great Mississippi Flood of 1927, or Great Flood of 1951 as measured by duration, square miles inundated, persons displaced, crop and property damage, and number of record river levels. Since the previous great flood, extensive leveeing had been carried out to keep more residential and agricultural areas protected (Larson ’96).
Almost 14,000 oil spills are reported each year. Between 2005 and 2009 B.P. spilled an average
of between 2- 4.4 million barrels of oil a year. The Key Provisions of the Oil Pollution Act provides at Title 33 USC (40) §2702, that the responsible party for a vessel or facility from which oil is discharged, is liable for removal costs and damages, including damage to natural resources, to real or personal property, to subsistence use of natural resources, to revenues lost, profits and earning capacity, and the cost of public services used to redress the damage caused by
37

the oil spill. Under 33 USC (40) §2718 States may impose additional liability (including unlimited liability), funding mechanisms, requirements for removal actions, and fines and penalties for responsible parties. "Responsibility” refers to the primary obligation of states party, whereas the term “liability” refers to the secondary obligation, namely, the consequences of a breach of the primary obligation. “Responsibility to ensure” points to an obligation of the sponsoring State under international law. A violation of this obligation entails “liability”. However, not every violation of an obligation by a sponsored contractor automatically gives rise to the liability of the sponsoring State. Such liability is limited to the State’s failure to meet its obligation to “ensure” compliance by the sponsored contractor, a State may be held liable under customary international law even if no material damage results from its failure to meet its international obligations. The liability of sponsoring States arises from their failure to carry out their own responsibilities and is triggered by the damage caused by sponsored contractors. The responsible State is under an obligation to make full reparation for the injury caused by the internationally wrongful act. Liability in every case shall be for the actual amount of damage. If the contractor has paid the actual amount of damage, there is no room for reparation by the sponsoring State. Taking into account the extent to which such harmful effects may directly result from drilling, dredging, coring and excavation and from disposal, dumping and discharge into the marine environment of sediment, wastes or other effluents. Under the Deepwater Horizon Spill Response Solution HA-8-6-10, BP paid for all U.S. federal disaster assistance for 2011-2012, until Superstorm Sandy, while Great Britain went bankrupt. In awe of this oil spill settlement the International Tribunal of the Law of the Sea lamented their polymetallic nodule obsession in Responsibilities and obligations of States sponsoring persons and entities with respect to activities in the Area (Request for Advisory Opinion submitted to the Seabed Disputes Chamber) No. 17 1 February 2011, that neglected to make any money whatsoever, while the U.S. beggars their neighbor over an oil spill in the Gulf of Mexico, and oceanic dead zones and thermal pollution, go un-noticed.
Part II Meteorology
Chapter 5 Atmosphere
The gases that comprise the "dry" atmosphere occur in fixed proportions up to about 62 mi (100 km) above sea level. This well-mixed layer is known as the turbosphere, and within it the mixing is carried out by large-scale weather systems and much smaller-scale turbulence. This region is capped by the turbopause, above which lies the thermosphere. Here the atmosphere is characterized by layers composed of individual gases separated out according to their molecular weight. The heavier gases occur at the lower levels of the upper atmosphere. "Dry" air refers to the gaseous constituents of the Earth's atmosphere - with the exception of water vapor. This is not included because, unlike the gases that occur in fixed amounts, water vapor is highly variable in concentration. Water vapor resides at lower levels, mainly within the first few miles of the atmosphere, because it originates at the Earth's surface. In addition to its gaseous constituents, the air within the lower levels of the atmosphere (the troposphere) contains solid and liquid water in the form of ice, water droplets, clouds and precipitation. Very small particles, known as aerosol, also occur in the same layer; they comprise a suspension of solid and liquid particles with very low settling velocities and small diameters (Reynolds '05: 10).
38

Layers of the Atmosphere
Credit: Bing
The troposphere is the lowest layer of the atmosphere. This layer is characterized by temperatures that, on average, decreases with height, and by the presence of almost all the atmosphere's clouds and weather. Something like 80% of the mass of the atmosphere is contained in the troposphere, along with virtually all the clouds, water vapor and precipitation. The layer is generally well mixed by vertical circulations of the air. Ascent of an air particle from low level to the vicinity of the tropopause can occur in a few minutes in the most vigorous thundercloud updrafts, while in clear conditions the journey may take several days. This type of air motion is a hallmark of the troposphere, although it does not occur everywhere all of the time. Because the depth of the overturning motions is related to the intensity of surface heating, on average the layer is deepest in the tropics and becomes shallower toward the poles There is a seasonal variation outside the lowest latitudes such that the troposphere is deepest in summertime. When air ascends it cools at a rate that depends on whether it is "dry" (i.. without clouds) or "saturated" (cloudy). Conversely, air that descends will warm at the same rate as ascending air, depending on whether the sinking happens within clear skies or within a cloud.
39

Ascending air moves into steadily reducing pressure, which causes it first to expand and then consequently cool Descending air is compress as it subsides gradually into higher pressure and thus is warmed. So the up-and-down motions that typify the troposphere are associated with cooler air aloft and warmer air below. The average lapse rate of temperature - the rate at which it falls with height - is almost 3°F/1,000 ft (6°C/km). Air at 0 ft that is 59°F (15°C), is 57°F (14°C) at 300 ft (100 m), 55°F (13°C) at 700 ft (200 m) 54°F (12°C) at 1,000 ft (300 m) and 52°F (11°C) at 1,300 ft (400 m). If the bubble is cloudless, it will cool at a fixed rate, known as the dry adiabatic lapse rate (DALR) which is 5.5°F/1,000 ft (9.8°C/km). Conversely, when air sinks toward the surface, it will be compressed and warmed at this rate. If ascending air is damp enough to produce cloud droplets, latent heat will be released, which warms the air and offsets the DALR. This reduced rate of cooling is called the saturated adiabatic lapse rate (SALR), and it varies according to the quantity of water vapor contained in the air. It is the rate of temperature decrease that would be measured within a cloud (Reynolds '05: 12-14).
The stratosphere was discovered independently by two European scientists in 1902 who established that above about 5 mi (10 km) the air temperature either remains constant with height or actually increases. This layer extends from the tropopause up to 31 mi (50 km) above sea level ,where its maximum temperature is reached. As an annual average above middle latitudes, this is about 32°F(0°C). This layer is stratified, or layered, since it is a region within which temperature is constant or increases with height. It is colder below and warmer above, and tis suggests that the overturning motions in the stratosphere are reduced in contrast to those in the troposphere. Sometimes cumulonimbus clouds formed within the troposphere, in the tropics or over the interior of the USA in summer, for example, can overshoot into the lower reaches of the stratosphere. It is so stable and so dry in this region, however, that the upward-shooting cloud is soon evaporated by mixing with the ambient air. Increased temperature in the middle and upper stratosphere is caused by the absorption of the short-wave solar radiation by ozone, a form of oxygen molecule that has three atoms rather than the much more common two-atom form of the gas The existence of ozone at these levels is due to the splitting, or dissociation , of oxygen molecules into tow oxygen atoms by the action of that same short-wave radiation. This means that ozone is constantly being created and destroyed by natural processes in the stratosphere, mainly at a height of 12-19 mi (20-30 km). The complex chemical reactions that occur within the ozone layer mean that some 90% of the potentially harmful ultraviolet radiation that streams into the atmosphere in the solar beam is absorbed. Today, the artificial destruction of the ozone is of enormous concern internationally since such depletion will lead to increased risk of harmful ultraviolet radiation reaching the Earth's surface. In the polar stratosphere there is a marked seasonal change in the air temperature, which is caused mainly by the prolonged months of darkness during the polar night and the similarly extended period of light during the polar day (Reynolds '05: 14, 15).
The mesosphere or middle, region lies above the stratosphere and impinges on the lower ionosphere. It is characterized by temperature that decreases with increasing height, from something like 32°F(0°C) at its base to around -130°F(-90°C) at the mesopause, where the atmospheric pressure is about 1/100,000 of the sea-level value. The thermosphere is a deep layer that stretches from the mesopause to the outer limit of the Earth's atmosphere; it lies above the well mixed tubosphere (also known as the homosphere) and is sometimes termed the heterosphere. The thermosphere is characterized by increasing temperature with elevation, such
40

that at heights between 190 and 310 mi (300-500km), it reaches between 930°F(500°C) and 3,600°F(2,000°C). This temperature range is directly attributable to solar activity, the highest values associated with an active Sun It is within the thermosphere that the gases separate out according to their molecular weights (Reynolds '05: 15, 16). The exosphere is the farthest layer at heights from 400 to 40,000 mi (640, 64,000 km). The air dwindles to a few molecules floating in outer space but temperatures remain at thermosphere highs.
Meteoroids are the smallest particles orbiting the sun, and most are no larger than grains of sand. From years of studying the evolution of meteor streams, astronomers have concluded that clouds of meteoroids orbiting the sun were produced by comets. Meteoroids cannot be observed moving through space because of their small size. Over the years numerous man-made satellites recovered by manned spacecraft have shown pits in their metal skins which were caused by the impact of meteoroids. Most meteor parents (meteoroids) range in size from sand grains to pebbles. Meteoroids become visible to observers on Earth when they enter Earth's atmosphere. They are then referred to as meteors. Meteors, arrive at very high speeds — anywhere from 11 to 74 kilometers (7 to 46 miles) per second therefore they vaporize by air friction in a white-hot streak. An estimated 25 million meteors fall every day however most are too small to be visible to the naked eye. They become visible as a result of friction caused by air molecules slamming against the surface of the high-velocity particle. The friction typically causes meteors to glow blue or white, although other colors have been reported. Most visible meteors are white or blue-white in appearance, although other frequent colors are yellow, orange. The colors seem more related to the speed of the meteor rather than composition. Red meteors occasionally appear as very long streaks and are usually indicative of a meteor that is skimming the atmosphere. Green meteors are also occasionally seen and are usually very bright. The green color may be a result of ionized oxygen. A meteor that appears brighter than any of the stars and planets is called a fireball. Most meteors are seen 80 to 120 kilometers (50 to 75 miles) above the ground. Occasionally someone will claim to see a fireball land just beyond a tree or a hilltop, but in fact a typical fireball first appears at a height of about 125 kilometers (80 miles) and loses its brightness while still at least 20 kilometers (12 miles) above the ground. Much more abundant are smaller, everyday meteors. While most look white, some appear blue, green, yellow, orange, or red. One that explodes at the end of its visible flight is called a bolide. Most meteors completely burn up in the atmosphere at altitudes of between 60 and 80 miles. They are rarely seen for periods of more than a few seconds. Occasionally a larger object will survive its descent and fall to Earth — then it's called a meteorite. Thankfully, the larger the explosion, the rarer the event. Metropolis destroyers, with an explosive energy on the order of 100 million tons of TNT, happen roughly once per millennium. Regional destroyers, about 100 billion tons of TNT, have an event rate of around once per hundred millennia. Civilization destroyers, about 100 trillion tons of TNT, average once every 10 million years or so. The 30 ton meteor that struck Russia in 2013 totally burnt up in the atmosphere.
Meteor Shower Calendar
Shower Activity Maximum Radiant V∞ rMeteors per Hour
Date λ⊙ α δ km/sAntihelion Source Dec 10 - Sep March-April, see Table 6 30 3.0 4
41

(ANT) 10late May, late June
Quadrantids (QUA) Dec 28 - Jan 12 Jan 03 283.16° 230° +49° 41 2.1 120
α-Centaurids (ACE) Jan 28 - Feb 21 Feb 08 319.2° 210° -59° 56 2.0 6
γ-Normids (GNO) Feb 25 - Mar 22
Mar 14 354° 239° -50° 56 2.4 6
Lyrids (LYR) Apr 16 - Apr 25
Apr 22 32.32° 271° +34° 49 2.1 18
π-Puppids (PPU) Apr 15 - Apr 28
Apr 23 33.5° 110° -45° 18 2.0 Var
η-Aquariids (ETA) Apr 19 - May 28
May 06 45.5° 338° -01° 66 2.4 55*
η-Lyrids (ELY) May 03 - May 14
May 08 48.0° 287° +44° 43 3.0 3
June Bootids (JBO) Jun 22 - Jul 02 Jun 27 95.7° 224° +48° 18 2.2 Var
Piscis Austrinids (PAU)
Jul 15 - Aug 10 Jul 28 125° 341° -30° 35 3.2 5
South. δ-Aquariids (SDA)
Jul 12 - Aug 23 Jul 30 127° 340° -16° 41 3.2 16
α-Capricornids (CAP) Jul 03 - Aug 15 Jul 30 127° 307° -10° 23 2.5 5
Perseids (PER) Jul 17 - Aug 24
Aug 13 140.0° 48° +58° 59 2.2 100
κ-Cygnids (KCG) Aug 03 - Aug 25
Aug 18 145° 286° +59° 25 3.0 3
α-Aurigids (AUR) Aug 28 - Sep 05 Sep 01 158.6° 91° +39° 66 2.5 6
September ε-Perseids (SPE)
Sep 05 - Sep 21 Sep 09 166.7° 48° +40° 64 3.0 5
Draconids (DRA) Oct 06 - Oct 10 Oct 08 195.4° 262° +54° 20 2.6 Var
Southern Taurids (STA)*
Sep 10 - Nov 20 Oct 10 197° 32° +09° 27 2.3 5
δ-Aurigids (DAU) Oct 10 - Oct 18 Oct 11 198° 84° +44° 64 3.0 2
ε-Geminids (EGE) Oct 14 - Oct 27 Oct 18 205° 102° +27° 70 3.0 3
Orionids (ORI) Oct 02 - Nov 07 Oct 21 208° 95° +16° 66 2.5 20*
Leo Minorids (LMI) Oct 19 - Oct 27 Oct 24 211° 162° +37° 62 3.0 2
42

Northern Taurids (NTA)*
Oct 20 - Dec 10
Nov 12 230° 58° +22° 29 2.3 5
Leonids (LEO)* Nov 06 - Nov 30
Nov 17 235.27° 152° +22° 71 2.5 15*
α-Monocerotids (AMO)
Nov 15 - Nov 25
Nov 21 239.32° 117° +01° 65 2.4 Var
Phoenicids (PHO) Nov 28 - Dec 09
Dec 06 254.25° 18° -53° 18 2.8 Var
Puppid/Velids (PUP) Dec 01 - Dec 15
(Dec 07) (255°) 123° -45° 40 2.9 10
Monocerotids (MON) Nov 27 - Dec 17
Dec 09 257° 100° +08° 42 3.0 2
σ-Hydrids (HYD) Dec 03 - Dec 15
Dec 12 260° 127° +02° 58 3.0 3
Geminids (GEM) Dec 04 - Dec 17
Dec 14 262.2° 112° +33° 35 2.6 120
Comae Berenicids (COM)
Dec 12 - Dec 23
Dec 16 264° 175° +18° 65 3.0 3
Dec. Leonis Minorids (DLM)
Dec 05 - Feb 04
Dec 20 268° 161° +30° 64 3.0 5
Ursids (URS) Dec 17 - Dec 26
Dec 22 270.7° 217° +76° 33 3.0 10
Source: International Meteor Organization
At certain times of the year one can see more meteors than usual. This happens when Earth passes near a comet's orbit and sweeps through debris that the comet has shed. Such events are called meteor showers. For the major annual meteor showers, seeing one meteor every few minutes is typical, though there are often bursts and lulls. Shower meteors can appear anywhere in the sky, but their direction of motion is away from the constellation whose name the shower bears. This apparent point of origin is known as the radiant. Some observers feel that the best place to watch is between a shower's radiant and the zenith (the point directly overhead). In general, one does best by watching the darkest part of the sky, wherever one may be. Meteor showers sometimes occur when the Earth passes thru the orbit of a comet or space debris should enter the Earth’s atmosphere. Some occur with great regularity: the Perseid meteor shower occurs every year between August 9 and 13 when the Earth passes thru the orbit of Comet Swift-Tuttle. Comet Halley is the source of the Orionid shower in October. Meteors appear as fast-moving streaks of light in the night sky. They are frequently referred to as "falling stars" or "shooting stars." There are only nine meteor showers than are considered major. They are the Quadrantids (Jan 3-4), Lyrids (Apr 22), Eta Aquarids (May 2-10), Delta Aquarids (Jul 26-30), Perseids (Aug 5-19), Orionids (Oct 18-26), Leonids (Nov 18), Geminids (Dec 10-16), and the Ursids (Dec 22). These major showers vary in intensity but all are best seen during the early morning hours. Viewing the morning sky during these periods will offer much more activity as these showers will combine with the normal sporadic activity to produce a good show. The absolute ten best mornings for viewing meteor activity are: (in order of strength) Dec 14, Aug
43
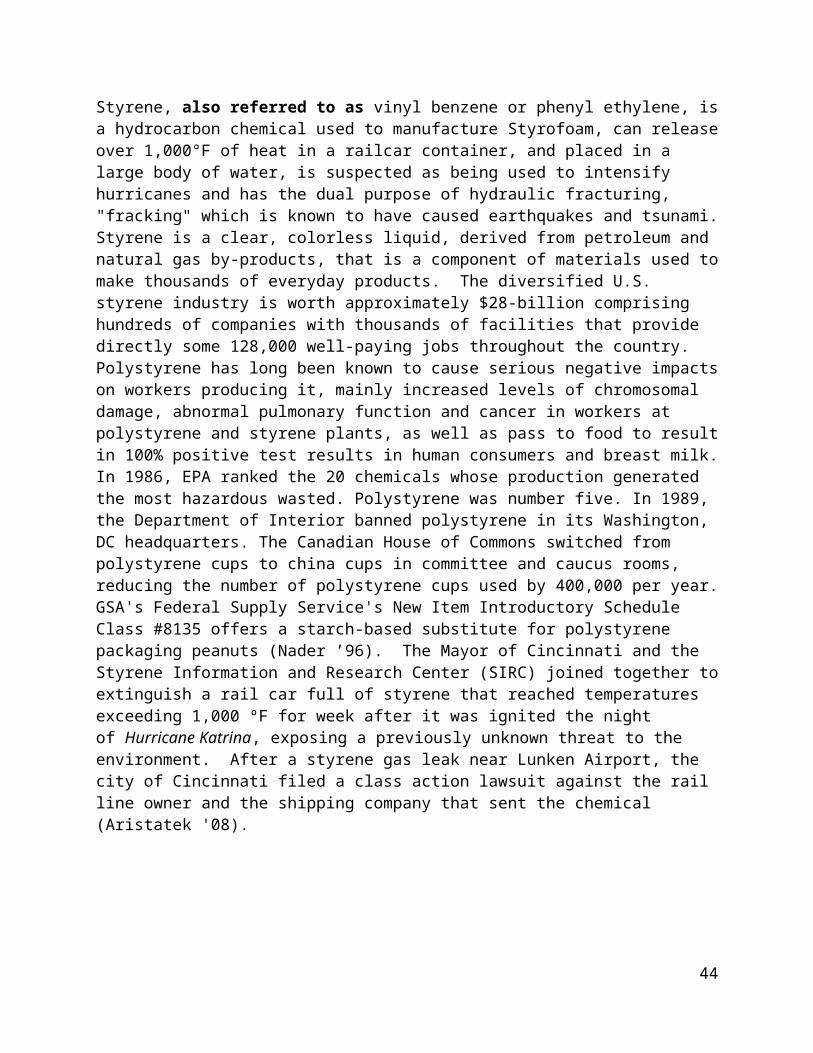
12, Dec 13, Aug 11, Aug 13, Jan 3, Dec 12, Oct 22, Aug 10, and Dec 11. Since the Earth encounters these showers every year at the same time, these dates will usually remain the same year after year (Sanders '07: 6-8).
Chapter 6 Wind and Air Pressure
The difference between high and low pressure across the Earth's surface is the basic driving force that makes the air move. Take as an example the difference in pressure between the centers of the Iceland Low and Azores High during the North Atlantic winter, assessed using the extreme-season maps. This turns out to be about 25 mbar. By determining the distance between the two, which is something like 1,500 mi (2,500 km) one calculates the horizontal gradient of pressure - or how fast pressure changes across the sea surface. In this case, it would be around 1 mbar per 60 mi (100 km). This is a fairly steep gradient and means that the sea-surface wind speed midway between the Azores and Iceland is, on average during the winter, about 16 m/sec or some 56-58 km/hr (35 or 36 mi/hr). A large pressure difference between a high and a low that are close will produce a steep gradient and a strong force to drive the air. A large pressure difference between a high and a low that are close will produce a steep gradient, however, will generate less force. The steeper the gradient, the stronger the wind. The difference between the "head" of air above a high and that above a low drives the air from the high toward the low. This flow will decrease the mass of air in the column above the high, causing pressure to fall, and will increase the mass of air in the region of the low, causing pressure to rise . Although air flows from high-pressure regions toward low-pressure areas, the direction of the flow, or wind, is not straight from one to the other. The Earth's rotation causes the wind to be deflected so that it spirals out of the highs and into the lows The direction of the mean prevailing winds across the Earth's surface in January and July is strongly related to the direction of the isobars. Isobars are graphic representations of this wind on weather maps (Reynolds '05: 61, 62).
There are many regional winds too numerous to mention. All are related to the critical location of low and high pressure systems that act to channel the airflow in a particular direction. Local topography can also accentuate its strength by "squeezing" wind between two areas of high ground. In some parts of the world, such as areas of the Mediterranean basin, well-known winds blow over quite restricted areas They occur when the pressure patterns display a particular distribution - like the northerly Mistral that shoots down the Rhone valley in southern France between a slow or stationary low pressure system over, say, central Europe and a high located across Biscay. There are many regional winds around the Mediterranean, including the hot, dry southerly Sirocco whose baking heat comes from its source over the Sahara In contrast, the wintertime northeasterly
Bora is associated with the cold, gusty conditions found across the Adriatic shores of the Dinaric Alps. There is also the Santa Ana wind of southern California. This hot, dry, northeasterly
44

blows parchingly over the Los Angeles basin and is frequently linked to the wildfires that are a notorious risk for properties on the upwind flanks of that city (Reynolds '05: 63). In addition to the risk of fires, they are hazardous for drivers and pilots. Desert winds rise in a clock-wise pattern from a high pressure East of the Sierras. Air extends from the mountains and is compressed and warmed, becoming less humid. Winds gust through the canyons at 40 to 60 mph.
45

Along many of the world's spring and summertime coastlines, cool, "fresh" air, often blows onshore as the sea breeze. Whether or not this occurs depends on the larger-scale weather pattern providing relatively light winds and mainly clear skies over a coastal region. If this is the case, the land surface will heat up quicker than the adjacent sea after sunrise, because water has a more sluggish thermal response to the sun shining on it. Throughout the early morning hours the preferential heating of the land leads to a fall in the barometric pressure there. The pressure over the sea does not fall, however, but it remains relatively high and drives the sea air across the coast toward the low inland. The greatest contrast between the air temperature above the land and sea occurs during the afternoon, with the warmest conditions over land. This means that the strength of the breeze is usually greatest during the afternoon and will decline gradually as the sun goes down. The all-important thermal difference across the coast means that in the tropics sea breezes can generate all year round, while in higher latitudes they are generally only warm season phenomenon. Sea breezes have distinct leading edges that move inland more or less parallel to the coastline, quickest across low-lying areas. The "front' has a lobelike structure whose passage leads frequently to an abrupt fall of temperature (as the sea air is cooler) and increase in humidity (because the sea air is damper). The wind direction can change rapidly too. Often the denser sea air, which may be up to 980 ft (300 m) to 1,300 ft (400 m) deep, scoops up the warmer land air ahead of it to produce a line of cumulus clouds that are organized parallel to the coast. Such clouds can produce showers along this sea breeze "front". After dark, as the land surface cools more rapidly than the sea, the pressure difference switches to drive a gentle land breeze toward the sea through the night. It tends to be light than the daytime sea breeze because the temperature contrast is weaker at night. Under the same large-scale weather conditions as those that permit the genesis of sea and land breezes, broadly similar circulations can occur across the shores of sizable lakes. The US Great Lakes, for example, experience daytime lake breezes during some spring and summer days, as air blows onto the surrounding land across their shores. This can occur over many large lakes or inland seas, such as the Caspian and Black Seas (Reynolds '05: 64).
Ocean Currents
Credit: Maricopa.edu
The pattern of large-scale ocean surface currents is more or less a mirror of the average wind patterns at the surface. In other words, the sea-surface circulation is essentially wind-driven, although both warm and cold ocean streams do have an important impact on the weather and climate over the sea and across adjacent land areas. The Gulf Stream, the North Atlantic Drift and the Kuro Siwa are all examples of warm water being exported from the tropical boilerhouse and all three have a significant impact on the climates of distant shores. The principal warm ocean current of the southern hemisphere are known as the Brazil and Agulhas Currents. The extensive region of warm water that washes the shores of eastern Australia is also significant. In contrast, the cool Canaries and the California Currents are parts of the grand design to transport cooler water toward the equator for warming. On the way, they influence the weather along the adjacent coastlines dramatically. They do this because when their cool waters are overrun by relatively warmer and damp air, extensive sea fog or low-level layer cloud is formed as the lower atmosphere is chilled. The western flanks of the southern continents are influenced by cold oceanic flows toward the equator in the form of the Peru (or Humboldt), the Benguela and the
46

West Australian Currents. As with the cold California Current, the Humboldt Current is associated with the extensive low cloud and sea fog that occurs along the part of the coasts of Peru and Chile. In comparison to the northern hemisphere's ocean circulation, the southern oceans are markedly cooker, because they are influenced by the cold Antarctic Circumpolar Current at high latitudes (Reynolds '05: 22-23).
Pressure is related to the weight of the air above the point at which the measurement is taken. The air is compressed under its own weight, so its density also decreases with height. The annual global mean-sea-level pressure is 1013.2 mbar, which relates to an air density of 1.23 kg/m3. At the top of the Empire State Building in New York, USA, it is typically 53 mbar lower than at sea level; air at the harborside in New York is about 3% denser than the air at the top of the Empire State Building. Going up through the highest peaks leads to thinner and thinner air, down to a density of 0.48 kg/m at the top of Mount Everest, where the average pressure is 315 mbar. Commercial jets normally use cabin pressures between about 850 and 800 mbar, which is about the same as being in the open air between 4,900 and 6,600 ft (1,500 and 2,000m) above sea level . Such jets cruise at a level where the outside pressure is around 250 to 200 mbar because that is where they are most fuel-efficient (Reynolds '05: 10, 11).
High pressure areas tend to be associated with dry, settled conditions, whereas low pressure regions relate to the frequent occurrence of cloudy, wet and windy weather. The Iceland Low and Aleutian Low, which occur in the higher latitudes of both the North Atlantic and Pacific Oceans respectively are examples of the traveling low-pressure system that run typically from southwest to northeast across these oceans during the winter months. The minimum pressure values mark the point where, on average, the depressions, or cyclones, reach their deepest (lowest). The southwest/northeast alignment of their troughs indicates the mean track of the depressions in the winter. The long term average value across the centers of the Iceland and Aleutian Lows is around 995-1,000 mbar, a few thousand kilometers across The trough that stretches northeastward from the Iceland Low is more extensive than that linked to the Aleutian Low This is largely an expression of how the traveling cyclones are able to penetrate deeply into the Arctic Basin via the broad Norwegian Sea, in contrast to the more limited pole-war excursions across the Bering Strait. In contrast to the maritime lows in the winter hemisphere, the extensive cold continents are marked manly by the presence of very large highs, or anticyclones The centers of these two major features lie deep in the middle-latitude continental interiors of Asia and North America. The most intense is the Asian High, with a long-term value above 1,040 mbar; the center over the United State is less intense than the Asian High (about 1,020-1,025 mbar) but nevertheless, it still has a strong influence on the regional weather. The highs are the products of intense radiative cooling that occurs across these vast land masses in the winter. As with lows, there is no specific value of pressure that defines such a feature as "high" the pressure quoted is simply the maximum value that occurs across an extensive region. Therefore, a high could have a value of, perhaps, 1,055 mbar on a particular day, and 1,015 mbar on another. In addition to the cold continental winter anticyclones, regions of high pressure occur across the subtropical North Atlantic and Pacific Oceans. These are the Azores and Hawaiian Highs, which dominate the weather in these regions. They are warmer than their continental counterparts, and deeper, stretching throughout the depth of the troposphere. Cold anticyclones are shallow, recognizable as highs only up to 1 mi (1.5-2 km) above the surface (Reynolds '05: 25, 26).
47

On the poleward sides of the anticyclones, major warm and moist currents of air move toward the poles as south westerlies and northwesterlies in the North and South Atlantic respectively. Across the British Isles and western Europe, the southwesterly wind direction predominates. This maritime stream of air contrasts strongly with that on the other side of the North Atlantic, which affects Labrador, the Maritime Provinces and the northeastern USA. Here, the prevailing wind direction is northwesterly, between the Iceland Low and the high over the USA. This means that most often the air comes from the cold, dry regions of North America's higher latitudes. In a similar fashion, mild and moist southwesterlies flow toward southern Alaska and western Canada. The situation here differs from that in the northeastern Atlantic because of the Rocky Mountains, which are aligned more or less at right angles to the tracks of the traveling lows. Much of the precipitation from the northeastern Pacific depressions is deposited on the Rockies, to the detriment of the arid high plains to the east. In fact, the dryness of the Plains is related to the presence of the extensive rain-and-snow scavenging mountains to the west. On the contrary, Atlantic depressions can move right across the lower land of northern Europe unimpeded. On the western flank of the Aleutian Low, the predominant flow is from the northwest, from the very cold stretches of Russia and northern China. During the summer in te southern hemisphere, the westerlies blow parallel to the lines of latitude, between the subtropical highs of the South Atlantic, South Indian and South Pacific Oceans and the higher-latitude, low-pressure belt. Winds in the region of Asia are dominated by flow from the wintertime high into the Aleutian low systems . They either blow into the ITCZ as the Northeast Monsoon, or blow toward the Arctic Ocean. Although the North American High is important, it does not dominate such an extensive region (Reynolds '05: 32-34).
Polar regions are subjected to seasonal changes of pressure. The Arctic tends to experience a weak high in the winter and a shallow low in the summer. The relatively high elevations throughout the Antarctic mean that reducing the pressure values to sea eve becomes unrealistic and it experiences relatively high pressure throughout the year. The poles are also affected by geography. In the northern hemisphere, the continents widen toward the pole and surround the
48

Arctic Ocean, while in the southern hemisphere, they taper toward the pole, giving way to the circumpolar ocean that surrounds the massive continent of Antarctica. The result of this marked difference is that frontal depressions tend to run due west-east, flanking the Antarctic continent. In contrast, those of the Northern Hemisphere extra-tropical oceans most often track from southwest to northeast in association with the thermal gradients that are aligned in the same way, parallel t the orientation of the coastlines there (Reynolds '05: 27).
In middle and high latitudes, the broad continents of the northern hemisphere are intensely cold in the winter. There is an east-west difference, however with their eastern flanks colder than the western. This is true of both Eurasia and North America. The coldest conditions on the east coasts are caused by the prevailing winds, which blow off the cold continents. In contrast, the west coasts experience milder conditions in part because of the tropical maritime air borne by the traveling frontal lows that approach from the ocean. These are complemented by warm ocean currents that stream toward the western coasts. Both the Gulf Stream/North Atlantic Drift and the Kuro Siwo/North Pacific Current are crucial. The tropics experience a very small annual temperature range between the warmest and coolest months, because there is little variation in the amount of solar radiation received throughout the year. This is why the different seasons within the tropics are defined by when it rains, rather than by temperature changes. In contrast, throughout the extratropics, the winter is significantly colder than the summer, so the annual round of warming and cooling is a basic means of defining the seasons (Reynolds '05: 39-41).
Moving toward the equator form the subtropical anticyclones reveals a broad area of low-latitude minimum of pressure known as the Equatorial Trough across the intensely heated southern continents of South America, Southern Africa and Australia. The middle-latitude southern ocean is characterized by an elongated circumpolar bet of low pressure, which is virtually unbroken, unlike the northern lows Its presence is a reflection of depressions that travel unimpeded around the open southern ocean, providing the strong westerly winds associated with the Roaring Forties that skirt the Antarctic continent. In contrast, the North Atlantic and Pacific storm tracks run much more southwest/northeast, influenced by the alignment of eastern North American and eastern Asian coastlines in the middle latitudes These depressions feed off the strong thermal contrasts that exist between the continental and oceanic regions in the northern hemisphere: the temperature gradient separating them has the same orientation. These ar warm subtropical anticyclones located over the South Pacific, South Indian and South Atlantic Oceans, which give way northward to the Equatorial Trough. There are no continental highs because these regions are strongly heated in the summer and are characterized by this shallow low-pressure (1,005-1,010 mbar) feature (Reynolds '05: 27).
49

The centers of low pressure, so marked over the northern oceans in January, are much weaker or barely discernible in July, having shifted pole-ward. The extensive continental anticyclones are now replaced by large-scale low-pressure features. Over Asia, this change is marked by a depression centered across western India and Pakistan. The switch over this continent from extensive high to extensive low pressure is linked to the evolution of the monsoon from its winter to summer phase. The summer hemisphere subtropical highs intensify or become higher. Both exhibit an increase of some 5 mbar and migrate a few degrees of latitude northward As in winter, the east-west continental/oceanic pattern in this hemisphere is caused by the breakup of the major pressure features into very large highs and lows. The Earth-girdling Equatorial Trough, over the continents especially, exhibits a substantial seasonal migration toward the equator. The subtropical anticyclones in the wintertime southern hemisphere form a virtually complete belt, while the circumpolar lows still occur around the Antarctic with noticeable low pressure values (Reynolds '05: 29).
The relative locations of the highs and lows in January and July determine the pattern of prevailing winds and thus, in part, the nature of the weather experienced around the Earth. In January, the North and South Atlantic, and their surroundings, are influenced by the important source regions of air: the two subtropical anticyclones. At the surface, the winds flow clockwise out of these in the northern hemisphere, and anticlockwise in the southern hemisphere. Parts of these outflows run toward the equator from both highs as the Northeast and Southeast Trades. Together, these culminate in the Inter-Tropical Convergence Zone (ITCZ). The Trades are known for their strength and constancy over the tropical oceans, but they slow dramatically as they converge toward each other and enter the ITCZ. This feature, most noticeable over the oceans, is typified by the infamously light and variable winds of the Doldrums. The Trades exist throughout the year, with marked and important migrations north and south of the ITCZ, particularly over the tropical continents. The ITCZ is also well known for very strong ascent caused by the surface convergence of the hot humid Trades; this shows up as cloud clusters that produce many thunderstorms. The disastrous droughts that occur occasionally across parts of Ethiopia or Sudan can be related to the ITCZ's failure to spread far enough north, or a lack of activity in terms of the deep convective clouds that produce the life-giving downpours. On the eastern and western flanks of the subtropical anticyclones the air flows generally parallel to the
50

adjacent coasts but also penetrates into the southern continents to supply the ITCZ (Reynolds '05: 29-32).
Inter-Tropical Convergence Zone
The ITCZ reaches its northernmost limit during the height of the northern summer, its most "famous" excursion being across southern Asia. This seasonal change in the surface winds across India, for example, is the signature of the Monsoon, which takes its name from an Arabic word meaning "season". The convergence zone and associated low center and troughs contrast markedly with the January pattern of extensive northeasterlies across the region. Similar, but less extensive seasonal wind reversals also affect the southern part of West Africa the southwestern USA and northern Mexico. The middle-latitude westerlies occur in the northern ocean basins, but generally are less extensive and less vigorous than in the winter months The subtropical highs on the westerlies' southern flank intensify into the summer and shift slightly poleward. They still supply the Trades, which as in January, are the most significant across the tropical oceans. The Roaring Forties of the Southern Ocean persist virtually all year, blowing powerfully between the oceanic subtropical highs and the circumpolar low-pressure region. Apart from Antarctica and Australia, the less extensive continents of the southern hemisphere do not have any substantial high associated with them Only Australia is large enough in the subtropical/middle latitudes to produce an anticyclone and, thus, influence the mean wind pattern regionally (Reynolds '05: 34, 35).
51

Each hemisphere displays three distinct types of vertical air circulation, known as cells. The deepest, most powerful and most extensive is the Hadley, or tropical cell. It generally comprises very vigorous, tropical thunderstorms (known as "hot towers") associated with the low level convergence of warm, moisture-laden air in the ITCZ. Flow from the top of this thundery zone, in the upper troposphere, toward both poles. This air gradually cools as it moves poleward and, at around 30°N and 30°S, sinks through the troposphere. Surface return flows from subtropical highs toward the ITCZ as the Northeast and Southeast Trade Winds. Much weaker than the Hadley cell, the Ferrel, or middle latitude cell is comprised of low-level currents of air that flow poleward form the subtropical highs. A region of rising air, at around 50°-60°N and 50°-60°S, represented by the large-scale rise of the warm, moist air in frontal depressions. These common frontal depressions are the major source of precipitation for middle and higher latitude areas of the world, for example over much of western Europe the southern Andes and South Island, new Zealand. A return flow in the upper troposphere that heads toward the upper outflow from the ITCZ. These two flows converge above the subtropical highs, and are matched by the two currents that diverge directly below them at the surface. The final component of vertical air circulation is the weak Polar cell It sinks gently in the highest latitudes, associated with surface highs. Surface flow toward the equator, some of which ultimately undercuts the warm-sector tropical maritime air in the frontal zone. This forms the leading edge of the polar air behind a cold front. A weak return flow from above the frontal depressions toward the poles (Reynolds '05: 37-39).
Air Circulation Cells
El Niño and La Niña together, make up the El Niño Southern Oscillation (ENSO). A La Nina event involves abnormally cool water in the equatorial Pacific, while El Niño occurs when the water is warmer than average. The recent results of the 20 computer models showed that surface temperatures in the equatorial eastern Pacific could rise above 28 degrees Celsius more
52

frequently. At that temperature, an extreme El Niño event can be triggered. Intense El Niño periods could double in frequency as the Earth’s average temperature continues to rise, warned an international team of atmospheric scientists and oceanographers. The researchers forecast higher warming of the eastern Pacific Ocean near the equator, relative to surrounding waters, based on 20 computerized models of the planet. Extreme El Niño events may cause deluges in the United States and Peru, yet leave the other side of the Pacific deathly dry. The 1982-1983 El Niño caused disastrous flooding in Peru. Yet the same event resulted in droughts in Indonesia and Australia. The ’82-’83 event also hurt marine life and people dependent upon that life. The warm surface waters of El Niño cut off the circulation of cold, nutrient rich water from deeper in the Pacific. The lack of deep-water nutrients knocked out the base of the marine food chain and thereby starved both fish and fishermen. During the 1997-1998 El Niño, torrential rains flooded California and caused disastrous mudslides (Wall '14).
The equatorial Pacific not only experiences el Niño however; on occasion the South Oscillation (SO) index can experience its antithesis known as la Niña. During la Niña the central and eastern tropical Pacific waters tend to become much cooler than average. La Niña is also linked to generally cooler than average surface land temperatures across the tropics and subtropics in Asia. High pressure and temperature develop around the San Joaquin Valley in California There is also evidence of increased tropical storm activity in the North Atlantic during la Niña and decreased activity during el Niño. Relatively wet weather occurs across large areas of Indonesia, Australia and southern Africa, while lower than average rainfall is observed over southern Brazil, Uruguay, northern Argentina and east Africa. The North Atlantic Oscillation (NAO) is a phenomenon that is essentially a "see-saw" in mass exchange between the North Atlantic's Azores High and Iceland Low during the winter season. A negative NAO index means much weaker than average flows across the Atlantic toward Europe, and cooler winters across much of that continent. A positive NAO index occurs when there is a large pressure difference between the Azores and Iceland; such a steep gradient is associate with stronger westerly flow into Europe and generally more vigorous starveling lows. It is linked to milder, wetter than average winters over much of Europe and also to cooler than average conditions across comparable eastern North American latitudes (Reynolds '05: 54, 27, 28).
El Niño is associated with an atmospheric phenomenon known as the Southern Oscillation (SO). Pressure is normally high over the southeast Pacific and low in the western equatorial Pacific. The horizontal gradient of pressure between these two centers leads to the presence of the easterly (westward-blowing) Trade Winds During such times, the SO is said to be in its High Index. Sometimes, however, the barometer falls over a period of months across the southeastern Pacific and, when this happens, it rises simultaneously in the western Pacific. This change leads to a weakening of the pressure gradient, together with a weakening - or even a reversal - of the Trades . This is known as the Low Index of the SO. During such phases there are droughts in Australia, Indonesia, India and parts of Africa. In addition winters tended to be unusually warm in western Canada. Furthermore, the desert islands in the middle equatorial Pacific suffer persistent and torrential rains. SO and el Niño are both parts of the same phenomenon known collectively as ENSO. During normal, or average years, the easterly winds that blow along the equator and the southeasterlies that blow along the coast of Ecuador and Peru, drag surface water along with them. The rotation of the Earth deflects this water to the right of the flow in the northern hemisphere, and to the left in the southern. This means that water is driven away from
53

the equator in both hemispheres and also from the Peru-Ecuador coastline. Cold, nutrient-rich water wells up from below to replace it, forming narrow zones of equatorial and coastal upwelling less than 90 mi (50 km) wide. Normal conditions are marked by cool temperatures over the eastern Pacific and a warm maximum over the equatorial western Pacific. This western area is so warm that very deep convective cloud and heavy rainfall are a hallmark. Part of the huge volume of air that ascends to great height within these clouds - as high as the upper troposphere - moves eastward at these levels and sinks in depth across the eastern Pacific. This vertical circulation is called Walker cell. A number of these cells exist around the equator, connecting wet and dry regions. The descending portions of such cells are characterized by very dry and often cloud-free weather (Reynolds '05: 47-49).
Within the ocean there is a layer with a depth of 330 ft (100 m) or so, through which the water temperature drops rapidly. Known as the thermocline, it separates the upper warmer zone from the much colder deeper reaches. Normally, the thermocline is near the surface in the eastern equatorial Pacific, some 160 ft (50 m) down, and it slopes gently down toward the western side, where it is found at a depth of about 660 ft (200 m). If there were no wind stress on the surface of the ocean, the thermocline would be nearly horizontal. In this region, however, the persistent Trades drive water westward, lifting the thermocline toward the surface in the east, and depressing it in the west. The fact that the westward-driven surface water is steadily warmed by sunshine and, therefore, is lower density means that the surface of the sea slopes up toward the western equatorial Pacific. When the Trades are blowing at their strongest, the sea level in the western basin is over 1.6 ft (0.5 m) higher than in the east. This very broad, flattened mound of warm water occurs around Indonesia and New Guinea. As the SO index gradually moves to a low-value phase, when the Tahiti/Darwin difference is small, the relaxation in the normally strong Trades leads to the thermocline becoming less tilted. It drops by more than 330 ft (100m) in the east and cuts off the cool, upwelled water from the Ecuador/Peru coastal zone. Thus, the sea level flattens out along the equator, falling in the west and rising in the east. In association with this, the warm surface water flows eastward as a long, low wave known as a Kelvin wave,
54
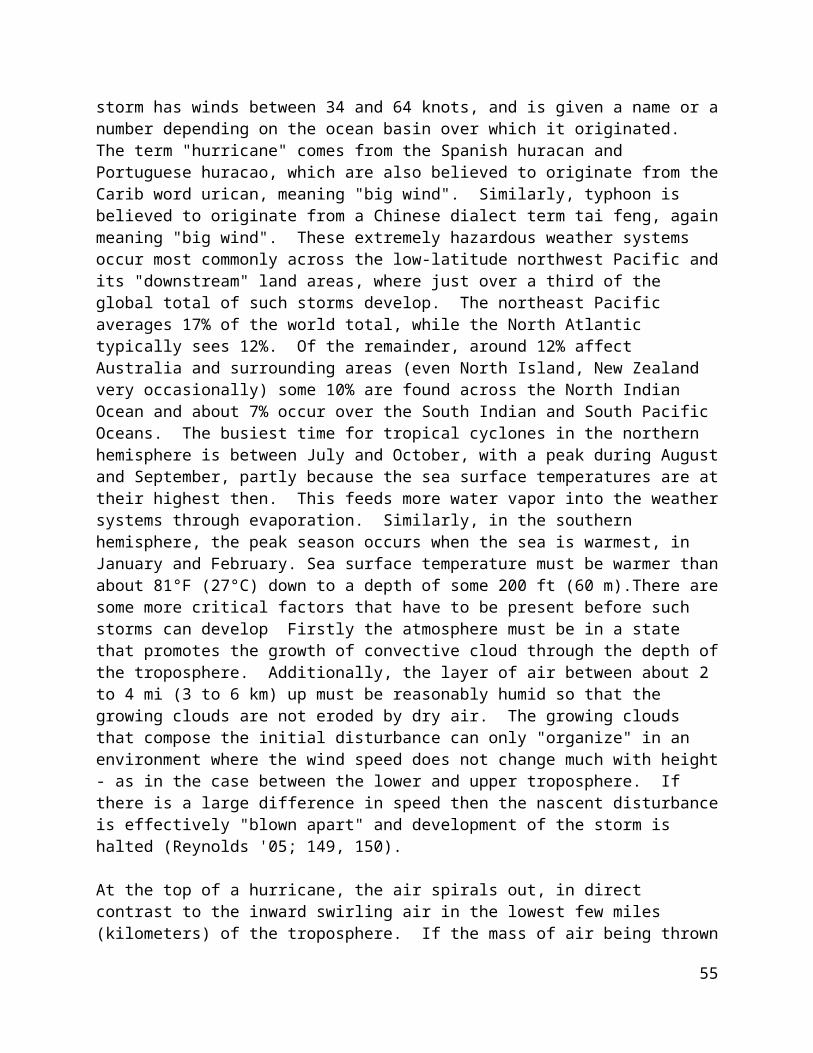
reaching South America a few months later, where it turns north and south along the coast. This leads to an increase in sea level and the migration of fish. The northward branch of warm water influences marine life as far north as Vancouver, Canada. The eastward migration of the warm water across the equatorial Pacific causes the air above it to become moist and warm. It also gains sufficient buoyancy to produce massive convective cloud and torrential rain in regions that otherwise are persistently arid (Reynolds '05: 49, 50).
During el Niño, the warm surface water flows east along the equator, bringing thunderstorms. The classic el Niño conditions include unusually high rainfall across the central equatorial ocean, as well as unusually dry conditions over the western sector, including northern South America, eastern Australia and over Indonesia. This distinct pattern is due to the fact that one portion of the enormous upward movement of air in the displaced convective region subsides over the western Pacific. After the Kelvin wave has left the western Pacific, the warm water layer thins substantially and mixes with cooler water This cooling leads to less evaporation and a more stable atmosphere, which together mean less rain. The eastern half of Australia and a of Indonesia, therefore, are susceptible to drought during a marked el Niño. There are other typical thermal and precipitation anomalies associated with a strong el Niño. The period from June to August that follows the evolution of the el Niño tends to be characterized by drier than average conditions around Indonesia, Australia and the Fijian Islands. Drought is a risk across the northern part of South America and the southern Caribbean too - and there is evidence that the Indian monsoon may be drier. Dry conditions stretch from Sumatra and southern Malaysia to the Hawaiian Islands in the north, and the Fijian Islands in the south. Additionally, drought is a high risk for eastern equatorial South America and southeastern Africa. Abnormally wet conditions occur over Ecuador, Peru, southern Brazil, Uruguay, northern Argentina, southern USA and equatorial east Africa. Warmer than average winter conditions are often experienced from Alaska to the Canadian Rockies, in parts of southeastern Canada and northeastern USA and around Japan. The equatorial Pacific not only experiences el Niño however; on occasion it can experience its antithesis known as la Niña. During la Niña the central and eastern tropical Pacific waters tend to become much cooler than average. La Niña is also linked to generally cooler than average surface land temperatures across the tropics and subtropics. There is also evidence of increased tropical storm activity in the North Atlantic during la Niña and decreased activity during el Niño. Relatively wet weather occurs across large areas of Indonesia, Australia and southern Africa, while lower than average rainfall is observed over southern Brazil, Uruguay, northern Argentina and east Africa (Reynolds '05: 50-52, 54).
Chapter 7 Clouds and Precipitation
Water is heavy, near sea level, a cubic meter of air weight about 2.6 lb (1.2 kg) while one of water weight 2,200 lb (1,000 kg). Clouds stay aloft, despite the weight of the water, because they are associated with rising air. A cloud's look and extent are expressions of how the air has risen to produce them Extensive layer cloud- like stratus or stratocumulus - are formed by widespread ascent that is relatively gentle. In contrast, puffy cumulus or cumulonimbus are related to strongly ascending air across a more limited area. In general air ascends in small cumulus clouds at a rate of 1-5ms, whereas large cumulonimbus clouds have air rushing through at up to 30 ms. All clouds are formed by the cooling of moist air down to its dewpoint
55
temperature, the temperature at which air must cook in order for saturation to occur. Further cooling causes the water vapor to condense gradually out of the air as myriad cloud droplets. The amount of water vapor contained in saturated air depends on the air temperature. Cold air is capable of holding small amounts while very warm air can contain much more. This marked increase in the saturation value of water vapor with temperature means that moist, cold air generally produces less precipitation than moist, warm air. The most common way that damp air cool enough to produce cloud droplets or ice crystals is by ascending. In some cases, a volume of ascending air may be about six hundred feet across (200 m); in others, it may be as long as six hundred miles (1,000 km) across. The speed with which air rises varies (Reynolds '05: 64, 65, 66).
All cloud droplets have a nucleus around which they have condensed - known as the cloud condensation nucleus (CCN). These microscopic particles have a variety of sources, including blowing soil, volcanic eruptions, industry (e.g. smoke) and the spray from breaking waves. Their number varies from ocean to continent, and with height within the troposphere, but a typical value at sea level is around 100-200 million in every 35 cubic feet (or every cubic meter). Cloud droplets vary in size depending, for example, on the number of such condensation nuclei, how much water vapor there is available, and the strength of the up-currents within the cloud. The incredibly tiny cloud droplets are so small that their terminal fallspeeds are much lower than the speed of the updrafts that create the clouds. They settle at about 1 cm/sec, while the larger ones do so at about 1 ft/sec (30 cm/sec). Generally, larger cloud droplets are found in convective clouds (cumulus clouds, formed by relatively warm air that pulls away from the Earth's surface; these generally fairly small clouds transport heat up into the atmosphere by the process of convection), where they can grow within the fast updrafts (Reynolds '05: 66).
Meteorologists recognize a large variety of cloud types. They are defined in basic ways related to their essential shape: for example, a sheet or layer is "stratiform" while those with lumpy upper surfaces and flat bases are :cumuliform". The terms "stratus" - for layer cloud - and "cumulus" - for lumpy cloud - are the basic building blocks for cloud names. In addition to these indicators of form, meteorologists recognize three different heights at which clouds occur - simply low, middle and high. Which level a particular cloud falls into depends on the height of its base above the surface. So, low cloud can, for example, be stratus (a monotonous layer of cloud); stratocumulus (a sheet of cloud that has a subtle "lumpy" form to it); cumulus (a shallow, bubble-topped cloud); or cumulonimbus (the tallest, or deepest, cumulus cloud from which a shower falls - indicated by the inclusion of "nimbus" in its name). The many varieties of cloud at middle levels are prefixed by "alto" - altostratus and altocumulus, for example. In addition, nimbostratus occurs as middle levels, as a deep layer of precipitating cloud. The highest level clouds are prefixed by "cirro". In contrast to the low and middle types, they are composed entirely of ice crystals. As well as cirrostratus and cirrocumulus, there are the elegantly striated "cirrus" that can occur as patches or long fibrous elements, which don't fit either of the cumuliform or stratiform forms. Clouds are formed by moist air rising in air bubbles, However, moist air also rises on a very much larger scale within lows, or depressions. This occurs across tens to hundreds of thousands of square miles of the earth's surface during the formation of a typical low. Therefore, depressions are cloud laden, often with deep layer cloud that can produce widespread precipitation. As lows track across the earth, the cloud is borne with them (Reynolds '05: 66, 68).
56

Cloud Types
So long as the ascending or descending air is unsaturated (cloud-free), it will cool or warm respectively at the rate of 5.5°F per 1,000 feet (9.8°C per kilometer). Once condensation begins, a cloud appears. The process of condensation actually releases heat, which warms the surrounding air. This means the ascent within clouds causes the air to cool much more slowly than in cloud-free ascent. Some days, conditions can be such that convective clouds develop into a distinct patter of long lines, separated by clear air. These lines may stretch for many tend or hundreds of miles along the direction of the wind and are known as cloud streets. They are formed when there is a temperature inversion (a rise in temperature with height) a few miles above the surface, and when the wind direction remains constant with height below this level, with a speed of at least 13 knots at the surface. Since the streets occur when an inversion is present, the clouds do not usually become deep enough to produce any precipitation. Cloud streets are common over mid and high latitude oceans in the fall and winter, and over the land in spring and summer (Reynolds '05: 69, 70).
Air has no choice but to flow over and around upland areas. If the air is damp, its forced ascent (termed orographic uplift) can often lead to saturation and condensation into orographic cloud. Such cloud is commonly thick stratus with a base below the tops of the hills over which the damp air flows. This situation produces hill fog for upland areas shrouded in such cloud- hilly areas are often cloudier than adjacent lower land because of the orographic effect. The amount of uplift required depends on how close the air is to saturation point. Very dry air will require a
57

good deal of cooling (uplift) to reach its dewpoint temperature, while very damp air will need only slight ascent to produce cloud. Within warm sectors of a weather front, rain is commonly subjected to a process known as orographic enhancement. Upland regions of South Wales in the UK, for example, can experience a fall of rain that is two or three times more intense than that falling on the coast at the same time. Careful study of this phenomenon has defined the conditions required to produce significantly heavier rain in upland areas - it is not true that a moist airstream crossing a hilly district will always generate more rain. Orographic enhancement occurs in warm sectors when there is a precipitating layer of cloud at a height of about 1 ro 2 mi (2 to 3 km). This layer will not be related to the hills in any way, but to the large-scale flow of the frontal depression. Sometimes, as this layer moves across the hills, the rain it produces falls through cloud that has been generated by a strong, low-level stream of moist air flowing up and over the hills, visible as orographic cloud. While the situation persists, the rain washes out large quantities of water from the lower cloud, thus increasing rainfall over the hills compared to other areas. If the lower cloud is constantly replenished by a strong surface flow of damp air, there wil be a prolonged period (over many hours) of orographic enhancement. However, if the surface flow is weak, the water will soon be washed from the cloud, and not replenished at a rapid enough rate, providing only a fleeting addition to the catch over the hills. This action occurs across many middle-latitude hilly areas that are frequented by frontal depressions. It is the explanation for example, for the wet reputation of upland North Wales, Western Scotland and the Lake District in the UK. Other upland areas of the world that lie in the track of frontal cyclones also see orographic rain and snow. These include the Norwegian mountains, the Rockies of northwestern USA and western Canada, the southern Andes and the mountains of South Island, New Zealand (Reynolds '05: 74, 75, 76).
Under special conditions of wind and temperature change with height, hills and mountains can generate standing waves, anchored to the hills and mountains that produce them, in the airflow above and downwind of them. These lee waves are indicated by cloud in the ascending air, contrasting with clear areas where the air descends. Such waves can appear over a distance of 60
58

mi (100 km) or more, to leeward of upland areas. Lee waves can be compared to the standing waves sometimes seen in streams where water flows over large stones The flow creates a pattern downstream, in which the waves are stationary, but the water flows quickly through the pattern. The ribbed cloud pattern associated with lee waves will exist for some hours, rather than days, until the large-scale weather pattern that favors their development changes. The lenticular (lenslike) clouds produced by the wave pattern do not produce precipitation. On some occasions, the droplets that compose the lee wave clouds freeze and, if the air is humid enough ,an extensive sheet of ice crystals develops, which will be carried many kilometers/miles downstream by the wind (Reynolds '05: 76, 77).
For precipitation to occur, there must be a means by which cloud droplets or ice crystals can grow larger and heavy enough to fall as drizzle, rain, snow or hail. Clouds with tops warmer than 5°F (-15°C) are composed of cloud droplets of varying size, which collide as they settle. The larger drops fall faster and sweep up smaller drops by a process known as coalescence. The number of raindrops that form within these clouds depends on the liquid water content, the range of droplet sizes, the strength of the updraft within the cloud - which determines the time available for the droplet to grow - and even the electrical charge carried by the droplets. If, by some process, cloud drops grow large enough to attain a fallspeed greater than the ascending air speed, they will fall as rain. A borderline cloud/drizzledrop has a diameter of about 0.02 cm (0.2 mm), while a typical raindrop has a diameter of about 0.7707 in (2 mm); a raindrop of this size falls at up to 21 ft/sec (6.5 m/sec). Drizzle is formed of drops with a diameter of between 0.02 to 0.05 cm (0.2 and 0.5 mm). Drizzle falls from shallow stratus, within which weak up-currents of some 4 in/sec (20 c/sec) occur, while vigorous tropical cumulus cloud will generate updrafts of many meters a second to produce raindrops of up to 0.2 in (5 mm) in diameter. Even when drops do become large enough to fall out of the cloud, they suffer some evaporation in the subcloud layer, between the cloud-base and the surface. If the air in this layer is dry and the raindrops small, they may completely evaporate on their way down. Sometimes it is possible to observe this evaporation when shaft of rain or snow can be seen falling from clouds. The shaft will narrow toward the ground surface, vanishing above it. Such features are called virgae or fall-streaks (Reynolds '05: 77, 78).
Sleet is generally defined as snow that is melting as it settles on the surface although in the USA the term is used for very cold raindrops that freeze into small ice pellets if they fall through a fairly deep layer of air just above the surface. Freezing rain occurs when raindrops fall from a higher, above-freezing region of air into a shallow subzero layer at the surface. The rain freezes on impact with all sorts of surfaces. During an ice storm, the accumulations of frozen rain (sometimes termed glaze) are so large that telephone lines come down, tree branches snap off and walking and driving are treacherous. An accumulation of a few cm of ice is fairly common in susceptible regions - over northeastern USA for example. They can reach some 12 in (30 cm) in extreme cases. Hail comprises of large pieces of ice that form within, and fall from, a cumulonimbus cloud. Such deep convective clouds are characterized by strong updrafts and downdrafts. The hailstones grow from graupel (ice crystals), which act as a nucleus, becoming larger due to the accumulation of supercooled water droplets as they are borne upward on the rapidly ascending air. It is not uncommon for golfball-size hail to occur in the United States during the summer. Such hailstones probably will have ben up and down through the same cloud a few times - over the course of ten minutes or so - before they acquire sufficient layers of
59

ice to be heavy enough to fall out of the cloud and on to the surface. It if possible to count the number of ice layers in a large hailstone and thus gain an idea of the number of ascents it has made in the water-rich updraft. It may seem paradoxical that we see such cold, icy objects in the warmest season; it's because convective clouds reach their greatest (and coldest) elevations when the surface is most strongly heated (in the summer), and they are most moisture-laden when evaporation rates are highest (also in the summer) (Reynolds '05: 79-81).
Under normal conditions, water freezes at 32°F (0°C). However, in the atmosphere ,where water particles exist as extremely small cloud droplets, this is far from the case. Even at high altitudes within the troposphere, many cloud particles remain liquid in what is termed a supercooled state. Except at very low temperatures ,liquid water will not freeze unless minute impurities are present. These are much less likely to occur in the very small droplets that form clouds than in substantial bodies of water where freezing occurs at 32°F(0°C) (Therefore, it is better to define 32°F (0°C) as the melting point of ice). In the atmosphere, only one cloud droplet in a million is frozen at 14°F(-10°C), a couple of hundred or so in a million are frozen at -22°F(-30°C) and only at -40°F(-40°C) and below will they all be ice crystals. Ice crystals that row from vapor alone take on different characteristic shapes depending on the temperature range within which they are created. As they descend through progressively warmer layers, they become more complex in shape. Similarly complex form changes can occur if they ascend on updrafts into cooler regions of a cloud. The freezing of supercooled water on to ice crystals is a second mechanism of growth . It is known as riming, which is essentially the same process that causes the deposit of rime as a frost. The most effective surface to freeze water upon is an ice crystal, so if supercooled droplets touch one, they freeze instantly. This means that in clouds where both supercooled droplets and ice crystals are present, the crystals grow rapidly. Crystals may grow at varying rates depending on how much supercooled water freezes on to them, and larger ones can capture others as they fall at higher speeds. The icy particles formed in this manner are known as graupel, which fall and fracture when they crash into cloud droplets. Such splinters can grow into new graupel, which may fragment again to produce a chain reaction, forming very large numbers of ice crystals. As these descend, they often stick together to produce snowflakes. In fact, most of the rain in middle and higher latitudes starts life as snow, even in the summertime. Perhaps surprisingly, the heaviest snowfalls do not occur in the coldest air. Deep accumulations anywhere in the word are associated with moisture-rich air that has usually come across relatively warm seas. This is because the air must be relatively warm in order to contain large amounts of water vapor. In middle and high latitude areas, the most common mechanism for producing substantial snowfalls is the frontal low - across the Rockies, the Andes and the European and New Zealand Alps, for example. Widespread, deep accumulations are often associated with air that streams through a depression's warm sector, although temperatures must be subzero right down to the surface (Reynolds '05: 79, 80).
Lightning is a massive electrical discharge between one cloud and another, from a cloud into te air, or between a cloud and the ground, and thunder is the audible component of the process. These two always go hand in hand. Meteorologists do ot agree on the way in which electric charge become separated within thunderclouds. The leading theory is that when hail and graupel fall through a layer of supercooled water and ice crystals that form the cloud, there is a transfer f positive charge from the slightly warmer hail to the colder cloud particles. The larger hail becomes negatively charged, accumulating such charge in the lower layers of the cloud.
60

Conversely, the water and ice crystals gain positive charge and tend to accumulate in the upper reaches of the cloud on the updraft. As the lower negative charge grows with the evolution of the cloud, it induces a region of positive charge below it on the surface, which moves along beneath the drifting cloud. This positive charge tends to be concentrated on objects that protrude from the surface and that are relatively isolated. Although dry air is quite a good electrical insulator, the potential difference that will grow under the right conditions is so enormous that a massive discharge is unavoidable. A difference of about 300,000 volts/ft (1,oo,ooo volts/m( is typical and will lead to a current of up to 100,000 amperes. Lightning that reaches the ground first develops within the cloud, where electrons move rapidly down toward the base of the cloud, but in a stepped fashion. Every discharge runs for 330 ft (100 m) or so, then halts for about 50 millionths of a second before continuing downward. This process is continued as an invisible stepped "leader" until near the ground, the potential gradient is so large that an upward positive current leaves the surface from tall objects such as trees and buildings. Once these two currents meet, electrons flow down to establish a channel that is used by a larger return stroke. This massive, brilliant upcurrent is what we see, and it lasts typically for about one ten-thousandths of a second. Only about one in fie lightning strokes are from cloud to ground. Each instantly heats the channel of air through which it flows by about 54,000°F (30,000° C). This means that the air expands incredibly quickly and very dramatically to produce a shock wave, which travels away from the lightning stroke at the speed of sound. The light from lightning reaches our eyes instantaneously, but the sound of thunder emanates from it at about 1,000 ft/sec (330 m/sec). This forms the basis for a rule that we can use to estimate our distance from the ground stroke. Count the seconds between the flash and the thunder - every second indicates a distance of about 1,000 ft (330m). therefore, a pause of three seconds means that the lightning is about 0.6 mi (1 km) away. This rule holds good for distances of up to 3 mi (5 km), beyond that, we do not often hear thunder, because the sound is absorbed and refracted by the air (Reynolds '05: 81-83).
Lightning Types Diagram
61

Sometimes when the weather is showery, we see rainbows. These are visible when the Sun shines upon the falling drops - and it must be shining rom behind us as we look toward the shower. This means broadly, that in the morning, rainbows will be visible in the west, and in the afternoon, in the east. When sunlight enters a raindrop, some of it passes straight though, while the remainder is reflected back by the rear surface of the drop. The angle at which this occurs is about 42 degrees; as the light enters the raindrop, each ray is refracted slightly differently, as is each ray leaving the drop. When combined with the internal reflection, this double refraction splits the "white" sunlight that shines on to a drop into its component colors, the same way that a prism spits white light into the colors of the spectrum. When this happens within a mass of falling raindrops, we see a rainbow. Refracted red light enters our eyes from higher drops, and violet light from lower drops. As a result, the brilliant rainbow we see is red at tis top and violet at its bottom. Occasionaly, there may be fainter, but noticeable, secondary rainbow. This forms when sunlight enters the raindrops at such as angle that a double internal reflection occurs. As a result, the light that finally leaves such drops is fainter and the colors weaker (Reynolds '05: 83, 84).
Fog is defined as a condition where the horizontal visibility is 3,300 ft (1,000 m) or less because of the presence of water droplets suspended in the atmosphere. Thick fog is defined as having visibility of c. 300 ft (100 m) or less. Impaired visibility of more than 3,000 ft (1,000 m) is defined as mist. In land on a cloudless, calm night when the air has low humidity, there will be a large flow of radiation from the Earth surface and atmosphere out into space. If cloud is present, its water vapor, water droplets and ice crystals will absorb some of this outgoing energy and radiate some of it back down to the surface and lower levels of the atmosphere. Therefore, cloud -especially layer cloud -acts like an insulator. If the sky is cloud-free, but the air is humid, the water vapor present will also absorb some of the outgoing radiation and, like a cloud layer, will radiate some of it back to the surface and lower layers, keeping them warmer than they would be otherwise If however, the air has very low humidity, much of the heat will escape to space, and the surface will be much chillier. Once the Sun is low in the sky and the air begins to cool it does so most strongly at the surface . Thus the chilling tends to be most marked at and near the ground, notably on calm nights. This means that a temperature inversion will form above the surface, in which te temperature increases with height. If the conditions are calm, or near calm, the air adjacent to the surface may cool until it reaches its dewpoint. Light, subtle movements will spread the cooling through the surface layer; any stronger motion - if the wind picks up -will mix the warmer air above and the chilly layer below, destroying the conditions that favor fog formation (Reynolds '05: 84, 85).
Calm, cloud-free conditions can produce radiation fog. The world "radiation" expresses the means by which the air is cooled to its dewpoint temperature - the Earth and the atmosphere lose heat rapidly by radiating it to space. Once the fog develops and grows vertically, the effective radiating surface is no longer the ground, but the top of the fog. The temperature inversion is found at the top, too, often many feet above the ground. Radiation fog is most common when chilling is strongest, during the fall and winter, and it is confine to land areas. Its frequency depends on the distance from the sea and the local lie of the land. Such fog tends to occur more frequently across-low-lying areas, like valleys, into which cool air drains slowly during the hours of darkness. The sea cools only marginally at night - considerably less than the land surface does. In fact, marine cooling is so minimal that it does not lead to radiation fog. Another
62

frequent type of fog is hill fog, which occurs when layer cloud intersects a range of hills, reducing visibility in those portions of the hills within the cloud to half a mile (1 km) or less. Hill fog often occurs in moist warm sectors of frontal depressions, where the cloud base is low. Arctic sea smoke, occurs, occasionally, when cold air spills over much warmer water, the extreme temperature gradient through the air just above the water triggers very localized rapid ascent of bubbles of air, within which the water vapor condenses as narrow plumes These plume features are known as Arctic sea smoke or steam fog. They can occur over open water in the Arctic and over lakes in middle latitudes in the winter (Reynolds '05: 85, 88).
Cooling of the air can also occur when a warm air mass flows across a colder surface, in which case heat is transferred downward from the air. This can reduce the air temperature to its dewpoint, producing saturation, then advection fog. The critical difference between advection fog and radiation fog is the role played by air movement in its formation. The term "advection" is used almost exclusively in meteorology and oceanography, normally referring to horizontal motion that transports some property of the fluid. For example, "thermal advection" refers to the amount of heat transported by the wind or ocean currents. Advection fog is commonly found in areas of poleward moving tropical maritime air that is cooled by contact with the sea's surface. Thus, it is also known as sea fog. It occurs most often in the spring and early summer, when the sea's surface temperature is at, or recovering from its lowest. Persistently cool areas of ocean witness more frequent advection fog, although it is not very common within the tropics. Among these regions are the Grand Banks, off Newfoundland, where, in July, advection fog occurs on four out of ten day sover the cool waters of the Labrador current. It is as common over the cool Oya Shio and Kamchatka waters in the northwest Pacific, and in the Bering Strait. In higher latitiudes, sea fog is frequently found over the pack ice and open waters of the summertime Arctic Ocean and Canadian archipelago, and to some extent over the pack ice and open waters around Antarctica. Coastal advection fog often occurs where unusually cold sea water flows parallel to subtropical western continents Strong cooling of the low-level air leads to fog along the coast of northwest Africa (over the canaries Current) south west Africa (the Benguela Current), Chile (the Humboldt Current) and, perhaps most famously, the central and northern California coast. In the seas around Britain, especially to the southwest from where the tropical maritime air most often approaches, advection fog is also common. On Britain's east coast, too, the cooling of moist onshore flow leads to the development of the "fret" along the Northumbrian coast and "haar" across the coast of eastern Scotland. By definition, advection fog moves This means that even with winds of 30 knots over the sea, thick fog may still be present. However, with strengthening wind, the fog often lifts to form extensive stratiform cloud. Although advection fog is most common over the sea, it can occur over land when warm, moist air passes across a snow-covered surface or one that has recently been frosty (Reynolds '05: 86-88).
Dew forms by the direct condensation of water vapor on to the ground, most noticeably on the grass. Dew will occur under conditions that favor the generation of radiation fog. It is deposited before such fog develops, but is often observed when there is no fog at all. On these occasions, the cooling is sufficient to produce a dewfall, but is not intense enough to affect condensation within the lowest layers of the atmosphere. In regions where precipitation is generally sparse, dew can provide an important source of water for both plants and animals. The most common form of frost is hoar frost it is the equivalent of dew, but the water vapor is deposited as ice crystals in the form of scales, needles, feathers, etc. on blades of grass, bushes and other
63

surfaces. Like dew, hoar frost develops under clear, calm conditions. The temperature to which the air must cool to produce frost is not the dewpoint, but the frost-point. This is defined as the temperature to which the air must be cooled (at fixed pressure) to saturate it with respect to an ice surface, rather than a liquid water surface. A less common form of frost, which often produces dramatic forms, is rime. This occurs when supercooled cloud and fog droplets come into contact with cold surface to form masses of white ice crystals. Rime is most commonly found in upland areas during winter. Sometimes, amazing shapes may be observed because the crystals are deposited while the supercooled cloud or hill fog is in motion. The frost formation grows downstream of the object in which the deposit was first made. Visible frost does not always occur when the air temperature falls below 32°F (0°C). Sometimes the air is so dry that overnight chilling is not intense enough to squeeze any water out of the air as a deposit of frost. Nevertheless, if the surface temperature reaches or falls below 32°F (0°C), ground frost is reported (Reynolds '05: 88, 89). The global pattern of annual precipitation is strongly related to those of pressure and wind. In middle latitudes, widespread (spanning hundreds of kilometers) precipitation is generated by the ascent of warm, moist air over fronts that sweep across the oceans and adjacent continents. Frontal rain and snow move with the frontal depressions that create them. In many of the regions in the middle latitudes these traveling disturbances provide much of the rain and snow. The areas of activity vary seasonally: they tend to shift toward the pole in the summer months. These systems are responsible for a good deal of the precipitation along the extreme western flank of North America from the Gulf of Mexico to the Maritime Provinces of Canada and also across most of Europe including the Mediterranean in the fall and winter. They also affect regions from China and Japan to Kamchatka in Russia, as well as over and to the west of the southern Andes, as well as southeastern South America in the fall and winter to the southern flanks of southern Africa. Australia and New Zealand are affected during their cooler season. These depressions produce widespread precipitation over the middle-latitude oceans as well. During the summer, over middle-latitude continents, strong surface heating leads to significant showery rain. This tends to be shorter-lived and heavier than the frontal types. 20-80 in (500-2,000 mm) of precipitation falls across Europe in a typical year. The largest amounts occur in mountainous regions, especially those that abut the Atlantic Ocean and provide the first landfall for the traveling frontal systems. Broadly similar totals occur across western North America with heavier falls concentrated along the relatively narrow mountainous coastal zone from central California northward. The steep rain/snowfall gradient across this trip reflects the impact these massive coastal ranges have on frontal precipitation and the rain-shadow region to the east, where totals are below 0 in (250 mm). These mountainous regions also face the onslaught of winter depressions and suffer the snowiest conditions (Reynolds '05: 42-43).
The pattern of dry areas (with less than 20 inches - 500 mm in a year, for example) can be related to a number of causes. At the highest of northern latitudes, low precipitation values are due, in part, to the low temperatures that prevail in those regions, because the amount of water vapor contained in cold air is very small Even if the atmosphere provides a means of lifting the air to cool it enough for the water vapor to condense into clouds, little rain or snow is produced. The aridity of the middle-latitude continental interiors is partly due to a rain-shadow effect: for example, the high pains of the United States, and the dry region of western Argentina, in the lee of the Andes. Other areas, such as Siberia in Russia, which is east of the Urals and north of the
64

Himalayas, are generally arid because, in winter, the massive anticyclone suppresses any ascent and is very cold. In summer, surface heating will spark off scattered showery precipitation, but the region's remoteness from the sea means that very humid air rarely reaches it. In contrast the interior of the United States is exposed to very large incursions of moist air from the Gulf of Mexico. During the summer, these provide the essential ingredient of the torrential, thundery downpours that can be linked to severe phenomena like large hailstones or even tornadoes. The marked aridity of the Sahara, Arabia and the Thar Desert of northwest India is essentially an expression f the sinking portion of the Hadley cell. The same is true of the Australian and Kalahari Deserts, and indeed the regions of scant rainfall that stretch across the eastern tropical/subtropical oceans . Another group of arid land areas runs down western South America and Southern Africa These are affected by the presence of cold ocean currents that flow toward the equator along the coasts The Atacama and Namib Deserts are here, because the cold water suppresses any rain-producing ascent but lies under extensive layer cloud just offshore In face, at Calama in northern Chile, no rainfall at all was reported in a 400-year period up to 1971 (Reynolds '05: 44, 45).
With the very high humidity levels within the oceanic tropics, and he intense surface heating there, it is no surprise that the world's rainfall records are held by the region. The largest rainfall total for any 12 month period was recorded in Cherrapunji in the Indian tea-growing region of Assam. It returned an accumulation of 86.2 ft (26.27 m) from August 1860 to July 1861. The same station also holds the wettest month record: 9.6 ft (2.93 m( in July 1861. The largest 24 hour fall comes from the island of Reunion in the western Indian Ocean, where an unbelievable 6.1 ft (1.87 m) was recorded during 15-16 Match 1952. Sometimes hurricanes and typhoons are created within the regime of the Trade Winds, producing widespread heavy rain as well as their notoriously dangerous winds. Places where 80-120 in (2,000-3,000 mm) are observed are regions where the ITCZ is active, where mountainous costs face onshore flow, where hurricanes, typhoons or cyclones run across land areas, and where mountainous islands like Indonesia trigger locally heavy showers. Much of the heavy rainfall that falls across Southeast Asia and West Africa is monsoonal, while some of the large amounts over the Caribbean, Central America, the Phillipines, Vietnam northward to Japan, and Madagascar are produced by intense tropical cyclones. These traveling rotating storms tend to be embedded in the larger-scale northeast and southeast Trades. Often, they are born on the eastern flanks of oceans and make landfall on their western flanks. This annual pattern masks the seasonal migration of the ITCZ, so the heavy rainfall over Southeast Asia occurs during the summer monsoon. Conditions during the winter monsoon are mainly dry (Reynolds '05: 44, 45).
Fronts are significant weather features in middle and higher latitudes. Fronts are shall sloping zones that separate extensive air masses that have different values of temperature and humidity. Cold and warm fronts are the leading edges of cold and warm air masses that sweep generally toward lower or higher latitudes respectively. Typically, front slopes at about in 100, with cold fronts somewhat steeper and warm fronts somewhat shallower. A front is normally about half a mile (1 km) deep, which means that it intersects the surface across a region some 60 mi (100 km) wide. Therefore, the weather changes associated with a front do not normally occur instantly, but gradually over a transition zone Broadly, the passage of a warm front brings warmer, moister air and a veering of the wind direction. This means that the wind shifts in a clockwise direction, typically over the space of an hour or so, from southeasterly to southwesterly in the
65

northern hemisphere in the southern hemisphere, the wind will shift from northeasterly to southwesterly. The area ahead of an approaching warm front is often influenced by the signs of the advancing warm, moist air as it glides across the sloping zone between the two air masses. In fact, much of the warm air streams beyond the line where the front meets the surface. High above the Earth's surface, the first signs of cirrus cloud will occur. This can be as far as 370-430 mi (600-700 km) ahead of the warm front at the surface. As the warm from approaches point on the surface, the base of the cloud produced by the overrunning warm, moist tropical air gradually lowers. This is indicated by the gradual progression from cirrus to cirrostratus/cirrocumulus, followed by altostratus/altocumulus and a thickening into nimbostratus, which will produce precipitation that reaches the surface. Closer to the surface, the rain falling through the very damp layer below the nimbostratus cloud will evaporate a little, cooling the air slightly as a result. Sometimes, this process leads to condensation in the damp air, creating "scud" or fractostratus, clouds. These are the ragged low clouds that fly across the sky during conditions of strong winds and moderate or heavy rain. The leading edge of the warm frontal rain can occur some 120-180 mi (200-300 km) ahead of the surface front and cause a few hours of precipitation before the arrival of the warm sector air. Precipitation rates in this region would be something like a few millimeters an hour, although radar observations reveal that rain bands often occur, with heavier, localized bursts (Reynolds '05: 56, 57).
During the lifecycle of frontal systems, occlusions naturally evolve, An occluded front is a front with warm air lifted off the surface, with cool or cold air at lower levels. Because a cold front travels faster, it tends to scoop the warm air up away from the surface when it catches up
66

with the warm front. This "occlusion" grows in length with time until a low, in its dying stages, is fully occluded. At the same time, deep layers of warm, moist air ascend continuously over the gently inclined warm and cold fronts, to produce very extensive condensation in the form of cloud. Frontal systems have characteristic large-scale currents of air that move in an organized fashion. The major cloud-producing flow is called the arm conveyor belt, which streams through the warm sector ahead of the cold front. It ascends gradually from a mile or so above the ground surface, eventually flowing over the warm front up to 3 or 4 mi (5 or 6 km) above the surface. This feature is called a conveyor belt because it transports most of the all-important heat and moisture associated with frontal depressions. The very large thermal difference between the tropics and extratropics drives the atmosphere and ocean to act in such a way that they propel the warmer fluid poleward and cooler fluid equatorwards. This is, therefore, an expression of the "requirement" that the air and the sea act in a real sense and convectors, transporting heat toward high latitudes within their bodily motion. The warm conveyor belt is closely related to the massive region of cloud within the warm sector and above the warm front. This cloud is the "signature" of huge volumes of tropical maritime air that flow poleward and upward within the frontal system. Both movements act to cool the air. There is also a cold conveyor belt, which consists of air that actually approaches the warm front from ahead and sinks to move parallel to the front, undercutting the higher warm conveyor belt. Then, it ascends into the occluded front. A third current flows through the middle troposphere overrunning the travelling low as a cold, dry stream of air Behind the cold front, a huge volume of cool relatively dry polar air streams across the surface. Over the ocean areas that are commonly downstream of air bowing off cold wintertime continents, a great deal of heat and moisture is pumped up into the atmosphere when it flows across the generally warmer sea. Here, the depression is transporting cold, dry air equator-wards, and air that flows toward the equator tends to sink, becoming compressed. As a result, it is warmed by two processes; convection, and compression warming of the air that sinks between the convective clouds. This action is visible as a region of widespread, scattered convective cumulus clouds that rise essentially as bubbles from over the sea. They often produce showers, separated by bright spells, caused by the sinking air (Reynolds '05: 59, 60, 61).
The region between a warm and cold front is known as the warm sector. Quite often, it is characterized by extensive layer cloud that can produce persistently miserable conditions on exposed coasts, but may break up into pleasantly sunny condition to the lee of hills. The relative warmth, dampness and cloudiness of a warm sector are an expression of the air's origin in oceanic regions of much lower latitudes. Precipitation within this sector is generally widespread; many frontal depression exhibit a band of enhanced activity ahead of, and parallel to, the surface cold front. Visibility is often poor to moderate, and hill fog can be a problem in upland areas where the extensive low cloud has a base that is below the tops of hilly areas. The passage of a cold front, usually produces a drop in temperature and dewpoint This leads to cooler and drier conditions, in terms of absolute humidity or the amount of water vapor in the air. The polar air that streams across the surface behind a cold front generally provides better visibility because it is often unstable turning over in great depth and becoming well mixed This instability also produces showery weather, with short-lived precipitation falling from deep cumulus clouds. These characteristic are common over middle and high latitude oceans, but not over continental areas like North America. There, cold air that sweeps southward from Canada in the winter does not experience significant surface heating over the cold land surface, and tends not to generate deep convective cloud. In general, as a cold front passes, the wind veers from southwesterly to
67

westerly or northwesterly in the northern hemisphere, in the southern hemisphere, it tends to shift from northwesterly to southwesterly (Reynolds '05:57, 58).
Chapter 8 Meteorological Observation, Contrails and Cloud Seeding
The measurements that are taken routinely at weather stations across the globe are a standard set of observations laid down by international agreement through the agency of the United Nations' World Meteorological Organization (WMO) in Geneva, Switzerland. Surface weather is observed operationally on an hourly basis at busy airports and military airfields. At many other sites, however, observations are only taken every three, six or perhaps 12 hours. In these cases, it is important that they include the hours of 0000 and 1200 UTC because these are the key times on which forecasts are based. Normally, the surface observations reported every hour are dry bulb temperature, dewpoint temperature, mean-sea level barometric pressure, pressure tendency, total cloud amount cloud type and base height, horizontal visibility, wind direction and speed, present and past weather, and
precipitation total (usually 12 or 24 hour). Surface observations are then supplemented by information collected by other means, Over the last 50 years or so, global upper-air observations have developed into an essential component of the network, providing all-important information on how temperature, humidity, wind direction and speed vary up to about 12 mi (20 km) above sea level. These variables are measured by balloon borne instrument packages called radiosondes, which are released routinely four times a day- usually at 0000, 0600, 1200 and 1800 UTC (Reynolds '05: 90, 91).
Since 1960, weather satellites have orbited the Earth, not only providing operational information in regards to clouds and other information, information including profiling of temperature and humidity levels throughout the atmosphere. Radar has also evolved since World War II into a useful tool for weather analysis because it can be "tuned" to sense precipitation within about 60 mi (100 km) of the antenna. Today, for example, Canada is covered by a network of such radars, from which a national map of the extent and intensity of precipitation is produced every 15 minutes. Many their weather services have similar systems. Precipitation radars across Australia have dual purpose in some areas, where, generally, population is sparse. In such places, they are used for tracking balloons to produce estimates of wind speed and direction up through the atmosphere. The area covered by each radar is basically the same as those in Canada. The national network of Doppler radars in the USA offers a complete cover by these more sophisticated instruments. They provide maps of precipitation and low level wind fields that indicate the location of convergence lines along which the air streams together as a possible harbinger of thunderstorms (Reynolds '05: 91, 92).
68

NOAA satellites are part of a network that forms a crucial component of the global weather observing system. Currently there are two satellites in near-circular polar orbits, roughly at right angles to each other, at a height of 530 mi (850 km). The height of a satellite determines its period - the time it takes to circle the Earth once. For a NOAA satellite, this is 102.1 minutes. Today's NOAAs weigh just over 1.7 tons and require power of 475 Watts from their solar paddles when all systems are working. There are other weather polar orbiters, including the Russian Meteor series at a higher elevation of around 740 mi (1,190 km) and a period of 109.4 minutes. Polar orbiters look down at the planet from a relatively low altitude, around 620 mi (1,000 km), which is only about 0.08 of the Earth's diameter. They provide meteorologists with high-quality images along a swathe of the Earth's surface that shifts from one orbit to the next as the planet rotates beneath the satellite. If a satellite is launched to 22,400 mi (36,000 km) above the equator, its complete orbit takes 24 hours. At 2.8 Earth diameters from the Earth's surface, such a satellite is a long way out in space. This is called the geosynchronous (or geostationary) orbit, because the period of a satellite is the same as the time the Earth takes to rotate once about its axis. Thus, the satellite keeps pace with the spinning planet, racing along eastward at a speed of just over 2 mi/sec (3 km/sec) and appearing to hover over the equator. This type of orbit ensures that the satellite always sees the same "full-disk" face of the Earth, producing a new image of either all or part of the region every 30 minutes. There are five weather satellites distributed fairly evenly around the equator, operated by different agencies. Meteosat's are run by the European weather satellite organization, known as EUMETSAT; the two US GOES (Geo-stationary Operation Environmental Satellite) orbiters are overseen by NOAA and GMS (Geostationary Meteorological Satellite) is operated by the Japanese Meteorological Agency (Reynolds '05: 107, 108).
All weather satellites look down at the Earth to produce images of clouds, and many of them reveal the atmosphere's invisible water vapor, too. They do this with an instrument called a radiometer, which is capable of sensing the intensity of radiation coming from the planet. The
69

signal measured is an expression of the strength of, for example, the sunshine reflected back to space by all the surfaces being illuminated. As the sensor scans the Earth, during daylight hours, it will "see" very strong reflections, from fresh snow or the tops of very deep clouds In contrast, it will sense a weak signal from cloud-free vegetated or ocean surfaces that naturally reflect considerably less "visible" solar radiation. Cloud patterns are illustrated as various shades of white The cloud-free areas are darker shades, the tone of which depends partly on the surface viewed and its albedo or reflective strength. Generally, the ocean reflects less than 10% of sunshine falling on it and therefore appears black; the sandy Sahara is quite bright with a albedo of between 25% and 40%. Clean, dry snow reflects something like 75-95%. Clouds reflect more the deeper they are, so thin ones have albedos of 30-50%, while thicker ones are brighter with values between 60% and 90%. In addition to monitoring short wave "visible" radiation that has come from the Sun and is reflected back into space, all weather satellites image the planet in the thermal infrared, which is a waveband that our eyes do not sense.. The strength of the infrared signal varies with the temperature of the body that emits it. This will range, for example from an intensely hot, cloud-free Saharan surface (near 140-158F[60-70C]) to the frigidly cold cloud tops of equatorial cumulonimbus thunderclouds at -94F(-70C), or sometimes even colder. The hotter a body is, the stronger its signal will be. Infrared data are mapped and displayed as a black-and-white image in such a way that a strong signal appears black, and a weak one white. This way, clouds, which are colder than most other surfaces, stand out as white features. Weather satellites also sense additional wavebands, including one from which images of water vapor can also be produced. Some weather satellites provide thousands of vertical profiles each day of temperature and humidity down through the atmosphere (Reynolds '05: 109, 110).
A properly exposed weather screen will house a number of instruments. The screen is designed to ensure that the air temperatures measured really is just that - the temperature of the air flowing through it via the gaps between its sides' downward-angled slats. The reflective quality of the box's white finish combines with its insulated floor and roof to minimize any effect on the air temperature by sunshine or the temperature of the ground below the screen. Air temperature is measured by using a mercury-in-glass thermometer that is read to the nearest 0.1°C(0.1°F).This is known as a dry bulb thermometer. Also housed within the screen are the horizontally-mounted maximum and minimum thermometers which are designed specifically to record the highest and lowest temperatures that occur during a specified time period, often 24 hours from 0900 local time. The maximum thermometer is a mercury-in-glass instrument with a constriction in the narrow central thread, near the bulb. The mercury can expand unimpeded from the bulb and through the constriction as the air temperature increases. Once the temperature falls, however, the length of the mercury thread is preserve because the fluid is prevented from returning to the bulb by the constriction. Thus the maximum temperature is recorded and will remain so until the instrument is reset in the same manner as a clinical thermometer, which records body temperature using the same principle, shaken. The minimum thermometer contains alcohol rather than mercury because its lower freezing point (-156.1°F [ -114.4C]) makes it more useful in very cold regions. Alcohol expands along the thin bore of the instrument as the air temperature increases, and retreats when it cools. Suspended within the alcohol is a very thin "index", or marker, which is dragged back along the bore by the alcohol's meniscus as the air temperature falls. As the air warms once more, the alcohol will expand along the bore, leaving the index behind, and the tip furthest form the bulb will mark the minimum temperature precisely. Usually, this type of thermometer is reset once a day by gently tilting it
70

so that the index drifts back to the meniscus. The thermograph provides a continuous trace of temperature, typically over a period of a week. The pen traces temperature fluctuations on a thermogram - a paper strip chart - wrapped around a clockwork-driven drum (Reynolds '05: 92, 93, 94).
Some of the definitions of humidity used in meteorology: Absolute humidity is the maximum amount of water vapor (in grams) that can be contained in a cubic meter of the air and water vapor mixture. Specific humidity is the mass of water vapor (in grams) in a kilogram of air and water vapor mixture. Mixing ration is the mass of water vapor (in grams) present in a kilogram of dry air. Vapor pressure is the pressure exerted at the Earth's surface by water vapor contained it the atmospheric column. This varies from virtually zero to about 3% of the total pressure, which is typically 1,000 mbar. Relative humidity is the ratio, expressed as a percentage, of the actual amount of water vapor contained in a sample of air to the amount it could contain if saturated at the observed dry bulb temperature. Humidity is measured in weather screens by the wet bulb method. The bulb of a mercury-in-glass thermometer is snugly covered by a muslin bag that is kept permanently wet with distilled water supplied by a wick. Although the wet bulb temperature is read in degrees Celsius or Fahrenheit, in fact it is a measure of humidity. The wet-bulb temperature reading forms the basis of the calculations for both relative humidity and absolute humidity. The specific humidity of air that is saturated with water vapor increases with temperature. Saturated air with a temperature of 32°F(0°C) contains 3.0 g/kg; at 50°F(10°C) this rises to about 7.0 g/kg; at 68°F(20°C) it is about 14.0 g/kg; and at 86°F(30°C) it is 26.0 g/kg. A hygrometer is used to measure the amount of moisture, or humidity, in the air. Changes in humidity are recorded on a hyprogram. One type of hygrometer commonly used is the hair hygrometer, which takes advantage of the fact that horse (and human) hair lengthens and shortens as relative humidity varies. Human hair shrinks in length by some 2.5% when relative humidity reduces from 100% to 0%. A small sheaf of hair is stretched across a thin metal bar, which is connected mechanically to a pen that traces fluctuations in relative humidity on a hygrogram strip chart. This is wrapped around a rotating drum and normally is changed once a week. Other hygrometers are based on the moisture-absorbing properties of various chemicals, which become moister as the humidity increases (Reynolds '05: 97, 98).
To measure atmospheric pressure is to weigh the great mass of air that presses down upon the Earth. The pressure decreases with height through the atmosphere, because there is progressively less air above a given level. It's useful to measure because if it is analyzed on a map by drawing isobars, forecasters can immediately see the location and intensity of weather-producing features. This downward pressure can support a column of water, or other fluid, in a glass tube immersed in a reservoir at its lower end, and topped by a vacuum at its upper sealed end. Atmospheric pressure is such that at sea level, this water column would be about 33 ft (10 m) high. The high density of mercury means that its column height is a more manageable 30 in (75 cm) or so. The mercury barometer is widely used, but its reading must be corrected for the influence of the surrounding air temperature and variations in the strength of gravity. Both affect the height of the mercury column. The "station level" pressure is read to the nearest 0.1 mbar (0.1 "hectopascal" or hPa) but this reading must be adjusted to a common datum, which is mean-sea-level This entails adding a certain number of millibars to represent the pressure of an imaginary column of air between the barometer and mean-sea-level. Many homes have what are known as aneroid (without air) barometers. This type senses the pressure through small
71

distortions of a partly evacuated metal capsule. Higher atmospheric pressure will "squash" it more than lower pressure. The capsule is linked mechanically to the familiar arrow that moves around a scale of millimeters and/or inches of mercury, and of millibars. In addition, the oversimplified and often unreliable, forecasts of "dry, "change", "wet" etc. are printed on the face of the instrument alongside the scales. The drawback of a barometer is that it provides only an indication of pressure at the time it is read. More significant is the rate of change of pressure with time and the patter of pressure across the surface at mean-sea-level, because weather-producing features such as highs and lows are identified by its routine mapping. The change of pressure with time is portrayed by a barograph, an aneroid instrument with an indicating arm that traces a continuous line of pressure on a barogram, that is changed once a week (Reynolds '05: 94, 95).
The term "precipitation" encompasses all forms of water particle that fall from the atmosphere to the Earth's surface. In addition to rain it also includes drizzle, snow and hail. The most common instrument or measuring precipitation is a raingauge that is emptied once a day to provide a simple record of fall in millimeters or inches. The design varies little from country to country: often is comprises a 5 in (12.7 cm) diameter copper cylinder with its top 12 in (30.5 cm) above the surrounding surface. This height reduces the risk of water splashing in from the ground and aids the retention of snow. Precipitation that falls into the gauge runs down a funnel with a narrow aperture to minimize evaporative losses. It is collected in a vessel (often a glass bottle) that is sunk into the ground. Once a day, the observer decants the water into a tapered glass measuring vessel to determine the amount to the nearest 0.01 in (0.1 mm). Autographic raingauges are designed to provide details on the changes in precipitation and is usually changed daily, or automatically as a telemetered radio message from the gauge to a central point. A common type is the "tipping bucket" design, in which two small open metal containers on a see-saw mechanism are used to collect the precipitation. When one bucket is filled by the required amount, it tips, moving the other into position to continue collecting any further precipitation. The tipping action is registered on the strip chart trace. By international agreement, cloud amount is reported as eighths (or oktas) of the sky covered, as both individual layers of cloud and as total cloud amount. Clouds belong to one of three layers, defined simply as low, middle or high. The layer in which they occur depends on the height of their base above the surface, which varies by latitude. Cumulus clouds have a "bubbly" appearance; cirrus clouds are wispy; stratus is sheetlike; and nimbus clouds are rainbearing. These basic cloud types can be combined, hence cirrocumulus and nimbostratus, etc. The prefixes "alto" and "cirro" are applied specifically to the middle and high clouds respectively. High clouds; cirrus, cirrocumulus and cirrostratus. Middle clouds; altocumulus, altostratus and nimbostratus. Low clouds; stratus, stratocumulus, cumulus and cumulonimbus (Reynolds '05: 95, 96, 99).
Wind speed is measured by using an anemometer. The type routinely used at weather stations is the cup anemometer, which usually has three hemispherical cups mounted on a vertical shaft. The pressure exerted by the wind on the concave inner faces of the cups is greater than that on their convex outer faces, which causes the vertical shaft to rotate. The rotation rate varies with the wind speed, which is displayed on a calibrated dial marked with knots (nautical miles per hour), meters per second and other units. A properly exposed anemometer will be mounted 33 ft (10 m) above the surface. The value measured every few minutes is the horizontal wind speed, and while the vertical component is important, it is not measured routinely - typically, it is about
72

100 times smaller than the horizontal wind. In some circumstances, however, it can actually outweigh the horizontal wind speed, as with the strong vertical winds associated with very deep cumulus clouds. Combined with the anemometer is a vane that points into the wind to show the direction from which it is blowing. Movements of the vane are transmitted to an anemograph, which provides a continuous trace of direction fluctuations. A wind direction report is usually given as an average taken every few minutes, and it is expressed in degrees read clockwise from true north to the nearest ten degrees. The value of 000° is reserved for cam conditions when there is no wind. An easterly (that is, a wind blowing from the east) has a direction of 090°, a southerly blows from 180°, a westerly from 270°, and northerly from 360°. There are finer gradations, such as a southwesterly being 225°. The convention in meteorology is to report the direction from which the air flows because it is important to know its past trajectory. The temperature and humidity of the air are partly determined by the nature of the surfaces over which it approaches an observation site. Solar radiation is measured in Watts per square meter. Some observation sites use solarimeters to sense this variable, the most basic type using a device known as a thermopile, which converts, heat into electrical energy. The solar radiation takes two forms: direct and diffuse. The former reaches the instrument directly from the Sun, while the diffuse (or sky radiation) arrives after being scattered by gas molecules, dust and other particles (Reynolds '05: 100, 101).
Visibility is the distance at which an object can be seen and identified by someone with normal eyesight under normal daylight conditions. At synoptic stations, the observer must assess the poorest horizontal visibility (it may vary with direction from the vantage point used). At land stations, visibility is quoted to the nearest 100 m (about 330 ft) up to 5 km (about 3mi), and every 5 km up to a maximum of 75 km (about 48 mi). This is achieved by reference to objects at specific distances from the vantage point. If visibility is extremely poor - a visibility of less than 100 m (330 ft) - it is reported to the nearest 10 m (about 33 ft). A scale is used for marine visibility observations which are coarser and only logged once a day. Ships also report sea-surface temperature and the speed and direction of their motion. The reason for this is that pressure tendencies reported by them are not only influenced by the movement and changing intensity of weather systems but also by a ship's movement relative to weather disturbances. The use of moored and drifting buoys has increased in recent years to provide forecast centers with improved coverage of many areas of the oceans. They house automatic sensors that report, for example, dry bulb and wet bulb temperatures, wind direction and speed, atmospheric pressure and sea-surface temperature (Reynolds '05: 101, 102).
Contrails are condensation trails that happen when hot engine exhaust momentarily condenses ice crystals into pencil-thin vapor trails that quickly vanish like the wave behind a boat, like breath on a cold day. Contrails are formed when hot humid air from the engines mixes with the colder surrounding air. The rate at which contrails dissipate is entirely dependent on weather conditions and altitude. If the atmosphere is near saturation, the contrail may exist for some time. Conversely, if the atmosphere is dry, the contrail will dissipate quickly. Chemtrails, is a conspiracy theory regarding contrails that linger for hours and will spread out to form large areas of “cloud” cover. Chemtrials have returned positive for aluminum, barium, bacteria, virus, human blood, and molds. Testing of chemical or biological agents on human subjects is prohibited under 50USC(32)§1520a. The tendency for outbreaks of disease during inclement weather is better attributed to seasonal affective disorder in abusive people for wardrobe
73

purposes. Cloud seeding could be better regulated to ensure non-toxic commercial grade product use is publicly disclosed. Cloud seeding, a form of weather modification, is the attempt to change the amount or type of precipitation that falls from clouds, by dispersing substances into the air that serve as cloud condensation or ice nuclei, which alter the microphysical processes within the cloud. The most common chemicals used for cloud seeding include silver iodide and dry ice (frozen carbon dioxide). The expansion of liquid propane into a gas has also been used and can produce ice crystals at higher temperatures than silver iodide. The use of hygroscopic materials, such as salt, is increasing in popularity because of some promising research results. Seeding of clouds requires that they contain super-cooled liquid water—that is, liquid water colder than zero degrees Celsius. Introduction of a substance such as silver iodide, which has a crystalline structure similar to that of ice, will induce freezing nucleation. Dry ice or propane expansion cools the air to such an extent that ice crystals can nucleate spontaneously from the vapor phase. Seeding of warm-season or tropical cumulonimbus (convective) clouds seeks to exploit the latent heat released by freezing. This strategy of "dynamic" seeding assumes that the additional latent heat adds buoyancy, strengthens updrafts, ensures more low-level convergence, and ultimately causes rapid growth of properly selected clouds. Cloud seeding chemicals may be dispersed by aircraft (as in the second figure) or by dispersion devices located on the ground (generators, as in first figure, or canisters fired from anti-aircraft guns or rockets). For release by aircraft, silver iodide flares are ignited and dispersed as an aircraft flies through the inflow of a cloud. When released by devices on the ground, the fine particles are carried downwind and upwards by air currents after release (Sanders '10). Cloud seeding is under-regulated by local weather modification boards established under state statute and a system of mandatory public disclosure and national E.P.A. permission in response to natural disaster declarations is needed to better publish and regulate cloud seeding, and punish hostile cloud seeding. Vincent Schaefer (1906–1993) discovered the principle of cloud seeding using dry ice in July 1946. Within the month, Schaefer's colleague, the noted atmospheric scientist Dr. Bernard Vonnegut (brother of novelist Kurt Vonnegut) is credited with discovering another method for "seeding" supercooled cloud water using silver iodide. The first attempt to modify natural clouds in the field through "cloud seeding" began during a flight that began in upstate New York on 13 November 1946. Schaefer was able to cause snow to fall near Mount Greylock in western Massachusetts, after he dumped six pounds of dry ice into the target cloud from a plane after a 60 mile easterly chase from the Schenectady County Airport. From March 1967 until July 1972, the U.S. military's Operation Popeye cloud-seeded silver iodide to extend the monsoon season over North Vietnam, specifically the Ho Chi Minh Trail. The operation resulted in the targeted areas seeing an extension of the monsoon period an average of 30 to 45 days. The 54th Weather Reconnaissance Squadron carried out the operation to "make mud, not war". In 1969 at the Woodstock Festival, various people claimed to have witnessed clouds being seeded by the U.S. military. This was said to be the cause of the rain which lasted throughout most of the festival. An attempt by the United States military to modify hurricanes in the Atlantic basin using cloud seeding in the 1960s was called Project Stormfury was discontinued. The U.S. Bureau of Reclamation of the Department of Interior sponsored several cloud seeding research projects under the umbrella of Project Skywater from 1964 to 1988, and NOAA conducted the Atmospheric Modification Program from 1979 to 1993. The sponsored projects were carried out in several states and two countries (Thailand and Morocco), studying both winter and summer
74

cloud seeding. Reclamation sponsored a small cooperative research program with six Western states called the Weather Damage Modification Program, from 2002–2006. About 24 countries currently practice weather modification operationally. The largest cloud seeding system in the world is that of the People's Republic of China, which believes that it increases the amount of rain over several increasingly arid regions, including its capital city, Beijing, by firing silver iodide rockets into the sky where rain is desired. There is even political strife caused by neighboring regions which accuse each other of "stealing rain" using cloud seeding. In Australia, CSIRO conducted major trials between 1947 and the early 1960s: in the Snowy Mountains, on the Cape York Peninsula in Queensland, in the New England district of New South Wales, and in the Warragamba catchment area west of Sydney. Only the trial conducted in the Snowy Mountains produced statistically significant rainfall increases over the entire experiment. In Tasmania seeding resulted in increased rainfall by 30% in autumn and seeding has continued ever since. Russian military pilots seeded clouds over Belarus after the Chernobyl disaster to remove radioactive particles from clouds heading toward Moscow. The Russian Airforce tried seeding clouds with bags of cement on June 17, 2008, one of the bags did not pulverize and went through the roof of a house. In October 2009, the Mayor of Moscow promised a "winter without snow" for the city after revealing efforts by the Russian Air Force to seed the clouds upwind from Moscow throughout the winter. In India, Cloud seeding operations were conducted during the years 2003 and 2004 through U.S. based Weather Modification Inc. in state of Maharashtra. In 2008, there are plans for 12 districts of state of Andhra Pradesh (Sanders '10).
Part III Oceanography
Chapter 9 Oceans
Today, nearly three-quarters of the planet, 72 percent, are covered by ocean, 97 percent of the Earth's water lies in the sea. On the surface, warm waters flow in great circular gyrations and sea level rises and falls with the rhythm of the tides and the undulations of the waves. In the deep sea below, the cold ocean moves in a slow and relatively steady course. The saltiness of the sea varies from site to site. Life teems in the ocean, in the arm, comfortable waters of the tropics, in the frigid pools of the poles, and even at its greatest depths.. The water molecule - two hydrogen atoms and one oxygen atom - has some truly amazing properties. It has a large, positively charged oxygen atom on one end, and two negatively charged hydrogen atoms on the other. These oppositely charged ends act like a magnet, the positive side attracting particles with a negative charge and the negative side attracting particles with a positive charge. Water dissolves more substances in greater quantities than any other liquid. When water molecules move about freely, they are water vapor - a gas. An increase in temperature will cause the water molecules in the gas to move around faster, causing it to expand and become less dense. In cooler temperatures, the molecules slow down and some form weak bonds between their
75

hydrogen atoms, thus forming a liquid - water. The ocean can store great amounts of heat, because lots of energy must be added before the water molecules break their bonds and evaporate as water vapor. In really cold temperatures, all of the hydrogen atoms within the water molecules attach to each other in a six-sided ring and form a solid - ice. Because the angle between oxygen and hydrogen in the ice crystal is greater than in its liquid form, it is slightly more open and therefore less dense; this is why ice floats in water When seawater freezes, salt crystals cannot quite squeeze into the ice structure, so they are excluded and the salinity of the surrounding water increases. The attraction of hydrogen atoms in water also produces a high surface tension. The only liquid with a higher surface tension is mercury, well-illustrated by its ability as a liquid to form small beads and roll around. Probably the most important properties of seawater is its density. The density of seawater increases when either temperature is lowered or salt is added; conversely its density decreases when heated or fresh water is added. An increase in salinity will raise seawater's boiling point and lower its freezing point and vice versa. The oceans transport warm water on the surface and cold water below. Winds transport heat, create waves, and drive currents on the ocean's surface (Prager & Early '00: ix, 65, 76, 77, 78).
The saltiness of the see generally refers to the amount of dissolved inorganic minerals (salts) in the ocean, in scientific lingo this is called salinity. Within seawater, dissolved salts are in the form of ions, or charged particles. The most common ions - the major constituents of seawater - are chloride (55 percent by weight), sodium (31 percent), sulfate (8 percent), magnesium (4 percent), calcium (1 percent), potassium (1 percent) and bicarbonate, bromide, boric acid, strontium, and fluoride (all less than 1 percent). The ocean also contains dissolved gases (carbon dioxide, nitrogen and oxygen), nutrients (silica, nitrogen and phosphorous) and minute or trace amounts of iodine, iron, manganese, lead, mercury and gold. There are three main sources of the sea's saltiness: weathering of rocks on land, volcanic gases and circulation at deep sea hydrothermal vents. When water combines with carbon dioxide it becomes acidic. Consequently, rain tends to be slightly acidic, dissolving rocks and sediments in a slow process called weathering. Calcium carbonate rocks are particularly vulnerable to weathering by acidic rainwater. River water has less chloride and calcium and more magnesium than ocean water. Volcanic eruptions that spew gas rich in chorine and sulfate from Earth's interior account for some of the missing constituents. Deep-sea vents or chimneys occur along mid-ocean ridges where plumes of mineral-rich superheated water erupt from fissures in the seafloor. Heated by molten material below, the temperature of the water emanating from an active hydrothermal vent field can range from a warm 25°C(77°F) to a fiery 400° C (752°F). Intense pressure at vent depths some 2500 meters below the sea surface allows the water temperature to rise above its boiling point and remain as a liquid, hence the term superheated. Because the hot vent water is less dense than the surrounding cold seawater, buoyancy continues to drive it upward. In some areas, superheated water escaping from the vents becomes trapped under ledges. Some scientists estimate that the entire volume of the oceans may circulate through the underlying oceanic crust in 10 million years or less. Chemical interaction with the underlying molten material causes circulating seawater to lose magnesium and gain calcium. On average, 1 kilogram of seawater contains 35 grams of salt, 35 parts per thousand (ppt). While salinity may vary between 30 to 37 ppt, it always has the same ratio of elements (55 percent chloride, 31 percent sodium, 8 percent sulphate, etc.). Traditionally, chemists measured seawater's chloride content to determine salinity. salinity Sensors to measure salinity, temperature and pressure (for depth) are often
76

combined in an instrument package called a CTD (conductivity, temperature and depth) (Prager & Early '00: 74, 75, 76).
In a single day, the entire planet spins once around to the east. Because the circumference of Earth is great at the equator than at the poles, the Earth must move faster at the equator than at the poles for both places to rotate completely in the same amount of time. Earth moves approximately 1600 kilometers per hour (1000 mph) at about 2 degrees of latitude and 800 kilometers per hour (500 mph) at 60 degrees of latitude. The resulting Coriolis effect can be observed in that ice movements were not parallel to the wind, but at an angle some 20 to 40 degrees to the right of the wind. If the direction of flow is averaged over the entire mixed layer the net transport is about 90 degrees to the right. Ekman transport is very important along continental margins where it can cause coastal upwelling. Several regions of the world wind blows parallel to the coast and Ekman transport causes the surface water to flow offshore. To replace the offshore-flowing surface water, cold nutrient-rich water wells upward from below; this is called coastal upwelling. Areas of coastal upwelling are some of the most fertile regions in the sea. Here, phytoplankton (floating plants) use upwelled nutrients to photosynthesize and grow in prolific numbers. Then, as long as upwelling continues, zooplankton (floating animals) and small fish come to dine and prosper on the constantly replenishing smorgasbord of food. Off Peru, along South America's west coast, northward blowing winds cause upwelling and crate one of the richest anchovy fisheries in the world. Coastal upwelling also occurs off the coast of California and, during the summer, off the northeast coast of Africa. During years when El Niño is particularly powerful, coastal upwelling weakens and major fisheries typically collapse. Upwelling also occurs within the equatorial region of the sea and in the southernmost ocean (north of Antarctica). Near the equator the trade winds blow from east to west and Ekman transport causes the surface waters to deflect to the north and south, away from the equator. Cold nutrient-rich waters well upward from below and create a narrow equatorial zone of fertile water rich with life (Prager & Early '00: 83, 84, 86, 87, 88).
Ocean gyres
77

The combined effects of wind-driven motion at the sea surface and the distribution of land cause the surface waters to the global ocean to move in a series of large circular flows, called gyres. These gyres are distinct features within the world's oceans; they are separated by flow at the equator and play a major role in the transport of heat in the sea and air. Circulation in the North
Atlantic ocean illustrates how gyre systems form and operate throughout the sea today. Winds over the northern half of the North Atlantic tend to blow toward the east, and in the south, the trade winds blow toward the west. Oceanographers name winds and currents based on where they are flowing to, and meteorologists name them on where they are coming from So the trade winds that blow from the eat are easterlies to the meteorologist and westerlies to the oceanographer. With the winds blowing from the west in the north and east in the south of the North Atlantic, Coriolis and Ekman transport cause the surface water to
flow toward the middle of the North Atlantic Ocean. The convergence of surface water causes a literal pileup of water in the middle, in an area known as the Sargasso Sea . In the ocean the surface forms small rolling hills and valleys that help to drive currents. Measurements of sea surface height show that within the central Sargasso Sea there is about a 1- meter- high pileup of water. Floating materials such as plastic, tar and sargassum, a floating seaweed, tend to accumulate in the water converging in the middle of the Sargasso Sea According to historical accounts, sargassum once formed dense mats across the central region of the North Atlantic, hence the name Sargasso Sea. Sargassum can live either free-floating in the open ocean or attached to the seafloor in shallow, warm-water regions. Small, berry-shaped bladders speckle the plant and keep it afloat. With little protection and few objects to cling to in the open ocean, many small organisms live within the small clumps and great rafts of sargassum in tne Sargasso Sea. The sargassum fish with its mottled-brown coloring and seaweed-like growths loos so much like the seaweed itself that it is often hard to distinguish fish from plant. Though small, the sargassum fish is a fierce and voracious competitor. If two are placed in a fish tank, soon there will be only one. The victor may bloat guiltily to double its normal size as a result of consuming its fellow fish. Also common in the Sargasso Sea are the amazing flying fish. These fish propel themselves out of the water and glide effortlessly over the surface using their tails as rudders and out stretched fins as wings. Flying fish have been known to fly onto boat decks. Surface water continually piles up at the center of the Sargasso Sea. Consequently, a pressure gradient forces water to flow outward beneath the surface pile. As water flows outward below, Coriolis comes into play and the moving water curves to the right. This process - surface water piling up, flowing outward and to the right below the mixed layer - creates a large gyre of currents circulating clockwise in the North Atlantic. A similar pattern occurs in the South Atlantic except that because Coriolis acts to the left, the gyre circulates counterclockwise. Ocean gyres also occur in the Pacific and Indian oceans, although the Indian Ocean system is modified by seasonal changes in the monsoon winds. Around the Antarctic, where no land boundaries exist to block flow, a globe-encircling, or circumpolar, current flows around the entire Southern Hemisphere. Additionally, beneath the westward-flowing equatorial currents lies an undercurrent going in the opposite direction. Typical open-ocean currents, not including boundary currents such as the
78

Gulf Stream and its pacific counterpart, the Kurishio, flow at speeds of less than 2 kph (1 mph) (Prager & Early '00: 88-90).
Just as wind drives circulation at the ocean's surface, gravity drives flow in the deep sea. On average, the ocean is some 4 kilometers (2.5 miles) deep. Therefore, most of the ocean lies below the mixed layer. Beneath these two areas lies the deep sea. Water motion in the deep sea is slow, driven by gravity and caused primarily by changes in the density of seawater. The cooler and more salty the sea gets, the heavier and denser it becomes For the most part, it is at the surface, the interface of the air and sea, that temperature or salinity change. The cooling of the sea takes place when a chill wind blow over the surface or a cool air mass sucks the warmth out of the sea. An increase in salinity can occur with evaporation or the formation of sea ice. If the density increase due to these processes is sufficient, ocean water will slowly sink and flow downward until it reaches a level of equal density or the seafloor. Almost all of the ocean's deep water forms through the effects of cooling and freezing at high latitudes. Little bottom-water actually forms in the pacific or Indian oceans; most of it comes from the Atlantic. By far, the area that generates the most bottom water lies just south of Greenland in the North Atlantic. Here, the warm, salty waters of the Gulf Stream merge with cold waters flowing south around Greenland. When these waters collide they produce prodigious amounts of cold, salty water that cascades downward and spreads throughout the deep Atlantic. This deep-water mass is known as North Atlantic Deep Water mixes with water flowing around Antarctica and then moves into the Pacific and Indian oceans. The very densest seawater forms during the southern winter beneath the Antarctic ice shelf. Here, the water is extremely cold and very salty, so it sinks all the way to the seafloor, spreads out, and flows northward, beneath the somewhat less dense, southerly-flowing North Atlantic Deep Water. However, Antarctic Bottom Water generally stays in the Atlantic Ocean because ridges on the seafloor block its path. Cold bottom water also forms during the winter in the Arctic, but because of the surrounding continents and seafloor ridges it remains within the Arctic Ocean basin. Since there are few means of mixing water in the deep ocean, water masses tend to move as distinct layers flowing within the sea. Each water mass has a suite of characteristic properties, such as temperature, salinity, oxygen, and silica content (Prager & Early '00: 90-92).
Ocean Depths
79

In between the surface and deep waters of the sea lies the intermediate ocean. In some places, water masses form and flow into the intermediate ocean, wedged between the warm waters of the surface and cold waters of the deep sea. In the Mediterranean Sea intense evaporation creates a very salty, warm intermediate water mass that flows out through the Straits of Gibraltar, beneath less salty, incoming surface water. Even though it is warm, the Mediterranean water is so salty that when it enters the North Atlantic it spills downward to a depth of about 1000 meters, where colder water is of an equal density. Sandwiched between the upper and lower layers of the ocean, Mediterranean intermediate water forms a salty liquid avalanche spreading down and out. Scientists have nicknamed the Mediterranean water eddies as Meddies, and have tracked them for up to 7 years as they slowly drift within the intermediate depths of the sea (Prager & Early '00: 92-94).
Within the global ocean are smaller-scale features that play a supporting role in the big picture and greatly influence coastal environments. Partially enclosed, relatively large embayments of the ocean are called regional seas, or gulfs. Examples include the Gulf of Mexico, the Gulf of Maine and the Caribbean Sea. Circulation within a gulf or sea may be controlled by local changes in depth, river inflow, wind and ocean currents. Seasonal increases in river discharge can often be traced as a spreading plume of freshwater. For instance, using satellite imagery or water mass properties, the outflow or plume of South America's Orinoco River can sometimes be traced for hundreds of kilometers as it flows into the Caribbean Sea. The narrow, swift flow and incessant wanderings of the warm Gulf Stream are one of the dramatic and easily observed physical phenomena in the sea. The first chart of the Gulf Stream made by Benjamin Franklin and his whaler cousin, Timothy Folger, shows a relatively large river of water moving northward along the coast from Florida up to North Carolina, where it veers to the east, widens and continues across the North Atlantic. The Gulf Stream is approximately 50 to 75 kilometers wide, about 2 to 3 kilometers deep, and flows at a rate of 3 to 10 kilometers per hour. It has been estimated that in some areas, the Gulf Stream transports somewhere on the order of 70 million cubic meters of water each second, about a thousand times the amount of water moved by the
80

Mississippi River. When the Stream bends to the north, breaks off, and forms a ring, it is called a warm-core ring. They are usually 100 to 200 kilometers across and have a central core of warm subtropical water from th3 Sargasso Sea and cooler, outside waters that rotate clockwise. A meander nthat bends southward, breaks off, and traps cold water at its center forms a cold-core ring rotating counterclockwise. There can be 10 or more rings at a single time, each drifting slowly westward for an average of about 4 ½ months. Eventually rings coalesce with the parent Gulf Stream and disappear from view. The Gulf Stream has an important influence on climate. It is a great transporter of heat from the tropics to the poles and brings warmth to coastal lands on the East Coast of the United States and along the western shores of Europe. Tropical fish have even been found along the shores of Cape Cod, carried off-course by the Gulf Stream. To the north, where its warm waters collided with the cold waters of the Labrador current, thick banks of fog hover over the sea and land (Prager & Early '00: 96, 97, 98, 99).
Wind blowing over the ocean's surface creates not only currents but also waves - rolling and cresting of the sea. There are two forces that create the up-and-down motion of a wave; a disturbing force and a restoring force. Disturbing forces include wind, earthquakes, landslides, asteroid impacts, changes in atmospheric pressure, and the mixing of fluids with different densities. Restoring forces are gravity and the water's surface tension. Disturbing forces push or pull water into a pile, large or small. The water that creates this pile, a crest, comes from the neighboring patch of water. As the crest or pile rises, the surface of the adjacent water lowers into a trough. A restoring force such as gravity then acts on the pile, urging it downward toward a level surface. But because of inertia, the falling pile overshoots its original level and forms a new dip or trough. The falling pile pushes water into the adjacent trough and it rises into a new peak. Adjacent crests successively become troughs, troughs become crests and a wave moves through the water. Only if the crest of a wave is higher than the trough is low does the water actually move slightly forward; otherwise it just goes round and round. Wind is the most common creator of waves in the sea. At first, a wind blowing over the sea surface generates small ripples. These create a bumpy or uneven surface and make it easier for the wind to "grip" the water. If the wind continues to blow, the ripples grow and gradually form larger waves. At first, they are short and choppy and may seem to come from all directions; this is called sea. As waves spread away from the original area of generation they become rolling mounds, called swell. Swell forms because longer waves travel faster than shorter ones. Waves moving away from a storm sort themselves out into a first group of fast, long waves and a later group of slow, short waves. Once the waves reach the coast it is possible to determine how far away the original storm center was by judging the distance between the groups of long and short waves. The height of a wave in the open ocean depends on the strength and duration of the wind, the depth of the water, and the fetch, or area over which the wind is blowing. In general, stronger winds blowing over a longer fetch will produce higher waves. When waves enter shallow water, the orbital motion of the water near the bottom is flattened by friction from the seafloor and three things happen: the length of the wave shortens, it slows, and then it becomes higher. The shape of a wave breaking on the shoreline depends on the wave height, its length and the slope of the beach. Waves approaching a gently sloping shore tend to spill over and gradually release their energy across the surf zone. However, on a steeply sloping bottom, waves tend to plunge downward in a magnificent watery curl and rapidly release their energy within a relatively narrow sea. Waves approaching the coast can also create rip currents, sometimes mistakenly called rip tides. Swimmers caught in a rip current can get dragged out to sea or drowned when
81

trying to swim against the strong flow. To escape the seaward pull of a rip current and return to the beach, a swimmer should swim to the side or diagonally, not directly against the offshore flowing current. Waves can also create undertows, particularly on a steep beach, and produce along-shore currents. Undertows are typically caused by the rush of water flowing back to sea after a wave or waves have pushed it onto the shore. If a line of waves hits the beach at an angle, a weak current flowing along the shore is created. Along-shore currents are typically not dangerous, but they play an important role in sand movement down the coast (Prager & Early '00: 100-104).
Wave Formation
The rhythm of the tides, in some places, sea level oscillates once a day, and in others, twice. The water level may change only a few centimeters or may vary more than 10 meters (32 feet) each and every day. The largest sea-level variations are created where the shoreline forms a sort of funnel from the open ocean into a restricted embayment. Such is the case in the Bay of Fundy, Nova Scotia, where tides can be an unbelievable 13 meters (43 feet) high. Tides can also create fast-moving waves that travel up a river. In the Amazon, the tides combine with a narrowing of the shoreline and changes in depth to create a huge wave 5 meters (16 feet) high that regularly rushes upriver at speeds of over 20 kilometers per hour (12 mph). A similar wave, truly a tidal wave, rushes up the Fu-Ch'un River in northern China at over 25 kilometers per hour and can reach a height of some 8 meters. Each day at a specific location the tides occur about 1 hour later. The moon rotates around Earth once every 29 ½ days, so each day the moon moves a little bit more to the east relative to Earth. As Earth spins, it must rotate a little bit past its original starting point to catch up with the moon; this is why the tides are about an hour later every day. The sun also creates tides on Earth. Although the sun is much larger than the moon, it is also 400 times farther away. Because of its distance, the solar tides are, on average, less than half that of lunar tides. However when the moon and sun align during the full or new moon, their gravitational effects combine and create the highest of tides, the spring tide. When the moon is
82

near the first or third quarter, at a right angle to the sun, then the smallest of tides, the neap, occur. The cycle of spring and neap tides occurs every two weeks in sync with the moon's rotation. Additional influences on the tides, over 50 components, occur due to other orbital factors such as Earth's tilt about its own axis and the changing distance between the planets during their orbits. Computer models that incorporate all of the lunar and solar tidal components, Coriolis, the shape of the ocean basins, depth, and some baseline measurements, can now predict quite accurately the height and times of the tides throughout the world. Tides also create tidal currents during their rise (flood) and fall (ebb). Currents are strongest midway through the tide's rise and fall, and are calm or slack at high and low (Prager & Early '00: 109-113).
The ocean's influence on climate and weather can be obvious or it can be more subtle in nature Along the coast, the sea provides warmth in the winter and cooling in the summer. Winters are relatively warm in coastal cities such as Seattle, Washington, or Cape Code, Massachusetts. But in the interior of the continent at a similar latitude, winters can be brutally cold. During the summer in Miami or on the islands of the Caribbean, a cooling sea breeze provides relief from the heat and sun. In contrast, residents of inland Texas and Louisiana face hot, unrelenting heat during the summer months. The sea's surface temperature and evaporative processes also generate and steer some of the world's most powerful storms - hurricanes - and influence global weather patterns through the infamous phenomenon known as El Niño. When wind speeds exceed speeds of 120 kph (74 mph) a storm becomes a hurricane, a typhoon, or a cyclone. Although they have different names and occur in different locations these storms are al born of the same source, the ocean. The powerful and swirling fury of a hurricane develops only when certain conditions exist in both air and sea. The principal prerequisites are warm water (at least 26°C/79°F), a disturbance of Earth's wind field, and a force to cause wind to spiral (Coriolis). Hurricanes cannot form right at the equator because Coriolis is negligible. But just to the south and north conditions are ripe, particularly during the hot summer months, so hurricanes tend to form in the summer in two bands about Earth, between 4 and 30 degrees north latitudes and 4 and 30 degrees south latitudes. Storms may form and move past these boundaries, but it is within this narrow band of heat that the sea's tempests are generally born. The disturbance that typically sets the stage or a hurricane to develop is an atmospheric wave in the easterly trade winds. Every three to four day s in the Atlantic during hurricane season (June to November), an easterly wave appears in the trade winds. As the winds blow from Africa to the Americas, the wave creates a low pressure near the surface as air converges and rises to form a crest in the atmosphere. When an easterly wave occurs it may move harmlessly off to the east, but if beneath the crest there exists an extensive region of warm ocean water and lots of warm, moist air, the wave may begin to build into a mounting fury. The underlying warm water must also be deep, extending down at least 60 meters (200 feet); otherwise mixing by the wind will bring cold water to the surface and suck the heat and energy out of the growing storm (Prager & Early '00: 116, 117).
One of the most dangerous aspects of a hurricane and other storms striking the coast is surge. Storm surge occurs when the sea rises, rushes shoreward, and then pours off the land. Extensive flooding, high waves, dangerous currents, and widespread coastal erosion can be expected when the sea surges forth. Surge can result from several oceanic and atmospheric conditions. As a storm moves toward the coast, its low atmospheric pressure literally sucks water upward,
83

creating a rise in sea level. More water is driven into the growing pile of water y converging winds at the storm's center. Water may begin to flow out of the pile and surge dangerously toward shore. Strong winds also create large waves that crash onto the shore and elevate the sea even further. Storm surge is most dangerous when the storm passes, winds spiral away from shore, and water retreats back to the sea. Swift and hazardous currents erode the land and carry out to sea all that lay in their path. Hurricanes are rated Category 1 to 5. Category 1: cause minimal damage; >980 mbars central pressure, 74-95 mph wind speed, and 4-5 ft storm surge. Category 2 cause moderate damage, 979-965 mbars central pressure, 96-110 mph wind speeds, and 6-8 ft storm surge. Category 3 cause extensive damage, 964-945 mbars central pressure, 111-130 mph wind speeds, and 9-12 ft storm surge. Category 4 cause extreme damage, 944-920 mbars central pressure, 131-155 mph wind speeds, and 13-18 ft storm surge. Category 5, cause catastrophic damage, <920 mbars central pressure, >155 mph wind speeds and >18 ft storm surge . On average only about 10 percent of the easterly wves that form each year develop into full-fledge hurricanes. With a solid understanding of how hurricanes form, move and strike, coastal people can prepare wisely, warn threatened populations and try to minimize, loss of life, land and property (Prager & Early '00: 120, 121, 122).
Within the Indian Ocean and its skies above, a seasonal reversal of the winds creates a unique pattern of shifting air currents, the monsoons. During the Northern Hemisphere summer, the land in Asia and Africa heats up. Warm air rising over the land draws in air from the Indian Ocean and creates surface winds and ocean currents that flow to the north and east. A clockwise ocean gyre is thereby produced and winds pick up moisture as they blow across the warm sea surface toward land. Torrential downpours, known as monsoon rains, fall over Asia and North Africa, bringing welcome relief from the heat and water to thirsty crops. Rainfall during ht southwest monsoon is not continuous, but tends to occur in short intense bursts that are followed by 20 to 30 day mini-droughts, or monsoon breaks. During the Northern Hemisphere winter, the land cools much more rapidly than the sea, so the system reverses. Air rises over the relatively warm ocean and is drawn in from the continents. Winds and ocean currents at the surface reverse and flow to the south and west, creating a counterclockwise gyre. During the summer monsoon a swift, narrow western boundary current (the Somali Current) flows northward along the shore, and coastal upwelling within the region creates fertile waters for fishing. However, come the fall and winter reversal, the Somali Current switches direction and weakens, and coastal upwelling ceases. One of the greatest influences on the strength of the wind and intensity of rain during the monsoon season is El Niño (Prager & Early '00: 122, 123).
During an El Niño event, two major changes occur in and over the equatorial Pacific Ocean, one in the atmosphere and one in the ocean. El Niño occurs when the trade winds relax, and a wave of warm water flows eastward across the equatorial sea. Sea level falls in the western Pacific and rises in the east. Regions like the Galapagos Islands, coastal Peru, and southern California are bathed in waters that are much warmer than usual. This harms marine life. During El Niño years, warm air, heavy with moisture, rises not over the western Pacific but in the central and eastern Pacific. Torrential rains, mudslides and landslides plague the west coasts of North and South America. Meanwhile, in Indonesia and other areas of the western Pacific less rain falls and drought as well as forest fires ravage the region. El Niño also weakens the southwest monsoons over southern Asia and influences the frequency, intensity and paths of major storms. Typically, during El Niño years, fewer hurricanes occur in the Atlantic, while more numerous
84
and intense storms form in the Pacific. La Niña is less well understood than El Niño. La Niña is essentially the opposite of El Niño, characterized by unusually cold waters throughout the equatorial Pacific. The jet stream over North America shifts. Extreme winter weather strikes the northern United States. Unusually warm air in the south collides with extraordinarily cold air in the north. Conditions are ripe for warm weather events such as tornadoes (Prager & Early '00: 127, 128).
Records of sea surface temperature in the North Atlantic show periods of warm and cold that vary approximately every 10 years. During "normal" periods, an area of atmospheric high pressure sits over the Azores, and low pressure sits over Iceland. Between the two pressure centers, wind blows from North America toward Europe, while north of the Icelandic low, and to the south of the Azorian high the winds blow in the opposite direction, to the east. Periodically, the strength and position of the pressure centers oscillates, bringing changes in the surface winds, sea surface temperatures and climate. Normally, strong winds are heated over the ocean and bring warm air to northern Europe. When the pressure system oscillate, the Icelandic low moves to the south off Newfoundland and high pressure sits over northern Greenland. Cold, dry polar air then blows across to northern Europe, brining cooler summers and more severe winters. Milder conditions occur in the northeastern United States as do more nor'easter. The North Atlantic Oscillation (NAO) is related to climate oscillations over the Arctic. Although we can predict the onset of el Niño using a Pacific Ocean observing system, satellite technology and computer simulations, the underlying cause of ENSO and NAO remains a mystery. El Niño seems to occur every 2 to 7 years (Prager & Early '00: 128, 129).
The ocean's role in global warming stems principally from its huge capacity to absorb carbon dioxide and to store and transport heat. In the sea, photosynthesis by marine plants and algae, principally phytoplankton, removes great quantities of carbon dioxide form the atmosphere. Hence, the greater the growth (productivity) of phytoplankton in the sea ,the greater the removal of carbon dioxide. Within the ocean the production of limestone, in the form of calcium carbonate skeletons or shells, also reduces atmospheric carbon dioxide. However when deposits of limestone become exposed and weathered on and or are recycled at a subduction zone, carbon dioxide is released back into the atmosphere. Gas hydrates are a solid, crystalline form of water, like ice, except that they contain additional gas, typically methane, and are often found stored in ocean sediments. Large hydrate accumulations have been found undersea off the shores of North and South Caroline, and in the gulf of Mexico. Increased ocean temperatures could cause gas hydrates to dissociate, releasing massive amounts of methane gas into the atmosphere and cause undersea landslides in the process. Consequently, hydrates may, if released, significantly increase global warming as well as create a geologic hazard to offshore drilling operations. The ocean is also a great reservoir and transporter of heat. Heat from the ocean warms the atmosphere and fuels tropical storms. Heat is transported by currents from the equator to the poles. Ocean circulation, as described earlier, is strongly controlled by wind and the sea's balance of salt and heat. Clouds and water vapor in the atmosphere come mainly from the sea and strongly influence climate (Prager & Early '00: 133, 134).
During periods of warmth, sea level rises form the thermal expansion of seawater and the melting of glacial snow and ice. In times of glacial cold, sea level drops as water is trapped in ice and seawater contracts due to cooling. Today, as the climate warms, we face a rising sea, on
85

the order of 10 to 30 centimeters (4 to 12 inches) per 100 years. Some worry that if global warming continues the West Antarctic ice sheet will become unstable and collapse. If all of this ice were released into the ocean, sea level could rise an estimated 4 to 6 meters (13 to 20 feet) and cause major coastal flooding. If all the ice in both Antarctica and Greenland were to melt, sea level could rise some 65 to 80 meters (210 to 260 feet). The current shoreline would be completely submerged and inland realty would become beachfront property. The regions of the planet inhabitable by humans would be significantly reduce, while marine environments expanded. On the other hand, if climate were to swing toward another ice age, sea level could drop some 120 meters (395 feet) as it did during the last major glaciation. On a global scale global warming can raise sea level; locally however, it can cause a relative fall in sea level, as a glacier melts, the removal of the ice and snow's weight causes the land to rebound or rise. Low-lying regions like Bangladesh and coastal communities and cities such as New Orleans, which lie near or below sea level, are most at risk of flooding. Rising sea level coupled with global warming may lead to impacts such as increasingly frequent and intense flooding during storms, the spread of water-borne or related disease, loss of property and crops, and the intrusion of saltwater into coastal aquifers - reservoirs of freshwater. Some believe that global warming may prevent us from entering another ice age. Others think that the greenhouse effect will go on heating the planet and continue, if not accelerate, the rise of the sea (Prager & Early '00: 136, 138, 139, 140).
Chapter 10 Plate Tectonics
The planet's hard surface is relatively tin and composed of a series of interlocking rigid pieces, plates, that move atop a layer of hotter, more fluid material. The interior of the Earth is composed of several concentric layers. These layers can be divided in two ways - by their chemical composition or their physical properties. Earth is composed of three main layers: an outer crust (0-50 km), an intermediate rocky mantle (50-2900 km), and inner metallic core (2900-6378 km. The outermost layer, the crust, is relatively thin and includes all that we see on land or beneath the sea. Relative to the rest of the Earth, the crust is but a thin sheath covering the planet, much like the outer skin of an apple. The continental crust is less dense, thicker and composed of lighter minerals than oceanic crust. Like the portion of an iceberg that is hidden beneath the sea surface, the continents also have thick "root" of buoyant rock that keeps them sitting high above the underlying layer. Beneath the Earth's crust lies the rocky mantle, a thick layer of dense, sometimes semimolten rock, rich in iron and magnesium. A dividing line, called the Mohorovicic discontinuity, or simply the Moho, marks the division between the crust and mantle. Based on seismic wave data and rocks uplifted on land or collected at sea, it is believed that the mantes composition is similar to that of a mineral called peridiotite (a light to dark green silicate (SiO2) rock, rich in magnesium and iron). Below the mantle, some 2900 kilometers form the surface, is the core. Calculations from measurements of gravity, earthquake data, and the composition of meteorites suggest that the core is composed of a very dense metallic material, probably a mixture of iron and lead. Increasing temperature and pressure alters he physical state of Earth's internal layering. Laboratory experiments suggest that the temperature of the outer core hovers around 5000°C. Outside of the core, Earth's layers insulate the surface form its hot interior, like the lining of a thermos. Two important types of seismic waves are primary or P-waves and secondary or S-waves. Primary waves are compressional and pass through materials by jiggling molecules back and forth, parallel to the direction of travel. An important property of
86

P waves is that as the density of the surrounding material increases, so does their speed. P waves can pass through both solids and liquids. Shear or secondary waves propagate by deforming a material or shifting the molecules from side to side. S-waves can pass through solids. By studying how both P-waves and S-waves travel through Earth, scientists can estimate the relative hardness or fluidity of Earth's internal layers (Prager & Early '00: 149-151).
Near the surface, the crust and upper mantle together form a rigid hard layer called the lithosphere. The lithosphere extends from the surface to a depth of approximately 100 km beneath the oceans and 100 to 200 km below the continents. Below the lithosphere, a relatively thin zone exists in which both P-waves and S-waves slow. This low-velocity layer, approximately 100 km thick, is called the asthenosphere. The slowing of seismic waves in the asthenosphere suggests that it is partially molten or fluid-like, able to deform plastically, something similar to tar or asphalt. Below the asthenosphere, the mantle appears to harden, but its exact nature remains uncertain. Seismic discontinuities, or changes in seismic wave speed, occur at depths of 410 and 670 kilometers within the mantle and are believed to reflect changes in mineral structure (not composition). The base of the mantle, the core-mantle boundary, a 5 to 50 kilometer-thick layer exists in which seismic velocities are also reduced. S-waves cannot pass through the outer part of the Earth's metallic core; therefore, it is believed that the outer portion of the core is liquid and the inner, solid. Earth's magnetic field is thought to derive from the planet's rotation about its axis and the subsequent motions of the outer, metallic, liquid core (Prager & Early '00: 151, 152).
Layers of the Earth
Earth's surface is divided into about 15 lithospheric plates that are internally rigid and overlie the more mobile asthenosphere. The plate are irregular in shape, vary in size, and move relative to one another over the spherical surface. A single plate can contain oceanic crust, continental
87

crust, or both. They are continually in motion, in relation to each other and to Earth's rotation. At their boundaries, the plates constantly jostle and grind against one another, creating huge mountain chains or deep-sea trenches. At the border of the plates are generated the majority of the world's earthquakes, volcanoes, and tsunamis. A divergent boundary occurs where two lithospheric plates are moving away from one another. The mid-ocean ridge system, the most extensive mountain chain on Earth, is a consequence of plate divergence. At the crest of a mid-ocean ridge. Lithospheric plates move apart and molten rock from deep within the planet wells upward. When it is beneath Earth's surface, molten rock is called magma; when it erupts or oozes out above ground, it is called lava. Magma is generally a mixture of melted or crystallized minerals an dissolved gases . It is typically less dense than surrounding materials, so buoyancy drive it upward. At a mid-ocean ridge, magma rises toward the surface and erupts onto the seafloor to create new ocean crust. Here, deep in the sea, when hot lava meets cold seawater, it cools very quickly and creates dark, glassy pillow basalts. The separation of plates at a mid-ocean ridge and the creation of new oceanic crust are called seafloor spreading (Prager & Early '00: 152, 153).
Seafloor spreading occurs intermittently and at varying rates. In the Pacific Ocean, along the East Pacific Rise, new seafloor is created at a rate of approximately 6 to 17 centimeters per year. In contrast, in the Atlantic, along the Mid-Atlantic Ridge, spreading is slower, and estimated 1 to 3 centimeters per year. Variations in heat flow, the chemical composition of upwelled magma, and the structure of a ridge along its axis appear related to the spreading rate. At the Mid-Atlantic Ridge, a slow-spreading ridge, the magma is blocky, relatively viscous, and forms a steep, rocky terrain with a topographic low or valley along the rift axis. At the East Pacific Rise, a fast-spreading ridge, molten material is thinner, less viscous, and forms a flat, broad ridge with a topographic high at its center. Scientists speculate that beneath fast-spreading ridges there
88

exists a narrow zone of high heat and melting. Seismic evidence and three-dimensional imaging suggest that 1 to 2 kilometers beneath the East Pacific Rise lies a thin horizontal layer of molten materials that feeds the spreading center At slow-spreading ridges the axis appears to be cooler, thicker, and subject to greater faulting and earthquake activity. The Mid-Atlantic Ridge runs smack through the middle of Iceland. Consequently, in Iceland scientists are availed an uparalleled look at the processes of rifting along a slow-spreading mid-ocean ridge. Rifting occurs by a slow widening and sinking at the ridge axis, until a breaking point is reached and fractures occur. Cracks being to form parallel to the rift, earthquakes jolt the region, and lava erupts through some of the fissures. Along the world's mid ocean ridges and their associated fracture zones are sites of active hydrothermal activity, known as deep-sea vents (Prager & Early '00: 153, 154).
New crust continually forms at the mid-ocean ridges, but Earth's size has not changed significantly for millions, if not, billions of years. Crust destruction occurs where two lithospheric or tectonic plates collide. There are essentially three types of collisions: (1) Continental-continental collisions. When two plates collide and each is composed of continental crust, towering mountains are created. When India crashed into Asia some 50 million years ago, the crumping and crashing of the edges of the plates created the towering Himalayan Mountains. (2) Oceanic-oceanic collisions. The Marianas Trench off the coast of the Philippine Islands in the Pacific Ocean is some 11 kilometers deep, the deepest site in the sea. Beneath the Marianas Trench two plates of oceanic crust are colliding, the Pacific plate and the Philippine plate. When two oceanic plates converge, usually the older, denser plate is driven beneath the younger, less dense plate. (As ocean crust ages and spreads away from a mid-ocean ridge, it cools and its density increases). However, exceptions do occur; the younger Caribbean plate is inexplicably being driven beneath the other, it is called subduction, and the area in which this occurs is called a subduction zone. Ocean trenches are the surface expression of a subduction zone. During the subduction process, water deep within Earth is thought to be an important lubricating agent, allowing one plate to slide over another. Even so, the subduction of Earth's crust produces the planet's largest and most devastating earthquakes. These earthquakes and the associated deformation of the seafloor can also spawn towering tsunamis. Additionally, high temperature deep in the subduction zone melts the down-going slab and generates molten rock. Driven by buoyancy the hot magma flows upward through fractures in the overlying rock and can erupt at the surface to form a chain or arc of active volcanoes behind the subduction zone An arc of volcanoes known as the "Ring of Fire" rims the Pacific Ocean. Seventy-five percent of Earth's active volcanoes and most of the planet's earthquakes and tsunamis occur within the Pacific's infamous Ring of Fire. (3) Oceanic-continental collisions. Since oceanic crust is denser than continental crust, when the two collide oceanic crust is forced downward beneath continental crust. For instance, at the Peru-Chile trench the oceanic Nazca plate is being driven beneath the South American continent, part of the South American plate. Behind the subduction zone, great upheavals of the land and slow continuous uplift have created the lofty Andes Mountains. During collisions of oceanic and continental crust, or oceanic and oceanic crust, some of the sediment and rock on the down-going slab may be scraped off and pasted onto the overriding plate. The island of Barbados is built on a wedge of material scraped off the Caribbean plate as it dives beneath the South American plate (Prager & Early '00: 155-157).
89

Transform faults are where two plates slide in opposite directions past one another. Across the mid-ocean ridges transform faults create numerous fracture zones. Shallow earthquakes are common along transform faults. The most famous - or infamous, as the case may be - transform fault is California's San Andreas fault. Here, the Pacific plate, which includes part of California, is moving approximately 1 to 6 centimeters per year northwest against the southeast moving North American plate, which includes the rest of the state. If plate motion continues, sometime in the distant future San Francisco and Los Angeles will reside at the same latitude. There are fixed places inside Earth's mantle that are unusually hot. Here, rising heat and erupting magma generate a series of volcanic features such as sea-mounts or volcanic islands that trace the movement of the plate over the hot spot. The Hawaiian Island chain is the most well- known product of a hot spot. As the Pacific plate moves over an underlying hot spot, the Hawaiian Island are created. Hawaii is a relatively recent hot-spot creation, but now a new submerged volcano, name Loihi, is forming to its southeast. By dating rocks on the island, scientists have determined that the Pacific plate has moved an average of 8.6 centimeters per year for at least 70 million years. A bend in the island chain suggests that some 40 million years ago, the movement of the Pacific plate changed direction, from north to northwest. Hot spots occur less commonly under the continents. The famous geysers, boiling mud pools, and steaming landscapes of Yellowstone National Park are thought to result from a hot spot underlying the North American continent. Hot-spot activity was five to ten times greater 100 million years ago (Prager & Early '00:157-159).
Plate motion appears to be driven mainly by convection within Earth's mantle layer and pull from plate subduction. The asthenosphere, a thin layer in the upper mantle, is believed to be partly molten. Heat from deep within the planet is thought to cause very slow convection currents. The heat source for convection within the asthenosphere comes from deep in Earth's
90

interior, fueled by the decay of naturally radioactive materials (e.g. uranium, plutonium, thorium) and heat from the early formation of the planet. Uneven heating causes thermal plumes to rise at midocean ridges and cooling near the surface creates descending plumes at subductin zones. In between, the asthenosphere moves horizontally from beneath a spreading center - a ridge - to a subduction zone - a trench. Friction between the lithosphere and the asthenosphere acts like glue, and the lithospheric plates are dragged along by the motion of the underlying asthenosphere. At subduction zones, gravity pulls the slabs of cold, dense oceanic crust down into the mantle (Prager & Early '00: 160, 161).
Deep Ocean Trenches
The deepest trenches occur in the Pacific: the Marianas, 10.9 km; the Tonga, 10.8 km, the Philippine, 10 km. Trenches are shallower where sediments spill into and pile up within the undersea crevasses: the Puerto Rico Trench, 8.6 km deep. Between the continents, trenches, and mid-ocean ridges lie broad, flat undersea plains speckled with underwater peaks and seamounts. This is the realm of the abyssal plain, the flattest region on Earth. Here, sediments raining down from above bury the rough, underlying volcanic terrain and form a smooth, low seafloor that averages about 3 to 5 kilometers in depth. In some areas, the abyssal plains are dotted with domes or elongated hills made up of volcanic rock with a thin veil of overlying sediment. Seamounts which were once active volcanoes, may rise steeply above the seafloor and occur singly, as a chain, or a in a cluster of peaks. Some seamounts are flat-topped. Along the edge of the ocean lies the continental margin, the interface between land and sea. Here the land begins to slope into the abyss, sediment flows form the continents offshore, and ancient rivers and underwater avalanches carve out deep submarine canyons. In some area, the land slopes gradually into the sea, forming a broad, flat shelf, while in other settings the transition is quick and narrow. The continental shelf, a flat brim bordering the ocean, averages about 60 kilometers in width, though it can be as wide as 1000 kilometers in the Arctic Ocean or as narrow as a few kilometers along the Pacific coast of North and South America. At a depth of about 130 to 200
91

meters, the continental shelf steepens to form the continental slope. Sediments worn form the land pile up beneath the continental shelf and slope, and in some areas, huge submarine canyons cut deep submarine canyons into their surface, that act as chutes, transporting sediments from the land into the sea. The continental rise can extend into the deep ocean for hundreds of kilometers, reaching depths of some 4000 meters and the abyssal plains (Prager & Early '00: 163, 164).
Ocean sediments cover most of the seafloor, forming a geologic cloak that hides the dark underlying volcanic crust . Undersea mountain peaks appear as if snow-topped, while the ocean's edges are often lines with sparkling grains of sand. Marine sediments are particles of organic or inorganic matter that accumulate in the ocean in a loose, unconsolidated form. Depending on their size, sediments are called mud (0.001-0.032 mm) sand (0.063-2 mm) or gravel (2-10 cm). Mud can be further divided into clay (0.001-0.004 mm) and silt particles (0.004-0.063 mm). The size, shape, and density of a grain determines how it moves in the ocean. Over time compaction, crystallization and cementation can transform the sea's loose sediments into hardened rock. In the shallow sea and at its edges, sediments can accumulate relatively fast, on the order of 5 to 30 centimeters per 1000 years, and reefs can grow even faster, up to 10 meters per 1000 years. In the deep sea, however, where sediments rain down in an endless underwater snowfall, accumulation rates are very slow, on the order of 1 to 25 millimeters per 1000 years. It may take 50 years for an individual particle to descend form the surface to the seafloor. Due to the chemistry of the oceans, silica tends to dissolve near the surface and calcium carbonate in the deeper sea. For a biologic ooze to accumulate there must be a great abundance of organisms growing in the overlying water, and the depth and chemistry of the sea must be conducive to preservation (Prager & Early '00: 165, 177, 179).
Marine sediments are generally divided into four groups: glacial, terrigenous, siliceous, and calcareous. Glacial sediments, those associated with the frigid grip of ice, tend to accumulate mainly in a broad band of gravel encircling the shores of Antarctica. Other much small regions of glacial debris are found in the far north, for instance, just east of Greenland Terrigenous (land-derived) sediments rim the continents are of particular abundance where rivers enter the sea. Siliceous sediments, primarily diatom and radiolarian oozes, occur in three distinct stripes, along the equator and at high latitudes, both north and south. The distribution of silica-rich sediment in the sea reflects mainly the depth and fertility of the overlying waters. In zones of upwelling, great quantities of siliceous shells rain down from above, and become part of the sediment. In deep regions red-brown clay coats the seafloor. The distribution of calcium carbonate in deep marine sediments differs from either silica or clay and coincides with the location of the mid-ocean ridges. It is the whitish, calcareous oozes that produce the "snow-tipped" peaks of the underwater realm. Silica tends to dissolve near the surface, calcium carbonate dissolves in the deeper sea. The increase in pressure and decrease in temperature with depth causes calcium carbonate to dissolve. On average, below about 4 to 5 kilometers, almost all calcium carbonate is dissolved. Consequently, on those areas of the seabed that rise above a depth of 4 to 5 kilometers, such as the peaks of undersea mountains, are blanketed by the white of millions of tiny calcium carbonate shell. The level at which complete dissolution of calcium carbonate occurs is shallower in the Pacific than in the Atlantic. In a core sample where the sediment layers are intact and undisturbed, younger sediments overlay older sediments. The thickness of a sediment layer is a measure of time and the process that produces it. The
92

sediments near the bottom of a core will have been compressed more than those near the top. Mixing by marine organisms can blur layering (Prager & Early '00: 183, 184).
Sediment sampling is often done with a towed dredge or a mechanical scoop dropped from a ship. Sediments may also be collected using SCUBA gear, submersibles, remotely operated vehicles, or a sediment trap. Sediment traps typically consist of an open funnel-shaped top attached to an underlying collecting up. These simple but effective devices are placed on the seafloor or hanging within the water and left over time to collect marine sediments as they rain down from above. The first major seafloor coring was done by the Deep Sea Drilling Project (DSDP) and is now being accomplished by its successor, the Ocean Drilling Program (ODP). Today, the ODP has drilled throughout the world's oceans, including in water depths of almost 6000 meters in the oldest part of the Pacific Ocean, and cores have reached some 2111 meters below the surface of the seabed. Global positioning system (GPS) lets scientists accurately map sampling sites in the ocean. Using one receiver on Earth's surface, the precision of GPS is on the order of meters. However, GPS does not work underwater, so positions must be located at the sea surface and then correlated to sites on the seabed (Prager & Early '00: 180, 181).
The Federal government did not largely regulate natural gas and oil exploration and development activities in the offshore regions of the United States from the 1880s, when offshore oil production first began, through the mid-1900s. Today, there are around 4,000 platforms producing in Federal waters up to roughly 7,500 feet deep and up to 200 miles from shore. The offshore has accounted for about one-quarter of total U.S. natural gas production over the past two decades and almost 30 percent of total U.S. oil production in recent years. Hydraulic fracturing is used after the drilled hole is completed. Fractures are created by pumping large quantities of fluids at high pressure down a wellbore and into the target rock formation. Hydraulic fracturing fluid commonly consists of water, proppant and chemical additives that open and enlarge fractures within the rock formation. These fractures can extend several hundred feet away from the wellbore. The proppants - sand, ceramic pellets or other small incompressible particles - hold open the newly created fractures. The first use of hydraulic fracturing to stimulate oil and natural gas wells in the United States was in the 1940s. Coalbed methane production began in the 1980s; shale gas extraction is even more recent. The main enabling technologies, hydraulic fracturing and horizontal drilling, have opened up new areas for oil and gas development, with particular focus on natural gas reservoirs such as shale, coalbed and tight sands. Hydraulic fracturing combined with horizontal drilling has turned previously unproductive organic-rich shales into the largest natural gas fields in the world. The Marcellus Shale, Barnett Shale and Bakken Formation are examples of previously unproductive rock units that have been converted into fantastic gas or oil fields by hydraulic fracturing. Experts believe 60 to 80 percent of all wells drilled in the United States in the next ten years will require hydraulic fracturing to remain operating. A variety of environmental risks are associated with offshore natural gas and oil exploration and production, among them such things as discharges or spills of toxic materials whether intentional or accidental, interference with marine life, damage to coastal habitats owing to construction and operations of producing infrastructure, and effects on the economic base of coastal communities (Mastrangelo '05).The use of hydraulic fracturing to open underground natural gas formations has a low risk of triggering earthquakes. There's a higher risk of man-made seismic events when wastewater from the fracking process is injected back into the ground, Earthquakes attributable to human activities are called “induced
93

seismic events” or “induced earthquakes.”(1) the process of hydraulic fracturing a well as presently implemented for shale gas recovery does not pose a high risk for inducing felt seismic events; (2) injection for disposal of waste water derived from energy technologies into the subsurface does pose some risk for induced seismicity, and (3) Carbon Capture Storage (CCS), due to the large net volumes of injected fluids, may have potential for inducing larger seismic events.
An earthquake is a shaking of the ground caused by a sudden release of energy within the Earth. Most earthquakes occur because of a natural and rapid shift (or slip) of rocks along geologic faults that release energy built up by relatively slow movements of parts of the Earth’s crust. The numerous, sometimes large earthquakes felt historically in California and the earthquake that was felt along much of the East Coast in August of 2011 are examples of naturally occurring earthquakes related to Earth’s movements along regional faults (see also Section 1.2). An average of ~14,450 earthquakes with magnitudes above 4.0 (M>4.0) are measured globally every year. This number increases dramatically—to more than 1.4 million earthquakes annually—when small earthquakes (those with greater than M 2.0) are included.Earthquakes result from slip along faults that release tectonic stresses that have grown high enough to exceed a fault’s breaking strength. Strain energy is released by the Earth’s crust during an earthquake in the form of seismic waves, friction on the causative fault, and for some earthquakes, crustal elevation changes. Seismic waves can travel great distances; for large earthquakes they can travel around the globe. Ground motions observed at any location are a manifestation of these seismic waves. Seismic waves can be measured in different ways: earthquake magnitude is a measure of the size of an earthquake or the amount of energy released at the earthquake source, while earthquake intensity is a measure of the level of ground shaking at a specific location. The distinction between earthquake magnitude and intensity is important because intensity of ground shaking determines what we, as humans perceive or feel and the extent of damage to structures and facilities.magnitude is also closely tied to the earthquake rupture area, which is defined as the surface area of the fault affected by sudden slip during an earthquake. A great earthquake of M 8 typically has a fault-surface rupture area of 5,000 km2 to 10,000 km2 (equivalent to ~1931 to 3861 square miles or about the size of Delaware which is 2489 square miles). In contrast, M 3 earthquakes typically have rupture areas of roughly 0.060 km2 (about 0.023 square miles or about 15 acres, equivalent to about 15 football fields). “Felt Earthquakes” are generally those with M between 3 and 5, and “Damaging Earthquakes” are those with M>5.Most naturally occurring earthquakes occur near the boundaries of the world’s tectonic plates where faults are historically active. However, low levels of seismicity also occur within the tectonic plates. A larger magnitude earthquake implies both a larger area over which crustal stress is released, and a larger displacement on the fault. Most existing fractures in the Earth’s crust are small and capable of generating only small earthquakes. Thus, for fluid injection to trigger a significant earthquake, a fault or faults of substantial size must be present that are properly oriented relative to the existing state of crustal stress and these faults must be sufficiently close to points of fluid injection to have the rocks surrounding them experience a net pore pressure increase. (National Research Council '12).
More than 700,000 different wells are currently used for the underground injection of fluids in the United States and its territories. Underground nuclear tests, controlled explosions in connection with mining or construction, and the impoundment of large reservoirs behind dams
94

can each result in induced seismicity. Energy technologies that involve injection or withdrawal of fluids from the subsurface also have the potential to induce seismic events that can be measured and felt. Globally there have been 154 reported induced seismic events, in the United States there have been a total of 49 induced seismic events documents ,respectively caused by Waste water injection 11 (9); Oil and gas extraction (withdrawal) 38 (20); Secondary recovery (water flooding) 27 (18); Geothermal energy 25 (3); Hydraulic fracturing (shale gas) 2 (1); Surface water reservoirs: 44 (6) and Other (e.g. coal and solution mining) 8 (3). There have probably been other events, including catastrophic intentionally caused earthquakes such as the one that levelled Port au Prince in Haiti in 2010 and the Japanese tsunami in 2011.
Chapter 11 Oceanic Observation, Heat Pumps and Dead Zones
The Cold War saw extensive efforts to control the weather for both aggressive and peaceful purposes. It met with little success, although the US military claims it used weather-modification techniques to impede the flow of soldiers and material along the Ho Chi Minh Trail during the Vietnam War. In 1976 the nations of the world outlawed military manipulation of the weather by adopting the Convention on the Prohibition of Military or Any Other Hostile use of Environmental Modification Techniques (ENMOD) which has been ratified by the major powers, including China (Hamilton ’10: 187, 219). Three major environmental treaties were ratified by the United Nations Conference on Environment and Development in Rio de Janeiro, “Earth Summit”, from 3 to 14 June 1992 guided by Agenda 21: The Rio Declaration. The treaties are the Framework Convention on Climate Change of 9 May 1992, the Convention on Biological Diversity of 5 June 1992, and the Statement on Forest Principles of 14 August 1992. Three autonomous international organization were established by the United Nations Division on Ocean Affairs the Law of the Sea when the 1982 United Nations Convention on the Law of the Sea entered into force with the 1994 Agreement relating to the Implementation of Part XI. (1) The International Seabed Authority, which has its headquarters in Kingston, Jamaica, came into existence on 16 November 1994, upon the entry into force of the 1982 Convention. (2) The Tribunal of the Law of the Sea came into existence following the entry into force of the Convention on 16 November 1994. After the election of the first judges on 1 August 1996, the Tribunal took up its work in Hamburg on 1 October 1996. The official inauguration of the Tribunal was held on 18 October 1996. (3) The Commission on the Limits of the Continental Shelf established a subsidiary body - the Standing Committee on provision of scientific and technical advice to coastal States, in June 1997, at its first session.
In 1998, as part of the United Nation's International Year of the Ocean, the Department of Commerce and Department of the Navy cohosted the National Ocean Conference in Monterey, California. The participants found the United States should, join the 1982 U.N. Convention on the Law of the Sea and the accompanying 1994 Agreement to implement Part IX of the Convention on the Law of the Sea (incorrectly remembered by the U.S. as the Seabed Mining Agreement) to address issues such as military and commercial navigation, fishing, oil and gas development, offshore mining, and scientific research (Preger & Early '00: 282) which the United States President and appearing Senate have apparently not ratified as of 2014. The USA is party to the 1995 Agreement Relating to the Conservation and Management of Straddling Fish
95

Stocks and Highly Migratory Fish Stocks. The U.S. is highly encouraged to adopt the 1982 U.N. Convention on the Law of the Sea and 1994 Agreement to implement Part IX, with a focus on searching for and exploiting polymetallic nodules in socio-economic cooperation with the U.N., to better protect North American coasts against (a) strategically placed industrial hydrocarbon fueled heat and cooling pumps of rail container size, with remote thermostats, and (b) illicit drilling and hydraulic fracturing (fracking) on any faults.
"Dead zone" is a more common term for hypoxia, which refers to a reduced level of oxygen in the water. Less oxygen dissolved in the water is often referred to as a “dead zone” because most marine life either dies, or, if they are mobile such as fish, leave the area. Hypoxic zones can occur naturally, but scientists are concerned about the areas created or enhanced by human activity. Excess nutrients (nitrogen and phosphorus) that run off land or are piped as wastewater into rivers and coasts can stimulate an overgrowth of algae, which then sinks and decomposes in the water. Dead zones in the coastal oceans have spread exponentially since the 1960s and have serious consequences for ecosystem functioning. Enhanced primary production results in an accumulation of particulate organic matter, which encourages microbial activity and the consumption of dissolved oxygen in bottom waters depleting availability to marine animals. Dead zones have now been reported from more than 400 systems, affecting a total area of more than 245,000 square kilometers, and are probably a key stressor on marine ecosystems (Diaz & Rosenberg '10). Dead zones occur in many areas of the country, particularly along the East Coast, the Gulf of Mexico, and the Great Lakes, but there is no part of the country or the world that is immune. The second largest dead zone in the world is located in the U.S., in the northern Gulf of Mexico. Temperature is also a factor, and biodiversity must be a considered in the environmental impact assessment of legitimate oceanic heat pump operations. Even small changes in water temperature can affect the growth, feeding behavior and reproduction of marine organisms, many of which are sensitive to thermal increases of just a degree or two above normal. Confronted with continued ocean warming, these species may be forced to adaptor relocate to cooler waters, or even face possible extinction. Conversely, rising ocean temperature can also make it easier for invasive species that favor warmer waters to expand into new areas, displacing native marine life and disrupting ecosystem structure. Ocean warming has also been linked with outbreaks of marine disease.
96

Pressure is the force per unit area exerted by water (or air in the atmosphere) on either side of the unit area. The units of force are (mass length / time^2) which you can remember from Newton's Law F = ma. The units of pressure are (force / length^2) or (mass /[length time^2]). cgs: dynes/cm^2. mks: Newtons/m^2 and 1 Pascal = 1 Newton/m^2. Atmospheric pressure is usually measured in bars. 1 bar = 10^6 dynes/cm^2 = 10^5 Pascal. Ocean pressure is usually measured in decibars. 1 dbar = 10^-1 bar = 10^5 dyne/cm^2 = 10^4 Pascal.The force due to pressure comes from the difference in pressure from one point to another - i.e. the "pressure gradient force" since the gradient is the change over distance. The force is in the direction from high to low pressure, hence we say the force is oriented "down the pressure gradient". In the ocean, the downward force of gravity is balanced mostly by an upward pressure gradient force. That is, the water is not accelerating downwards - instead it is kept from collapsing by the upward pressure gradient. Therefore pressure increases with increasing depth.The pressure at a given depth depends on the mass of water lying above that depth. (Hydrostatic equation given in class.) If the pressure change is 100 decibars (100 dbar), gravity g = 9.8 m/sec^2, and density is 1025 kg/m^3, then the depth change is 99.55 meter. The total vertical variation in pressure in the ocean is thus from near zero (surface) to 10,000 dbar (deepest). Horizontal pressure gradients drive the horizontal flows in the ocean (which are much much stronger than the vertical flows). The horizontal variation in pressure in the ocean is due entirely to variations in the mass distribution. Where the water column above a given depth (or rather geopotential surface, parallel to the geoid) is heavier because it is either heavier or thicker or both, the pressure will be greater. Note that the horizontal pressure differences which drive the ocean currents are on the order of a
97

decibar over hundreds or thousands of kilometers, that is, much smaller than the change in pressure with depth. Until recently, and possibly still in some circumstances, pressure was measured using a pair of reversing thermometers - one protected from seawater pressure by a vacuum and the other open to the seawater pressure. They were sent in a pair down to whatever depth, then flipped over, which cuts off the mercury in an ingenious small glass loop in the thermometer. They were brought back aboard and the difference between the mercury column length in the protected and unprotected thermometers was used to calculate the pressure. Quartz transducer is now used with electronic instruments. The accuracy is 3 dbar and the precision is 0.5 dbar.
The ocean can be divided into three vertical zones, depending on temperature. The top layer is the surface layer, or mixed layer. This layer is the most easily influenced with solar energy (the sun's heat), wind and rain. The next layer is the thermocline. Here the water temperature drops as the depth increases. The last layer is the deep-water layer. Water temperature in this zone decreases slowly as depth increases. Water temperature in the deepest parts of the ocean is averages about 36°F (2°C). The ocean has a wide range of temperatures from the almost 100°F (38°C) shallow coastal waters of the tropics to the nearly freezing waters of the poles. The freezing point of seawater is about 28.4°F (-2°C), instead of the 32°F (0°C) freezing point of ordinary water, due to salt. As seawater increases 5 ppt in salinity, the freezing point decreases by 0.5°F. Temperature units used in oceanography are degrees Celsius. For heat content and heat transport calculations, the Kelvin scale for temperature should be used. In the special case when mass transport is zero across the area chosen for the heat transport calculation, degrees Celsius can of course be used. Most oceanographic applications of heat transport rely on making such a mass balance. 0 C = 273.16 K. A change of 1 deg C is the same as a change of 1 deg K.
98

Temperature is measured by (1) Reversing mercury thermometers. These were invented by Negretti and Zamba in 1874. Accuracy is 0.004C and precision is 0.002C. (2) Thermistors for electronic instruments, including replacement for reversing thermometer pairs. Quality varies significantly. The best thermistors commonly used in oceanographic instruments have and accuracy of 0.002C and precision of 0.0005-0.001C. Heat per unit volume is computed from temperature using Q = density*specific heat*T where Q is heat/volume and T is temperature in degrees Kelvin. Units of heat are joules (i.e. an energy unit). Heat change is expressed in Watts (i.e. joules/sec). Heat flux is in Watts/meter^2 (energy per second per unit area). To change the temperature by 1C in a column of water which is 100 m thick and 1 m^2 on the top and bottom, over a period of 30 days, requires what heat flux? The density of seawater is about 1025 kg/m^3 and the specific heat is about 3850 J/(kg C). The heat flux into the volume must then be density*specific heat*(delta T)*volume/(delta t) where T is temperature and t is time. This gives a heat change of 100 W. The heat flux through the surface area of 1m^2 is thus 100 W/m^2.When making a heat calculation within the ocean, where pressure is non-zero, use potential temperature. Pressure in the ocean increases greatly downward. A parcel of water moving from one pressure to another will be compressed or expanded. When a parcel of water is compressed adiabatically, that is, without exchange of heat, its temperature increases. (This is true of any fluid or gas.) "Potential temperature" is the temperature which a water parcel has when moved adiabatically to another pressure. In the ocean, the sea surface is the "reference" pressure for potential temperature - temperatures parcels are compared as if they have been moved, without mixing or diffusion, to the sea surface. Since pressure is lowest at the sea surface, potential temperature (computed at surface pressure) is ALWAYS lower than the actual temperature unless the water is lying at the sea surface. Just as wind drives circulation at the ocean's surface, gravity drives flow in the deep sea. On average, the ocean is some 4 kilometers (2.5 miles) deep. Therefore, most of the ocean lies below the mixed layer. Near the surface and
99

in the mixed layer, oceanographers use drifters and stationary current meters to measure flow. Just below that, they use sea surface height, gravity and pressure differences to calculate flow. But beneath these two areas lies the deep sea. Here measuring or calculating low is much more difficult. In fact, the least about the area that makes up 90 percent of total volume of the ocean. Water motion in the deep sea is slow, driven by gravity and caused primarily by changes in the density of seawater. The cooler and more salty the sea gets, the heavier and denser it becomes For the most part, it is at the surface, the interface of the air and sea, that temperature or salinity change. The cooling of the sea takes place when a chill wind blow over the surface or a cool air mass sucks the warmth out of the sea. An increase in salinity can occur with evaporation or the formation of sea ice. If the density increase due to these processes is sufficient, ocean water will slowly sink and flow downward until it reaches a level of equal density or the seafloor. By identifying and tracking these properties with depth, oceanographers can trace water masses as they move throughout the ocean. One of the most common ways to sample water in the deep sea is to use a specially designed collecting device called a Niskin Bottle. A Niskin Bottle is an ingenious and inexpensive piece of equipment (though getting it into the deep sea is very costly). The bottle, usually made of thick gray PVC tubing, is attached to a cable, directly or as part of a large sampling unit, and lowered into the sea. On the way down, both the top and bottom of the bottle are kept open. Once the depth to be sampled is reached, a triggering mechanism releases the lids and the bottle is snapped shut. With the seawater tightly seals inside, the Niskin Bottles are then raised to the surface. Using a CTD and numerous Niskin Bottles that trigger at various depths, researchers can sample at a location and with subsequent chemical analyses identify the different water masses present throughout the water column. To precisely measure the sea's flow in the horizontal as well as the vertical direction, oceanographers can also use sound waves via shipboard and stationary instruments called acoustic Doppler current meters. To track flow at depth, researchers can use specially designed drifters. The most recent version of this type of float is called Argo drifter and is being used to trace ocean currents and make measurements at depths of up to 2000 meters, in ten day drift periods (Prager & Early '00: 92-94).
The Gulf Stream system has three named components - the Florida Current where it passes between Florida and the Bahamas, the Gulf Stream where it flows along the coast of the U.S. and the Gulf Stream Extension after it separates from the coast. The warm part of the Gulf Stream comes from the Gulf of Mexico, in which the circulation is first confined through the Yucatan
100

Channel (between the Yucatan Peninsula and Cuba) and then forms a dramatic loop (the "Loop Current") in the Gulf of Mexico before exiting into the Florida Current. A marked westward flow exists south of the Gulf Stream ("Gulf Stream recirculation"). A westward flow usually carrying subpolar types of water is found north of the Gulf Stream ("Slope Water Current"). The isopycnal bowl immediately south of the Gulf Stream created by the Gulf Stream itself and its westward recirculation south of the Gulf Stream is a site of winter convection. Convection is favored here for two reasons - the isopycnal bowl has reduced vertical stratification compared with other regions simply because of the bowl, and heat losses to the atmosphere in this region are very large because of the conjunction of the warm Gulf Stream waters and cold, dry air blowing off the North American continent. The convected water mass is called "Eighteen Degree Water" because of its dominant temperature. It is the Subtropical Mode Water that is associated with the Gulf Stream. (Recall that there is an STMW for each of the subtropical gyres' western boundary currents.) The Eighteen Degree Water is spread by the circulation into the whole of the western subtropical gyre, even though the only location where it outcrops is close to the Gulf Stream. It is recognized far from its source as a vertical maximum in thickness between isopycnals, which results from the initial convection
Vertical Temperatures and Pressures in the North Atlantic at 47°N
The North Atlantic Current makes a major bend offshore at the southern entrance to the Labrador Sea (called the "northwest corner") and then extends eastward into the mid-Atlantic and then turns northward into the subpolar region as the Subarctic Front. Part of the subpolar flow proceeds on north into the Norwegian Sea - this component is essentially part of the thermohaline circulation, discussed below. Part of the subpolar circulation makes its way westward past Iceland (although not at the sea surface) and follows the deep boundaries to Greenland, around Greenland into the Labrador Sea and then southward out of the Labrador Sea. Western boundary currents are found along the eastern side of Greenland ("East Greenland
101

Current") and along the Labrador coast ("Labrador Current"). The strong boundary currents around the rim of the subpolar gyre penetrate to great depth without much change in velocity, unlike the subtropical currents. The Subarctic Front extends northeastward from the North Atlantic Current, and passes east of Iceland into the Norwegian Sea. The subtropical gyre also has an eastern boundary current called the Canary Current. The southern side of the subtropical gyre shrinks poleward (northward) and westward with increasing depth, that is, towards the Gulf Stream Extension. The wind-driven subtropical gyre is largely gone by about 2000 meters depth (Talley '00).
Temperature and Pressure Profile of the North Pacific
The eastward flow of the northern subtropical and southern subpolar gyres is referred to as the North Pacific Current. It is not a uniform eastward flow but is punctuated by zonal fronts with somewhat intensified flow which occur at remarkably unchanging latitudes despite strong seasonal and interannual changes in forcing. The two principal fronts are the Subarctic Front at around 40-42°N and the Subtropical Front at around 30-32°N. It is likely that these are eastward extensions of the separated Oyashio and Kuroshio respectively, but it is also clear that several semi-permanent fronts arise from both of these separated currents. The westward flow of the southern subtropical gyre and northern tropical gyre is referred to as the North Equatorial Current. The NEC appears to be more intense in the tropical circulation than in the subtropical
102

circulation. The eastward flow on the south side of the tropical gyre is the North Equatorial Countercurrent; despite its narrowness it is very swift and carries a large transport. Using patterns of properties on isopycnals, it is possible to trace a subtropical gyre down to about 2000 meters, with poleward shrinkage throughout this depth. Potential vorticity maps on isopycnals show regions of homogenized potential vorticity which shrink poleward with depth and disappear around 2000-2500 meters. The western boundary current (Kuroshio) does not have the same depth limitations. The Kuroshio is the western boundary current of the subtropical gyre. Its transport is 60-70 Sv with large seasonal variations. It arises at the western boundary in the bifurcation of the North Equatorial Current; the southward flow is the Mindanao Current and the northward flow the Kuroshio. It passes along the coast of Taiwan and west of the Ryukyu Islands. The western boundary in this region is actually the broad shelf of the East China Sea rather than a continent, and so some of the Kuroshio's transport is actually up on the shelf, although the main core of flow remains in the deep channel. The Kuroshio turns eastward and emerges through Tokara Strait. A small portion remains west of Japan, entering the Japan Sea as the Tsushima Current; surface drifter measurements suggest that the actual continuity of flow into the Japan Sea is marginal. After passing through Tokara Strait, the Kuroshio continues eastward and passes through the Izu Ridge just south of Japan. Between Tokara Strait and the Izu Ridge, the Kuroshio exists in one of two modes - it either flows due eastward or undergoes a large southward meander. This bimodality appears to be due to the wave-guide nature of the two bounding ridges. When the Kuroshio is in the large meander state, its transport is usually reduced compared to when it follows the "straight" (progressive meandering) path. The Kuroshio separates from the land at the southeastern corner of Honshu (south of the Boso Peninsula). At this location the Kuroshio often undergoes a large northward meander, which often produces a warm core ring. In the relatively shallow regions where it is a true western boundary current, the Kuroshio extends to the bottom. On either side of the northward flow it has narrow southward recirculations. Once the Kuroshio crosses the Izu Ridge and enters deep water, its dynamic signature appears to extend to the ocean bottom. Thus the mean currents measured at great depth at 155E show flow below the Kuroshio axis which is eastward relative to stronger recirculation regions to the north and south. However, the actual mean flow along the Kuroshio axis at great depth is weakly westward; one might think of this as a superposition of deep westward flow, perhaps driven through thermohaline forcing, on the deep Kuroshio, which derives its energy from the winds.
The subarctic circulation appears to be composed of four nearly separate cyclonic cells: one in the Gulf of Alaska, one in the western subarctic region, and one in each of the Bering and Okhotsk Seas. Each of these has a western boundary current of sorts - in the Gulf of Alaska it is the Alaskan Stream, which appears to be mainly a northern boundary current except that the coastline has enough slant that it acquires western boundary current identity. This strong current evaporates at the southernmost point of the Aleutians, with some flow turning northward into the Bering Sea, some turning back eastwards. The East Kamchatka Current arises in the Bering Sea and flows along Kamchatka into the open North Pacific. A portion of the flow enters the Okhotsk Sea (around 5 Sv) where it is greatly transformed in properties and emerges with different T/S/O2 characteristics. The Okhotsk current emerges primarily at Bussol' Strait where it joins the EKC. South of this point the western boundary current is referred to as the Oyashio. It flows southward along the remaining Kuril Islands, along the coast of Hokkaido and separates at the southern end of Hokkaido. This location is about 500 km north of the Kuroshio separation
103

point, and coincides more with the N. Pacific zero of Sverdrup transport, than with the zero of wind stress curl (which coincides fairly well with the Kuroshio separation point). East of its separation, the Oyashio can be thought of as continuing as a partially density-compensated front called the Subarctic Front, although the continuity of the Oyashio/ Subarctic Front is somewhat questionable. In the Okhotsk Sea there also occurs a western boundary current - the East Sakhalin Current. The principal eastern boundary current of the North Pacific is the California Current. It arises from a bifurcation of the North Pacific Current (west wind drift). A portion of the North Pacific Current water turns southward into the California Current and a portion northward as the eastern limb of the subpolar gyre. The exact location of the bifurcation, and hence the amount of water which flows northward versus southward, is time dependent. nce the northern waters have high nutrient content, the amount which enters the California Current could impact its local productivity (Talley '13).
To explain the current weather anomalies regular sea surface temperature anomaly charts are created by the NOAA Satellite and Products Operations to explain weather patterns and direct maritime efforts to detect, remove and manage fields of metallic hydrocarbon fueled heating and cooling pumps of container size placed in ocean waters without informing the public. According to the current NOAA Sea Surface Temperature Anomaly map the drought and high pressure system which has caused a drought emergency declaration in California seems to be caused by high levels of warming at around 47°N 100°W, out to sea off the southern coast of Alaska, which blows winds, including the Santa Ana's warmed in the mountains, towards a cooling along the California coast. The cooling on the California coast is theorized to have dissipated somewhat as the result of artificial warming of the waters off the coasts of Southern California and Baja Peninsula consequent to the declaration of drought emergency by California Governor Brown. This man-made warming has neutralized the drying Santa Anna winds and created a warm, humid northerly moving front that has been receptive to cloud seeding. The Gulf Stream seems
104

to be getting artificially chilled as it moves up the continental shelf near the East Coast. Somewhat farther out to sea than the Gulf Stream, but still on the continental shelf, there is a strip of artificially warm water which causes moist winds to blow towards the cold belt which causes the powerful winter storms. The 105 mph hour winds on the western Coast of England are explained by the artificially cold waters of the Gulf Stream chilling the North Atlantic Current intensified by an artificial cooling off the coast of Wales, which is drawing winds from an artificial, or volcanic, warming off the eastern coast of Iceland at 65°N, 5°W, and prevented from blowing northward by even warmer water by Norway's Svalbard, Island northwest coast and north coast of Norway. There are no known declarations of emergency in other parts of the world to warrant the commission of maritime searches for hydrocarbon heating and cooling pumps, with remote thermostats, that might be mined. The sea surface temperature anomalies off the Pacific Coast of Asia and Indian Ocean seem to indicate El Niño conditions thwarted by the presence of a novel warm zone off the southern Coast of Alaska. Detection involves this satellite study of anomalous ocean temperature on the surface, anomalous temperature at depths as compared to previous charts and sonar images of shipping container size metallic heat pumps on the seafloor. Removal may be complicated by the possibility of the mining of a hostile hydrocarbon fueled heat pump with remote thermostat but they should not be much more difficult to remove than transoceanic cable. Henceforth, any unpermitted placing of heating and cooling pumps, and resulting thermal pollution, is ruled pollution for the purposes of corporate liability and state responsibility under the Clean Water Act of 1972 and 1982 Law of the Sea.
Bibliograghy
Aon Benfield. Annual Global Climate and Catastrophe Report - 2013. Impact Forecasting. 2014Aristatek. The First Responder. Violent Self-Polymerization Reactions. October 1, 2008 - Vol. VII Issue 10Baker, Terence. Confluence: the Mississippi and Missouri Rivers. AAA Travel Views. April 19, 2011Diaz, Robert J.; Rosenberg, Rutger. Spreading Dead Zones and Consequences for Marine Ecosystems.Science 15 August 2008: Vol. 321 no. 5891 pp. 926-929 Fugate, W. Craig. Disaster Relief Fund: Monthly Report Through June 30, 2013. July 5, 2013Hamilton, Clive. Requiem for a Species: Why We Resist the Truth about Climate Change. Earthscan. Washington DC. 2010
105

International Tribunal of the Law of the Sea. Responsibilities and obligations of States sponsoring persons and entities with respect to activities in the Area (Request for Advisory Opinion submitted to the Seabed Disputes Chamber) No. 17 1 February 2011Larson, Lee W. The Great USA Flood of 1993. Destructive Water: Water-Caused Natural Disasters - Their Abatement and Control. National Weather Service. Annaheim, California. June 24-28 1996 Lee, Jane J. Behind California's January Wildfires: Dry Conditions, Stubborn Weather Pattern: The state is the driest it's been since the 1890s. National Geographic. January 17, 2014Lew, Jacob J. OMB Report on Disaster Relief Funding to the Committees on Appropriations and the Budget of the U.S. House of Representatives and the Senate. Director, Office of Management and Budget. September 1, 2011Mastrangelo, Erin. Overview of U.S. Legislation and Regulations Affecting Offshore Natural Gas and Oil Activity. Energy Information Administration, Office of Oil and Gas, September 2005 Myers, John. California Governor declares drought emergency. USA Today. Sacramento, California. January 17, 2014Nader, Ralph. Eliminate the Use of Polystyrene. Making Governments Purchase Green. 1996NOAA National Climatic Data Center, State of the Climate: National Snow & Ice for December 2013. January 2014National Research Council. Induced Seismicity Potential in Energy TechnologiesNational Academy of Science. June 2012Ortiz, Erik; Austin, Henry. Winter Storm set to go 'Bananas' across Northeast. NBC News. January 21, 2014Painter, William L. Offsets, Supplemental Appropriations, and the Disaster Relief Fund: FY 1990-FY 2013. Analysis Emergency Management and Homeland Security Policy December 4, 2012Petrone, Christopher J. Heat Capacity. Virginia Institute of Marine Science. 2013Prager, Ellen J.; Early, Sylvia A. The Oceans. McGraw-Hill. New York. 2000Reynolds, Ross. Guide to Weather: A Practical Guide to Observing, Measuring and Understanding the Weather. Firefly Books Ltd. Buffalo, New York. 2005Richman, Josh; Rogers, Paul. Brown declares California drought emergency. San Jose Mercury News. January 17. 2014Robbins, John. The Food Revolution: How Your Diet Can Help Save Your Life and Our World. Foreword by Dean Ornish M.D. Conari Press. San Francisco, California. 2001Rodale, Maria. Organic Manifesto: How Organic Farming Can Health Our Planet, Feed the World, and Keep Us Safe. Foreward by Eric Schlosser. Rodale. New York. 2010Sanders, Tony J. Deepwater Horizon Spill Response Solution. Hospitals & Asylums HA-8-6-10Sanders, Tony J. Flood and Tornado Insurance from the Deepwater Horizon Overpayment. Hospitals & Asylums HA-16-5-11Sanders, Tony J. 5th Plenary Perseid Party. Hospitals & Asylums HA-21-6-07Scheer, Roddy; Moss, Doug. What Causes Ocean "Dead Zone". Scientific America. September 25, 2012Steward, H. Leighton. Fire, Ice and Paradise. Author House. Bloomington, IN. 2009Sussman, Brian. Climategate: A Veteran Meteorologist Exposes the Global Warming Scam. WND Books. 2010
106

Talley, Lynne. North Atlantic circulation and water masses. Thermohaline forcing. Lecture 5. 2000Talley, Lynne. Eastern boundary currents and Pacific Ocean upper layer circulation. Introduction to Physical Oceanography. Fall 2013Uccellini, Louis. Sandy — One Year Later. National Weather Service Director. October 28, 2013Wall, Tim. El Ninos could double as the Pacific warms. Discovery News. January 22, ,2014
107