characterize transceiver systems
TRANSCRIPT
RIGOL – Uncompromised Performance... Unprecedented Value PAGE 1
Defining a Process for characterization
Today, more engineers are working with a wider variety of
RF signals than ever before. From ubiquitous Wi-Fi and
Bluetooth signals to simpler data transmissions using
spread spectrum technology devices utilizing radio
frequency communication continue to expand. With this
explosion in use and application more engineers new to RF
need to characterize and optimize their own transceiver
designs.
In this application note, we will walk through the key
phases of testing on a new RF device before bringing it to
market. While there are many tests that can be conducted
in the name of transceiver evaluation, we will focus on
tests in the 2.4 GHz band that give us direct feedback on
the strengths and weaknesses of the RF design while also
being straightforward and cost effective to conduct. In
these tests, we will establish the characteristics of our
system, conduct stress tests, inject noise, and finally test
external source interference.
We will also review techniques and instrument capabilities
that can be used in these different tests and discuss the
advantages and limitations of each approach.
An experimental approach to testing RF
device integration
For these types of characterization studies, we will begin
with a basic experimental process:
1. Capturing the RF signal
2. Reproducing the data
3. Generating the modulation
4. Emulating the complete RF environment
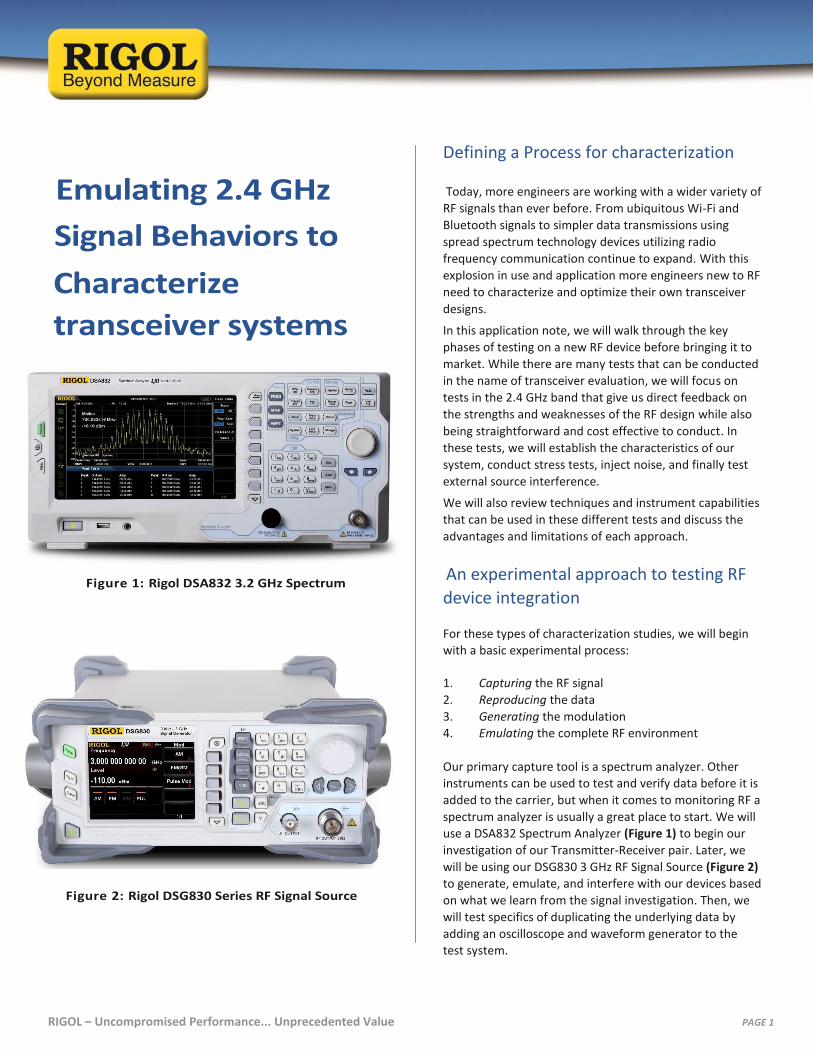
Our primary capture tool is a spectrum analyzer. Other
instruments can be used to test and verify data before it is
added to the carrier, but when it comes to monitoring RF a
spectrum analyzer is usually a great place to start. We will
use a DSA832 Spectrum Analyzer (Figure 1) to begin our
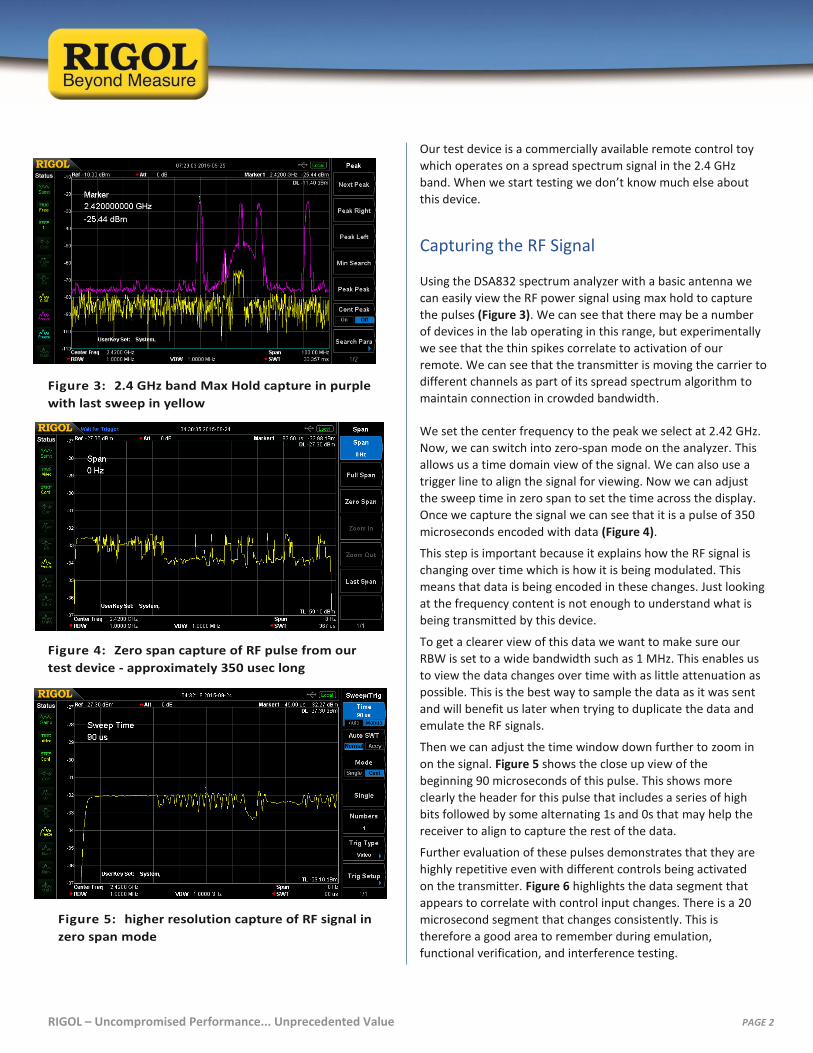
investigation of our Transmitter-Receiver pair. Later, we
will be using our DSG830 3 GHz RF Signal Source (Figure 2)
to generate, emulate, and interfere with our devices based
on what we learn from the signal investigation. Then, we
will test specifics of duplicating the underlying data by
adding an oscilloscope and waveform generator to the
test system.
Characterize
transceiver systems
RIGOL – Uncompromised Performance... Unprecedented Value PAGE 2
Our test device is a commercially available remote control toy
which operates on a spread spectrum signal in the 2.4 GHz
band. When we start testing we don’t know much else about
this device.
Capturing the RF Signal
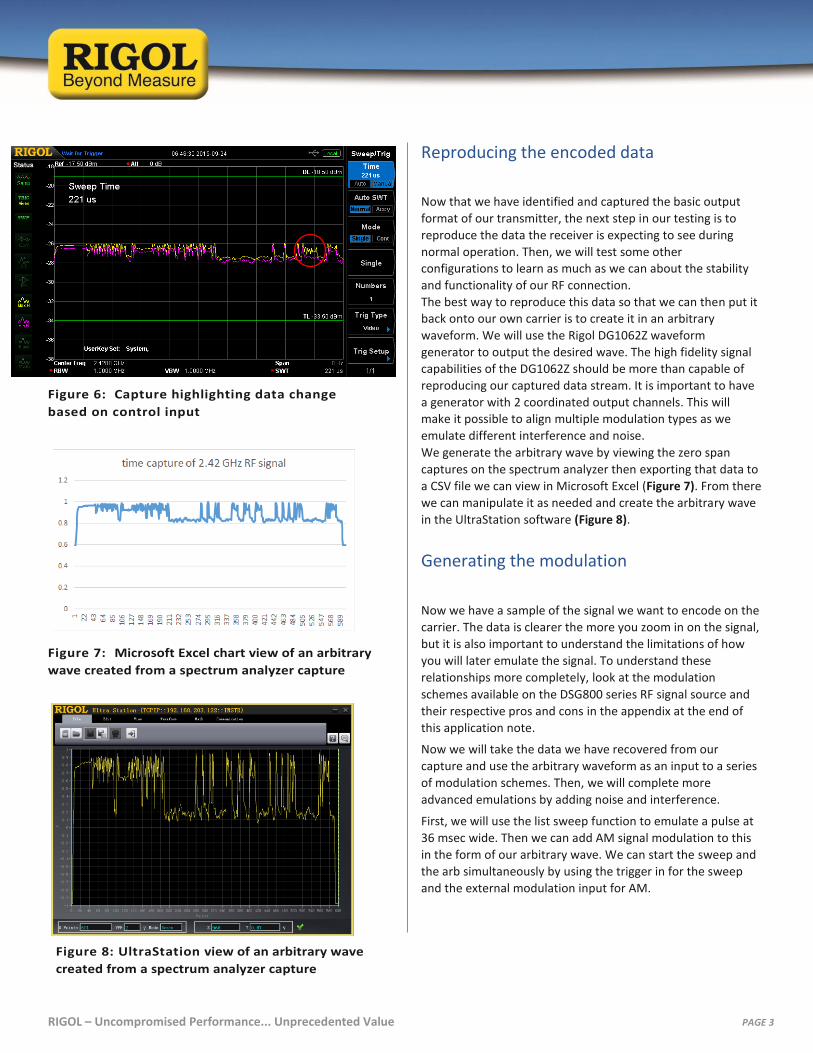
Using the DSA832 spectrum analyzer with a basic antenna we
can easily view the RF power signal using max hold to capture
the pulses (Figure 3). We can see that there may be a number
of devices in the lab operating in this range, but experimentally
we see that the thin spikes correlate to activation of our
remote. We can see that the transmitter is moving the carrier to
different channels as part of its spread spectrum algorithm to
maintain connection in crowded bandwidth.
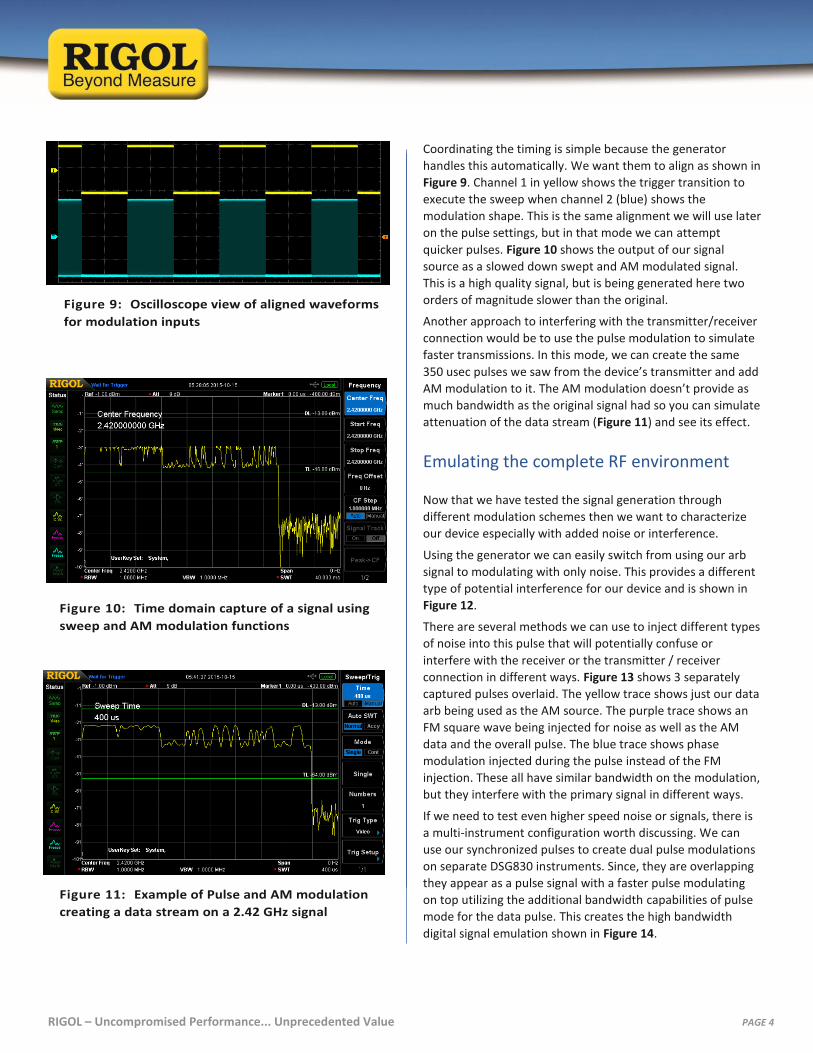
We set the center frequency to the peak we select at 2.42 GHz.
Now, we can switch into zero-span mode on the analyzer. This
allows us a time domain view of the signal. We can also use a
trigger line to align the signal for viewing. Now we can adjust
the sweep time in zero span to set the time across the display.
Once we capture the signal we can see that it is a pulse of 350
microseconds encoded with data (Figure 4).
This step is important because it explains how the RF signal is
changing over time which is how it is being modulated. This
means that data is being encoded in these changes. Just looking
at the frequency content is not enough to understand what is
being transmitted by this device.
To get a clearer view of this data we want to make sure our
RBW is set to a wide bandwidth such as 1 MHz. This enables us
to view the data changes over time with as little attenuation as
possible. This is the best way to sample the data as it was sent
and will benefit us later when trying to duplicate the data and
emulate the RF signals.
Then we can adjust the time window down further to zoom in
on the signal. Figure 5 shows the close up view of the
beginning 90 microseconds of this pulse. This shows more
clearly the header for this pulse that includes a series of high
bits followed by some alternating 1s and 0s that may help the
receiver to align to capture the rest of the data.
Further evaluation of these pulses demonstrates that they are
highly repetitive even with different controls being activated
on the transmitter. Figure 6 highlights the data segment that
appears to correlate with control input changes. There is a 20
microsecond segment that changes consistently. This is
therefore a good area to remember during emulation,
functional verification, and interference testing.
Figure 3: 2.4 GHz band Max Hold capture in purple
with last sweep in yellow
Figure 4: Zero span capture of RF pulse from our
test device - approximately 350 usec long
Figure 5: higher resolution capture of RF signal in
zero span mode
RIGOL – Uncompromised Performance... Unprecedented Value PAGE 3
Reproducing the encoded data
Now that we have identified and captured the basic output
format of our transmitter, the next step in our testing is to
reproduce the data the receiver is expecting to see during
normal operation. Then, we will test some other
configurations to learn as much as we can about the stability
and functionality of our RF connection.
The best way to reproduce this data so that we can then put it
back onto our own carrier is to create it in an arbitrary
waveform. We will use the Rigol DG1062Z waveform
generator to output the desired wave. The high fidelity signal
capabilities of the DG1062Z should be more than capable of
reproducing our captured data stream. It is important to have
a generator with 2 coordinated output channels. This will
make it possible to align multiple modulation types as we
emulate different interference and noise.
We generate the arbitrary wave by viewing the zero span
captures on the spectrum analyzer then exporting that data to
a CSV file we can view in Microsoft Excel (Figure 7). From there
we can manipulate it as needed and create the arbitrary wave
in the UltraStation software (Figure 8).
Generating the modulation
Now we have a sample of the signal we want to encode on the
carrier. The data is clearer the more you zoom in on the signal,
but it is also important to understand the limitations of how
you will later emulate the signal. To understand these
relationships more completely, look at the modulation
schemes available on the DSG800 series RF signal source and
their respective pros and cons in the appendix at the end of
this application note.
Now we will take the data we have recovered from our
capture and use the arbitrary waveform as an input to a series
of modulation schemes. Then, we will complete more
advanced emulations by adding noise and interference.
First, we will use the list sweep function to emulate a pulse at
36 msec wide. Then we can add AM signal modulation to this
in the form of our arbitrary wave. We can start the sweep and
the arb simultaneously by using the trigger in for the sweep
and the external modulation input for AM.
Figure 6: Capture highlighting data change
based on control input
Figure 7: Microsoft Excel chart view of an arbitrary
wave created from a spectrum analyzer capture
Figure 8: UltraStation view of an arbitrary wave
created from a spectrum analyzer capture
RIGOL – Uncompromised Performance... Unprecedented Value PAGE 4
Coordinating the timing is simple because the generator
handles this automatically. We want them to align as shown in
Figure 9. Channel 1 in yellow shows the trigger transition to
execute the sweep when channel 2 (blue) shows the
modulation shape. This is the same alignment we will use later
on the pulse settings, but in that mode we can attempt
quicker pulses. Figure 10 shows the output of our signal
source as a slowed down swept and AM modulated signal.
This is a high quality signal, but is being generated here two
orders of magnitude slower than the original.
Another approach to interfering with the transmitter/receiver
connection would be to use the pulse modulation to simulate
faster transmissions. In this mode, we can create the same
350 usec pulses we saw from the device’s transmitter and add
AM modulation to it. The AM modulation doesn’t provide as
much bandwidth as the original signal had so you can simulate
attenuation of the data stream (Figure 11) and see its effect.
Emulating the complete RF environment Now that we have tested the signal generation through
different modulation schemes then we want to characterize
our device especially with added noise or interference.
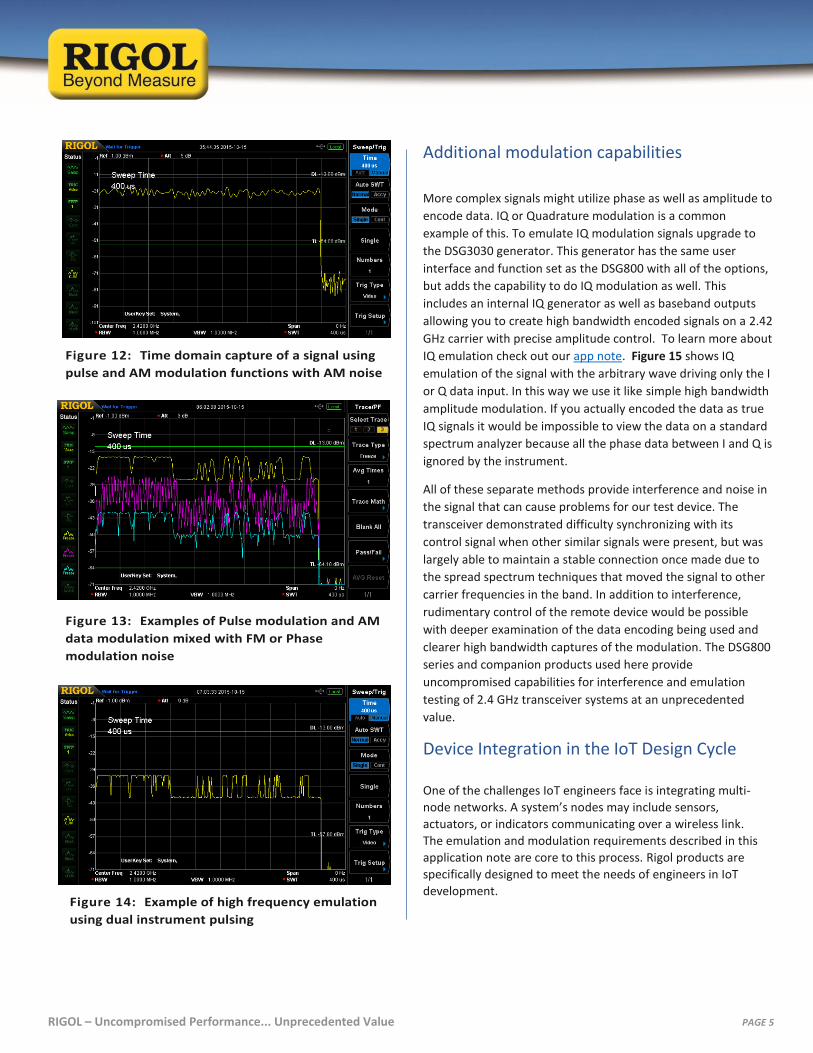
Using the generator we can easily switch from using our arb
signal to modulating with only noise. This provides a different
type of potential interference for our device and is shown in
Figure 12.
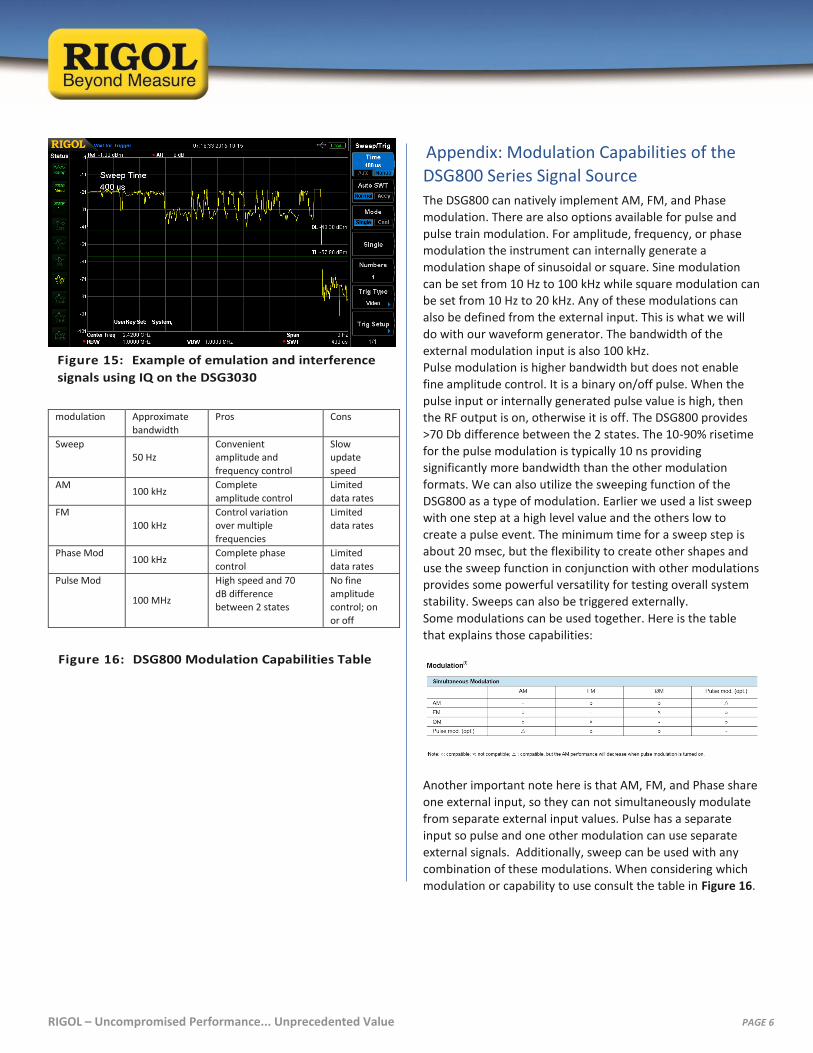
There are several methods we can use to inject different types
of noise into this pulse that will potentially confuse or
interfere with the receiver or the transmitter / receiver
connection in different ways. Figure 13 shows 3 separately
captured pulses overlaid. The yellow trace shows just our data
arb being used as the AM source. The purple trace shows an
FM square wave being injected for noise as well as the AM
data and the overall pulse. The blue trace shows phase
modulation injected during the pulse instead of the FM
injection. These all have similar bandwidth on the modulation,
but they interfere with the primary signal in different ways.
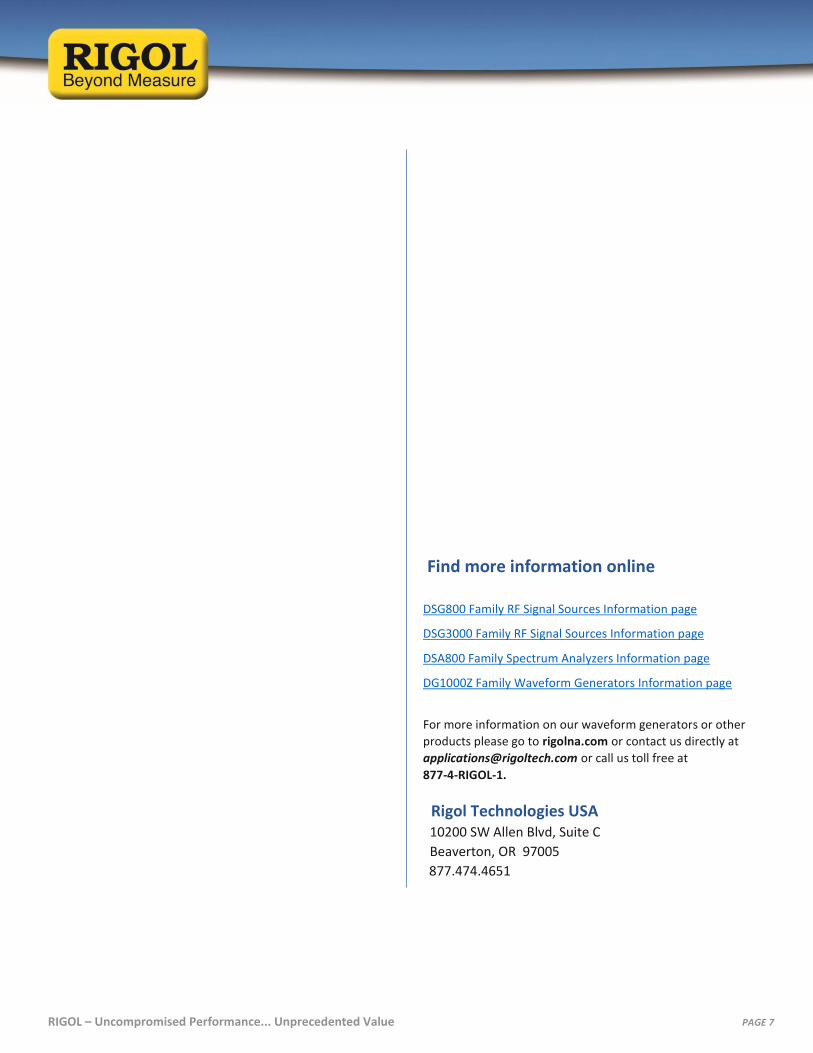
If we need to test even higher speed noise or signals, there is
a multi-instrument configuration worth discussing. We can
use our synchronized pulses to create dual pulse modulations
on separate DSG830 instruments. Since, they are overlapping
they appear as a pulse signal with a faster pulse modulating
on top utilizing the additional bandwidth capabilities of pulse
mode for the data pulse. This creates the high bandwidth
digital signal emulation shown in Figure 14.
Figure 9: Oscilloscope view of aligned waveforms
for modulation inputs
Figure 10: Time domain capture of a signal using
sweep and AM modulation functions
Figure 11: Example of Pulse and AM modulation
creating a data stream on a 2.42 GHz signal
RIGOL – Uncompromised Performance... Unprecedented Value PAGE 5
Additional modulation capabilities
More complex signals might utilize phase as well as amplitude to
encode data. IQ or Quadrature modulation is a common
example of this. To emulate IQ modulation signals upgrade to
the DSG3030 generator. This generator has the same user
interface and function set as the DSG800 with all of the options,
but adds the capability to do IQ modulation as well. This
includes an internal IQ generator as well as baseband outputs
allowing you to create high bandwidth encoded signals on a 2.42
GHz carrier with precise amplitude control. To learn more about
IQ emulation check out our app note. Figure 15 shows IQ
emulation of the signal with the arbitrary wave driving only the I
or Q data input. In this way we use it like simple high bandwidth
amplitude modulation. If you actually encoded the data as true
IQ signals it would be impossible to view the data on a standard
spectrum analyzer because all the phase data between I and Q is
ignored by the instrument.
All of these separate methods provide interference and noise in
the signal that can cause problems for our test device. The
transceiver demonstrated difficulty synchronizing with its
control signal when other similar signals were present, but was
largely able to maintain a stable connection once made due to
the spread spectrum techniques that moved the signal to other
carrier frequencies in the band. In addition to interference,
rudimentary control of the remote device would be possible
with deeper examination of the data encoding being used and
clearer high bandwidth captures of the modulation. The DSG800
series and companion products used here provide
uncompromised capabilities for interference and emulation
testing of 2.4 GHz transceiver systems at an unprecedented
value.
Device Integration in the IoT Design Cycle
One of the challenges IoT engineers face is integrating multi-
node networks. A system’s nodes may include sensors,
actuators, or indicators communicating over a wireless link.
The emulation and modulation requirements described in this
application note are core to this process. Rigol products are
specifically designed to meet the needs of engineers in IoT
development.
Figure 14: Example of high frequency emulation
using dual instrument pulsing
Figure 12: Time domain capture of a signal using
pulse and AM modulation functions with AM noise
Figure 13: Examples of Pulse modulation and AM
data modulation mixed with FM or Phase
modulation noise
RIGOL – Uncompromised Performance... Unprecedented Value PAGE 6
Appendix: Modulation Capabilities of the
DSG800 Series Signal Source The DSG800 can natively implement AM, FM, and Phase
modulation. There are also options available for pulse and
pulse train modulation. For amplitude, frequency, or phase
modulation the instrument can internally generate a
modulation shape of sinusoidal or square. Sine modulation
can be set from 10 Hz to 100 kHz while square modulation can
be set from 10 Hz to 20 kHz. Any of these modulations can
also be defined from the external input. This is what we will
do with our waveform generator. The bandwidth of the
external modulation input is also 100 kHz.
Pulse modulation is higher bandwidth but does not enable
fine amplitude control. It is a binary on/off pulse. When the
pulse input or internally generated pulse value is high, then
the RF output is on, otherwise it is off. The DSG800 provides
>70 Db difference between the 2 states. The 10-90% risetime
for the pulse modulation is typically 10 ns providing
significantly more bandwidth than the other modulation
formats. We can also utilize the sweeping function of the
DSG800 as a type of modulation. Earlier we used a list sweep
with one step at a high level value and the others low to
create a pulse event. The minimum time for a sweep step is
about 20 msec, but the flexibility to create other shapes and
use the sweep function in conjunction with other modulations
provides some powerful versatility for testing overall system
stability. Sweeps can also be triggered externally.
Some modulations can be used together. Here is the table
that explains those capabilities:
Another important note here is that AM, FM, and Phase share
one external input, so they can not simultaneously modulate
from separate external input values. Pulse has a separate
input so pulse and one other modulation can use separate
external signals. Additionally, sweep can be used with any
combination of these modulations. When considering which
modulation or capability to use consult the table in Figure 16.
modulation Approximate
bandwidth
Pros Cons
Sweep 50 Hz
Convenient amplitude and
frequency control
Slow update
speed
AM 100 kHz
Complete
amplitude control
Limited
data rates
FM 100 kHz
Control variation over multiple
frequencies
Limited data rates
Phase Mod 100 kHz
Complete phase
control
Limited
data rates
Pulse Mod
100 MHz
High speed and 70
dB difference between 2 states
No fine
amplitude control; on
or off
Figure 16: DSG800 Modulation Capabilities Table
Figure 15: Example of emulation and interference
signals using IQ on the DSG3030
RIGOL – Uncompromised Performance... Unprecedented Value PAGE 7
Find more information online
DSG800 Family RF Signal Sources Information page
DSG3000 Family RF Signal Sources Information page
DSA800 Family Spectrum Analyzers Information page
DG1000Z Family Waveform Generators Information page
For more information on our waveform generators or other
products please go to rigolna.com or contact us directly at
[email protected] or call us toll free at
877-4-RIGOL-1.
Rigol Technologies USA
10200 SW Allen Blvd, Suite C
Beaverton, OR 97005
877.474.4651