environmental and ocean temperatures robert perry
TRANSCRIPT
ENVIRONMENTALAND OCEAN
TEMPERATURES
Robert Perry

TEMPERATURE IS ONE OF THEMOST IMPORTANT ENVIRONMENTALFACTORS GOVERNING THE DISTRIBUTION OF LIFE ON EARTH.

TEMPERATURERECORDS ARETHE BACKBONEOF MOSTENVIRONMENTALRESEARCHSTUDIES
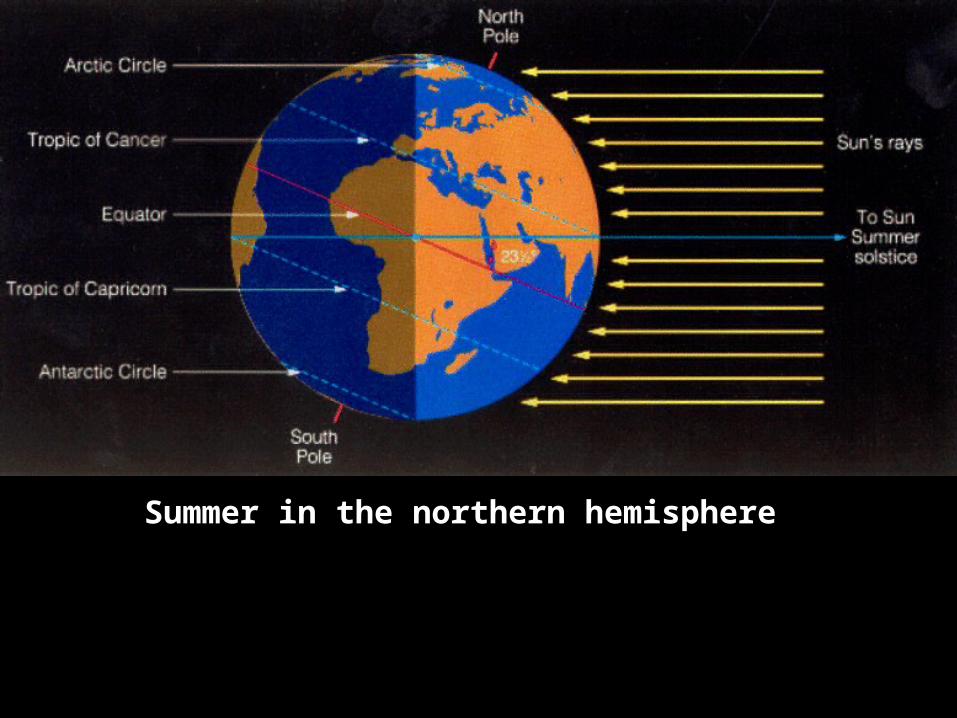
Summer in the northern hemisphere

AtEquator Sub-
Tropics
Mid-Latitudes
Near thePoles
INSOLATION
More solar energy is received per m2 as you movecloser to the Equator.
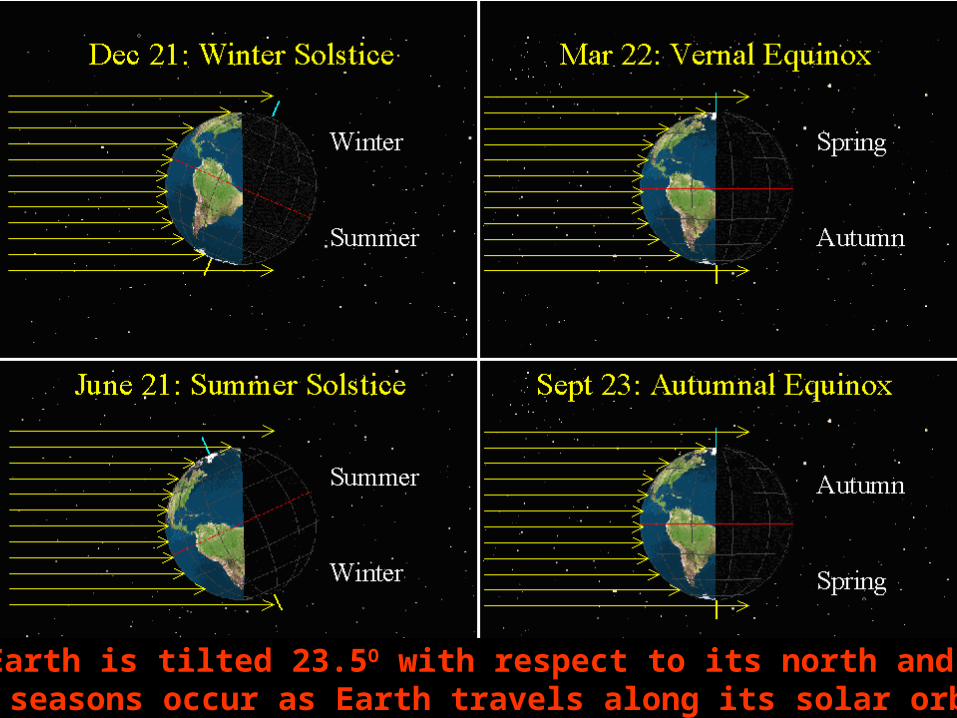
Since the Earth is tilted 23.5O with respect to its north and south polethe seasons occur as Earth travels along its solar orbit.
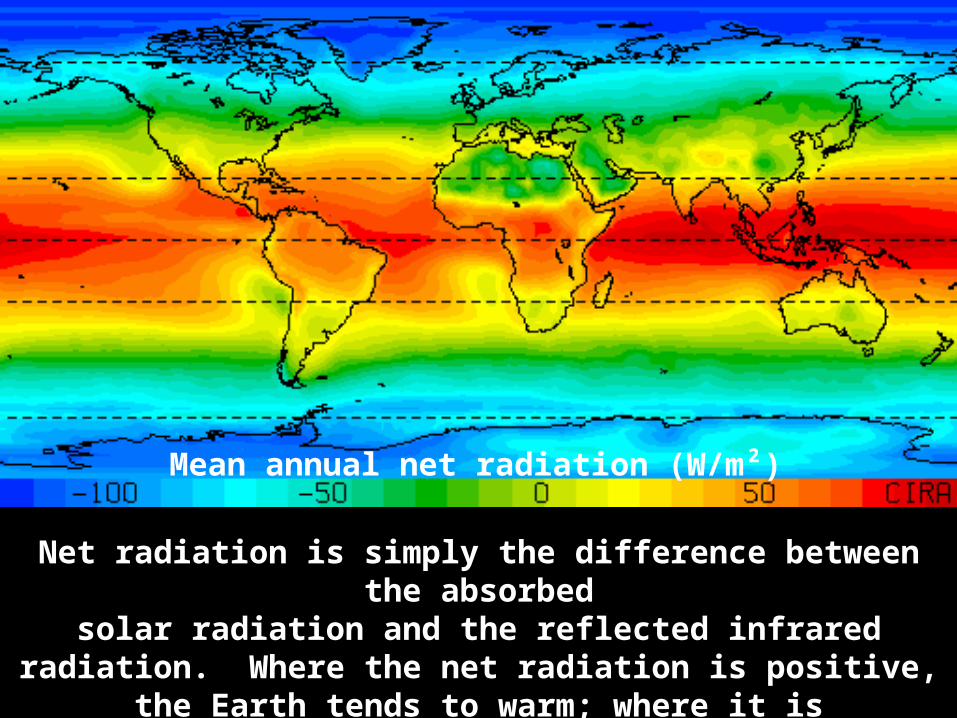
Mean annual net radiation (W/m²)
Net radiation is simply the difference between the absorbedsolar radiation and the reflected infrared radiation. Where the net radiation is positive, the Earth tends to warm; where it is
negative, the Earth tends to cool.
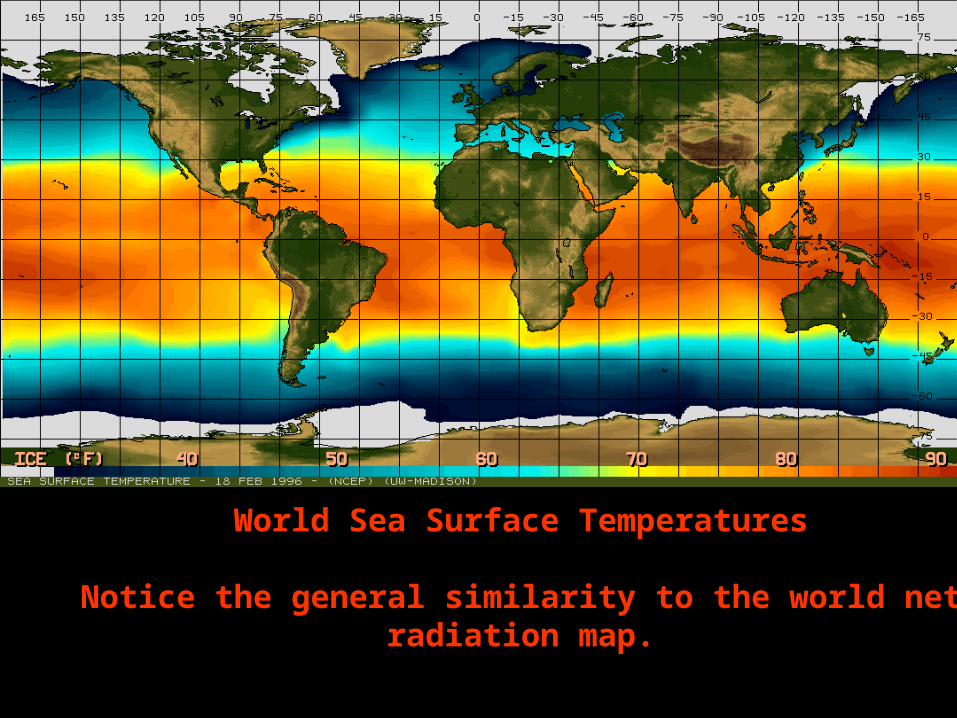
World Sea Surface Temperatures
Notice the general similarity to the world netradiation map.

TEMPERATUREvs.
DEPTH

OCEAN TEMPERATURES:
THERE ARE THREE TEMPERATURELAYERS IN THE
OPEN OCEAN
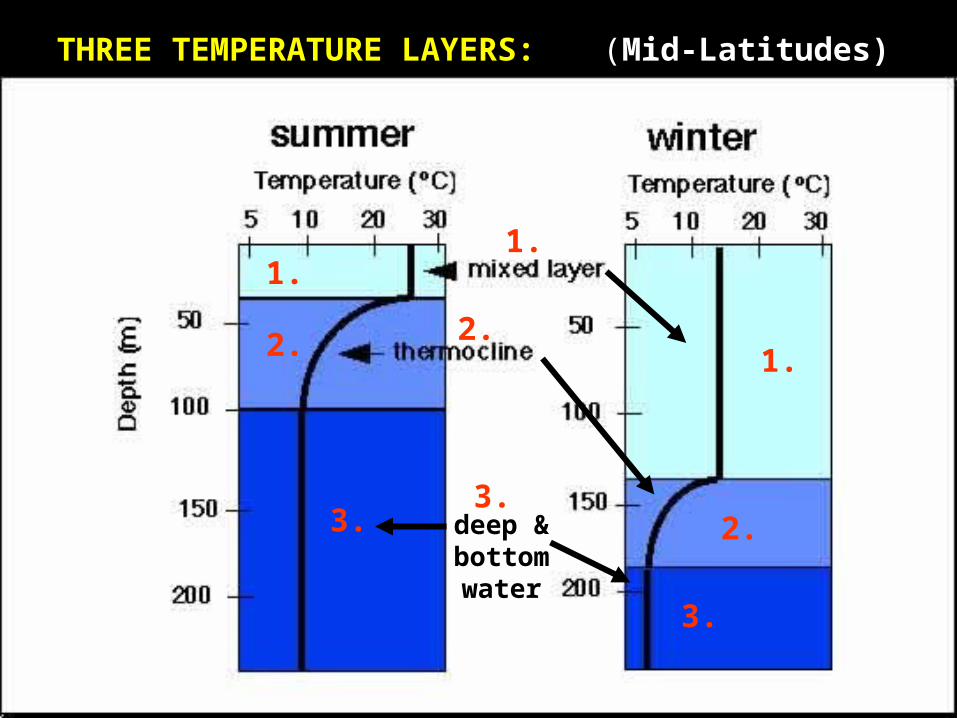
THREE TEMPERATURE LAYERS:
deep &bottomwater
(Mid-Latitudes)
1.
2.
3.
1.
1.2.
2.3.
3.
deep &bottom
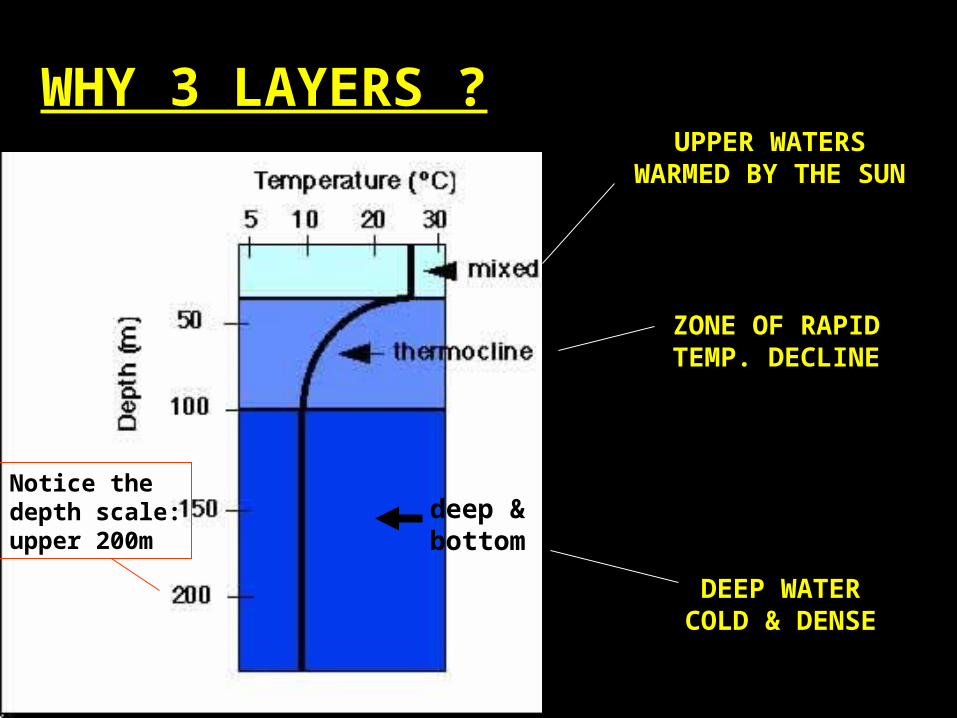
WHY 3 LAYERS ?UPPER WATERS
WARMED BY THE SUN
ZONE OF RAPIDTEMP. DECLINE
DEEP WATERCOLD & DENSE
Notice thedepth scale:upper 200m

DIFFERENT TEMPPLOTS IN DIFFERENTLATITUDES.
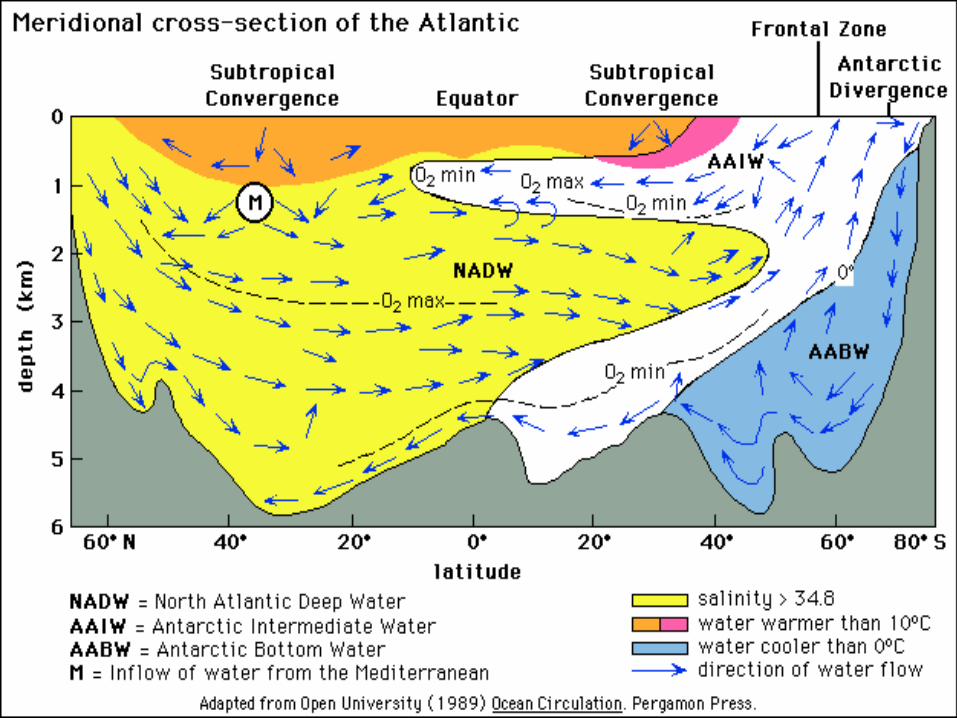
CROSS SECTION OFAN ENTIRE OCEAN TO
SHOW WATER MASSES
ATLANTICOCEAN:
THE GULF STREAM
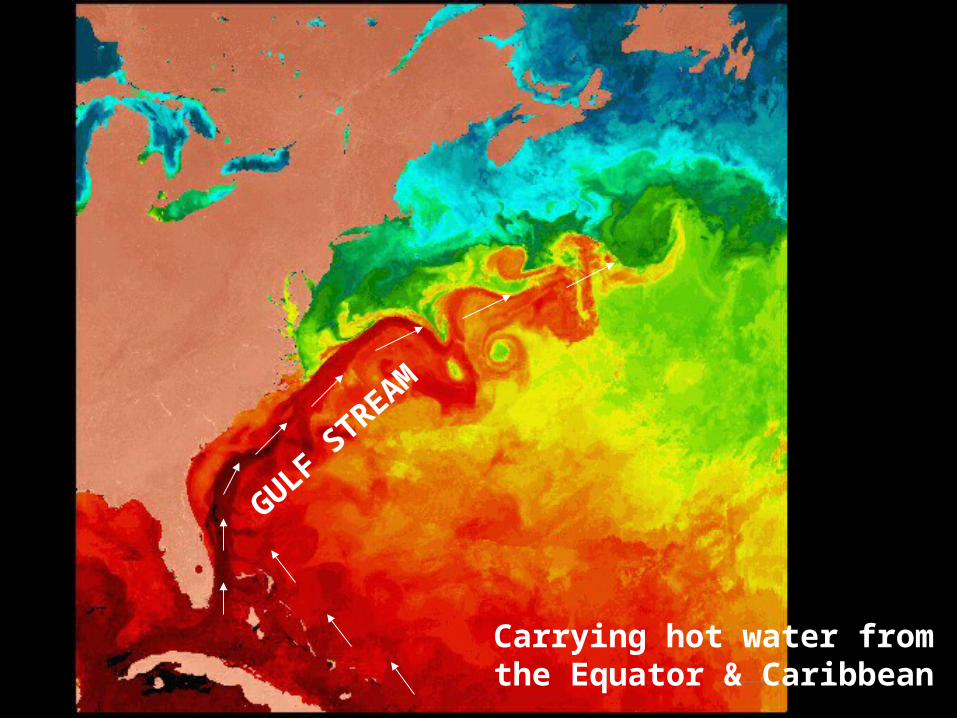
GULF STREAM
Carrying hot water fromthe Equator & Caribbean
ARCTICOCEAN

ARCTIC SST’s


PACIFICOCEAN
TEMPERATURES

4 yr. Mean SST mapcourtesy of US Navy
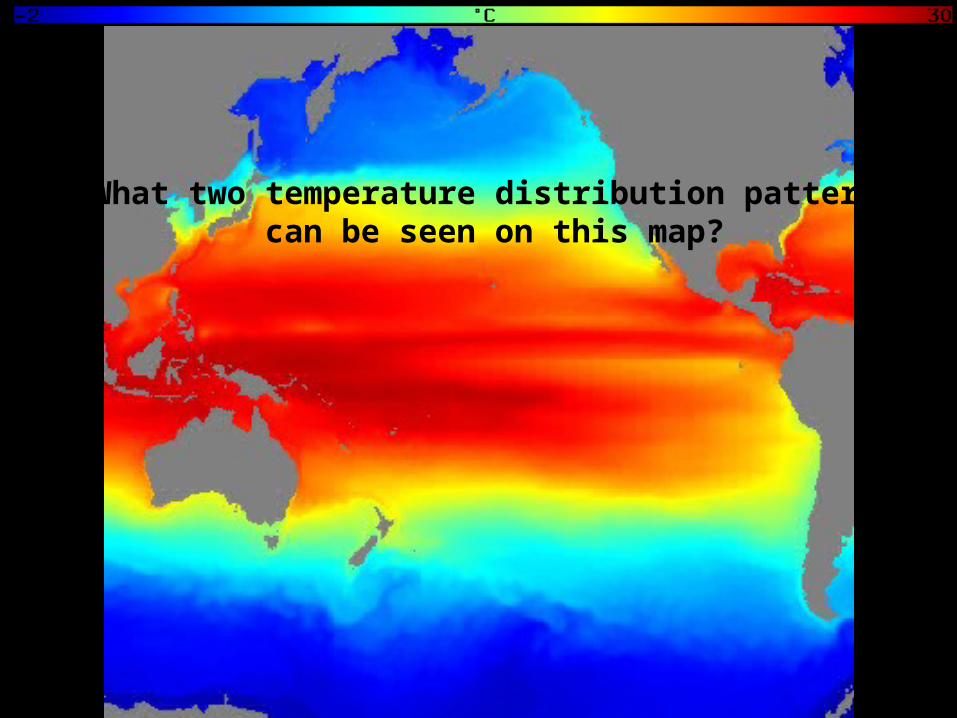
What two temperature distribution patternscan be seen on this map?
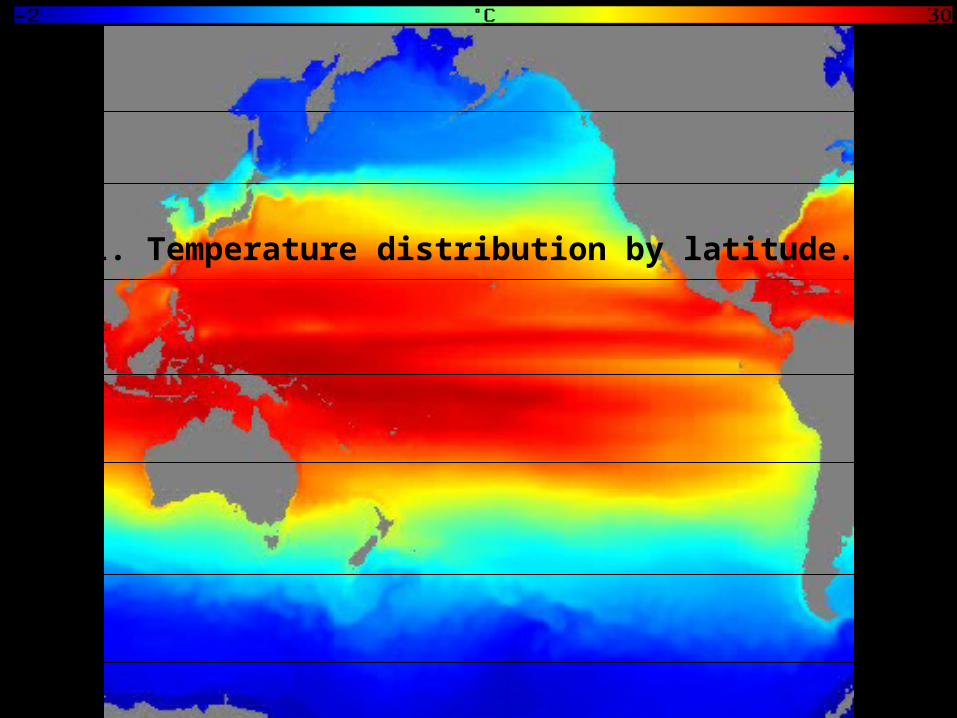
1. Temperature distribution by latitude.
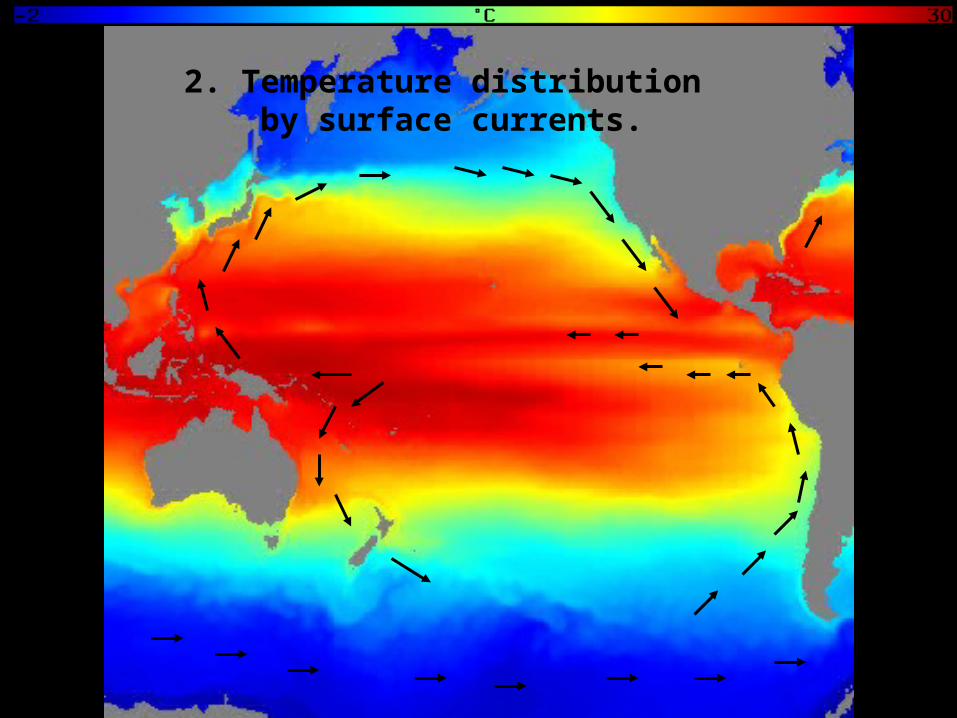
2. Temperature distribution by surface currents.
EL NINOTEMPERATURES
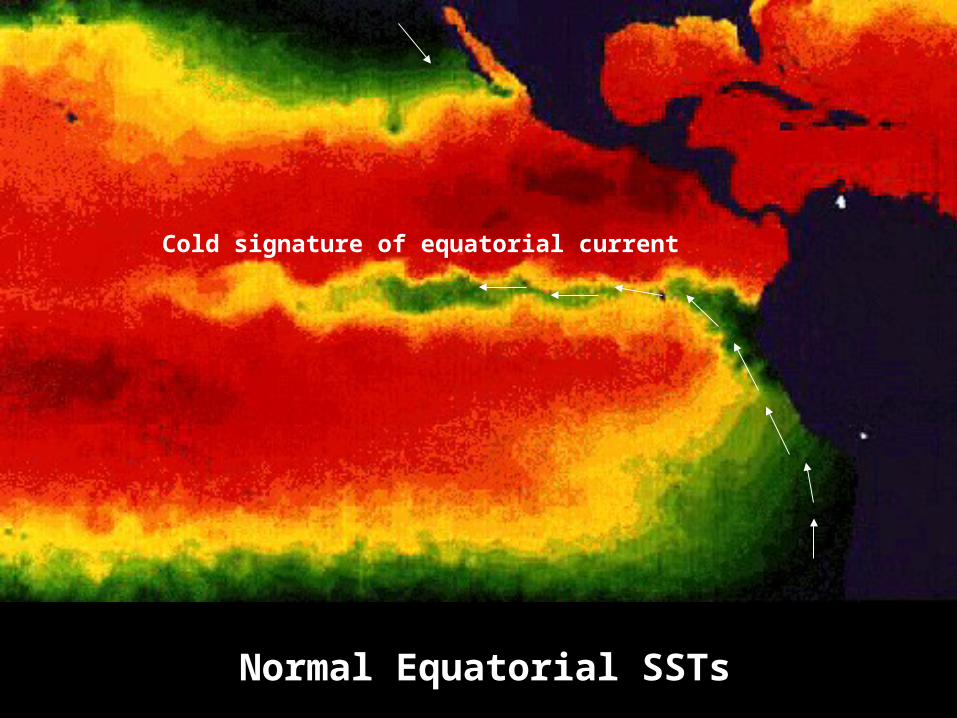
Normal Equatorial SSTs
Cold signature of equatorial current

El Nino Equatorial SSTs
(Cold signature gone)
El Nino hot signature

CALIFORNIATEMPERATURES
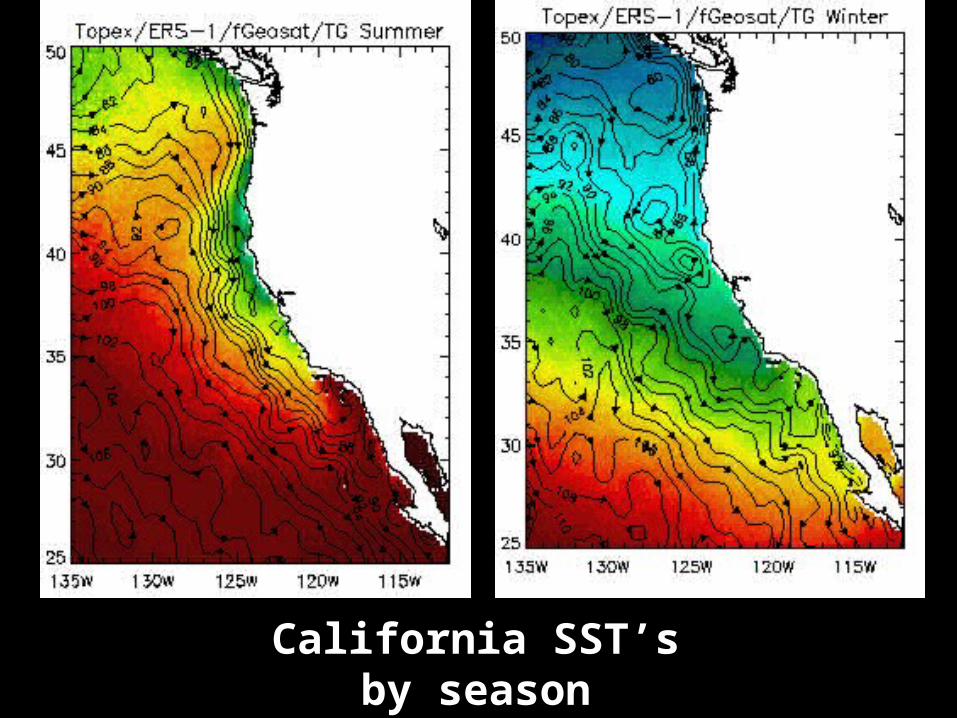
California SST’s
by season

SPRING TO FALL
SST CHANGES
MARCH TOOCTOBER2003
THISANIMATIONMAY NOT BEVISIBLE ON THE WEB. VISIT SOURCE:
http://suzaku.eorc.jaxa.jp/GLI/ocean/
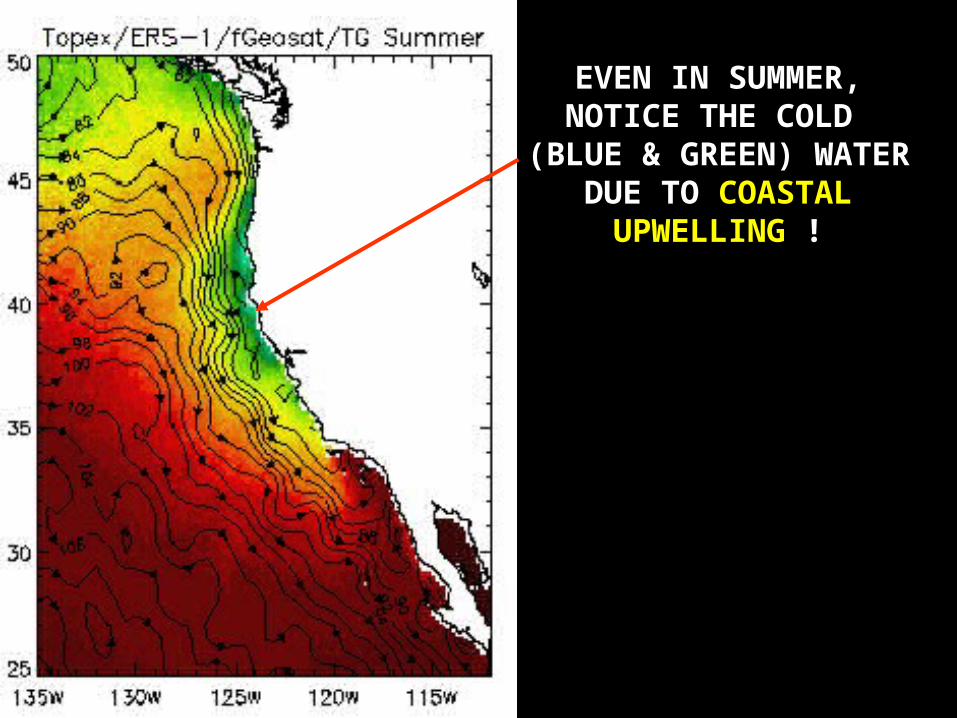
EVEN IN SUMMER,NOTICE THE COLD
(BLUE & GREEN) WATERDUE TO COASTAL
UPWELLING !

34O N
OUR LATITUDE:
U.S.A.EAST COAST
vsWEST COAST
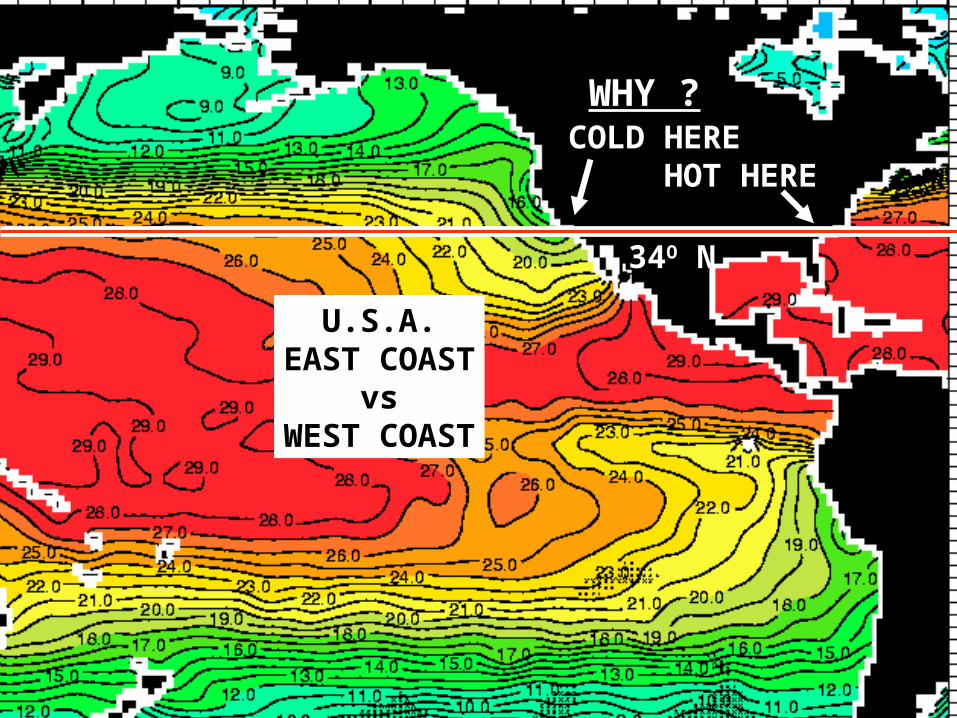
34O N
COLD HEREHOT HERE
WHY ?
U.S.A.EAST COAST
vsWEST COAST
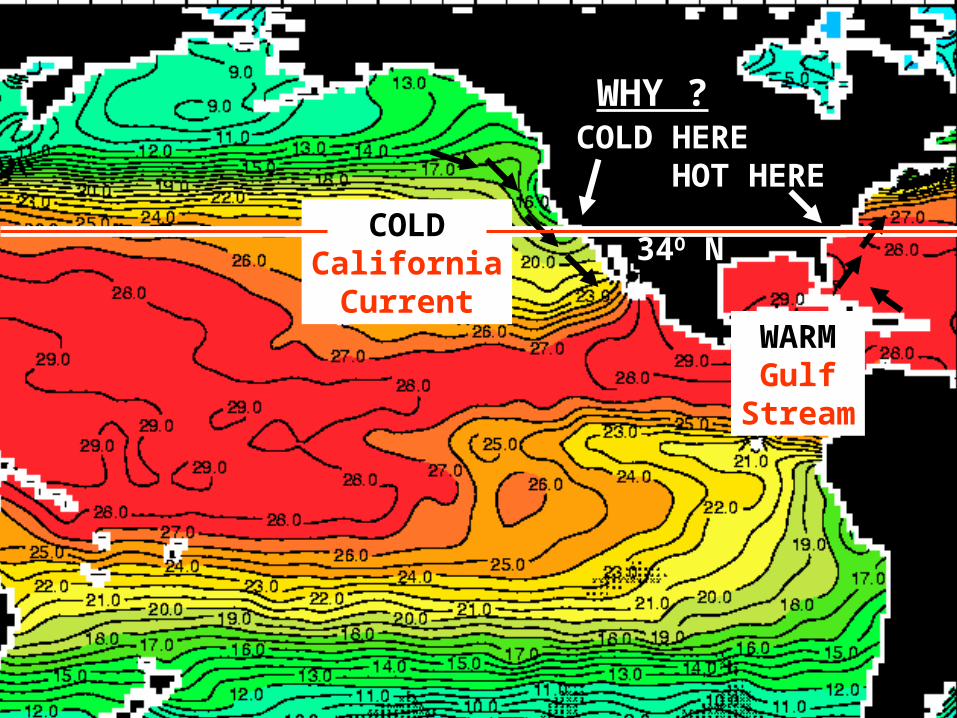
34O N
WHY ?COLD HERE
HOT HERE
COLDCaliforniaCurrent
WARMGulf
Stream
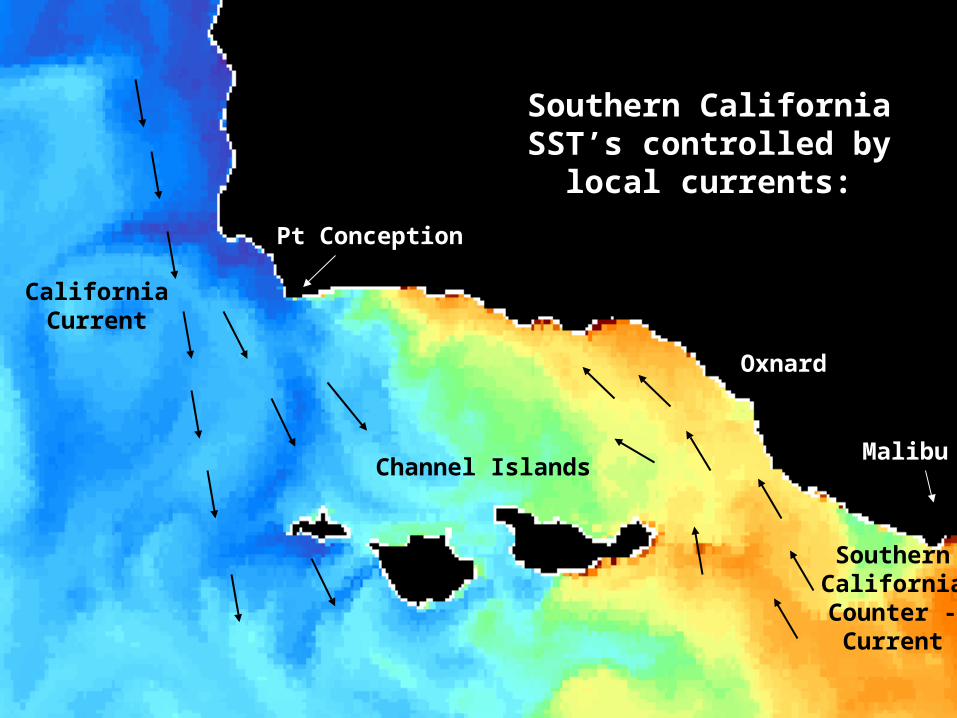
Pt Conception
Oxnard
MalibuChannel Islands
Southern CaliforniaSST’s controlled by
local currents:
CaliforniaCurrent
SouthernCaliforniaCounter -Current
OCEAN TEMPERATURES:
WHAT IS THE EFFECT OF
TEMPERATUREON ORGANISMS ?

HERE’S HOWIT WORKS:
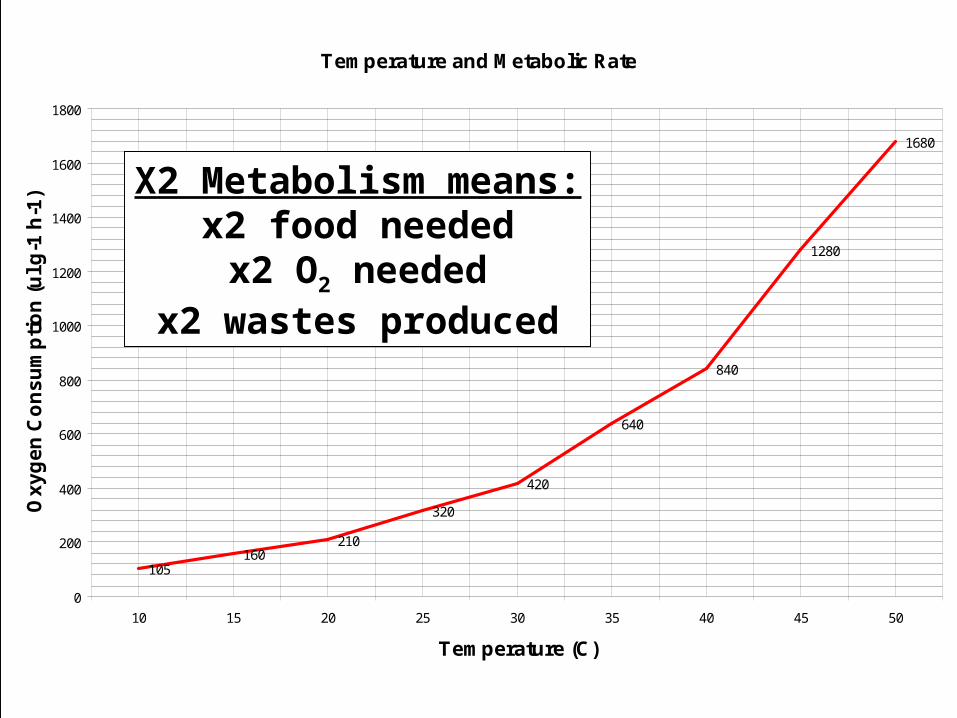
Temperature and Metabolic Rate
105160
210
320
420
640
840
1280
1680
0
200
400
600
800
1000
1200
1400
1600
1800
10 15 20 25 30 35 40 45 50
Temperature (C)
Ox
yg
en
Co
ns
um
pti
on
(u
l g-1
h-1
)

Temperature and Metabolic Rate
105160
210
320
420
640
840
1280
1680
0
200
400
600
800
1000
1200
1400
1600
1800
10 15 20 25 30 35 40 45 50
Temperature (C)
Ox
yg
en
Co
ns
um
pti
on
(u
l g-1
h-1
)
Van’t Hoff’s Rule:For every 10OC increase
in temperature, themetabolic rate doubles
(at least).
Temperature and Metabolic Rate
105160
210
320
420
640
840
1280
1680
0
200
400
600
800
1000
1200
1400
1600
1800
10 15 20 25 30 35 40 45 50
Temperature (C)
Ox
yg
en
Co
ns
um
pti
on
(u
l g-1
h-1
) X2 Metabolism means:x2 food neededx2 O2 needed
x2 wastes produced

T H E E N D