environmental change institute oxford university centre
TRANSCRIPT

Dr John Ingram Environmental Change Institute Oxford University Centre for the
Environment

Feeding a healthy world population:
policy and business challenges for the future
John Ingram
Food Systems Programme Leader Environmental Change Institute
University of Oxford

Demand for food consumption increases as
incomes rise
A more
populous,
urban, and
wealthier
world will
demand 70-
100% more
food by
2050.

But ‘Food Security’ is already the BIG ISSUE
Independent; 16 October 2011: World Food Day

Food security…
... exists when all people, at all times, have physical,
social and economic access to sufficient, safe, and
nutritious food to meet their dietary needs and food
preferences for an active and healthy life.
(UN-FAO 1996; 2012)
… is more than food production
… is underpinned by food systems

Now an added emphasis on
nutrition and a food systems approach
“Food Systems for
Better Nutrition”
A ‘food system’ approach
includes consideration of:
• producing, processing,
distributing, retailing and
consuming food
• availability, access and utilisation
of food
• diets, health, economics and
governance

Food systems are already failing many:
ca. 1 billion people hungry in 2012
“One new food bank opens every week in UK as more people find they
cannot afford to feed themselves and their families”
London Times, April 17th 2012
Asia & Pac
~ 650m SSA
~ 250m
Developed
~ 15m


And food systems are failing
a further >1 billion!
>1 billion with
insufficient nutrition
esp. vitamin A, iron,
iodine and zinc
20% of people
admitted to hospital in
England are nutrient
deficient; similar in
Switzerland!
Edington, et al. 2000; Impberdorf, et al, 2010; Hilton et al, 2012

Nutrition is essential for development
• Poor nutrition in early life
negatively impacts the overall
economic development of
nations.
• Improved nutrition can
increase a country’s GDP by
at least 2-3% annually.
• Investing $1 in nutrition can
result in a return of up to $30.

Chronic undernutrition: Stunting and poor brain development
UNICEF 2013

South Atlantic Ocean South Pacific Ocean
Indian Ocean
Arctic Ocean
Arctic Ocean
North Pacific Ocean
<10% 10-20%
21-30% 31-40% 41-50% >51%
POPKIN The World is Fat (Penguin, Dec 2008)
Overweight and Obesity Patterns % adults overweight or obese

1
2200
- Too much - -- Too little --
Billions of people
----- Appropriate amount -----
(indicative; not to scale)
2 3 4 5 7 6 8 10 9
2050
2013
2025
kcal
/per
son
/day
Looking ahead …?
Poor nutrition can affect those who don't get enough and also those that get too much
------ Too much ------ --- Too little --- ---- Appropriate amount ----
----------- Too much ------------ ----- Too little ----- --- Appropriate amount ---

Adapting to inevitable socioeconomic and
environmental change
Mitigating further environmental change
So what can we do about it?
Invest financial, human and social capitals in:

“an opportunity to do things differently; an
opportunity for investment”
Producing food
Processing & packaging food
Distributing & retailing food
Consuming food
Numerous
opportunities for
policy, investors,
business, resource
managers and
consumers to
adapt our Food
System “Activities”
Adaptation

Investing in improving food storage?
~ 15-25% losses to pests
and damp in store

Investing in reducing
catastrophic losses?
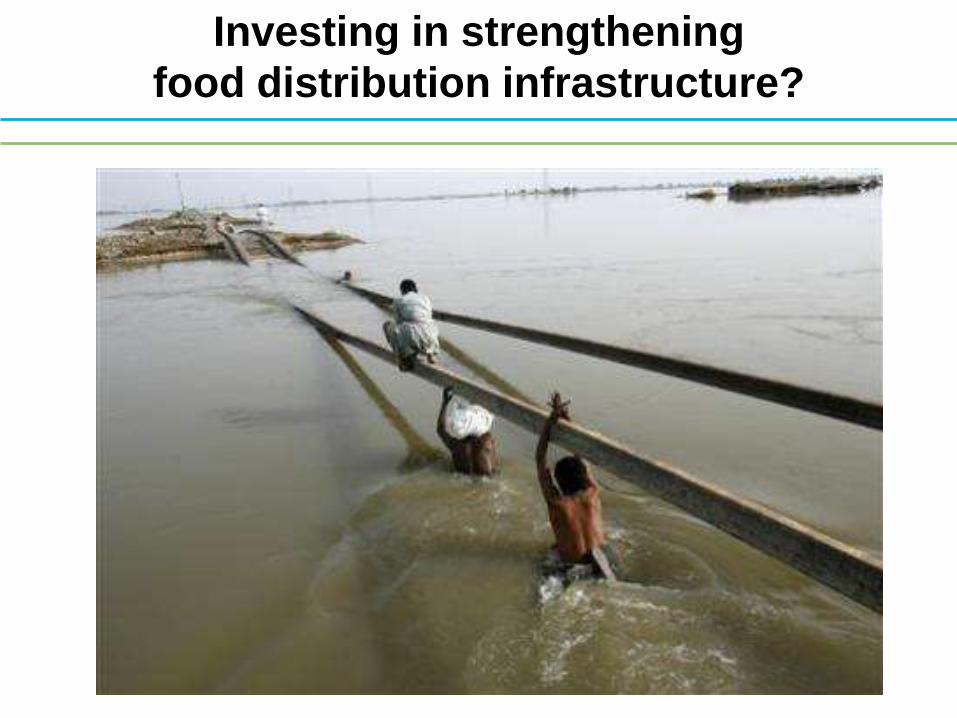
Investing in strengthening
food distribution infrastructure?

Investing in alternative foods?

Investing in novel foods?

Tuomisto & Teixeira de Mattos. Env Sci & Tech, 2011
Investing in cultured meat?

Food
47%
Feed
34%
Other
19%
FAO Food Outlook 2013
2.3 bn tons cereal produced in 2010/11
Re-allocating human edible food
back to humans?

Mitigation: reduce food losses and waste
Source: FAO, Global Food Losses and Food Waste, 2011

Reducing food waste would reduce the
environmental impact of the food system …
Avoidable UK household food and drink
waste:
17 million tonnes of CO2e
(≈ emissions of 1 in 5 cars on UK roads)
4% of the UK total water footprint
WRAP, 2011
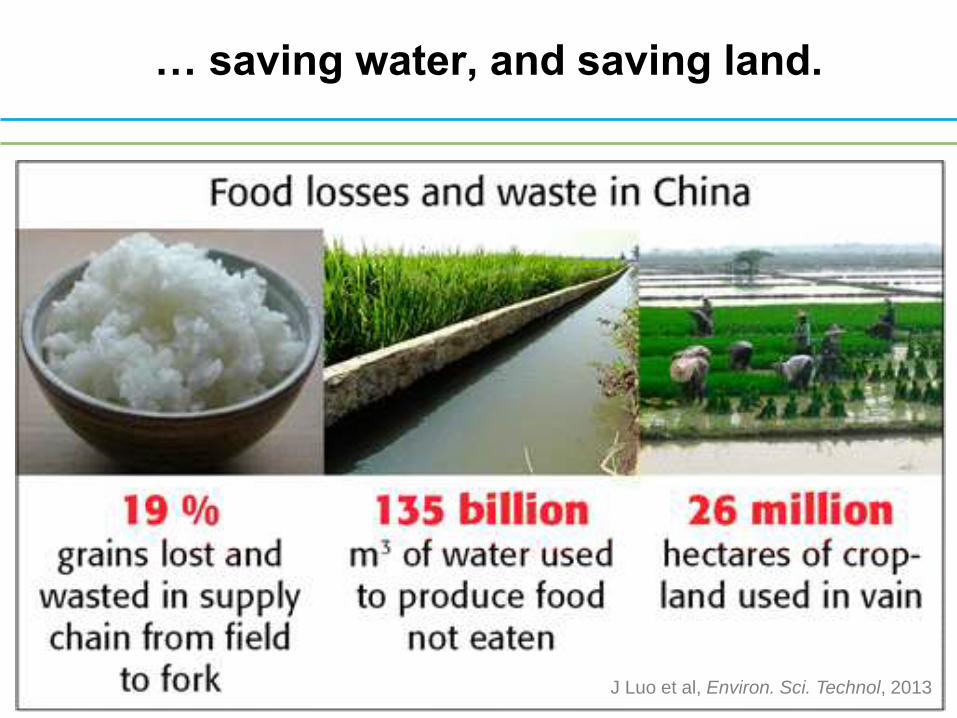
… saving water, and saving land.
J Luo et al, Environ. Sci. Technol, 2013

“One of the surest – and arguably most affordable –
ways to feed more people sustainably is to ensure
that the food already produced is not lost or wasted
between the farm and the table.”
Jose W. Fernandez
Assistant Secretary,
Bureau of Economic and Business Affairs
US Department of State
Remarks on Preventing Postharvest Loss
February 19, 2013, Washington, DC
And reducing food waste
improves food security.

3000
2000
2500
kcal/p
ers
on
/day
Edible cereal
harvest
After 15%
lost on-
farm
After 34%
fed to
animals
After 15% lost
in food chain
Nature of food loss
On-farm
1825
2675
3150
2750
2400
1875
1650
15% reduction due
to population
increase and
environmental
change
33% reduction
in on-farm
losses
67% reduction
in feeding to
animals 50% reduction
in food chain
losses
Animal feed Food chain
‘Current’ data (in red) from FAO; & Luo, 2013
Plausible scenarios for 2025 in green
Reducing cereal loss: A plausible way ahead by 2025 50% more cereal cals/person/day, despite harvesting 15% less/person
1500
After 19%
for biofuel
1300
Biofuel
1000
90% reduction
in use for
biofuels
1775
1100
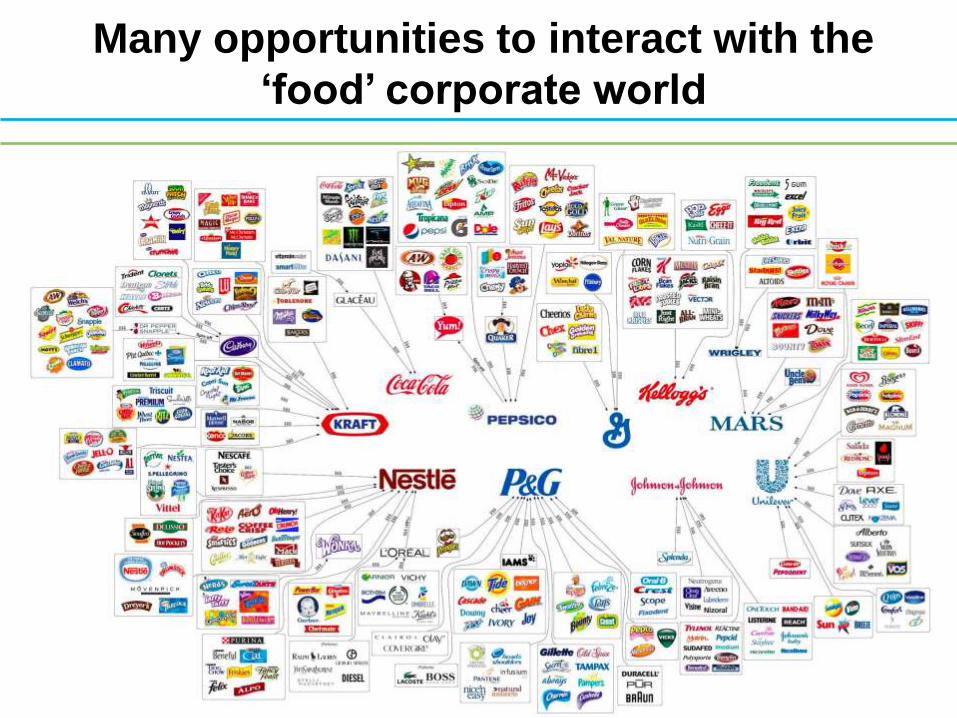
Many opportunities to interact with the
‘food’ corporate world

DRIVER
Interactions
Socioeconomic
DRIVERS Changes in:
Demographics, Economics,
Socio-political context,
Cultural context
Science & Technology
GEC DRIVERS Changes in:
Land cover & soils, Atmospheric
Comp., Climate variability & means,
Water availability & quality,
Nutrient availability & cycling,
Biodiversity, Sea currents
& salinity, Sea level
‘Natural’
DRIVERS
e.g. Volcanoes
Solar cycles
Environmental feedbacks
e.g. water quality, GHGs
Socioeconomic feedbacks
e.g. livelihoods, social cohesion
Food System ACTIVITIES Producing food
Processing & Packaging food
Distributing & Retailing food
Consuming food
Food System OUTCOMES Contributing to:
Social
Welfare
Environ
Welfare Food
Utilisation Food
Access
Food
Availability
Food Security
But optimum investment needs to
understand nature of drivers and feedbacks

CIMSANS Participants (“tri-partite”)
Private Sector
Academia
Governments, etc.
30

1
2200
- Too much - -- Too little --
Billions of people
----- Appropriate amount -----
> 50% of China’s adults are already prediabetic
Yu Xu et al. 2013.China Noncommunicable Disease
Surveillance Group
2 3 4 5 7 6 8 10 9
2050
2013
2025
kcal
/per
son
/day
A challenge or an investment opportunity?
------ Too much ------ --- Too little --- ---- Appropriate amount ----
----------- Too much ------------ ----- Too little ----- --- Appropriate amount ---