environmental engineering fundamentals nve3325c
TRANSCRIPT

Komar University of Science and Technology (KUST)
1
Environmental Engineering Fundamentals
NVE3325C
Department of Civil Engineering
College of Engineering
Instructor
Dr. Ibrahiem Abdul Razak Al-Ani
Fall 2015, Version 3

Komar University of Science and Technology (KUST)
2
4. LABORATORY EXPERIMENTS
EXP No. 1: Determination of Alkalinity in a water sample
EXP No. 2: Determination of pH, and Conductivity in some
water samples.
EXP No. 3/ Field trip: Air pollution (Particulate Test)/measurements
EXP No. 4/ Field trip: Solid waste plants/recycling centre
EXP No. 5/ Field trip: Noise pollution
5
7
10
12
14

Komar University of Science and Technology (KUST)
3
LABORATORY EXPERIMENTS
Experiment No.1: Determination of Alkalinity in a water sample.
Objective: To Determine the Alkalinity of a given Water Sample.
Apparatus Required: Burette, Pipette, Conical Flask, and Beakers (Shown in Fig.1).
Fig.1: Apparutus required for Determination of Alkalinity in the water sample
Chemicals Required: N/10 HCl, Phenolphthalein and Methyl Orange (Shown in Fig.2).
Fig.2: Chemical required for Determination of Alkalinity in a water sample

Komar University of Science and Technology (KUST)
4
Theory:
Alkalinity in water is due to the presence of different ions in water. Determination of
alkalinity in water is based on titration of water sample against a standard acid using selective
indicators. The indicators used are phenolphthalein and methyl orange. The following
reactions take place:
i) OH- + H
+ H2O
ii) CO3 2-
+ H+HCO3-
iii) HCO3- + H
+H2CO3
The volume of the acid used up to phenolphthalein end point corresponds to the reaction i)
and ii), i.e., complete neutralization of OH- ions and CO3
2- ions up to HCO3
- stage. The
volume of the acid used up to methyl orange end point corresponds to the reaction i), ii), iii),
i.e., complete neutralization of OH-, CO3
2- and HCO3
- ions.
Thus from the volume of respective titration the strengths of various ions can be determined.
By measuring phenolphthalein alkalinity and methyl orange alkalinity, it is possible to
calculate the magnitude of various forms of alkalinity present in water sample, e.g.,
(i) Alkalinity due to HCO3- only
(ii) Alkalinity due to CO3 2-
only
(iii) Alkalinity due to CO3 2-
and HCO3-
(iv) Alkalinity due to CO3 2-
and OH-
(v) Alkalinity due to OH- only.
Case (I): When phenolphthalein alkalinity = 0, means OH- and CO3
2- both ions are absent.
Whatever alkalinity is present is due to HCO3- ions and can be detected using methyl orange
as indicator.
Case (II): When P = M/2, this means that only CO3 2-
ions are present. Neutralization reaches
up to HCO3 –
stage -using phenolphthalein as indicator. Same amount of acid will be further
used to neutralize HCO3 – to H2O and CO2. M or 2P will determine the strength of CO3
2-.

Komar University of Science and Technology (KUST)
5
Case (III): When P < M / 2, this means that in addition to CO32-
ions, HCO3– ions are also
present.
Alkalinity due to CO32-
= 2P
Alkalinity due to HCO3– = (M - 2P)
Case (IV): When P > M / 2, this means that in addition to CO32-
ions, OH- ions are also
present.
Let [OH-] = x and [CO3
2- ] = 2y,
Then P = x+y ---(i) and M = x + 2y ---(ii), so subtracting (i) from (ii), we get (M-P) = y ---
(iii) Putting the value of y from (iii) in (i), we get P = x + M-P
Or, [OH-]= x = 2P-M ---(iv) and [CO3
2- ] = 2y = 2 ( M-P)
Case (v) : When P = M, this means that only [OH- ] ions are present, so [OH
- ]= P=M
Significance:
Highly alkaline waters are usually unpalatable and upper limits with respect to
phenolphthalein alkalinity and total alkalinity are required to be specified. Alkaline waters
used in boilers for steam generation may lead to precipitation of sludges, deposition of
scale and cause caustic embitterment. A knowledge of the kinds of alkalinity present in
water and their magnitudes is important in calculating the amounts of lime [Ca(OH)2] and
soda [Na2(CO)3] needed for water softening.Use of different fertilizers in agriculture is
dictated by alkalinity of water.
Procedure:
a) Pipette out 20 ml of water sample into a conical flask. Add 2-3 drops of phenolphthalein.
b) Rinse and fill the burette with N/10 HCl.
c) Titrate the water sample in conical flask with N/10 HCl till the pink color just disappears.
d) Note down the reading and repeat to get three concordant readings.
e) Again take 20 ml of the water sample in conical flask and add 2-3 drops of methyl orange
indicator to it.
f) Titrate it using N/10 HCl till just a red color is obtained.
g) Record the observation and repeat to get three concordant readings.

Komar University of Science and Technology (KUST)
6
Observations:
Using Phenolphthalein:
Normality of the acid used = N/10
Note : If no color develops on addition of phenolphthalein to the water sample, it means
that phenolphthalein alkalinity is zero and hence do not titrate the sample for phenolphthalein
alkalinity.
Using Methyl Orange
Normality of the acid used = N/10
Calculations:
1. Phenolphthalein alkalinity in terms of CaCO3 Equiv. :
(Acid) (Water Sample)
N1V1 = N2V2
1/10 * V1 = N2 * 20
N2 = 1/10 * V1/ 20 = V1/ 200
Strength in terms of CaCO3 equiv. = N2 * Eq. wt. of CaCO3
(V1/ 200) * 50 g/L = X g/L
Phenolphthalein alkalinity (P) = X * 1000 mg/L = X * 1000 ppm.
2. Methyl orange Alkalinity in terms of CaCO3 Equiv. :
(Acid) (Water Sample)
N1Vi = N2V2
Komar University of Science and Technology (KUST)
7
1/10 * Vi = N2 * 20
N2 = 1/10 * Vi / 20 = V1/ 200
Strength in terms of CaCO3 equiv. = N2 * Eq. wt. of CaCO3
(V1/ 200) * 50 g/L = y g/L
Methyl orange alkalinity or total alkalinity of water sample = y * 1000 mg/L
Results:
Phenolphthalein alkalinity = ……. ppm. of CaCO3
Methyl orange alkalinity = …… ppm. of CaCO3
Questions:
1. Write the structural formula of methyl orange. In which forms does it exist in acidic and
alkaline medium
2. Explain the use of two different indicators in the above experiment on the basis of pH
change during the titration.
3. Explain the action of phenolphthalein as an acid base indicator.
4. Why the alkalinity is calculated in terms of CaCO3 equivalent?
5. Why Phenolphthalein cannot be used for titrating a weak base like HCO3-?
Komar University of Science and Technology (KUST)
8
Experiment No. 2: Determination of pH, and Conductivity for some water samples.
Objective: Determine the pH and Conductivity of given water samples.
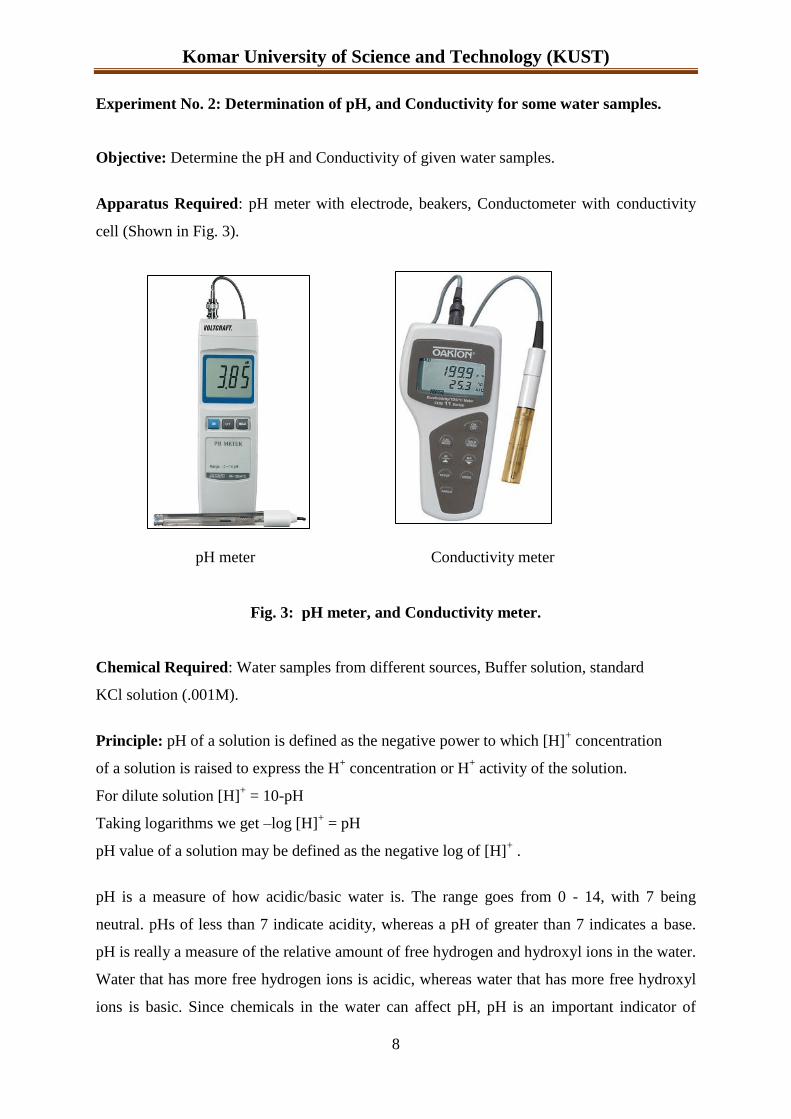
Apparatus Required: pH meter with electrode, beakers, Conductometer with conductivity
cell (Shown in Fig. 3).
pH meter Conductivity meter
Fig. 3: pH meter, and Conductivity meter.
Chemical Required: Water samples from different sources, Buffer solution, standard
KCl solution (.001M).
Principle: pH of a solution is defined as the negative power to which [H]+ concentration
of a solution is raised to express the H+ concentration or H
+ activity of the solution.
For dilute solution [H]+ = 10-pH
Taking logarithms we get –log [H]+ = pH
pH value of a solution may be defined as the negative log of [H]+ .
pH is a measure of how acidic/basic water is. The range goes from 0 - 14, with 7 being
neutral. pHs of less than 7 indicate acidity, whereas a pH of greater than 7 indicates a base.
pH is really a measure of the relative amount of free hydrogen and hydroxyl ions in the water.
Water that has more free hydrogen ions is acidic, whereas water that has more free hydroxyl
ions is basic. Since chemicals in the water can affect pH, pH is an important indicator of
Komar University of Science and Technology (KUST)
9
water that is changing chemically. pH is reported in "logarithmic units," like the Richter
scale, which measures earthquakes. Each number represents a 10- fold change in the
acidity/basic ness of the water. Water with a pH of five is ten times more acidic than water
having a pH of six.
The pH of water determines the solubility (amount that can be dissolved in the water) and
biological availability (amount that can be utilized by aquatic life) of chemical constituents
such as nutrients (phosphorus, nitrogen, and carbon) and heavy metals (lead, copper,
cadmium, etc.). For example, in addition to affecting how much and what form of phosphorus
is most abundant in the water, pH also determines whether aquatic life can use it. In the case
of heavy metals, the degree to which they are soluble determines their toxicity. Metals tend to
be more toxic at lower pH because they are more soluble.
Conductivity:
Conductivity is a measurement of the ability of an aqueous solution to carry an electrical
current. An ion is an atom of an element that has gained or lost an electron which will create
a negative or positive state. For example, sodium chloride (table salt) consists of sodium ions
(Na+) and chloride ions (Cl
-) held together in a crystal. In water it breaks apart into an
aqueous solution of sodium and chloride ions. This solution will conduct an electrical current.
An equation which shows this is:
Na (atom) + Cl (atom) Na+ Cl - (ionic crystal)
Na+Cl - (in a water solution) = Na+ (ion) + Cl - (ion)
There are several factors that determine the degree to which water will carry an electrical
current. These include:
1) The concentration or number of ions;
2) Mobility of the ion;
3) Oxidation state (valence) and;
4) Temperature of the water.
Conductivity is a measurement used to determine a number of applications related to water
quality. These are as follows:
1. Determining mineralization: this is commonly called total dissolved solids. Total
dissolved solids information is used to determine the overall ionic effect in a water

Komar University of Science and Technology (KUST)
10
source. The number of available ions in the water often affects certain physiological
effects on plants and animals.
2. Noting variation or changes in natural water and wastewaters quickly;
3. Estimating the sample size necessary for other chemical analyses; and
4. Determining amounts of chemical reagents or treatment chemicals to be added to a
water sample.
Elevated dissolved solids can cause "mineral tastes" in drinking water. Corrosion or
encrustation of metallic surfaces by waters high in dissolved solids causes problems with
industrial equipment and boilers as well as domestic plumbing, hot water heaters, toilet
flushing mechanisms, faucets, and washing machines and dishwashers.
Indirect effects of excess dissolved solids are primarily the elimination of desirable food
plants and habitat-forming plant species. Excessive dissolved solids limit agricultural uses of
water for livestock watering and high dissolved solids can be a problem in water used for
irrigation.
Procedure:
Determination of pH
1. Switch on the pH meter and connect the banana socket of pH electrode with the
instrument and allow it to warm up for 15 to 20 minutes.
2. Insert the electrode in buffer solution of 4.00 pH and adjust the desired value by using
CAL control.
3. Wash the electrode and carefully insert it into another buffer solution of 9.20 pH, adjust
the value again by using the CAL knob.
4. Now insert the electrode in the water sample 1, 2, 3, 4… respectively and note down the
pH values for each of the sample.
Determination of Conductivity.
1. Connect the conductivity cell to the instrument and allow it to warm up for 15 minutes.
2. Wash the cell with distilled water and calibrate the instrument as described in the working
manual.
3. Dip the cell in the water samples whose conductivity is to be measured.
4. Note down the conductivity of the water samples as displayed by the instrument.

Komar University of Science and Technology (KUST)
11
Procedure:
1. Pipette water out of the top of the first sample and place it in a sample tube, making sure
that no air bubbles are present in the sample. (Air bubbles will rinse while turbidity will
sink)
2. Carefully wipe the outside of the sample tube clean.
3. Place the sample tube in a calibrated turbidity meter and read the turbidity.
4. Repeat for the water from the other samples.
Observations:
Results and Report:
----------------------------------------
----------------------------------------
----------------------------------------
Precautions:
1. Handle the pH glass electrode very carefully and keep the pH meter always at stand by
mode when not in use.
2. Wash the pH electrode and Conductivity cell with distilled water after every observation.
3. Do not disturb the CAL mode of the instruments during the experiment.
Questions:
1. What is the pH?
2. Define conductivity of the solution.
3. What should be the range of drinking water pH?

Komar University of Science and Technology (KUST)
12
Experiment No. 3/ Field trip: Air pollution (Particulate Test)/measurements
Purpose
To determine the amount of foreign particles in the air in
a specific area.
Additional information
Breathing air is vital to our existence, but have you ever thought you might not be breathing
purely clean air? This simple experiment will give you an idea of how “dirty” your air is.
Required materials
White posterboard
Scissors
Vaseline
String
Hole punch
Magnifying glass
Permanent black marker
Journal or notebook
Procedure
1. Find an area in which you can hang several cut out pieces of the posterboard. You can do
this in your home if you’d like to find out how clean the air in your home is, or you can
hang the cut out pieces of posterboard outside in your yard or another area.
2. Cut the posterboard into several squares.
3. Draw a square with the marker on each cut out piece of posterboard, a little smaller than
the square itself.
4. Punch a hole in the top of each piece of posterboard and tie pieces of string in the holes so
you can hang the cut outs in various areas.

Komar University of Science and Technology (KUST)
13
5. Smear a thin layer of Vaseline inside the drawn square on each cut out and hang them in
different places within the area you’ve chosen. Record the areas you’ve hung each cut out
in your notebook.
6. In about a week, collect your squares.
Note
You may need an adult’s help cutting and punching holes into the posterboard or hanging the
cut out pieces of posterboard in high places so they are not disturbed.
Observation
With the magnifying glass, count how many particles you can see stuck to the Vaseline in
each square. Record the number of particles, as well as the location of each cut out in your
journal.
Results
You will most likely find some amount of particles stuck to the cut outs. Are there a lot of
particles or just a few? How do you think the area you’ve chosen to perform the experiment
in has affected your results? What do you think would happen if you performed this
experiment in a heavily polluted area, such as a big city or an area with known air pollution?
Do you think you would find more particles stuck to the cut outs? How do you think the
particles in the air affects the air quality and our ability to breathe well?

Komar University of Science and Technology (KUST)
14
Experiment No. 4/Field trip: Solid waste plants/recycling centre
Purpose: Our department synergizes classroom teaching with research, field trips, lecture
series and hands on experiences that expose students to the realities and professionals in their
field. Our thematic field trips focus on both civil and environmental engineering and offer our
students a first-hand look into their fields of study.
Objective: All students in the department participate in the Class Fieldtrip. This trip focuses
on solid waste plants, treatment techniques and their interaction with the larger environmental
systems. This trip will be conducted in Sulaymaniah at the recycling centre which has been
constructed by Lafarge Company and it would focus on various aspects of solid waste
treatment, strategies to minimize/prevent the solid waste disposable. The students will be
exposed to the following aspects: (i) Characterization and classification of solid waste by
kind, composition and sourceswaste sources; (ii) Collection, storage, transfer, and disposal
collection; (iii) Design and optimization collection and transfer mechanism; (iv) Design of
sanitary landfill; and (v) Post closure landfill monitoring and post monitoring. This trip will
also focus on solid waste systems design, and large reservoirs. The students extensively will
interact with design and project engineers and also have an opportunity to explore internships
with the organizations that we visit.
Apparatus Required:
Fig. 4: Solid Waste Samples and Plant
Komar University of Science and Technology (KUST)
15
Experiment No. 5/Field trip: Noise Pollution
Purpose: Our department synergizes classroom teaching with research, field trips, lecture
series and hands on experiences that expose students to the realities and professionals in their
field. Our thematic field trips focus on both civil and environmental engineering and offer our
students a first-hand look into their fields of study.
Objective: All students in the department participate in the Class Fieldtrip. This trip focuses
on various causes of noise and its impact on the environment. This trip will be conducted in
Sulaymaniah at different places including KUST and it would focus on various aspects of
noise pollution causes such as Industrialization, Poor Urban Planning, Social Events,
Transportation, Construction Activities, and Household Chores. The trip will also focus on
the possible strategies, rules and regulations that could be implemented to minimize/prevent
the noise as much as possible. The students will also be exposed to the effects of noise
pollution on Hearing Problems, Health Issues, Sleeping Disorders, Cardiovascular Issues,
Trouble Communicating and Effect on Wildlife. The students will extensively interact with
these causes and effects and will have better understanding on how to tackle these noise
problems and find effective ways to minimize it.
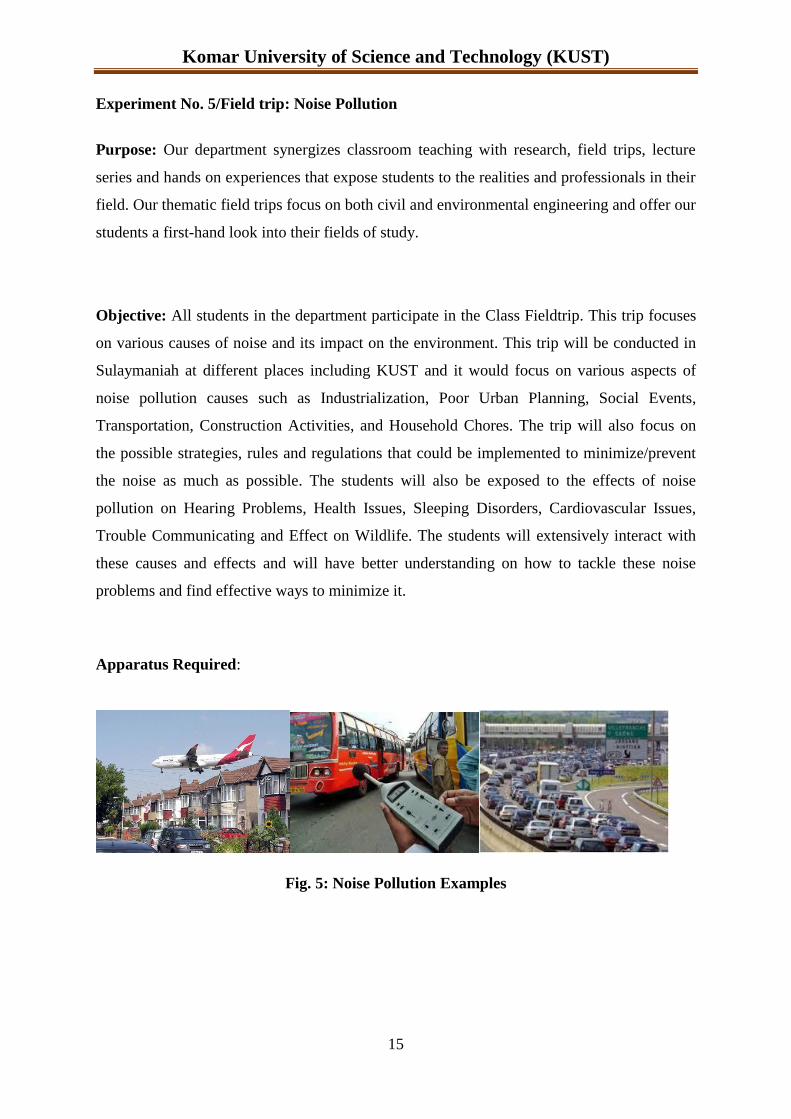
Apparatus Required:
Fig. 5: Noise Pollution Examples