environmental health effects analysis - ihs · environmental health effects analysis a study to...
TRANSCRIPT
Environmental Health Effects Analysis
A study to estimate health impacts and social costs of ambient air
pollution in Hyderabad, India
Working Paper - WP 58/2004 (1-17)
THE INSTITUTE OF HEALTH SYSTEMS
Environmental Health Effects Analysis
A study to estimate health impacts and social costs of ambient air pollution in Hyderabad, India.
Satish Kumar K1
Srinivasa Reddy N2
Dhanaraj3
3 Research Associate, The Institute of Health Systems, HACA Bhavan, Hyderabad, AP 500 0042 Research Associate, The Institute of Health Systems, HACA Bhavan, Hyderabad, AP 500 0041 Faculty in Environmental Health, The Institute of Health Systems, HACA Bhavan, Hyderabad, AP 500 004
Copyright © 2004 The Institute of Health Systems (IHS), Hyderabad AP India.
All rights reserved. No part of this book may be reproduced, stored in a retrieval system,transmitted or utilised in any form or by any means, electronic, mechanical, photocopying,recording or otherwise without permission in writing from the Publishers.
The Institute of Health SystemsHACA Bhavan, Hyderabad, AP - 500 004, IndiaPh: 91-40-23210136/9,23211013/4; Fax:91-40-23241567Email: [email protected]; http://www.ihsnet.org.in
Printed in Hyderabad, 2004
IHS Library Cataloguing-in-Publication DataEnvironmental Health Effects Analysis - A study to estimate health impacts and social costs ofambient air pollution in India, Hyderabad. : 1st Edition\Satish Kumar, Srinivasa Reddy andDhanaraj
Includes bibliographic references1. Health Effects Analysis 2. Air Pollutants 3. Particulate Matter 4. Benefits Calculation 5.Respiratory DiseasesI. Satish Kumar II. Srinivasa Reddy III. Dhanaraj
363.739’5484-ddc21
Acknowledgments
Our thanks are due to The United States Agency for International Development
(USAID), The United States Environment Protection Agency, and the National Renewable
Energy Laboratory, who provided financial assistance for the study and the required support,
and continued to follow up with a keen interest in the results of the study and also in the
development of the report. Our thanks are especially due to the Environment Protection
Training & Research Institute (EPTRI) our collaborators for the study for providing
necessary support in the design and execution of the study. We express our sincere thanks to
many individuals for their valuable contribution in the study including, Mr.John Smith-Sreen
(USAID), Ms. Katherine Sibold (USEPA), Mr. Collin Green & Mr. Adam Chambers (NREL),
Dr. Luis Cifuentes (P Catholic University of Chile) and Dr. VNVK Sastry, Mr. NS Vatcha &
Dr. V. Srinivas (EPTRI).
We are thankful to the Director of Census Operations for providing demographic
data for Hyderabad Urban Development Area. We are also thankful to all the Municipal
Commissioners of the HUDA area for providing mortality data of their respective
municipalities. We thank Commissioner of APVVP, Medical Superintendents of Osmania
General Hospital, Gandhi General Hospital, Niloufer Hospital, ESI Hospital, Director of
Nizam’s Institute of Medical Sciences, and Medical Officer’s of Government Hospitals and
PHCs, Private Medical Practitioners and Heads of Nursing Homes & Private Hospitals for
providing morbidity data of the study area.
We are grateful to the Director and staff of the IHS for their support in the conduct
of the study.
iThe Institute of Health Systems , HACA Bhavan, Hyderabad, AP 500004, India.

CONTENTS
I. Abbreviations and Acronyms 1
II. Executive Summary 2
III. Introduction 3
IV. Objectives 5
V. Methodology 51. Data Collection Process 5
2. Health Effects Quantification 6
3. CR Functions 10
4. Benefits calculation 13
VI. Results
1. Change in Ambient Concentrations 14
2. Change in Health Effects 15
3. Benefits Estimation 17
VII. Acknowledgements

Abbreviations and Acronyms
APHEBA Air Pollution Health Effects Benefit Analysis
BAU Business as Usual
BG Biogas
CHC Community Health Centre
COI Cost of Illness
COPD Chronic Obstructive Pulmonary Disease
CR Function Concentration Response Function
CVD Cardiovascular Disease
ESI Employees State Insurance
GVH Government Hospital
HCA Human Capital Approach
HUDA Hyderabad Urban Development Area
ICD International Classification of Disease
IES Integrated Environmental Strategies
IHS Institute of Health Systems
MCH Municipal Corporation of Hyderabad
NG Natural Gas
PCI Per Capita Income
PHC Primary Health Centre
PM Particulate Matter
PM10 Particulate Matter less than 10 microns in diameter
RSP Respiratory Ailment
SPM Suspended Particulate Matter
TSP Total Suspended Particulate
VSL Value of Statistical Life
WHO World Health Organisation
Environmental Health Effects Analysis
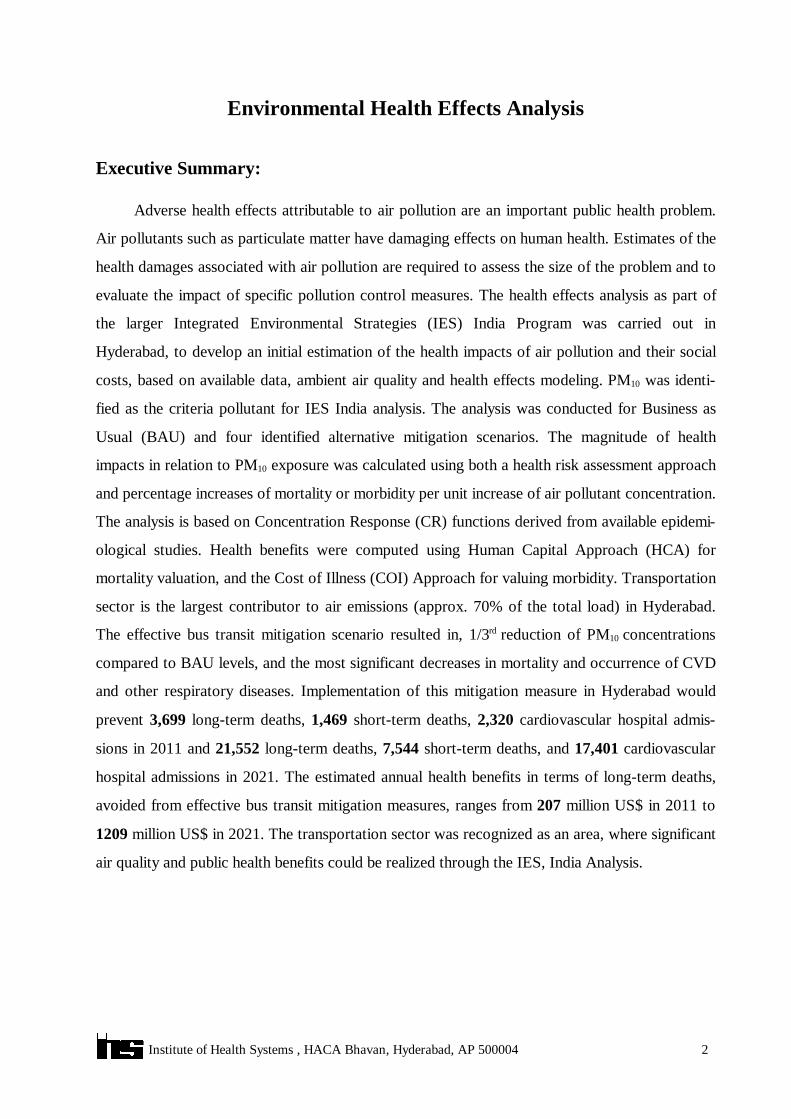
Executive Summary:
Adverse health effects attributable to air pollution are an important public health problem.
Air pollutants such as particulate matter have damaging effects on human health. Estimates of the
health damages associated with air pollution are required to assess the size of the problem and to
evaluate the impact of specific pollution control measures. The health effects analysis as part of
the larger Integrated Environmental Strategies (IES) India Program was carried out in
Hyderabad, to develop an initial estimation of the health impacts of air pollution and their social
costs, based on available data, ambient air quality and health effects modeling. PM10 was identi-
fied as the criteria pollutant for IES India analysis. The analysis was conducted for Business as
Usual (BAU) and four identified alternative mitigation scenarios. The magnitude of health
impacts in relation to PM10 exposure was calculated using both a health risk assessment approach
and percentage increases of mortality or morbidity per unit increase of air pollutant concentration.
The analysis is based on Concentration Response (CR) functions derived from available epidemi-
ological studies. Health benefits were computed using Human Capital Approach (HCA) for
mortality valuation, and the Cost of Illness (COI) Approach for valuing morbidity. Transportation
sector is the largest contributor to air emissions (approx. 70% of the total load) in Hyderabad.
The effective bus transit mitigation scenario resulted in, 1/3rd reduction of PM10 concentrations
compared to BAU levels, and the most significant decreases in mortality and occurrence of CVD
and other respiratory diseases. Implementation of this mitigation measure in Hyderabad would
prevent 3,699 long-term deaths, 1,469 short-term deaths, 2,320 cardiovascular hospital admis-
sions in 2011 and 21,552 long-term deaths, 7,544 short-term deaths, and 17,401 cardiovascular
hospital admissions in 2021. The estimated annual health benefits in terms of long-term deaths,
avoided from effective bus transit mitigation measures, ranges from 207 million US$ in 2011 to
1209 million US$ in 2021. The transportation sector was recognized as an area, where significant
air quality and public health benefits could be realized through the IES, India Analysis.
2 Institute of Health Systems , HACA Bhavan, Hyderabad, AP 500004
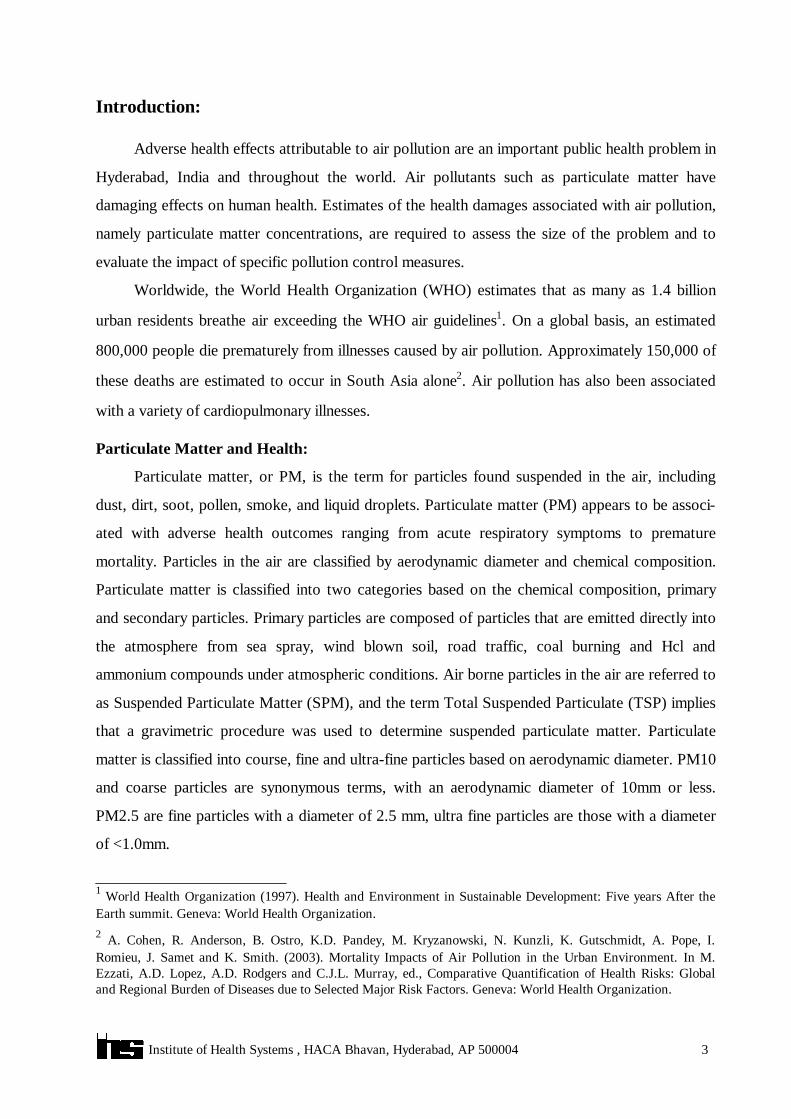
Introduction:
Adverse health effects attributable to air pollution are an important public health problem in
Hyderabad, India and throughout the world. Air pollutants such as particulate matter have
damaging effects on human health. Estimates of the health damages associated with air pollution,
namely particulate matter concentrations, are required to assess the size of the problem and to
evaluate the impact of specific pollution control measures.
Worldwide, the World Health Organization (WHO) estimates that as many as 1.4 billion
urban residents breathe air exceeding the WHO air guidelines1. On a global basis, an estimated
800,000 people die prematurely from illnesses caused by air pollution. Approximately 150,000 of
these deaths are estimated to occur in South Asia alone2. Air pollution has also been associated
with a variety of cardiopulmonary illnesses.
Particulate Matter and Health:
Particulate matter, or PM, is the term for particles found suspended in the air, including
dust, dirt, soot, pollen, smoke, and liquid droplets. Particulate matter (PM) appears to be associ-
ated with adverse health outcomes ranging from acute respiratory symptoms to premature
mortality. Particles in the air are classified by aerodynamic diameter and chemical composition.
Particulate matter is classified into two categories based on the chemical composition, primary
and secondary particles. Primary particles are composed of particles that are emitted directly into
the atmosphere from sea spray, wind blown soil, road traffic, coal burning and Hcl and
ammonium compounds under atmospheric conditions. Air borne particles in the air are referred to
as Suspended Particulate Matter (SPM), and the term Total Suspended Particulate (TSP) implies
that a gravimetric procedure was used to determine suspended particulate matter. Particulate
matter is classified into course, fine and ultra-fine particles based on aerodynamic diameter. PM10
and coarse particles are synonymous terms, with an aerodynamic diameter of 10mm or less.
PM2.5 are fine particles with a diameter of 2.5 mm, ultra fine particles are those with a diameter
of <1.0mm.
3 Institute of Health Systems , HACA Bhavan, Hyderabad, AP 500004
2 A. Cohen, R. Anderson, B. Ostro, K.D. Pandey, M. Kryzanowski, N. Kunzli, K. Gutschmidt, A. Pope, I.Romieu, J. Samet and K. Smith. (2003). Mortality Impacts of Air Pollution in the Urban Environment. In M.Ezzati, A.D. Lopez, A.D. Rodgers and C.J.L. Murray, ed., Comparative Quantification of Health Risks: Globaland Regional Burden of Diseases due to Selected Major Risk Factors. Geneva: World Health Organization.
1 World Health Organization (1997). Health and Environment in Sustainable Development: Five years After theEarth summit. Geneva: World Health Organization.
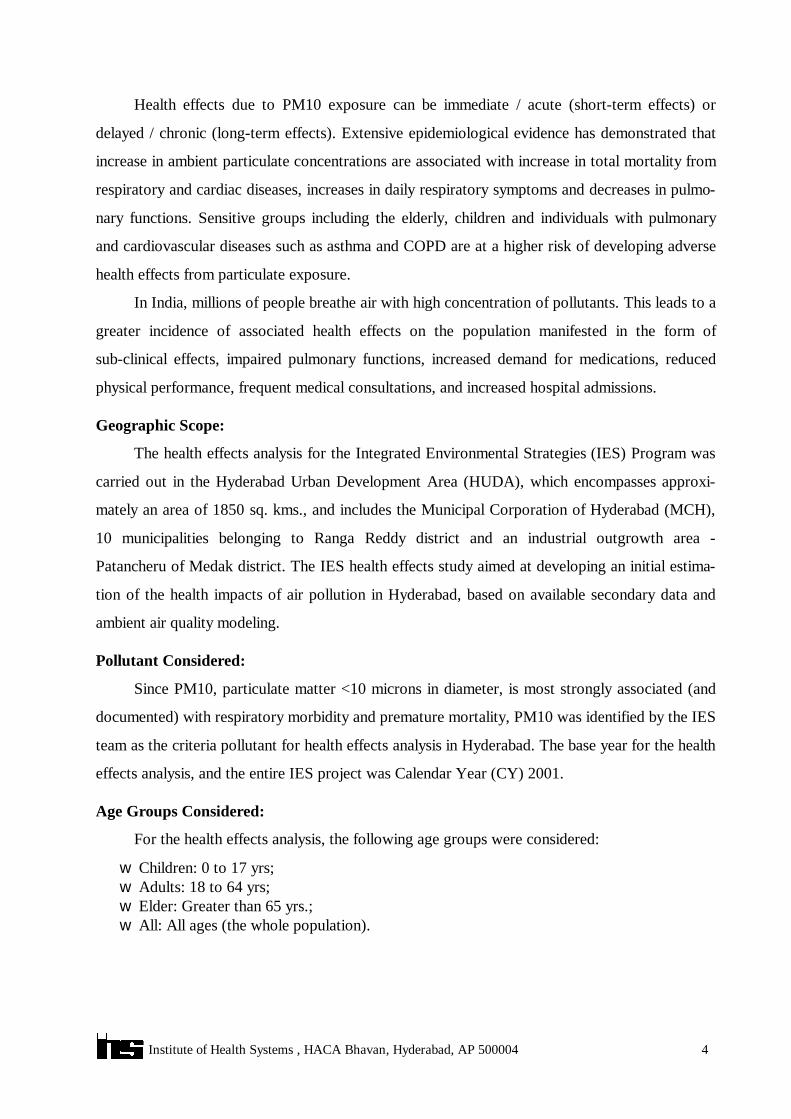
Health effects due to PM10 exposure can be immediate / acute (short-term effects) or
delayed / chronic (long-term effects). Extensive epidemiological evidence has demonstrated that
increase in ambient particulate concentrations are associated with increase in total mortality from
respiratory and cardiac diseases, increases in daily respiratory symptoms and decreases in pulmo-
nary functions. Sensitive groups including the elderly, children and individuals with pulmonary
and cardiovascular diseases such as asthma and COPD are at a higher risk of developing adverse
health effects from particulate exposure.
In India, millions of people breathe air with high concentration of pollutants. This leads to a
greater incidence of associated health effects on the population manifested in the form of
sub-clinical effects, impaired pulmonary functions, increased demand for medications, reduced
physical performance, frequent medical consultations, and increased hospital admissions.
Geographic Scope:
The health effects analysis for the Integrated Environmental Strategies (IES) Program was
carried out in the Hyderabad Urban Development Area (HUDA), which encompasses approxi-
mately an area of 1850 sq. kms., and includes the Municipal Corporation of Hyderabad (MCH),
10 municipalities belonging to Ranga Reddy district and an industrial outgrowth area -
Patancheru of Medak district. The IES health effects study aimed at developing an initial estima-
tion of the health impacts of air pollution in Hyderabad, based on available secondary data and
ambient air quality modeling.
Pollutant Considered:
Since PM10, particulate matter <10 microns in diameter, is most strongly associated (and
documented) with respiratory morbidity and premature mortality, PM10 was identified by the IES
team as the criteria pollutant for health effects analysis in Hyderabad. The base year for the health
effects analysis, and the entire IES project was Calendar Year (CY) 2001.
Age Groups Considered:
For the health effects analysis, the following age groups were considered:
w Children: 0 to 17 yrs; w Adults: 18 to 64 yrs; w Elder: Greater than 65 yrs.; w All: All ages (the whole population).
4 Institute of Health Systems , HACA Bhavan, Hyderabad, AP 500004

Objectives :
1. Develop an initial estimation of the health impacts of air pollution in Hyderabad and their
social costs, based on available secondary data.
2. Identify the most relevant health and social welfare impacts.
3. Identify data gaps and research needs for future assessments.
Methodology:
Data Collection Process
Population data:
Age-wise and sex-wise population data of the study area were obtained from the Census of
India 2001.
Mortality data :
Data on all cause and cause specific deaths, from non-external causes, excluding the trauma
deaths, age and sex-wise for the year 2001 were obtained from the Directorate of Health /
Municipal Health Offices falling under the MCH area and 10 municipalities of Ranga Reddy
Districts.
Morbidity data :
Cause-specific morbidity data for the selected health endpoints were collected from Health
Care Institutions (HCI) selected using APHIDB (Andhra Pradesh Health Institutions Database)
an electronic database maintained by IHS. The selection of hospitals was done to be representa-
tive of the study area. Initial survey of all major hospitals and health posts within the study area
revealed that record keeping, particularly with respect to retrospective data was very poor.
Hence, data was collected from only 28 hospitals (Table 1) out of total 68 hospitals visited in and
around HUDA area, based on availability of medical records.
5 Institute of Health Systems , HACA Bhavan, Hyderabad, AP 500004

NA: Data not availableNAGovernmentMalkajgiri GVH28NAGovernmentQuthbullapur PHC27NAGovernmentAlwal CHC26NAGovernmentSerilingampally PHC25NAGovernmentKesara PHC24NAGovernmentRamchandrapuram PHC23NAGovernmentGatkesar PHC22NAGovernmentUppal PHC21NAGovernmentGovernment Unani Dispensary206GovernmentBalanagar PHC19
NAGovernmentAPVVP Government Dispensary18
125Non-profit Registeredtrust
Indo-American Cancer Hospital andResearch Centre
17NAPrivateMediciti Hospital16350PrivateApollo Hospital15NAPrivateDr. R. Vijay Kumar Clinic1430GovernmentRajendranagar CHC13
100GovernmentGolconda Area Hospital12100GovernmentMalakpet Area Hospital11100GovernmentNampally Area Hospital10100GovernmentVanasthalipuram Area Hospital9200GovernmentKing Koti District Hospital8300GovernmentNiloufer Hospital7334GovernmentESI Hospital6
330GovernmentSir Ronald Institute of Tropical &Communicable Disease Hospital
5670GovernmentA.P. General and Chest Hospital4735GovernmentNizam’s Institute of Medical Sciences3
1,012GovernmentGandhi General Hospital21,168GovernmentOsmania General Hospital1
Bed strengthType of ManagementName of the HospitalS. No.
Table-1: List of hospitals that provided cause-specific morbidity data
Health Effects Quantification:The magnitude of health impacts in relation to PM10 exposure was calculated using both a
health risk assessment approach and percent increase of mortality or morbidity per unit increase
of air pollutant concentration.
Since most of the epidemiological studies linking air pollution and health endpoints are
based on a relative risk model in the form of Poisson regression, the number of health effects at a
given concentration C, is given by the following Equation:
Effects (C) = exp(ß×(C-C0))×R0 ×Pop
In the above Equation, ß is the slope of the CR function, C and C0 are concentrations of
the air pollutants in one specific scenario and baseline scenario respectively, R0 refers to the base
rate of effects at concentration C0, and Pop is the exposed population.
6 Institute of Health Systems , HACA Bhavan, Hyderabad, AP 500004
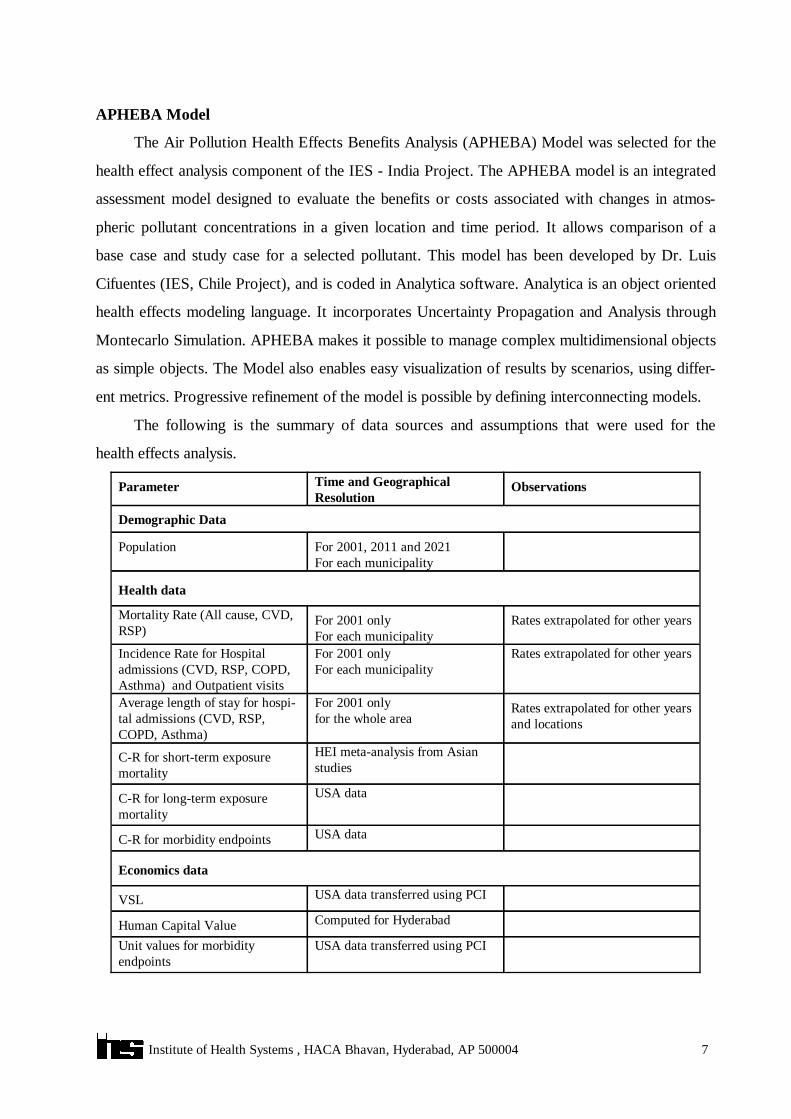
APHEBA Model
The Air Pollution Health Effects Benefits Analysis (APHEBA) Model was selected for the
health effect analysis component of the IES - India Project. The APHEBA model is an integrated
assessment model designed to evaluate the benefits or costs associated with changes in atmos-
pheric pollutant concentrations in a given location and time period. It allows comparison of a
base case and study case for a selected pollutant. This model has been developed by Dr. Luis
Cifuentes (IES, Chile Project), and is coded in Analytica software. Analytica is an object oriented
health effects modeling language. It incorporates Uncertainty Propagation and Analysis through
Montecarlo Simulation. APHEBA makes it possible to manage complex multidimensional objects
as simple objects. The Model also enables easy visualization of results by scenarios, using differ-
ent metrics. Progressive refinement of the model is possible by defining interconnecting models.
The following is the summary of data sources and assumptions that were used for the
health effects analysis.
USA data transferred using PCIUnit values for morbidityendpoints
Computed for HyderabadHuman Capital Value
USA data transferred using PCIVSL
Economics data
USA dataC-R for morbidity endpoints
USA dataC-R for long-term exposuremortality
HEI meta-analysis from Asianstudies
C-R for short-term exposuremortality
Rates extrapolated for other yearsand locations
For 2001 onlyfor the whole area
Average length of stay for hospi-tal admissions (CVD, RSP,COPD, Asthma)
Rates extrapolated for other yearsFor 2001 onlyFor each municipality
Incidence Rate for Hospitaladmissions (CVD, RSP, COPD,Asthma) and Outpatient visits
Rates extrapolated for other yearsFor 2001 onlyFor each municipality
Mortality Rate (All cause, CVD,RSP)
Health data
For 2001, 2011 and 2021For each municipality
Population
Demographic Data
ObservationsTime and Geographical Resolution
Parameter
7 Institute of Health Systems , HACA Bhavan, Hyderabad, AP 500004
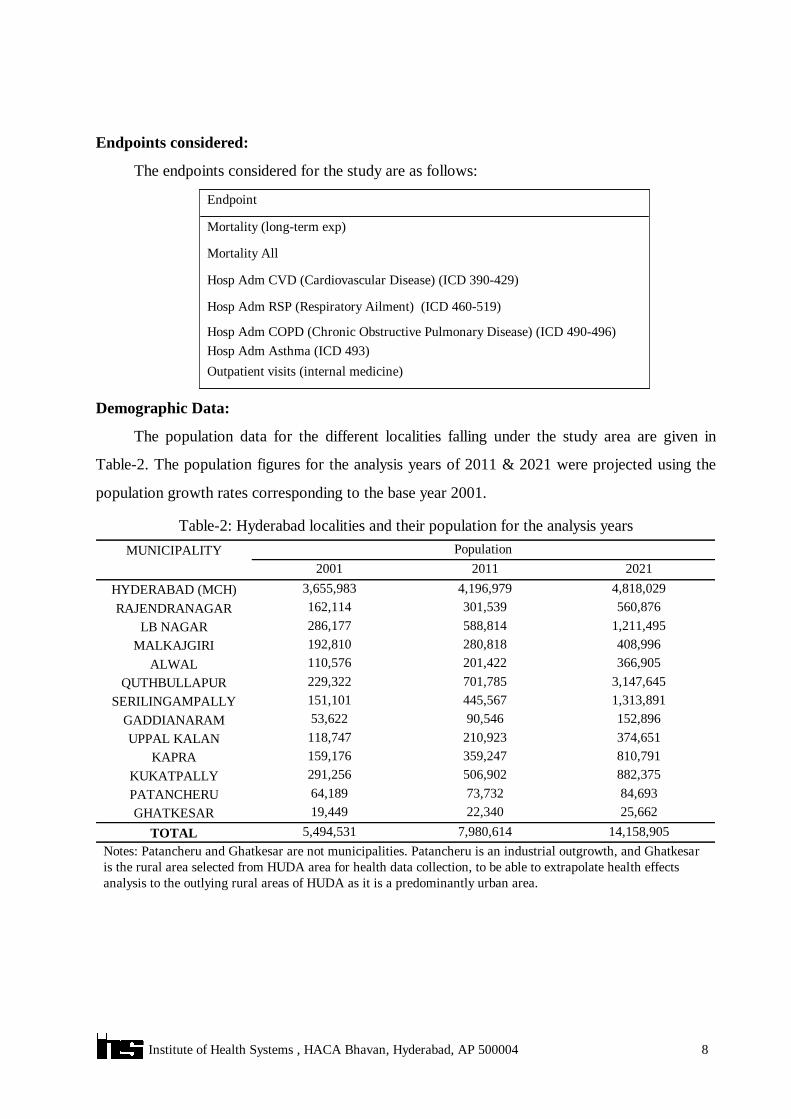
Endpoints considered:
The endpoints considered for the study are as follows:
Outpatient visits (internal medicine)Hosp Adm Asthma (ICD 493) Hosp Adm COPD (Chronic Obstructive Pulmonary Disease) (ICD 490-496)
Hosp Adm RSP (Respiratory Ailment) (ICD 460-519)
Hosp Adm CVD (Cardiovascular Disease) (ICD 390-429)
Mortality All
Mortality (long-term exp)
Endpoint
Demographic Data:
The population data for the different localities falling under the study area are given in
Table-2. The population figures for the analysis years of 2011 & 2021 were projected using the
population growth rates corresponding to the base year 2001.
Notes: Patancheru and Ghatkesar are not municipalities. Patancheru is an industrial outgrowth, and Ghatkesaris the rural area selected from HUDA area for health data collection, to be able to extrapolate health effectsanalysis to the outlying rural areas of HUDA as it is a predominantly urban area.
14,158,9057,980,6145,494,531TOTAL25,66222,34019,449GHATKESAR84,69373,73264,189PATANCHERU
882,375506,902291,256KUKATPALLY810,791359,247159,176KAPRA374,651210,923118,747UPPAL KALAN152,89690,54653,622GADDIANARAM
1,313,891445,567151,101SERILINGAMPALLY3,147,645701,785229,322QUTHBULLAPUR366,905201,422110,576ALWAL408,996280,818192,810MALKAJGIRI
1,211,495588,814286,177LB NAGAR560,876301,539162,114RAJENDRANAGAR
4,818,0294,196,9793,655,983HYDERABAD (MCH)202120112001
PopulationMUNICIPALITY
Table-2: Hyderabad localities and their population for the analysis years
8 Institute of Health Systems , HACA Bhavan, Hyderabad, AP 500004

Health Data:
The baseline mortality rates for the base year 2001 for the different localities are given in
Table-3.
NB: * Completed with data from Municipal Corporation of Hyderabad (MCH) Area.
4106.90*430.72*184.43*433.78*GHATKESAR4106.90*430.72*184.43*433.78*PATANCHERU2521.82209.7815.46185.09KUKATPALLY2560.20172.591.49159.57KAPRA3160.04319.63184.43 *176.85UPPAL KALAN3386.00681.6713.26201.40GADDIANARAM2029.37154.3010.98140.30SERILINGAMPALLY2287.52210.405.17175.30QUTHBULLAPUR5290.04233.74184.43*260.45ALWAL5210.30256.842.46272.29MALKAJGIRI4342.31315.1415.73288.63LB NAGAR2240.48139.362.92133.85RAJENDRANAGAR4106.91430.72184.43433.78HYDERABAD (MCH)
ElderAdultChildrenAllMun.Corporation/Municipality
Table-3: Baseline mortality rate by municipalities for the year 2001 (cases/100,000)/year)
The baseline incidence rate data for morbidity endpoints for Municipal Corporation of
Hyderabad (MCH) area for the year 2001 is given in Table-4.
2422.62250.83990.42996.5Outpatient visits (internalmedicine)
107.5840.0119.2533.15Hosp Adm Asthma (ICD 493)546.1757.281.4347.84Hosp Adm COPD194.47136.5289.27118.11Hosp Adm RSP (ICD 460-519)788.22139.753.14100.62Hosp Adm CVD (ICD 390-429)ElderAdultChildrenAllEndpoint
Table-4: MCH incidence rate data for morbidity end points
The average length of stay for different morbidity endpoints, were computed based on the
date of admission and date of discharge recorded in the case sheets of public hospitals of HUDA
area. The same is shown in Table-5.
Source: Health records of public hospitals in HUDA area10.298.808.436.76All Ages8.799.029.346.6664+10.418.928.247.2717-6411.428.248.075.330-17COPDRSPCVDAsthmaAge Group
Table-5: Average Length of Hospital Stay for Hospital Admissions Endpoints (days per event)
9 Institute of Health Systems , HACA Bhavan, Hyderabad, AP 500004

Concentration-Response Functions:
Concentration-Response (C-R) functions are one of the most critical areas. Unfortunately,
there are few studies conducted in India. However, a recent meta-analysis has been conducted on
Asian studies. The results of the meta-analysis give a beta of 0.0004 and a Std. Dev. of 0.00008
for all cause mortality. These were used in the IES health effects analysis.
The following figure shows the C-R function in the relevant range of concentrations
observed in the municipalities. We have assumed a base concentration of 121 µg/m3, the popula-
tion weighted mean of all localities.
Figure 1: C-R function for All cause mortality (mid value and 95% CI)
-5%
0%
5%
10%
15%
20%
25%
30%
35%
0 100 200 300 400 500 600
C oncentration (ug/m3)
% In
crem
ent
in N
umbe
r of
cas
es
Note: Lower and upper dotted lines in the above graph represent low and high values, and solid line representsmid value respectively of the CR coefficient for all-cause mortality.
10 Institute of Health Systems , HACA Bhavan, Hyderabad, AP 500004
HEI International Scientific Oversight Committee (2004). Health Effects of Outdoor Air Pollution in Developing Countries of Asia: A LiteratureReview. Boston, MA, Health Effects Institute. Available at http://www.healtheffects.org/Pubs/SpecialReport15.pdf

For the other endpoints, C-R functions were used with the following relative risks:
2.6%---Hosp Adm COPD (ID 490-496)1.70%--0.02%Hosp Adm RSP (ICD 460-519)1.20%--2.30%Hosp Adm CVD (ICD 390-429)
--4.00%0.40%Mortality All---3.40%Mortality (long-term exp)
ElderAdultChildrenAllEndpoint
Table–6: Estimated % increase in effects per 10 mg/m3 of PM10 for different endpoints
Long-term Effects of Particulate Matter: Long term effects of Particulate Matter pollution are more difficult to consider. The risk
coefficient for long-term mortality is much higher (see above Table-6, the coefficient is 8 times
more) than that for short-term effects. That means that at higher concentrations, the risk is
bigger. Also, there are problems with extrapolation outside the range of the original studies,
which is about 10-30 µg/m3 of PM2.5.
Since there are no Asian studies at higher concentrations (all of them have been performed
in the US), one should make some assumptions about the shape of the C-R function outside the
range of the original study. The next figure shows some of such assumptions, proposed by the
group that performed the Global Burden of Disease calculation for the WHO.
Figure-2: Alternative concentration-response curves for mortality from cardio-pulmonary disease, using different scenarios
11 Institute of Health Systems , HACA Bhavan, Hyderabad, AP 500004

Source: Figure 17.7 Cohen, A. J., H. R. Anderson, et al. (2004). Chapter 17: Urban air pollution. ComparativeQuantification of Health Risks.
In this analysis we assumed a linear C-R function for long-term mortality. It must be noted
that this probably results in an overestimation of the long-term exposure effects. Also, the original
studies considered an exposure that lasted 18 or so years. If the pollution levels are growing
rapidly, then the annual average will be higher than the moving average for the past years, also
resulting in an overestimation of the impacts. Therefore, for the calculation of the impacts of the
long-term exposure, we computed the average exposure during the last 20 years. For 2021, this
corresponds to the average of 2001, 2011 and 2021 levels. For 2011, this corresponds to the
averages of 1991, 2001, and 2011. For 1991 value, we assumed the same value as for 2001.
Control Scenarios:
The health effects analysis was conducted for Business as Usual (BAU) years: 2001, 2011,
2021 and four identified alternative mitigation scenarios. The scenarios considered are as follows:
Industrial Control Mitigation ScenarioControl 4C4Industrial (Fuel Additives) Mitigation ScenarioControl 3C3Combined Industrial (NG+BG) Mitigation Scenario Control 2C2Alternative – Transport – Bus Transit Mitigation Scenario Control 1C1BAU for years 2001, 2011, 2021Base CaseBaseDefinitionScenario
Pollutant Concentrations
The PM10 concentrations municipality –wise and for the baseline and alternative scenarios
are given in Table-7.
20212011202120112021201120212011202120112001
C4IndustrialControl Mitiga-tion Scenario
C3Industrial (FuelAdditives)MitigationScenario
C2Combined Indus-trial (NG+BG)MitigationScenario
C1Alternative -Transport -Bus TransitMitigationScenario
BaseLocality
Table- 7: Concentrations for each scenario (mg/m3)
21070210701857060402107030KUKATPALLY11040110501104040301107020KAPRA2601102601102601001006026011040UPPAL KALAN 31018031017031017014010031023070GADDIANARAM21080210702107060402107030SERILINGAMPALLY51021048521051021018011056022080QUTHBULLAPUR285130285120285130907028514060ALWAL604011050110404030605020MALKAJGIRI
2601202601302601201007031013070LB NAGAR24410924699219119505036012030RAJENDRANAGAR1009420100942010094204902601010420160HYDERABAD (MCH)
12 Institute of Health Systems , HACA Bhavan, Hyderabad, AP 500004

16040160401354050401605030GHATKESAR53519053519048514018010056019090PATANCHERU
Table–8, presents population weighted average concentrations that were computed to havea sense of the changes in PM10 concentration:
550275-C4-Industrial Control 546275-C3-Industrial (Fuel Additives) 549274-C2-Combined Industrial (NG+BG) 238166-C1-Alternative – Transport – Bus Transit Mitigation Scenario571279121Base
202120112001Case
Table-8: Population Weighted average Concentrations for each scenario (mg/m3)
Benefits Calculations:
Valuation of health effects is a crucial component in assessing the social costs of air pollu-
tion, since it allows the performance of cost-benefit analysis of pollution control measures and
provides a basis for setting priorities for actions. In order to perform the economic valuation of
health effects of air pollution, we need to know first the unit cost of valuation to translate health
impacts into economic values. Benefits were computed using values derived from local data and
values transferred from the USA.
Human Capital Approach (HCA):
Human Capital Approach (HCA) was followed for mortality valuation. Premature deaths
were valued using the value of a statistical life (VSL), which is estimated as the discounted value
of expected future income at the average age. The VSL was computed using a life expectancy at
birth of 62.5 years, and an average age of the population of 27.5 years. The average annual wage
considered was US$357.55 using an annual discount rate of 5%. The VSL for Hyderabad was
estimated at US$ 6, 212.
Willingness To Pay (WTP):
There are no Indian studies of WTP to reduce risks of death. Therefore, the US values
were transferred to India. The current value used in the US is 5.5M US$. The annual per capita
income for USA is US$ 35,060. For India the per capita income (PCI) is US$ 480, while
expressed in purchase power parity (PPP) it is $25704. For PCI however, we used the value
computed for India, that is $357. The following table shows the VSL values (US $ per case)
transferred from USA to India for the present analysis.
13 Institute of Health Systems , HACA Bhavan, Hyderabad, AP 500004
4 World Development Report, 2002. Building Institutions for Markets. The World Bank. Washington, D.C.www.worldbank.org
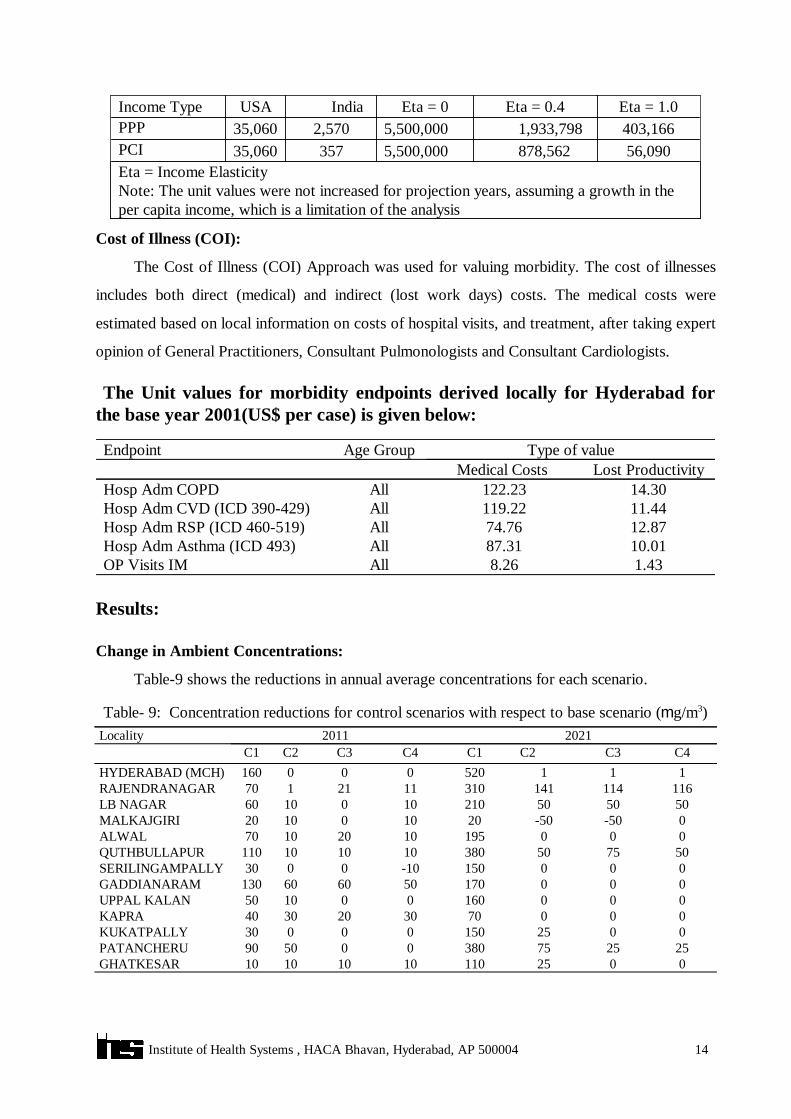
Eta = Income ElasticityNote: The unit values were not increased for projection years, assuming a growth in theper capita income, which is a limitation of the analysis
56,090878,5625,500,00035735,060PCI403,1661,933,7985,500,0002,57035,060PPPEta = 1.0Eta = 0.4Eta = 0IndiaUSAIncome Type
Cost of Illness (COI):
The Cost of Illness (COI) Approach was used for valuing morbidity. The cost of illnesses
includes both direct (medical) and indirect (lost work days) costs. The medical costs were
estimated based on local information on costs of hospital visits, and treatment, after taking expert
opinion of General Practitioners, Consultant Pulmonologists and Consultant Cardiologists.
The Unit values for morbidity endpoints derived locally for Hyderabad forthe base year 2001(US$ per case) is given below:
1.438.26AllOP Visits IM10.0187.31AllHosp Adm Asthma (ICD 493)12.8774.76AllHosp Adm RSP (ICD 460-519)11.44119.22AllHosp Adm CVD (ICD 390-429)14.30122.23AllHosp Adm COPD
Lost ProductivityMedical Costs Type of valueAge GroupEndpoint
Results:
Change in Ambient Concentrations:
Table-9 shows the reductions in annual average concentrations for each scenario.
002511010101010GHATKESAR252575380005090PATANCHERU002515000030KUKATPALLY0007030203040KAPRA000160001050UPPAL KALAN 000170506060130GADDIANARAM000150-100030SERILINGAMPALLY
507550380101010110QUTHBULLAPUR00019510201070ALWAL0-50-50201001020MALKAJGIRI
5050502101001060LB NAGAR1161141413101121170RAJENDRANAGAR
111520000160HYDERABAD (MCH)C4C3C2C1C4C3C2C1
20212011Locality
Table- 9: Concentration reductions for control scenarios with respect to base scenario (mg/m3)
14 Institute of Health Systems , HACA Bhavan, Hyderabad, AP 500004

Change in Health Effects:
The change in health effects is computed using the formula based on the Poisson CR
functions. The excess cases in each scenario with respect to base case scenario are computed
based on the change of population exposure levels to PM10 under each scenario, CR functions,
and baseline rates for the health outcomes. The baseline for 2001 corresponds to the population
multiplied by the mortality rate. For the years 2011 and 2021, the mortality rate was increased
corresponding to the increase in air pollution levels.
The baseline number of deaths (cases per year) municipality-wise is shown in Table-10.
39,08326,13020,119TOTAL11798158GHATKESAR445333521PATANCHERU
1,758954539KUKATPALLY1,342585254KAPRA725384210UPPAL KALAN160138108GADDIANARAM
1,985625212SERILINGAMPALLY6,7181303402QUTHBULLAPUR1048542288ALWAL1,132774525MALKAJGIRI3,8581,741826LB NAGAR859418217RAJENDRANAGAR
29,61420,25415,859HYDERABAD (MCH)202120112001Municipality
Table-10: Baseline number of deaths by municipality ( cases per year)
The total number of mortality / morbidity cases for all localities for the base and projection
years are summarized in Table-11.
2291701344,0722,7452,128Hosp Adm COPD (ICD 490-496)1,5189736709,9576,6915,188Hosp Adm RSP (ICD 460-519)2,5131,7421,32413,0078,6766,500Hosp Adm CVD (ICD 390-429)12,0528,1076,00649,62528,03519,702Mortality202120112001202120112001
ElderAll PopulationEnd pointTable-11: Baseline number of mortality & morbidity cases (Total for all localities, cases per year)
15 Institute of Health Systems , HACA Bhavan, Hyderabad, AP 500004

The number of cases of short-term mortality avoided in the projection years of 2011 and 2021
municipality-wise and scenario-wise is presented in Table-12.
2713603297,5443020341,470Total00151111Ghatkesar55136400712Patancheru001810500012Kukatpally0003875710Kapra000460028Uppal Kalan00020001Gaddiannaram0001183008Serilingampally
13620313696955557Quthbullapur0008124215Alwal0232393036Malkajgiri
78787831870742LB Nagar40394810324012Rajendranagar1212125,6860001,286Hyderabad (MCH)C4C3C2C1C4C3C2C1
20212011Locality
Table–12: Change in short-term mortality by municipality (cases avoided in each year)
The avoided cases of mortality and morbidity by scenarios and projection years are
presented in Table-13.
222446667671570Hosp Adm COPD (ICD 490-496)3573604712553283943278Hosp Adm RSP (ICD 460-519)6877901922131427301Hosp Adm CVD (ICD 390-429)00000000Mortality (short -term exposure
1631611794052201728771Mortality (Long-term exposureC4C3C2C1C4C3C2C1
20212011End point(b) Elder Population
00000000Hosp Adm COPD (ICD 490-496)161420181891356Hosp Adm RSP (ICD 460-519)
582683821174011731963042320Hosp Adm CVD (ICD 390-429)27131428475442519341469Mortality (short -term exposure)780845847215526549903699Mortality (Long-term exposure)C4C3C2C1C4C2C2C1
20212011End point(a) All Population
Table–13: Change in health effects by scenarios - Total for All localities (cases avoided per year)
Table-13 shows the heath benefits in different scenarios in Hyderabad in the years 2011 and
2021. Transportation sector is the largest contributor to air emissions (approx. 70% of the total
load) in Hyderabad. It is clear from the results that C1 Scenario (i.e., Alternative-Transport-Bus
Transit-Mitigation Scenario) could have significant impact on the health status for Hyderabad
residents in the future. The most significant reductions in PM10 concentrations were also observed
in this scenario. Implementation of Alternative-Transport-Bus Transit-Mitigation Scenario in
Hyderabad would prevent 3,699 long-term deaths, 1,469 short-term deaths, 2,320 cardiovascular
16 Institute of Health Systems , HACA Bhavan, Hyderabad, AP 500004
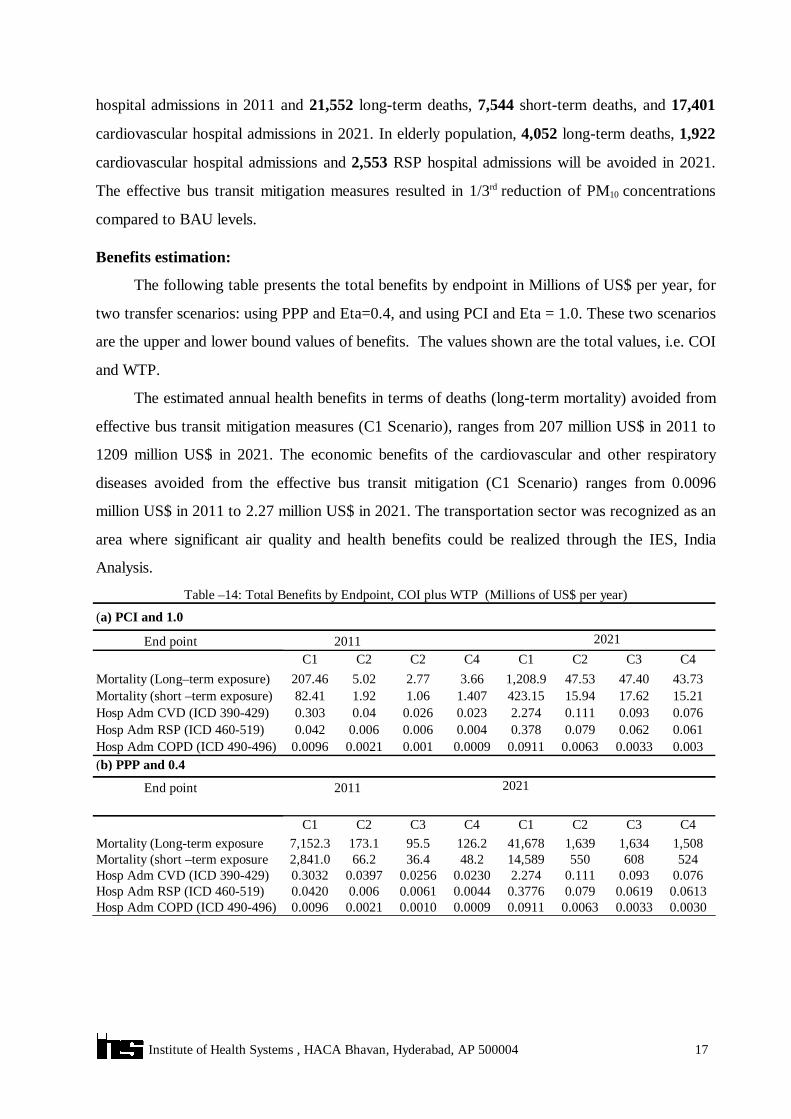
hospital admissions in 2011 and 21,552 long-term deaths, 7,544 short-term deaths, and 17,401
cardiovascular hospital admissions in 2021. In elderly population, 4,052 long-term deaths, 1,922
cardiovascular hospital admissions and 2,553 RSP hospital admissions will be avoided in 2021.
The effective bus transit mitigation measures resulted in 1/3rd reduction of PM10 concentrations
compared to BAU levels.
Benefits estimation:
The following table presents the total benefits by endpoint in Millions of US$ per year, for
two transfer scenarios: using PPP and Eta=0.4, and using PCI and Eta = 1.0. These two scenarios
are the upper and lower bound values of benefits. The values shown are the total values, i.e. COI
and WTP.
The estimated annual health benefits in terms of deaths (long-term mortality) avoided from
effective bus transit mitigation measures (C1 Scenario), ranges from 207 million US$ in 2011 to
1209 million US$ in 2021. The economic benefits of the cardiovascular and other respiratory
diseases avoided from the effective bus transit mitigation (C1 Scenario) ranges from 0.0096
million US$ in 2011 to 2.27 million US$ in 2021. The transportation sector was recognized as an
area where significant air quality and health benefits could be realized through the IES, India
Analysis.
0.00300.00330.00630.09110.00090.00100.00210.0096Hosp Adm COPD (ICD 490-496)0.06130.06190.0790.37760.00440.00610.0060.0420Hosp Adm RSP (ICD 460-519)0.0760.0930.1112.2740.02300.02560.03970.3032Hosp Adm CVD (ICD 390-429)52460855014,58948.236.466.22,841.0Mortality (short –term exposure
1,5081,6341,63941,678126.295.5173.17,152.3Mortality (Long-term exposureC4C3C2C1C4C3C2C1
20212011End point
(b) PPP and 0.40.0030.00330.00630.09110.00090.0010.00210.0096Hosp Adm COPD (ICD 490-496)0.0610.0620.0790.3780.0040.0060.0060.042Hosp Adm RSP (ICD 460-519)0.0760.0930.1112.2740.0230.0260.040.303Hosp Adm CVD (ICD 390-429)15.2117.6215.94423.151.4071.061.9282.41Mortality (short –term exposure)43.7347.4047.531,208.93.662.775.02207.46Mortality (Long–term exposure)
C4C3C2C1C4C2C2C120212011End point
(a) PCI and 1.0
Table –14: Total Benefits by Endpoint, COI plus WTP (Millions of US$ per year)
17 Institute of Health Systems , HACA Bhavan, Hyderabad, AP 500004