environmental pollution: health effects and operational...
TRANSCRIPT

Environmental Pollution: Health Effects and Operational Implications for Pollutants Removal
Journal of Environmental and Public Health
Guest Editors: Roya Kelishadi, Mohammad Mehdi Amin, Tuula Anneli Tuhkanen, Rainer Schulin, and Ajay Kumar Gupta

Environmental Pollution:Health Effects and OperationalImplications for Pollutants Removal

Journal of Environmental and Public Health
Environmental Pollution:Health Effects and OperationalImplications for Pollutants Removal
Guest Editors: Roya Kelishadi, Mohammad Mehdi Amin,Tuula Anneli Tuhkanen, Rainer Schulin,and Ajay Kumar Gupta

Copyright © 2012 Hindawi Publishing Corporation. All rights reserved.
This is a special issue published in “Journal of Environmental and Public Health.” All articles are open access articles distributed underthe Creative Commons Attribution License, which permits unrestricted use, distribution, and reproduction in any medium, providedthe original work is properly cited.

Editorial Board
Habibul Ahsan, USASuminori Akiba, JapanI. Al-Khatib, Palestinian AuthorityStuart A. Batterman, USABrian Buckley, USADavid O. Carpenter, USAJ. C. Chow, USADevra L. Davis, USAWalid El Ansari, UKBrenda Eskenazi, USAPam R. Factor-Litvak, USAAlastair Fischer, UK
Linda M. Gerber, USAKaren Glanz, USARichard M. Grimes, USAH. R. Guo, TaiwanIvo Iavicoli, ItalyChunrong Jia, USAPauline E. Jolly, USAJoseph Lau, Hong KongJong-Tae Lee, Republic of KoreaStephen Leeder, AustraliaGary M. Marsh, USA
Oladele A. Ogunseitan, USAIke S. Okosun, USAJill P. Pell, UKMynepalli K. C. Sridhar, NigeriaDavid Strogatz, USAEvelyn O. Talbott, USAEdward Trapido, USADavid Vlahov, USAChit Ming Wong, Hong KongBenny Zee, Hong KongT. Zheng, USAAnthony B. Zwi, Australia
Contents
Environmental Pollution: Health Effects and Operational Implications for Pollutants Removal,Roya KelishadiVolume 2012, Article ID 341637, 2 pages
Study of Heavy Metal Levels among Farmers of Muda Agricultural Development Authority, Malaysia,Ahmad Rohi Ghazali, Nur Ezzazulianie Abdul Razak, Mohd Sham Othman, Hidayatulfathi Othman,Ismarulyusda Ishak, Syarif Husin Lubis, Nihayah Mohammad, Zariyantey Abd Hamid, Zaliha Harun,Firdaus Kamarulzaman, and Rozaini AbdullahVolume 2012, Article ID 758349, 4 pages
Comparison of Size and Geography of Airborne Tungsten Particles in Fallon, Nevada, and Sweet Home,Oregon, with Implications for Public Health, Paul R. Sheppard, Brian J. Bierman, Kent Rhodes,Gary Ridenour, and Mark L. WittenVolume 2012, Article ID 509458, 8 pages
Wider Action Plan and Multidisciplinar Approach Could Be a Wining Idea in Creation of FriendlyEnvironment, Natasa Gojkovic-Bukvic and Nenad BukvicVolume 2012, Article ID 473427, 7 pages
Effects of Three Types of Oil Dispersants on Biodegradation of Dispersed Crude Oil in WaterSurrounding Two Persian Gulf Provinces, Azadeh Zolfaghari-Baghbaderani, Mozhgan Emtyazjoo,Parinaz Poursafa, Sedigheh Mehrabian, Samira Bijani, Daryoush Farkhani, and Parisa MirmoghtadaeeVolume 2012, Article ID 981365, 8 pages
Environmental Impact Assessment of the Industrial Estate Development Plan with the GeographicalInformation System and Matrix Methods, Mohammad Ghasemian, Parinaz Poursafa,Mohammad Mehdi Amin, Mohammad Ziarati, Hamid Ghoddousi, Seyyed Alireza Momeni,and Amir Hossein RezaeiVolume 2012, Article ID 407162, 8 pages
Ethylbenzene Removal by Carbon Nanotubes from Aqueous Solution, Bijan Bina,Hamidreza Pourzamani, Alimorad Rashidi, and Mohammad Mehdi AminVolume 2012, Article ID 817187, 8 pages
Community-Led Assessment of Risk from Exposure to Mercury by Native Amerindian Wayana inSoutheast Suriname, Daniel Peplow and Sarah AugustineVolume 2012, Article ID 674596, 10 pages
Evaluation of Trace Metal Levels in Tissues of Two Commercial Fish Species in Kapar and MersingCoastal Waters, Peninsular Malaysia, Fathi Alhashmi Bashir, Mohammad Shuhaimi-Othman,and A. G. MazlanVolume 2012, Article ID 352309, 10 pages
Involuntary and Persistent Environmental Noise Influences Health and Hearing in Beirut, Lebanon,Marjaneh M. FooladiVolume 2012, Article ID 235618, 7 pages

Hindawi Publishing CorporationJournal of Environmental and Public HealthVolume 2012, Article ID 341637, 2 pagesdoi:10.1155/2012/341637
Editorial
Environmental Pollution: Health Effects and OperationalImplications for Pollutants Removal
Roya Kelishadi
Faculty of Medicine and Child Health Promotion Research Center, Isfahan University of Medical Sciences, Isfahan 81676-36954, Iran
Correspondence should be addressed to Roya Kelishadi, [email protected]
Received 4 March 2012; Accepted 4 March 2012
Copyright © 2012 Roya Kelishadi. This is an open access article distributed under the Creative Commons Attribution License,which permits unrestricted use, distribution, and reproduction in any medium, provided the original work is properly cited.
Environmental pollution is reaching worrying proportionsworldwide. Urbanization and industrialization along witheconomic development have led to increase in energy con-sumption and waste discharges. The global environmentalpollution, including greenhouse gas emissions and acid dep-osition, as well as water pollution and waste managementis considered as international public health problems, whichshould be investigated from multiple perspectives includingsocial, economic, legislation, and environmental engineeringsystems, as well as lifestyle habits helping health promotionand strengthening environmental systems to resist contami-nation [1–3].
Environmental pollutants have various adverse health ef-fects from early life some of the most important harmful ef-fects are perinatal disorders, infant mortality, respiratory dis-orders, allergy, malignancies, cardiovascular disorders, in-crease in stress oxidative, endothelial dysfunction, mentaldisorders, and various other harmful effects [4, 5]. Though,short-term effects of environmental pollutants are usuallyhighlighted, wide range of hazards of air pollution from ear-ly life and their possible implication on chronic non-commu-nicable diseases of adulthood should be underscored. Nu-merous studies have exposed that environmental particulateexposure has been linked to increased risk of morbidity andmortality from many diseases, organ disturbances, cancers,and other chronic diseases [6, 7]. Therefore it is time to takeaction and control the pollution. Otherwise, the waste prod-ucts from consumption, heating, agriculture, mining, man-ufacturing, transportation, and other human activities willdegrade the environment.
Based on the strength of the scientific knowledge regard-ing the adverse health effects of environmental pollution and
the magnitude of their public health impact, different kindsof interventions should be taken into account. In addition toindustrial aspects, the public awareness should be increasedin this regard. Likewise, health professionals have an exclu-sive competency to help for prevention and reduction of theharmful effects of environmental factors, this capacity shouldbe underscored in their usual practice.
This special issue is dedicated to increasing the depth ofresearch across all areas of health effects of pollutants in air,water, and soil environments, as well as new techniques fortheir measurement and removal. The goal of the special issueis to familiarize the readership of the Journal of Environmen-tal and Public Health with the potential for different aspectsof environmental pollution. We expect this special issuewould appeal to researchers, public health practitioners, andpolicymakers.
Roya Kelishadi
References
[1] N. T. Loux, Y. S. Su, and S. M. Hassan, “Issues in assessing envi-ronmental exposures to manufactured nanomaterials,” Interna-tional Journal of Environmental Research and Public Health, vol.8, no. 9, pp. 3562–3578, 2011.
[2] T. Abbasi and S. A. Abbasi, “Water quality indices based on bio-assessment: the biotic indices,” Journal of Water and Health, vol.9, no. 2, pp. 330–348, 2011.
[3] H. Yuan, “A model for evaluating the social performance ofcon-structionwaste management,” Waste Management. In press.
[4] R. Kelishadi, N. Mirghaffari, P. Poursafa, and S. S. Gidding,“Lifestyle and environmental factors associated with inflamma-tion, oxidative stress and insulin resistance in children,” Athe-rosclerosis, vol. 203, no. 1, pp. 311–319, 2009.

2 Journal of Environmental and Public Health
[5] R. Kelishadi and P. Poursafa, “Air pollution and non-respiratoryhealth hazards for children,” Archives of Medical Science, vol. 6,no. 4, pp. 483–495, 2010.
[6] M. Kargarfard, P. Poursafa, S. Rezanejad, and F. Mousavinasab,“Effects of exercise in polluted air on the aerobic power, serumlactate level and cell blood count of active individuals,” Interna-tional Journal of Preventive Medicine, vol. 2, no. 3, pp. 145–150,2011.
[7] P. F. Coogan, L. F. White, M. Jerrett et al., “Air pollution andincidence of hypertension and diabetes mellitus in black wom-en living in los angeles,” Circulation, vol. 125, no. 6, pp. 767–772, 2012.
Hindawi Publishing CorporationJournal of Environmental and Public HealthVolume 2012, Article ID 758349, 4 pagesdoi:10.1155/2012/758349
Research Article
Study of Heavy Metal Levels among Farmers of Muda AgriculturalDevelopment Authority, Malaysia
Ahmad Rohi Ghazali,1 Nur Ezzazulianie Abdul Razak,2
Mohd Sham Othman,2 Hidayatulfathi Othman,1 Ismarulyusda Ishak,1 Syarif Husin Lubis,1
Nihayah Mohammad,1 Zariyantey Abd Hamid,1 Zaliha Harun,1
Firdaus Kamarulzaman,1 and Rozaini Abdullah1
1 Biomedical Science Programme, Faculty of Health Sciences, School of Diagnostic and Applied Health Sciences,Universiti Kebangsaan Malaysia, Jalan Raja Muda Abdul Aziz, 50300 Kuala Lumpur, Malaysia
2 Environmental Health Programme, Faculty of Health Sciences, School of Diagnostic and Applied Health Sciences,Universiti Kebangsaan Malaysia, Jalan Raja Muda Abdul Aziz, 50300 Kuala Lumpur, Malaysia
Correspondence should be addressed to Ahmad Rohi Ghazali, [email protected]
Received 7 October 2011; Revised 12 January 2012; Accepted 3 February 2012
Academic Editor: Mohammad Mehdi Amin
Copyright © 2012 Ahmad Rohi Ghazali et al. This is an open access article distributed under the Creative Commons AttributionLicense, which permits unrestricted use, distribution, and reproduction in any medium, provided the original work is properlycited.
Heavy metals, particularly cadmium, lead, and arsenic, constitute a significant potential threat to human health. This study wasconducted to determine the levels of cadmium, lead, and arsenic in nail samples from farmers at Muda Agricultural DevelopmentAuthority (MADA), Kedah, Malaysia, and evaluate factors that can contribute to their accumulations. A total of 116 farmersparticipated in this study. Inductively coupled plasma mass spectrometry (ICP-MS) was used to analyze concentration of heavymetals in the nail samples and questionnaires were given to participants to get demographic, health status, and their agriculturalactivities data. In this paper, the level of heavy metals was within the normal range and varies according to demographic factors.We found that there were significant correlations between working period with level of lead and arsenic (r = 0.315 and r = 0.242,resp., P < 0.01) and age with lead level (r = 0.175, P < 0.05). Our findings suggested that agricultural activities could contributeto the accumulation of heavy metals in farmers. Hence, the control of environmental levels of and human exposure to these metalsto prevent adverse health effects is still an important public health issue.
1. Introduction
Farmers are exposed to a variety of pollutants particularlyheavy metals that are released into the environment as aconsequence of agricultural activities such as the use ofpesticides and fertilizers. Some metals are extremely toxic tohumans and the toxic heavy metals of greatest concerninclude cadmium, lead, and arsenic [1]. These heavy metalsare incorporated into the organism via different routes andcan then be stored and distributed in different tissues whichlead to an internal bioconcentration that can induce differentalterations, adverse effects, and/or diseases [2, 3].
Therefore, it is important to determine the heavy metalsconcentration in occupationally exposed workers to monitorand assess their impact on human health. The use of human
nail as a biomarker in occupational exposure to pollutants isan alternative biomarker besides blood and urine [4]. Nailis a good biomarker for several toxic elements in whichthe subjects had been exposed to these elements for theduration of 2 to 18 months [5]. Apart from that it is also auseful tool to measure the level of pollutants for long-termexposure [6]. According to International Atomic EnergyAgency [7], human exposure to heavy metal at low levelis a condition where it could cause poisoning and diseases,whereas accidental exposure at high level could cause seriouseffect immediately [8].
In this study, the levels of cadmium, lead, and arsenicin nail samples from farmers were determined and thoselevels were then correlated with their demographic factors,

2 Journal of Environmental and Public Health
blood pressure, and also their smoking working period andsmoking habit.
2. Materials and Methods
2.1. Study Group. Subjects for this study were farmersworking at the Wilayah III (Pendang, Kedah,) and WilayahIV (Kota Sarang Semut, Kedah,) of MADA, Malaysia, whowere chosen via universal sampling from a list of registeredfarmer under MADA authority. A total of 116 male Malayfarmers took part in this study. Inclusion criteria of subjectsfor this study consisted of farmers that had been workingmore than one year and less than 60 years of age. The studyprotocol was approved and conducted in accordance withthe Ethical Principles for Medical Research Involving HumanSubjects as defined by the research institution.
2.2. Questionnaire. Questionnaires were used to collect dem-ographic data and factors that can influence the levels ofheavy metals in the samples. Each subject was asked onthe sections listed in the questionnaire which included (A)personal background, (B) awareness of illness, and (C)agricultural activities.
2.3. Sample Analysis. All glassware and plastic equipmentswere immersed in nitric acid solution overnight to avoidcontamination. Then, all the equipments were rinsed withdeionized water, dried, and stored appropriately. Soil anddirt were removed from the nail sample using the methodrecommended by the International Atomic Energy Agency[9] with slight modifications [10, 11]. The samples werethen rinsed thoroughly with deionized water and placedin the desiccator for drying processes and stored in sealedplastic bags at room temperature until further processing wascarried out.
Then, a total of 10–20 mg samples were weighed usingelectronic scales and placed in a porcelain bowl that had beencleaned. Samples were then heated on a heating plate (StuartScientific, UK) until the ash was formed [11]. After cooling,the ash samples were moistened with 0.5 mL deionized water,and then 1 mL of nitric acid and 0.5 mL perchloric acid wereadded accordingly. Then, the samples were heated up to dryon a heating plate (Stuart Scientific, UK) at a temperatureof 20◦C. About 0.5 mL of nitric acid and deionized water areadded into the resulting residues and heated for 5 minutesuntil a clear solution was formed. This solution was rinsedin 10 mL volumetric flask with deionized water until thefinal volume of 10 mL. Samples were stored in metal-freeplastic tubes at room temperature until the determinationof the level of heavy metals was conducted using ICP-MS(PerkinElmer, USA) [12].
2.4. Statistical Analysis. Descriptive analysis was conductedto obtain means, standard deviations, and range of heavymetals in the nail samples. We employed one-way ANOVAtest to compare the means between heavy metals accordingto blood pressure and smoking habit. On the other hands, tofind the correlation of the heavy metals with age and working
Table 1: Levels of cadmium, lead, and arsenic (µg/g) in the nailsample of MADA farmers.
Metal Mean concentration (mean± SD)
Cadmium 0.874± 0.746
Lead 6.611± 5.170
Arsenic 7.801± 3.184
Table 2: Comparison of means± standard deviations of cadmium,lead, and arsenic (µg/g) levels in nail samples from references withsimilar studies from other countries.
ReferencesMean concentration (mean± SD)
Cadmium (Cd) Plumbum (Pb) Arsenic (As)
Present study 0.874± 0.746 6.611± 5.170 7.801± 3.184
[13] 2.50± 1.70 9.2± 1.5 ND
[14] 1.35± 0.85 4.82± 2.61 ND
[5] 0.32± 0.09 10.99± 2.04 7.24± 1.28
ND : not detected.
period, we employed the Spearman correlation test becausethe data for these variables were not normally distributed.All the data collected were analyzed statistically using SPSSsoftware version 17.0.
3. Results and Discussion
The influence of environmental pollution on human healthcan be determined in terms of biomonitoring of themetabolically inactive tissues such as nails due to easy ofsample collection, transportation, storage, and preparationfor analysis. Blood and urine could be alternative biomarkersbut these samples are meant for short-term exposure [4].
In our findings, the average levels of cadmium, lead, andarsenic (µg/g) in the nail samples from the MADA farmersare presented in Table 1. Since there was an insufficientreference on baseline data of the levels of heavy metals inMalaysian population study, we compared our results withother similar studies from other countries. Table 2 showscomparison of means ± standard deviations of cadmium,lead, and arsenic (µg/g) levels in nail samples from referenceswith similar studies from other countries.
Cadmium level in this study was found higher than thestudy conducted by Samanta et al. [5], but lower than thelevel of cadmium in other studies. Study by Samanta et al.[5] showed that the subjects were exposed to heavy metalsthrough rice consumption from paddy fields that could bepolluted by heavy metals from a nearby mining area. For theconcentration of lead, our result was higher than the studyconducted by Mortada et al. [14]. For the level of arsenic, ourstudy showed higher levels compared to the previous studiesshowed in Table 2. The levels of heavy metals in our studycould be due to the use of pesticides and fertilizers in theagricultural activities [13, 15].
Table 3 shows the average levels of cadmium, lead, andarsenic in farmers according to their blood pressure andsmoking habits. Results from this study showed that there

Journal of Environmental and Public Health 3
Table 3: Comparison of average levels of cadmium, lead, and arsenic (mg/g) in farmers according to their blood pressure and smokinghabits.
ParameterMean concentration (mean± SD)
Cadmium (Cd) Plumbum (Pb) Arsenic (As)
Blood pressure
Normal blood pressure 0.784± 0.687 6.222± 5.210 7.453± 3.047
High blood pressure 1.012± 0.818 6.999± 5.045 8.267± 3.371
Smoking habit
Smokers 0.921± 0.787 6.693± 5.228 7.798± 3.025
Nonsmokers 0.756± 0.655 6.285± 5.680 7.634± 3.716
was no significant difference in the levels of heavy metals innormal and high blood pressure groups. A study conductedby Sukumar and Subramanian [16] also found that therewas no significant difference for cadmium and lead levelsamong subjects with high blood pressure and normal bloodpressure. For arsenic, there was also no significant differencebetween subjects with high blood pressure and normal bloodpressure groups. Other factors such as dietary intake mightinfluence the levels of heavy metals in the nail samples of thesubjects in our study.
Smoking is also associated with high blood pressure andheavy metal content [17]. This could be due to the cadmiumand other heavy metals content in the cigarettes [18]. Resultsfrom Sukumar and Subramanian [16] and Mortada et al.[14] studies found that cadmium levels were significantlyhigher among subjects who smoked. However, this studyshowed that levels of cadmium did not differ significantly(P > 0.05) among smokers and nonsmokers groups. Levelsof lead and arsenic also showed no significant difference (P >0.05) between smokers and nonsmokers. Studies conductedby Sukumar and Subramanian [16] also found that leadlevels were not influenced by smoking.
Table 4 shows the relationships between the farmers’ ageand level of heavy metals from their nail samples. Therewas no significant relationship between both cadmium andarsenic levels with age (r = −0.045 and r = 0.124,resp., P > 0.05) according to the Spearman correlation test.However, the analysis of the relationship between the age andlevels of lead showed a significant relationship (r = 0.175,P < 0.05). A study conducted by Rodushkin and Axelsson[19] showed that age did not influence the levels of heavymetals in the nail samples. Lead levels were also found to beincreased among older individuals than younger individuals[14].
Table 4 also shows the relationships between workingperiod as farmers and level of heavy metals in their nailsamples. This study found that there was no relationshipbetween cadmium level and their working period as farmers(r = 0.0117, P > 0.05). Cadmium accumulates primarily inliver and kidney in which it would bind to metallothionein[20]. This might be the reason for the insignificant differencebetween the cadmium level in the nail samples and theirworking period. However, there was a significant relationshipbetween working period as a farmer and the level of lead and
Table 4: Correlation between heavy metals with age and the work-ing period of the farmers.
Heavy metalCorrelations, r
Age Working period
Cadmium −0.045 0.117
Lead 0.175∗ 0.315∗∗
Arsenic 0.124 0.242∗∗
There is significant correlation between heavy metals with both workingperiod and age (∗P < 0.05, ∗∗P < 0.01).
arsenic among MADA farmers (r = 0.315 and r = 0.242,resp., P < 0.01). Faridah et al. [21] stated that cadmium andlead were potential bioaccumulators because of their longhalf-lives. Most farmers who had been working for 20–30years and exposed to pesticides and fertilizers could increasethe levels of heavy metals in their bodies [15].
In addition, data collected from questionnaires showedthat almost 95% of subjects used protective equipmentwhen working. Protective equipment is a tool to reduceexposure and prevent harm including heavy metals materialfrom entering the body. Ironically, in this study we foundthat the level of arsenic was still high among the subjects.While assessing the heavy metals exposure, other factors suchas nutrition, socioeconomic status, exposure conditions,genetic variability and susceptibility, have to be consideredfor a realistic approach.
4. Conclusion
There were significant correlations between heavy metalswith subject’s age and working period as farmers. However,there was no significant correlation between heavy met-als and their blood pressure and smoking habits. Hence,exposure of heavy metals to the farmers could be due tothe use of pesticides and fertilizers in various agriculturalactivities. The control of environmental levels of and humanexposure to these metals to prevent adverse health effects isstill an important public health issue and other alternativesto control use of fertilizers and reducing the pesticidesapplications have to be implemented.

4 Journal of Environmental and Public Health
Acknowledgment
Special thanks to Muda Agricultural Development Authority(MADA), Kedah, Malaysia, for the permission to conductthis study on farmers under their authority.
References
[1] E. Zanini, E. Bonifacio, and G. C. Cuttica, “Heavy metals insoils near a steel-making industry: a case study in a complexvalley situation in Italy,” Journal of Environmental Science andHealth A, vol. 27, no. 8, pp. 2019–2036, 1992.
[2] Y. Chen, C. Wang, and Z. Wang, “Residues and source iden-tification of persistent organic pollutants in farmland soilsirrigated by effluents from biological treatment plants,” Envi-ronment International, vol. 31, no. 6, pp. 778–783, 2005.
[3] K. P. Singh, D. Mohan, S. Sinha, and R. Dalwani, “Impactassessment of treated/untreated wastewater toxicants dis-charged by sewage treatment plants on health, agricultural,and environmental quality in the wastewater disposal area,”Chemosphere, vol. 55, no. 2, pp. 227–255, 2004.
[4] T. Wang, J. Fu, Y. Wang, C. Liao, Y. Tao, and G. Jiang, “Useof scalp hair as indicator of human exposure to heavy metalsin an electronic waste recycling area,” Environmental Pollution,vol. 157, no. 8-9, pp. 2445–2451, 2009.
[5] G. Samanta, R. Sharma, T. Roychowdhury, and D.Chakraborti, “Arsenic and other elements in hair, nails, andskin-scales of arsenic victims in West Bengal, India,” Science ofthe Total Environment, vol. 326, no. 1–3, pp. 33–47, 2004.
[6] B. L. Batista, J. L. Rodrigues, J. A. Nunes, L. Tormen, A.J. Curtius, and F. Barbosa Jr., “Simultaneous determina-tion of Cd, Cu, Mn, Ni, Pb and Zn in nail samples byinductively coupled plasma mass spectrometry (ICP-MS)after tetramethylammonium hydroxide solubilization at roomtemperature: comparison with ETAAS,” Talanta, vol. 76, no. 3,pp. 575–579, 2008.
[7] IAEA, “Activation analysis of hair as an indicator of con-tamination of man by environmental trace element pollutant,”International Atomic Energy Agency, 1978.
[8] L. L. Needham, D. G. Patterson, D. B. Barr, J. Grainger, and A.M. Calafat, “Uses of speciation techniques in biomonitoringfor assessing human exposure to organic environmentalchemicals,” Analytical and Bioanalytical Chemistry, vol. 381,no. 2, pp. 397–404, 2005.
[9] Y. S. Ryabukhin, “Activation analysis of hair as indicator ofcontaminantion of man by environmental trace element pol-lutants,” Tech. Rep. 50, International Atomic Energy Agency,Vienna, Austria, 1978.
[10] M. Saiki, “Determination of trace elements in human nailclippings by neutron activation analysis,” Journal of Radioan-alytical and Nuclear Chemistry, vol. 249, no. 2, pp. 413–416,2001.
[11] M. Bergomi, M. Vinceti, G. Nacci et al., “Environmentalexposure to trace elements and risk of amyotrophic lateralsclerosis: a population-based case-control study,” Environmen-tal Research, vol. 89, no. 2, pp. 116–123, 2002.
[12] Y. Ming and L. Bing, “Determination of rare earth elements inhuman hair and wheat flour reference materials by inductivelycoupled plasma mass spectrometry with dry ashing andmicrowave digestion,” Spectrochimica acta B, vol. 53, no. 10,pp. 1447–1454, 1998.
[13] FAO, Fertilizer use by crop in Malaysia, vol. 71, 2004.
[14] W. I. Mortada, M. A. Sobh, M. M. El-Defrawy, and S. E.Farahat, “Reference intervals of cadmium, lead, and mercuryin blood, urine, hair, and nails among residents in Mansouracity, Nile Delta, Egypt,” Environmental Research, vol. 90, no. 2,pp. 104–110, 2002.
[15] B. Wei and L. Yang, “A review of heavy metal contaminationsin urban soils, urban road dusts and agricultural soils fromChina,” Microchemical Journal, vol. 94, no. 2, pp. 99–107, 2010.
[16] A. Sukumar and R. Subramanian, “Relative element levels inthe paired samples of scalp hair and fingernails of patientsfrom New Delhi,” Science of the Total Environment, vol. 372,no. 2-3, pp. 474–479, 2007.
[17] WHO, International Society of Hypertension (ISH) Statementon Management of Hypertension, World Heatlh Organization,2003.
[18] L. Jarup and A. Akesson, “New Insights into the mechanismsof cadmium toxicity-advances in cadmium research,” Toxicol-ogy and Applied Pharmacology, vol. 238, no. 3, pp. 201–208,2009.
[19] I. Rodushkin and D. Axelsson, “Application of double focusingsector field inductively couple plasma-mass spectrometrymulti-elemental characterization of human and nail part II. Astudy of inhibitants of northen Sweeden,” Science of The TotalEnvironment, vol. 262, no. 1-2, pp. 21–36, 2000.
[20] P. L. Goering, M. P. Waalkes, and C. D. Klaassen, “Handbookof experimental pharmacology,” in Toxicology of Metals,Biochemical Effects, R. A. Goyer and M. G. Cherian, Eds., vol.115, pp. 189–214, Springer, New York, NY, USA, 1994.
[21] H. W. Faridah, N. Wilson, J. Murugi, and R. Wanjau, “Use ofhuman nails as bio-indicators of heavy metals environmentalexposure among school age children in Kenya,” Science of theTotal Environment, vol. 393, no. 2-3, pp. 376–384, 2008.

Hindawi Publishing CorporationJournal of Environmental and Public HealthVolume 2012, Article ID 509458, 8 pagesdoi:10.1155/2012/509458
Research Article
Comparison of Size and Geography of Airborne TungstenParticles in Fallon, Nevada, and Sweet Home, Oregon, withImplications for Public Health
Paul R. Sheppard,1 Brian J. Bierman,2 Kent Rhodes,2 Gary Ridenour,3 and Mark L. Witten4
1 Laboratory of Tree-Ring Research, University of Arizona, Tucson, Az 85721, USA2 McCrone Associates, Inc., 850 Pasquinelli Drive, Westmont, IL 60559, USA3 625 W. Williams, Suite B, Fallon, Nevada 89406, USA4 Odyssey Research Institute, 7032 East Rosewood Street, Tucson, AZ 85710, USA
Correspondence should be addressed to Paul R. Sheppard, [email protected]
Received 7 October 2011; Accepted 21 November 2011
Academic Editor: Kelishadi Roya
Copyright © 2012 Paul R. Sheppard et al. This is an open access article distributed under the Creative Commons AttributionLicense, which permits unrestricted use, distribution, and reproduction in any medium, provided the original work is properlycited.
To improve understanding of possible connections between airborne tungsten and public health, size and geography of airbornetungsten particles collected in Fallon, Nevada, and Sweet Home, Oregon, were compared. Both towns have industrial tungstenfacilities, but only Fallon has experienced a cluster of childhood leukemia. Fallon and Sweet Home are similar to one anotherby their particles of airborne tungsten being generally small in size. Meteorologically, much, if not most, of residential Fallon isdownwind of its hard metal facility for at least some fraction of time at the annual scale, whereas little of residential Sweet Homeis downwind of its tungsten facility. Geographically, most Fallon residents potentially spend time daily within an environmentcontaining elevated levels of airborne tungsten. In contrast, few Sweet Home residents potentially spend time daily within anairborne environment with elevated levels of airborne tungsten. Although it cannot be concluded from environmental data alonethat elevated airborne tungsten causes childhood leukemia, the lack of excessive cancer in Sweet Home cannot logically be usedto dismiss the possibility of airborne tungsten as a factor in the cluster of childhood leukemia in Fallon. Detailed modeling ofall variables affecting airborne loadings of heavy metals would be needed to legitimately compare human exposures to airbornetungsten in Fallon and Sweet Home.
1. Introduction
Size and geography of airborne tungsten particles collectedin Fallon, Nevada, and Sweet Home, Oregon (Figure 1), werecompared as part of ongoing research on the cooccurrenceof airborne tungsten and a cluster of childhood leukemiain Fallon. Fallon experienced a cluster of childhood leuke-mia beginning in 1997 [3], with the last case announcedin 2004 [4]. Although the cluster is thought to have abated[5], at least one additional case of childhood leukemia hasoccurred in Fallon since 2004 [6]. Given Fallon’s pediatricpopulation of about 2500 children up to 19 years in age [1],and a national expected rate of childhood leukemia of 4.1cases per 100,000 children up to 19 years in age per year [7],the expected rate of childhood leukemia for Fallon should beonly one case every ten years.
This cluster, deemed “one of the most unique . . . everreported” [8], prompted extensive research in an effortto find a cause. Among other findings, multiple lines ofevidence have shown that Fallon has elevated levels ofairborne tungsten and cobalt [9–13].
Although Nevada is naturally rich in tungsten min-erals, including geologically [14] and hydrologically [15,16], Fallon also has a potential anthropogenic source ofairborne tungsten. An industrial facility specializing inhard-metal metallurgy, which uses tungsten carbide andcobalt to produce tool materials [17], is located withinFallon. This hard-metal facility was named by the NevadaState Health Division as a candidate source of tungsten inFallon [18]. Morphological and chemical characteristics ofairborne tungsten particles in Fallon indicate that they areanthropogenic in origin, not natural [19].

2 Journal of Environmental and Public Health
Table 1: Geographical comparison between Fallon and Sweet Home.
Community Populationa No. of employees in tungsten facility Annual temperature (◦C) Annual precipitation (mm)
Fallon 7,536 ∼100b 11.2 135
Sweet Home 8,016 11c 11.6 1,397aFrom [1].
bFrom [2].cPersonal communication with facility manager.
CorvallisJordan
Sweet Home
Oregon
200 km
Nevada
USA
Fallon
Figure 1: Regional map of Nevada and Oregon showing the loca-tion of Fallon and Sweet Home and weather stations of Oregon.
To improve understanding of possible connectionsbetween airborne tungsten and public health in Fallon, itwould be useful to replicate this research in other small com-munities that have an industrial source of airborne tungstenin order to compare airborne tungsten and rates of canceracross towns. Sweet Home, Oregon, is another town thathas an industrial source of airborne tungsten. As a first stepin comparing Sweet Home to Fallon, environmental mon-itoring techniques used in Fallon were employed in SweetHome [20]. Elevated airborne tungsten was accurately in-dentified near the known industrial facility in Sweet Homerelative to outlying forests and to the outskirts of SweetHome.
To our knowledge, Sweet Home has not experienced in-creased rates of cancer. This prompts a question about air-borne tungsten and public health: if exposure to airborne
tungsten and/or cobalt particles caused, or even contributedto, the cluster of childhood leukemia in Fallon, then why isthere not an increased rate of childhood leukemia in SweetHome? One possible answer to this question could be thattungsten particles and/or geographical traits differ betweenFallon and Sweet Home such that actual human exposure toairborne tungsten differs between these towns. Accordingly,the objectives of this research were (a) to measure andcharacterize the size of airborne tungsten particles of bothtowns, (b) to analyze spatial patterns of dispersal of airbornetungsten of both towns, and (c) to compare potential humanexposure to airborne tungsten between Fallon and SweetHome.
2. Materials and Methods
2.1. Fallon and Sweet Home. Fallon and Sweet Home aresimilar in that both are rural towns with small populations ofabout 8,000 people (Table 1), and both towns have industrialfacilities that process or otherwise use fine tungsten particles.Based on number of employees, the Fallon tungsten facilityis larger than that of Sweet Home. Fallon and Sweet Homehave similar annual mean temperatures (∼11◦C), but SweetHome receives 10 times more rainfall than Fallon on average.
2.2. Air Sampling. In March and November, 2004, airbornedust was collected within Fallon using portable, high-volumeparticulate air samplers [9]. Weather during these collectionperiods was generally sunny and windy in March and rainyin November. The filter type was glass-fiber, a common me-dium for high-volume sampling of airborne particulates [21,22]. Filters were 510 µm thick and had up to 99.99% reten-tion for particles down to sub-µm sizes [23]. In May, 2005,airborne dust was collected within Sweet Home using thesame equipment used in Fallon [20]. Weather during thiscollection period was generally sunny and calm.
For the particle size part of this research, three filters wereselected from both Fallon and Sweet Home for further mea-surement and analysis. The filters were selected to optimize atransect of distance from their respective industrial tungstenfacilities.
2.3. Additional Sampling in Sweet Home. Two additionalsamples of tungsten-laden dust were collected in 2011 inSweet Home. One, dust was collected from the powder drumitself, which was not the actual product of the industrialfacility but rather the fine waste that results from its proc-essing. This allowed assessment of tungsten particles that

Journal of Environmental and Public Health 3
Rel
ativ
e fr
equ
ency
(%
)
Tungsten particle size (µm)
0
20
40
0 5 10 15
500 m from hard metal facility
Median: 1.22 µm
Max: 5.88 µm≤5 µm: 99.7%Number of particles: 338
≥20
(a) Fallon air filter 1
Rel
ativ
e fr
equ
ency
(%
)
0
20
40
0 5 10 15
75 m from tungsten facility
Max: 16.74 µm≤5 µm: 97.8%Number of particles: 2,038
≥20
Tungsten particle size (µm)
Median: 1.33 µm
(e) Sweet Home air filter 2
Rel
ativ
e fr
equ
ency
(%
)
Median: 1.3 µm
Max: 4.82 µm≤5 µm: 100%Number of particles: 95
0
20
40
0 5 10 15 ≥20
Tungsten particle size (µm)
1,31 m from hard metal facility
(b) Fallon air filter 2R
elat
ive
freq
uen
cy (
%) 400 m from tungsten facility
1.29 µm
Max: 15.18 µm≤5 µm: 97.5%Number of particles: 198
0
20
40
0 5 10 15 ≥20
Tungsten particle size (µm)
(f) Sweet Home air filter 3
Rel
ativ
e fr
equ
ency
(%
)
0
20
40
0 5 10 15 ≥20
Tungsten particle size (µm)
Median: 1.22µm
Max: 2.69 µm≤5 µm: 100%Number of particles: 47
1,95 m from hard metal facility
(c) Fallon air filter 3
Median: 1.5 µmWithin tungsten facility
Max: 51.43 µm≤5 µm: 94.2%Number of particles: 1,922
Rel
ativ
e fr
equ
ency
(%
)
0
20
40
0 5 10 15 ≥20
Tungsten particle size (µm)
(g) Sweet Home powder drum
Rel
ativ
e fr
equ
ency
(%
)
0
20
40
0 5 10 15 ≥20
Tungsten particle size (µm)
Median: 1.83µm
Max: 20.87 µm≤5 µm: 89.5%Number of particles: 2,686
10 m from tungsten facility
(d) Sweet Home air filter 1
Median: 1.49 µmMax: 29.22 µm≤5 µm: 84.8%Number of particles: 541
Rel
ativ
e fr
equ
ency
(%
)
0
20
40
0 5 10 15 ≥20
Tungsten particle size (µm)
75 m from powder drum
(h) Sweet Home surface dust
Figure 2: Frequency histograms of tungsten particles by size for each sample analyzed from Fallon and Sweet Home.
result from the production process. Two, surface dust wasswept up from pavement just east of the facility. This allowedassessment of airborne tungsten particles that drift out of thebuilding but do not travel far from the source.
2.4. Isolation of Tungsten Particles. To remove the collectedparticulate matter from the glass-fiber filters for microanal-ysis, a 20 cm2 portion of each filter was placed into its own50 mL plastic centrifuge tube with approximately 10 mL of
ethanol. The tubes were sonicated for 20 minutes to dislodgethe particles, and then the filter pieces were removed fromthe tubes and saved. Approximately 50 mg of the powderdrum and surface dust samples was placed into their owncentrifuge tubes, again with approximately 10 mL of ethanol.
Fifteen mL of methyl iodide was added to the centrifugetubes, and the samples were centrifuged for 10 minutes at2000 rpm. The ethanol layer was pipetted off and saved. Thebottom methyl iodide layer was filtered on 25-millimeter pol-yester membrane filters and mounted onto aluminum stubs
4 Journal of Environmental and Public Health
3 km
2 km
1 km
50
95
1000 m
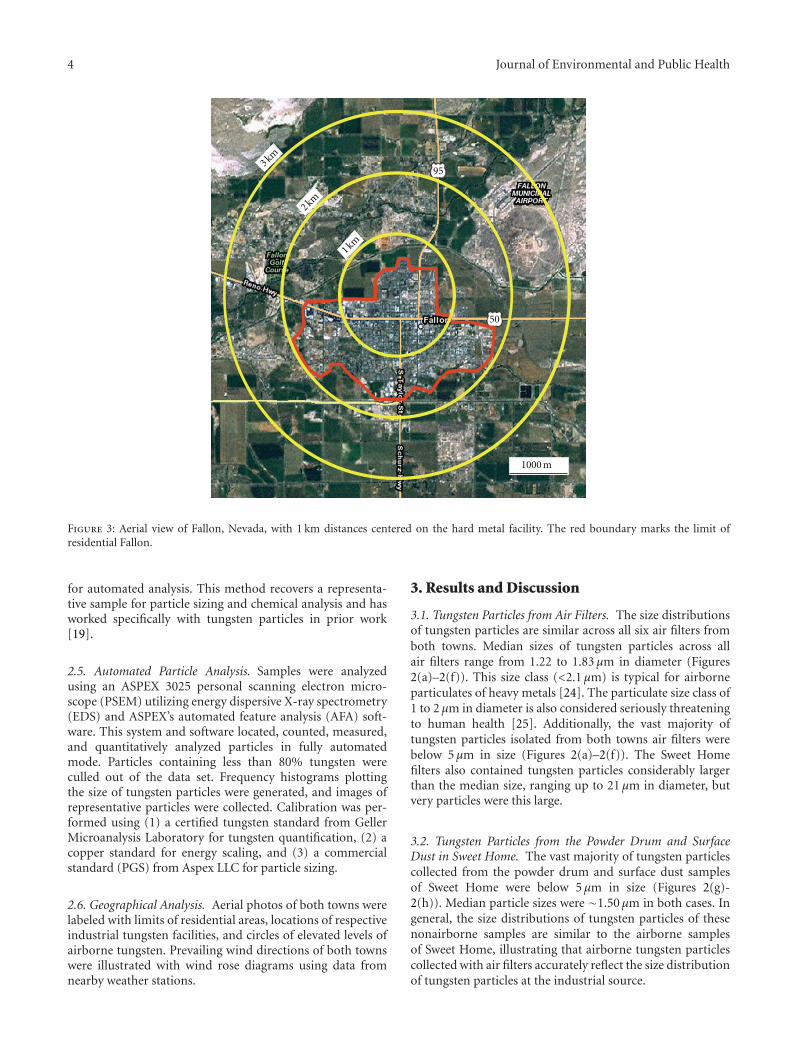
Figure 3: Aerial view of Fallon, Nevada, with 1 km distances centered on the hard metal facility. The red boundary marks the limit ofresidential Fallon.
for automated analysis. This method recovers a representa-tive sample for particle sizing and chemical analysis and hasworked specifically with tungsten particles in prior work[19].
2.5. Automated Particle Analysis. Samples were analyzedusing an ASPEX 3025 personal scanning electron micro-scope (PSEM) utilizing energy dispersive X-ray spectrometry(EDS) and ASPEX’s automated feature analysis (AFA) soft-ware. This system and software located, counted, measured,and quantitatively analyzed particles in fully automatedmode. Particles containing less than 80% tungsten wereculled out of the data set. Frequency histograms plottingthe size of tungsten particles were generated, and images ofrepresentative particles were collected. Calibration was per-formed using (1) a certified tungsten standard from GellerMicroanalysis Laboratory for tungsten quantification, (2) acopper standard for energy scaling, and (3) a commercialstandard (PGS) from Aspex LLC for particle sizing.
2.6. Geographical Analysis. Aerial photos of both towns werelabeled with limits of residential areas, locations of respectiveindustrial tungsten facilities, and circles of elevated levels ofairborne tungsten. Prevailing wind directions of both townswere illustrated with wind rose diagrams using data fromnearby weather stations.
3. Results and Discussion
3.1. Tungsten Particles from Air Filters. The size distributionsof tungsten particles are similar across all six air filters fromboth towns. Median sizes of tungsten particles across allair filters range from 1.22 to 1.83 µm in diameter (Figures2(a)–2(f)). This size class (<2.1 µm) is typical for airborneparticulates of heavy metals [24]. The particulate size class of1 to 2 µm in diameter is also considered seriously threateningto human health [25]. Additionally, the vast majority oftungsten particles isolated from both towns air filters werebelow 5 µm in size (Figures 2(a)–2(f)). The Sweet Homefilters also contained tungsten particles considerably largerthan the median size, ranging up to 21 µm in diameter, butvery particles were this large.
3.2. Tungsten Particles from the Powder Drum and SurfaceDust in Sweet Home. The vast majority of tungsten particlescollected from the powder drum and surface dust samplesof Sweet Home were below 5 µm in size (Figures 2(g)-2(h)). Median particle sizes were ∼1.50 µm in both cases. Ingeneral, the size distributions of tungsten particles of thesenonairborne samples are similar to the airborne samplesof Sweet Home, illustrating that airborne tungsten particlescollected with air filters accurately reflect the size distributionof tungsten particles at the industrial source.
Journal of Environmental and Public Health 5
20
400 m
500 m
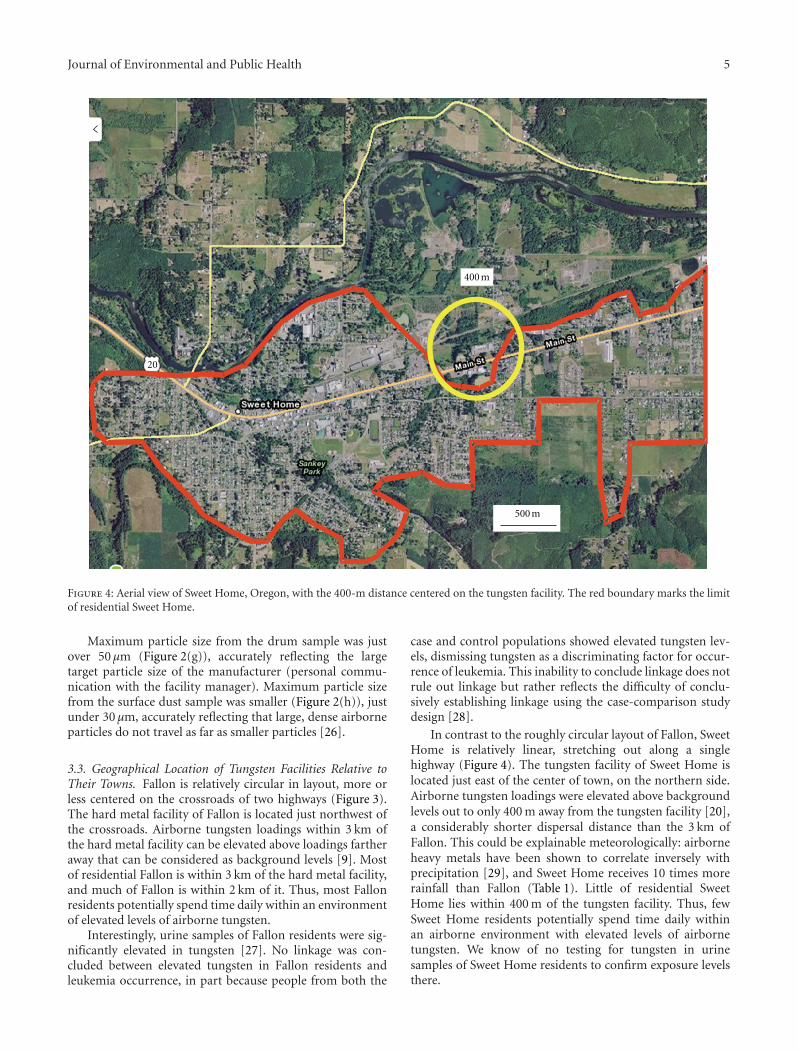
Figure 4: Aerial view of Sweet Home, Oregon, with the 400-m distance centered on the tungsten facility. The red boundary marks the limitof residential Sweet Home.
Maximum particle size from the drum sample was justover 50 µm (Figure 2(g)), accurately reflecting the largetarget particle size of the manufacturer (personal commu-nication with the facility manager). Maximum particle sizefrom the surface dust sample was smaller (Figure 2(h)), justunder 30 µm, accurately reflecting that large, dense airborneparticles do not travel as far as smaller particles [26].
3.3. Geographical Location of Tungsten Facilities Relative toTheir Towns. Fallon is relatively circular in layout, more orless centered on the crossroads of two highways (Figure 3).The hard metal facility of Fallon is located just northwest ofthe crossroads. Airborne tungsten loadings within 3 km ofthe hard metal facility can be elevated above loadings fartheraway that can be considered as background levels [9]. Mostof residential Fallon is within 3 km of the hard metal facility,and much of Fallon is within 2 km of it. Thus, most Fallonresidents potentially spend time daily within an environmentof elevated levels of airborne tungsten.
Interestingly, urine samples of Fallon residents were sig-nificantly elevated in tungsten [27]. No linkage was con-cluded between elevated tungsten in Fallon residents andleukemia occurrence, in part because people from both the
case and control populations showed elevated tungsten lev-els, dismissing tungsten as a discriminating factor for occur-rence of leukemia. This inability to conclude linkage does notrule out linkage but rather reflects the difficulty of conclu-sively establishing linkage using the case-comparison studydesign [28].
In contrast to the roughly circular layout of Fallon, SweetHome is relatively linear, stretching out along a singlehighway (Figure 4). The tungsten facility of Sweet Home islocated just east of the center of town, on the northern side.Airborne tungsten loadings were elevated above backgroundlevels out to only 400 m away from the tungsten facility [20],a considerably shorter dispersal distance than the 3 km ofFallon. This could be explainable meteorologically: airborneheavy metals have been shown to correlate inversely withprecipitation [29], and Sweet Home receives 10 times morerainfall than Fallon (Table 1). Little of residential SweetHome lies within 400 m of the tungsten facility. Thus, fewSweet Home residents potentially spend time daily withinan airborne environment with elevated levels of airbornetungsten. We know of no testing for tungsten in urinesamples of Sweet Home residents to confirm exposure levelsthere.

6 Journal of Environmental and Public Health
N
E
S
W
1 January 2001–31 December 2010
32%
39◦2556N118◦4108W
12%10%8%6%4%2%
Avg speed
2.9 m · s−1
(a)
N
E
S
W
1 July 2010–31 June 2011
64%
44◦4301N122◦4132W
12%10%
8%
6%
4%2%
1.7 m · s−1Avg speed
(b)
N
E
S
W
1 January 2001–31 December 2010
38%
44◦2950N123◦1723W
12%10%8%6%4%2%
2.8 m · s−1Avg speed
(c)
Figure 5: Wind rose diagrams for (a) Fallon, Nevada, a weather station with data for the entire decade of the 2000s, (b) Jordan, Oregon(Figure 1), a weather station with data for one year, and (c) Corvallis, Oregon (Figure 1), a weather station with data for the entire decadeof the 2000s. Lines indicate directions that winds come from. Center percentages represent calm, that is, winds ≤ 2 m·sec−1. Time spanand average wind speeds are given for each location. Wind data from NCDC, NOAA: wind roses generated using software of the WesternRegional Climate Center.
3.4. Wind Patterns. Fallon typically experiences windsfrom the northeast, north, west, south, and southeast(Figure 5(a)). Given the central location of the hard metalfacility in Fallon and these prevailing wind directions, much,if not most, of residential Fallon is downwind of the hardmetal facility for at least some fraction of time at the annualscale. This should result in human exposure to elevatedairborne tungsten levels for many, if not most, Fallonresidents.
Sweet Home typically experiences winds from the north-west, west, southwest, and south (Figure 5(b)), or from
the northwest and south (Figure 5(c)). Given the easternlocation of the tungsten facility in Sweet Home and theseprevailing wind directions, little of residential Sweet Home isdownwind of the tungsten facility. This should result in littlehuman exposure to elevated tungsten levels for Sweet Homeresidents.
4. Conclusions
As we have stated in prior work, it cannot be concluded fromenvironmental data alone that elevated airborne tungsten

Journal of Environmental and Public Health 7
causes childhood leukemia [9–13]. Such linkage requiresdirect biomedical research, which is at least supportable bythe cooccurrence of exposure to airborne tungsten and acluster of childhood leukemia [28, 30]. Tungsten has beenevaluated for carcinogenicity, by itself [31, 32] as well as withother metals [33–36]. In general, this biomedical research hasshown at least the possibility of linkage between exposure totungsten and cancer.
Regardless of the toxicity of tungsten, this comparison ofairborne tungsten and geography between Fallon and SweetHome does lead to the following conclusion: the lack ofexcessive cancer in Sweet Home, which has an industrialtungsten facility as well as elevated levels of airborne tung-sten, cannot logically be used to dismiss the possibility ofairborne tungsten as a factor in the cluster of childhoodleukemia in Fallon, which also has an industrial tungstenfacility as well as elevated levels of airborne tungsten. The sizedistributions of airborne tungsten in each town are similar,but the relative sizes and locations of the tungsten facilitiesdiffer between Fallon and Sweet Home as do prevailingwind directions and annual precipitation amounts such thathuman exposure to airborne tungsten is probably higher inFallon than in Sweet Home. Additional modeling of allvariables affecting airborne loadings of heavy metals wouldbe needed to legitimately compare human exposures toairborne tungsten in Fallon and Sweet Home. In any case,continued biomedical research on possible linkage of tung-sten with leukemia is justified based on the cooccurrenceof elevated airborne tungsten and a cluster of childhoodleukemia in Fallon, Nevada.
Disclosure
P. R. Sheppard and M. L. Witten have provided documents,data, and declarations in Cases CV03-03482, Richard Jerneeet al. versus Kinder Morgan Energy et al., and CV03-05326,Floyd Sands et al. versus Kinder Morgan Energy et al., SecondJudicial District Court of Nevada, Washoe County, whichare related to the childhood leukemia cluster of Fallon. Inthese cases, the law firm of Dunlap and Laxalt, representingthe plaintiffs, with full disclosure to all defendants and theircounsels, made an unsolicited donation of $15,000 to assistM. L.Witten and P. R. Sheppard in furthering their research,with a request that defendants provide similar donations.Neither M. L. Witten nor P. R. Sheppard have profited per-sonally as a result of doing their research in Fallon or fromproviding material in these cases. B. J. Bierman and K.Rhodes declare that they have no conflict of interests.
Acknowledgments
Volunteer participants of Fallon and Sweet Home are ac-knowledged for allowing air sampling in their backyards.Robert J. Speakman and Mark Borgstrom assisted in thisresearch. The original air sampling research was funded inpart by the Gerber Foundation and the Cancer Research andPrevention Foundation, neither of which is otherwise re-sponsible for this paper.
References
[1] United States Census, 2000, http://www.census.gov/main/www/cen2000.html.
[2] This is Reno, “Kennametal celebrates 60 years in Fallon,” 2011,http://thisisreno.com/2011/03/kennametal-celebrates-60-years-in-fallon.
[3] Expert Panel, “Final report and recommendations to theNevada State Health Division,” Expert Panel on Child-hood Leukemia in Churchill County, 2004, health.nv.gov/PDFs/FALLONexpertpanel022304.pdf.
[4] Nevada State Health Division, “New childhood leukemia caseconfirmed,” News Release, 2004.
[5] F. X. Mullen, “Metal remains at heart of fallon leukemia in-quiry,” Reno Gazette-Journal, 2010.
[6] Lahontan Valley News, “Obituary: Halycon Marie bice,” 2010.[7] U.S. NCI, Age-Adjusted SEER Incidence and the U.S. Death
Rates and 5-Year Relative Survival Rates by Primary CancerSites, Sex, and Time Period. SEER Cancer Statistics Review,1975–2000, Table XXVII-3: Childhood Cancers, National Can-cer Institute, 2003.
[8] C. Steinmaus, M. Lu, R. L. Todd, and A. H. Smith, “Probabilityestimates for the unique childhood leukemia cluster in Fallon,Nevada, and risks near other U.S. Military aviation facilities,”Environmental Health Perspectives, vol. 112, no. 6, pp. 766–771,2004.
[9] P. R. Sheppard, G. Ridenour, R. J. Speakman, and M. L.Witten, “Elevated tungsten and cobalt in airborne particulatesin Fallon, Nevada: possible implications for the childhoodleukemia cluster,” Applied Geochemistry, vol. 21, no. 1, pp.152–165, 2006.
[10] P. R. Sheppard, R. J. Speakman, G. Ridenour, and M. L. Witten,“Using lichen chemistry to assess airborne tungsten and cobaltin Fallon, Nevada,” Environmental Monitoring and Assessment,vol. 130, no. 1–3, pp. 511–518, 2007.
[11] P. R. Sheppard, R. J. Speakman, G. Ridenour, M. D. Glascock,C. Farris, and M. L. Witten, “Spatial patterns of tungstenand cobalt in surface dust of Fallon, Nevada,” EnvironmentalGeochemistry and Health, vol. 29, no. 5, pp. 405–412, 2007.
[12] P. R. Sheppard, C. L. Hallman, G. Rldenour, and M. L. Witten,“Spatial patterns of tungsten and cobalt on leaf surfaces oftrees in Fallon, Nevada,” Land Contamination and Reclama-tion, vol. 17, no. 1, pp. 31–41, 2009.
[13] P. R. Sheppard, G. Ridenour, and M. L. Witten, “Multi-yearassessment of airborne metals in Fallon, Nevada, based onleaf-surface chemistry,” in Air Quality Monitoring, Assessmentand Management, N. Mazzeo, Ed., pp. 329–344, InTech,Rijeka, Croatia, 2011.
[14] H. K. Stager and J. V. Tingley, Tungsten Deposits in Nevada,Bulletin 105, University of Nevada-Reno School of Mines,Nevada Bureau of Mines and Geology, Reno, Nev, USA, 1988.
[15] K. H. Johannesson, W. B. Lyons, E. Y. Graham, and K. A.Welch, “Oxyanion concentrations in Eastern Sierra NevadaRivers–3. Boron, Molybdenum, Vanadium, and Tungsten,”Aquatic Geochemistry, vol. 6, no. 1, pp. 19–46, 2000.
[16] R. L. Seiler, K. G. Stollenwerk, and J. R. Garbarino, “Factorscontrolling tungsten concentrations in ground water, CarsonDesert, Nevada,” Applied Geochemistry, vol. 20, no. 2, pp. 423–441, 2005.
[17] P. M. Harris and D. S. C. Humphreys, “Tungsten: a review,”Occasional Papers of the Institution of Mining and Metallurgypaper 2, Institution of Mining and Metallurgy, London, UK,1983.

8 Journal of Environmental and Public Health
[18] F. X. Mullen Jr., “No pollution controls in tungsten plant,”Reno Gazette-Journal, 2003.
[19] P. R. Sheppard, P. Toepfer, E. Schumacher, K. Rhodes, G.Ridenour, and M. L. Witten, “Morphological and chemicalcharacteristics of airborne tungsten particles of Fallon, Neva-da,” Microscopy and Microanalysis, vol. 13, no. 4, pp. 296–303,2007.
[20] P. R. Sheppard, R. J. Speakman, C. Farris, and M. L. Witten,“Multiple environmental monitoring techniques for assessingspatial patterns of airborne tungsten,” Environmental Scienceand Technology, vol. 41, no. 2, pp. 406–410, 2007.
[21] G. G. Eadie and D. E. Bernhardt, “Sampling and data reportingconsiderations for airborne particulate radioactivity,” Tech.Rep. ORP/LV-76-9, Environmental Protection Agency, Officeof Radiation Programs, Las Vegas, Nev, USA, 1976.
[22] K. W. Lee and R. Mukund, “Filter collection,” in AerosolMeasurement: Principles, Techniques, and Applications, P. A.Baron and K. Willeke, Eds., pp. 197–228, Wiley, New York, NY,USA, 2nd edition, 2001.
[23] HI-Q Environmental Products Company, Air Sampling Equip-ment, Systems & Accessories, HI-Q, San Diego, Calif, USA,2003.
[24] M. T. Ny and B. K. Lee, “Size distribution of airborne par-ticulate matter and associated metallic elements in an urbanarea of an industrial city in Korea,” Aerosol and Air QualityResearch, vol. 11, no. 6, pp. 643–653, 2011.
[25] F. P. Perera and A. K. Ahmed, Respirable Particles: Impactof Airborne Fine Particulates on Health and the Environment,Ballinger Publishing Company, Cambridge, Mass, USA, 1979.
[26] R. D. Cadle, The Measurement of Airborne Particles, Wiley, NewYork, NY, USA, 1975.
[27] C. S. Rubin, A. K. Holmes, M. G. Belson et al., “Investigatingchildhood leukemia in Churchill County, Nevada,” Environ-mental Health Perspectives, vol. 115, no. 1, pp. 151–157, 2007.
[28] J. D. Pleil, J. Sobus, P. R. Sheppard, G. Ridenour, and M. L.Witten, “Strategies for evaluating the environment-publichealth interaction of long-term latency disease: the quandaryof the inconclusive case-control study,” Chemico-BiologicalInteractions. In press.
[29] K. H. Kim, D. S. Kim, and T. J. Lee, “The temporal variabilitiesin the concentrations of airborne lead and its relationship toaerosol behavior,” Atmospheric Environment, vol. 31, no. 20,pp. 3449–3458, 1997.
[30] J. B. Nielsen and T. K. Jensen, “Environmental epidemiology,”in Essentials of Medical Geology: Impacts of the Natural Envi-ronment on Public Health, O. Selinus et al., Ed., pp. 529–540,Elsevier, Amsterdam, The Netherlands, 2005.
[31] N. N. Sun, C. D. Fastje, S. S. Wong et al., “Dose-dependenttranscriptome changes by metal ores on a human acutelymphoblastic leukemia cell line,” Toxicology and IndustrialHealth, vol. 19, no. 7–10, pp. 157–163, 2003.
[32] C. D. Fastje, K. Le, N. N. Sun, S. S. Wong, P. R. Sheppard, andM. L. Witten, “Prenatal exposure of mice to tungstate is associ-ated with decreased transcriptome-expression of the putativetumor suppressor gene, DMBT1: implications for childhoodleukemia,” Land Contamination and Reclamation, vol. 17, no.1, pp. 169–178, 2009.
[33] A. C. Miller, S. Mog, L. McKinney et al., “Neoplastic trans-formation of human osteoblast cells to the tumorigenicphenotype by heavy metal-tungsten alloy particles: inductionof genotoxic effects,” Carcinogenesis, vol. 22, no. 1, pp. 115–125, 2001.
[34] A. C. Miller, K. Brooks, J. Smith, and N. Page, “Effect of themilitary-relevant heavy metals, depleted uranium and heavy
metal tungsten-alloy on gene expression in human liver car-cinoma cells (HepG2),” Molecular and Cellular Biochemistry,vol. 255, no. 1-2, pp. 247–256, 2004.
[35] R. M. Harris, T. D. Williams, N. J. Hodges, and R. H. Waring,“Reactive oxygen species and oxidative DNA damage mediatethe cytotoxicity of tungsten-nickel-cobalt alloys in vitro,”Toxicology and Applied Pharmacology, vol. 250, no. 1, pp. 19–28, 2011.
[36] R. Verma, X. Xu, M. K. Jaiswal et al., “In vitro profiling ofepigenetic modifications underlying heavy metal toxicity oftungsten-alloy and its components,” Toxicology and AppliedPharmacology, vol. 253, no. 3, pp. 178–187, 2011.

Hindawi Publishing CorporationJournal of Environmental and Public HealthVolume 2012, Article ID 473427, 7 pagesdoi:10.1155/2012/473427
Research Article
Wider Action Plan and Multidisciplinar Approach Could Bea Wining Idea in Creation of Friendly Environment
Natasa Gojkovic-Bukvic1, 2 and Nenad Bukvic3
1 Logistics Management Consultancy, Viale Unita d’Italia No. 69, 70125 Bari, Italy2 Department of Economics, LUM Jean Monnet University, S.S. 100 km18, 70010 Casamassima, Italy3 Section of Cytogenetics and Molecular Biology, Department of Clinical Pathology, University Hospital, OORR Foggia,Viale Luigi Pinto No. 1, 71100 Foggia, Italy
Correspondence should be addressed to Natasa Gojkovic-Bukvic, [email protected] andNenad Bukvic, [email protected]
Received 30 August 2011; Revised 30 October 2011; Accepted 30 October 2011
Academic Editor: Kelishadi Roya
Copyright © 2012 N. Gojkovic-Bukvic and N. Bukvic. This is an open access article distributed under the Creative CommonsAttribution License, which permits unrestricted use, distribution, and reproduction in any medium, provided the original work isproperly cited.
Herein, we proposed planning of wide transdisciplinary actions, which bring a solution for economic activity such as transpor-tation, strongly related to pollution output with possible repercussions on climate change and public health. To solve logisticsproblem by introduction of common intermodal policy, and creation of more friendly transport solution, it is possible to obtainsustainable development, climate change prevention, government policy, and regulation which are all related to human health andcreation of health-supportive environment. This approach permits environmental and biological monitoring same as economicresults measurement by key performance indicators. This approach implementing emerging scientific knowledge in environmentalhealth science such as genetic epidemiology aimed at understanding how genomic variation impacts phenotypic expression andhow genes interact with the environment at the population level with subsequent translation into practical information forclinicians as well as for public health policy creation.
1. Introduction
Economic and industrial growth in the last century provokedthe massive increase of air pollutants, resulting from moreintense energy consumption and exhaust emissions fromvehicles, with important global environmental consequencesincluding climate change. Undoubtedly, increase of air pollu-tants same as global climate change will have multiple effectson human health especially on vulnerable populations suchas children, the elderly, and the poor who are at increased riskfrom such events [1].
The contamination of air by organic and inorganic toxicpollutants same as exposure to motor vehicle emissions rep-resents an important concern for possible long-term healtheffects [2–5]. Negative associations between traffic-relatedpollution and respiratory health have been underlined bydifferent epidemiological studies on air pollution [6–15].D’Amato et al. [16] reported observations that in the regions
with high levels of vehicle traffic the interplay betweenclimate change and the most abundant components of airpollutions (airborne particulate matter, nitrogen dioxideand ozone) alters the concentration and distribution of airpollutions and as consequence interferes with the seasonalpresence of allergenic pollens in the atmosphere by prolong-ing this period with adversely effects on lung function inasthmatics. The air pollutants with well-established respira-tory effects will potentially change as climate change [17, 18]and/or could be influenced by warming temperatures whichcan affect chemical reactions rates [19, 20]. Traditionally,climate change has been considered as an environmentalrather than a health issue.
Quantification of the effects of climate change on healthis needed on all levels (global, regional, and local) throughenhanced monitoring of environmental health and one ofthe possible ways could be biomonitoring.

2 Journal of Environmental and Public Health
Biomonitoring of the exposure to complex mixtures suchas polluted ambient air, vehicle exhaust, and smoke is aparticular challenge since these exposures have many con-stituents in common and many people were exposed to morethan one of these mixtures. It is well known that human bi-omonitoring comprises the determination of different val-idated biomarkers which are generally assigned to one ofthree classes: biomarkers of exposure, biomarkers of effect,and biomarkers of susceptibility. Their application in epi-demiological studies has been proven. Most studies used ran-dom samples of citizens with mixed activities and exposureprofiles, with intention to be representative of the whole pop-ulation [21]. The intensity of exposure of the study subjectscould be done with passive personal samplers as well as bloodand urinary biomarkers and could be also compared withambient, for example, benzene concentrations, measured bymunicipal monitoring stations [22].
As an example of good practice to be followed, a reporton tobacco toxicants of the Institute of Medicine (USA)could be considered. Namely, reducing risk of disease byreducing exposure to tobacco toxicants is feasible and bio-logical markers associated with tobacco-related disease couldbe used to offer guidance as to whether or not PotentiallyReduced Exposure Products (PREPs) are likely to be risk-reducing [23].
This observation raised a simple question: if the samecould be used to perform biomonitoring of populationsat places of high traffic density, with higher exposition/airpollutions and could it be measured, obviously before andafter introduction of friendly environment transport projectwith positive consequences on human health, climate changepreparedness strategy as a part of public health programs?
Climate change and adverse environment are perceivedas a health threat and the solutions are necessary by differenttype of actions. We focus on the health impact and possibilityto propose public health strategy through energy consump-tion reduction, implementing new intermodal transporta-tion chain. Stronghold for this approach underlined thatframework for prevention includes incorporation of climatechange actions into the 10 essential functions of public healthas reported by Frumkin et al. [24].
The project idea was born during attempt to find a wayhow to connect South Italy (South Europe, Spain, and Portu-gal) to South East Europe/Balkan Peninsula countries in themost suitable way, with less air pollution, more traffic safety,and reduction of road congestion. This approach should beseen as immediate implementation of the European UnionCommon Transport Policy and enlargement of EuropeanUnion on Balkan Peninsula countries, which are still outof EU and also to establish joined traffic management, asone of the most industrialized topic areas within transportresearch, with consequences for public policy issues related togovernment regulation, human health, and/or environment.Furthermore, this could be a way to create future strategyable to “burn out” timeline gap provoked by recent historicalevents and to prepare Balkan Countries for the futurepartnership giving to the Countries from this region apossible solution to help health promotion and buildingup environmental systems able to avoid the contamination
Agriculture
TransportEnergy industriesWaste
Industrial processes
Fugitive emissions from fuelsOther energiesManufacturing industries and construction
Figure 1: EU-27 Greenhouse Gas Emissions by sector, 2008 [26].
(discussed with great interest at REACT—conference 2011[25]).
2. Climate Change and Transportation
The greenhouse gas emission (GHG) in the decade up to2008 for the EU27 decreased by 2,4%. Energy use, waste,manufacturing, construction, and agriculture were the areaswhere emissions decreased but at the same time emissionsfrom energy industries, industrial processes, and transportwere growing.
Figure 1 reported the most recent data published byEUROSTAT regarding the situation of GHG emissions bysector in decade up to 2008 [26].
The increase in emission of air pollutants and climatechange due to economic and industrial growth has made airquality an important problem throughout the world. Theseemissions give rise to climate change with increased socialcosts (i.e., diseases), costs that do not have to be carried by theactual polluter. The GHG emissions in EU have been reducedin most sectors over the last 15 years, beside transportationwhich has shown a 25% increase (Figure 2) [27].
In order to come to terms with this, many Europeangovernments have to decide to take legislative actions. Thelevel of GHG emission is to be reduced by 40% by 2020 andby 2030 the Swedish vehicle fleet is to be fully independent offossil fuels. The social cost will have to be internalized and toachieve this carbon taxes and emissions trading schemes willbe utilized [27, 28].
The company may choose between a number of measuresin order to achieve a reduction. One measure commonlysuggested is a shift in transport mode, from faster, morepolluting mode such as road and air transport to slower andless polluting modes such as rail or sea transport developingproper logistics chain. A particularly interesting solutionis an intermodal road-rail-short sea shipping solution. Inthis way, the flexibility and availability of truck transport iscombined with low-cost, CO2 efficient, rail transport for the

Journal of Environmental and Public Health 3
TransportEnergy industriesResidentialAverageOther (nonenergy)Services
Industrial processesAgricultureIndustry (energy)WasteFugitive emissions
30
20
10
0
−10
−20
−30
−401990–2006
(%)
Figure 2: CO2 emissions from transportation EU-25 [27].
longer part of the journey. Research has shown that, with thistype of mode shift, CO2 emission can be reduced by 20–50%or more depending on how the energy for the train part isproduced [29, 30].
Climate change is a major threat to sustainable develop-ment. On the basis of Kyoto Protocol, EU15 has a collectivetarget of 8% of reduction below levels chosen in a base year(mostly 1990) which had decreased by 2008 by 6,9%. Afterthat, the EU27 has set a 20% reduction target to be achievedby 2020 [31].
Transport is the second largest source of emissions inthe EU and it is the sector that has exhibited continuouslygrowing emissions [26]. A task of the EU SustainableDevelopment Strategy is to achieve a balanced shift towardsenvironmentally friendly transport modes which will bringabout a sustainable transport and mobility system. Thisshift would certainly fall GHG emissions as well towardsenvironmental friendly transport modes.
3. European Union Plans for the Region
EU plans for the Region are grouped in hard and softmeasures; the hard measures are related to infrastructuresand soft measures are harmonization and reforms (technicalstandards and border crossing procedures). The soft projectsthat are considerably affected by “regionalization” deal withthe railways that could be solved by setting up Intergovern-mental Working Group on Railway and Intermodal Policy.
The Working Group is to make an inventory of rail reformsand further recommend measures that ensure the regionalintegration and harmonization of the reforms for everycountry and to open access to transport infrastructure.Unfortunately, States have usually denied railways enterprisesthe freedom of a commercial business and this has to bechanged. Different options are possible: some railways mayfocus entirely on their core business of operating trains. Oth-ers may choose to enter into partnership, for example, withroad haulers or logistics companies and offer door to doorintermodal services. Some may operate across Europe, whileothers may concentrate on local services. One thing in com-mon of all railways in Region is that they must focus on whattheir customers want and how they can satisfy these needs. Itis important to establish common traffic management whichwill focus on planning, monitoring, and controlling of traffic.The principal aim should be to maximize the effectivenessof the use of existing infrastructure, ensure reliable and safeoperation of transport, address environmental goals, andensure fair allocation of infrastructure space (road space, railslots, etc.) among competing users [32].
Given the various confusions among stakeholders aboutthe implication of the Carbon Pollution Reduction shouldserve to increase understanding of various effects of this ini-tiative and possible multidisciplinary approaches regardingthis theme.
4. Biomarkers and Adverse Human Exposure
For many years some cytogenetic alterations as biomarkersof genotoxic exposure have been used [33–38]. The factthat most established human carcinogens are genotoxicrepresents a relevant reason for using these assays [33]. Infact epidemiological studies strongly suggest that the highfrequency of some of them is predictive of an increased riskof cancer [34, 38]. Gene polymorphisms are also able tomodulate the human response to genotoxic insults [33, 39–43]. In fact any polymorphism that affects genes acting onmetabolism or cellular response to DNA damage may alterindividual sensitivity to genotoxic carcinogens.
From the 1950s mutagenicity testing became an impor-tant topic for geneticists who were well trained to recognizestructural chromosome rearrangements (CA). Up today,different tests (SCE, MN, Comet Assay, etc.) were introducedwhich correlate at least with parts of metaphase chromosomeaberration assays. The newest tests and approaches are fasterand less laborious and do not require a priori knowledgeabout the diversity of structural chromosome aberrations.This lack of knowledge can easily lead to unnecessarymisinterpretation of genomic data [44].
As exposure to environmental factors including tobaccosmoke and diet may significantly affect the onset of mostcancers [45], gene-environment interactions can modulatethe outcome of such exposure influencing individual suscep-tibility to tumour initiation and development. Thus, geneticvariability in metabolic activities related to some enzymaticpathways may partially explain individual susceptibility tocancer. The competition and interplay between different

4 Journal of Environmental and Public Health
metabolic pathways are expected to modulate the levels andpattern of the DNA adducts and consequently modify therisk of cancer development, and in several cases the poly-morphic variants have been found to confer to the encodedenzymes higher or lower capacity to activate or detoxify thegenotoxic compounds [37, 46].
Recently microRNAs (miRNAs; small noncoding RNAs)have been suggested to be important in maintaining the lungin a disease-free state through regulation of gene expression(epigenetics mechanisms); however little is known regardingwhether environmental agents can induce such changes.Observation of Jardim et al. [47] reports that alterationof miRNA expression profiles by environmental pollutantssuch as diesel exhaust particles (DEPs) can modify cellularprocesses by regulation of gene expression, which may leadto disease pathogenesis. However, mechanisms of damage byDEP exposure to human respiratory health are only partiallyknown, as reported by Li et al. [48]. The same authorsconfirm upregulation of Matrix-Metalloproteinase-1 (MMP-1) in response to DEPs in human bronchial epithelial (HBE)cells and suggest that human = 1607GG polymorphism is asusceptibility factor for high response [48].
More research for understanding of the interplay betweengenetic and environmental factors is necessary, as discussedby Comuzzie [49] regarding the challenge for applied geneticepidemiology and its relation on the information obtainedby completion of Human Genome Project which is to putthe human genome in context. This means not only toidentify genes impact but also to know how they interactwith the environment. Currently much of the effort ingenetic epidemiology is largely focused on attempting toidentify which genes influence which phenotypes, largelythrough genomewide efforts employing either case/controlstudy designs utilizing association methods. While the iden-tification of the key genes involved in the expression ofa phenotype, particularly for those involved in mediatingdisease risk, is an important endeavour, it only representsa first step. It is highly doubtful that any gene will exert itseffects completely in isolation but rather will have its actionmodulated by a wide range of other genetic, epigenetic,and also environmental factors. The identification of suchenvironmental factors and the deciphering of how theyimpact the action of genes are a fundamental objective ofgenetic epidemiological analyses. Therefore, as the diversity,as well as shear amount, of genetic information continues toaccumulate, the thoughtful definition and quantification ofkey environmental factors must also keep pace if we are totruly understand how the critical interaction between genesand environment gives rise to the phenotypic variation weobserve at the population level [49].
5. What Could Be Done?
The idea is to create intermodal transport chain betweenBari Logistic Center and Logistic Railways Terminals inBalkan Region avoiding the road traffic and reduction ofCO2 using short sea shipping by Ro/Ro vessels and blocktrains. One of the European Commission measures is toshift the balance between transport modes with focusing and
promoting intermodal transport, type of transport stronglyadvocated due to its environmental concerns, safety reasons,and road congestions avoidance.
The first step is organization of railways practice inBosnia and Herzegovina, Serbia, Romania, Montenegro,Croatia, and Bulgaria, mixing private and public consortia,which are going to be able to move merchandise from/toSouthern Europe to/from Eastern Europe. It is necessary tocreate an Intergovernmental Working Group on Railways—new railway management model able to take care of the op-portunities given by all existing European Programs on in-termodal transport sector—which will include all countriesinterested in a project start up. The aim of EU policy is toreduce and also to eliminate technical and operational dif-ferences among national railway systems, with subsequentlyachieving harmonization in terms of technical specifica-tions for infrastructure, signaling, telecommunications, androlling stock taking care of certain operational rules [50, 51]creating common intermodal policy.
Furthermore, this idea could have operational implica-tions in existence of more friendly transport solution, sus-tainable development, climate change prevention, govern-ment regulation, public education, and public policy issuesrelated to human health by creation of health-supportiveenvironment.
This is an integrated approach based on environmen-tal and biological monitoring, including the analysis ofbiomarkers of exposure, early biological effects, and suscep-tibility that could be useful to evaluate global benefits (suchas economics, logistics, transport, environmental, and/orclimate impact) and would be the translation of emergingscientific knowledge in environmental health science intopractical and useful information for clinical medicine as wellas for public health policy.
6. Final Remarks
The influence of genetic polymorphisms of the genes encod-ing for detoxification enzymes on a series of biomarkers wasdemonstrated before [37].
Human variability, especially as it relates to polymor-phisms in biotransformation enzymes, represents an impor-tant factor to consider in evaluating the effects of exposureto genotoxic substances, because polymorphisms are able toact on the individual susceptibility even to the neoplastictransformation [52].
Advances in molecular analytsis give the possibilitiesfor understanding the genetic contribution to phenotypicoutcomes, same as to develop new and creative researchdesigns and techniques to integrate the vast amount ofbiological information into models and careful measurementof the environment. This will, necessarily, have to be amultidisciplinary team science approach.
The contamination of air same as climate change is essen-tially a social problem and because of that it needs integraland coherent transport policy. The social implications of thetransport need to be constantly and carefully monitored.
The starting point is to find sustainable transport andwelcome the development of infrastructure changing as

Journal of Environmental and Public Health 5
Change oftransportation
mode(modal shift)
Possible improvement
Climate change
Decrease CO2
Increasesecurity and
safety
Decreaseenergy
consumption
Public health strategy and healthimprovement
Startingproblem
Possiblesolution
Logistics
Figure 3: Schematic presentation of project idea. Starting from logistic problem, passing through possible solution-introduction ofintermodal transport, problem solution could be achieved with improvement on climate change, security, and safety with positive effects onpublic health.
a policy instrument to contain and reduce congestion,and reduce environmental impacts. It is well reported byKreutzberger et al. [53] that the environmental performanceof intermodal transport is substantially better than that ofunimodal road transport when looking at every use andGHG emission and this is even more outspoken when alsolocal emissions, accidents, congestion, and noise are inte-grated. As regards of the automatic link between economicgrowth and growth in freight transport, the solution is not inreduction of transport but in redistribution between modes.This is a main reason and strength of a project idea whichcould bring a success. Furthermore, in this case we are notonly talking about redistribution between modes [54] oftransport but also we are implementing a new corridor.Enlargement of the European Union is set to trigger largerexchanges of goods and so need for additional investmentsin transport infrastructures. It is well known that south-east Europe transport system distinguishes itself by extremelyfragmented transport. Italy, especially South Italy, with itsgeographical position, cultural, political, humanitarian, andhistorical connections could have prestige and favorable rolebetween European Union and Balkans. Implementation oflegal regulations under supervision could produce differentpositive consequences on health, transport, environment,climate, and so forth.
Environmental pollution is reaching worrying propor-tion worldwide and solution probably could be in differentsmall changes of lifestyle habits which, all together, will beable to produce reduction of potentially toxicants, money
waste, and improvement of environmental with improve-ment of health and life quality.
We can find a good example in “multifactorial” diseases.“Multifactorial” recognizes that these disorders are the resultof both environmental and genetic factors and does prejudgethe relative role of either category. Namely, in this typeof diseases when conditions are favorable, that is, differentmutations and/or polymorphisms of susceptibility togetherwith adverse environment conditions, a pathological situ-ation is observed. However if involved genes are going tobe considered singularly, no one will be able to producepathology, but with contribution given by every gene, theinteraction between them, and environment we have to dealwith illnesses.
Finally we proposed in Figure 3 wide transdisciplinaryactions of project idea, which brings a solution for economicactivity such as transportation, strongly related to pollutionoutput with possible repercussions on climate change andpublic health.
So, if we consider our planet as “living organism” and ouraction as expression of genes, then individually small actionsin different fields could be extremely potent and benefitscould be obtained to us and future generations.
Acknowledgments
The author would like to thank Professor Luigi Viggiano foruseful and constructive comments and suggestions on themanuscript.

6 Journal of Environmental and Public Health
References
[1] P. E. Sheffield and P. J. Landrigan, “Global climate change andchildren’s health: threats and strategies for prevention,” Envi-ronmental Health Perspectives, vol. 119, no. 3, pp. 291–298,2011.
[2] A. Y. Watson, R. R. Bates, and D. Kennedy, Air Pollution,the Automobile, and Public Health, Health Effects Institute,National Academy Press, Washington, DC, USA, 1988.
[3] L. Tomatis, Air Pollution and Human Cancer, Springer, Berlin,Germany, 1990.
[4] F. Godlee, “Health and environment. Air pollution I-II,”British Medical Journal, vol. 303, pp. 1459–1466, 1991.
[5] K. Katsouyanni and G. Pershagen, “Ambient air pollutionexposure and cancer,” Cancer Causes and Control, vol. 8, no.3, pp. 284–291, 1997.
[6] M. Brauer, G. Hoek, H. A. Smit et al., “Air pollution anddevelopment of asthma, allergy and infections in a birthcohort,” European Respiratory Journal, vol. 29, no. 5, pp. 879–888, 2007.
[7] W. J. Gauderman, E. Avol, F. Lurmann et al., “Childhoodasthma and exposure to traffic and nitrogen dioxide,” Epidemi-ology, vol. 16, no. 6, pp. 737–743, 2005.
[8] A. J. Venn, S. A. Lewis, M. Cooper, R. Hubbard, and J. Britton,“Living near a main road and the risk of wheezing illness inchildren,” American Journal of Respiratory and Critical CareMedicine, vol. 164, no. 12, pp. 2177–2180, 2002.
[9] T. Nicolai, D. Carr, S. K. Weiland et al., “Urban traffic andpollutant exposure related to respiratory outcomes and atopyin a large sample of children,” European Respiratory Journal,vol. 21, no. 6, pp. 956–963, 2003.
[10] N. Pierse, L. Rushton, R. S. Harris, C. E. Kuehni, M. Silverman,and J. Grigg, “Locally generated participate pollution and res-piratory symptoms in young children,” Thorax, vol. 61, no. 3,pp. 216–220, 2006.
[11] P. H. Ryan, G. LeMasters, J. Biagini et al., “Is it traffic type,volume, or distance? Wheezing in infants living near truck andbus traffic,” Journal of Allergy and Clinical Immunology, vol.116, no. 2, pp. 279–284, 2005.
[12] R. McConnell, K. Berhane, L. Yao et al., “Traffic, susceptibility,and childhood asthma,” Environmental Health Perspectives,vol. 114, no. 5, pp. 766–772, 2006.
[13] W. J. Gauderman, H. Vora, R. McConnell et al., “Effect of ex-posure to traffic on lung development from 10 to 18 years ofage: a cohort study,” The Lancet, vol. 369, no. 9561, pp. 571–577, 2007.
[14] L. Bayer-Oglesby, C. Schindler, M. E. Hazenkamp-Von Arxet al., “Living near main streets and respiratory symptomsin adults: the Swiss cohort study on air pollution and lungdiseases in adults,” American Journal of Epidemiology, vol. 164,no. 12, pp. 1190–1198, 2006.
[15] J. Sunyer, D. Jarvis, T. Gotschi et al., “Chronic bronchitis andurban air pollution in an international study,” Occupationaland Environmental Medicine, vol. 63, pp. 836–843, 2006.
[16] G. D’Amato, L. Cecchi, M. D’Amato, and G. Liccardi, “Urbanair pollution and climate change as environmental risk factorsof respiratory allergy: an update,” Journal of InvestigationalAllergology and Clinical Immunology, vol. 20, no. 2, pp. 95–102,2010.
[17] R. A. Silverman and K. Ito, “Age-related association of fineparticles and ozone with severe acute asthma in New YorkCity,” Journal of Allergy and Clinical Immunology, vol. 125, no.2, pp. 367–373, 2010.
[18] L. Trasande and G. D. Thurston, “The role of air pollution inasthma and other pediatric morbidities,” Journal of Allergy andClinical Immunology, vol. 115, no. 4, pp. 689–699, 2005.
[19] K. L. Ebi and G. McGregor, “Climate change, troposphericozone and particulate matter, and health impacts,” Environ-mental Health Perspectives, vol. 116, no. 11, pp. 1449–1455,2008.
[20] P. L. Kinney, “Climate change, air quality, and human health,”American Journal of Preventive Medicine, vol. 35, no. 5, pp.459–467, 2008.
[21] R. Crebelli, F. Tomei, A. Zijno et al., “Exposure to benzenein urban workers: environmental and biological monitoringof traffic police in Rome,” Occupational and EnvironmentalMedicine, vol. 58, no. 3, pp. 165–171, 2001.
[22] F. Cassano, P. Bavaro, G. De Marinis, N. Bukvic, and A. Giaco-mantonio, “Benzene pollution in the city of Bari,” GiornaleItaliano di Medicina del Lavoro ed Ergonomia, vol. 20, no. 2,pp. 91–97, 1998.
[23] G. Scherer, “Biomonitoring of inhaled complex mixtures—ambient air, diesel exhaust and cigarette smoke,” Experimentaland Toxicologic Pathology, vol. 57, no. 1, pp. 75–110, 2005.
[24] H. Frumkin, J. Hess, G. Luber, J. Malilay, and M. McGeehin,“Climate change: the public health response,” AmericanJournal of Public Health, vol. 98, no. 3, pp. 435–445, 2008.
[25] N. Gojkovic Bukvic, “Environment friendly transport solu-tion-Transadriatic Balkan Transport Corridor,” in Proceedingsof the REACT Conference Workshop, Belgrade, Serbia, 2011.
[26] Eurostat, Greenhouse gas emission by sector, 2008, http://ec.europa.eu/eurostat/product?code=tsdcc210&language=en&mode=view.
[27] Eurostat, Greenhouse gas emissions by sector, 2006, http://epp.eurostat.ec.europa.eu.
[28] S. Reinfeldt, Enhallbar Energy-Och Klimatpolitik Foor Miljo,Konkurrnskraft Och Trygghert, Regeringskansliet, Stockholm,Sweden, 2009.
[29] K. IFEU and K. Sgkv, Comparative Analysis of Energy Con-sumption and CO2 Emission of Road Transport and CombinedTransport Road/Rail, IRU, Geneva, Switzerland, 2009.
[30] F. Eng Larsson and D. Kollberg, Overcoming the obstacles ofintermodal transport- a shipper perspective on the effects ofmodal shift, Master Thesis conducted at Engineering Logistics,M.S. thesis, Lund University, 2009.
[31] Eurostat, Climate change-driving forces, 2011, http://epp.eu-rostat.ec.europa.eu/statistics explained/index.php.
[32] The World Bank Document, “Railway Reform in the westernBalkans,” December 2005, http://ec.europa.eu/.../rail/.../005world bank western balkans railways report.www.seerecon.org/infrastructure/sectors/transport/documents/REBIS/RebisFR Final.pdf.
[33] H. Norppa, “Cytogenetic biomarkers,” in Mechanistic Consid-erations in the Molecular Epidemiology of Cancer, vol. 157, pp.179–205, IARC Science Publication, 2004.
[34] L. Hagmar, A. Brogger, I. L. Hansteen et al., “Cancer risk inhumans predicted by increased levels of chromosomal aberra-tions in lymphocytes: nordic study group on the health riskof chromosome damage,” Cancer Research, vol. 54, no. 11, pp.2919–2922, 1994.
[35] N. Bukvic, P. Bavaro, G. Elia, F. Cassano, M. Fanelli, and G.Guanti, “Sister chromatid exchange (SCE) and micronucleus(MN) frequencies in lymphocytes of gasoline station atten-dants,” Mutation Research, vol. 415, no. 1-2, pp. 25–33, 1998.
[36] P. Lovreglio, N. Bukvic, S. Fustinoni et al., “ChromosomalAberration (CA) and Sister Chromatide Exchange (SCE)
Journal of Environmental and Public Health 7
frequencies in workers exposed to very low doses of 1.3-butadien,” Archives of Toxicolog, vol. 80, pp. 378–381, 2006.
[37] N. Bukvic, F. Susca, A. Ballini et al., “Relation between detox-ification enzyme polymorphisms and genotoxyc cytogeneticbiomarkers,” Journal of Occupational and Environmental Med-icine, vol. 51, no. 7, pp. 811–821, 2009.
[38] S. Bonassi, L. Hagmar, U. Stromberg et al., “Chromosomalaberrations in lymphocytes predict human cancer indepen-dently of exposure to carcinogens,” Cancer Research, vol. 60,no. 6, pp. 1619–1625, 2000.
[39] H. Norppa, “Cytogenetic biomarkers and genetic polymor-phisms,” Toxicology Letters, vol. 149, no. 1–3, pp. 309–334,2004.
[40] H. Norppa, “Cytogenetic markers of susceptibility: influenceof polymorphic carcinogen-metabolizing enzymes,” Environ-mental Health Perspectives, vol. 105, no. 4, pp. 829–835, 1997.
[41] H. Norppa, “Influence of genetic enzyme polymorphisms oncytogenetic biomarkers,” in Human Monitoring after Environ-mental and Occupational Exposure to Chemical and PhysicalAgents, D. Anderson, A. E. Karakaya, and R. J. Sram, Eds., vol.313, pp. 300–311, NATO Science Series A: Life Sciences 105Press, Amsterdam, The Netherlands, 2000.
[42] H. Norppa, “Genetic polymorphisms and chromosome dam-age,” International Journal of Hygiene and EnvironmentalHealth, vol. 204, no. 1, pp. 31–38, 2001.
[43] H. Norppa, “Genetic susceptibility, biomarker respones, andcancer,” Mutation Research, vol. 544, no. 2-3, pp. 339–348,2003.
[44] I. Schubert and M. A. Lysak, “Interpretation of karyotype evo-lution should consider chromosome structural constraints,”Trends in Genetics, vol. 27, no. 6, pp. 207–216, 2011.
[45] W. C. Willett, “Diet, nutrition, and avoidable cancer,” Environ-mental Health Perspectives, vol. 103, supplement 8, pp. 165–170, 1995.
[46] P. Georgiadis, N. A. Demopoulos, J. Topinka et al., “Impactof phase I or phase II enzyme polymorphisms on lymphocyteDNA adducts in subjects exposed to urban air pollution andenvironmental tobacco smoke,” Toxicology Letters, vol. 149, no.1–3, pp. 269–280, 2004.
[47] M. J. Jardim, R. C. Fry, I. Jaspers, L. Dailey, and D. Diaz-Sanchez, “Disruption of MicroRNA expression in human air-way cells by diesel exhaust particles is linked to tumorigenesis-associated pathways,” Environmental Health Perspectives, vol.117, no. 11, pp. 1745–1751, 2009.
[48] J. Li, A. J. Ghio, S. H. Cho, C. E. Brinckerhoff, S. A. Simon,and W. Liedtke, “Diesel exhaust particles activate the matrix-metalloproteinase-1 gene in human bronchial epithelial in aβ-arrestin-dependent manner via activation of RAS,” Environ-mental Health Perspectives, vol. 117, no. 3, pp. 400–409, 2009.
[49] A. G. Comuzzie, “A grand challenge for applied genetic epi-demiology: putting the human genome in context,” Frontiersin Genetics, vol. 2, p. 10, 2011.
[50] Commission of the European Communities, White Paper: Eu-ropean Transport Oolicy for 2010: Time to Decide, Office forOfficial Publications of the European Communities, Luxem-burg, Germany, 2001.
[51] Commission of the European Communities, Keep EuropeMoving-Sustainable Mobility for Our Continent, Mid-Term Re-view of the European Commission’s 2001 Transport White Paper,Office for Offical Publications of the European Communities,Luxemburg, Germany, 2006.
[52] W. W. Weber, “Influence of heredity on human sensitivityto environmental chemicals,” Environmental and MolecularMutagenesis, vol. 25, no. 26, pp. 102–114, 1995.
[53] E. Kreutzberger, C. Macharis, L. Vereecken, and L. Woxenius,“Is intermodal freight transport more environmental friendlythan all-road freight transport? A review,” in Proceedings of the7th Nectar Conference “A New Millennium. Are things the Same?Umea, Sweden, June 2003.
[54] A. Ogorelc, “European union common transport policy,” NaseMore, vol. 50, no. 5-6, pp. 197–203, 2003.

Hindawi Publishing CorporationJournal of Environmental and Public HealthVolume 2012, Article ID 981365, 8 pagesdoi:10.1155/2012/981365
Research Article
Effects of Three Types of Oil Dispersants onBiodegradation of Dispersed Crude Oil in Water SurroundingTwo Persian Gulf Provinces
Azadeh Zolfaghari-Baghbaderani,1, 2 Mozhgan Emtyazjoo,2, 3 Parinaz Poursafa,4
Sedigheh Mehrabian,5 Samira Bijani,1, 2 Daryoush Farkhani,6 and Parisa Mirmoghtadaee7
1 Islamic Azad University North Tehran Branch, Tehran, Iran2 Iranian Offshore Oil Company, Tehran, Iran3 Faculty of Marine Science and Technology, Islamic Azad University North Tehran Branch, Tehran, Iran4 Environment Research Center, Isfahan University of Medical Sciences, Isfahan, Iran5 Department of Biology, Faculty of Science, Teacher Training University, Tehran, Iran6 Oil Industry Research Center, Tehran, Iran7 Department of Clinical Pharmacy and Pharmacy Practice, School of Pharmacy, Isfahan University of Medical Sciences, Isfahan, Iran
Correspondence should be addressed to Parinaz Poursafa, [email protected]
Received 27 September 2011; Accepted 10 October 2011
Academic Editor: Kelishadi Roya
Copyright © 2012 Azadeh Zolfaghari-Baghbaderani et al. This is an open access article distributed under the Creative CommonsAttribution License, which permits unrestricted use, distribution, and reproduction in any medium, provided the original work isproperly cited.
Objective. To determine the most effective and biodegradable dispersant of spilled oil in water surrounding two Persian Gulfprovinces. Methods. This study compared the effects of three dispersants, Pars 1, Pars 2, and Gamlen OD4000 on removal of oil intwo Persian Gulf provinces’ water. Overall, 16 stations were selected. Using the Well method, the growth rate of isolated bacteria andfungi was identified. To specify the growth rate of microorganisms and their usage of oil in the presence of the above-mentioneddispersants, as exclusive sources of carbon, the bacteria were grown in culture medium for 28 days at 120 rpm, 30◦C, and theiroptical density was measured by spectrophotometry. Then, we tested biological oxygen demand (BOD) and chemical oxygendemand (COD) in microorganisms. Results. The highest growth rate was documented for the growth of microorganisms on eitherPars 1 or Pars 2 dispersants or their mixtures with oil. However, the culture having microorganisms grown on Pars 1 had higherBOD and COD than the other two dispersants (9200 and 16800 versus 500 and 960, P < 0.05). Mixture of oil and Pars 2 as wellas oil and Pars 1 dispersants showed the highest BODs and CODs, respectively. In the Bahregan province, microorganisms grownon Pars 2 had maximum amount of BOD and COD in comparison with Pars 1 and Gamlen dispersants (7100 and 15200 versus6000 and 10560, P < 0.05). Conclusion. Pars 1 and Pars 2 were the most effective dispersants with highest degradability comparingGamlen. In each region, the most suitable compound for removing oil spill from offshores with least secondary contaminationshould be investigated.
1. Introduction
The main causes of oil pollution in the oceans are extractionof oil, transportation with ballast water release and tankeraccidents, and also war-related incidents [1]. Unfortunately,such incidents are not uncommon. Land and offshore oilwells also can be a source of oil spills into ocean water. Oilspills from such accidents may quickly spread over manysquare miles of water surface. The spills are particularlydestructive for local wildlife and plant life when they getclose to shorelines. They also damage boats, fishing gear, and
harbor installations and greatly diminish the value of theshore as recreational resources [2–4].
The use of dispersants in nearshore areas is expected toincrease the exposure of aquatic organisms to petroleum [5].If not treated, crude oil spills would require long period oftime to naturally biodegrade; it nearly takes 22 years forcomplete biodegradation of one kilogram of crude oil bynatural processes [6].
Considering the lack of ability of any bacterial strain forcomplete catabolism and biodegradation of crude oil, findingappropriate strains is necessary. Even microorganisms which

2 Journal of Environmental and Public Health
are consumers of non-hydrocarbonate components occa-sionally play important roles in removal of crude oil fromthe environment [7].
Many methods have been used to remove oil spills fromwater including physical removal of crude oil, chemicalremediation of the spills using dispersants and so-called“sinking agents,” and, in some cases, intentionally burningfloating petroleum slicks. Using chemical dispersants as anoil spill countermeasure is the most frequently employedclean-up method because such liquids can be readily appliedto large oil spills, and also this method is generally more costeffective than physical remediation methods [3, 4].
Furthermore, the exclusive property of these dispersantsto make oil spills dispersed into water will enhance thebiodegradability of crude oil due to the increased exposedsurface of the spills to such agents [8].
Chemical dispersion of an oil slick increases the pet-roleum toxicity, When the meteorological conditions inducethe dispersion of the oil slick such as wave, the applicationof dispersant does not rise the petroleum toxicity [5]. Thesignificant differences between chemically dispersed oil andwater-soluble fraction of oil highlight the environmental riskto disperse an oil slick. The lack of significance betweenchemically and mechanically dispersed oil suggests thatdispersant application is no more toxic than the naturaldispersion of the oil slick [9].
Dispersants contain surfactants, which are surface-activeagents with molecules composed of groups of opposingpolarity and solubility; that is, surfactants usually have bothan oil-soluble hydrocarbon chain and a water-soluble group.The synthetic surfactants can be anionic, cationic, nonionic,or amphoteric; however, only anionic or nonionic surfac-tants are utilized as crude oil dispersants. Surfactant mixturesoften include other chemical agents, such as solvents, whichenhance the dispersing capability of the surfactant [10].
Chemical surfactants are amphiphilic compounds whichcan reduce surface and interfacial tensions by accumulatingat the interface of immiscible fluids and increase the sol-ubility and mobility of hydrophobic or insoluble organiccompounds [11–13].
Chemical surfactants can increase the pseudosolubility ofpetroleum components in water [14, 15].
They are effective in reducing the interfacial tensions ofoil and water in situ, and they can also reduce the oil viscosityand remove water from the oil prior to processing [16, 17].
Nevertheless, not all surfactant compositions are effi-cient in dispersing spilled oil products, and many of theeffective ones have the drawbacks of being toxic and/ornot biodegradable [4]. Biodegradability of such componentsis absolutely crucial; otherwise, they get accumulated inthe environment and make the secondary cause of watercontamination. Modern-day dispersants are much less toxicto sea water than those used in the past. However, concernstill exists on their possible toxic effects, on fresh waterorganisms, especially if dispersants are used near shorewaters [18].
This study was conducted to determine the most effectiveand biodegradable dispersant of spilled oil in water sur-rounding two Persian Gulf provinces.
2. Methods and Materials
We selected two provinces in Persian Gulf because of theirlocation in one of the biggest offshore oil drilling rig andhigh traffic density of oil vessels in the sea lanes of PersianGulf; Siri and Bahregan provinces were studied because oftheir numerous shorelines contaminated by oil spills. Wecompared the effects of the dispersants produced by IranianOffshore Oil Company, that is, Pars 1 Pars 2 in comparisonwith Gamlen, which is actually used in the Persian Gulf water.Biodegradability of Gamlen and its effects on dispersing ofoil had already been studied [11, 19].
The culture used in the investigation was originally iso-lated from 16 sampling stations located at different longitudeand latitude in the Siri and Bahregan province offshore(Table 4).
Microorganisms were isolated through common micro-biological experiments under the sterile condition. Theywere cultured in the presence of Pars 1, Pars 2, and Gamlenseparately and also the combination of each with oil at adispersant-to-oil ratio of 1/20 [10, 20]. Dispersants were theonly source of carbon in the culture. The ability of bacteriaand fungi to grow at the sides of wells was assayed using theWell method and their growth rate was measured throughoptical density reading.
In this regard, isolated microorganisms, which were ableto grow at the side of wells, were individually culturedovernight. 100 mL of manual culture media ((concentrationin 1/mg): KH2PO4 (170), K2HPO4 (435), Na2HPO4 7H2O(668), NH4Cl (850), MgSO4·7H2O (22.5), CaCl2·2H2O(27.5), and FeCl3 (0.25)) and 2 mL of fresh overnight cultureof each microorganisms were poured into six 500 mL flasks.Dispersants as an exclusive source of carbon were added toeach flask as follows: flask 1: Pars 1, flask 2: Pars 2, flask 3:Gamlen, flask 4: Pars 1 and oil, flask 5: Pars 2 and oil, flask 6:Gamlen and oil.
It should be noted that the series of flasks containingboth dispersant and oil was set up by preparing 1 : 20 dilutionof the dispersant/crude oil [10]. Six control flasks containedsterile media, dispersants, and/or crude oil. All flasks wereincubated at 30◦C shaking at 120 rpm for 28 days. In differenttime intervals (24, 48, and 72 hours and 1, 2, 3, and 4weeks), the optical density of each sample was measuredusing spectrophotometer at wave length of 600 nm. Oilcomponents and dispersant were isolated from each sampleprior to oxygen demand (OD) reading using Hexane Normal[21].
In order to identify the biodegradation of above-men-tioned dispersants and their mixture with oil in the samplingstations, the BOD and the COD of each sample weremeasured in the presence of total microorganisms [22, 23].The procedure was as follows: 1 mL of water obtainedfrom each station was inoculated into marine broth in8 screwed cap tubes and one tube was kept as control.Marine broth which is an enriched bacterial medium wasused for enhanced growth of all type of microorganisms.After incubating the tubes at 37◦C for the period of 48–72 hours, all culture media of 8 tubes containing thegrown microorganisms were put together in nutrient broth

Journal of Environmental and Public Health 3
media and were cultured over night. Therefore, a culturemedia containing all microorganisms obtained from thesampling stations was prepared. Then, 1 mL of bacterialsuspension obtained from total microorganisms’ culture wasinoculated to each flask containing 100 mL of manual media.Furthermore, the component was singly added to the seriesof flasks so that each flask contained only one type ofdispersant or its mixture with oil as follows: 1 mL crude oil,1 mL Pars 1, 1 mL Gamlen, 1 mL Pars 2, 1 mL mixture ofcrude oil and Pars 1, 1 mL mixture of crude oil and Pars 2,1 mL mixture of crude oil and Gamlen, and their BOD andCOD were measured after 5 days using the standard method[24].
The standard microbiological procedures were used toidentify the species of the bacterium and fungus microorgan-isms.
2.1. Statistical Analysis. The obtained data was analyzed bythe Statistical Package for Social Sciences software version15.0 (SPSS Inc, Chicago, IL, USA) using analysis of variance(ANOVA) and post hoc Tukey statistical tests.
3. Results
Based on standard microbiological procedures, 4 genera ofbacteria and 3 genera of fungus in Siri province and 4 generaof bacterium and 2 genera of fungus in Bahregan provincewere identified.
3.1. Results Obtained from the Well Method. The ability ofbacteria and fungi to grow in the presence of dispersantsindividually or mixture of each with crude oil is presentedin Table 1 and Figure 1.
The highest number of bacteria and fungi in Siri Provincewere those cultured in the presence of Pars 1, Pars 2 orseparate mixture of each with crude oil, whereas in BahreganProvince, the bacteria around Pars 1 and Pars 2, had bettergrowth rate compared with Gamlen.
3.2. Biomass Analysis of Bacterial Culture Using the OpticalDensity Reading. In Siri province, the microorganisms iso-lated from the sampling stations, which had the ability togrow at the side of wells in the Well method, were cultured28 days for the purpose of biomass analysis. The bacteria andfungi were grown for 28 days, and their optical density wasmeasured in different time intervals. The OD reading showedthat the highest growth occurred in the presence of eitherPars 1 or Pars 2 or their separate mixture with crude oil.
The results of ANOVA and post hoc Turkey statisticaltests are shown in Table 2.
As shown in Table 2, in Siri province significant differ-ences (P = 0.006) were documented in the effects of isolatedmicroorganisms (4 bacteria and three fungi) on differentdispersants (Pars 1, Pars 2, and the combination of Gamlendispersant with crude petroleum) after 24 hours.
The comparison of the mean growth rate using hocTukey test exhibited that there is meaningful differencesbetween Pars 1 and Gamlen dispersants (P ≤ 0.046) and also
0
10
20
30
40
50
60
70
80
90
100
A B C D E F
Nu
mbe
r of
mic
roor
gan
ism
s
Hydrocarbon compounds
(a) A: Pars 1 dispersant; B: Pars 2 dispersant; C: Gamlen dispersant; D:Pars 1 dispersant + crude oil; E: Pars 2 dispersant + crude oil; F: Gamlendispersant + crude oil.
0
20
40
60
80
100
120
A B C D E F G
Nu
mbe
r of
mic
roor
gan
ism
s
Hydrocarbon compounds
Frequency of fungiFrequency of bacteria
(b) A: Pars 1 dispersant; B: Pars 2 dispersant; C: Gamlen dispersant; D:Crude oil; E: Pars 1 dispersant + crude oil; F: Pars 2 dispersant + crudeoil; G: Gamlen dispersant + crude oil.
Figure 1: Abundance of microorganism’s growth at the side of wellscontaining organic components: (a) Siri province; (b) Bahreganprovince.
between Gamlen and combination of crude oil with Pars 1(P ≤ 0.005). In other words, the effect of microorganisms onPars 1 dispersant is more than that on Gamlen dispersant.
This finding is in agreement with the result obtainedfrom the Well method experiment.
The results of ANOVA test on day 28 did not showsignificant difference in effects of microorganisms amongeach dispersant separately or their combination with crudeoil.
The results of ANOVA test on day 28 (P ≤ 0.755)showed that there is no meaningful differences in effects ofmicroorganisms among each dispersant separately or theircombination with crude oil.

4 Journal of Environmental and Public Health
Table 1: Frequency of microorganisms grown at the side of wells inthe Well method.
VariablesFrequency of
fungiFrequency of
bacteria
Siri province
Pars 1 dispersant 10 43
Pars 2 dispersant 8 31
Gamlen dispersant 5 30
Pars 1 + crude oil 24 95
Pars 2 + crude oil 25 68
Gamlen + Petroleum 24 65
Bahregan province
Pars 1 dispersant 20 91
Pars 2 dispersant 18 89
Gamlen dispersant 12 84
Pars 1 + crude oil 14 81
Pars 2 + crude oil 11 88
Gamlen + Petroleum 4 33
Table 2: The effect of isolated microorganisms on Hydrocarbonatecompounds in 24 hours.
Compounds of hydrocarbon Mean SD
Pars 1 dispersant 0.126 0.082
Pars 2 dispersant 0.055 0.049
Gamlen dispersant 0.011 0.004
Crude oil 0.072 0.046
Pars 1 dispersant + petroleum 0.156 0.098
Pars 2 dispersant + petroleum 0.104 0.087
Gamlen dispersant + petroleum 0.115 0.067
Coefficient F = 3.53, P = 0.006, SD: standard deviation.
The optical density of one sample of bacterial and fungalcultures with the highest absorbance during 28 days in Siriprovince is depicted in Figures 2(a) and 2(b).
As shown in Figure 2(a), on the day 28, the highestgrowth rate of Aureobasidium spp. fungus in Siri provincewas observed in the presence of Pars 2 dispersant andthe combination of Pars 2 dispersant with crude oil. Thegrowth pick occurred in the first 24 hours in the presenceof combination of Pars 2 dispersant with crude oil. However,the growth rate of microorganisms in the presence of Pars 1dispersant was also noticeable.
As shown on Figure 2(b), on day 28, the highest growthrate of Pseudomonas spp. bacteria in Siri province was highwhen they were grown in the presence of combination Pars2 dispersant with crude oil and. On day 14, high growthrate of the microorganism was observed in the presence ofcombination of Pars 1 dispersant with crude oil.
In Bahregan, province, the absorbance rate of samplesduring 24, 48, 72 hours, and 1–4 weeks was measured withspectrograph in 600 nm wave length. Moreover, according toFigures 3(a), 3(b), 3(c), and 3(d) that show the growth rate
0
0.05
0.1
0.15
0.2
0.25
0.3
0.35
0.4
0.45
24h 48h 72h 1w 2w 3w 4w
Axi
s ti
tle
Days
(a) Growth rate of Aureobasidium fungus in Siri province
0
0.05
0.1
0.15
0.2
0.25
24h 48h 72h 1w 2w 3w 4w
Days
Pars 1 dispersantPars 2 dispersantGamlen Gamlen + oil
Pars 1 + oilPars 2 + oil
(b) Growth rate of Pseudomonas spp. bacteria in Siri province
Figure 2: Growth rate of fungus and bacteria in Siri province.
in 4 bacteria of Bahregan, the maximum rate was when theywere grown in the presence of Pars 1 and Pars 2 dispersants.
3.3. Results of BOD-COD Tests. The results from BOD andCOD analyses are shown in Table 3; the BOD and CODlevels in culture having only Siri province crude oil were verylow, but, when treated by dispersants, the levels increased.However, as the results show among different combinationsof crude oil and dispersants in Siri province, the mixtureof crude oil and Pars 2 had the highest BOD and CODfollowed by the mixture of crude oil and Pars 1. Moreover,among the three different dispersants under study, Pars 1 hadthe highest BOD and COD. However, In Bahregan Provincethe maximum level of BOD was devoted to Pars 2, Pars 1and Gamlen, respectively. The combination of crude oil and
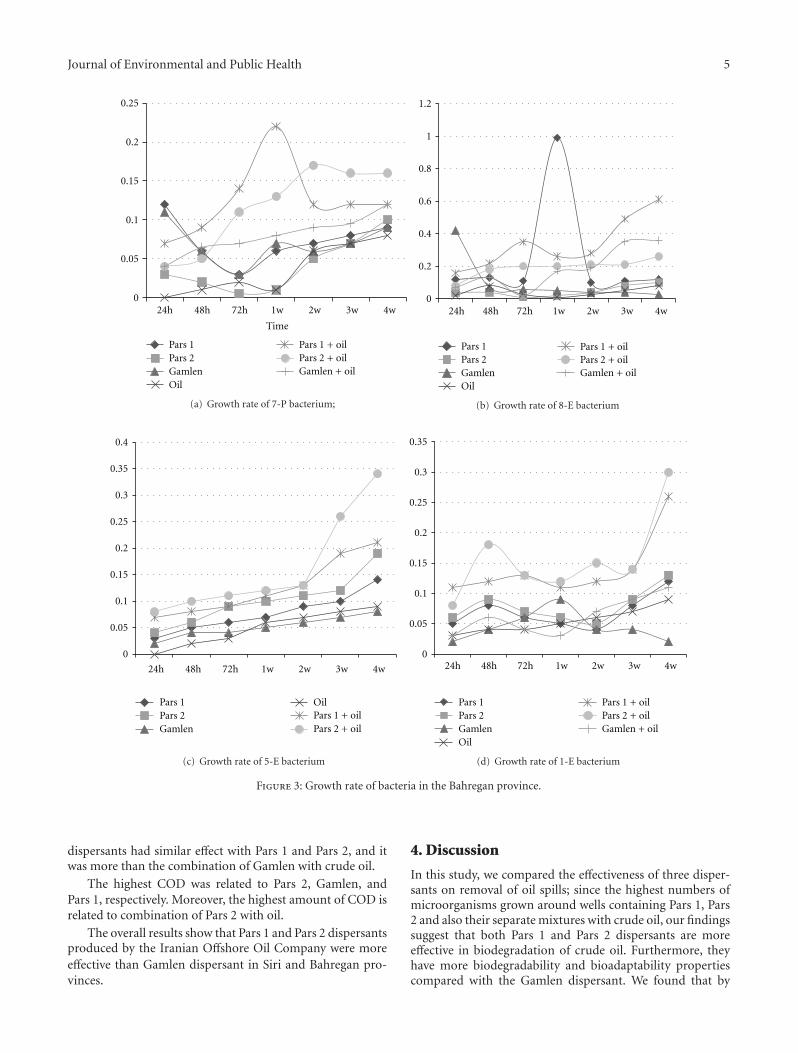
Journal of Environmental and Public Health 5
0
0.05
0.1
0.15
0.2
0.25
24h 48h 72h 1w 2w 3w 4w
Time
Pars 1Pars 2GamlenOil
Gamlen + oil
Pars 1 + oilPars 2 + oil
(a) Growth rate of 7-P bacterium;
0
0.2
0.4
0.6
0.8
1
1.2
24h 48h 72h 1w 2w 3w 4w
Pars 1Pars 2GamlenOil
Gamlen + oil
Pars 1 + oilPars 2 + oil
(b) Growth rate of 8-E bacterium
0
0.05
0.1
0.15
0.2
0.25
0.3
0.35
0.4
24h 48h 72h 1w 2w 3w 4w
Pars 1Pars 2Gamlen
OilPars 1 + oilPars 2 + oil
(c) Growth rate of 5-E bacterium
0
0.05
0.1
0.15
0.2
0.25
0.3
0.35
24h 48h 72h 1w 2w 3w 4w
Pars 1Pars 2GamlenOil
Gamlen + oil
Pars 1 + oilPars 2 + oil
(d) Growth rate of 1-E bacterium
Figure 3: Growth rate of bacteria in the Bahregan province.
dispersants had similar effect with Pars 1 and Pars 2, and itwas more than the combination of Gamlen with crude oil.
The highest COD was related to Pars 2, Gamlen, andPars 1, respectively. Moreover, the highest amount of COD isrelated to combination of Pars 2 with oil.
The overall results show that Pars 1 and Pars 2 dispersantsproduced by the Iranian Offshore Oil Company were moreeffective than Gamlen dispersant in Siri and Bahregan pro-vinces.
4. Discussion
In this study, we compared the effectiveness of three disper-sants on removal of oil spills; since the highest numbers ofmicroorganisms grown around wells containing Pars 1, Pars2 and also their separate mixtures with crude oil, our findingssuggest that both Pars 1 and Pars 2 dispersants are moreeffective in biodegradation of crude oil. Furthermore, theyhave more biodegradability and bioadaptability propertiescompared with the Gamlen dispersant. We found that by

6 Journal of Environmental and Public Health
Table 3: The measurements of BOD and COD (mg/mL).
Crude oil + Gamlen Crude oil + Pars 2 Crude oil + Pars 1 Gamlen Pars 2 Pars 1 Petroleum
Siri province
BOD5 test (mg/mL) 1185 4170 1540 5392 500 9200 65
COD test (mg/mL) 2720 9280 3120 11200 960 16800 128
Bahregan province
BOD5 test (mg/mL) 900 1120 1120 5995 7100 6000 110
COD test (mg/mL) 1840 2880 1840 12480 15200 10560 240
BOD: biological oxygen demand; COD: chemical oxygen demand.
Table 4: Longitude and latitude coordinates of the sampling sta-tions.
Station number Longitude Latitude
Siri province
(1) 54◦33/410 E 25◦54/750 N
(2) 54◦34/027 E 25◦54/921 N
(3) 54◦34/466 E 25◦55/141 N
(4) 54◦30/133 E 25◦50/545 N
(5) 54◦27/344 E 25◦48/738 N
(6) 54◦24/569 E 25◦46/414 N
(7) 54◦21/100 E 25◦44/544 N
(8) 54◦18/005 E 25◦42/156 N
Bahregan province
(1) 49◦29/100 E 32◦29/335 N
(2) 49◦30/027 E 32◦29/251 N
(3) 49◦30/445 E 32◦33/251 N
(4) 49◦29/441 E 32◦30/334 N
(5) 49◦27/302 E 32◦28/336 N
(6) 49◦21/244 E 32◦27/416 N
(7) 49◦19/340 E 32◦29/358 N
(8) 49◦19/004 E 32◦27/779 N
using the Well method experiment, the highest number ofisolated bacteria and fungi was able to grow at the sideof wells containing Pars 1 dispersant. The growth indexrepresents the mass of microorganisms at the side ofwells containing dispersants which indicates the ability ofmicroorganisms to use crude oil and dispersant components[20]. Therefore, microorganisms grown around the wells areconsidered as petroleum-degrading microorganisms. In thisagreement, the highest optical density was related to thebacterial culture containing above-mentioned dispersants asthe exclusive carbon source.
The result of statistical calculations on isolated bacteria(4 genera) and fungi (3 genera) in Siri province showedthat in the first 24 hours, noticeable growth has occurred inthe presence of Pars 1 dispersant as well as its combinationwith crude oil showing significant difference compared to thegrowth of the same organisms in the presence of the otherdispersants or their combination with Siri province crudeoil. In Bahregan province, in all conditions the maximumgrowth rate was found in the presence of Pars 1 and Pars
2 in the environment. In 4 bacteria of Bahregan province,combination of crude oil with 2 bacteria of 5-E and 1-Ewhich are related to Flavobacterium spp. and Enterobacterspp., respectively, showed higher degradability and growthrate. However, in 2 other bacteria which are related toPseudomonas spp and Bacillus genus (7-P and 8-E), thehighest growth rate is when Pars 1 and Pars 2 are the onlysources of carbon in the environment. In 7-P bacteriumthe highest growth rate was observed in the presence ofPars 1 dispersant after one week. 8-E bacterium had thehighest growth in the first week in the presence of Pars 1dispersant and in 4th the week with presence of combinationof Pars 1 and crude oil. Moreover, 5-C and 1-E showed thehighest growth rate after four weeks in the presence of Pars 2dispersant.
These findings confirm that Pars 1 dispersant has moreadaptability to both province ecosystems, and also theyhave more ability in biodegradation of crude oil comparedwith the other two dispersants. There was no significantdifferences in the effect of microorganisms on each disper-sant and also on their combination with crude oil after 28days. However, since the entered material to the ecosystemneeds to be degraded fast, Pars 1 dispersant which showsmore degradability in the first 24 hours comparing otherdispersants, is more adaptable to the environment.
In Siri province, The growth diagrams of Pseudomonasspp. bacteria in 4 weeks showed the highest growth rateof bacteria to the great extent in the presence of Pars 1dispersant and slightly lower extent in the presence of Pars2 dispersant. The growth peak was seen on day 14 in thepresence of combination of Pars 1 dispersant and crude oil.The growth curve of Aureobasidium spp. fungus shows thaton day 28, the highest optical density is observed when themicroorganism is cultured in the presence of Pars 2 and itsmixture with crude oil; also the growth peak occurred in thepresence of the aforementioned mixture in the first 24 hours.However, the microorganisms had also enhanced growth inthe presence of Pars 1 dispersant.
The optical density of microorganism cultures contain-ing dispersants is indicating the usage of these componentsas the sole carbon source which leads to microorganismgrowth and catabolism of the carbohydrate [11, 25]. There-fore, the result of the OD reading and the Well methodexperiments show that Pars 1 and Pars 2 are more effectivein biodegradation of crude oil of both provinces, also theyare more biodegradable than Gamlen dispersant. Overall,

Journal of Environmental and Public Health 7
these findings suggest that Pars 1 and Pars 2 are more bio-adaptable for both province offshores.
In agreement with results obtained from optical densityreading and the Well method experiment, microorganismculture containing Pars 1 showed the highest level of BODand COD. BOD is an indicator of biodegradation of organiccomponents in water. BOD is measured by the amountof required oxygen for bacteria to metabolize organiccomponents. The flasks are kept at 20◦C for 5 days andthe amount of dissolved oxygen is determined by chemicalprocedures. The BOD test identifies the approximate amountof required oxygen for biological oxidation of contami-nated water, surplus water, and sewages. This is the onlyexperiments determining the amount of required oxygenfor bacteria in order to catabolize the organic components.Therefore, the higher BOD shows the increased amountof consumed oxygen which is consequently indicating theenhanced bacterial activity [24].
The COD value indicates the amount of oxygen neededto chemically oxidize organic compounds present in wastew-ater and adjacent to oxidizing material. In fact, chemical oxy-gen demand determines the amount of organic compoundpresent in the sample which has the ability to be oxidized bya strong chemical oxidizing agent [24].
BOD and COD tests are well-known methods forassessment of biodegradability of organic materials such assurfactants; for instance, in a study in 1976, the percentage ofbiodegradation of 123 organic compounds was assayed [23].
Previous studies showed that none of the bacterial speciesare able to catabolize all the components of crude oil, and itscomplete biodegradation depends on the presence of variousbacterial species and microorganisms. Even microorganismswhich are consumers of non-hydrocarbonate compoundscan play important role in biodegradation of crude oil [7].Thus, in the present study, we measured the BOD and theCOD of all microorganism cultures, which were originallyisolated from sampling stations in the Persian Gulf in thepresence of three dispersants and their mixtures with crudeoil and also crude oil alone.
In this study, the highest BOD and COD in Siri provincewere related to culture containing Pars 1 in comparison withthe two other dispersants studied.
Likewise, BOD-COD test performed on different com-binations of dispersants and crude oil showed highest scorefor the combination of Pars 1 and crude oil and secondly tothe mixture of Pars 2 and crude oil. Moreover, in Bahreganprovince the maximum BOD and COD devoted to Pars2 dispersant. These findings suggest that microorganismswith the presence of these compounds require the highestamount of oxygen for their activities including the biodegra-dation of such components. Furthermore, in oxidation anddegradation reactions, in presence of oxidizing agents, thehighest amount of chemical oxygen is demanded; therefore;Pars 1, mixture of Pars 2 and crude oil, and also mixtureof Pars 1 and crude oil hold more degradability propertiescompared to the mixture of Gamlen and crude oil. In fact,Pars 1 and Pars 2 increased biodegradability of crude oil morethan that of Gamlen dispersant. Since Pars 1 showed moredegradability compared with the other two dispersants, the
bioadaptability of this dispersant is high enough, so that itdoes not get accumulated in the region and does not makethe environment contaminated.
5. Conclusion
This study revealed that Pars 1 and Pars 2 dispersants aremore biodegradable than Gamlen and have more effec-tiveness in biodegradation of crude oil. These findingssuggest that, in each region, the most suitable compoundfor removing oil spill from offshores with least secondarycontamination should be investigated.
Acknowledgments
This project was funded by the Naft Falat Ghareh Iran Co.The authors are grateful to the director of the Research andDevelopment Department of this company for his assistanceand cooperation.
References
[1] J. Haapkylal, F. Ramade, and B. Salvat, “Oil pollution on coralreefs: a review of the state of knowledge and managementneeds,” Life and Environment, vol. 57, no. 1-2, pp. 91–107,2007.
[2] J. S. Levintion, Marine Biology, Oxford University Press,Oxford, UK, 1995.
[3] P. Riley, “Composition and methods for dispersing andbiodegrading spilled petroleum oils and fuels,” PetroTech,Article ID 701063, 1998.
[4] N. P. Ventikos, E. O. Vergetis, H. N. Psaraftis, and G.Triantafyllou, “A high—level synthesis of oil spill responseequipment and countermeasures,” Journal of Hazardous Mate-rials, vol. 107, no. 1-2, pp. 51–58, 2004.
[5] T. Milinkovitch, J. Godefroy, M. Theron, and H. Thomas-Guyon, “Toxicity of dispersant application: biomarkersresponses in gills of juvenile golden grey mullet (Liza aurata),”Environmental Pollution, vol. 159, no. 10, pp. 2921–2928, 2011.
[6] J. G. Anson and G. Mackinnon, “Novel pseudomonas plasmidinvolved in aniline degradation,” Applied and EnvironmentalMicrobiology, vol. 48, no. 4, pp. 868–869, 1984.
[7] A. D. Venosa and Z. Xueqing, “Bioremediation of Crude oilcontaminating marine shorelines and fresh water wetlands,”Spill Science & Technology Bulletin, vol. 8, pp. 163–178, 2003.
[8] K. Watanabe, “Microorganisms relevant to bioremediation,”Current Opinion in Biotechnology, vol. 12, no. 3, pp. 237–241,2001.
[9] T. Milinkovitch, R. Kanan, and H. Thomas-Guyon, “Effects ofdispersed oil exposure on the bioaccumulation of polycyclicaromatic hydrocarbons and the mortality of juvenile Lizaramada,” The Science of the total Environment, vol. 1, no. 409,pp. 1643–1650, 2011.
[10] R. J. Fiocco and A. Lewis, “Oil spill dispersants,” Pure andApplied Chemistry, vol. 71, no. 1, pp. 27–42, 1999.
[11] G. J. Mulkins-Phillips and J. E. Stewart, “Effect of fourdispersants on biodegradation and growth of bacteria oncrude oil,” Journal of Applied Microbiology, vol. 28, no. 4, pp.547–552, 1974.
[12] P. H. Pritchard, J. G. Mueller, J. C. Rogers, F. V. Kremer, andJ. A. Glaser, “Oil spill bioremediation: experiences, lessons

8 Journal of Environmental and Public Health
and results from the Exxon Valdez oil spill in Alaska,”Biodegradation, vol. 3, no. 2-3, pp. 315–335, 1992.
[13] E. Z. Ron and E. Rosenberg, “Biosurfactants and oil bioreme-diation,” Current Opinion in Ophthalmology, vol. 13, pp. 249–252, 2002.
[14] W. Chu, “Remediation of contaminated soils by surfactant-aided soil washing,” Practice Periodical of Hazardous, Toxic, andRadioactive Waste Management, vol. 7, no. 1, pp. 19–24, 2003.
[15] T. Pekdemir, M. Copur, and K. Urum, “Emulsification ofcrude oil—water systems using biosurfactants,” Process Safetyand Environmental Protection, vol. 83, no. B1, pp. 38–46, 2005.
[16] A. M. Al-Sabagh, “Surface activity and thermodynamic prop-erties of water-soluble polyester surfactants based on 1,3-dicarboxymethoxybenzene used for enhanced oil recovery,”Polymers for Advanced Technologies, vol. 11, no. 1, pp. 48–56,2000.
[17] Q. Liu, M. Dong, W. Zhoua, M. Ayuba, Y. P. Zhangb, andS. Huangb, “Improved oil recovery by adsorption–desorptionin chemical flooding,” Journal of Petroleum Science andEngineering, vol. 43, no. 1-2, pp. 75–86, 2004.
[18] A. D. Venosa and E. L. Holder, “Biodegradability of dispersedcrude oil at two different temperatures,” Marine PollutionBulletin, vol. 54, no. 5, pp. 545–553, 2007.
[19] L. Bordbar, S. Oryan, M. Emtiyazjoo, and D. Farkhani, “Theeffect and the toxicity of Iranian oil dispersant (Pars 1) onrainbow trout,” Ecology and the Environment, vol. 88, no. 10,2006.
[20] E. V. Pleshakova, A. Y. Muratova, and O. V. Turkovskaya,“Degradation of mineral oil with a strain of Acinetobactercalcoaceticus,” Applied Biochemistry and Microbiology, vol. 37,no. 4, pp. 342–347, 2001.
[21] A. Vijay, Biodegradation of petroleum hydrocarbons, M.S. thesis,IIT Bombay, Mumbai, India, 2001.
[22] G. Nakhla, M. Al-Sabawi, A. Bassi, and V. Liu, “Anaerobictreatability of high oil and grease rendering wastewater,”Journal of Hazardous Materials, vol. 102, no. 2-3, pp. 243–255,2003.
[23] P. Pitter, “Determination of biological degradability of organicsubstances,” Water Research, vol. 10, no. 3, pp. 231–235, 1976.
[24] L. S. Clesceri, A. E. G. Berg, and R. Trusell, StandardMethods for the Examination of Water and Waste Water,American Public Health Association, Washington, DC, USA,17th edition, 2005.
[25] D. Delille and B. Delille, “Field observations on the variabilityof crude oil impact on indigenous hydrocarbon-degradingbacteria from sub-Antarctic intertidal sediments,” MarineEnvironmental Research, vol. 49, no. 5, pp. 403–417, 2000.
Hindawi Publishing CorporationJournal of Environmental and Public HealthVolume 2012, Article ID 407162, 8 pagesdoi:10.1155/2012/407162
Research Article
Environmental Impact Assessment of the IndustrialEstate Development Plan with the Geographical InformationSystem and Matrix Methods
Mohammad Ghasemian,1 Parinaz Poursafa,2 Mohammad Mehdi Amin,2
Mohammad Ziarati,3 Hamid Ghoddousi,4 Seyyed Alireza Momeni,4
and Amir Hossein Rezaei2, 5
1 Tehran Wastewater Company, Power Ministry, Tehran, Iran2 Environment Research Center, Isfahan University of Medical Sciences, Isfahan, Iran3 Department of Geography, Isfahan University, Isfahan, Iran4 Environment Division, Isfahan Industrial Estates Company, Isfahan, Iran5 Science and Research Branch, Islamic Azad University, Tehran, Iran
Correspondence should be addressed to Parinaz Poursafa, [email protected]
Received 5 September 2011; Accepted 26 September 2011
Academic Editor: Kelishadi Roya
Copyright © 2012 Mohammad Ghasemian et al. This is an open access article distributed under the Creative CommonsAttribution License, which permits unrestricted use, distribution, and reproduction in any medium, provided the original work isproperly cited.
Background. The purpose of this study is environmental impact assessment of the industrial estate development planning. Methods.This cross-sectional study was conducted in 2010 in Isfahan province, Iran. GIS and matrix methods were applied. Data analysiswas done to identify the current situation of the region, zoning vulnerable areas, and scoping the region. Quantitative evaluationwas done by using matrix of Wooten and Rau. Results. The net score for impact of industrial units operation on air quality of theproject area was (−3). According to the transition of industrial estate pollutants, residential places located in the radius of 2500meters of the city were expected to be affected more. The net score for impact of construction of industrial units on plant species ofthe project area was (−2). Environmental protected areas were not affected by the air and soil pollutants because of their distancefrom industrial estate. Conclusion. Positive effects of project activities outweigh the drawbacks and the sum scores allocated to theproject activities on environmental factor was (+37). Totally it does not have detrimental effects on the environment and residentialneighborhood. EIA should be considered as an anticipatory, participatory environmental management tool before determining aplan application.
1. Introduction
The existing tendency of industrialization and urbanizationin developing countries has an enormous impact on naturaland man-made environments. Pollution sources increasewith the development of cities and cause contamination ofair, water, and soil. Lack of urban environmental planningand management strategies has led to better concern forupcoming urban expansion [1].
Unprecedented growing rates of global human popula-tion and urban development make tremendous stress onlocal, regional, and global air and water quality. A neces-
sity to better understanding of the factors that mediatethe interactions between urbanization and variations ofenvironmental quality exists [2].
Land use modification, urbanization, and infrastructuredevelopments specifically could destruct the natural environ-ments and are threating the biodiversity. Tools and measuresmust be adapted to evaluate and remedy the potentialeffects on biodiversity caused by human activities and devel-opments. Within physical planning, environmental impactassessment (EIA) plays important roles in the predictionand assessment of biodiversity-related impacts from planneddevelopments [3].
2 Journal of Environmental and Public Health
EIA is one of the main legislative tools recognized toreduce an anthropogenic impact on the environment. EIAcan be defined as “a process by which information about theenvironmental effects of a project is collected, both by thedeveloper and from other sources, and taken into account bythe relevant decision-making body before a decision is givenon whether the development should go ahead.” [4].
The purpose of EIA is to ensure that the environmentaleffects of a proposed development are fully considered,together with its economic or social benefits. This shouldbe considered before the planning application would bedetermined. EIA is thus an anticipatory, participatory envi-ronmental management tool.
The extensive understanding of EIA as an anticipatoryenvironmental management tool has made a significantconsideration over the extent to which it is achieving itspurposes. This has been measured in terms of EIA “effective-ness,” especially as discussion has moved away from issuesof procedural operation to the more practical goals of EIAand its place in more comprehensive decision-making situa-tions [5].
Geographical information systems (GISs) bring theopportunity to enhance predictable evaluation techniques(e.g., matrix-based assessments). It acts as graphic mediatorsof spatial knowledge and by providing an effective tool forthe spatial and temporal analysis of environmental impacts.GIS has the potential to increase the objectivity and accuracyof the assessment, to improve both the understanding ofenvironmental and planning concerns and the distributionof information. Therefore, it may help to develop theeffectiveness of strategic environmental assessment practice[6].
For monitoring industrial pollution in the case ofdeveloping countries, the design of policy instruments is ademanding task. In principle, the regulator has a collection ofphysical, legal, financial, and other tools. However, existenceof a great number of small-scale industries and informalregion pollution sources, requiring knowledge, funds, tech-nology, and skills to treat their effluent, leads to failure [7].
At the present time, due to the inappropriate expansionof industries in Iran, similar to other developing countries,environmental attitudes for suitable protection of environ-ment are vital for next generations, and it has attractedauthorities’ attention. In this regard, the government hasattempted to establish and to develop different industrialestates in various parts of the country for managing indus-trial activities to control the environmental pollution [8].
The environmental impacts of projects or actions gen-erally include a comprehensive range of impacts. All theseimpacts vary in magnitude, as well as in their beneficial oradverse organization [9].
According to the industrial estates company’s policy inIran, planning the industrial units follow specific patternsand in each estate separated sites have been predicted fordifferent industries. Therefore, each industry could be apotential source of solid, liquid, and gaseous emissions andtheir effects on humans, natural flora, air, soil, water sources,climate conditions, cultural heritage, and valuable materialsshould be evaluated.
The purpose of this study is to establish EIA for anindustrial estate development planning in Iran by using theGIS and matrix methods.
2. Materials and Methods
This cross-sectional study was conducted in 2010, in Isfahanprovince, in central Iran. The following methods were usedfor EIA.
2.1. GIS Assessment Method. Environmental evaluation ofKoohpayeh industrial estate by using GIS was conducted bythe following processes.
2.1.1. Identifying Effective Factors in Environmental Degrada-tion. Including climate, geology, hydrology data, and somedegradation factors in the region such as its location,different types of pollutants, land use, and ecological data.
2.1.2. Collecting and Entering Data. The collection of infor-mation on the site and surroundings of the proposed devel-opment (“baseline” information) is essential in EIA, as in theimplementation of any proposed development.
2.1.3. Data Analysis. Required data for analyzing maps ofdifferent organizations was gathered with scale of 1 : 50000and using the Universal Transverse Mercator (UTM) system,and they were given digits with ARC GIS software. In analyz-ing steps, data analysis was done by using existing operatorsto identify the current situation of the region, zoningvulnerable areas, and scoping the region, which is affectedby pollutants. For this purpose, overlay method and analysisof ground water was used.
To perform zoning, considered parameters were selectedand then they were scored by expert evaluators. Thereafter,classified layer zones were categorized.
2.2. Evaluation with Quantitative Method by Using the Matrix.Quantitative evaluation method was done by using thematrix of Rau and Wooten [9], that is, the other format ofLeopold Matrix (1).
Net score for impact = magnitude of effect
× (importance of effect).
(1)
In each project, the effect magnitude of activities is definedbased on environmental parameters with classifying eachgroup of pollutants; for example, it is defined based ontechnical and scientific principles for determining effectmagnitude of each group. The scope for importance of effectis similar for all of the impacts. In this study, the range ofimportance of effect is defined with the numbers of 0 to 5 asit presented in Table 4.
2.3. District of the Study Area. In this study, developmentplanning of the industrial estate, located in the Isfahanprovince, central of Iran, was evaluated. The current area

Journal of Environmental and Public Health 3
N
Figure 1: Current and development layout of industrial zones in the study project.
of the industrial estate is 150 hectares (Figure 1, dark colorpart), and its extent development planning is 350 hectares.The development plan is included various types of indus-tries such as food, chemical, ceramic industries, thermaland sound insulation, and other manufacturing industries(Figure 1).
3. Results
The entries in matrix represent not only an indication of theareas impacted by each action, but also serve as a measureof the impact’s extent. Table 1 provides an illustration ofthe basic structure of the matrix method approach, namely,a matrix in which each proposed action (or its separatecomponents) is identified as a column of the matrix and theenvironmental conditions or impacted areas are identified asthe rows of the matrix.
3.1. EIA for Gaseous and Particulate Pollutants via Matrix
3.1.1. Qualitative Analysis. Based on daily meteorologicaldata in synoptic station of Naein city in a one year period(2010), the minimum and maximum speed of prevailingwind were 0 and 15 m/s, respectively. Moreover, most daysin a year have a mild air flow. So, Koohpayeh region isin class C of atmospheric stability classes and the regionatmosphere is slightly unstable. Therefore, the particulateand gaseous pollutants will become diluted and their neg-ative effects would reduce. However, the wind rose of theregion (Figure 2) shows that the prevailing wind in thisindustrial estate has east-west direction and vice versa with21% of region wind rose. There is no residential area indownstream, and air pollutants have enough opportunityfor becoming diluted in the environment. Instability air inindustrial estate location cause releasing the emissions and it
increases the concentration of air pollutants in comparisonwith background air.
3.1.2. Quantitative Analysis. Given the mentioned condi-tions, the importance of particulate and gaseous pollutantson this industrial estate air quality is very low with thescore of 1 (Table 1). Moreover, considering the atmosphericstability, the magnitude of effect for C stability class is −3(Table 5). Therefore, as shown in Table 1, cell (4, 11), thenet score for impact of “industrial units operation” on “airquality” of the project area is equal to −3 [1× (−3) = −3].
The magnitude effect of particulate and gaseous pollu-tants on air quality based on atmospheric stability classes isdetermined in Table 5.
3.2. Air Pollution Assessment through GIS. Considering thehighest percentage wind speed of 2–5 m/s in the study areawith an average speed of 3 m/s, the height of 25 m for themost elevated stack in the estate, and using Gaussian model,pollutants concentration in various distances from the estateis indicated in Table 2.
According to the transition of industrial estate pollutants,residential places located in the radius of 2500 meters of thecity would be affected more (Figure 3).
3.3. Gaseous and Particulate Pollutants Effects on Plant Species.The status of pastures has been selected as a criterion ofevaluating pollutants effects on plants. Due to severe destruc-tion of soil and vegetation in the pastures, five classes wereconsidered for rating. For this purpose, rangeland vegetationpercentage method is provided by US Range service.
In this method, current rangeland composition vegeta-tion of increaser and decreaser plants are calculated in climaxstage, and their statuses will be determined by using 5 class-scales in Table 6.

4 Journal of Environmental and Public Health
Ta
ble
1:M
atri
xfo
rE
IAof
the
indu
stri
ales
tate
.
Env
iron
men
talf
acto
rs
Pro
ject
Act
ivit
ies
Soil
and
Ear
th
Gro
un
dw
ater
quan
tity
and
qual
ity
Floo
dA
irqu
alit
yN
oise
Pla
nt
and
anim
alsp
ecie
sO
ccu
pati
onH
ousi
ng,
edu
cati
on,a
nd
wel
fare
Em
igra
tion
Hea
lth
and
safe
tyTo
talF
acto
rIm
pact
12
34
56
78
910
11
Exc
avat
ion
and
emba
nkm
ent
1−2
(2)
01(
2)−1
(2)
−1(1
)−2
(1)
1(3)
00
0−2
Con
stru
ctio
nof
wat
erdi
stri
buti
onn
etw
ork
2−1
(1)
−2(1
)0
−1(2
)−1
(1)
−2(1
)1(
3)1(
2)0
−1(1
)−4
Con
stru
ctio
nof
stor
mw
ater
and
indu
stri
alse
wer
3−1
(1)
−1(1
)2(
3)−1
(2)
−1(1
)−2
(1)
1(3)
1(2)
0−1
(1)
3
Con
stru
ctio
nof
indu
stri
alw
aste
wat
ertr
eatm
ent
plan
t4
−1(3
)0
0−1
(2)
−1(1
)−2
(1)
1(3)
1(2)
0−1
(1)
−4
Tran
spor
tati
onof
wor
kers
50
00
00
01(
5)0
00
5
Con
stru
ctio
nof
indu
stri
alu
nit
s6
−1(1
)0
00
−1(1
)−2
(1)
1(3)
1(2)
0−1
(1)
0
Indu
stri
alSo
lidw
aste
disp
osal
7−2
(2)
−3(2
)0
00
00
00
−1(1
)−1
1
Req
uir
edw
ater
(In
dust
rial
use
)8
0−2
(3)
00
00
00
00
−6
Op
erat
ion
ofw
aste
wat
ertr
eatm
ent
plan
t9
1(1)
−1(2
)0
−2(1
)0
00
−1(1
)0
2(3)
0
Dis
char
geof
Indu
stri
aleffl
uen
t10
−2(1
)−3
(2)
00
02(
4)0
00
00
Indu
stri
alu
nit
sop
erat
ion
11−2
(3)
00
−3(1
)−2
(1)
−1(1
)5(
5)5(
5)4(
5)−2
(1)
56
Tota
lact
ion
impa
ct12
−21
−23
8−1
3−7
−345
3220
−137
An
egat
ive
sign
(−)
inth
efr
ont
ofth
em
agn
itu
den
um
ber
show
sth
atth
eim
pact
isad
vers
e(T
able
2).

Journal of Environmental and Public Health 5
Wind speed (m/s)
>11.18.8–11.15.7–8.8
3.6–5.72.1–3.60.5–2.1
North
South
West East
5%
10%
15%
20%
25%
Figure 2: Wind rose of the study area.
Koohpayeh industrial estate
Population centers
Pollution concentration:
>1300 mg/L36–130 mg/L10.5–36 mg/L5.2–10.5 mg/L
0 10 20 40(km) N
mg/L361–1300mg/L130–361
Figure 3: Pollutant emission on the residential districts of the studyarea.
Table 2: Predicted pollutants concentration in various distancesfrom the estate using Gaussian model.
Distance (km) Pollutants concentration (mg/L)
2 1300
5 361
10 130
20 36
Protected areasKoohpayeh industrial estate
>1300 mg/L36–130 mg/L10.5–36 mg/L5.2–10.5 mg/L
mg/L361–1300mg/L130–361
Figure 4: The magnitude of air pollution effects on wildlifeprotected zones of the study area.
3.3.1. Quantitative Analysis. Excavation and embankment,construction of industrial units, water distribution network,and industrial wastewater collection system have a lowmagnitude effect with score of −2 (Table 7) and very lowimportance impact with score of 1 (Table 4) was considered.Therefore, as shown in Table 1, cell (6, 6), the net scorefor impact of “Construction of industrial units” on “Plantspecies” of the project area is equal to −2 [1× (−2) = −2].
3.4. EIA of the Wildlife Zones. Environmental protected areasare not affected by the air and soil pollutants because of theirdistance from industrial estate. According to the locationof the wildlife protected areas (southwest of the estate) andregion wind rose (Figure 2), the percentage of wind to thesouthwest about 6 percent of the winds, blow into this regionduring the year. Therefore, these regions were not highlyaffected by pollutants. The pattern of prevailing winds in thisestate indicated that these winds have west-east direction.Figure 4 shows the magnitude of air pollution effects onwildlife-protected areas.
3.5. EIA for Groundwater Quality via Matrix
3.5.1. Quantitative Analysis. As indicated in Table 1, cell (2,10), importance effect of discharge of industrial effluentson ground water considered “low” with the score of 2, andmedium and intermittent magnitude of effect consideredwith the score of −3 (Table 3).
Water resources of study area are provided by wellsand Qanats, and there is no surface water resource in this
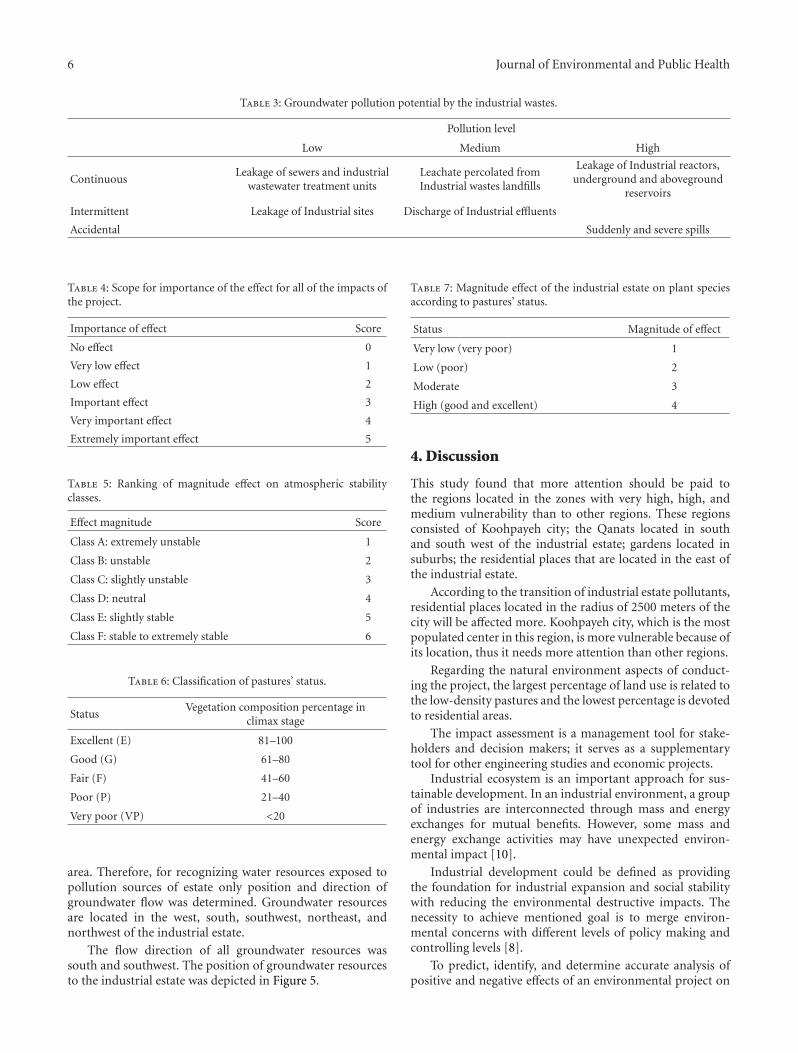
6 Journal of Environmental and Public Health
Table 3: Groundwater pollution potential by the industrial wastes.
Pollution level
Low Medium High
ContinuousLeakage of sewers and industrial
wastewater treatment unitsLeachate percolated fromIndustrial wastes landfills
Leakage of Industrial reactors,underground and aboveground
reservoirs
Intermittent Leakage of Industrial sites Discharge of Industrial effluents
Accidental Suddenly and severe spills
Table 4: Scope for importance of the effect for all of the impacts ofthe project.
Importance of effect Score
No effect 0
Very low effect 1
Low effect 2
Important effect 3
Very important effect 4
Extremely important effect 5
Table 5: Ranking of magnitude effect on atmospheric stabilityclasses.
Effect magnitude Score
Class A: extremely unstable 1
Class B: unstable 2
Class C: slightly unstable 3
Class D: neutral 4
Class E: slightly stable 5
Class F: stable to extremely stable 6
Table 6: Classification of pastures’ status.
StatusVegetation composition percentage in
climax stage
Excellent (E) 81–100
Good (G) 61–80
Fair (F) 41–60
Poor (P) 21–40
Very poor (VP) <20
area. Therefore, for recognizing water resources exposed topollution sources of estate only position and direction ofgroundwater flow was determined. Groundwater resourcesare located in the west, south, southwest, northeast, andnorthwest of the industrial estate.
The flow direction of all groundwater resources wassouth and southwest. The position of groundwater resourcesto the industrial estate was depicted in Figure 5.
Table 7: Magnitude effect of the industrial estate on plant speciesaccording to pastures’ status.
Status Magnitude of effect
Very low (very poor) 1
Low (poor) 2
Moderate 3
High (good and excellent) 4
4. Discussion
This study found that more attention should be paid tothe regions located in the zones with very high, high, andmedium vulnerability than to other regions. These regionsconsisted of Koohpayeh city; the Qanats located in southand south west of the industrial estate; gardens located insuburbs; the residential places that are located in the east ofthe industrial estate.
According to the transition of industrial estate pollutants,residential places located in the radius of 2500 meters of thecity will be affected more. Koohpayeh city, which is the mostpopulated center in this region, is more vulnerable because ofits location, thus it needs more attention than other regions.
Regarding the natural environment aspects of conduct-ing the project, the largest percentage of land use is related tothe low-density pastures and the lowest percentage is devotedto residential areas.
The impact assessment is a management tool for stake-holders and decision makers; it serves as a supplementarytool for other engineering studies and economic projects.
Industrial ecosystem is an important approach for sus-tainable development. In an industrial environment, a groupof industries are interconnected through mass and energyexchanges for mutual benefits. However, some mass andenergy exchange activities may have unexpected environ-mental impact [10].
Industrial development could be defined as providingthe foundation for industrial expansion and social stabilitywith reducing the environmental destructive impacts. Thenecessity to achieve mentioned goal is to merge environ-mental concerns with different levels of policy making andcontrolling levels [8].
To predict, identify, and determine accurate analysis ofpositive and negative effects of an environmental project on

Journal of Environmental and Public Health 7
Ground water
Estate area
N
(a)
Very low affectedLow affectedHighly affectedMost highly affected
Critical zoneCommunication linesIndustrial estateUnderground water
N
0 5 10 20
(km)
(b)
Figure 5: The position of the groundwater resources to theindustrial estate (a) and the Qanats exposed to pollution (b).
natural and man-made environments, it is necessary to eval-uate these projects before their implementation to estimatethe minimum negative consequences in the future. Thus,spatial analyzing tool can be used under water analyzingtool and destruction model in GIS.
Table 8: Effect magnitude of project activities on groundwaterquality.
Effect magnitude Score
No effect 0
Low and intermittent 1
Low and continuous 2
Medium and intermittent 3
Medium and continuous 4
High and continuous 5
The purpose of using these tools is preventing degra-dation and reduction of vulnerability level of ecosystemsas well as prevention of the destruction in developmentprograms. Moreover, some preventive ways against the short-term recurrence of destruction can be suggested. Therefore,it is vital to evaluate the environmental impacts of theindustrial development to provide a clear management forthe decision-makers and stakeholders. Environmental pro-tection issues are considered as parts of the national laws,and application of such projects may be of help in thisregard.
The main limitation of this study is its cross-sectionalnature. Some damages caused by this development projectsuch as groundwater contamination may have nonmeasur-able environmental impact, which is not compensable.
5. Conclusion
Results of quantitative analysis of the effects of environ-mental factors on the industrial estate development projectby the matrix method demonstrated that the sum scoresallocated to the project activities on environmental factoris “+37,” which means that positive effects of projectactivities outweigh the drawbacks and totally it does not havedetrimental effects on the environment and residentialneighborhood (Table 8).
Given that the qualitative and quantitative analysis,industrial estate development project might have somenegative effects on some environmental factors but gener-ally, development of this estate should not be prevented.Moreover, with considering all factors including socio-economic factors that have special effect on developmentprocess, performing of the project with minimum negativeconsequences should be provided.
Acknowledgment
This study was funded by a research Grant supported by theIsfahan Industrial Estates Company, Isfahan, Iran.
References
[1] H. M. Alshuwaikhat, “Strategic environmental assessment canhelp solve environmental impact assessment failures in devel-oping countries,” Environmental Impact Assessment Review,vol. 25, no. 4, pp. 307–317, 2005.

8 Journal of Environmental and Public Health
[2] J.-D. Duh, V. Shandas, H. Chang, and L. A. George, “Rates ofurbanisation and the resiliency of air and water quality,” Sci-ence of the Total Environment, vol. 400, no. 1–3, pp. 238–256,2008.
[3] M. Gontier, U. Mortberg, and B. Balfors, “Comparing GIS-based habitat models for applications in EIA and SEA,” Envi-ronmental Impact Assessment Review, vol. 30, no. 1, pp. 8–18,2010.
[4] D. Komınkova, “Environmental impact assessment and ap-plication—part 1,” in Encyclopedia of Ecology, J. S. Erik andF. Brian, Eds., Academic Press, Oxford, UK, 2008.
[5] S. Jay, C. Jones, P. Slinn, and C. Wood, “Environmental impactassessment: retrospect and prospect,” Environmental ImpactAssessment Review, vol. 27, no. 4, pp. 287–300, 2007.
[6] A. Gonzalez, A. Gilmer, R. Foley, J. Sweeney, and J. Fry, “Ap-plying geographic information systems to support strategicenvironmental assessment: opportunities and limitations inthe context of Irish land-use plans,” Environmental ImpactAssessment Review, vol. 31, pp. 368–381, 2011.
[7] V. Kathuria, “Informal regulation of pollution in a developingcountry: evidence from India,” Ecological Economics, vol. 63,no. 2-3, pp. 403–417, 2007.
[8] J. Nouri, A. H. Mahvi, M. Younesian, R. Nabizadeh, and I.Hashemi, “Environmental impacts assessment of industrialestate providing with managerial process,” Iranian Journal ofEnvironmental Health Science and Engineering, vol. 4, no. 2, pp.121–126, 2007.
[9] J. G. Rau and D. C. Wooten, Environmental Impact AnalysisHandbook, McGraw-Hill, New York, NY, USA, 1980.
[10] A. Singh, H. H. Lou, C. L. Yaws, J. R. Hopper, and R. W.Pike, “Environmental impact assessment of different designschemes of an industrial ecosystem,” Resources, Conservationand Recycling, vol. 51, no. 2, pp. 294–313, 2007.

Hindawi Publishing CorporationJournal of Environmental and Public HealthVolume 2012, Article ID 817187, 8 pagesdoi:10.1155/2012/817187
Research Article
Ethylbenzene Removal by Carbon Nanotubes fromAqueous Solution
Bijan Bina,1 Hamidreza Pourzamani,2 Alimorad Rashidi,3 and Mohammad Mehdi Amin1
1 Environment Research Center, Isfahan University of Medical Sciences, Isfahan, Iran2 Environment Research Center and Department of Environmental Health Engineering, School of Health,Isfahan University of Medical Sciences, Isfahan, Iran
3 Gas Division, Research Institute of Petroleum Industry (RIPI), Tehran, Iran
Correspondence should be addressed to Mohammad Mehdi Amin, [email protected]
Received 29 August 2011; Accepted 10 September 2011
Academic Editor: Kelishadi Roya
Copyright © 2012 Bijan Bina et al. This is an open access article distributed under the Creative Commons Attribution License,which permits unrestricted use, distribution, and reproduction in any medium, provided the original work is properly cited.
The removal of ethylbenzene (E) from aqueous solution by multiwalled, single-walled, and hybrid carbon nanotubes (MWCNTs,SWCNTs, and HCNTs) was evaluated for a nanomaterial dose of 1 g/L, concentration of 10–100 mg/L, and pH 7. The equilibriumamount removed by SWCNTs (E: 9.98 mg/g) was higher than by MWCNTs and HCNTs. Ethylbenzene has a higher adsorptiontendency on CNTs, so that more than 98% of it adsorbed in first 14 min, which is related to the low water solubility and thehigh molecular weight. The SWCNTs performed better for ethylbenzene sorption than the HCNTs and MWCNTs. Isothermsstudy indicates that the BET isotherm expression provides the best fit for ethylbenzene sorption by SWCNTs. Carbon nanotubes,specially SWCNTs, are efficient and rapid adsorbents for ethylbenzene which possess good potential applications to maintainhigh-quality water. Therefore, it could be used for cleaning up environmental pollution to prevent ethylbenzene borne diseases.
1. Introduction
Ethylbenzene (aromatic organic compound) is important onmaterial in the chemical process industries. This materialis usually used as raw material in numerous chemical pro-ductions and also often as solvent in a wide variety of man-ufacturing processes [1].
Ethylbenzene is widely used in industry as solvents fororganic synthesis, equipment cleaning, and other down-stream processing purposes. They are present in refinery andchemical industry effluents. The ethylbenzene is frequentlyfound in groundwater because of leaks in underground stor-age tanks and pipelines, improper waste disposal practices,inadvertent spills, and leaching from landfills [2]. Thispollutant has been found to cause many serious health sideeffects to humans (e.g., skin and sensory irritation, centralnervous system depression, respiratory problems, leukemia,cancer, and disturbance of the kidney, liver, and bloodsystems) [3].
Ethylbenzene removal from groundwater has been widelystudied, and several processes have been successfully applied.
A considerable effort has been dedicated in the past yearsconcerning the removal of ethylbenzene from water andwastewater, several methods have been proposed and devel-oped, and the most extensively used is adsorption process.
Carbon nanotubes (CNTs) have attracted great interestbecause of their unique chemical structure and intriguingphysical properties [4]. The large adsorption capacity ofCNTs for organic pollutant is primarily due to their poresstructure and the existence of a wide spectrum of surfacefunctional groups. The adsorption mechanism of ethylben-zene on CNTs is mainly attributed to the π-π electrondonor-acceptor interaction between the aromatic ring ofethylbenzene and the surface carboxylic groups of CNTs [5].
The adsorption of ethylbenzene on Pt and on epitaxialFeO and Fe3O4 films is studied by Ranke and Weiss [6].Lu et al. used surface modification of carbon nanotubes toenhance ethylbenzene adsorption from aqueous solutions.The NaOCl-oxidized CNTs have superior adsorption per-formance toward ethylbenzene with many types of carbonand silica adsorbents reported in the literature [5]. Su et al.employed multiwalled carbon nanotubes (MWCNTs) that

2 Journal of Environmental and Public Health
were oxidized by sodium hypochlorite (NaOCl) solution toenhance the adsorption of ethylbenzene in an aqueous solu-tion [7]. Aivalioti et al. studied the removal of ethylbenzenefrom aqueous solutions by raw (DR) and thermally modifieddiatomite [3].
These studies indicate that CNTs have high affinity withboth organic and inorganic chemicals. Literature also showedthe potential for developing carbon nanotube technologiesfor treating ethylbenzene in water. It is commonly dischargedfrom many kinds of industrial activities and frequentlyencountered in the groundwater of gasoline-contaminatedsites [3–7].
The present study aimed to determine the removal effi-ciency for ethylbenzene using single-walled and multiwalledcarbon nanotubes and hybrid carbon nanotubes and to ranktheir ethylbenzene removal abilities. The contribution of thisstudy is the evaluation of using hybrid CNTs in ethylbenzeneremoval that was not found in the literature.
2. Materials and Methods2.1. Materials. The chemical tested in this study was ethyl-benzene (Merck, purity: 99.7%). A stock solution of approx-imately 100 mg/L of ethylbenzene was prepared by dissolvingappropriate amounts of substance in a standard solution thatcontained 100 mg/L of ethylbenzene in deionized H2O. Themixture was mixed thoroughly by using an ultrasonic bath(BANDELIN Sonorex Digtec) for 60 min. Then, it was stirredcontinuously for 24 h at 25◦C. After shaking, the solutionwas put in the ultrasonic bath again for 30 min and wasused to prepare the initial ethylbenzene solution with a 10–100 mg/L concentration. Finally, standard series and sampleswere prepared using deionized H2O to achieve the desiredconcentrations.
2.2. Experimental Conditions. Batch adsorption experimentswere conducted using 110 mL glass bottles with the additionof 100 mg of adsorbents and 100 mL of ethylbenzene solutionat an initial concentration (C0) of 10 mg/L. It was chosen tobe representative of low ethylbenzene level in water pollutedwith gasoline. The glass bottles were sealed with 20 mmstoppers. The headspace within each beaker was minimizedto exclude any contaminant volatilization phenomena. Theglass bottles from the batch experiments were placed on ashaker (Orbital Shaker Model OS625) and were stirred at240 rpm at room temperature for 10 minutes. The solutionsamples were then allowed to settle for 2 min. Finally,the ethylbenzene concentration in the liquid phase wasdetermined using gas chromatography with detector of massspectrometry (GC/MS). All of the experiments were repeatedthree times, and only the mean values were reported. Blankexperiments, without the addition of adsorbents, were alsoconducted to ensure that the decrease in ethylbenzeneconcentration was not due to adsorption on the wall ofthe glass bottle or volatilization. The pHin was adjusted toneutral using 0.05 M HCl or 0.05 M NaOH. The amountsof adsorbed ethylbenzene on the adsorbents (qe, mg/g) werecalculated as follows:
qe = (C0 − Ct)× V
m, (1)
where C0 and Ct (mg/L) are the ethylbenzene concentrationsat the beginning and after a certain period of time, V is theinitial solution volume (Li), and m is the adsorbent weight(g).
2.3. Chemical Analysis. An Agilent Technologies systemconsisting of a 5975C inert MSD with a triple-axis detec-tor equipped with a 7890A gas chromatograph with asplit/splitless injector was used for ethylbenzene measure-ments. A fused silica column, HP-5 ms (5% phenyl-95%dimethylpolysiloxane; 30 m × 0.25 mm I.D, 0.25 μm), wasemployed with helium (purity 99.995%) as the carrier gasat a flow rate of 1 mL/min. The column temperature wasprogrammed as follows: 36◦C for 2 min, increasing to 140◦Cat 10◦C/min and holding for 6 min. The injector port wasmaintained at 210◦C, and a 1 mL volume of headspace wasinjected in splitless mode (2.0 min). The effluent from theGC column was transferred via a transfer line held at 280◦Cand fed into a 70 eV electron impact ionization source heldat 280◦C. The data were acquired and processed by the dataanalysis software.
Static headspace analysis was performed using a CTCPAL-Combi PAL headspace sampler. The experimentalparameters of the headspace sampler were as follows: incu-bation time, 25 min; incubation temperature, 70◦C; sampleloop volume, 1 mL; syringe/transfer line temperature, 110◦C;flash time, 2 min with N2; loop fill time, 0.03 min; injectiontime, 1 min; and sample volume, 10 mL in 20 mL vials. NoNaCl was added to the samples.
The pH measurements were made with a pH meter(EUTECH, 1500).
2.4. Adsorbents. During the experimental procedure, threedifferent nanomaterials were tested: (1) single-walled carbonnanotubes (SWCNTs), (2) multi-wall carbon nanotubes(MWCNTs), and (3) hybrid carbon nanotubes (HCNTs).The SWCNTs with 1-2 nm diameter (Figure 1), MWCNTswith 10 nm diameter (Figure 2), and HCNTs were a hybridof MWCNTs and silica (Figure 3) to open the tubes ofMWCNT as a sheet instead of tube. These adsorbentswere purchased from the Iranian Research Institute of thePetroleum Industry.
2.5. Analysis of Data. For the data analysis, design ofexperiments (DOE) software (Design Expert 6) was used.In this software, the analysis was done with a generalfactorial plan. Isotherm Fitting Tool (ISOFIT) is a softwareprogram that fits isotherm parameters to experimental datavia the minimization of a weighted sum of squared error(WSSE) objective function. ISOFIT supports a number ofisotherms, including (1) Brunauer-Emmett-Teller (BET), (2)Freundlich, (3) Freundlich with Linear Partitioning (F-P),(4) Generalized Langmuir-Freundlich (GLF), (5) Langmuir,(6) Langmuir with Linear Partitioning (L-P), (7) Linear,(8) Polanyi, (9) Polanyi with Linear Partitioning (P-P), and(10) Toth. Observation weights are ideally assigned accordingto individual estimates of measurement error, such thatwi = 1/sdi, where sdi is the standard deviation of the ithmeasurement.

Journal of Environmental and Public Health 3
100n
m115
k2917
Figure 1: TEM image of SWCNT.
25 nm
10 nm
3.8 nm
Figure 2: TEM image of MWCNT.
2.6. Recycling Method. The reversibility of the sorbents thatwere used for ethylbenzene removal from aqueous solutionwas evaluated via 2 successive adsorption cycles followed by2 successive desorption cycles. Recycling was also conductedat 105 ± 2◦C and 24 h in an oven (Memmert D-91126,Schwabach FRG). All samples were replicated at least intriplicate.
3. Results and Discussion
3.1. Adsorption Performance. Table 1 shows the ethylbenzeneremoval percent for MWCNTs, SWCNTs, and HCNTs underan initial ethylbenzene concentration of 10 mg/L, an adsor-bent concentration of nanomaterial of 1000 mg/L, contacttime of 10 min, and shaking at 240 rpm.
35 nm
Figure 3: TEM image of HCNT.
90.6
93
95.5
97.9
100.4
Eth
ylbe
nze
ne
rem
oval
(%)
MWCNT SWCNT Hybrid CNT
CNT
Figure 4: Design expert plot for MWCNT, SWCNT, and HCNT inethylbenzene removal with a C0 of 10 mg/L.
9.2
109.9
8.5
9
9.5
10
10.5
q e(m
g/g)
MWCNT SWCNT HCNT
Adsorbent
Figure 5: Equilibrium amount of ethylbenzene adsorbed on CNTswith a C0 of 10 mg/L.

4 Journal of Environmental and Public Health
96.9
97.7
98.6
99.4
100.2
Eth
ylbe
nze
ne
rem
oval
(%)
SWCNTraw SWCNTrec1 SWCNTrec2
SWCNT
(a)
94.8
95.6
96.5
97.3
98.2
Eth
ylbe
nze
ne
rem
oval
(%)
HCNTraw HCNTrec1 HCNTrec2
Hybrid CNT
(b)
85.3
87.1
89
90.8
92.7
Eth
ylbe
nze
ne
rem
oval
(%)
MWCNTraw MWCNTrec1 MWCNTrec2
MWCNT
(c)
Figure 6: Design expert plot for raw and recycled CNTs in ethylbenzene removal: (a): SWCNTs, (b): HCNTs, and (c): MWCNTs.
Table 1: Ethylbenzene removal by MWCNT, SWCNT, and HCNTat C0 = 10 mg/L and contact time of 10 min.
AbsorbentEthylbenzene
Ct (mg/L) Removal percent (%)
MWCNT 0.23 91.7
SWCNT 0.03 99.5
HCNT 0.04 97.6
Based on the DOE analysis, there were differencesbetween MWCNTs, SWCNTs, and HCNTs for ethylbenzeneremoval (values of “Prob > |t|” less than 0.05).
Figure 4 shows the ethylbenzene removal by MWC-NTs, SWCNTs, and HCNTs and a comparison betweenthem. SWCNTs were better than HCNTs and MWCNTs,and also HCNTs were better than MWCNTs at removingethylbenzene.
Table 2: Ethylbenzene removal by raw and recycled MWCNTs,SWCNTs, and HCNTs at C0 = 10 mg/L and contact time of 10 min.
AdsorbentEthylbenzene
Ct (mg/L) Removal percent (%)
MWCNTrec1 1.16 88.5
SWCNTrec1 0.01 99.8
HCNTrec1 0.35 96.5
MWCNTrec2 1.37 86.3
SWCNTrec2 0.23 97.7
HCNTrec2 0.43 95.7
Figure 5 indicates the equilibrium amounts of ethylben-zene adsorbed on MWCNTs, SWCNTs, and HCNTs (qe) witha C0 of 10 mg/L and contact time of 10 min.
The results from this study showed that the qe forSWCNTs is higher than for HCNTs and MWCNTs. With

Journal of Environmental and Public Health 5
Table 3: Summary of selected diagnostics for ethylbenzene adsorbed by CNTs.
AdsorbentsSelected
diagnosticsIsotherms
GLF Toth Linear Langmuir F-P L-P Freundlich P-P BET Polanyi
SWCNTs
AICc 34.4 41.5 41.5 41.5 41.5 41.5 44.7 45.5 24.5 72.8
R2y 0.988 0.962 0.962 0.962 0.962 0.962 0.962 0.962 0.992 0.000
R2N 0.934 0.892 0.892 0.892 0.892 0.892 0.892 0.888 0.966 0.947
M2 30 1 × 10⁻⁹ 3 × 10⁻⁹ 2 × 10⁻¹⁰ 3 × 10⁻¹⁰ 4 × 10⁻¹⁰ 7.3 5 × 10⁻¹ 2 × 10⁻² 9 × 10⁵
Linearityassessment
Non-linear
Linear Linear Linear Linear LinearNon-linear
Non-linear
LinearNon-linear
HCNTs
AICc 25.9 26.3 26.3 26.3 26.3 29.5 29.5 31.3 40.7 72.8
R2y 0.994 0.992 0.992 0.992 0.992 0.992 0.992 0.992 0.960 0.000
R2N 0.946 0.942 0.942 0.942 0.942 0.942 0.942 0.952 0.945 0.957
M2 83 6 × 10⁻¹⁰ 1 × 10⁻⁹ 8 × 10⁻¹⁰ 6 × 10⁻¹⁰ 3 × 10² 20 5 × 10⁻¹ 10 2 × 10⁶
Linearityassessment
Non-linear
Linear Linear Linear LinearNon-linear
Non-linear
Non-linear
LinearNon-linear
MWCNTs
AICc 30.7 34.8 34.8 34.8 34.8 34.8 38.6 39.3 37.6 68.1
R2y 0.989 0.980 0.980 0.980 0.980 0.980 0.979 0.980 0.965 —
R2N 0.931 0.914 0.914 0.914 0.914 0.914 0.914 0.918 0.956 0.944
M2 39 1 × 10⁻⁹ 2 × 10⁻⁹ 2 × 10⁻⁹ 2 × 10⁻⁹ 2 × 10⁻⁹ 11 5 × 10⁻¹ 11 3 × 10⁻⁹
Linearityassessment
Linear Linear Linear Linear Linear LinearNon-linear
Non-linear
Linear Linear
AICc: Multimodel ranking, R2y : Correlation between measured and simulated observation, R2
N : Correlation between residual and normality, M2: Linssenmeasure of nonlinearity.
a C0 of 10 mg/L, the SWCNTs showed the greatest qe(ethylbenzene: 9.98 mg/g). The equilibrium amount (qe) forethylbenzene adsorption sequence is SWCNTs > HCNTs >MWCNTs.
Equilibrium amount from Lu et al. study for surfacemodification of carbon nanotubes qe for ethylbenzeneobtained 180 mg/g for a C0 of 60 mg/L [5]. And in studyof Aivalioti et al., qe for ethylbenzene adsorbed by rawdiatomite soil and thermally modified diatomite were 0.3 and0.6 mg/g, respectively [3]. The equilibrium results from Su etal. study showed that the qe of ethylbenzene adsorption (ata C0 of 200 mg/L, contact time of 240 min, and 600 mg/L ofadsorbent concentration) by raw CNT and modified CNT byNaOCl were 255 and 274 mg/g, respectively [7].
The results imply the presence of chemically inheritedgroups that lead to direction of the affinity for ethylbenzeneremoval, irrespective of the texture characteristics. Thisindicates that the adsorption of ethylbenzene on CNTs isdependent on the surface chemical nature and the porositycharacteristics. Similar findings have been reported in theliterature for the adsorption of ethylbenzene on activatedcarbon [8] and multiwalled carbon nanotubes (MWCNTs)[5, 7].
As shown in Figure 3 used of silica with MWCNT asHCNT, silica cause opens the tubes of MWCNTs and producesheet of carbon nanotubes, which have more area thanMWCNTs for ethylbenzene adsorption. It is response formore removal of ethylbenzene by HCNTs than MWCNTs.
Furthermore, the electrostatic interaction between theethylbenzene molecules and the SWCNT surface may alsoexplain the observation of high ethylbenzene adsorption viathe single-walled CNTs. Because the ethylbenzene molecules
are positively charged [5], the adsorption of ethylbenzene isthus favored for adsorbents with a negative surface charge.This results in more electrostatic attraction and thus leads toa higher ethylbenzene adsorption.
Under analogous conditions, the present SWCNTs andHCNTs show better performance for ethylbenzene adsorp-tion than do other adsorbents. This suggests that theSWCNTs and HCNTs are efficient ethylbenzene adsorbents.Because the costs of commercially available HCNTs are con-tinuously decreasing, it may be possible to utilize these novelnanomaterials for ethylbenzene removal in water and wast-ewater treatment in the near future.
3.2. CNTs Recycling. Repeated availability is an importantfactor for an advanced adsorbent. Such adsorbent not onlypossesses higher adsorption capability, but also should showbetter desorption property, which will significantly reducethe overall cost for the adsorbent.
Although CNTs show more ethylbenzene sorption capac-ities form aqueous solution, very high unit cost currentlyrestricts their potential use in water and wastewater treat-ment. Thus, testing the reversibility of sorbents used forethylbenzene removal is required in order to reduce theirreplacement cost. For this purpose as a part of the stud-y, probability for used SWCNTs, MWCNTs, and HCNTsrecycling was investigated. Table 2 shows the ethylbenzeneremoval percent by MWCNTs, SWCNTs, and HCNTs thatwere recycled in the first cycle (MWCNTrec1, SWCNTrec1,and HCNTrec1) and MWCNTs, SWCNTs, and HCNTsthat were recycled in the second cycle (MWCNTrec2,SWCNTrec2, and HCNTrec2) under initial ethylbenzeneconcentration of 10 mg/L, nanomaterial concentration of

6 Journal of Environmental and Public Health
1000 mg/L, contact time of 10 min, and shaking at 240 rpm.Figure 6 compares raw SWCNTs, HCNTs, and MWCNTswith their recycling in cycles of 1 and 2.
It is apparent that CNTs can be reused for the removalof ethylbenzene through a large number of water and wast-ewater treatment and regeneration cycles. The presence ofmetal catalysts in raw SWCNTs that could be retainedthrough the chemical process to functionalize of SWCNTsmay be removed due to heating and cause better adsorptionperformance for recycled SWCNTs than raw SWCNTs. Alsothe structure and nature of carbon surface were changedafter thermal treatment including the increase in graphitizedstructure and the decrease in surface functional groups andnegative charges [9]. These specifications of SWCNTs causemore adsorption of ethylbenzene.
Results show that the ethylbenzene adsorbed by theSWCNTs, MWCNTs, and HCNTs could be easily desorbedby temperature, and thereby they can be employed repeatedlyin water and wastewater management. This is the key factorfor whether a novel but expensive sorbent can be accepted bythe field or not. It is expected that the unit cost of CNTs canbe further reduced in the future by recycling heat processes.So; the SWCNTs, HCNTs, and MWCNTs appear possiblycost effective ethylbenzene sorbents in water and wastewatertreatment.
As CNTs and carbonaceous materials such as blackcarbon, coal, and kerogen in soils/sediments that are com-posed of almost the same element, desorption differencemay be due to their distinct geometric structure. The car-bonaceous materials exhibit a high degree of porosity andextended interparticulate surface area, whereas CNTs are onedimensional hollow nanosize tubes as well as aggregates.CNTs easily adhere to each other and form bundles due tostrong Van der Waals interactions. The adsorption sites aretherefore defined for the entire bundles instead of individualnanotubes. There are four possible groups of adsorption siteson bundles, including interior of individual tubes, interstitialchannels between nanotubes, external groove sites, and theouter surface sites of individual tubes on the peripheralsurface of the bundles. The interior of individual tubes isonly available in open-ended tubes; the interstitial channelsare applied for large tube diameters, while grooves and theexternal surface are of most importance for adsorption [4].Therefore, it is inferred that most of the ethylbenzene islocated on the external adsorption sites. Moreover, CNTscannot form closed interstitial spaces in their aggregates.Hence, ethylbenzene adsorbed release due to temperature.
The sorbent weight loss was neglected in the recyclingprocesses. The weight loss can be attributed to the evapo-ration of adsorbed water and the elimination of carboxylicgroups and hydroxyl groups on the CNT wall [5].
3.3. Isotherm Study. The adsorption equilibrium data ofethylbenzene on SWCNTs, HCNTs, and MWCNTs sampleswere fitted by several well-known isotherm models to assesstheir efficacies. In this study, ISOFIT was applied to involvingthe adsorption of ethylbenzene with initial concentration of10–100 mg/L (10, 20, 30, 40, 50, 60, 70, 80, 90, and 100 mg/L)by SWCNTs, HCNTs, and MWCNTs. Water solubility (Sw)
0102030405060708090
100
Sorb
edco
nc.
(mg
E/g
SWC
NT
)
0 20 40 60 80 100
Aqueous solution (mgE/l)
Observed data P-P isotherm
GLF isotherm Polany isotherm
(a)
0
20
40
60
80
100
Sorb
edco
nc.
(mg
E/g
SWC
NT
)0 20 40 60 80 100
Aqueous solution (mgE/l)
Observed data
Linear, Thot, Freundlich, Langmuir, F-PLand -P isotherm
BET isotherm
(b)
Figure 7: Plots of fitted isotherms and observed data of ethylben-zene adsorption by SWCNTs: (a) Toth, P-P, GLF, and Polanyi, (b)linear, Freundlich, Langmuir, F-P, L-P, and BET.
of ethylbenzene was estimated 152 mg/L at pH 7. Numerousstudies have considered one or more of the supportedisotherms in the context of a water-wastewater system. Thedual-mode isotherms reflect recently developed models forthe sorption of hydrophobic organic solutes [10].
To characterize parameter uncertainty, ISOFIT reportsparameter correlation coefficients and 95% linear confidenceintervals for each isotherm parameter. The correlation coef-ficient (CORij) between parameters Xi and Xj is a measureof the linear dependence between the two parameters; valuesrange from −1 to 1, with a value of zero (0) indicating nocorrelation.
Isotherm expressions are important for describing thepartitioning of contaminants in environmental systems.Table 3 summarizes some of the diagnostic statistics comput-ed by ISOFIT and reported in the output file for ethyl-ben-zene adsorption by CNTs.
Figure 7 contains plots of the fitted isotherms for ethyl-benzene adsorption by SWCNTs, (organized into visually in-distinguishable groups) along with the observed data points.
Figure 8 contains plots of the fitted isotherms for ethyl-benzene adsorption by HCNTs, (organized into visually in-distinguishable groups) along with the observed data points.

Journal of Environmental and Public Health 7
0102030405060708090
100
0 20 40 60 80 100
Sorb
edco
nc.
(mg
E/g
HC
NT
)
Aqueous solution (mgE/l)
Observed data P-P isotherm
GLF isotherm Polany isotherm
(a)
0
20
40
60
80
100
0 20 40 60 80 100
Observed data
Linear, Toth, Freundlich, Langmuir, F-P
BET isotherm
Aqueous solution (mgE/l)
Sorb
edco
nc.
(mg
E/g
HC
NT
)
Land -P isotherm
(b)
Figure 8: Plots of fitted isotherms and observed data of ethylben-zene adsorption by HCNTs: (a) Toth, P-P, GLF, and Polanyi, (b)linear, Freundlich, Langmuir, F-P, L-P, and BET.
Figure 9 contains plots of the fitted isotherms for ethyl-benzene adsorption by HCNTs, (organized into visually in-distinguishable groups) along with the observed data points.
The AICc values indicate that the BET isotherm expres-sion provides the best fit of ethylbenzene adsorption bySWCNTs, GLF isotherm expression provides the best fit ofethylbenzene adsorption by HCNTs, and GLF isotherm is thebest fit for ethylbenzene adsorption by MWCNTs.
In this study, the results showed that ISOFIT providedsuperior fits in ethylbenzene removal by SWCNTs, for BET,GLF, and Polanyi isotherms and for ethylbenzene removalby HCNTs and MWCNT and provided superior fits for allisotherms. ISOFIT was used by Shawn Matott to the adsorp-tion of zinc by ferrihydrite. Results indicate that ISOFITproduced equivalent or better fits values. In particular,ISOFIT provided superior fits for the GLF, Toth, Polanyi, andPolanyi-Partition isotherms [10]. The adsorption process ofatrazine on CNTs studyed by Yan et al. shows the adsorp-tion equilibrium isotherms were nonlinear and were fittedby Freundlich, Langmuir, and Polanyi-Manes models. Itwas found that the Polanyi-Manes model described theadsorption process better than other two isotherm models[4].
0102030405060708090
100
0 20 40 60 80 100
Sorb
edco
nc.
(mg
E/g
MW
CN
T)
Aqueous solution (mgE/l)
Observed data P-P isotherm
GLF isotherm Polany isotherm
(a)
0
20
40
60
80
100
0 20 40 60 80 100
Aqueous solution (mgE/l)
Sorb
edco
nc.
(mg
E/g
MW
CN
T)
Observed dataLinear, Toth, Freundlich, Langmuir, F-P
BET isothermLand -P isotherm
(b)
Figure 9: Plots of fitted isotherms and observed data of ethylben-zene adsorption by MWCNTs: (a) Toth, P-P, GLF, and Polanyi, (b)linear, Freundlich, Langmuir, F-P, L-P, and BET1.
Wibowo et al. studied the adsorption of benzene andtoluene from aqueous solutions onto activated carbon; theirstudy shows that the Langmuir equation can describe theexperimental data fairly well than Freundlich [1].
In the adsorption mechanism of aromatic compoundsin liquid phase on SWCNT, there are two main typesof interactions, including electrostatic and dispersive. Thefunctional group linked to the adsorptive aromatic ring canactivate or deactivate it that removes its electronic charge.Electron with drawing groups on an aromatic ring create apartial positive charge in the ring, while deactivating groupsproduce the opposite effect, creating a partial negative charge[1].
Here, ethylbenzene is in the molecular form in theaqueous solution; in this case, dispersive interactions arepredominant, mainly because of the attraction between the πorbital on the SWCNT basal planes and the electronic densityin the benzene and toluene aromatic rings (π-π interactions)[1].
The limitations of this study were using constantcondition for ethylbenzene removal. Somewhat separationof nanotubes from supernatant was also difficult. Carbonnanotubes are in the nano of one dimension. Also, to

8 Journal of Environmental and Public Health
provide a well adsorption; ethylbenzene should penetrateinto the tubes. This causes slow absorption, and increasingthe contact time is required. Similar findings have beenreported in the literature for the adsorption of ethylbenzeneby multiwalled carbon nanotubes (MWCNTs) [7]. But, in thehybrid nanotubes sheets, these tubes are opened and contactsurfaces are more easily available.
4. Conclusion
We concluded that SWCNTs showed a higher adsorptioncapacity for ethylbenzene removal than MWCNTs andHCNTs. Also between MWCNT and HCNT, HCNT showsbetter performance for ethylbenzene removal because ofsheet shape produced by silica. It appears that ethylbenzeneis the component with higher adsorption tendency on CNTs.The equilibrium amount (qe) sequence is SWCNTs > HCNTs> MWCNTs.
Results of CNTs recycling show that the ethylbenzeneadsorbed by the SWCNTs, MWCNTs, and HCNTs could beeasily desorbed by temperature, and thereby they can beemployed repeatedly in water and wastewater management.
ISOFIT provided superior fits for the BET isothermfor ethylbenzene removal by SWCNTs, and GLF fits forethylbenzene removal by HCNTs and MWCNTs.
More research works on the toxicity of CNTs and CNT-related materials are needed before practical use of CNTs inwater and wastewater treatment because it can be realized.
Acknowledgment
The authors wish to acknowledge the Department of Envi-ronmental Health Engineering and the Environment Re-search Center, Vice-chancellery of Research, Isfahan Univer-sity of Medical Sciences for financial support of ResearchProject no. 389065.
References
[1] N. Wibowo, L. Setyadhi, D. Wibowo, J. Setiawan, and S. Is-madji, “Adsorption of benzene and toluene from aqueoussolutions onto activated carbon and its acid and heat treatedforms: influence of surface chemistry on adsorption,” Journalof Hazardous Materials, vol. 146, no. 1-2, pp. 237–242, 2007.
[2] H. Shim, E. Shin, and S.-T. Yang, “A continuous fibrous-bedbioreactor for BTEX biodegradation by a co-culture of Pseu-domonas putida and Pseudomonas fluorescens,” Advances inEnvironmental Research, vol. 7, no. 1, pp. 203–216, 2002.
[3] M. Aivalioti, I. Vamvasakis, and E. Gidarakos, “BTEX andMTBE adsorption onto raw and thermally modified diatom-ite,” Journal of Hazardous Materials, vol. 178, no. 1–3, pp. 136–143, 2010.
[4] X. M. Yan, B. Y. Shi, J. J. Lu, C. H. Feng, D. S. Wang, and H. X.Tang, “Adsorption and desorption of atrazine on carbon na-notubes,” Journal of Colloid and Interface Science, vol. 321, no.1, pp. 30–38, 2008.
[5] C. Lu, F. Su, and S. Hu, “Surface modification of carbonnanotubes for enhancing BTEX adsorption from aqueous so-lutions,” Applied Surface Science, vol. 254, no. 21, pp. 7035–7041, 2008.
[6] W. Ranke and W. Weiss, “Photoemission of ethylbenzeneadsorbed on Pt(111) and on epitaxial films of FeO(111) andFe3O4(111): electronic structure and isosteric heats of adsorp-tion,” Surface Science, vol. 414, no. 1-2, pp. 236–253, 1998.
[7] F. Su, C. Lu, and S. Hu, “Adsorption of benzene, toluene, ethyl-benzene and p-xylene by NaOCl-oxidized carbon nanotubes,”Colloids and Surfaces A: Physicochemical and Engineering As-pects, vol. 353, no. 1, pp. 83–91, 2010.
[8] A. A. M. Daifullah and B. S. Girgis, “Impact of surface charac-teristics of activated carbon on adsorption of BTEX,” Colloidsand Surfaces A: Physicochemical and Engineering Aspects, vol.214, no. 1–3, pp. 181–193, 2003.
[9] C. Lu and F. Su, “Adsorption of natural organic matter by car-bon nanotubes,” Separation and Purification Technology, vol.58, no. 1, pp. 113–121, 2007.
[10] L. S. Matott and A. J. Rabideau, “ISOFIT—a program for fit-ting sorption isotherms to experimental data,” EnvironmentalModelling & Software, vol. 23, no. 5, pp. 670–676, 2008.

Hindawi Publishing CorporationJournal of Environmental and Public HealthVolume 2012, Article ID 674596, 10 pagesdoi:10.1155/2012/674596
Research Article
Community-Led Assessment of Risk from Exposure to Mercury byNative Amerindian Wayana in Southeast Suriname
Daniel Peplow1, 2 and Sarah Augustine1
1 Suriname Indigenous Health Fund, International Humanities Center, White Swan, WA 98952, USA2 College of the Environment, University of Washington, Seattle, WA 98195, USA
Correspondence should be addressed to Daniel Peplow, [email protected]
Received 16 May 2011; Revised 12 September 2011; Accepted 21 September 2011
Academic Editor: Rainer Schulin
Copyright © 2012 D. Peplow and S. Augustine. This is an open access article distributed under the Creative Commons AttributionLicense, which permits unrestricted use, distribution, and reproduction in any medium, provided the original work is properlycited.
This study was a collaboration between Western public health researchers and Suriname indigenous communities. The questionasked was “how can Western researchers effectively engage traditional indigenous communities in Suriname, South America,in public health research”. The approach used a combination of Participatory Action Research methods in which “Western”researchers became participating observers in an indigenous-led research initiative. The Wayana communities of Puleowime(Apetina) and Kawemhakan (Anapayke) defined a single objective: determine for themselves whether they are at risk from exposureto mercury (Hg) contamination. Community members collected hair samples for analysis. Hair samples were analyzed using aportable Hg analyzer. Individual, community and hazard quotient indices were used to quantify risk. Results showed the Wayanawere at a high lifetime risk of adverse effects from exposure to Hg. This study showed that the community-led approach is aneffective way Westerners can engage indigenous communities and address serious public health threats. While factors that appealedto indigenous communities were identified, obstacles inherent to Western research methodology were also encountered.
1. Introduction
This study began in 2007 with one overarching objective,which was for Wayana communities in southeast Surinameto determine for themselves the risk of exposure to con-taminants from mining, especially mercury (Hg), on theirhealth. To this end, a community-led research design wascreated in partnership between community leaders in twoWayana villages and two non-governmental organizations.Community leaders represented the perspective and interestsof community members and as such defined the context,the research problem and led the exploration of culturallyappropriate public health solutions. Community leadersinvited two non-governmental organizations to assist themin designing and carrying out an environmental risk assess-ment study. The Suriname organization Stichting WadekenWasjibon Maria (SWWM) provided guides, educators, andtranslators, whereas the USA-based Suriname IndigenousHealth Fund (SIHF) provided expertise by a toxicologist, asociologist, and a public health physician.
Indigenous villages in Suriname’s interior region aredependent on their traditional lands for hunting, fishing,farming, medicines, shelter, and their daily necessities suchas clean water [1]. Many of these people have been displacedfrom their lands due to mining concessions [2]. Kawenhakanis an example. Families are relocating from the Surinameside of the Lawa River to the French Guiana side becauseof pollution of their traditional water source by gold miningactivities. Gold mining activities release mercury (Hg) intothe water. Methylation of inorganic Hg released by miningleads to fish contamination, and fish are the primarysource of protein for these communities. Hg toxicity causesirreversible damage to the environment and to the healthof the general population living in the region where miningoccurs.
Since the end of the last century, gold mining inSuriname has been carried out at numerous sites and stillcontinues to be practiced by international mining companiesand smaller groups on terrestrial sites or by dredgingoperations directly in the rivers. In Suriname it is estimated

2 Journal of Environmental and Public Health
that 20,000 kg/year Hg is discarded into the environment bysmall-scale and artisanal gold mining [3, 4]. Other studiesestimate that gold mining releases 9,000–54,000 kgs of Hgin Suriname interior rainforest [5].This amount is ordersof magnitude larger than other sources including Hg frombauxite refining and biomass [6]. Emissions by bauxiterefining were estimated to be 500–600 kg/year in 2002-2003 and below 150 kg/year in 2005 from the “SurinameAluminum Company.” Emissions from biomass burning areestimated to be about 30 kg/year.
A range of health outcomes is expected when com-munities like the Wayana live close to resources valuableto mainstream society. Resource exploitation often affectsindigenous people negatively either through exposure toenvironmental contamination or by restricting their access toforest areas that provide living space, medicinal organisms,food, building materials, and water [7]. The maintenanceof traditional culture is thought to be a protective factor,especially for problems related to nutrition.
Gold mining activities are mainly concentrated within anarea of Eastern and Southeastern Suriname (Figure 1). Thisregion is rich in minerals, including gold. And at the sametime, it is rich in biodiversity and is inhabited by a variety ofindigenous (Amerindian) and tribal (Maroon) communities.The significance of this study, conducted by the communitiesPuleowime (Apetina) and Kawemhakan (Anapayke), is notlimited to the Greenstone Belt Region (GBR) because thedirect impacts of mining go well beyond the geologicalboundaries of the GBR [8]. The impacts of gold mining inSuriname fall into four general categories: physical, chemical,biological, and social. Specific examples of impacts includethe degradation of landscapes and soils, altered hydrogeolog-ical regimes, modification of surface drainage, degradationof drinking water resources, degradation of surface water byincreased turbidity, contamination of land and water by solidand liquid waste and mercury, loss of natural habitats andbiodiversity, loss of rare and endangered species, degradationof fisheries, and finally the degradation of the social integrityand physical health of indigenous communities living in theregion where gold mining occurs. The villages of Puleowime(Apetina) and Kawemhakan (Anapayke) are home to theWayana Tribe, a collective name for several ethnic groupsincluding the Upului, Opagwana, and Kukuiyana [9, 10].
Mercury contamination is of particular importance toindigenous communities in the region. In neighboringFrench Guiana, a mercury risk assessment study was con-ducted in 1994, where hair samples were analyzed for Hg[11]. Results showed high levels of Hg, only in the nativeAmerindian communities living in the upper reaches of theMaroni River. This contamination probably reflects past andcurrent gold mining activities in this area and is linkedto the diet of these populations, of which fish is a maincomponent. This population’s health is a major concern forFrance because the Wayana is an ethnic group that may bevulnerable due to their particular way of life.
In Suriname, numerous risk assessment studies reportingthe effects of Hg pollution on public health have beenperformed. However, few studies have been published. Re-cent studies have shown high levels of Hg in people from
interior communities on the Saramacca River [12]. Hg vaporfrom gold shops in the capital also contributes to exposureof people in their vicinity even if it is difficult to assess[13]. Communities are aware of their exposure to Hg, itslink to gold mining, and the potential for neurologicaltoxicity. However, the majority of individuals remain poorlyinformed about the precise causes, symptoms, and possibleremedies [12].
Suppression of public health research on the impactsof mining and Hg contamination from gold mining bygovernment and non-government organizations is obscur-ing the public health risks and leading to insufficientand misguided regulation. [Americaanse WetenschapperGevlucht uit Suriname: Na bedreiging ATM: Americaansewetenschapper gevlucht uit Suriname (Ameriican ScientistEscaped from Suriname after threat from ATM) De WestNewspaper, Paramaribo, Suriname, 19 July 2005]. Foreignresearchers and in-country collaborators were warned of“dire consequences” if they communicate the effects onpublic and environmental health from Hg contaminationfrom gold mining. The defenders of scientific censorshipclaim that the government has the right to set policy anddeliver its own message in its own words. Under this system,research is highly institutionalized through disciplines andfields of knowledge. Research is also an integral part ofpolitical structures: funding agencies, universities, devel-opment programs, and policies. Research is regarded asbeing the domain of experts who have advanced educationalqualifications and have access to highly specialized language,skills and resources [14].
While it is reasonable to require that scientists defenddata and clarify statements, it is essential that researchconducted at the intersection of race and economic classavoid the biases caused by Western systems for organizing,classifying, and storing new information, and for theorizingthe meanings of such discoveries [14]. Indigenous com-munities are now calling for an end to “the ambulanceat the bottom of the cliff approach to health” and arecalling for support for projects using culturally appropriate,community-directed prevention and intervention strategies[2, 14]. This form of research is a pragmatic integration ofboth scientific and traditional knowledge systems. Westernscience focuses on hypothesis testing by data collectionand statistical analysis. Indigenous traditional knowledge isbased on cumulative experience, close observation, and oralknowledge communicated by elders and handed down overgenerations. This study worked with Wayana communityleadership to create a collaborative environmental healthresearch project.
Wayana village leaders and participating villagers fromPuleowime (Apetina) and Kawemhakan (Anapayke) in Suri-name SE Lawa region (Figure 1) consistently prioritizedthree concerns facing their communities: (1) encroachmentof their traditional homeland by miners who are heavilyarmed and prevent villagers from hunting, fishing, andproviding for their families; (2) the effects of water andfood chain contaminants from mining, especially nervoussystem damage from mercury (Hg) on their health; (3)clean water for drinking, cooking, and bathing is now scarce

Journal of Environmental and Public Health 3
∗Paramaribo
FrenchGuiana
(Fr.)Guyana
Brazil
Suriname
Puleowime(Apetina)
Tapan
ahoni Rive
r
Law
aR
iver
Kawemhakan(Anapayke)
North Atlantic Ocean
Figure 1: Map of Suriname showing location of communities that led the community-directed mercury risk assessment study.
due to contamination from mining. (Testimony collected byauthors during visit to Apetina 2008).
This study focused on item 2 and had one objective:Employ Participatory Action Research methods [15], partic-ipatory research methods [16], and the methods describedby Smith [14] to conduct community-directed research sothat two indigenous communities, Puleowime (Apetina)and Kawemhakan (Anapayke), with assistance from twocharitable nonprofit organizations, could determine forthemselves whether they were at risk from exposure to Hgcontamination.
2. Methods and Materials
2.1. Community-Led Research. In 2008, community mem-bers in Puleowime (Apetina) pointed to the frequencywith which they have been overstudied and note thatresearch conducted by the World Wildlife Fund in 2004 wasdone with little concern for community needs. [Personalcommunication from Leon Eric Wijngaarde, Director ofStichting Wadeken Wasjibon Maria and Sita Tempico, boardmember from Kawemhakan (Anapayke), 2008. (StichtingWadeken Wasjibon Maria is a self-organized nonprofitfoundation comprised of native Amerindian representa-tives from various communities in Suriname)]. In 2008,Stichting Wadeken Wasjibon Maria (SWWM) acquired thedata from the 2004 study then met with village leadersto discuss community rights in research, data ownershipand to interpret study results in terms of the healthimpacts of contaminant exposure. SWWM, a public healthand indigenous advocacy non-governmental organizationin Suriname, was then invited to meet with representatives
from Kawemhakan (Anapayke) to discuss community needs.Leaders from both communities concluded that they wantedto determine for themselves whether they were at riskfrom exposure to Hg contamination and assess potentialhealth impacts from Hg exposure, especially in children.Because community leaders had previously been criticizedfor releasing data to the press, they determined they wantedfindings to be published in an “international peer-reviewedjournal” that would be acknowledged as legitimate bydomestic and foreign government health care agencies.Stichting Wadeken Wasjibon Maria (SWWM) requested theassistance of the Suriname Indigenous Health Fund (SIHF),a nonprofit non-governmental organization based in theUnited States, to provide technical expertise throughoutthe research process. A toxicologist, a sociologist, andpublic health physician represented SIHF on the researchteam.
The approach used was a combination of Participa-tory Action Research methods [15], participatory researchmethods [16], and the methods described by Smith [14].These approaches drew on a Freirean approach that is acollaborative and collegiate process [17]. The elements of thecommunity-led research process are as follows: (1) outsidescience experts were issued an invitation by communitymembers to participate in a codirected study; (2) communitymembers codeveloped a research plan according to appropri-ate scientific procedures and traditional cultural norms; (3)data was collected by trained community members; (4) datawas owned and interpreted by community members; (5) thefinal determination for the disposition of research results wasdetermined by community members according to traditionaldecision-making processes.

4 Journal of Environmental and Public Health
Stichting Wadeken Wasjibon Maria, with support fromthe Suriname Indigenous Health Fund, held group discus-sions in Puleowime (Apetina) and Kawemhakan (Anapayke)to define roles and responsibilities and identify issues criticalto establishing an effective, cooperative partnership betweenthe scientists, health professionals, and the community. Allmeetings were held in the Wayana language.
2.2. Analysis of Hg Levels in Human Hair. Leaders fromPuleowime (Apetina) and Kawemhakan (Anapayke) choseto collect hair samples for analysis (as opposed to bloodor urine) because it is the least invasive sample to col-lect and the best indicator of dietary exposure to Hgfrom fish. Community members received training fromSWWM educators and collected hair samples for analy-sis using methods designed to maximize sample qualityand consistency and minimize cross-contamination, whichemphasized the use of powderless surgical gloves and new,sterile, stainless steel scissors for each sample collected.Community members, with the assistance of representativesfrom the SWWM, collected and submitted hair samplesfor Hg analysis from 158 people in Puleowime (Apetina)and 106 people in Kawemhakan (Anapayke). Ages rangedfrom less than one-year to over 80 years old in bothcommunities. In Puleowime, participants was more female(92) than male (67). In Kawemhakan, the number of malesand females were almost the same (54 and 52, resp.).All hair samples were collected from the lower occipitalregion. When long hair strands (>3 cm) were collected, thehair tips were discarded and only the proximal 1 cm wereused.
Each hair sample, of approximately 20 mg, was placedin a labeled envelope. The hair samples were analyzed intriplicate for total Hg by a SIHF technician educated inanalytical chemistry and trained in the operation of theLumex Hg analyzer. Hg analysis was by the cold-vaportechnique using the Portable Zeeman Lumex (RA915+/RP-91C) mercury analyzer. The instrument detection level was0.2 ng/g. All concentrations were expressed in parts permillion (equal to µg/g Hg). Measurement of Hg levels inhair using the Lumex RA915+/RP-91C portable analyzerhad been previously confirmed by laboratory analysis usinga modified National Institute for Occupational Safety andHealth (NIOSH) 6009 method. In this study, the Lumex wasoperated in software “On Stream” mode using the procedurein the manufacturer’s operation manual. NIST traceablestandards 2709 for Hg at 1400 ng/g and 1633d for Hg at141 ng/g were used to standardize the analyzer before andafter each ten samples analyzed.
SWWM and SIHF consulted with the communitiesthroughout the process. Following the analysis of all hairsamples, meetings were held to discuss the results andanswer any questions the community had regarding the data.Afterwards, a community meeting was held to reflect onthe process, outcome, and future needs. A physician wasin attendance to answer questions from the community.The attending physician performed limited examinations onpersons who requested a consultation because they thoughtthey had been exposed to potentially hazardous levels of
mercury. The purpose of this examination was to addresstheir concerns, alleviate anxiety, determine whether theirconcerns had merit, and provide a baseline for future healthmonitoring. The examination by the physician includeda discussion regarding the patients medical history, withemphasis on the nervous system (target organ for chronicexposure), the kidneys (target organ for acute and chronicexposure), the oral cavity (target organ for chronic expo-sure), the lungs (target organ for acute exposure), the eyes(affected by chronic exposure), and the skin (since mercuryis a known skin sensitizer). Early signs and symptoms ofmercury intoxication were elicited by employing finger-to-nose testing, rapid alternating hand movements, anddiminished two-point discrimination tests.
The guidelines used to interpret the significance of anindividual’s results were the following.
(1) If a person’s laboratory results were less than 1 µg/g,they were told that the Hg level in their hair wasbelow the recommended upper limit. The UnitedStates Environmental Protection Agency (EPA) [18]recommends that safe levels of Hg found in hair arebelow 1 µg/g.
(2) If a person’s laboratory results were between 1 µg/gand 11 µg/g, they were advised that their Hg levelwas above the recommended limit. They were alsotold that they could be at elevated risk if they werepregnant, planning to become pregnant, or nursinga baby. They were advised to seek the advice of amedical professional if they had any health concerns.
(3) If a person’s laboratory results were greater than11 µg/g, they were told that their Hg level was abovethe benchmark dose set by the EPA. They were alsotold that they could be at elevated risk if they werepregnant, planning to become pregnant, or nursinga baby. They were advised to seek the advice of amedical professional.
Regardless of the other languages understood by the peo-ple in (Apetina) and (Anapayke), that is, Dutch and SrananTongo, they assert that they are only able to fully understandpublic health information when the material is translatedinto their native Wayana language. As a consequence of thisobservation, the communities are currently working withStichting Wadeken Wasjibon Maria, with support from theSuriname Indigenous Health Fund, to develop more detailededucation programs that explain the importance of theguidelines for pregnant women and children in the Wayanalanguage.
2.3. Data Analysis. In this study, hair mercury results weresummarized using simple descriptive statistics includingarithmetic mean, median, standard deviation, and range.The mean hair concentrations were evaluated by population,age and gender using the two-tailed t-test assuming equalvariances (P < 0.05). Geometric mean and standarddeviation were used for the analysis of exponential datarelated to risk.

Journal of Environmental and Public Health 5
Table 1: Total hair mercury (Hg) concentrations (µg/g) and risk by population (community) and subgroup (age and gender) amongresidents of Puleowime (Apetina) and Kawemhakan (Anapayke).
Community/age group Average age No.Geometric mean Hair
hg (µg/g) ± SDMedian hair
Hg (µg/g)Hazard quotient
(HQ)Range hairHg (µg/g)
Geometric mean ofindividual risk
Puleowime (Apetina) 24 158 14 ± 6 14 6.0 3–34 0.23
≤5 years 3 23 17 ± 7 20 7.0 5–28 0.25
Male 2 9 20 ± 6 23 9.0 7–28 0.45
Female 16 14 15 ± 7 16 6.0 5–26 0.18
6–14 years 9 53 14 ± 5 14 6.0 6–34 0.26
Male 9 27 16 ± 6 15 7.0 8–34 0.42
Female 10 26 13 ± 5 14 6.0 6–25 0.15
15–25 years 20 19 14 ± 7 14 6.0 6–32 0.16
Male 22 5 13 ± 5 14 6.0 6–18 0.20
Female 19 14 14 ± 8 13 6.0 8–32 0.15
26–45 years 35 35 15 ± 7 14 6.0 6–33 0.22
Male 35 13 15 ± 8 13 6.0 7–33 0.27
Female 34 22 14 ± 7 15 6.0 6–30 0.20
>45 years 59 28 13 ± 6 13 6.0 3–29 0.22
Male 58 13 11 ± 6 13 5.0 3–29 0.22
Female 62 15 14 ± 5 14 6.0 7–27 0.21
Population risk 93
Kawemhakan (Anapayke) 28 106 9 ± 4 9 4.0 2–19 0.01
≤5 years 3 17 9 ± 4 10 4.0 2–18 0.02
Male 3 9 8 ± 3 10 4.0 2–14 0.01
Female 3 8 10 ± 4 9 4.0 6–18 0.02
6–14 years 9 27 5 ± 2 6 2.0 2–9 0.00
Male 9 13 6 ± 2 5 3.0 3–9 0.00
Female 9 14 5 ± 2 6 2.0 2–8 0.00
15–25 years 22 8 8 ± 3 8 4.0 4–16 0.01
Male 22 6 8 ± 4 9 4.0 4–16 0.00
Female 22 2 9 ± 1 9 4.0 9-10 0.01
26–45 years 35 28 8 ± 4 8 4.0 4–18 0.01
Male 36 17 9 ± 4 9 4.0 4–18 0.03
Female 34 11 7 ± 2 7 3.0 4–11 0.00
>45 years 59 26 10 ± 4 10 4.0 5–19 0.02
Male 61 9 11 ± 4 13 5.0 5–18 0.07
Female 59 17 9 ± 4 8 4.0 6–19 0.01
Population risk 18
In this report, the concept of a benchmark dose (BMD)is used to calculate risk. The BMD is the estimated dosecorresponding to a specified incremental risk over and abovebackground. Individual risk, defined here as the probabilityof having a 5% chance of exhibiting an adverse neurologicaleffect, was based on the most conservative of the three doseresponse functions (DRFs) reported by Sullivan et al. [19] inwhich risk is correlated to the biomarker of Hg concentrationin hair as a function of the amount of Hg consumed throughfish. According to Sullivan, the probability of having a5% chance of exhibiting an adverse neurological effect wasestimated to be 0 for hair at 0–3 ppm Hg, 1 × 10⁻⁴ for hairat 4 ppm, 1 × 10⁻³ for hair at 5-6 ppm, 2 × 10⁻³ for hair at
7 ppm, 3× 10⁻³ for hair at 8 ppm, 5× 10⁻³ for hair at 9 ppm,1 × 10−2 for hair at 10 ppm, 1 × 10⁻¹ for hair at 11 ppm, 4× 10⁻¹ for hair at 12 ppm, 6 × 10⁻¹ for hair at 13 ppm, and9 × 10−1 for hair over 13 ppm. Population risk was obtainedthrough the summation of risk for all individuals [19, 20].Risk assessors use the term “population risk” to mean thenumber of people in the community that are affected. Bycontrast, “individual risk” is the incremental probability thatthe hazard will impose an effect on some particular person[21].
2.4. Hazard Quotient. Exposure can be expressed as a non-carcinogenic risk expressed in terms of the hazard quotient

6 Journal of Environmental and Public Health
Table 2: Summary of t-test statistics supporting analysis of hair mercury concentrations in residents from Puleowime (Apetina) andKawemhakan (Anapayke).
Data category Mean df P
CommunityApetina 16
Anapayke 9 262 7.80E−20
Gender
Apetina-Female 15
Apetina-Male 16 158 0.19
Anapayke-Female 8
Anapayke-Male 9 105 0.21
Age
Apetina-≤5 years 18
Apetina->5 years 16 56 0.27
Anapayke-≤5 years 10
Anapayke->5 years 9 105 0.26
(HQ) [19]. The ratio of the exposure value (dietary intake,µg/kg/day) to the risk value (RfD) provides an estimateof risk. In 2004 the Joint FAO/WHO Expert Committeeon Food Additives (JECFA) established a tolerable intakeof 1.6 µg/kg bodyweight per week (0.23 µg/kg bw/d) formercury in order to protect the developing fetus fromneurotoxic effects [22].
The mean conversion factor from consumption (µg/kg/d) to hair Hg (µg/g) was assumed to be 10 [23–25]. Ifthe quotient is one or more then an adverse effect is likelyto occur. Reference levels are indicators of the potential foradverse effects when consistently exceeded. When the hazardquotient is less than one, the mercury exposure could beregarded as unlikely to lead to adverse health effects.
As exposures increase above the reference level, either bymagnitude or by time, the likelihood of adverse effects alsoincreases. Generally, if the hazard quotient is greater than 1,more evaluation is warranted to determine the degree andfrequency of exposures above the reference level. Althoughthe quotient method is commonly employed, it is the leastprobabilistic of the methods used and is highly dependenton professional judgment.
2.5. Professional Judgment and Indigenous Wayana Judgment.Risk assessments are based on scientific data that arefrequently difficult to interpret and complex, conflictingor ambiguous, and incomplete. Analysis of this data forrisk assessment purposes depends, therefore, on professionaljudgment based on scientific expertise. The analysis ofthis data for risk assessment purposes also depended onindigenous Wayana judgment because the communitiesperforming the risk assessment are embedded in a social,political, and economic context that shapes the behaviorsof the stakeholders that are involved, and determines thecommunity access to resources that are necessary to main-tain health. Together, outside advisors and Wayana leadersdesigned the risk assessment plan, evaluated methods to beused, and interpreted the significance of exposure data andthe observed effects.
Participatory research differs from conventional researchin the alignment of power within the research process [17].
Methodologically, outside experts became learners, facilita-tors, and catalysts in a process that gathered momentum asthe community came together to analyze and discuss theresearch process and the results it yielded. The process wascharacterized by a cycle of dialogue, reflection, and action.This method relied less on the methodological frameworkthan it did on the relationship between the researchers andthe community. The program was managed in a mannerthat ensured that all partners’ interests and aspirationswere considered, and activities were implemented only withagreement from all partners involved. The relationshipfollowed here was described by Biggs [26] who describedthis mode of community participation as collegiate whereresearchers and local people work together as colleagues withdifferent skills to offer, in a process of mutual learning wherelocal people have control over the process.
2.6. Human Subjects Review. The SIHF research team con-sulted with the human subjects review staff at the Universityof Washington who approved the project plan on 18 June2007 and again on 30 December 2010 to review plans topublish this paper. The Institutional Review Board stafffound that the research design did not require full IRB reviewsince the traditional roles of researcher and research subjectdo not apply. Since research subjects were co-investigatorsleading the research process while the western researchteam acted as consulting technicians, informed consent wasdeemed unnecessary.
3. Results
The estimated risk of adverse neurological effects at mea-sured levels of Hg in hair are given in Table 1. In bothcommunities, 58% of the people who submitted hair sampleshad Hg levels above the World Health Organization [27,28] safety limit (10 µg/g). The mean hair Hg concentrationin Puleowime (GM = 14) was significantly higher (P <0.05, df 262) than the hair Hg levels in Kawemhakan (GM= 8). Although mean hair concentrations varied from 11± 6 to 20 ± 6 µg/g, the differences were not significantat the 95% confidence level (Table 2). The population

Journal of Environmental and Public Health 7
risk for Puleowime was 93 and for Kawemhakan was 18,which reflects the number of people in each communityexpected to be affected by exposure to excess levels ofmercury.
Facilitators from SWWM also noted information relatedto fish consumption patterns and self-reported symptoms.In Puleowime, all participants reported eating fish at least 3times per day every day whereas, in Kawemhakan, more than25% of the participants reported consuming fish less fre-quently. Residents in Puleowime (Apetina) and Kawemhakan(Anapayke) reported that the two most common varieties offish eaten in their communities were anumara (Hoplias spp.)and tucunare (Cichla sp.).
Among participants in Puleowime, 12% reported feelingnumbness in arms, fingers, or toes. In Kawemhakan, thatnumber was higher at 36%. Three women with hair mercurylevels between 25 and 30 ug Hg/g requested a healthassessment. All complained of headaches and pain andtingling in their hands and feet. The attending physician,D. J. Roesel, Clinical Assistant Professor, General InternalMedicine and Adjunct Clinical Assistant Professor, GlobalHealth at the University of Washington, noted that threewomen who presented themselves to him with concernsthat they were affected by exposure to mercury exhibitedabnormal neurological testing, with poor performance onfinger-to-nose testing, rapid alternating hand movements,and diminished two-point discrimination. In both Puleow-ime and Kawemhakan, over one-third of the participantscomplained of either headaches or strong feelings of sadnessor depression at least once weekly.
4. Discussion
This study was successful in reaching its primary objective.Two Wayana communities in southeast Suriname success-fully completed a project in which they measured for them-selves their risk of exposure to mercury (Hg) contaminationusing a model of community-led research.
Mercury exposure in the Wayana villages of Puleowime(Apetina) and Kawemhakan (Anapayke) appears to mirrorthe problems documented elsewhere in the region. In twoWayana villages in French Guyana, 58% and 57% of thepeople had Hg levels above the World Health Organization(WHO) safety limit (10 µg/g), respectively [27, 28]. Freryet al. [11] measured hair Hg concentrations in 235 samplesfrom people in four villages along the upper Maroni Riverin French Guiana where the average concentration was 11± 4 µg/g (mean ± SD). This value corresponds to theexposure levels in Kawemhakan where the average hair Hgconcentration was 8 ± 4 µg/g. In Puleowime, however, theaverage hair Hg concentration was significantly higher at 14± 6 µg/g (P < 0.05).
Frery et al. [11] conducted a detailed familial dietarystudy associated with Hg measurements in fish and somegame. The Frery study was conducted over 7 days in twodifferent seasons in the four most populated Wayana villageson the upper part of the Maroni River. The results confirmmercury exposure of the Wayana population related to a diet
rich in fish, which are highly contaminated for certain species(up to 1.62 mg/kg fresh weight or 8.1 mg/kg dry weightin skeletal muscle). Frery showed that Hg concentrationsin fish muscle were closely linked to the feeding regimeand position of fish in the food webs. Overall, 14.5% ofthe fish collected exceeded the 0.5 mg/kg (fresh weight)safety limit. Four carnivorous species accounted for no lessthan 72% of the metal ingested by the Wayana families,although these represented only 28% of the consumed fishbiomass. The species were Pseudoplatystoma fasciatum (27%of the Hg dietary intake), Hoplias aimara (27%), Ageneiosusbrevifilis (11%), and Serrasalmus rhombeus (6.5%). Cynodonmeionactis, which along with P. fasciatum has the highestHg concentrations, was hardly eaten at all (especially bychildren) because these fish contain a large number of bones.The two species that are consumed in the greatest amounts,Myleus rhomboidalis/tometes (12.7%) and Doras micropeus(11.2%), are not contaminated to a very high degree (100and 1,160 (micro) g/g, dw, resp.). The Frery study revealedexcessive exposure to mercury in the Wayana population wasrelated to the consumption of contaminated fish.
While several studies have shown that Hg levels in hairare higher in residents of areas contaminated by mercurythan in residents of uncontaminated regions, others showwide variations depending on the relative importance offish in the diet [5]. In Puleowime, the community fillsmore of its dietary needs by fishing than Kawemhakanwhere the residents are more acculturated and have a morediversified diet. In both cases, subsistence fishers consumelarge amounts of fish and represent high exposure cases thatform the tail of the distribution of the general population.The Wayana live in isolated villages on the Tapanahoni River(Apetina) and the Lawa River (Anapayke) and are consideredexcellent examples of members of a “fishing civilization.”Recent investigations by Frery et al. [11] show that mostsubjects take more than 14 fish meals per week. The actualexposure, therefore, among these populations will be highlyvariable, location specific, and they will depend on local fishHg levels and individual fish consumption patterns.
In both Puleowime and Kawemhakan the risk of havingan adverse effect is quite large (population risk 93 and 18resp.). In general, a lifetime risk of one-in-ten-thousandand in some instances one-in-one million has become acommon place standard in public health discourse andpolicy. The risks for subsistence fishers in Puleowime andKawemhakan are orders of magnitude greater than the riskthat is acceptable in mainstream society.
Another way to consider risk is by comparing theestimated oral exposure dose (µg/kg/d) to an oral refer-ence level to calculate the hazard quotient (HQ) [23–25].For Puleowime, the dietary exposure rate was 1.4 µg/kg/dand for Kawemhakan, 0.9 µg/kg/d. The FAO/WHO ExpertCommittee on Food Additives (JECFA) reference level fordietary exposure to Hg is 2.3 µg/kg/d [22]. Both yield hazardquotients greater than 1 as did the individual exposure dosesbased on measured hair Hg concentrations (Table 1). Ofthese, approximately 15% were children under the age of5 and 34% were women of childbearing age. These peopleare especially susceptible to mercury exposure because of the

8 Journal of Environmental and Public Health
sensitivity of the developing nervous system in the fetus andin children.
From the point of view of the physician who was inattendance, there are many potentially confounding factorsthat are affecting community health. As a global and publichealth professional, the research team physician struggledwith the idea that, although there are compelling instances ofhigh levels of mercury exposure, there was no “smoking gun”in terms of clearly caused, well-documented health impactsfrom mercury exposure. The health impacts observed canalso be related to social decay, loss of hunting grounds andland rights, and the threat of extinction of these indigenouscommunities and their way of life. Consequently, whenconsidering the impacts of contamination from mining itis important to consider the broadest definition of “health”possible [23, 24]. This approach argues in favor of long-term community partnerships over short-term public healthcampaigns that are iterative in nature and open to thepossibility of collaboration with other disciplines that canaddress a broader range of social and legal considerations.
5. Wayana Community Review of Report
Research data on the exposure of Wayana people to mercuryhas been reported since before 1994 [7]. Since then, researchand outreach has been conducted by government and non-government organizations including a study conducted in2004 by the World Wildlife Fund. As late as 2007, the resultsof this research had not been published nor returned to theWayana communities.
There were two ways in which the community-ledapproach to research was different from research performedpreviously among the Wayana. The first was that theWayana communities were equal partners with Western-trained experts. The community-led approach involved acollaboration of “formally trained research” partners fromthe fields of environmental toxicology, sociology, and publichealth as well as indigenous advocates and communityleaders. As the experts in their environmental and culturalcontext, community leaders were able to identify the researchquestion, select a feasible and culturally appropriate researchstrategy, interpret data findings within their own socialstructure, and identify next steps within traditional decisionmaking mechanisms. Second, instead of creating knowledgefor knowledge’s sake or instead of performing research forthe advancement of the field of risk assessment or toxicology,the community-led approach was an iterative process thatincorporated research, reflection, and action in a cyclicalprocess for the benefit of the communities at risk.
According to Aptuk Noewahe, the Wayana Granman(leader) from Puleowime (Apetina), past research wasconducted by scientists who, “came often, said big things,made promises, then left.” He said that if scientists wantto help, then they should “include the community, listenand help. Otherwise, they should just go away”. As Cornwalland Jewkes [17] argue “participatory research consists less ofmodes of research which merely involve participation in datacollection than of those which address issues of the setting ofagendas, ownership of results, power and control.”
After the risk assessment analyses were complete, theresults were discussed with the community. The communi-ties asked Suriname Indigenous Health Fund and StichtingWasjibon Wadeken Maria to help write this report commu-nicating results of the community-directed risk assessment.The report was drafted in English, translated into theirnative language (Wayana), and reviewed. Regardless of theother languages understood by the people in Puleowimeand Kawemhakan they were only able to fully understandthe details of this complex problem when the reportwas translated into their native language for their review,comment, and approval. As a consequence of this process,the communities now want to repeat the education programspresented previously by government and NGOs, this time intheir Wayana language.
Noewahe added that, “We support the article and theresearch because we led the process as partners in the project,and we are involved. Usually people do not discuss theirwork with us, not even the results of their work. This articleis important because our problem needs to be known byothers. Also, we look forward to continuing this project andwe hope that together we can work towards a sustainablesolution to our problem together with the government andother health organizations.”
Community elders agreed that, “this was a good project,because it means our children could have a good future.”However, there were a lot of other comments that weredetailed in nature and reflected the complexity of the prob-lem. The first was language. As a consequence of engagingthe community in the conduct of this risk assessment projectand discussing the data and drafts of this manuscript inthe community’s native Wayana language, one participantnoted that, “Now we understand the problem and want torepeat the education programs presented previously by thegovernment and NGOs, this time in our Wayana language.”Residents challenged suggestions made by Westerners thatcommunities impacted by mercury (Hg) contaminationmust eat small, young fish from the lowest possible trophiclevel; residents noted they do not often have a choice. “Weeat what the river gives us. We tried eating only the fish wewere told to eat but could not catch enough and after 3 or4 months we had to quit trying.” Instead, communities wantto focus on integration, education, land rights, human rights,and the root causes leading to a wider range of problems thatincludes risk from exposure to mercury.
Community leaders identified three major priorities forfurther investigation. First, the Wayana communities ofPuleowime (Apetina) and Kawemhakan (Anapayke) pri-oritized the assessment of potential health impacts fromHg exposure. Health assessments must be conducted forall community residents, beginning with the most sus-ceptible subpopulations. Second, further risk assessmentsto evaluate the degree and frequency of exposures abovethe reference level must be conducted since residents ofthese communities consume larger amounts of fish thanmainstream communities. Third, the major concerns facingthe communities voiced throughout the research process thatwere not addressed in this study must be addressed. Theseinclude the encroachment of their traditional homeland by

Journal of Environmental and Public Health 9
miners who are heavily armed and prevent villagers fromhunting, fishing, and providing for their families; and thescarcity of clean water for drinking, cooking, and bathing dueto contamination from mining.
On its own, a risk assessment study can serve as anexample of reductionism and illustrates the approach thatforms the basis for modern science. In many cases, agood understanding of the components of a system willlead to a good understanding of the system as a whole.However, within the context of an indigenous societywhere the relationship between the environment and humanpopulation is complex and multilayered, emergent propertiesof the system are impossible to predict from knowledgeof discrete parts, and a holistic rather than a reductionistapproach is necessary. The community-led research processprovides a method for bridging the disciplines withinscientific paradigms with traditional indigenous paradigms.The Wayana have a cosmology, which is distinct fromthe Western Reductionist approach to science. It integratessociety, nature, and health and has more in common withWestern Complexity theory, systems thinking and a holisticparadigm. By allowing community members to take alead role in the research process, community-led researchfacilitates the exchange of information and shared decision-making that provides access to public health information forboth at-risk communities and researchers.
6. Conclusion
In this study the Wayana communities of Puleowime(Apetina) and Kawemhakan (Anapayke) in Suriname iden-tified for themselves that they were at a high lifetime riskof adverse effects from exposure to mercury. Exposure washigher in Puleowime (Apetina) compared to Kawemhakan(Anapayke) where differences in the relative importance offish in the diet may be responsible. Risk estimates suggestthat all participants in the study exceeded the one-in-ten-thousand policy common in mainstream society.
The community-led research process allowed commu-nity leaders to identify the research question most mean-ingful to them, select a feasible and culturally appropriateresearch strategy with the assistance of trained experts,collect data from participants within their communitythemselves, interpret data findings within their own socialstructure, and identify next steps within traditional decisionmaking mechanisms.
The community-directed approach increases the visibil-ity of researcher and the transparency of their intentions,which are significantly greater than in conventional research.In practice, community-directed research was not a simpleralternative to a conventional research project and workingin collaboration with local people is far from easy. Contraryto expectations, control over research does not devolvecompletely onto the community, nor do communities wantto assume complete control.
Acknowledgments
This paper was prepared by the authors at the request ofAptuk Noewahe, the granman from Puleowime (Apetina)
and Amaipoti, granman from Kawemhakan (Anapayke).Drafts were translated by Leon Eric Wijngaarde, Sita Tem-pico, and Eveline Monsanto, all from Stichting WasjibonWadeken Maria, and reviewed with community memberswho contributed comments and approved the final draft.Financial support for this project was provided throughan International Engagement Award from Wellcome Trust(089659/Z/09/Z).
References
[1] D. Peplow and S. Augustine, “Suriname,” in The IndigenousWorld, S Stidsen, Ed., pp. 118–124, 2008.
[2] D. Peplow, “Mercury, small-scale mining, and public healthin Suriname,” SETAC Globe—Learned Discourses, vol. 6, no. 1,pp. 32–33, 2005.
[3] J. H. Mol, J. S. Ramlal, C. Lietar, and M. Verloo, “Mercurycontamination in freshwater, estuarine, and marine fishesin relation to small-scale gold mining in Suriname, SouthAmerica,” Environmental Research, vol. 86, no. 2, pp. 183–197,2001.
[4] J. E. Gray, V. F. Labson, J. N. Weaver, and D. P. Krabbenhoft,“Mercury and methylmercury contamination related to arti-sanal gold mining, Suriname,” Geophysical Research Letters,vol. 29, no. 23, p. 2014, 2002.
[5] Suralco, “Sustainability report,” 2003, http://www.bnl.gov/des/ertd/TechDevelApp/files/pdf/71538-Potential-Health-Risk-Reduction-Arising-From-Reduced-Hg-Emissions.pdf.
[6] SuriMerc, “Final report, strengthening Surinamese involve-ment in activities related to mercury pollution in Suriname,submitted to the United Nations Environment Programme(UNEP),” 2008, http://www.chem.unep.ch/mercury/partner-ships/Documents Partnerships/080114 final%20report suri-merc.pdf.
[7] R. A. Montenegro and C. Stephens, “Indigenous health inLatin America and the Caribbean,” Lancet, vol. 367, no. 9525,pp. 1859–1869, 2006.
[8] PlantProp, Greenstone Belt Gold Mining Regional Environmen-tal Assessment, Ministry of Labour, Technological Develop-ment and Environment, Paramaribo, Suriname, 2003.
[9] K. Boven, Overlaven in en Grengsebied: VeranderingsprocessenBij de Wayana in Suriname en Frans-Guyana, IBS Publishers,Amsterdam, the Netherlands, 2006.
[10] K. Hough, The expression and perception of space in Wayana,M.S. thesis, Sidestone Press, Amsterdam, The Netherlands,2008.
[11] N. Frery, R. Maury-Brachet, E. Maillot, M. Deheeger, B. DeMerona, and A. Boudou, “Gold-mining activities and mercurycontamination of native Amerindian communities in FrenchGuiana: key role of fish in dietary uptake,” EnvironmentalHealth Perspectives, vol. 109, no. 5, pp. 449–456, 2001.
[12] D. Peplow and S. Augustine, “Community-directed risk assess-ment of mercury exposure from gold mining in Suriname,”Pan American Journal of Public Health, vol. 22, no. 3, pp. 202–210, 2007.
[13] D. Peplow and S. Augustine, “Gaseous elemental mercury(GEM) in the atmosphere close to gold shops in Paramaribo,Suriname,” Health, Safety and Environment Quarterly, vol. 4,pp. 23–27, 2009.
[14] L. T. Smith, Decolonizing Methodologies, 1991.[15] M. A. Rahman and O. Fals-Borda, “A self-review of PAR,” in
Action and Knowledge: Breaking the Monoply with ParticipatoryAction Research, Intermediate Technology Publications, 1991.

10 Journal of Environmental and Public Health
[16] T. B. Grandstaff and S. W. Grandstaff, “A conceptual basisfor methodological development in rapid rural appraisal,” inProceedings of the 1985 International Conference on Rapid RuralAppraisal, KKU, Ed., pp. 69–88, Rural Systems Research andFarming Systems Research Projects, Khon Kaen University,Khon Kaen, Thailand, 1987.
[17] A. Cornwall and R. Jewkes, “What is participatory research?”Social Science and Medicine, vol. 41, no. 12, pp. 1667–1676,1995.
[18] EPA, “Office of air quality planning and standards and office ofresearch and development. Mercury study report to Congress,”US Environmental Protection Agency, 1997.
[19] T. M. Sullivan, F. W. Lipfert, S. C. Morris, and Moskowitz,“Potential health risk reduction arising from reduced mercuryemissions from coal-fired power plants,” Brookhaven ScienceAssociates, LLC for the United States Department of Energyunder Contract no. DE-AC02-98CH10886, 2001.
[20] EPA, “Guidelines for exposure assessment, risk assessmentforum,” U.S. Environmental Protection Agency EPA/600/Z-92/001, 1992.
[21] M. D. Adler, “Against “individual risk”: a sympathetic critiqueof risk assessment,” University of Pennsylvania Law Review, vol.153, no. 4, pp. 1121–1250, 2005.
[22] JECFA, “Summary and conclusions of the 67th JointFAO/WHO Expert Committee on Food Additives,” WHOTechnical Report Series 940, World Health Organization,International Programme on Chemical Safety, Geneva,Switzerland, 2006, http://www.who.int/ipcs/food/jecfa/sum-maries/summary67.pdf. In press.
[23] WHO, “Guidance for Identifying Populations at Risk fromMercury Exposure,” United Nations Environment Prog-ramme, WHO Department of Food Safety, Zoonoses andFoodborne Diseases, Geneva, Switzerland, 2008, http://www.unep.org/hazardoussubstances/Mercury/MercuryPublica-tions/GuidanceTrainingmaterialToolkits/GuidanceforIdentif-yingPopulationsatRisk/tabid/3616/language/en-US/Default.aspx.
[24] WHO, “Declaration from the website of the World HealthOrganization,” in Proceedings of the International Conferenceon Primary Health Care (Alma-Ata ’78), USSR, September1978.
[25] F. W. Lipfert, “Estimating exposure to methylmercury: effectsof uncertainties,” Water, Air, and Soil Pollution, vol. 97, no. 1-2,pp. 119–145, 1997.
[26] S. Biggs, “Resource-poor farmer participation in research:a synthesis of experiences from nine national agriculturalresearch systems,” OFCOR Comparative Study Paper 3, Inter-natioal Service for National Agricultural Research, the Hague,the Netherlands, 1989.
[27] WHO, Environmental Health Criteria, 101, Methylmercury,World Health Organization, Geneva, Switzerland, 1990.
[28] WHO, “Safety evaluation of certain food additives andcontaminants. International Programme on Chemical Safety,”WHO Food Additive Series 52, World Health Organization,Geneva, Switzerland, 2004, http://whqlibdoc.who.int/publi-cations/2004/924166052X.pdf.

Hindawi Publishing CorporationJournal of Environmental and Public HealthVolume 2012, Article ID 352309, 10 pagesdoi:10.1155/2012/352309
Research Article
Evaluation of Trace Metal Levels in Tissues ofTwo Commercial Fish Species in Kapar and Mersing CoastalWaters, Peninsular Malaysia
Fathi Alhashmi Bashir, Mohammad Shuhaimi-Othman, and A. G. Mazlan
School of Environmental and Natural Resource Sciences, Faculty of Sciences and Technology, National University of Malaysia, Selangor,43600 Bangi, Malaysia
Correspondence should be addressed to Fathi Alhashmi Bashir, [email protected]
Received 16 June 2011; Revised 20 July 2011; Accepted 15 August 2011
Academic Editor: Mohammad Mehdi Amin
Copyright © 2012 Fathi Alhashmi Bashir et al. This is an open access article distributed under the Creative Commons AttributionLicense, which permits unrestricted use, distribution, and reproduction in any medium, provided the original work is properlycited.
This study is focused on evaluating the trace metal levels in water and tissues of two commercial fish species Arius thalassinus andPennahia anea that were collected from Kapar and Mersing coastal waters. The concentrations of Fe, Zn, Al, As, Cd and Pb in thesecoastal waters and muscle, liver and gills tissues of the fishes were quantified. The relationship among the metal concentrationsand the height and weight of the two species were also examined. Generally, the iron has the highest concentrations in both waterand the fish species. However, Cd in both coastal waters showed high levels exceeding the international standards. The metal levelconcentration in the sample fishes are in the descending order livers> gills >muscles. A positive association between the trace metalconcentrations and weight and length of the sample fishes was investigated. Fortunately the level of these metal concentrations infish has not exceeded the permitted level of Malaysian and international standards.
1. Introduction
It is unfortunate that we, human beings without realizing theconsequences of pollution, do a lot of activities that terriblyruin the nature, resulting in the denial of healthy environ-ment to our successors. Water contamination is one of theserious concerns that affect the marine ecosystem with highconcentration of trace level metals. Malaysia is one of thecountries that critically face this issue since 1990. The reasonfor this alarming situation is due to the rapid economicgrowth that the country is experiencing for the past two dec-ades. The contamination of water cannot be taken as pricefor this economic boom.
According to Paquin et al. [1] the coastal or river watersare contaminated by the dumping of industrial wastages. Themetals accumulated in these waters infect the humans bydirect consumption of water or through consuming the af-fected organisms like fishes [2, 3] claim that when the levelof trace metal concentrations exceeds the stipulated level,
it turns out to be toxic. Very recently, the work in [4] hasstated that the higher level of metal concentration will bringshattering effect to the ecological balance by altering therange of organisms in water.
Several researchers, including [5–8], have studied theimportance of fishes and their healthy benefits. They claimthat fishes are the most healthy food with the high sourceof omega 3 fatty acids, that brings a lot of benefits to us,including the reduction of heart-related diseases. Apart fromthis, the fishes are rich source of vitamins, minerals, andproteins. Studies in [9, 10] reveal that 60 to 70% of proteinneeds are fulfilled by the consumption of fishes in Malaysia.But, [11–13] have analysed the other side of high fish con-sumptions. They claim that other than cardiovascular bene-fits, the exceeding level of fish diet brings negative impact tothe human society.
Researches in [14, 15] reveal that iron and zinc are essen-tial for the metabolism of fishes. At the same time, alumini-um, cadmium, arsenic, and lead are added to the food chain

2 Journal of Environmental and Public Health
of these organisms though they do not play any importantrole in the metabolic activities. Whereas [16] ascertain thatwhen we consuming fishes with high accumulation of thesesmetals, over a long period of time, will bring harmful effectsto us. Reilly and Barton [17, 18] added that the continualhigh dosage of Al consumption will result in lung fibrosis,osteomalacia, defective bone mineralization, dialysis demen-tia, and ferric-independent microcytic anaemia. Furtherstudies regarding diseases related to high dose of mineralconsumption can be summarized as follows. High Cd Accu-mulation brings skeletal damage, kidney dysfunction, andreproductive deficiencies [19]; cardiovascular disease, skindisorders, cancer, and neurotoxicity are triggered by arsenicconsumption [20]; Pb, termed as neurotoxins, brings cardio-vascular diseases to adults and reduced mental developmentin children [19, 20].
According to Canli and Atli [21] Fe and Zn are very vitalfor the normal metabolism for the schools of fishes. At thesame time iron is one of the important trace metals thathighly benefits humans. It serves as the oxygen conductorbetween the tissues and lungs. Camara et al. [22] have es-tablished the health benefits of advocated level of mineralconsumption. They claim that deficiency of Zn will causeloss of appetite, growth retardation, skin changes, and immu-nological abnormalities. But Tuzen [23] has stated thatthough Zn has biological significance, excessive consumptionof these kinds of metals will affect the humans. The tracemetal sewage from industries pollutes water and fishes inturn. The consumption of the affected fishes over a pro-longed period will harm the health of humans.
Fortunately previous studies reveal that the trace metalconcentration level in fishes is not that much alarming inSouth East Asian countries. The researchers have examinedmuscles, livers, and gills of fishes as these organs play dif-ferent roles in bioaccumulation process [24]. Hamilton andMehrle [25] say that the concentration level of metals ingills represents the level of metals in water, where theydwell. The concentrations of metals in liver represent theirstorage level. Metallothioneins (MTs) are the metal-bindingproteins accumulated in livers, whereas [26, 27] assert thatmetal accumulation in the muscles of fishes is dangerousas they are the most edible part. They also established that,environmental evaluation in aquaecology shall be conductedin water, organisms, or sediments. Each of these componentsprovides partial image of metal accumulation in the wholeecosystem.
According to Marcovecchio and Moreno [28], studyingthe trace level in organisms reflects the real degree of pol-lution in the related environment. References [29–31] statethat generally fishes are used as the medium for monitoringanthropogenic pollution level in the environment. As fishesare the last level of the food chain, the polluted varietieswill easily pass the metals into the humans when they areconsumed [32–35].
The marine ecosystem of Kapar is selected as it is locatedin the Strait of Malacca which consists of many pollutionsources situated around it. This locality gets infected by agreat variety of pollutants due to the existence of large num-ber of international shipping lanes and the concentration
of agriculture, industrialization, and urbanization activitiesalong the coast of Peninsular Malaysia [36]. Moreover, theStrait of Malacca is one of the most vulnerable areas to con-tamination by oil spills [37]. On the other hand, the Strait ofMalacca is the most important fishing ground in Malaysia,accounting for approximately 70% of total fish landings ofthe country [37].
Apart from the above-mentioned sources of pollution,an electric power station that uses coal and discharges thepolluted, preused water into the surface water systems sur-rounding Kapar, also contribute to the trace metal pollutionof the marine ecosystem in this area. Moreover, Kapar hasgreat importance for the local fishery industry therefore, itis vital to estimate the selected metals in fish of the Kaparcoastal water, to define the current trace metal levels in thefish as well as to monitor the trends of change in fish tracemetal levels with time.
However, evaluation of the levels of the same metals inMersing allows for comparison between the two areas, par-ticularly in terms of the kinds and effects of different pol-lution sources in the two areas. This study is focused onmeasuring the concentration level of selected metals (Al, Fe,Zn, As, Cd, and Pb) in the muscles, livers, and gills of selectedspecies of fishes and the pollution level in the coastal areasin Malaysia. Moreover, the relationships between the tracemetal levels in these tissues and the length and weight offishes were also investigated.
2. Materials and Methods
2.1. Reagents. The reagents with suprapur quality, analyticalgrade Nitric acid (65%), and hydrogen peroxide (30%) wereacquired from Merck (Darmstadt, Germany) along with thestock standard solutions of Al, Fe, Zn, As, Cd, and Pb inconcentrations of 1,000 mg/L. Prior to the experiments theapparatus were sterilised by soaking them overnight in dilut-ed nitric acid (10%) and were later rinsed with deionisedwater. The experiments were conducted using the distilleddeionised water.
2.2. Apparatus. In this study we have used Perkin Elmermodel Elan 9000 inductively coupled plasma mass spectrom-etry (ICP-MS, USA), [40]. After calibrating the instrumentwith standard solutions derived from commercial materials,it was optimized according to the manufacturing standards.Besides these initiations, the cones and tubes were thorough-ly cleaned to get rid of any possible residues. Table 1 showsthe analytical conditions for determining the trace metalsby the inductively coupled plasma mass spectrometry (ICP-MS).
2.3. Study Area. Water and fish sampling were done at twodifferent stations of coastal waters of Peninsular Malaysia inOctober 2009. Stations shown on the map (Figure 1) werechosen in relation to the contamination gradient.
The first station chosen was Kapar (3◦11′54′′ N, 101◦
32′66′′ E) located in Selangor on the west coast of PeninsularMalaysia near the Sultan Salahuddin Abdul Aziz Power Plant

Journal of Environmental and Public Health 3
Malaysia
Kapar
Indonesia
Striate ofMalacca
Singapore
South ChinaSea
N
Johor Bahru
Thailand
Mersing
Figure 1: Locations of the sampling sites.
Table 1: ICP-MS operating conditions and performance.
Performance Operating condition
RF Generator 40 MHz
RF Power 1000 W
Spray Chamber Ryton Scott
Nebulizer Cross-Flow
Plasma gas flow 15.0 L/min
Auxiliary gas flow 1.0 L/min
Nebulizer gas flow 0.60 L/min
Sampler & skimmer cone Nickel
Sweeps/Reading 20
Reading/Replicates 3
station. In terms of pollution, the water quality of Kaparcoast is influenced by various industrial outputs, dischargeddirectly to the sea or by rivers. The second station wasMersing (2◦25′60′′ N, 103◦49′60′′ E) in Johor on the westcoast of Peninsular Malaysia, it is relatively clean when com-pared with Kapar.
2.4. Samples Collection and Samples Preparation
2.4.1. Collection of Water Samples. For research purpose astint of 200 ml of water was collected with the help of 21 cccapacity automated sampler. The sample was collected fromthe surface of the coastal water (depth range < 10 centime-tre). The sample was then filtered using Whatman 0.45 µmmembrane filter paper, and filled in polyethylene bottles(amber coloured). These bottles were pre washed with 1(N) HNO3 and deionised water. Later 3 mL of concentratedHNO3 was added to the collected sample to avoid oxidationand preserved at 4◦C, prior to analysis.
2.4.2. Collection of Fish Samples. Two commercially signif-icant and nutritious fish species, namely, duri (Arius thalassi-nus) and gelama (Pennahia anea), were selected and collectedwith various fishing methods by fishermen (Table 2). Ten
fresh fish specimens of both the species, from each station,were collected from local fishermen. The samples were storedin a cool box (−4◦C) and transported to the laboratory formetal analysis. Total length (cm) and weight (g) of the fishsamples were measured before dissection.
The specimens were dissected with sterilized stainlesssteel equipment. The dissected parts such as muscle, liver,and gills were later dried in an oven at 80◦C until constantweight was obtained. The homogenized samples (muscle,liver, and gills) were digested in triplicate in a microwaveoven digestive system (Start D Microwave Digestive System)with HNO3 (65% Merck) and H2O2 (30% Merck) in Teflonvessels. The residues were filtered through 0.45 µm Whatmanfilter paper (Whatman international Ltd. Cat) and trans-ferred to a 50 mL volumetric flask and diluted to level withdeionised water in the case of muscle and gills. However, inthe case of liver tissues, the final dilution volume was 25 mLrather than 50 mL [41].
Analytical blanks were run in the same way as the sam-ples and determined using standard solutions, prepared inthe same acid matrix. All chemical materials and standardsolutions used in this study were obtained from Merck andwere of analytical grade.
2.5. Analysis of Metals. As discussed earlier in Section 2.2,the concentrations of iron (Fe), zinc (Zn), aluminium (Al),arsenic (As), cadmium (Cd), and lead (Pb), in water and twospecies of fish, were examined using the inductively coupledplasma mass spectrometry. The analytical findings werearticulated in terms of micrograms of metal in every gram offish on dry weight basis (µg/g dry weight). The performanceassessment of this method was done by examining a standardreference material of marine biota sample (SRM2976, freeze-dried mussel tissue, National Institute of Standards and Tech-nology, USA).
2.6. Statistical Analysis. Due to the lack of normal distribu-tion of data, the log transformation was implemented for thenormalization process. To examine the vital differences inthe concentrations of heavy metals in the two research sites,

4 Journal of Environmental and Public Health
Table 2: The fish samples and the average length and weight of the species examined in present study.
Species Samples number Family Common name Habitat Total weight (g) Total length (cm)
A. thalassinus 10 Ariidae Sea catfish Demersal 300–500 31–36
P. anea 10 Sciaenidae Big eye Croaker Demersal 112–130 21–25
Table 3: Observed and certified(1) values of elemental metal con-centrations (µg/g dry weight).
ElementCertified
valueMeasured
valueSRD%
Recovery(%)
Al 134 ± 34 128.23 0.2 96
Fe 158 ± 8 144.64 1 92
Zn 137 ± 13 115.20 1.1 84
As 13.3 ± 1.8 14.452 2.5 109
Cd 0.82 ± 0.16 0.679 12.5 83
Pb 1.19 ± 0.18 1.026 0.4 86(1)
Certified mussel standard reference material (SRM) 2976.
Table 4: Method detection limits of trace metals.
Trace metalsDetection limit
(µg/g)
∗Health-criteria levels(µg/g)
Al 0.287 —
Fe 0.492 —
Zn 0.474 480
As 0.403 86
Cd 0.193 4
Pb 0.606 2∗
FDA recommended health criteria concentrations (µg/g), [38, 39].
the t-test was conducted. Moreover, to investigate the denot-ing dissimilarity of concentrations of trace metals among thethree fish organs, the Kruskal-Wallis test was used. Pearsonrank correlation analysis was employed, to measure the latentassociations of metal concentrations with fish weight andlength. For which a P value less than 0.05 was consideredas suggestive of statistical significance. SPSS for windows,version 16.0 was used to perform all the above-mentionedtests.
3. Results and Discussion
3.1. Validation of Analytical Methods. The precision andaccuracy of the applied analytical method was validated byaccurate analysis of standard reference material of marinebiota sample (SRM2976, freeze-dried mussel tissue, NationalInstitute of Standards and Technology, USA). All the runswere carried out in triplicate. The results obtained on theSRMs are showed in Table 3 which was in a good agreementwith the certified values for all metals. Recovered values of allmetals were between 83% and 109% of the certified value.
3.1.1. Quality Control. It is vital for the analytical instru-ments (ICP-MS) to meet the standard before it can produce a
reliable data. Calibration curve of each element must be ableto produce good correlation coefficient r2 = 0.999.
3.1.2. Instrument Detection Limit (IDL). The IDL is thesmallest signal that can be differentiated from backgroundnoise by a specific device. The method detection limit shouldbe always higher than the IDL, whereas the IDL is thrice equalto the standard deviation of 10 replicates measurements ofcalibration blanks signal at the selected elements.
3.1.3. Limit of Detection (LOD). The LOD is the least amountof a substance that can be distinguished from the absence ofit (a blank value) within a stated confidence limit (generally1%). The method detection limit is defined as the concentra-tion corresponding thrice to the standard deviation of tenreagent blanks [42]. Table 4 shows the method detectionlimit (µg/g) of five metals and the FDA recommended health-criteria concentrations (µg/g) of five metals in seafood [38,39]. The detection limit values were found to be 0.287 µg/gfor Al, 0.492 µg/g for Fe, 0.474 µg/g for Zn, 0.403 µg/g for As,0.193 µg/g for Cd, and 0.606 µg/g for Pb which were muchlower than the recommended health-criteria values.
3.1.4. Limit of Quantitation (LOQ). The LOQ is mathemat-ically expressed as equal to 10 times the standard deviationof the results for a sequence of replicates used to establisha reasonable boundary of detection. The LOQ values werefound to be 2.87 for Al, 4.92 µg/g for Fe, 4.73 µg/g for Zn,4.03 µg/g for As, 1.95 µg/g for Cd, and 6.16 µg/g for Pb.
3.2. Trace Metals Contents in Water. Analysis on water qualityof baseline study for Kapar and Mersing seawater are neces-sary to predict the level of pollutant as well as to the envi-ronment in the study areas. Table 5 shows the water temper-ature, pH, dissolved oxygen (DO), and the trace metal levelsin the seawater samples from Kapar and Mersing. The watertemperature from Mersing and Kapar ranges from 19.6to 22.5◦C; the variation in water temperature was mainlydue to prevailing weather conditions. The statistical analysisshowed that there was no significant difference between thetwo locations (P > 0.05). Moreover, the pH has rangedbetween 7.23–7.56. The standard pH for seawater is 6.5–8.5[43], and the values obtained were within the recommendedstandard, and there was no significant difference in pH forthe two sampling sites. The lowest dissolved oxygen (DO)value recorded was 4.37 mg/L at Kapar, while the highestwas 7.90 mg/L at Mersing. Generally, the dissolved oxygenwill be affected by water temperature, tides, and depths.Furthermore, the maximum concentration of the metals inthe water samples in the descending order were Fe > Al > As> Zn > Pb > Cd and Fe > As > Cd > Zn > Al > Pb from Kapar

Journal of Environmental and Public Health 5
Table 5: Trace metal concentrations (mg/L), water temperature (T), pH, dissolved oxygen (DO mg/L) in sea water from Kapar and Mersing.
Location Metals Parameters
Al Fe Zn As Pb Cd T (C◦) pH DO (mg/L)
KaparMean 0.048 0.33 0.021 0.036 0.010 0.010 23.05 7.72 5.66
Max 0.049 0.34 0.033 0.040 0.014 0.011 24.80 7.65 5.62
Min 0.047 0.32 0.015 0.020 0.020 0.010 21.30 7.79 5.70
MersingMean 0.012 0.36 0.015 0.030 0.010 0.019 21.25 7.28 6.73
Max 0.013 0.40 0.016 0.033 0.014 0.030 23.60 7.52 6.60
Min 0.011 0.32 0.014 0.028 0.002 0.011 18.90 7.64 6.86
NWQSM∗ 0.5 1 0.5 0.1 0.5 0.01 — — 5–7
WHO∗∗ — — 5 0.01 0.01 0.003 — 6.5–8.5 —
NWQSM∗ National Water Quality Standards for Malaysia. WHO∗∗World Health Organization.
Table 6: Concentrations (µg g−1 dry wt) of heavy metals (mean ± SD) in different organs of fish collected from the coastal waters of Kapar,Malaysia.
Species Organ Elements
Al Fe Zn As Cd Pb
A. thalassinusMuscle 7.24± 0.0 53.84± 5.1 50.99± 5.34 12.58± 0.8 0.088± 0.01 0.12± 0.01
Liver 28.38± 1.92 1007.1± 11.7 550.89± 6.75 14.17± 1.03 1.01± 0.07 1.54± 0.19
Gills 538.6± 3.48 805.6± 3.38 840.89± 5.2 13.59± 0.69 0.048± 0.01 2.03± 0.05
P. aneaMuscle 3.00± 0.11 21.62± 4.7 26.32± 1.6 3.28± 0.65 0.048± 0.01 0.13± 0.004
Liver 13.72± 1.12 1975.0± 38.9 114.11± 2.16 11.75± 0.13 0.694± 0.05 0.57± 0.03
Gills 299.5± 0.75 891.6± 28.6 60.21± 0.44 4.75± 0.65 0.690± 0.05 0.26± 0.02
WHO∗ — 50 150 0.02 0.2 0.2
FAO∗∗ — — 30–100 7.88a 0.2 0.5–0.6
MFR∗∗∗ — — 100 — 1 2∗
WHO (1989), ∗∗FAO (1992), aFAO 1983, ∗∗∗Malaysian Food regulation (1985).
and Mersing, respectively. Al, Zn, and As had higher con-centration in Kapar, whereas the Fe and Cd had higher inMersing. There was no significant difference in metal con-centrations in the two sampling locations. Additionally, thecomparison of trace metals level with NWQSM and WHO[44, 45] showed that all the metal concentrations were belowthe maximum acceptable concentration (MAC), except forCd from both sites that showed high levels exceeding theinternational standards suggesting that adverse effects toaquatic organisms would frequently occur.
3.3. Trace Metals Contents in Various Organs in Fish. Knowl-edge about heavy metals concentration in fish is importantwith respect to nature management and human consump-tion. Levels of six metals (µg/g dry wt.) in muscle, liver,and gill tissues of two fish species collected from the coastalwaters around Kapar and Mersing are shown in Tables 6and 7. Generally, the highest concentrations of iron, zinc,aluminium, arsenic, and lead were found in the liver tissuesof both examined fish species. The analysis of varianceproved that the mean concentrations of metals in the organsof each species were significantly different (P < 0.05) in boththe species except for Cd. The concentrations of the studiedmetals decreased in the following order Fe > Zn > Al > As >
Pb > Cd in the two species. Iron exhibited the highest con-centrations in all the examined organs of both species,followed by Zn. On the other hand, the levels of Pb and Cdwere generally the lowest. Similar findings were reported bymany researchers [14, 46–48].
It is observed that Fe concentration was the highest inboth species and both study areas. In the present study, withthe exception of Al, liver had significantly higher trace ele-ment concentrations than gills and muscle. It is observed thatthe mean concentrations of metals in the muscle, liver, andgills of each fish species showed great variations, this maybe related to the differences in ecological needs, swimmingbehaviours, and the metabolic activities among different fishspecies.
The differences in metal concentrations of the tissuesmight be due to their capacity to induce metal-binding pro-teins such as metallothioneins. Our study showed that themetal levels in liver and gills were highest in the sampledspecies. It is well known that large amount of metallothio-neins induction occurs in the liver tissue of fishes. The ad-sorption of metals onto gill surface could also be an impor-tant influence in total metal levels of the gill [30].
The mean concentrations of Fe in the muscles of P. Aneaand A. thalassinus in Kapar were 34.91 µg/g and 53.84 µg/g,

6 Journal of Environmental and Public Health
Table 7: Concentration (µg g−1 dry wt) of heavy metals (mean ± SD) in different organs of fish collected from the Mersing coastal waters,Johor Bahru, Malaysia.
Species Organ Elements
Al Fe Zn As Cd Pb
A. thalassinusMuscle 5.44± 1.25 34.91± 1.74 25.39± 0.71 14.2± 2.34 0.02± 0.03 0.2± 0.02
Liver 10.05± 1.7 924.6± 24.7 341.9± 3.35 21.89± 0.9 2.075± 0.1 0.87± 0.07
Gills 850.1± 7.1 822.76± 9.9 246.55± 7.4 7.65± 0.1 0.02± 0.01 0.24± 0.02
P. aneaMuscle 1.46± 13 21.47± 1.86 18.1± 0.79 3.76± 0.2 0.023± 0.02 0.17± 0.05
Liver 5.13± 0.65 525.96± 17 104.84± 1.23 8.38± 0.22 2.46± 0.02 1.07± 0.07
Gills 91.03± 2.7 461.4± 8.6 66.24± 1.3 4.88± 0.13 0.05± 0.01 1.96± 0.16
WHO∗ — 50 150 0.02 0.2 0.2
FAO∗∗ — — 30–100 7.88a 0.2 0.5–0.6
MFR∗∗∗ — — 100 — 1 2∗
WHO (1989), ∗∗FAO (1992), aFAO 1983, ∗∗∗Malaysian Food regulation (1985).
respectively. However, in Mersing the mean concentrationswere 21.47 µg/g in P. Anea and 21.62 µg/g in A. thalassinus.It is revealed that Fe concentrations varied significantly (P <0.05) between the two stations. Higher Fe concentration inmuscles of both species was found in the fish from Kaparthan that of Mersing. The reason for this is that the Kapararea is polluted by various sources such as electrical powerstation, international shipping activities, and urban andagricultural activities. Similarly, the concentrations of Fe inthe liver tissues of P. anea and A. thalassinus in Kapar were,approximately, 1976.0 µg/g and 1008.0 µg/g, respectively. Butin the same tissues of the fish from Mersing the concentra-tions were 526.0 µg/g and 924.6 µg/g, respectively. The levelsof iron in the muscles of Mediterranean Sea fish that arereported in the literature ranges from 59.6 and 73.4 µg/g [31].The concentrations of Fe in the fish muscle were reported tohave the range of 24.1–50.3 µg/g in Parangipettai Coast, India[49] and the range of 49.9–889 µg/g in the Turkish seas [47].Therefore, the levels of iron in the fish muscles reported inthis study are generally in accordance with the literature.
According to the results (Tables 6 and 7), concentrationsof Zn in the livers of P. anea and A. thalassinus collected fromKapar and Mersing were 114.1 µg/g and 555.9 µg/g (Table 6),and 104.8 µg/g and 341.9 µg/g (Table 7), respectively. Gener-ally, high concentrations of Zn were observed in the liversof A. thalassinus in both the studied areas. The mean concen-trations of Zn in the muscle tissues of P. Anea and A. tha-lassinus collected from Kapar were around 26.3 µg/g and51.0 µg/g, respectively. However, in Mersing the respectiveconcentrations were 18.1 µg/g and 25.4 µg/g. Higher Zn con-centrations in the muscle tissues of both species were foundin Kapar than in Mersing.
The observed differences can be explained by the fact thatthe concentrations of these metals depend to a great extenton species, sex, biological cycle, and on the part of the fishanalyzed [23]. Moreover, ecological factors such as season,location/environment of development, nutrient availability,and temperature and salinity of the water, may contributeto variations in the metal concentrations in fishes. Rangesof Zn concentrations reported earlier in the muscles and
livers of Malaysian marine fish were 15.4–60.1 µg/g and 27.1–95.3 µg/g, respectively [40]. Another study conducted inLangkawi Island showed that all species had higher concen-trations of Zn than of other metals and that the concentra-tions in muscles ranged from 34.3 µg/g to 49.4 µg/g [50].Accordingly, the Zn concentrations in the fish muscles detec-ted by the present study are similar to those reported by [50].
In this study, the concentrations of aluminium were thehighest in the gills and it ranged from 13.7 µg/g in P. aneato 538.6 µg/g in A. thalassinus in Kapar, and from 91.0 µg/gin P.anea to 850.14 µg/g in A. thalassinus at Mersing, whereasin A. thalassinus, the Al concentration was 7.2 µg/g in muscleand 28.4 µg/g in liver at Kapar station and it was 5.4 µg/g and10.0 µg/g in the fish muscle and liver tissues, respectively, atMersing station.
On the other hand, the concentrations of Al in the muscleand liver tissues of P. anea was 3.0 µg/g and 13.7 µg/g, re-spectively, in Kapar while the respective concentrations inMersing were 1.5 µg/g and 5.1 µg/g, respectively. The meanAl concentrations were higher in the three organs fish speciescaptured from Kapar than its concentration in the same or-gans of the fish species collected from Mersing except gillsof A. thalassinus from Mersing. The Al concentrations werereported to fall within the range 1.50–4.50 µg/g in fishmuscles from the Parangipettai Coast, India [49]. On theother hand, the Al concentrations were reported earlier to fallin the range of 51.9–166.3 µg/g in muscles and in the rangeof 229.01–1412.7 µg/g in gills of Malaysian marine fish fromKapar [51]. As such, the Al concentrations observed in thisstudy generally correspond with the values reported in theliterature.
Arsenic levels in the muscles of the analyzed fish rangedfrom 3.8 µg/g in P. anea in Kapar to 14.2 µg/g in A. thalassinusin Mersing. Whereas, the arsenic levels in fish livers rangedfrom 11.8 µg/g in P. anea from Kapar to 21.9 µg/g in A. tha-lassinus from Mersing. The arsenic levels in the fish gillsranged from 4.9 µg/g in P. anea from Mersing to 13.6 µg/g inA. thalassinus from Kapar (Tables 6 and 7). Unfortunatelywe do not have sufficient data of arsenic levels in fish tissuesfrom Malaysia, to be compared with our findings.

Journal of Environmental and Public Health 7
050
100150200250300350400450
0 100 200 300 400 500 600
Met
als
con
cen
trat
ion
Weight
r = 0.89
(a) Correlation between metals concentration in Muscle andWeight
050
100150200250300350400450
Met
als
con
cen
trat
ion
15 20 25 30 35 40
Length
r = 0.86
(b) Correlation between metals concentration in Muscle andLength
050
100150200250300350400450
Met
als
con
cen
trat
ion
0 100 200 300 400 500 600
Weight
r = 0.84
(c) Correlation between metals concentration in Liver andWeight
050
100150200250300350400450
Met
als
con
cen
trat
ion
15 20 25 30 35 40
Length
r = 0.8
(d) Correlation between metals concentration in Liver andLength
050
100150200250300350400450
Met
als
con
cen
trat
ion
0 100 200 300 400 500 600
Weight
r = 0.84
(e) Correlation between metals concentration in Gills andWeight
050
100150200250300350400450
Met
als
con
cen
trat
ion
15 20 25 30 35 40
Length
r = 0.81
(f) Correlation between metals concentration in Gills andLength
Figure 2: Correlation analysis.
According to published literature, ranges of arsenic con-centrations reported earlier in the muscles of Malaysianmarine fish were 1.05–2.14 µg/g [52]. Another study con-ducted showed that arsenic content of fish from Indian coast-al waters was within the range of 0.01–0.63 µg/g [53] whichare well below the arsenic levels detected in fish tissues by thisstudy.
In this study, the lead concentrations in muscles rangedfrom 0.1 µg/g in P. anea in Kapar to 0.2 µg/g in A. thalassinusin Mersing. While in the livers the concentrations rangedfrom 1.1 µg/g in P. anea from Mersing to 1.5 µg/g in A. tha-lassinus in Kapar. On the other hand, the concentrationranged in gills from 1.96 µg/g in P. anea in Mersing to2.03 µg/g in A. thalassinus in Kapar. Lead levels reportedearlier in the literature fall in the range of 0.018–0.023 µg/g
for muscles and 0.115–0.380 µg/g for livers of fish from Mers-ing. Moreover, the lead level ranged from 0.026–0.72 µg/gin muscles and 0.041–0.872 µg/g in livers of fishes fromLangkawi coastal waters of Malaysia [40]. Hence, the Pb con-centrations reported herein comply with these ranges.
The results of this investigation reveal that there is nosignificant variation in Cd levels (P > 0.05). The highest con-centrations were observed in the livers of the fish species fromMersing, where the mean Cd concentration ranged from2.075 µg/g in livers of A. thalassinus to 2.458 µg/g in liversof P. anea from Mersing coastal water. While the highestlevels of Cd in the muscles were recorded as 0.088µg/g inA. thalassinus from Kapar, in contrast, the lowest value ofCd detected was 0.021 µg/g in the muscles of P. anea fromMersing, whereas the Cd levels reported in the literature

8 Journal of Environmental and Public Health
fall in the range of 0.14–0.57 mg/kg and 0.15–0.52 mg/kg formuscles of A. thalassinus and P. anea from the same studyarea Kapar [51]. Another study was conducted on commer-cial marine fish from Klang Valley, Malaysia, which conclud-ed that the mean Cd concentrations in the fish muscles rang-ed from 0.121 mg/kg to 1.594 mg/kg [54]. The third studyinvestigated the marine fin fish captured from the coast ofLangkawi Island in Malaysia and reported that the meanCd concentrations in the fish muscles ranged from 0.30 µg/gto 0.90 µg/g [50]. Compared with the literature from dif-ferent Malaysian marine coastal waters, our results for Cdconcentration is lower than the literature. Cd and Pb havehigher tendencies to bioaccumulate in the fish liver tissueswhich involves in the detoxification process. The presenceof free protein-thiol group content and metallothioneinsbinding proteins in the liver forms a strong fixation with theheavy metals [55]. Meanwhile fish liver acts as major site forhomeostasis [56].
The variability in heavy metal levels in different speciesdepends on feeding habits [26], ecological needs, and metab-olism [30], age, size, and length of the fish [57], and fishhabitat [21]. Concentrations of trace metals detected in themuscle, gill, and liver samples indicate different bioaccumu-lation potentials. Muscles seem to be a transitory tissue in thepathway of metal uptake and in metal storage, whereas theliver appears to be the tissue, specialized in metal storage anddetoxification [58]. The gills comprise the chief exposure tis-sue and early uptake site of the soluble, waterborne metals inwhich metal concentrations are the highest in the early stagesof exposure, before these metals are transported to otherfish tissues [59]. Although human activity is concentratedin the west coast of Peninsular Malaysia, compared with theeast coast, there is some contamination with heavy metals inthe east coast. The results of the present study suggest that,at some point, sources of heavy metal contaminations arepresent in the east coast of Peninsular Malaysia in spite ofthe relatively low human activities.
The relationships between body size and trace elementconcentrations in the two fish species were also investigatedand significant positive correlations between the total fishlength and weight and heavy metal concentrations werefound (P < 0.05) (Figure 2). Particularly, the concentrationsof some of the heavy metals of concern had positive, highcorrelations with fish weight and total length. On the otherside, metal concentrations were more affected by fish weightthan by length. Our findings were in agreement with resultsreported by [60].
4. Conclusion
This study was undertaken to provide information on tracemetal concentrations in water and two fish species fromKapar and Mersing. The highest metal concentrations werefound in the fish liver and gill tissues, while the musclestend to accumulate relatively low metal levels. Generally, theFe concentrations were the highest in water samples andall organs of the two species in both study areas exceptthe muscles of P. anea from Kapar which had higher Zn
concentration, and the gills of A. thalassinus from both Kaparand Mersing had higher Al and Zn levels, respectively. More-over, the A. thalassinus species had higher metal concentra-tions than the P. anea. In water samples, Cd concentrations inboth sites exceed the international standards, but still in thepermissible levels of national standards. The mean concen-trations of heavy metals, analyzed in the muscles of bothspecies, were lower than the maximum concentrations rec-ommended by [61–63]. The concentrations of Al, Fe, Zn,As, Cd, and Pb in muscle tissues should pose no acutetoxicological risks to human health. This study revealed thatthe studied metals concentrations are generally low in thetissues of the examined fish in the two study areas. Althoughthe levels of these heavy metals are not high, a potential dan-ger may emerge in the future depending on pollution sour-ces. The data may be taken as a convenient base line againstwhich any future pollution trends can be evaluated.
Abbreviations
cm: Centimeterg: Gramµg/g: Micrograms per gramµg/L: Micrograms per literMg/L: Milligrams per literSD: Standard deviationRSD: Relative standard deviation.
Acknowledgments
The authors are grateful to the Libyan Ministry of High Ed-ucation for the generous financial support they have kindlyprovided for this study. The authors would also like to thankthe staff of the microwave and ICP-MS laboratory, Facultyof Science and Technology, University Kebangsaan Malaysia,for their help in running the analyses and for their extendedassistance.
References
[1] R. R. Paquin, K. Farley, R. C. Santore et al., Metals in AquaticSystems: A Review of Exposure, Bioaccumulation, and ToxicityModels, Society of Environmental Toxicology and Chemistry,Pensacola, Fla, USA, 2003.
[2] G. W. Goldstein, “Lead poisoning and brain cell function,”Environmental Health Perspectives, vol. 89, pp. 91–94, 1990.
[3] A. Malik, “Metal bioremediation through growing cells,”Environment International, vol. 30, no. 2, pp. 261–278, 2004.
[4] C. Y. Kamaruzzaman, Z. Rina, B. A. A. John, and K. C. A. Jalal,“Heavy metal accumulation in commercially important fishesof South West Malaysian coast,” Reaesrch Journal of Environ-mental Sciences, vol. 5, no. 6, pp. 595–602, 2011.
[5] V. Wim, S. Issabelle, D. Karen, H. Stefan, and C. John,“Consumer perception versus scientific evidence of farmedand wild fish: exploratory insights from Belgium,” AquacultureInternational, vol. 15, no. 2, pp. 121–136, 2007.
[6] M. I. Castro-Gonzalez and M. Mendez-Armenta, “Heavymetals: implications associated to fish consumption,” Environ-mental Toxicology and Pharmacology, vol. 26, no. 3, pp. 263–271, 2008.
Journal of Environmental and Public Health 9
[7] P. Hajeb, S. Jinap, A. Ismail, A. B. Fatimah, B. Jamilah, andM. Abdul Rahim, “Assessment of mercury level in commonlyconsumed marine fishes in Malaysia,” Food Control, vol. 20,no. 1, pp. 79–84, 2009.
[8] Food and Agriculture Organization, “Nutritional elementsof fish,” 2010, http://www.fao.org/fishery/topic/12319/enon 26/8/2010.
[9] L. Tukiman, I. Norazura, M. Ahmad, and A. R. Sahibin, “Kan-dungan logam berat dalam makanan laut dan kadar pengam-bilannya oleh penduduk di Tanjung Karang, Selangor,” TheMalaysian Journal of Analytical Sciences, vol. 10, no. 2, pp. 197–204, 2006.
[10] A. Zuraini, M. N. Somchit, M. H. Solihah et al., “Fatty acidand amino acid composition of three local Malaysian Channaspp. fish,” Food Chemistry, vol. 97, no. 4, pp. 674–678, 2006.
[11] J. Burger, M. Gochfeld, C. Jeitner, S. Burke, and T. Stamm,“Metal levels in flathead sole (Hippoglossoides elassodon)and great sculpin (Myoxocephalus polyacanthocephalus) fromAdak Island, Alaska: potential risk to predators and fisher-men,” Environmental Research, vol. 103, no. 1, pp. 62–69, 2007.
[12] C. M. Liao and M. P. Ling, “Assessment of human health risksfor arsenic bioaccumulation in tilapia (Oreochromis mossam-bicus) and large-scale mullet (Liza macrolepis) from blackfootdisease area in Taiwan,” Archives of Environmental Contamina-tion and Toxicology, vol. 45, no. 2, pp. 264–272, 2003.
[13] S. Dıez, S. Delgado, I. Aguilera et al., “Prenatal and earlychildhood exposure to mercury and methylmercury in spain, ahigh-fish-consumer country,” Archives of Environmental Con-tamination and Toxicology, vol. 56, no. 3, pp. 615–622, 2009.
[14] A. Farkas and S. J. Specziar, “Age and size specific patterns ofheavy metals in the organs of fresh water fish Abramis brama L.populating a low-contaminated site,” Water Research, vol. 37,pp. 959–964, 2003.
[15] S. A. Mansour and M. M. Sidky, “Ecotoxicological studies.3. Heavy metals contaminating water and fish from FayoumGovernorate, Egypt,” Food Chemistry, vol. 78, no. 1, pp. 15–22, 2002.
[16] U. Celik and J. Oehlenschlager, “High contents of cadmium,lead, zinc and copper in popular fishery products sold inTurkish supermarkets,” Food Control, vol. 18, no. 3, pp. 258–261, 2007.
[17] C. Reilly, Metal Contamination of Food, Blackwell Science,Axford, UK, 3rd edition, 2002.
[18] H. Barton, “Predicted intake of trace elements and mineralsvia household drinking water by 6-year-old children fromKrakow, Poland,” Part 3: Aluminium. Food Additives andContaminants, vol. 25, no. 5, pp. 588–603, 2008.
[19] O. D. Uluozlu, M. Tuzen, D. Mendil, and M. Soylak, “Assess-ment of trace element contents of chicken products fromturkey,” Journal of Hazardous Materials, vol. 163, no. 2-3, pp.982–987, 2009.
[20] J. Liu, R. A. Goyer, and M. P. Waalker, “Toxic effects of metals,”in Casarrett and Doull’s Toxicology the Basic Science of Poisons,C. D. Klaassen, Ed., pp. 931–979, McGraw-Hill, New York, NY,USA, 2008.
[21] M. Canli and G. Atli, “The relationships between heavy metal(Cd, Cr, Cu, Fe, Pb, Zn) levels and the size of six Mediterra-nean fish species,” Environmental Pollution, vol. 121, no. 1, pp.129–136, 2003.
[22] F. Camara, M. A. Amaro, R. Barbera, and G. Clemente, “Bioac-cessibility of minerals in school meals: comparision betweendialysis and solubility methods,” Food Chemistry, vol. 92, pp.481–489, 2005.
[23] M. Tuzen, “Determination of heavy metals in fish samplesof the middle Black Sea (Turkey) by graphite furnace atomicabsorption spectrometry,” Food Chemistry, vol. 80, no. 1, pp.119–123, 2003.
[24] T. Agusa, T. Kunito, A. Sudaryanto et al., “Exposure assess-ment for trace elements from consumption of marine fish inSoutheast Asia,” Environmental Pollution, vol. 145, no. 3, pp.766–777, 2007.
[25] S. J. Hamilton and P. M. Mehrle, “Methallothionein in fish:review of its importance in assessing stress from metal con-taminants,” Transactions of the American Fisheries Society, vol.115, no. 4, pp. 596–609, 1986.
[26] M. Romeo, Y. Siau, Z. Sidoumou, and M. Gnassia-Barelli,“Heavy metal distribution in different fish species from theMauritania coast,” Science of the Total Environment, vol. 232,no. 3, pp. 169–175, 1999.
[27] A. B. Yilmaz, “Levels of heavy metals (Fe, Cu, Ni, Cr, Pb, andZn) in tissue of Mugil cephalus and Trachurus mediterraneusfrom Iskenderun Bay, Turkey,” Environmental Research, vol.92, no. 3, pp. 277–281, 2003.
[28] J. E. Marcovecchio and V. J. Moreno, “Cadmium, zinc andtotal mercury levels in the tissues of several fish species fromLa Planta river estuary, Argentina,” Environmental Monitoringand Assessment, vol. 25, no. 2, pp. 119–130, 1993.
[29] G. W. Bryan and W. J. Langston, “Bioavailability, accumula-tion and effects of heavy metals in sediments with special ref-erence to United Kingdom estuaries,” Environmental Pollution,vol. 76, no. 2, pp. 89–131, 1992.
[30] M. Canli and R. W. Furness, “Toxicity of heavy metals dis-solved in sea water and influences of sex and size on metal ac-cumulation and tissue distribution in the Norway lobsterNephrops norvegicus,” Marine Environmental Research, vol. 36,no. 4, pp. 217–236, 1993.
[31] M. Kalay, O. Aly, and M. Canli, “Heavy metal concentrationsin fish tissues from the Northeast Mediterranean Sea,” Bulletinof Environmental Contamination and Toxicology, vol. 63, no. 5,pp. 673–681, 1999.
[32] U. Forstner and G. T. W. Wittmann, Metal Pollution in theAquatic Environment, Springer, Berlin, Germany, 1981.
[33] A. T. Khan and J. S. Weis, “Bioaccumulation of heavy metalsin two populations of mummichog (Fundulus heteroclitus),”Bulletin of Environmental Contamination and Toxicology, vol.51, no. 1, pp. 1–5, 1993.
[34] E. I. Adeyeye, N. J. Akinyugha, M. E. Fesobi, and V. O. Tenabe,“Determination of some metals in Clarias gariepinus (Cuvierand Vallenciennes), Cyprinus carpio (L.) and Oreochromisniloticus (L.) fishes in a polyculture fresh water pond and theirenvironments,” Aquaculture, vol. 147, no. 3-4, pp. 205–214,1996.
[35] J. Burger, M. Gochfeld, C. Jeitner, S. Burke, and T. Stamm,“Metal levels in flathead sole (Hippoglossoides elassodon) andgreat sculpin (Myoxocephalus polyacanthocephalus) fromAdak Island, Alaska: potential risk to predators and fisher-men,” Environmental Research, vol. 103, no. 1, pp. 62–69, 2007.
[36] A. R. Abdullah, N. M. Tahir, T. S. Loong, T. M. Hoque, andA. H. Sulaiman, “The GEF/UNDP/IMO Malacca Straits dem-onstration project: sources of pollution,” Marine PollutionBulletin, vol. 39, no. 1-12, pp. 229–233, 1999.
[37] C. T. Eng, J. N. Paw, and F. Y. Guarin, “The environmentalimpact of aquaculture and the effects of pollution on coastalaquaculture development in Southeast Asia,” Marine PollutionBulletin, vol. 20, no. 7, pp. 335–343, 1989.
[38] K. Swami, C. D. Judd, J. Orsini, K. X. Yang, and L. Husain, “Mi-crowave assisted digestion of atmospheric aerosol samples

10 Journal of Environmental and Public Health
followed by inductively coupled plasma mass spectrometrydetermination of trace elements,” Analytical and BioanalyticalChemistry, vol. 369, no. 1, pp. 63–70, 2001.
[39] R. Bou, F. Guardiola, A. Padro, E. Pelfort, and R. Codony, “Val-idation of mineralisation procedures for the determinationof selenium, zinc, iron and copper in chicken meat andfeed samples by ICP-AES and ICP-MS,” Journal of AnalyticalAtomic Spectrometry, vol. 19, no. 10, pp. 1361–1369, 2004.
[40] T. Agusa, T. Kunito, G. Yasunaga et al., “Concentrationsof trace elements in marine fish and its risk assessment inMalaysia,” Marine Pollution Bulletin, vol. 51, no. 8-12, pp. 896–911, 2005.
[41] O. C. Vaidya and R. T. T. Rantala, “A comparative study ofanalytical methods: determination of heavy metals in mussels(Mytilus edulis) from eastern Canada,” International Journalof Environmental Analytical Chemistry, vol. 63, no. 3, pp. 179–185, 1996.
[42] D. Mendil, O. F. Unal, M. Tuzen, and M. Soylak, “Determi-nation of trace metals in different fish species and sedimentsfrom the River Yesilidotlessrmak in Tokat, Turkey,” Food andChemical Toxicology, vol. 48, no. 5, pp. 1383–1392, 2010.
[43] DOE, “Environmental Quality Report,” Tech. Rep., Depart-ment of Environment, Kuala Lumpur, Malaysia, 2006.
[44] A. K. Ahmad, I. Mushrifah, and M. Shuhaimi-Othman,“Water quality and heavy metal concentrations in sediment ofSungai Kelantan, Kelantan, Malaysia: A baseline study,” SainsMalaysiana, vol. 38, no. 4, pp. 435–442, 2009.
[45] WHO, Guidelines for Drinking Water Quality Volume 2: HealthCriteria and Other Supporting Information, World HealthOrganization, Geneva, Switzerland, 1996.
[46] M. Dural, M. Z. L. Goksu, and A. A. Ozak, “Investigationof heavy metal levels in economically important fish speciescaptured from the Tuzla lagoon,” Food Chemistry, vol. 102, no.1, pp. 415–421, 2007.
[47] Y. Tepe, M. Turkmen, and A. Turkmen, “Assessment of heavymetals in two commercial fish species of four Turkish seas,”Environmental Monitoring and Assessment, vol. 146, no. 1–3,pp. 277–284, 2008.
[48] M. Turkmen, A. Turkmen, Y. Tepe, A. Ates, and K.Gokkus, “Determination of metal contaminations in sea foodsfrom Marmara, Aegean and Mediterranean seas: twelve fishspecies,” Food Chemistry, vol. 108, no. 2, pp. 794–800, 2008.
[49] P. Raja, S. Veerasingam, G. Suresh, G. Marichamy, and R.Venkatachalapath, “Heavy metals concentration in four com-mercially valuable marine edible fish species from Parangipet-tai coast, south east coast of India,” International Journal ofAnimal and Veterinary Advances, vol. 1, no. 1, pp. 10–14, 2009.
[50] J. Irwandi and O. Farida, “Mineral and heavy metal contentsof marine fin fish in Langkawi island, Malaysia,” InternationalFood Research Journal, vol. 16, no. 1, pp. 105–112, 2009.
[51] C. A. R. Mohamed, A. Samat, M. R. Otman, and W. M. Muda,“Kandungan Cd, Cr, Fe, Mn dan Al di dalam ikan di per-sekitaran stesen janakuasa electric, TNB, kapar. selangor,”Malaysia Journal of Analytical Sciences, vol. 10, no. 1, pp. 87–92, 2006.
[52] T. Budiati, “The presence of arsenic as heavy metal contam-inant on salmon : a risk assessment,” International Journal ofBasic and Applied Sciences, vol. 10, no. 5, pp. 6–12, 2010.
[53] A. Deshpande, S. Bhendigeri, T. Shirsekar, D. Dhaware, and R.N. Khandekar, “Analysis of heavy metals in marine fish fromMumbai Docks,” Environmental Monitoring and Assessment,vol. 159, no. 1–4, pp. 493–500, 2008.
[54] K. Nor Hasyimah, V. J. Noik, Y. Y. Teh, C. Y. Lee, and H. C.Pearline, “Assessment of cadmium (Cd) and lead (Pb) levels in
commercial marine fish organs between wet markets and su-permarkets in Klang Valley, Malaysia,” International FoodResearch Journal, vol. 18, pp. 770–777, 2011.
[55] C. M. A. Iwegbue, “Heavy metal composition of livers andkidneys of cattle from southern Nigeria,” Veterinarski Arhiv,vol. 78, no. 5, pp. 401–410, 2008.
[56] H. Reynders, K. van Campenhout, L. Bervoets, W. M. DeCoen, and R. Blust, “Dynamics of cadmium accumulationand effects in common carp (Cyprinus carpio) during simul-taneous exposure to water and food (Tubifex tubifex),” Envi-ronmental Toxicology and Chemistry, vol. 25, no. 6, pp. 1558–1567, 2006.
[57] A. R. Linde, S. Sanchez-Galan, J. I. Izquierdo, P. Arribas, E.Maranon, and E. Garcıa-Vazquez, “Brown trout as biomoni-tor of heavy metal pollution: effect of age on the reliability ofthe assessment,” Ecotoxicology and Environmental Safety, vol.40, no. 1-2, pp. 120–125, 1998.
[58] P. Kotze, H. H. Du Preez, and J. H. J. Van Vuren, “Bioaccumu-lation of copper and zinc in Oreochromis mossambicus andClarias gariepinus, from the Olifants River, Mpumalanga,South Africa,” Water SA, vol. 25, no. 1, pp. 99–110, 1999.
[59] Jezierska and M. Witeska, “Metal toxicity to fish. University ofPodlasie,” Monografic, no. 42, 2001.
[60] B. Y. Kamaruzzaman, M. C. Ong, S. Z. Rina, and B. Joseph,“Levels of some heavy metals in fishes from Pahang river estu-ary, Pahang, Malaysia,” Journal of Biological Sciences, vol. 10,no. 2, pp. 157–161, 2010.
[61] Food and Agriculture Organization (FAO), “Compilation oflegal limits for hazardous substances in fish and fisheryproducts,” FAO Fishery Circular, no. 464, pp. 5–10, 1983.
[62] World Health Organization, “Heavy metals-environmentalaspects,” Environment Health Criteria , no. 85, World HealthOrganization, Geneva, Switzerland, 1989.
[63] H. I. Nasser and Y. T. Huat, “Malaysian Food and Regulations,”in Malaysian Law on Food and Drugs, Malaysia Law, KualaLumpur, Malaysia, 1985.

Hindawi Publishing CorporationJournal of Environmental and Public HealthVolume 2012, Article ID 235618, 7 pagesdoi:10.1155/2012/235618
Research Article
Involuntary and Persistent Environmental Noise InfluencesHealth and Hearing in Beirut, Lebanon
Marjaneh M. Fooladi1, 2, 3
1 Council for International Exchange of Scholars, A Division of the Institute of International Education, 3007 Tilden Street NW, Suite5-L, Washington, DC 20008, USA
2 College of Nursing, Florida State University, Vivian M. Duxbury Hall, 98 Varsity Way, P.O. Box 3064310, Tallahassee,FL 32306-4310, USA
3 School of Nursing, American University of Beirut, P.O. Box 11-0236, Riad El Solh, Beirut 1107 2020, Lebanon
Correspondence should be addressed to Marjaneh M. Fooladi, [email protected]
Received 9 June 2011; Revised 31 July 2011; Accepted 11 August 2011
Academic Editor: Mohammad Mehdi Amin
Copyright © 2012 Marjaneh M. Fooladi. This is an open access article distributed under the Creative Commons AttributionLicense, which permits unrestricted use, distribution, and reproduction in any medium, provided the original work is properlycited.
Objective. This study was conducted to assess the effects of involuntary and persistent noise exposure on health and hearingamong Lebanese adults in Beirut, Lebanon, where people are exposed to noise from construction sites, power generators, honkingcars, and motorcycles. Methods. Using a descriptive and exploratory design with mixed methods, participants were surveyed,interviewed, and tested for hearing while street noise levels were measured near their residents and work places. Results. Self-reports of 83 Lebanese adult, who lived and worked in Beirut, helped identify common patterns in experiences such as irritability,anger, headaches, and sleep disturbances due to noise annoyance. Of those tested, 30% suffered from high-frequency hearingimpairment. Our results showed that environmental sound dB had increased by 12% and sound intensity by 400% above themaximum standard level when compared to the WHO report of 1999. Conclusion. Environmental noise contributes to prematurehearing loss and potentiates systemic diseases among Lebanese.
1. Introduction
The unrecognized effects of persistent exposure to environ-mental noise on health and hearing and the unexplored non-specific responses to noise pollution in Beirut, Lebanon, werethe focus of this study. Literature [1] reports have identifiedexcessive external noise and smoking as a major cause ofhearing loss and impairment among children and youngadults. The nonmodifiable contributing risk factors are listedas age, genetic trends, male gender, and race. Modifiablefactors are voluntary exposure to loud music, smoking,sports, diet, dental hygiene, and systemic diseases [1, 2].
The city of Beirut is a metropolitan and multiculturalvenue with high-rise buildings erected to replace tradi-tional one-family dwelling and occupy a vast portion ofthe Mediterranean shores in condensed populated areas.The environmental noise associated with ongoing powergenerators and construction sites begins at dawn and contin-
ues through the night as honking cars and motorcycles zigzagthrough crowded narrow streets. There is no escape fromnoise since commercial and residential zones are adjacentin close proximity where people live above the shops andbusinesses. Incessant honking is an expression of frustrationwhen narrow streets are blocked by parked cars on both sidesand fruit venders at each intersection.
In a surveyed community response to noise in Beirut,Lebanon [2], participants identified the main sources asmotorcycles (70.4%), traffic (63.1%), and car horns (56.3%).Reported construction and generator annoyance were 42%and 55.1%, respectively. This study aims to identify thecurrent level of persistent environmental noise effect onhearing and overall health among Lebanese living andworking on Hamra in Beirut, Lebanon.
In a study of 440 local residents of Beirut, ages 21–50,researchers examined the effects of environmental noise andsmoking on hearing loss [2]. They divided the participants

2 Journal of Environmental and Public Health
into 4 groups of smokers and nonsmokers living in noisy(70–90 dBA) and quiet areas (45–55 dBA) and found hearingloss among the smokers when exposed to 8000 Hz at highfrequencies and more hearing impairment among smokersabove age 40+. Younger nonsmokers (21–39) showed signifi-cant hearing impairment at low frequencies.
Environmental noise and health were found [3] closelyrelated when researchers assesses 105 adults living nearAuckland International Airport in New Zealand for noisesensitivity and annoyance for any adverse health effects.They identified that noise contributed to sleep disturbanceand reduced health-related quality of life. Similarly, 2,312people living near Frankfurt Airport [4] were given envi-ronmental (EQoL) and health-related (HQoL) quality of lifeinstruments to assess their experiences with aircraft noiseannoyance and disturbances to their life quality. Researcherscompared their findings from aircraft noise with exposureto road traffic and railway noise, and results suggested arecursive relationship between noise and health.
Numerous empirical studies have identified long-termexposure to noise as a major health concern. Noise fromsiren or ambulance can generate an immediate protectivereaction known as fight or flight. In a substantial review [5]traffic noise effects were found as a source of environmentalannoyance. Referencing the Environmental Expert Council(EEC) of Germany, noise was reported as a major sourceof severe annoyance and distress. The fastest and mosturgent signal to noise is mediated by a subcortical area onamygdala. Even during sleep, the environmental noise fromairplanes or heavy equipments can generate dangerous brainsignals to release stress hormones. The chronic release ofstress hormone from long-term exposure to environmentalnoise increases the endogenous risk factors such as ischemicheart disease and myocardial infarction [5]. Because eachindividual study on the adverse health effects of noise inmost cases does not reach statistical significance, meta-analysis of multiple studies [5] according to EEC shows aconsistent trend towards cardiovascular risk when daytimenoise level exceeds 65 dB(A). However, the urgent call forpublic health safety to reduce extra-aural occupational noiseremains misclassified and warnings ignored.
Unprotected and regular exposure to occupational loudnoise in the daytime interferes with nocturnal sleep patterns.Researchers [6] divided 3 groups of 8 subjects (n = 24)and exposed them to continuous noise at >75 dB for 1–2years, 5–10 years, and over 15 years and matched them withcorresponding healthy control groups who worked in a quietenvironment. After using PolySomnoGraphy (PSG) for anall-night sleep study, subjects rated their sleep quality on aVisual Analogue Scale (VAS), and the results showed thatworkers who were exposed to occupational noise had poorquality sleep and over the years adapted to noise. However,the long-term adverse health effects of noise hidden in anadaptive process or subsequent systemic diseases were notinvestigated. Assessing the sleep quality of air travelers andtheir exhaustion level after sleeping on flights may betterreveal brain responses to unrecognized and constant noise.
According to the 1998 WHO report [7], Lebanon oc-cupies 10, 452 square kilometers (Km2) of land strip with a
population of 4.5 million residents. Over 80% of Lebanesereside in crowded urban areas in high-rise buildings. Re-searchers [8] have examined the quality of life in high-risebuildings or controlled built environments (CBE) and foundthem incompatible with the psychological needs of womenand children. The recent social architects place multiplefamilies in one high-rise building, and residents exposed toovercrowding, external loud noise from proximate airportsor railroads, air pollution, toxins, and malodorous sewerare those experiencing nonspecific stress manifested asirritability and aggression similar to patients in hospitals andconvalescent centers or air travelers kept in CBEs such asairports who experience stress.
Farmers using farming equipment are at risk for noise-induced hearing loss [9]. Ninety three industrial farmersbetween the ages of 18–75 were surveyed after completehealth history and demographic data on noise exposure.Their bilateral hearing sensitivity was assessed, using airconduction audiometric testing at 500–800 Hz frequencies.Farmers completed the self-assessment of communication(SAC) hearing handicap scale, and their hearing thresholdwas less than 25 dB HL. Subjects had high-frequency hearingloss, and those older than age 50 had a higher perceivedhearing handicap and damage from external noise. Amongother noise-related health effects researchers [10, 11] haveidentified impaired cognitive abilities as reflects in Table 1,when at various noise levels there is annoyance, speechand sleep interference, reduced work productivity, hearingimpairment, and physiological changes [10–13].
Noise at a certain frequency and decibel is detrimentalto hearing and according to the United States EnvironmentalProtection Agency (USEPA) and World Health Organization(WHO) (see Table 2) outdoor exposure to the environmentalnoise should remain within an acceptable range to avoidhearing loss [10–13]. According to the WHO report pub-lished by the Lebanese Ministry of Environment, the noiselevel in Beirut, Lebanon could have adverse health effects onthe local residents (see Table 3). The physiological effects ofenvironmental noise have been associated with the endocrinechanges [14, 15].
2. Methodology
The purpose of this study was to examine the local per-ceptions on environmental noise levels and how exposureto involuntary and persistent noise affected young Lebanesehealth and hearing. To assess street noise level and its healthand hearing effects, a cross-sectional design was adoptedusing mixed methods and the critical theory of participatoryaction according to Freire [16]. This exploratory and descrip-tive investigation was focused on individual experiences withpersistent noise.
Assured of anonymity and confidentiality participantswillingly engaged in informal dialogues and interviews for30–60 minutes. Interviews took place at various locationsincluding workplace, shops, dormitories, or outdoors. Inter-viewers helped participants recall and explain past andpresent experiences with noise at different peak hours and
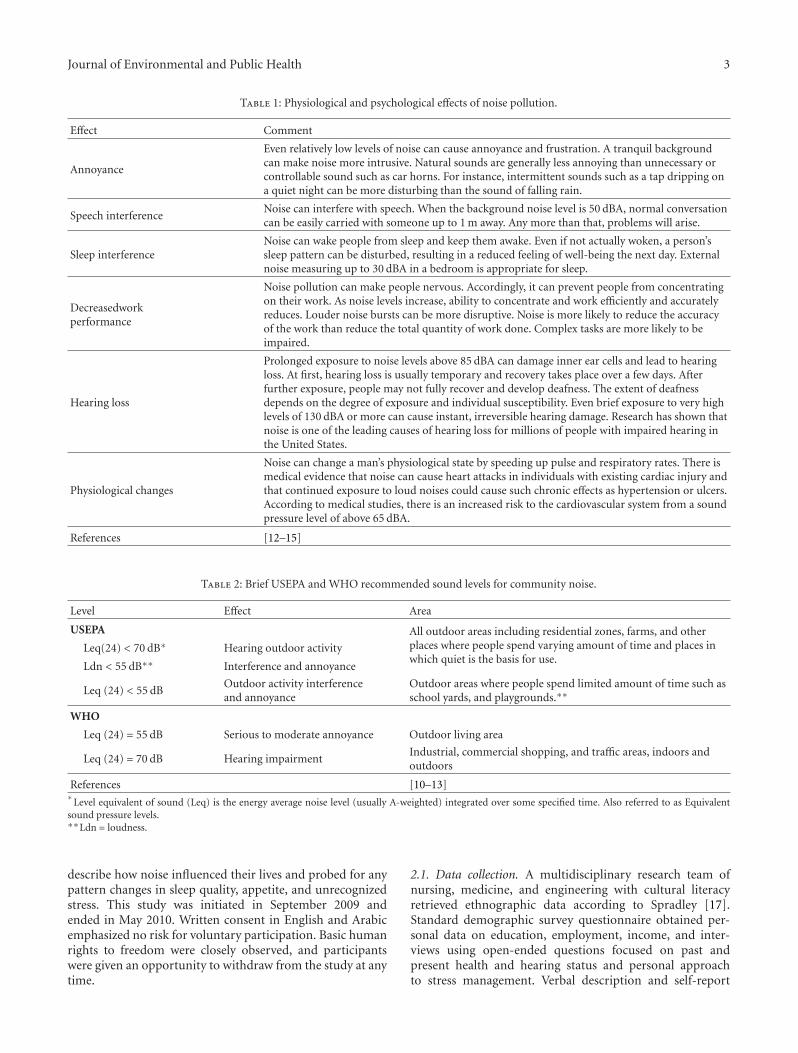
Journal of Environmental and Public Health 3
Table 1: Physiological and psychological effects of noise pollution.
Effect Comment
Annoyance
Even relatively low levels of noise can cause annoyance and frustration. A tranquil backgroundcan make noise more intrusive. Natural sounds are generally less annoying than unnecessary orcontrollable sound such as car horns. For instance, intermittent sounds such as a tap dripping ona quiet night can be more disturbing than the sound of falling rain.
Speech interferenceNoise can interfere with speech. When the background noise level is 50 dBA, normal conversationcan be easily carried with someone up to 1 m away. Any more than that, problems will arise.
Sleep interferenceNoise can wake people from sleep and keep them awake. Even if not actually woken, a person’ssleep pattern can be disturbed, resulting in a reduced feeling of well-being the next day. Externalnoise measuring up to 30 dBA in a bedroom is appropriate for sleep.
Decreasedworkperformance
Noise pollution can make people nervous. Accordingly, it can prevent people from concentratingon their work. As noise levels increase, ability to concentrate and work efficiently and accuratelyreduces. Louder noise bursts can be more disruptive. Noise is more likely to reduce the accuracyof the work than reduce the total quantity of work done. Complex tasks are more likely to beimpaired.
Hearing loss
Prolonged exposure to noise levels above 85 dBA can damage inner ear cells and lead to hearingloss. At first, hearing loss is usually temporary and recovery takes place over a few days. Afterfurther exposure, people may not fully recover and develop deafness. The extent of deafnessdepends on the degree of exposure and individual susceptibility. Even brief exposure to very highlevels of 130 dBA or more can cause instant, irreversible hearing damage. Research has shown thatnoise is one of the leading causes of hearing loss for millions of people with impaired hearing inthe United States.
Physiological changes
Noise can change a man’s physiological state by speeding up pulse and respiratory rates. There ismedical evidence that noise can cause heart attacks in individuals with existing cardiac injury andthat continued exposure to loud noises could cause such chronic effects as hypertension or ulcers.According to medical studies, there is an increased risk to the cardiovascular system from a soundpressure level of above 65 dBA.
References [12–15]
Table 2: Brief USEPA and WHO recommended sound levels for community noise.
Level Effect Area
USEPA All outdoor areas including residential zones, farms, and otherplaces where people spend varying amount of time and places inwhich quiet is the basis for use.
Leq(24) < 70 dB∗ Hearing outdoor activity
Ldn < 55 dB∗∗ Interference and annoyance
Leq (24) < 55 dBOutdoor activity interferenceand annoyance
Outdoor areas where people spend limited amount of time such asschool yards, and playgrounds.∗∗
WHO
Leq (24) = 55 dB Serious to moderate annoyance Outdoor living area
Leq (24) = 70 dB Hearing impairmentIndustrial, commercial shopping, and traffic areas, indoors andoutdoors
References [10–13]∗
Level equivalent of sound (Leq) is the energy average noise level (usually A-weighted) integrated over some specified time. Also referred to as Equivalentsound pressure levels.∗∗Ldn = loudness.
describe how noise influenced their lives and probed for anypattern changes in sleep quality, appetite, and unrecognizedstress. This study was initiated in September 2009 andended in May 2010. Written consent in English and Arabicemphasized no risk for voluntary participation. Basic humanrights to freedom were closely observed, and participantswere given an opportunity to withdraw from the study at anytime.
2.1. Data collection. A multidisciplinary research team ofnursing, medicine, and engineering with cultural literacyretrieved ethnographic data according to Spradley [17].Standard demographic survey questionnaire obtained per-sonal data on education, employment, income, and inter-views using open-ended questions focused on past andpresent health and hearing status and personal approachto stress management. Verbal description and self-report

4 Journal of Environmental and Public Health
Table 3: 1999 WHO assessment of community noise problem ingreater Beirut area.
Land use Noise standard dBA
Day time∗ Evening time∗∗
Commercial,administrative, ordowntown
55–65 50–60
Residential/commercialcenters on highways
50–60 45–55
City residential areas 45–55 40–50∗
7:00 a.m. to 6:00 p.m., ∗∗6:00 p.m. to 10:00 p.m.Lebanese ambient noise limits for intensity in different land use zones [14,15].
offered valuable personal experiences and concurrentlywere compared with literature. Recorded and expandeddata reached saturation upon two rounds of transcriptionand were analyzed. Further networking with participantsprovided sufficient opportunities for clarification. Data weresafely stored for future reference.
The initial proposal was aimed to include 100 equallydivided men and women, and after randomly approachingresidents and shop keepers on Hamra Streets we could onlyrecruit 83 volunteer adult Lebanese (46 men and 37 women).Researcher and two graduate assistants from nursing admin-istered survey questionnaire and interviewed participantsfor personal experiences with noise. One research assistantfrom engineering measured street noise levels in areas whereparticipants worked and lived. Research team worked inrotations and frequently compared data to match partici-pants with locations for increased data accuracy. Informaland semistructured interviews using open-ended questionshelped retrieve participants’ experiences and perceptionswith noise to identify their ways of coping or adjustingto environmental noise. Participants were offered a smallincentive to compensate for their time and cooperation.Anonymity was assured, and raw data was secured in lockedoffice cabinets.
Demographic data provided age range, the number ofyears working and/or living on premises, income, and ed-ucation level. Interviews helped obtain information onhealth habits such as diet, sleep, and coping techniques.Later, participants were tested for hearing using pure tonescreening to determine hearing impairment or loss. Thestreet noise levels were measured at 4 busy intersections nearparticipant’s home and workplace using sound level meter(SLM).
Our inclusion criteria consisted of Lebanese men andwomen between the ages 18–38 who lived and worked onHamra Street for longer than 6 months. We chose a young-er age group to eliminate age-related hearing loss or impair-ment and health complications associated with advancedage. Because this study was conducted in a metropolitanarea and the majority of people in Beirut are trilingual(Arabic, English, and French) we chose to include people
with basic language literacy (read and write) and unexposedto voluntary noise such as loud music.
2.2. Findings/Results. Data were analyzed through an imme-diate debriefing after each interview and compared withfield notes and visual clues. Data was reviewed line by lineand coded using the four phases of qualitative study byPolit and Hungler [18]. Author’s personal experiences withnoise annoyance verified published literature to substantiatescientific adequacy and data credibility. Verified data werecompiled upon saturation and analysis. The inquiry auditand neutrality were established for dependability and dataconformity. Transferability of the framework was unanimousamong scholarly colleagues and their personal reflections onnoise annoyance.
Researcher and two assistants randomly approachedpeople at various shops, stores, apartment buildings, anddormitories on Hamra Street where residents and shop-keepers often gathered to visit. Consenting participants werelater met at a location of their choosing to be surveyed andinterviewed. On the same day an appointment was madefor each participant to meet individually or as a group forhearing test at the audiology clinic. In three occasions when4-5 participants were waiting for hearing test, focus groupdiscussion was held ranging from 60–90 minutes to exploremore experiences with noise. At other occasions interviewswere held at the store, at home, in dormitory, or outdoors.
Standard demographic data revealed an average age of26.5 for men and 27.3 for women, with mixed educational,income, and employment backgrounds. At interviews partic-ipants were asked to elaborate on their daily experiences withenvironmental noise, and 70% (58) had difficulty sleepingat night, and according to the noise meter results theywere exposed to Leq 12 hr >65 dBA. In support of ourfindings multiple studies [7, 19, 20] have reporting the degreeof annoyance, sleep disturbance, and hearing loss relatedto traffic noise in residential urban communities. Using aquestionnaire on the influence of environmental noise onhealth, researchers [19] sampled 1000 individuals ages 19–80 in a heavy traffic area in Stockholm and found frequentannoyance among 13% of subjects exposed to Leq 24 hr>50 dBA when compared to the 2% who were exposed to<50 dBA. Sleep disturbance were reported by 23% at Leq24 hr >50 dBA and by 13% exposed to <50 dBA. Habituationto noise has been more related to sleep rather than annoy-ance. Annoyance and sleep problems were prevalent amongthose with bedroom windows facing the streets or living inapartments [21].
Most studies on noise report human responses, and fewhave explored coping with constant noise. Our study focusedon finding various forms of coping skills when participantsshared experiences with increased craving for sweets 55%(45), caffeine intake 62% (51), and smoking 78% (65). Morewomen 81% (30) in the study reported frustration, anger,and feeling helpless as an aftereffect of persistent noise. Men93% (43) revealed habituation to noise by unrecognized andlater described techniques such as chewing gums or toothpicks, snacking at work, and managing to sleep at night by

Journal of Environmental and Public Health 5
using other incessant noise such as bathroom fan, radio,and television. Afternoon headaches were common amongwomen 78% (29). The unexpected fear of knowing abouthearing status 96% (80) among men and women revealedthat majority of participants had suspected some hearingimpairment when family members complained about havingto speak louder or repeat themselves.
Literature support identifies imbalance in endocrinesystem linked to emotional disturbance. Researchers [21, 22]remain uncertain about the habituation to stress and positthat repeated exposure to external stimuli can shape adap-tive brain plasticity mechanism in response to homotypicchallenges when cortical auditory processing areas respondto repeated loud noise.
Study limitations were few including low budget funding,time line for project completion per 10 months Fulbrightcontract, long delays for obtaining IRB approval to proceedwith data collection, and participants who were businessowner and could not leave their work to be tested for hearingor feared results.
Participants experienced the physical and emotionaleffects of persistent noise in form of irritability, anger, nau-sea, headache, and sleep disturbances. Men 93% (43) mainlyreported nervous eating, chewing (gum or tooth picks),and both genders 78% (65) smoked to relieve agitating dis-comforts (described as auditory disturbance on an aircraft).Participants showed concerns for recent weight gain 51%(42), hypertension 46% (38), and diabetes 54% (45). Weassessed participant’s hearing, and our measurable indicatorsand output activities were achieved using audiometer puretone testing. We found bilateral hearing sensitivity uponassessment by air-conduction audiometric testing at 500–4000 Hz frequencies. Of those tested 40% (33), there were30% (10) who suffered from asymmetrical high-frequencyhearing loss and impairment.
Street noise levels were measured by sound level meter(SLM) near participant’s home and workplace at 4 inter-sections on Hamra and Bliss streets. We selected similartime frames and durations to match the WHO study of1999 for increased accuracy in comparison. Tabulated andanalyzed data showed an increase in environmental noiselevel between 1999 and 2009. The mean average noisestandard dBA by the WHO report during 7 am to 6 pm was55–65, and in 2010 it was 65–75 with a 12% increase in sounddB and 400% increase in noise intensity (Tables 4 and 5).
3. Discussion
As discovered, Lebanese cope with persistent noise in var-ious forms such as smoking, consuming strong coffee,and sweets. To describe caffeine effects on stress responseassociated with noise, researchers [22] have reported thathigh doses of caffeine, a psychoactive substance, can activatehypothalamus-pituitary-adrenal axis (HPA), and low dosesof caffeine can restrict some of the stress responses by HPAaxis. Also, elevated stress due to loud noise was assessed [23]to find how noise influenced adrenocorticotropic hormone(ACTH) and corticosterone levels in animals with and
Table 4: 2010 assessment of street noise in greater Beirut area.
Land useNoise standard dBA
Morning∗ Noon∗∗ Afternoon∗∗∗
Hamra-1 intersectionnext to Costa Coffee
65–75 65–75 60–70
Hamra-2 intersectionat Red Shoe
65–75 60–70 60–70
Hamra-3 intersectionAbou Taleb at Sadat
65–75 60–70 65–75
Bliss—in front ofPenrose Gate
60–70 60–70 60–70
∗7:00 a.m. to 9 a.m., ∗∗12 p.m. to 2 p.m., ∗∗∗4p.m. to 6 p.m.
Table 5: Lebanese ambient noise limits for intensity in commercialareas.
ComparisonMean average of noise standard
dBA
1999WHO-Study
55–65∗
2010 IFI-Study62-72∗ (12% sound dB and
400% increase in noise intensity)∗
7:00 a.m. to 6:00 p.m.
without caffeine intake. Plasma ACTH and corticosteronelevels peaked 30 minutes after exposure to noise and rapidlydeclined when noise was eliminated. Then low-dose caffeineat 2 mg/kg was injected to find a significant increase in plas-ma corticosterone and ACTH levels within 30 minutes andreturn to baseline after 60 minutes. When higher doses ofcaffeine (30 mg/kg and higher) were injected, the hormonelevels increased and lasted for at least 2 hours in response toloud noise.
In this study participants experienced various noise-related physical responses. Researchers [6, 22, 23] showedperceived threat from loud noise on HPA axis and therelease of ACTH as corticosterone. Exposure to noise atnight in acoustic chambers using various intensities showedelevated plasma ACTH and corticosterone at 85 dBA. Manyregions of the brain showed negative response to noise dueto audiogenic stress which provoked HPA axis with life-threatening responses.
We found participants expressing rage and frustrationby honking and shouting when they could not controlnoise exposure. Similarly, an investigation [24] of 10 healthyhuman volunteers who were exposed to loud noise at 100 dBunder controllable and uncontrollable conditions on twoseparate days revealed noteworthy results. Participants self-rated their responses, and both groups reported a highersense of helplessness, lack of control, tension, stress, unhap-piness, anxiety, and depression. There was a greater HPA axisresponse higher plasma adrenocorticotropic hormone levelsand increased levels of sympathetic nervous system electro-dermal activity among those exposed to uncontrollable noise[22–24]. Therefore, losing control over aversive stimulus cannegatively affect mood and overall health.
6 Journal of Environmental and Public Health
This study with literature support highlights manyaspects of noise influence on health. The long-term exposureto the environmental noise can pose a threat to health bytriggering responses from neuroendocrine and autonomicnervous system.
4. Conclusion
In a nonspecific and unrecognized way, noise can generate anunsettling level of stress with profound influence on generalhealth. Upon our initial approach, Lebanese seemed fullyaware and yet resigned toward noise problem. Commonthread for adaptation to noise in this study was reported as aseries of unhealthy habits and public expression of anger andrage by shouting and honking. Noise and uninvited sounds[25] adversely influence physical and psychological health.Lebanese men and women exposed to chronic noise andtested showed hearing loss at high frequency range, and thosewho could not attend testing sessions due to long work hoursexpressed fear of hearing impairment according to familymembers’ complaints for having to speak louder or repeatthemselves.
In the United States, nearly 10 million adults and5.2 million children suffer from irreversible noise-relatedhearing impairment, and 30 millions are at risk for dailyexposure to dangerous levels of noise. The noise-relatedhealth effects are often ignored and yet significant such ashypertension, tachycardia and elevated cortisol levels, andstress [9, 12, 24].
Finally, our results showed that environmental sound dBhad increased by 12% and sound intensity by 400% above themaximum standard level when compared to the WHO reportof 1999 which confirms noise as an increasingly recognizedglobal problem with consequential effects on life quality. Thisstudy was an attempt to bring awareness to how noise couldaffect hearing and over time influence daily behavior leadingto systemic diseases. Although this study included seeminglyhealthy young adults (ages 18–38), we still found them at riskfor non-age-related hearing loss. Potential for temporary orpermanent loss of hearing among children and young adultswarrants greater focus on public education and awareness onnoise hazards.
Acknowledgments
This study was funded by an educational grant from IsaamFares Institute, an entity established to support Public Policyand International Affairs and an affiliate of the AmericanUniversity of Beirut in Lebanon. Credit and gratitude areextended to the research team members Dr. Marc K. Bassim,Co-PI, Faculty of Medicine, Dr. Maya Abou Zeid, Co-PI,Faculty of Transportation Engineering, Mrs. Mary Arevian,Co-PI and our graduate research assistants, Fatima Diranyand Rasha Shehadi in nursing and Sherif Maktabi fromEngineering. Our deepest gratitude is offered to DeanH.A.S. Huijer at HSON for her administrative support andencouragements and to Mr. Rami Khuri, Director of theIsaam Fares Institute, and his excellent team.
References
[1] E. El Zir, S. Mansour, P. Salameh, and R. Chahine, “Environ-mental noise in Beirut, smoking and age are combined riskfactors for hearing impairment,” Eastern Mediterranean HealthJournal, vol. 14, no. 4, pp. 888–896, 2008.
[2] S. I. Korfali and M. Massoud, “Assessment of community noiseproblem in Greater Beirut Area, Lebanon,” EnvironmentalMonitoring and Assessment, vol. 84, no. 3, pp. 203–218, 2003.
[3] D. Shepherd, D. Welch, K. N. Dirks, and R. Mathews, “Explor-ing the relationship between noise sensitivity, annoyance andhealth-related quality of life in a sample of adults exposed toenvironmental noise,” International Journal of EnvironmentalResearch and Public Health, vol. 7, no. 10, pp. 3579–3594, 2010.
[4] D. Schreckenberg, M. Meis, C. Kahl, C. Peschel, and T. Eik-mann, “Aircraft noise and quality of life around frankfurtairport,” International Journal of Environmental Research andPublic Health, vol. 7, no. 9, pp. 3382–3405, 2010.
[5] H. Ising and B. Kruppa, “Health effects caused by noise: ev-idence in the literature from the past 25 years,” Noise andHealth, vol. 6, no. 22, pp. 5–13, 2004.
[6] B. Gitanjali and R. Dhamodharan, “Effect of occupationalnoise on the nocturnal sleep architecture of healthy subjects,”Indian Journal of Physiology and Pharmacology, vol. 48, no. 1,pp. 65–72, 2004.
[7] WHO (World Health Organization), Averting the Three Out-riders of the Transport Apocalypse: Road Accidents, Air andNoise Pollution, Press Release WHO/57, Geneva, Switzerland,1998.
[8] G. W. Evans, “The Built Environment and Mental Health,”Journal of Urban Health, vol. 80, no. 4, pp. 536–555, 2003.
[9] M. Stewart, J. Scherer, and M. E. Lehman, “Perceived effects ofhigh frequency hearing loss in a farming population,” Journalof the American Academy of Audiology, vol. 14, no. 2, pp. 100–108, 2003.
[10] A. L. Bronzaft, “The effect of a noise abatement program onreading ability,” Journal of Environmental Psychology, vol. 1,no. 3, pp. 215–222, 1981.
[11] USEPA (United States Environmental Protection Agency),Noise Effects Handbook, USEPA, Office of Noise Abatementand Control, EPA 500-9-82-106, 1981.
[12] W. Babish, “Epidemiological studies of cardiovascular effectsof noise,” in Advances in Noise, Biological Effects, D. Prasherand I. Luxon, Eds., vol. 1, pp. 312–327, Whurr Publishers,1998.
[13] USEPA (United States Environmental Protection Agency),“Information on Levels of Environmental Noise requisite toProtect Public Health and Welfare with an adequate Margin ofSafety,” EPA/ONAC 550/9-74-004, 1974.
[14] WHO (World Health Organization), Guidelines for Commu-nity Noise, WHO-Expert Task Force Meeting, London, UK,1999.
[15] Lebanese MOE (Ministry of Environment), Resolution No.1/52, Official Gazette issue No. 45, 12/9/1996, 1996.
[16] P. Freire, Pedagogy of the Oppressed, M. B. Ramos translation,Continuum, New York, NY, USA, 1999.
[17] J. P. Spradley, The Ethnographic Interview, Harcourt BraceJovanovich College Publishers, Fort Worth, Tex, USA, 1979.
[18] D. F. Polit and B. P. Hungler, Nursing Research: Principlesand Methods, Lippincott Williams & Wilkins, Philadelphia, Pa,USA, 6th edition, 1999.
[19] G. Bluhm, E. Nordling, and N. Berglind, “Road trafficnoise and annoyance—an increasing environmental healthproblem,” Noise and Health, vol. 6, no. 24, pp. 43–49, 2004.
Journal of Environmental and Public Health 7
[20] E. Daniel, “Noise and hearing loss: a review,” Journal of SchoolHealth, vol. 77, no. 5, pp. 225–231, 2007.
[21] H. E. W. Day, C. V. Masini, and S. Campeau, “Reversibleinactivation of the auditory thalamus disrupts HPA axishabituation to repeated loud noise stress exposures,” BrainResearch, vol. 1276, pp. 123–130, 2009.
[22] M. D. Patz, H. E. W. Day, A. Burow, and S. Campeau, “Mod-ulation of the hypothalamo-pituitary-adrenocortical axis bycaffeine,” Psychoneuroendocrinology, vol. 31, no. 4, pp. 493–500, 2006.
[23] A. Burow, H. E. W. Day, and S. Campeau, “A detailed char-acterization of loud noise stress: intensity analysis of hypo-thalamo-pituitary-adrenocortical axis and brain activation,”Brain Research, vol. 1062, no. 1-2, pp. 63–73, 2005.
[24] A. Breier, M. Albus, D. Pickar, T. P. Zahn, O. M. Wolkowitz,and S. M. Paul, “Controllable and uncontrollable stressin humans: alterations in mood and neuroendocrine andpsychophysiological function,” American Journal of Psychiatry,vol. 144, no. 11, pp. 1419–1425, 1987.
[25] M. D. Seidman and R. T. Standring, “Noise and quality of life,”International Journal of Environmental Research and PublicHealth, vol. 7, no. 10, pp. 3730–3738, 2010.