environmental impact assessment study for sai o …
TRANSCRIPT
TOLO HARBOUR SEWERAGE OF UNSEWERED AREAS STAGE 2 – INVESTIGATION, DESIGN AND CONSTRUCTION
REVIEW OF HAZARD TO LIFE IMPACT FROM MOSWTW
Prepared by
Ramboll Hong Kong Limited
ENVIRONMENTAL IMPACT ASSESSMENT STUDY FOR SAI O TRUNK SEWER SEWAGE PUMPING STATION
APPENDIX 9.2REVIEW OF HAZARD TO LIFE IMPACT FROM MOSWTW

TOLO HARBOUR SEWERAGE OF UNSEWERED AREAS STAGE 2 – INVESTIGATION, DESIGN AND CONSTRUCTION
REVIEW OF HAZARD TO LIFE IMPACT FROM MOSWTW
Date 12 January 2021
Prepared by
Signed
Amy Ho
Engineer
Approved by
Signed
Henry Ng
Principal Consultant
Project Reference SHKSAISAE01
Document No. App 9.2 EIA_Sai O SPS_MOSWTW_Issue04_R6851 V2.0.docx
No part of this document may be reproduced or transmitted, in any form or by any means electronic, mechanical, photographic, recording or otherwise, or stored in a retrieval system of any nature without the written permission of Ramboll Hong Kong Ltd, application for which shall be made to Ramboll Hong Kong Ltd, 21/F, BEA Harbour View Centre, 56 Gloucester Road, Wan Chai, Hong Kong. Disclaimer: This report is made on behalf of Ramboll Hong Kong Ltd. No individual is personally liable in connection with the preparation of this report. By receiving this report and acting on it, the client or any third party relying on it accepts that no individual is personally liable in contract, tort or breach of statutory duty (including negligence).
Ramboll Hong Kong Limited
21/F, BEA Harbour View Centre 56 Gloucester Road, Wan Chai, Hong Kong
Tel: (852) 3465 2888 Fax: (852) 3465 2899 Email: [email protected]
Q:\Projects\SHKSAISAEI01\04 Deliverables\14 QRA Sai O SPS EIA\R6851 V2.0\App 9.2 chlorine\App 9.2 EIA_Sai O SPS_MOSWTW_Issue04_R6851 V2.0.docx

ENVIRONMENTAL IMPACT ASSESSMENT STUDY FOR SAI O TRUNK SEWER SEWAGE PUMPING STATION
REVIEW OF HAZARD TO LIFE IMPACT FROM MOSWTW
Table of Content
1. Introduction ............................................................................................ 1-1
1.1 Background ............................................................................................. 1-1
1.2 Report Scope and Objectives ..................................................................... 1-1
1.3 Study Approach ....................................................................................... 1-2
1.4 Risk Acceptance Criteria ............................................................................ 1-2
1.5 Review of Previous Hazard Assessment of MOSWTW ..................................... 1-2
1.6 Cases to be Considered ............................................................................. 1-3
2. Description of MOSWTW ............................................................................ 2-1
2.1 Location .................................................................................................. 2-1
2.2 Operation Data ........................................................................................ 2-1
2.3 Review of Current Status of MOSWTW ........................................................ 2-1
3. Project Data ............................................................................................ 3-1
3.1 Population Data ....................................................................................... 3-1
3.2 Meteorological Information ........................................................................ 3-3
4. Hazard Identification and Frequency Assessment ......................................... 4-1
4.1 Chlorine Release Scenarios from Previous Assessment .................................. 4-1
5. Consequence Assessment ......................................................................... 5-1
5.1 Overview................................................................................................. 5-1
5.2 Gas Dispersion and LD Contours ................................................................ 5-1
6. Risk Assessment ...................................................................................... 6-1
6.1 Risk Summation ....................................................................................... 6-1
6.2 Results of Individual Risk .......................................................................... 6-1
6.3 Results of Societal Risk ............................................................................. 6-1
7. Conclusion............................................................................................... 7-1
8. References .............................................................................................. 8-1
List of Tables
Table 1 Operation Data of MOSWTW ............................................................ 2-1
Table 2 Different Time Periods and Distributions ............................................ 3-1
Table 3 Population of Proposed Sewage Pumping Station ................................ 3-2
Table 4 Statistic of Frequencies of Different Weather Categories ...................... 3-3
Table 5 Day Time Statistic of Frequencies of Different Weather Categories ........ 3-3
Table 6 Night Time Statistic of Frequencies of Different Weather Categories ...... 3-4
Table 7 F-N Data of Project Site Only ........................................................... 6-2
Table 8 Combined Societal Risks .................................................................. 6-3

ENVIRONMENTAL IMPACT ASSESSMENT STUDY FOR SAI O TRUNK SEWER SEWAGE PUMPING STATION
REVIEW OF HAZARD TO LIFE IMPACT FROM MOSWTW
List of Figures
Figure 1 Location of the Project Site
Figure 2 Societal Risk Guideline (EIAO-TM)
Figure 3 Individual Risk of MOSWTW
Figure 4 Societal Risks of Project Site Only
Figure 5 Combined Societal Risk (Construction Case 2022)
Figure 6 Combined Societal Risk (Operation Case 2025)
List of Annex
Annex A Summary of Hazard Scenarios and Frequencies
Annex B Consequence Results from HA2018
Annex C Illustration of LD Contours
Annex D Example of Risk Summation Calculation
ENVIRONMENTAL IMPACT ASSESSMENT STUDY FOR SAI O TRUNK SEWER SEWAGE PUMPING STATION
REVIEW OF HAZARD TO LIFE IMPACT FROM MOSWTW
1-1
1. Introduction
1.1 Background
A new sewage pumping station, the Sai O Trunk Sewer Sewage Pumping Station (hereafter
referred to as the "Project") is proposed at the north of Sai O near Nai Chung, with a capacity
of about 20,600m3 per day for coping with the sewerage needs of both existing and future
developments. The Project is part of Public Works Programme Item 4125DS – Tolo Harbour
Sewerage of Unsewered Areas, Stage II, which originates from the findings of the Study
"Review of North District and Tolo Harbour Sewerage Master Plan" completed in 2002. The
location of the proposed development is shown in Figure 1.
The Project consists of Designated Project (DP) under Item F3, Part I, Schedule 2 of the
Environmental Impact Assessment Ordinance (EIAO). An application for an Environmental
Impact Assessment (EIA) Study Brief under section 5(1)(a) of the EIAO was made to
Environmental Protection Department (EPD) and the EIA Study Brief No. ESB-281 /2014
issued under the EIAO. According to the Study Brief, the proposed sewage pumping station
falls within the 1km Potentially Hazardous Installation (PHI) Consultation Zone of Ma On
Shan Water Treatment Works (MOSWTW). A study is required to review the risks from
MOSWTW to the Project, in order to determine if risk to life is a key issue with respect to
the Hong Kong Risk Guidelines.
1.2 Report Scope and Objectives
This Hazard Assessment (HA) presents the analyses and findings in reviewing the risks of
the Project in its construction and operation periods. This HA aims to achieve the objectives
as set out in Section 3.4.5 of the EIA Study Brief:
“3.4.5 Hazard to Life
3.4.5.1 The Applicant shall follow the criteria for evaluating hazard to life as stated in
Annex 4 of the TM.
3.4.5.3 The proposed works also falls within the 1km Potentially Hazardous Installation
(PHI) Consultation Zone of Ma On Shan Water Treatment Works (MOSWTW). The
Applicant shall conduct a review of the risks from MOSWTW to the Project and assess if
risk to life is a key issue with respect to Hong Kong Risk Guidelines given in Annex 4 of
the EIAO-TM. Hazard assessment including a Quantitative Risk Assessment (QRA) for
MOSWTW shall be conducted if, and only if, risk to life is a key issue· with respect to Hong
Kong Risk Guidelines following the requirements in Section 12.1 of EIAO-TM. If a QRA for
MOSWTW is required, the detailed technical requirements shall follow Appendix G.”
Appendix G of the EIA Study Brief:
1. “The Applicant shall investigate methods to eliminate and/or minimize risks from
town gas/chlorine. The Applicant shall carry out hazard assessment to evaluate
potential hazard to life during construction and operation stages of the Project. The
hazard assessment shall include but not limited to the following:

ENVIRONMENTAL IMPACT ASSESSMENT STUDY FOR SAI O TRUNK SEWER SEWAGE PUMPING STATION
REVIEW OF HAZARD TO LIFE IMPACT FROM MOSWTW
1-2
i. Identify hazardous scenarios associated with town gas/chlorine, and then
determine a set of relevant scenarios to be included in a Quantitative Risk
Assessment (QRA);
ii. Execute a QRA of the set of hazardous scenarios determined in (i), expressing
population risks in both individual and societal terms;
iii. Compare individual and societal risks with the criteria for evaluating hazard to life
stipulated in Annex 4 of the TM; and
iv. Identify and assess practicable and cost-effective risk mitigation measures.
2. The methodology to be used in the hazard assessment should be consistent with
previous studies having similar issues.”
1.3 Study Approach
This paper evaluates the risks of MOSWTW to the Project by reviewing the previous hazard
assessments of the MOSWTW. Hence, the previous hazard assessment’s hazard scenarios,
frequency assessments and consequence assessments are directly adopted in this study.
Finally, the risk levels of the Project posed by the MOSWTW is evaluated by a risk summation
and compared with the risk criteria.
1.4 Risk Acceptance Criteria
As stipulated in Annex 4 of the EIAO-TM, the risk guidelines comprise two measures shown
as follows:
i. Individual Risk: the maximum level of off-site individual risk should not exceed 1 x
10-5 / year, i.e. 1 in 100,000 per year.
ii. Societal Risk: it can be presented graphically as in Figure 2. The Societal Risk
Guideline is expressed in terms of lines plotting the frequency (F) of N or more fatalities
in the population from accidents at the facility of concern. There are three regions as
described below:
• Acceptable where the risk is so low that no action is necessary;
• Unacceptable where the risk is high enough that it should be reduced regardless
of the cost or else the project of concern should not proceed; and
• ALARP (As Low As Reasonably Practicable) where the risk associated with the
facility of concern should be reduced to a level “as low as reasonably practicable”,
in which the priority of measures is established on the basis of practicality and cost
to implement versus the risk reduction achieved.
1.5 Review of Previous Hazard Assessment of MOSWTW
The previous hazard assessment that studies the potential risks associated with the
MOSWTW is the “Final report of Hazard Assessment on Ma On Shan Water Treatment Works”
[1] (hereafter as HA2018).
Since HA2018 is the most recently approved hazard assessment of the MOSWTW, the
methodologies of HA2018 will form the basis when reviewing the risks in the current study.
The methodology adopted in the 2001 Reassessment Reports [1] will also be used as a

ENVIRONMENTAL IMPACT ASSESSMENT STUDY FOR SAI O TRUNK SEWER SEWAGE PUMPING STATION
REVIEW OF HAZARD TO LIFE IMPACT FROM MOSWTW
1-3
reference as the reports are the latest methodology commonly accepted for assessing a
Water Treatment Works.
1.6 Cases to be Considered
As the main objective of this hazard assessment is to review the risks from the MOSWTW to
the Project, two cases will be considered to demonstrate the changes in risk level induced
by the Project as below. Based on current information, the construction of the Sai O SPS
will commence in 2022 and operation year will be in 2024. To be conservative, the operation
assessment year is taken as 2025.
Construction case (2022) – to assess the risks due to the presence of construction workers
within the site; and
Operation case (2025) – to assess the risks due to the presence of the proposed pumping
station.

ENVIRONMENTAL IMPACT ASSESSMENT STUDY FOR SAI O TRUNK SEWER SEWAGE PUMPING STATION
REVIEW OF HAZARD TO LIFE IMPACT FROM MOSWTW
2-1
2. Description of MOSWTW
2.1 Location
MOSWTW is located between two ridges to the southeast and northwest directions. The
elevation of the ridges is up to 150 mPD and higher. The local topographic feature acts as a
natural barrier to prevent discharge of chlorine cloud in case of leak incidents. Moreover,
extensive vegetation coverage helps to stop dispersion of chlorine further downstream.
Facilities relevant to chlorine transport, storage and use include:
• Chlorine building is equipped with a single-pass scrubber system, mechanical
ventilation system, chlorination facilities and chlorine store.
• 500m of internal access road provides access to the chlorine store for delivery of
chlorine stock.
2.2 Operation Data
The operation data are extracted from HA2018 [1] and summarized in Table 1 below.
Table 1 Operation Data of MOSWTW
Parameter Value
Maximum design throughput 227 MLD
Designed chlorine dosage 2.68 mg/L
Average chlorine dosage 3.58 mg/L
Type of container in use 1 tonne drum
Maximum storage quantity 59 drums
Maximum number of drums per delivery 6 drums per truck
Scrubber system Single pass
Length of onsite chlorine delivery route 0.5km
2.3 Review of Current Status of MOSWTW
It is understood the MOSWTW is undergoing a modification work for the installation of an
on-site chlorine generation (OSCG) system, which is anticipated to be completed by end
2021. With that new technology, chlorine gas can be generated on-site according to the
demand for consumption. With removal of the bulk storage of the liquid chlorine upon
satisfactory installation of OSCG system, the risks associated with the existing operation of
the MOSWTW would be avoided.
Since the OSCG system is not yet completed and the future arrangement of the storage of
liquid chlorine is yet unknown, as a conservative approach for the purpose of this EIA study,
a hazard review was conducted considering the worst-case scenario that the operation
conditions of MOSWTW adopted in HA2018 remains unchanged during the construction and
operation of the Project. The assumptions, failure cases, frequencies and consequences
adopted in HA2018 is used as the basis in this study.
The results of hazard review are presented in this report.

ENVIRONMENTAL IMPACT ASSESSMENT STUDY FOR SAI O TRUNK SEWER SEWAGE PUMPING STATION
REVIEW OF HAZARD TO LIFE IMPACT FROM MOSWTW
3-1
3. Project Data
3.1 Population Data
3.1.1 The Proposed Sewage Pumping Station
As per the information given by the Project team, the construction of the Project would
commence around 2022 and the Project will come into operation around 2024. To be
conservative, the operation assessment year is taken as 2025. For construction, a
conservative number of 30 people (including engineers and construction workers) in day
time is assumed. The proposed sewage pumping station will be an unmanned station during
operation. Regular maintenance is assumed to be carried out twice a year and about 8 staff
will be involved in maintenance. For simplicity, it is conservatively assumed that the
maintenance team is present in the pumping station in the day time for the whole year
similar to construction workers.
The population of the proposed sewage pumping station in the construction and operation
phase are summarized in Table 3. In this assessment, it is assumed the populations of the
proposed sewage pumping station are at a height of 1m.
3.1.2 Temporal Variation
In order to reflect the temporal changes in the population within a week, the population data
is presented in different time modes. HA2018 recommended to adopt 5 time modes to
present the population data similar to the 2001 Reassessment Reports [2]. The time modes
are “peak”, “jammed peak”, “working day”, “weekend day” and “night”. Their distribution is
listed in Table 2 below.
Table 2 Different Time Periods and Distributions
Time Period Mon – Fri Sat Sun % Distribution
Peak 18.75 hr 3.75 hr 0 hr 13.39%
Jammed Peak 1.25 hr 0.25 hr 0 hr 0.89%
Working Day 40 hr 4 hr 0 hr 26.19%
Weekend Day 0 hr 4 hr 12 hr 9.52%
Night 60 hr 12 hr 12 hr 50.00%
The temporal changes of the construction workers and maintenance staff of the proposed
sewage pumping station are provided in Table 3.

ENVIRONMENTAL IMPACT ASSESSMENT STUDY FOR SAI O TRUNK SEWER SEWAGE PUMPING STATION
REVIEW OF HAZARD TO LIFE IMPACT FROM MOSWTW
3-2
Table 3 Population of Proposed Sewage Pumping Station
ID Description Type of
Building /
Site
Population Height (m) Night Jammed Peak Peak Weekend Day Working Day Indoor Ratio Vulnerability
Factor
PD1 Construction Worker Construction
Site
30 1 0% 100% 100% 50% 100% 0% 1
PD2 Pumping Station Maintenance Staff Construction
Site
8 1 0% 100% 100% 50% 100% 0% 1

ENVIRONMENTAL IMPACT ASSESSMENT STUDY FOR SAI O TRUNK SEWER SEWAGE PUMPING STATION
REVIEW OF HAZARD TO LIFE IMPACT FROM MOSWTW
3-3
3.2 Meteorological Information
The meteorological conditions affect the consequence of release and hence risk outcomes,
in particular the wind direction, speed and stability, which influences the direction and
degree of turbulence of gas dispersion. Meteorological data from the Hong Kong
Observatory Sha Tin weather station was adopted in HA2018. For consistency, the same
set of meteorological data as tabulated in Table 4 is adopted in this study.
Table 4 Statistic of Frequencies of Different Weather Categories
Direction
Day Time Night Time Total
B2 C4 D3 D3 E3 F1.5
15-44 0.0452 0.0181 0.0207 0.0262 0.016 0.0355 0.1617
45-74 0.0353 0.0175 0.0227 0.0328 0.0189 0.0363 0.1635
75-104 0.0288 0.0171 0.0184 0.0261 0.0149 0.0375 0.1428
105-134 0.0237 0.0175 0.0139 0.0176 0.0126 0.0249 0.1102
135-164 0.0115 0.0069 0.0068 0.005 0.0031 0.0111 0.0444
165-194 0.0081 0.0048 0.0047 0.0022 0.003 0.0159 0.0387
195-224 0.0159 0.0141 0.0151 0.0094 0.0079 0.0345 0.0969
225-254 0.0097 0.02 0.0234 0.0136 0.0151 0.031 0.1128
255-284 0.0014 0.0021 0.0027 0.0012 0.0014 0.0092 0.018
285-314 0.0012 0.0002 0.0011 0.0008 0.0001 0.0082 0.0116
315-344 0.0022 0.0017 0.0039 0.0051 0.002 0.0116 0.0265
345-14 0.01 0.0055 0.0113 0.0175 0.0071 0.0219 0.0733
All 0.193 0.1255 0.1447 0.1575 0.1021 0.2776 1.0004
To facilitate the calculation, the frequencies are further divided into day time and night
time by normalizing each frequency using the sum of frequencies in day and night as
shown in the tables below.
Table 5 Day Time Statistic of Frequencies of Different Weather Categories
Direction
Day Time Total
B2 C4 D3
15-44 0.0976 0.0391 0.0447 0.1813
45-74 0.0762 0.0378 0.0490 0.1630
75-104 0.0622 0.0369 0.0397 0.1388
105-134 0.0512 0.0378 0.0300 0.1190
135-164 0.0248 0.0149 0.0147 0.0544
165-194 0.0175 0.0104 0.0101 0.0380

ENVIRONMENTAL IMPACT ASSESSMENT STUDY FOR SAI O TRUNK SEWER SEWAGE PUMPING STATION
REVIEW OF HAZARD TO LIFE IMPACT FROM MOSWTW
3-4
Direction
Day Time Total
B2 C4 D3
195-224 0.0343 0.0304 0.0326 0.0974
225-254 0.0209 0.0432 0.0505 0.1146
255-284 0.0030 0.0045 0.0058 0.0134
285-314 0.0026 0.0004 0.0024 0.0054
315-344 0.0047 0.0037 0.0084 0.0168
345-14 0.0216 0.0119 0.0244 0.0579
All 0.4167 0.2709 0.3124 1.000
Table 6 Night Time Statistic of Frequencies of Different Weather Categories
Direction
Night Time Total
D3 E3 F1.5
15-44 0.0488 0.0298 0.0661 0.1446
45-74 0.0611 0.0352 0.0676 0.1638
75-104 0.0486 0.0277 0.0698 0.1461
105-134 0.0328 0.0235 0.0464 0.1026
135-164 0.0093 0.0058 0.0207 0.0357
165-194 0.0041 0.0056 0.0296 0.0393
195-224 0.0175 0.0147 0.0642 0.0964
225-254 0.0253 0.0281 0.0577 0.1111
255-284 0.0022 0.0026 0.0171 0.0220
285-314 0.0015 0.0002 0.0153 0.0169
315-344 0.0095 0.0037 0.0216 0.0348
345-14 0.0326 0.0132 0.0408 0.0866
All 0.2932 0.1901 0.5168 1.000

ENVIRONMENTAL IMPACT ASSESSMENT STUDY FOR SAI O TRUNK SEWER SEWAGE PUMPING STATION
REVIEW OF HAZARD TO LIFE IMPACT FROM MOSWTW
4-1
4. Hazard Identification and Frequency Assessment
4.1 Chlorine Release Scenarios from Previous Assessment
Internal release and external release scenarios were considered in HA2018. Internal
release cases are the releases of chlorine to the atmosphere through the scrubber and
ventilation systems within the chlorine storage building. Since the second containment
based on a “Contain and Absorb System” is available, the release rates to the surrounding
environment can be reduced.
External release cases are referred to the releases directly from the chlorine drums either
due to car accidents on the access road or due to earthquake and aircraft crash.
The frequencies of release scenarios were estimated from historical failure data of on-
site transport, storage and use of chlorine of the Water Treatment Works in Hong Kong.
As mentioned in Section 2.3, the operation conditions of MOSWTW adopted in HA2018
is assumed remaining unchanged as worse-case consideration. The chlorine release
scenarios as well as the event frequencies in HA2018 are directly adopted in this hazard
review. The release scenarios and the corresponding frequencies are summarized in
Annex B.

ENVIRONMENTAL IMPACT ASSESSMENT STUDY FOR SAI O TRUNK SEWER SEWAGE PUMPING STATION
REVIEW OF HAZARD TO LIFE IMPACT FROM MOSWTW
5-1
5. Consequence Assessment
5.1 Overview
The dispersion of chlorine in HA2018 was based on a software package “WHAZAN” (World
Bank Hazard Analysis), which is a computer model for predicting dense cloud dispersion.
The results of consequence modelling data were available in form of Lethal Dose (LD)
LD03, LD50 and LD95 contours. The contours were presented by the maximum downwind
and crosswind distances.
Factors including escape probability, effective fatality probability and chlorine cloud
height are considered in the consequence assessment. Since the model is a flat terrain
model, topographical effects are not taken into account.
5.2 Gas Dispersion and LD Contours
5.2.1 LD Contours
LD contours for outdoor population of fatality probability of LD03, LD50 and LD95 were
predicted using WHAZAN in HA2018. The maximum downwind and crosswind distances
are extracted from the previous reports and reproduced in Annex C. The consequence
data will be directly used in this hazard assessment to evaluate the change of risks as a
result of the presence of the proposed sewage pumping station.
5.2.2 Release Locations
Following HA2018, the chlorine release location is assumed at the centre of chlorine store
and is set at 844600, 831828 in HK Grid at an elevation of 32mPD.
5.2.3 Wind Directions
12 wind directions are used in HA2018 as the minimum number of wind directions. For
“wind smoothing” purpose, the cloud dispersion contours are rotated every 10o in wind
direction using the closest wind direction contour through rotational transformation.
Depending on the smoothness of individual risk contours in the verification exercise, a
smaller wind rotation angle may be adopted for satisfactory output.
5.2.4 Rationalization of LD Contours
In this study, the main purpose is to review whether the risk to the Project posed by the
MOSWTW is a major concern.
Since the Project Site is around 760m from the assumed chlorine release location of
MOSWTW. By referring to the downwind distance of the LD contours in Annex C, it is
obvious that only the contours due to 1 tonne instantaneous release and 7 tonne
instantaneous release (hence event ID. E19, E28, E34 and E35) are able to reach the
Project Site. Therefore, only these four events are further considered in the risk
summation in the later sections.
Moreover, construction work and routine maintenance will only be carried out during day
time. Wind speed and stability in night time including D3, E3 and F1.5 are therefore not
further considered.

ENVIRONMENTAL IMPACT ASSESSMENT STUDY FOR SAI O TRUNK SEWER SEWAGE PUMPING STATION
REVIEW OF HAZARD TO LIFE IMPACT FROM MOSWTW
5-2
The shapes of the LD contours were not illustrated nor the downwind distances at which
the maximum crosswind distances occur were presented in HA2018. As a conservative
approach, the LD contours in this assessment are therefore plotted in rectangular shapes
using the maximum downwind and crosswind distances. The LD contours, which rotated
in every 30 degrees, are illustrated in Annex D.

ENVIRONMENTAL IMPACT ASSESSMENT STUDY FOR SAI O TRUNK SEWER SEWAGE PUMPING STATION
REVIEW OF HAZARD TO LIFE IMPACT FROM MOSWTW
6-1
6. Risk Assessment
6.1 Risk Summation
By combining the population data, meteorological data, results of frequency estimation
and consequence analysis, risk levels due to the presence of MOSWTW, have been
characterised in terms of individual risk (presented in the form of risk contours) and
societal risk (presented in the form of a F-N curve).
The societal risks of the Project in the construction phase and operation phase were
calculated using a risk summation method. An example of the calculation of the Event ID
E19 is shown in Annex D.
6.2 Results of Individual Risk
The individual risk represents the risk of the MOSWTW itself, hence the introduction of
the Project and other population within its Consultation Zone does not induce any change
to the individual risk of the MOSWTW.
As it is confirmed that the operation data of the MOSWTW has remained the same since
HA2018, the individual risk of the MOSWTW is identical to that of HA2018 and reproduced
in Figure 3.
It is clearly shown in Figure 3 that the individual risk contour can hardly affect the
population in the proposed pumping station.
6.3 Results of Societal Risk
6.3.1 Project Site Only
The societal risks of the Project site in the construction phase and operation phase
calculated using a risk summation by considering the effects of Event ID E19, E28, E34
and E35 are shown in Table 7 and Figure 4.
Societal risk can also be represented in the form of Potential Loss of Life (PLL). It
expresses the risk to the population as a whole and for each scenario and its location.
The PLL is an integrated measure of societal risk obtained by summing the product of
each F-N pair:
PLL = 𝑓1𝑁1 + 𝑓2𝑁2 +⋯+ 𝑓𝑛𝑁𝑛
The PLLs of the Project Site in the construction phase and operation phase are
1.12×10⁻⁷ no. of fatality per year and 3.11×10⁻⁸ no. of fatality per year respectively.

ENVIRONMENTAL IMPACT ASSESSMENT STUDY FOR SAI O TRUNK SEWER SEWAGE PUMPING STATION
REVIEW OF HAZARD TO LIFE IMPACT FROM MOSWTW
6-2
Table 7 F-N Data of Project Site Only
Construction Case Operation Case
No. of Fatality
(N)
Frequency
(F)
No. of Fatality
(N)
Frequency
(F)
1 4.18E-08 1 4.18E-08
2 3.38E-08 2 2.43E-11
3 1.68E-08
4 2.43E-11
6.3.2 Overall Societal Risk
The societal risks presented in Section 6.3.1 are calculated using the same methodology,
event frequencies and consequence results in HA2018. Therefore, the societal risks of
the Project Site can be summed up with the societal risk result of HA2018 to estimate
the overall risk level.
The combined societal risks of the Construction Case and Operation Case are shown in
Table 8 and illustrated in Figure 5 and Figure 6.
From Table 8, it can be observed that the frequencies of the Project site only contribute
insignificant portions (around 1.1% to 2.2%) to the corresponding frequencies of the
combined societal risks. This is due to the Project’s frequencies (in the range of 10-9 to
10-8 per year) are in two to three orders of magnitude lower than the combined societal
risk’s frequencies (1×10⁻⁶ to 1×10⁻⁵ per year).
It can also be seen in Figure 5 and Figure 6 that the changes of risk levels are
insignificant in terms of F-N curve after considering the Project in its construction phase
and operation phase in the combined societal risks. The F-N curves (gold line in
construction case and dark orange line in operation case) overlap with the baseline FN
curve (black dashed line). One should note that the combined societal risks are within
the ALARP region mainly due to the background population instead of due to the induction
of the Project itself.
With the additional population of the Project, the increase in societal risk is negligible in
both construction and operation phase. It is therefore suggested that the risks from the
MOSWTW to the Project is not a major concern.

ENVIRONMENTAL IMPACT ASSESSMENT STUDY FOR SAI O TRUNK SEWER SEWAGE PUMPING STATION
REVIEW OF HAZARD TO LIFE IMPACT FROM MOSWTW
6-3
Table 8 Combined Societal Risks
Baseline FN of HA2018 Combined FN (HA2018 and Construction Case) Combined FN (HA2018 and Operation Case)
No. of Fatality
(N)
Frequency
(F)
No. of Fatality
(N)
Frequency
(F)
% of F of
Project Site to
F of Combined
FN
No. of Fatality
(N)
Frequency
(F)
% of F of
Project Site to
F of Combined
FN
1 3.70E-06 1 3.74E-06 1.12% 1 3.74E-06 1.12%
2 1.54E-06 2 1.57E-06 2.15% 2 1.54E-06
3 1.18E-06 3 1.20E-06 1.41% 3 1.18E-06
4 1.15E-06 4 1.15E-06 4 1.15E-06
5 1.15E-06 5 1.15E-06 5 1.15E-06
6 1.15E-06 6 1.15E-06 6 1.15E-06
7 1.11E-06 7 1.11E-06 7 1.11E-06
8 1.11E-06 8 1.11E-06 8 1.11E-06
9 1.10E-06 9 1.10E-06 9 1.10E-06
10 1.09E-06 10 1.09E-06 10 1.09E-06
20 9.45E-07 20 9.45E-07 20 9.45E-07
30 8.35E-07 30 8.35E-07 30 8.35E-07
40 7.62E-07 40 7.62E-07 40 7.62E-07
50 7.34E-07 50 7.34E-07 50 7.34E-07
60 6.90E-07 60 6.90E-07 60 6.90E-07

ENVIRONMENTAL IMPACT ASSESSMENT STUDY FOR SAI O TRUNK SEWER SEWAGE PUMPING STATION
REVIEW OF HAZARD TO LIFE IMPACT FROM MOSWTW
6-4
Baseline FN of HA2018 Combined FN (HA2018 and Construction Case) Combined FN (HA2018 and Operation Case)
No. of Fatality
(N)
Frequency
(F)
No. of Fatality
(N)
Frequency
(F)
% of F of
Project Site to
F of Combined
FN
No. of Fatality
(N)
Frequency
(F)
% of F of
Project Site to
F of Combined
FN
70 6.50E-07 70 6.50E-07 70 6.50E-07
80 6.10E-07 80 6.10E-07 80 6.10E-07
90 5.50E-07 90 5.50E-07 90 5.50E-07
100 5.00E-07 100 5.00E-07 100 5.00E-07
200 1.06E-07 200 1.06E-07 200 1.06E-07
300 1.87E-08 300 1.87E-08 300 1.87E-08
400 4.70E-09 400 4.70E-09 400 4.70E-09
480 1.00E-09 480 1.00E-09 480 1.00E-09

ENVIRONMENTAL IMPACT ASSESSMENT STUDY FOR SAI O TRUNK SEWER SEWAGE PUMPING STATION
REVIEW OF HAZARD TO LIFE IMPACT FROM MOSWTW
7-1
7. Conclusion A review of the risks posed by the MOSWTW to the Project has been carried out. The
societal risk results showed that the increases in risk levels due to the construction phase
and operation phase of the Project were insignificant.
The results suggested that, because of an insignificant increase of population induced by
the Project and a relatively far distance of the Project Site from the MOSWTW, risk to life
is not a key issue with respect to the Hong Kong Risk Guidelines given in Annex 4 of the
EIAO-TM. Therefore, a full QRA for the MOSWTW is not required.

ENVIRONMENTAL IMPACT ASSESSMENT STUDY FOR SAI O TRUNK SEWER SEWAGE PUMPING STATION
REVIEW OF HAZARD TO LIFE IMPACT FROM MOSWTW
8-1
8. References [1] Final Report of Hazard assessment on Ma On Shan Water Treatment Works,
188563/B&V/026/Issue 3, August 2018.
[2] Reassessment of Chlorine Hazard for Eight Existing Water Treatment Works, ERM,
2001.

ENVIRONMENTAL IMPACT ASSESSMENT STUDY FOR SAI O TRUNK SEWER SEWAGE PUMPING STATION
REVIEW OF HAZARD TO LIFE IMPACT FROM MOSWTW
8-2
Figures

ENVIRONMENTAL IMPACT ASSESSMENT STUDY FOR SAI O TRUNK SEWER SEWAGE PUMPING STATION
REVIEW OF HAZARD TO LIFE IMPACT FROM MOSWTW
Figure 1 Location of the Project Site

ENVIRONMENTAL IMPACT ASSESSMENT STUDY FOR SAI O TRUNK SEWER SEWAGE PUMPING STATION
REVIEW OF HAZARD TO LIFE IMPACT FROM MOSWTW
Figure 2 Societal Risk Guideline (EIAO-TM)

ENVIRONMENTAL IMPACT ASSESSMENT STUDY FOR SAI O TRUNK SEWER SEWAGE PUMPING STATION
REVIEW OF HAZARD TO LIFE IMPACT FROM MOSWTW
Figure 3 Individual Risk of MOSWTW

ENVIRONMENTAL IMPACT ASSESSMENT STUDY FOR SAI O TRUNK SEWER SEWAGE PUMPING STATION
REVIEW OF HAZARD TO LIFE IMPACT FROM MOSWTW
Figure 4 Societal Risks of Project Site Only

ENVIRONMENTAL IMPACT ASSESSMENT STUDY FOR SAI O TRUNK SEWER SEWAGE PUMPING STATION
REVIEW OF HAZARD TO LIFE IMPACT FROM MOSWTW
Figure 5 Combined Societal Risk (Construction Case 2022)

ENVIRONMENTAL IMPACT ASSESSMENT STUDY FOR SAI O TRUNK SEWER SEWAGE PUMPING STATION
REVIEW OF HAZARD TO LIFE IMPACT FROM MOSWTW
Figure 6 Combined Societal Risk (Operation Case 2025)

ENVIRONMENTAL IMPACT ASSESSMENT STUDY FOR SAI O TRUNK SEWER SEWAGE PUMPING STATION
REVIEW OF HAZARD TO LIFE IMPACT FROM MOSWTW
Annex A:
Summary of Hazard Scenarios
and Frequencies

ENVIRONMENTAL IMPACT ASSESSMENT STUDY FOR SAI O TRUNK SEWER SEWAGE PUMPING STATION
REVIEW OF HAZARD TO LIFE IMPACT FROM MOSWTW
Table A1 Summary of Hazard Scenarios and Frequencies
Internal Release
Event ID Initial Event Scrubber
available
Ventilation
shut down
Frequency of
Occurrence, per year
Subsequent Release
Rate, kg/s
E1 10 kg/h internal release Yes Yes 1.09E-02 1.92E-06
E2 10 kg/h internal release Yes No 5.76E-04 2.41E-03
E3 10 kg/h internal release No Yes 1.11E-04 1.44E-03
E4 10 kg/h internal release No No 5.82E-06 2.41E-03
E5 100 kg/h internal release Yes Yes 3.65E-03 1.92E-05
E6 100 kg/h internal release Yes No 1.92E-04 2.41E-02
E7 100 kg/h internal release No Yes 3.69E-05 1.44E-02
E8 100 kg/h internal release No No 1.94E-06 2.41E-02
E9 500 kg/h internal release Yes Yes 3.65E-03 9.61E-05
E10 500 kg/h internal release Yes No 1.92E-04 1.21E-01
E11 500 kg/h internal release No Yes 3.69E-05 7.22E-02
E12 500 kg/h internal release No No 1.94E-06 1.21E-01
E13 1000 kg/h internal release Yes Yes 3.65E-03 1.92E-04
E14 1000 kg/h internal release Yes No 1.92E-04 2.41E-01
E15 1000 kg/h internal release No Yes 3.69E-05 1.44E-01
E16 1000 kg/h internal release No No 1.94E-06 2.41E-01

ENVIRONMENTAL IMPACT ASSESSMENT STUDY FOR SAI O TRUNK SEWER SEWAGE PUMPING STATION
REVIEW OF HAZARD TO LIFE IMPACT FROM MOSWTW
External Release
Event ID Initial Event Frequency of
Occurrence, per year
Subsequent Release
Rate, kg/s
E17 Truck Accident – 1 drum with small leak 5.78E-06 1.73E-02
E18 Truck Accident – 1 drum with large leak 2.22E-06 1.23E-01
E19 Truck Accident – 1 drum (catastrophic failure) 8.90E-07 1 ton instantaneous
E20 Truck Accident – 3 drum with small leak 5.46E-09 5.19E-02
E21 Truck Accident – 3 drum with large leak 2.01E-09 3.69E-01
E22 Truck Accident – 3 drum (catastrophic failure) 8.40E-10 3 ton instantaneous
E23 Truck Accident – 6 drum with small leak 2.01E-13 1.04E-01
E24 Truck Accident – 6 drum with large leak 5.04E-07 7.38E-01
E25 Truck Accident – 6 drum (catastrophic failure) 3.10E-14 6 ton instantaneous
E26 Truck Accident – spontaneous drum failure with small leak 2.20E-07 1.73E-02
E27 Truck Accident – spontaneous drum failure with large leak 1.71E-07 1.23E-01
E28 Truck Accident – spontaneous catastrophic rupture of 1drr 1.63E-08 1 ton instantaneous
E29 Earthquake –valve and pipping of 8mm equivalent hole size 1.42E-07 1.23E-01
E30 Earthquake –piping from valve to manifold 1.70E-06 6.80E-01
E31 Earthquake –piping from manifold to change over panel / regulator 7.36E-07 6.80E-01
E32 Earthquake –piping from vacuum regulator to chlorinator 4.25E-07 6.80E-01
E33 Earthquake –valve failure of 1 drum 6.00E-06 1.23E-01
E34 Earthquake – 1 drum instantaneous failure 1.00E-06 1 ton instantaneous
E35 Aircraft accident 9.27E-10 7 ton instantaneous

ENVIRONMENTAL IMPACT ASSESSMENT STUDY FOR SAI O TRUNK SEWER SEWAGE PUMPING STATION
REVIEW OF HAZARD TO LIFE IMPACT FROM MOSWTW
Annex B:
Consequence Results from
HA2018

ENVIRONMENTAL IMPACT ASSESSMENT STUDY FOR SAI O TRUNK SEWER SEWAGE PUMPING STATION
REVIEW OF HAZARD TO LIFE IMPACT FROM MOSWTW
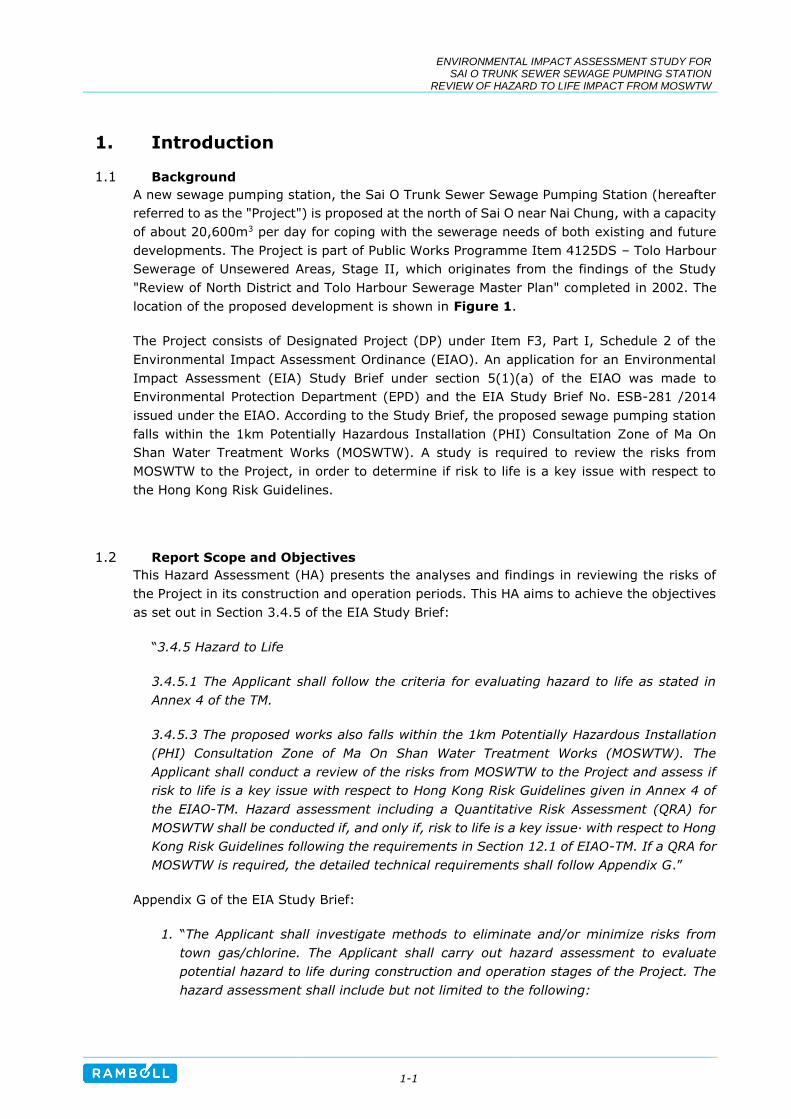
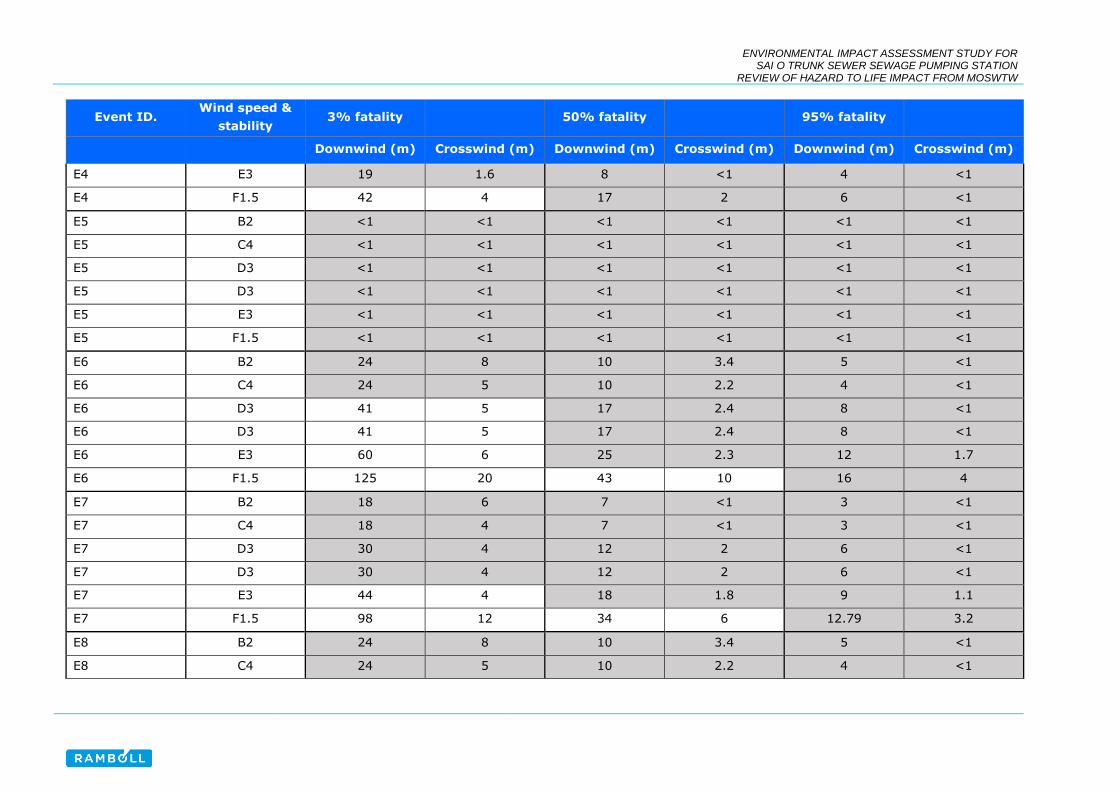
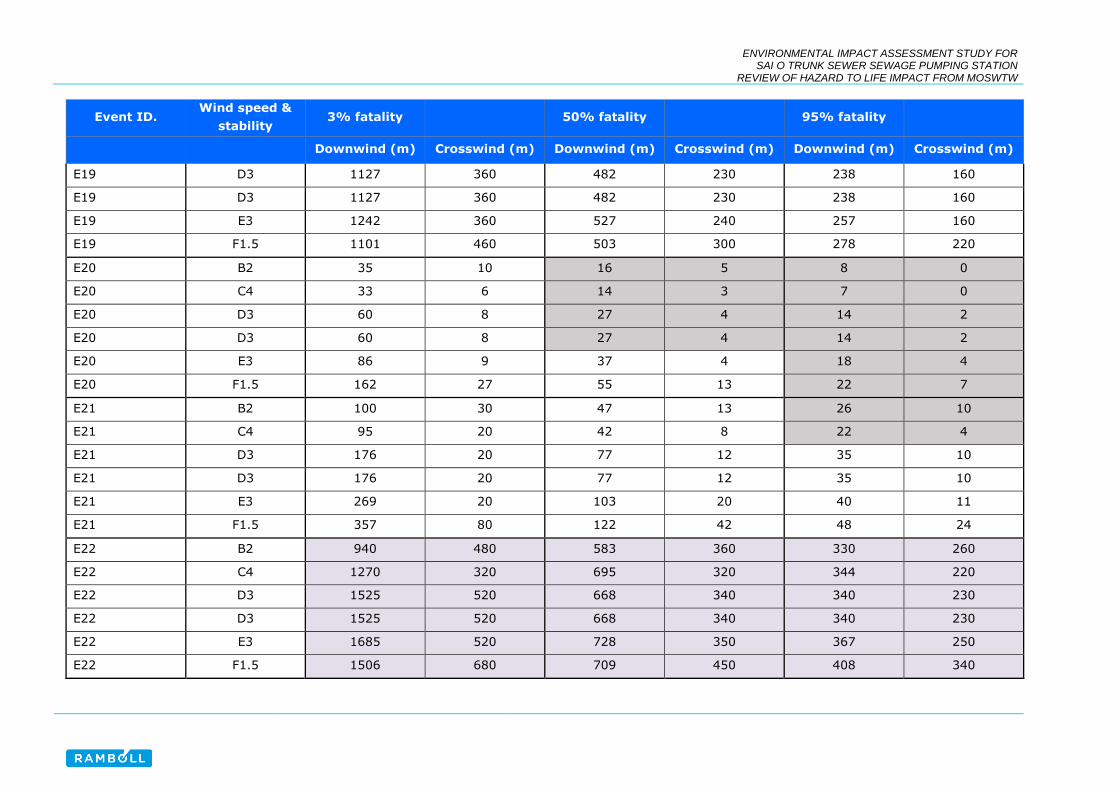
Table B1 LD Contours of Various Release Scenarios
Event ID. Wind speed &
stability 3% fatality 50% fatality 95% fatality
Downwind (m) Crosswind (m) Downwind (m) Crosswind (m) Downwind (m) Crosswind (m)
E1 B2 <1 <1 <1 <1 <1 <1
E1 C4 <1 <1 <1 <1 <1 <1
E1 D3 <1 <1 <1 <1 <1 <1
E1 D3 <1 <1 <1 <1 <1 <1
E1 E3 <1 <1 <1 <1 <1 <1
E1 F1.5 <1 <1 <1 <1 <1 <1
E2 B2 8 <1 3 <1 2 <1
E2 C4 8 <1 3 <1 2 <1
E2 D3 13 1.6 5 <1 2 <1
E2 D3 13 1.6 5 <1 2 <1
E2 E3 19 1.6 8 <1 4 <1
E2 F1.5 42 4 17 2 6 <1
E3 B2 6 <1 3 <1 <1 <1
E3 C4 6 <1 3 <1 <1 <1
E3 D3 10 1.7 4 <1 2 <1
E3 D3 10 1.7 4 <1 2 <1
E3 E3 14 1.8 6 <1 3 <1
E3 F1.5 31 2.2 13 1.5 4 <1
E4 B2 8 <1 3 <1 2 <1
E4 C4 8 <1 3 <1 2 <1
E4 D3 13 1.6 5 <1 2 <1
E4 D3 13 1.6 5 <1 2 <1
ENVIRONMENTAL IMPACT ASSESSMENT STUDY FOR SAI O TRUNK SEWER SEWAGE PUMPING STATION
REVIEW OF HAZARD TO LIFE IMPACT FROM MOSWTW
Event ID. Wind speed &
stability 3% fatality 50% fatality 95% fatality
Downwind (m) Crosswind (m) Downwind (m) Crosswind (m) Downwind (m) Crosswind (m)
E4 E3 19 1.6 8 <1 4 <1
E4 F1.5 42 4 17 2 6 <1
E5 B2 <1 <1 <1 <1 <1 <1
E5 C4 <1 <1 <1 <1 <1 <1
E5 D3 <1 <1 <1 <1 <1 <1
E5 D3 <1 <1 <1 <1 <1 <1
E5 E3 <1 <1 <1 <1 <1 <1
E5 F1.5 <1 <1 <1 <1 <1 <1
E6 B2 24 8 10 3.4 5 <1
E6 C4 24 5 10 2.2 4 <1
E6 D3 41 5 17 2.4 8 <1
E6 D3 41 5 17 2.4 8 <1
E6 E3 60 6 25 2.3 12 1.7
E6 F1.5 125 20 43 10 16 4
E7 B2 18 6 7 <1 3 <1
E7 C4 18 4 7 <1 3 <1
E7 D3 30 4 12 2 6 <1
E7 D3 30 4 12 2 6 <1
E7 E3 44 4 18 1.8 9 1.1
E7 F1.5 98 12 34 6 12.79 3.2
E8 B2 24 8 10 3.4 5 <1
E8 C4 24 5 10 2.2 4 <1

ENVIRONMENTAL IMPACT ASSESSMENT STUDY FOR SAI O TRUNK SEWER SEWAGE PUMPING STATION
REVIEW OF HAZARD TO LIFE IMPACT FROM MOSWTW
Event ID. Wind speed &
stability 3% fatality 50% fatality 95% fatality
Downwind (m) Crosswind (m) Downwind (m) Crosswind (m) Downwind (m) Crosswind (m)
E8 D3 41 5 17 2.4 8 <1
E8 D3 41 5 17 2.4 8 <1
E8 E3 60 6 25 2.3 12 1.7
E8 F1.5 125 20 43 10 16 4
E9 B2 <1 <1 <1 <1 <1 <1
E9 C4 <1 <1 <1 <1 <1 <1
E9 D3 <1 <1 <1 <1 <1 <1
E9 D3 <1 <1 <1 <1 <1 <1
E9 E3 <1 <1 <1 <1 <1 <1
E9 F1.5 <1 <1 <1 <1 <1 <1
E10 B2 55 17 23 8 11 2.3
E10 C4 54 13 22 4.4 10 2.2
E10 D3 95 12 41 5 21 4
E10 D3 95 12 41 5 21 4
E10 E3 144 16 61 8 27 5.6
E10 F1.5 237 44 81 26 31 12
E11 B2 40 13 17 5.6 8 <1
E11 C4 40 8 16 3.8 7 <1
E11 D3 69 9 29 3.6 15 2
E11 D3 69 9 29 3.6 15 2
E11 E3 101 10 43 4 21 4
E11 F1.5 186 32 63 14 24 8.2

ENVIRONMENTAL IMPACT ASSESSMENT STUDY FOR SAI O TRUNK SEWER SEWAGE PUMPING STATION
REVIEW OF HAZARD TO LIFE IMPACT FROM MOSWTW
Event ID. Wind speed &
stability 3% fatality 50% fatality 95% fatality
Downwind (m) Crosswind (m) Downwind (m) Crosswind (m) Downwind (m) Crosswind (m)
E12 B2 55 17 23 8 11 2.3
E12 C4 54 13 22 4.4 10 2.2
E12 D3 95 12 41 5 21 4
E12 D3 95 12 41 5 21 4
E12 E3 144 16 61 8 27 5.6
E12 F1.5 237 44 81 26 31 12
E13 B2 <1 <1 <1 <1 <1 <1
E13 C4 <1 <1 <1 <1 <1 <1
E13 D3 <1 <1 <1 <1 <1 <1
E13 D3 <1 <1 <1 <1 <1 <1
E13 E3 <1 <1 <1 <1 <1 <1
E13 F1.5 <1 <1 <1 <1 <1 <1
E14 B2 79 24 34 11.8 17 5.2
E14 C4 76 15 31 5.4 14 2.8
E14 D3 142 20 62 8 32 8
E14 D3 142 20 62 8 32 8
E14 E3 218 20 89 12 35 8.4
E14 F1.5 313 80 107 32 41 18
E15 B2 57 17 24 8 12 34
E15 C4 56 10 23 5.2 10 2.2
E15 D3 99 10 43 5 22 4
E15 D3 99 10 43 5 22 4
ENVIRONMENTAL IMPACT ASSESSMENT STUDY FOR SAI O TRUNK SEWER SEWAGE PUMPING STATION
REVIEW OF HAZARD TO LIFE IMPACT FROM MOSWTW
Event ID. Wind speed &
stability 3% fatality 50% fatality 95% fatality
Downwind (m) Crosswind (m) Downwind (m) Crosswind (m) Downwind (m) Crosswind (m)
E15 E3 151 14 64 9 28 5.2
E15 F1.5 245 42 84 22 32 13.2
E16 B2 79 24 34 11.8 17 5.2
E16 C4 76 15 31 5.4 14 2.8
E16 D3 142 20 62 8 32 8
E16 D3 142 20 62 8 32 8
E16 E3 218 20 89 12 35 8.4
E16 F1.5 313 80 107 32 41 18
E17 B2 19 6 9 2 4 <1
E17 C4 18 4 8 0 4 <1
E17 D3 34 4 15 2 8 <1
E17 D3 34 4 15 2 8 <1
E17 E3 49 5 21 2 11 1
E17 F1.5 104 14 36 6 14 3
E18 B2 56 16 25 7 14 4
E18 C4 53 12 23 5 11 2
E18 D3 94 10 42 5 22 5
E18 D3 94 10 42 5 22 5
E18 E3 138 10 59 8 26 5
E18 F1.5 229 48 78 23 31 12
E19 B2 648 262 414 250 225 180
E19 C4 862 220 503 220 242 140
ENVIRONMENTAL IMPACT ASSESSMENT STUDY FOR SAI O TRUNK SEWER SEWAGE PUMPING STATION
REVIEW OF HAZARD TO LIFE IMPACT FROM MOSWTW
Event ID. Wind speed &
stability 3% fatality 50% fatality 95% fatality
Downwind (m) Crosswind (m) Downwind (m) Crosswind (m) Downwind (m) Crosswind (m)
E19 D3 1127 360 482 230 238 160
E19 D3 1127 360 482 230 238 160
E19 E3 1242 360 527 240 257 160
E19 F1.5 1101 460 503 300 278 220
E20 B2 35 10 16 5 8 0
E20 C4 33 6 14 3 7 0
E20 D3 60 8 27 4 14 2
E20 D3 60 8 27 4 14 2
E20 E3 86 9 37 4 18 4
E20 F1.5 162 27 55 13 22 7
E21 B2 100 30 47 13 26 10
E21 C4 95 20 42 8 22 4
E21 D3 176 20 77 12 35 10
E21 D3 176 20 77 12 35 10
E21 E3 269 20 103 20 40 11
E21 F1.5 357 80 122 42 48 24
E22 B2 940 480 583 360 330 260
E22 C4 1270 320 695 320 344 220
E22 D3 1525 520 668 340 340 230
E22 D3 1525 520 668 340 340 230
E22 E3 1685 520 728 350 367 250
E22 F1.5 1506 680 709 450 408 340

ENVIRONMENTAL IMPACT ASSESSMENT STUDY FOR SAI O TRUNK SEWER SEWAGE PUMPING STATION
REVIEW OF HAZARD TO LIFE IMPACT FROM MOSWTW
Event ID. Wind speed &
stability 3% fatality 50% fatality 95% fatality
Downwind (m) Crosswind (m) Downwind (m) Crosswind (m) Downwind (m) Crosswind (m)
E23 B2 51 15 23 6 13 3
E23 C4 48 10 21 4 10 2
E23 D3 86 10 39 5 20 4
E23 D3 86 10 39 5 20 4
E23 E3 125 10 53 6 24 5
E23 F1.5 214 40 73 20 29 10
E24 B2 148 43 70 20 38 18
E24 C4 140 28 61 12 32 6
E24 D3 267 32 113 24 46 15
E24 D3 267 32 113 24 46 15
E24 E3 395 50 136 30 52 16
E24 F1.5 471 130 162 62 65 35
E25 B2 1527 700 722 500 420 350
E25 C4 1600 520 848 400 426 280
E25 D3 1848 700 818 440 425 300
E25 D3 1848 700 818 440 425 300
E25 E3 2036 700 891 450 457 320
E25 F1.5 1839 860 886 600 520 440
E26 B2 19 6 9 2 4 <1
E26 C4 18 4 8 0 4 <1
E26 D3 34 4 15 2 8 <1
E26 D3 34 4 15 2 8 <1

ENVIRONMENTAL IMPACT ASSESSMENT STUDY FOR SAI O TRUNK SEWER SEWAGE PUMPING STATION
REVIEW OF HAZARD TO LIFE IMPACT FROM MOSWTW
Event ID. Wind speed &
stability 3% fatality 50% fatality 95% fatality
Downwind (m) Crosswind (m) Downwind (m) Crosswind (m) Downwind (m) Crosswind (m)
E26 E3 49 5 21 2 11 1
E26 F1.5 104 14 36 6 14 3
E27 B2 56 16 25 7 14 4
E27 C4 53 12 23 5 11 2
E27 D3 94 10 42 5 22 5
E27 D3 94 10 42 5 22 5
E27 E3 138 10 59 8 26 5
E27 F1.5 229 48 78 23 31 12
E28 B2 648 262 414 250 225 180
E28 C4 862 220 503 220 242 140
E28 D3 1127 360 482 230 238 160
E28 D3 1127 360 482 230 238 160
E28 E3 1242 360 527 240 257 160
E28 F1.5 1101 460 503 300 278 220
E29 B2 56 16 25 7 14 4
E29 C4 53 12 23 5 11 2
E29 D3 94 10 42 5 22 5
E29 D3 94 10 42 5 22 5
E29 E3 138 10 59 8 26 5
E29 F1.5 229 48 78 23 31 12
E30 B2 314 400 113 114 46 37
E30 C4 149 110 70 36 34 14

ENVIRONMENTAL IMPACT ASSESSMENT STUDY FOR SAI O TRUNK SEWER SEWAGE PUMPING STATION
REVIEW OF HAZARD TO LIFE IMPACT FROM MOSWTW
Event ID. Wind speed &
stability 3% fatality 50% fatality 95% fatality
Downwind (m) Crosswind (m) Downwind (m) Crosswind (m) Downwind (m) Crosswind (m)
E30 D3 156 150 73 52 36 22
E30 D3 156 150 73 52 36 22
E30 E3 174 164 81 56 40 24
E30 F1.5 591 800 212 240 86 80
E31 B2 314 400 113 114 46 37
E31 C4 149 110 70 36 34 14
E31 D3 156 150 73 52 36 22
E31 D3 156 150 73 52 36 22
E31 E3 174 164 81 56 40 24
E31 F1.5 591 800 212 240 86 80
E32 B2 314 400 113 114 46 37
E32 C4 149 110 70 36 34 14
E32 D3 156 150 73 52 36 22
E32 D3 156 150 73 52 36 22
E32 E3 174 164 81 56 40 24
E32 F1.5 591 800 212 240 86 80
E33 B2 56 16 25 7 14 4
E33 C4 53 12 23 5 11 2
E33 D3 94 10 42 5 22 5
E33 D3 94 10 42 5 22 5
E33 E3 138 10 59 8 26 5
E33 F1.5 229 48 78 23 31 12

ENVIRONMENTAL IMPACT ASSESSMENT STUDY FOR SAI O TRUNK SEWER SEWAGE PUMPING STATION
REVIEW OF HAZARD TO LIFE IMPACT FROM MOSWTW
Event ID. Wind speed &
stability 3% fatality 50% fatality 95% fatality
Downwind (m) Crosswind (m) Downwind (m) Crosswind (m) Downwind (m) Crosswind (m)
E34 B2 648 262 414 250 225 180
E34 C4 862 220 503 220 242 140
E34 D3 1127 360 482 230 238 160
E34 D3 1127 360 482 230 238 160
E34 E3 1242 360 527 240 257 160
E34 F1.5 1101 460 503 300 278 220
E35 B2 1620 1800 791 820 407 430
E35 C4 1325 1280 661 620 348 340
E35 D3 1464 1420 725 700 377 365
E35 D3 1464 1420 725 700 377 365
E35 E3 1602 1600 786 760 406 400
E35 F1.5 2162 2300 1046 1070 524 600
Note:
Cells highlighted in grey or purple were not considered since the contours have no offsite impact or the event frequencies are less than 9E-10 per year.

ENVIRONMENTAL IMPACT ASSESSMENT STUDY FOR SAI O TRUNK SEWER SEWAGE PUMPING STATION
REVIEW OF HAZARD TO LIFE IMPACT FROM MOSWTW
Annex C:
Illustration of LD Contours

ENVIRONMENTAL IMPACT ASSESSMENT STUDY FOR SAI O TRUNK SEWER SEWAGE PUMPING STATION
REVIEW OF HAZARD TO LIFE IMPACT FROM MOSWTW
LD Contour of 1 Tonne Instantaneous Release – Stability C4 (Event ID. E19, E28, E34)

ENVIRONMENTAL IMPACT ASSESSMENT STUDY FOR SAI O TRUNK SEWER SEWAGE PUMPING STATION
REVIEW OF HAZARD TO LIFE IMPACT FROM MOSWTW
LD Contour of 1 Tonne Instantaneous Release – Stability D3 (Event ID. E19, E28, E34)

ENVIRONMENTAL IMPACT ASSESSMENT STUDY FOR SAI O TRUNK SEWER SEWAGE PUMPING STATION
REVIEW OF HAZARD TO LIFE IMPACT FROM MOSWTW
Annex D:
Example of Risk Summation
Calculation

ENVIRONMENTAL IMPACT ASSESSMENT STUDY FOR SAI O TRUNK SEWER SEWAGE PUMPING STATION
REVIEW OF HAZARD TO LIFE IMPACT FROM MOSWTW
Calculation of F-N curve of Construction Phase
For Event ID E19, only the consequences of LD03 in the wind direction from 135-164 degree are able to affect the Project Site.
According to Section 3.1.1, it is assumed that there will be 30 construction workers present during day time.
The event frequency of E19 is 8.90E-07 per year according to Annex A.
The calculation of the F-N pairs of E19 is shown below in form of table.
Time
Period
Base Frequency (per year)
(A)
Temporal
Change
(B)
Time Period
%
(C)
Frequency in the Time
Period (per year)
(D =A × C
/ ΣC)
Weather Probability
(E)
Proportion of Project Site
Covered by the Contour (1)
(F)
Population in the time
period
(G = 30 ×
B)
Effective Fatality
Probability (2)
(H)
B20 C40 D30 B20 C40 D30
Night 8.90E-07 0% 0% 0.00E+00 0.009308 0.005771 0.020663 0 0.648 1 0 0.12
Jammed
Peak 8.90E-07 100% 0.89% 1.58E-08 0.024827 0.014896 0.01468 0 0.648 1 30 0.12
Peak
Hour 8.90E-07 100% 13.39% 2.38E-07 0.024827 0.014896 0.01468 0 0.648 1 30 0.12
Weekend
day 8.90E-07 50% 9.53% 1.70E-07 0.024827 0.014896 0.01468 0 0.648 1 15 0.12
Working
day 8.90E-07 100% 26.19% 4.66E-07 0.024827 0.014896 0.01468 0 0.648 1 30 0.12
Note
1. Portion of the Project Site covered is calculated according to the affect area divided by the total site area using information extracted by an in-house
GIS software.
2. Geometrical mean of effective fatality probability of LD03 and LD50.

ENVIRONMENTAL IMPACT ASSESSMENT STUDY FOR SAI O TRUNK SEWER SEWAGE PUMPING STATION
REVIEW OF HAZARD TO LIFE IMPACT FROM MOSWTW
Time Period No. of fatality
(I = G × F × H)
Frequency of particular stability
(J = D × E )
B20 C40 D30 B20 C40 D30
Night 0.000 0.000 0.000 0.00E+00 0.00E+00 0.00E+00
Jammed Peak 0.000 2.333 3.600 3.93E-10 2.36E-10 2.36E-10
Peak Hour 0.000 2.333 3.600 5.92E-09 3.55E-09 3.55E-09
Weekend day 0.000 1.167 1.800 4.21E-09 2.53E-09 2.53E-09
Working day 0.000 2.333 3.600 1.16E-08 6.94E-09 6.94E-09
By categorizing the no. of fatality and accumulating the corresponding frequencies, the F-N pairs can be calculated.
No. of Fatality Frequency (per year)
>= 1 2.63E-08
>= 2 2.13E-08
>= 3 1.06E-08
>= 3.6 1.06E-08