environmental monitoring &...
TRANSCRIPT

4-1
ENVIRONMENTAL MONITORING & ANALYSIS OVERVIEW The environmental monitoring program was continued in 2008 in accordance with the requirements established by Federal and State Regulations, the Radioactive Materials License (RML), and Radiation Protection Plan Procedures (RPPP). Air Emissions Control and Liquid Management monitoring programs results are reported in sections 5 and 7 of this report respectively. Analytical results for 2008 were provided by the onsite laboratory. Results and discussion from the following programs and procedures are included in this section:
• Individual Member of the Public (IMOP) Dose: RPPP EV-010
Environmental Dose Assessment • Environmental Air Particulate: RPPP EV-020 Environmental Air
Particulate Sampling, EV-021 Calibration of Environmental Air Samplers using the Plate Orifice Method
• Environmental Radon: RPPP EV-030 Radon 222/220 Air Surveys • Environmental TLD: RPPP EV-070 Environmental TLD • Meteorological Monitoring: RPPP EV-130 Weather Monitoring • Vegetation: RPPP EV-060 Vegetation Sampling • Soils: RPPP EV-110 Soil Sampling; EV-120 Radon Flux Measurement
Public dose for 2008 was estimated by the computer code MILDOS to be slightly higher in comparison to 2007 as CCMF continued in a stand-down condition where site work was performed primarily to reduce potential hazards, maintain compliance, and maintain vital equipment. Old Pond Area (OPA) soil removal of approximately two hundred thirty thousand (230,000) cubic yards was performed during May through September 2008.
The general trend in radionuclide concentrations at Perimeter Air sampling locations since 2005, continued lower. This is likely attributable to increased dust control efforts in the timeframe. Average 2008 concentrations remained within historical levels and were generally lower than 2007. Environmental Radon measurements at perimeter and nearby locations in 2008 were generally lower at all locations including the three (3) background locations (Canon City, Lincoln Park and Oro Verde). Environmental TLD measurements were all generally higher for individual locations in 2008 versus 2007 with the exception of AS-209 Mill Entrance Road, which was markedly lower in response to the site entry road cleanup completed in 2007. Meteorological Monitoring data continued to be dominated in 2008 (similar to 2002-2005) by drought conditions, although less severe than for 2002-2003, year with good data recovery. Wind Rose data was very similar for 2008 as compared to 2007.

4-2
Vegetation sample analytical results for 2008 indicated generally higher levels some above historic levels. Sampling locations are selected based on predicted ground concentrations using the public dose model MILDOS. Soil sample analytical results for 2008 indicate results within historic levels. Radon Flux measurements for the Primary Impoundment were conducted in June 2008 with the resulting flux of nineteen point seven (19.7) pCi/m2-s compared to the 2007 flux of fourteen (14) pCi/m2-s versus the National Emission Standard for Hazardous Air Pollutants (NESHAPS) standard of twenty (20) pCi/m2-s. The 2008 report was filed with Environmental Protection Agency (EPA). When the 2008 Primary Impoundment preliminary results were received, Cotter initiated a program to cover the most highly elevated areas as an ALARA function. Approximately eight thousand eight hundred (8,800) cubic yards of soil cover averaging four (4) feet in depth was placed on approximately one (1) acre in the northwest corner of the exposed tailings beach encompassing tailings beach locations TB 69-72. This was completed in the latter part of 2008. Other areas were being covered in early 2009. The expected reduction in mean radon flux is about twenty-five percent (25%). For the Secondary Impoundment, the June 2008 sampling was conducted as an ALARA function and not for compliance with NESHAPS. The resulting measurements indicated a reading of fourteen (14) pCi/m2-s This result is the same (fourteen (14) pCi/m2-s) as the readings which were taken in October 2007 after some remedial ALARA actions were taken to reduce the flux of twenty-three point four (23.4) pCi/m2-s as measured in July 2007. Overall, the presented results indicate good control of airborne emissions from CCMF as evidenced by compliance with the Effluent Concentration (EC) limits in Part 4 of the Radiation Regulations, conformance to the 40 CFR 190 public dose requirements and compliance with the 40 CFR 61 National Emission Standards for Hazardous Air Pollutants (NESHAP) requirements for radon flux. INDIVIDUAL MEMBER OF THE PUBLIC (IMOP) DOSE Public Dose for 2008 was estimated using the MILDOS Computer Code and site-specific data. These are estimates for potential actual residents for 2008 which are generally higher than for 2007 estimates. Generally, the increase can be attributed to movement of Old Pond Area (OPA) soils. The 40 CFR 190 dose estimates may be compared to the Colorado Rules and Regulations Part 4.5.4 constraint level of ten (10) mrem/year (effective dose only) and the Colorado Rules and Regulations Part 4.14.4 regulatory limit of twenty-five (25) mrem/year. The Total Effective dose estimates may be compared to the Colorado Rules and Regulations Part 4.14.1.1 regulatory limit of one hundred (100) mrem/year, which includes exposure to radon. A comparison of the 2001 – 2008 estimated maximum doses to a potentially exposed individual is shown in Table 4-1.

4-3
The maximum dose for each dose category (i.e. bone, lung, effective, and total effective) per year is shown as bold. See Appendix D Estimates of Radiation Doses to Members of the Public from Cotter 2008 Operations for additional details.
Table 4-1
Estimates of Public Dose – Maximum (mrem/yr)
Individual Year 40 CFR 190
Bone (Limit 25)40 CFR 190
Lung (Limit 25)40 CFR 190
Effective (Limit 25) Total Effective
(Limit 100) 2001 9 5 1 13 2002 10 3 1 9 2003 3 1 <1 7 2004 6 2 1 5 2005 9 5 1 18 2006 6 2 1 10 2007 5 <1 <1 9
Adult
2008 8 1 1 9 2001 15 6 2 12 2002 17 4 1 9 2003 6 1 <1 7 2004 8 2 1 5 2005 13 6 1 18 2006 8 2 1 10 2007 7 1 <1 9
Teen
2008 10 1 1 9 2001 6 11 2 13 2002 7 6 1 9 2003 6 2 <1 7 2004 8 4 1 5 2005 7 10 2 18 2006 5 4 1 10 2007 4 2 <1 9
Child
2008 7 2 1 9 2001 Note 1 19 3 12 2002 Note 1 10 2 8 2003 Note 1 2 <1 7 2004 Note 1 6 1 6 2005 Note 1 19 3 20 2006 Note 1 7 1 12 2007 Note 1 3 1 10
Infant
2008 Note 1 2 1 9 Note 1: Infants do not generally consume home grown vegetables; the dose to bone was not calculated

4-4
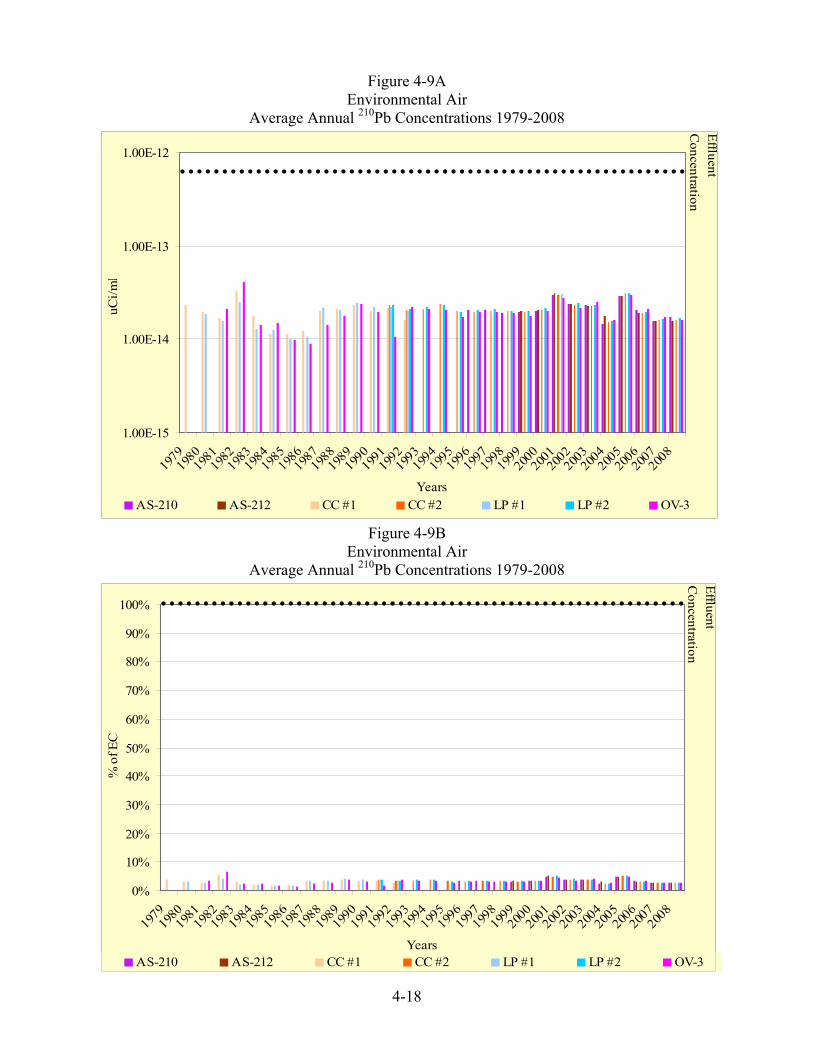
ENVIRONMENTAL AIR PARTICULATE Environmental Air Samplers (Particulates) A location map of the Environmental Air Samplers is included as Figure 4-1. Radon Track Etch Measurement Devices and Environmental TLDs are co-located at these collection points. Annual Average Particulate Concentrations for the period 1979 through 2008 are presented in Figures 4-2 through 4-11. Average Annual Radon and TLD measurements are shown in figures 4-12 through 4-14 and in 4-14 and 4-15, respectively. The particulate data generally indicates radionuclide concentrations which are approximately one hundred (100) times below the regulatory EC limit with the exception of 230Th, which is generally at least ten (10) times below the limit. Please see figures 4-2A through 4-11B which show the concentrations in an exponential format (A) for trend observation and as a percent of the effluent concentration limit (B). Management of the tailings area since 2002 by soil covering, mulch application, application of soil binding agents, as well as covering as much of the tailings beach as possible with available water and use of a sprinkling system in accordance with the Air Permit Compliance Plan has provided sufficient dust control. The Primary Impoundment solution level was approximately 5,573 at the end of September 2007 and was likely lower by year’s end although measurements were suspended due to unsafe conditions. A sprinkler system was installed on the tailings beach adjacent to the evaporation cells in May 2003 and additional sprinklers were added in the fall of 2006 as well as the second (2nd) half of 2007 and in the first (1st) half of 2008. The AS-202 and AS-209 Supplemental Air Samplers (AS-136) and (AS-140) respectively continue to show slightly elevated readings, generally in the winter periods of the last several years. See Section 5 and Figure 5-2 for more information. Review and comparison of the 2008 to the 2007 Environmental Air sample results generally indicate similar average radiological concentrations for the perimeter samples (AS-203, AS-204, AS-206) while AS-202 East Boundary was slightly higher and AS-209 Mill Entrance Road concentrations were markedly lower. Nearby locations designated as AS-210 Shadow Hills Estates and AS-212 Nearest Resident, which are between the Canon City Milling Facility and actual residences generally showed lower results within historical levels. The outlying locations, Canon City #2, Lincoln Park #2, and OroVerde #3 are located at residences as shown on Figure 4-1 while AS-210 and AS-212 are at locations between the site boundary and actual residences. Results from these outlying locations showed concentrations within historical levels with individual radionuclides generally lower than in 2007. All radionuclide particulate results include background, which has been determined to be represented by the Canon City #2 location.
• Natural uranium was down at all locations particularly at AS-209 which was at one twentieth (1/20) the 2005 historical high. This result may be related to the site entry road cleanup completed in 2007 and cessation of ore receipt in February 2006.
• Thorium-230 results were slightly higher at AS-202, AS-204 and AS-210 but lower at all other locations for 2008 versus 2007.

4-5
• Radium-226 was lower for all other locations for 2008 versus 2007. • Lead-210 results were similar for 2008 than for 2007. Lead-210 results at all monitoring
locations are controlled by global 222Rn concentrations (The primary source of 210Pb in air is global radon 222Rn). Radon-222 emanates from the soil and is dispersed through the atmosphere. The 222Rn decay products build in as the parent decays. The short–lived decay products of 222Rn attach to dust particles and are carried long distances with the air. Pb-210 is the longest-lived of the 222Rn decay products. The 210Pb concentration in air varies with location. The average ground level concentrations in selected states are as follows (NCRP, 1992):
NCRP Report No. 94 (NCRP, 1992) cites a mean concentration for the north temperate latitude of 0.6 mBq/m3 (1.5E-14 uCi/ml). The report also states that “It appears that re-suspension of soil is not a significant contributor to air concentrations since the ratio of Pb-210 to U-238 in surface soil is only about 2 … while the ratio in air is about 1000.” The Pb-210 concentration in air in the vicinity of the Cotter mill is within the range of the average values reported for various locations. Reference: National Council on Radiation Protection and Measurements (NCRP). 1992. NCRP Report No. 94, “Exposure of the Population in the United States and Canada from Natural Background Radiation”. NCRP Bethesda, MD.
Ten (10) air monitoring stations where environmental radon, TLD monitors, and soil sampling locations are also co-located are shown in Figure 4-1. A review of the 2008 environmental air sample data indicates that the highest annual averages for natU, 230Th, 226Ra and 232Th, are at locations as indicated below and are compared to the 2007 highest measurement. For 2008 AS-202 East Boundary was highest for:
• Natural uranium – 4.36E-16 versus 3.56E-16 microCuries/milliliter (μCi/ml) (1.61 E-11 versus 1.32E-11 Becquerel/milliliter (Bq/ml) both (AS-202 East Boundary)
• Thorium-230 – 7.21 E-16 (AS-202 East Boundary) versus 1.05E-15 (AS-209 Mill Entrance Road) μCi/ml (2.67 E-11 versus 5.18E-11 Bq/ml)
• Radium-226 – 7.92E-16 versus 8.67E-16 μCi/ml (2.93 E-11 versus3.21E-11 Bq/ml) both (AS-202 East Boundary)
For 2008:
• Lead-210 – 1.93E-14 (AS-206 North Boundary) versus 1.887E-14 (AS-202 East Boundary) (7.15E-10 versus 6.96E-10 Bq/ml)
• Thorium-232 – 3.13E-17 LP #2 (Lincoln Park #2) versus 5.43E-17 μCi/ml (1.16 E-12) versus 2.01-12 Bq/ml).
State Pb-210 concentration uBq/m3 uCi/ml
California 600 1.6 E-14 Illinois 1500 4.1 E-14 Ohio 300 8.1 E-15 Massachusetts 700 1.9 E-14

4-6
The highest sample results in 2008 for each radionuclide, when compared to the regulatory Effluent Concentration (EC) limit, indicate the following: Percent Radionuclide of Effluent Concentration (EC) Monitoring Location
• Natural uranium 0.5 AS-202 East Boundary • Thorium-230 3.6 AS-202 East Boundary • Radium-226 < 0.1 AS-202 East Boundary • Lead-210 3.2 AS-206 North Boundary • Thorium-232 0.8 Lincoln Park #2
This means that all samplers monitored for 2008 for the radioactive particulates including Lead-210 (210Pb), which as noted above is controlled by global radon concentrations, when combined, are less than ten percent (<10%) of the regulatory limit. Environmental radionuclide concentrations are compared to the Effluent Concentration (EC) limit in Part 4 Appendix B of the Radiation Regulations. The EC is equivalent to fifty (50) mrem/year. Therefore, one percent (1%) of EC is equivalent to a dose of 0.5 mrem/year. The regulatory dose limit for uranium mills per 40 CFR 190 to an actual resident is twenty-five (25) mrem/year excluding radon. The analytical results include background; that is we do not subtract the naturally occurring concentration existing in the Canon City area. Accordingly, CCMF’s results (inclusive of background) are overestimates and are not just the increment above background which would be allowed by regulation. CC-2 Canon City is generally considered as background. Therefore, for example with 230Th, the 2008 average concentration at CC-2 is five tenth percent (0.5%) of the Effluent Concentration (EC) limit and if subtracted from, for example, AS-210 Shadow Hills Estates (one point four percent (1.4%) of EC), the observed contribution from CCMF at that location is approximately nine tenth percent (0.9%) of the Effluent Limit or a dose potential of 0.45 mrem/year. Tables 4-2 through 4-6 provide tabular data from 1979 through 2008 for each monitoring location. Figures 4-2A through 4-11B provide a graphical presentation of the data for each monitoring location from 1979 through 2008.

4-7
Figure 4-1 Environmental Air and Vegetation
Sampling Locations

4-8
Figure 4-2A Environmental Air
Average Annual natU Concentrations 1979-2008
1.00E-17
1.00E-16
1.00E-15
1.00E-14
1.00E-13
1979
1980
1981
1982
1983
1984
1985
1986
1987
1988
1989
1990
1991
1992
1993
1994
1995
1996
1997
1998
1999
2000
2001
2002
2003
2004
2005
2006
2007
2008
uCi/m
l
AS-202 AS-203 AS-204 AS-206 AS-209
Effluent Concentration
Figure 4-2B Environmental Air
Average Annual natU Concentrations 1979-2008
0%
10%
20%
30%
40%
50%
60%
70%
80%
90%
100%
1979
1980
1981
1982
1983
1984
1985
1986
1987
1988
1989
1990
1991
1992
199319
9419
9519
9619
9719
9819
9920
0020
0120
0220
0320
0420
0520
0620
0720
08
Years
% o
f EC
AS-202 AS-203 AS-204 AS-206 AS-209
Effluent Concentration

4-9
Figure 4-3A Environmental Air
Average Annual natU Concentrations 1979-2008
1.00E-17
1.00E-16
1.00E-15
1.00E-14
1.00E-13
1979
1980198
1198
2198
3198
4198
519
8619
8719
8819
8919
9019
9119
9219
9319
94199
5199
6199
7199
8199
9200
020
0120
0220
0320
0420
0520
0620
0720
08
Years
uCi/m
l
AS-210 AS-212 CC #1 CC #2 LP #1 LP #2 OV-3
Effluent Concentration
Figure 4-3B
Environmental Air Average Annual natU Concentrations 1979-2008
0%
10%
20%
30%
40%
50%
60%
70%
80%
90%
100%
197919
80198
119
82198
319
84198
519
86198
719
8819
89199
019
91199
219
93199
419
95199
619
97199
819
9920
0020
0120
0220
0320
04200
520
06200
720
08
Years
% o
f EC
AS-210 AS-212 CC #1 CC #2 LP #1 LP #2 OV-3
Effluent Concentration

4-10
Table 4-2 Environmental Air
Average Annual natU Concentrations 1979-2008 (µCi/ml)
Year AS-202 AS-203 AS-204 AS-206 AS-209 AS-210 AS-212 LP #1 LP #2 CC #1 CC #2 OV-3
1979 6.19E-15 1.50E-15 2.26E-15 1.00E-15
1980 3.71E-15 1.55E-15 2.82E-15 8.36E-16 1.40E-15
1981 4.07E-15 1.54E-15 5.28E-15 8.30E-15 1.03E-15 1.02E-15 1.37E-15
1982 2.31E-15 1.26E-15 2.48E-14 2.79E-15 5.28E-16 4.79E-16 5.96E-16
1983 1.26E-15 1.43E-15 1.32E-15 1.63E-15 4.77E-16 6.86E-16 5.03E-16
1984 5.50E-16 7.64E-16 8.36E-16 1.52E-15 2.78E-16 3.27E-16 4.01E-16
1985 1.42E-15 1.22E-15 8.96E-16 1.92E-15 4.56E-16 5.77E-16 6.66E-16
1986 6.71E-16 6.56E-16 4.05E-16 9.36E-16 2.95E-16 2.93E-16 4.84E-16
1987 8.08E-16 1.03E-15 1.09E-15 1.05E-15 4.66E-16 5.12E-16 4.60E-16
1988 6.73E-16 6.96E-16 9.03E-16 5.51E-16 1.85E-16 1.95E-16 1.89E-16
1989 9.58E-17 9.95E-17 2.86E-16 3.62E-17 8.37E-17 9.38E-17 6.38E-17
1990 5.59E-17 3.14E-17 1.06E-16 3.10E-17 6.18E-17 1.26E-16 9.09E-17
1991 1.12E-16 9.18E-17 2.65E-16 1.24E-16 1.70E-16 1.57E-16 1.73E-16 1.21E-16 2.60E-16
1992 6.55E-17 7.84E-17 1.12E-16 6.48E-17 9.71E-17 6.39E-17 9.40E-17 7.88E-17 8.23E-17
1993 7.13E-17 9.08E-17 1.61E-16 6.30E-17 8.26E-17 1.20E-16 2.55E-16
1994 1.25E-16 4.68E-17 1.00E-16 3.68E-17 1.55E-16 9.68E-17 8.12E-17 2.54E-16
1995 2.99E-16 5.86E-17 1.53E-16 5.23E-17 2.11E-16 9.34E-17 1.26E-16 4.83E-16
1996 2.25E-16 1.43E-16 2.26E-16 8.62E-17 2.44E-16 7.89E-17 9.73E-17 1.25E-16 5.93E-17
1997 1.23E-16 1.18E-16 2.20E-16 1.19E-16 1.51E-16 1.75E-16 1.27E-16 2.00E-16 9.48E-17
1998 1.32E-16 1.02E-16 3.29E-16 1.06E-16 2.27E-15 2.32E-16 8.13E-17 7.50E-17 2.43E-16
1999 4.06E-16 1.49E-16 2.91E-16 3.23E-16 1.46E-15 2.82E-16 4.59E-16 1.16E-16 9.41E-17 7.97E-17
2000 4.33E-16 2.04E-16 2.61E-16 1.63E-16 1.49E-15 1.89E-16 4.82E-16 5.39E-17 5.33E-17 5.39E-17
2001 4.96E-16 6.19E-16 4.96E-16 5.29E-16 1.32E-15 2.06E-16 2.88E-16 4.96E-17 3.80E-17 5.18E-17
2002 6.50E-16 4.93E-16 6.21E-16 3.24E-16 9.91E-16 3.69E-16 4.05E-16 2.46E-16 1.59E-16 2.05E-16
2003 3.55E-16 2.19E-16 2.55E-16 2.01E-16 4.91E-16 2.21E-16 2.20E-16 2.11E-16 2.07E-16 2.62E-16
2004 2.51E-16 1.95E-16 2.40E-16 1.99E-16 6.27E-16 1.40E-16 2.30E-16 9.69E-17 9.68E-17 8.61E-17
2005 4.54E-16 2.77E-16 2.87E-16 1.58E-16 3.97E-15 4.85E-16 5.25E-16 1.68E-16 1.29E-16 1.23E-16
2006 5.14E-16 2.68E-16 3.24E-16 2.12E-16 1.72E-15 6.62E-16 3.40E-16 2.20E-16 1.75E-16 1.87E-16
2007 3.56E-16 1.51E-16 2.03E-16 1.39E-16 3.13E-16 1.46E-16 1.33E-16 1.41E-16 1.43E-16 1.27E-16
2008 4.36E-16 8.61E-17 1.72E-16 8.44E-17 2.17E-16 9.77E-17 9.78E-17 9.02E-17 8.97E-17 6.43E-17

4-11
Figure 4-4A Environmental Air
Average Annual 230Th Concentrations 1979-2008
1.00E-17
1.00E-16
1.00E-15
1.00E-14
1.00E-13
1979
1980
1981
198219
8319
8419
8519
8619
8719
8819
8919
9019
9119
9219
9319
9419
9519
9619
9719
9819
9920
0020
0120
0220
0320
0420
0520
0620
0720
08
Years
uCi/m
l
AS-202 AS-203 AS-204 AS-206 AS-209
Effluent C
oncentration
Figure 4-4B
Environmental Air Average Annual 230Th Concentrations 1979-2008
0%
50%
100%
150%
200%
250%
300%
350%
400%
450%
1979
1980
1981
1982
1983
1984
1985
198619
8719
8819
8919
9019
9119
9219
9319
9419
9519
9619
9719
9819
9920
0020
0120
0220
0320
0420
0520
0620
0720
08
Years
% o
f EC
AS-202 AS-203 AS-204 AS-206 AS-209
Effluent C
oncentration

4-12
Figure 4-5A Environmental Air
Average Annual 230Th Concentrations 1979-2008
1.00E-17
1.00E-16
1.00E-15
1.00E-14
1.00E-13
197919
8019
8119
8219
8319
8419
8519
8619
8719
8819
8919
9019
9119
9219
9319
9419
9519
9619
9719
9819
9920
0020
0120
0220
0320
0420
0520
0620
0720
08
Years
uCi/m
l
AS-210 AS-212 CC #1 CC #2 LP #1 LP #2 OV-3
Effluent C
oncentration
Figure 4-5B
Environmental Air Average Annual 230Th Concentrations 1979-2008
0%
10%
20%
30%
40%
50%
60%
70%
80%
90%
100%
1979
1980
1981
1982
1983
1984
1985
1986
1987
1988
1989
1990
1991
1992
1993
1994
1995
1996
1997
1998
1999
2000
2001
2002
2003
2004
2005
2006
2007
2008
Years
% o
f EC
AS-210 AS-212 CC #1 CC #2 LP #1 LP #2 OV-3
Effluent Concentration

4-13
Table 4-3 Environmental Air
Average Annual 230Th Concentrations 1979-2008 (µCi/ml)
Year AS-202 AS-203 AS-204 AS-206 AS-209 AS-210 AS-212 LP #1 LP #2 CC #1 CC #2 OV-3
1979 2.33E-15 1.05E-15 8.08E-15 3.07E-16
1980 2.50E-16 8.76E-16 2.81E-16 8.17E-17 1.30E-16
1981 2.60E-15 3.50E-15 3.00E-14 6.93E-15 1.42E-16 8.17E-17 3.92E-16
1982 2.12E-14 1.94E-14 8.95E-14 1.26E-14 7.49E-16 9.18E-16 3.15E-15
1983 5.86E-15 9.79E-15 5.64E-15 8.26E-15 3.74E-16 3.12E-16 1.07E-15
1984 1.64E-15 2.98E-15 3.82E-15 6.35E-15 2.69E-16 2.00E-16 2.89E-16
1985 1.84E-15 2.15E-15 4.86E-15 3.73E-15 2.60E-16 2.64E-16 2.84E-16
1986 3.70E-15 5.55E-15 3.13E-15 4.68E-15 3.70E-16 3.08E-16 2.41E-16
1987 1.21E-15 1.29E-15 2.28E-15 1.08E-15 2.06E-16 1.77E-16 9.90E-17
1988 2.58E-15 3.51E-15 5.85E-15 2.05E-15 1.41E-16 1.72E-16 1.70E-16
1989 6.33E-16 3.85E-16 9.17E-16 1.08E-16 8.93E-17 9.03E-17 9.24E-17
1990 7.63E-16 4.00E-16 5.86E-16 1.09E-16 7.40E-17 7.04E-17 7.20E-17
1991 7.25E-16 4.59E-16 8.75E-16 2.83E-16 1.91E-16 1.29E-16 1.25E-16 1.01E-16 1.33E-16
1992 4.57E-16 2.20E-16 4.71E-16 9.46E-17 6.58E-17 6.39E-17 5.98E-17 6.23E-17 9.56E-17
1993 4.45E-16 3.03E-16 6.42E-16 9.32E-17 1.06E-16 9.17E-17 2.33E-16
1994 1.18E-15 2.96E-16 1.08E-15 1.24E-16 9.20E-16 1.54E-16 1.16E-16 2.83E-16
1995 1.65E-15 5.33E-16 1.24E-15 1.18E-16 8.88E-16 9.80E-17 1.12E-16 3.30E-16
1996 2.21E-15 2.95E-16 8.13E-16 8.85E-17 7.67E-16 2.33E-16 7.11E-17 5.08E-17 6.39E-17
1997 7.64E-16 1.31E-16 6.17E-16 6.49E-17 1.99E-15 3.82E-16 8.37E-17 7.86E-17 3.24E-17
1998 2.88E-15 2.02E-16 9.34E-16 1.15E-16 2.17E-15 3.32E-16 7.70E-17 7.99E-17 7.82E-17
1999 3.76E-15 3.24E-16 1.09E-15 1.84E-16 2.19E-15 4.15E-16 3.02E-16 7.37E-17 9.51E-17 1.11E-16
2000 1.22E-15 2.48E-16 1.01E-15 2.02E-16 4.16E-15 4.71E-16 6.69E-16 1.47E-16 1.57E-16 1.27E-16
2001 8.20E-16 5.19E-16 9.67E-16 2.61E-16 4.15E-15 4.04E-16 4.61E-16 1.56E-16 9.95E-17 1.13E-16
2002 5.84E-16 2.76E-16 5.95E-16 2.57E-16 1.25E-15 2.38E-16 3.13E-16 8.15E-17 8.54E-17 8.55E-17
2003 5.19E-16 2.62E-16 4.90E-16 9.73E-17 1.40E-15 4.11E-16 1.77E-16 8.27E-17 8.91E-17 5.30E-17
2004 2.17E-16 8.26E-17 3.87E-16 8.33E-17 6.57E-16 2.26E-16 1.08E-16 5.36E-17 5.62E-17 6.07E-17
2005 3.17E-16 1.97E-16 3.51E-16 2.64E-16 3.41E-15 4.85E-16 4.81E-16 1.04E-16 1.05E-16 1.08E-16
2006 5.17E-16 2.91E-16 4.74E-16 1.77E-16 1.40E-15 4.73E-16 3.27E-16 2.73E-16 2.04E-16 2.85E-16
2007 6.62E-16 1.90E-16 4.32E-16 1.48E-16 1.05E-15 2.77E-16 2.23E-16 1.68E-16 1.57E-16 1.53E-16
2008 7.21E-16 1.87E-16 5.12E-16 1.32E-16 6.21E-16 2.88E-16 2.05E-16 1.11E-16 1.08E-16 1.16E-16

4-14
Figure 4-6A Environmental Air
Average Annual 226Ra Concentrations 1979-2008
1.00E-17
1.00E-16
1.00E-15
1.00E-14
1.00E-13
1979
1980
1981
1982
1983
1984
1985
1986
1987
1988
1989
1990
1991
1992
1993
1994
1995
1996
1997
1998
1999
2000
2001
2002
2003
2004
2005
2006
2007
2008
Years
uCi/m
l
AS-202 AS-203 AS-204 AS-206 AS-209
Effluent Concentration
Figure 4-6B Environmental Air
Average Annual 226Ra Concentrations 1979-2008
0%
10%
20%
30%
40%
50%
60%
70%
80%
90%
100%
1979
1980
1981
1982
1983
1984
1985
1986
1987
1988
1989
1990
1991
1992
1993
1994
1995
1996
1997
1998
1999
2000
2001
2002
2003
2004
2005
2006
2007
2008
Years
% o
f EC
AS-202 AS-203 AS-204 AS-206 AS-209
Effluent Concentration

4-15
Figure 4-7A Environmental Air
Average Annual 226Ra Concentrations 1979-2008
1.00E-17
1.00E-16
1.00E-15
1.00E-14
1.00E-13
1979198
0198
1198
2198
3198
4198
5198
6198
7198
8198
9199
0199
1199
2199
3199
4199
5199
6199
7199
8199
9200
0200
1200
2200
3200
4200
5200
6200
7200
8
Years
uCi/m
l
AS-210 AS-212 CC #1 CC #2 LP #1 LP #2 OV-3
Effluent Concentration
Figure 4-7B
Environmental Air Average Annual 226Ra Concentrations 1979-2008
0%
10%
20%
30%
40%
50%
60%
70%
80%
90%
100%
1979
1980
1981
1982
1983
1984
1985
1986
1987
1988
1989
1990
1991
1992
1993
1994
1995
1996
1997
1998
1999
2000
2001
2002
2003
2004
2005
2006
2007
2008
Years
% o
f EC
AS-210 AS-212 CC #1 CC #2 LP #1 LP #2 OV-3
Effluent Concentration

4-16
Table 4-4 Environmental Air
Average Annual 226Ra Concentrations 1979-2008 (µCi/ml)
Year AS-202 AS-203 AS-204 AS-206 AS-209 AS-210 AS-212 LP #1 LP #2 CC #1 CC #2 OV-3
1979 1.55E-15 3.75E-16 7.89E-15 3.07E-16
1980 3.61E-15 7.81E-16 1.62E-15 2.78E-16 1.58E-15
1981 4.19E-15 2.35E-15 2.94E-15 2.96E-15 3.79E-16 4.59E-16 6.30E-16
1982 6.53E-15 6.92E-15 3.81E-15 3.82E-15 6.07E-16 4.02E-16 1.25E-15
1983 2.00E-15 5.08E-15 4.95E-15 2.85E-15 9.42E-17 1.76E-16 5.30E-16
1984 1.11E-15 1.84E-15 3.63E-15 2.20E-15 1.18E-16 1.67E-16 1.87E-16
1985 9.63E-15 1.11E-15 1.78E-15 1.97E-15 1.69E-16 1.88E-16 1.89E-16
1986 1.47E-15 1.98E-15 1.61E-15 2.60E-15 1.43E-16 3.45E-16 2.22E-16
1987 5.91E-16 7.52E-16 1.19E-15 4.74E-16 1.83E-16 1.15E-16 1.89E-16
1988 1.29E-15 2.05E-15 2.53E-15 3.60E-16 1.24E-16 5.09E-17 1.09E-16
1989 2.72E-16 1.81E-16 3.30E-16 4.79E-17 1.02E-16 8.89E-17 7.77E-17
1990 1.75E-16 1.68E-16 1.92E-16 4.36E-17 6.69E-17 8.36E-17 7.82E-17
1991 1.19E-16 1.25E-16 2.68E-16 6.17E-17 6.85E-17 4.33E-17 7.16E-17 6.09E-17 1.37E-16
1992 8.46E-17 7.30E-17 1.50E-15 3.71E-17 5.10E-17 4.60E-17 5.80E-17 4.73E-17 1.17E-16
1993 9.11E-17 1.14E-16 2.49E-16 5.99E-17 6.14E-17 6.72E-17 2.20E-16
1994 1.03E-16 7.57E-17 1.69E-16 4.96E-17 1.55E-16 7.80E-17 8.68E-17 2.64E-16
1995 1.21E-16 1.14E-16 2.07E-16 7.46E-17 2.06E-16 6.88E-17 1.05E-16 3.99E-16
1996 1.78E-16 1.02E-16 2.08E-16 5.33E-17 2.11E-16 5.82E-17 5.22E-17 6.67E-17 3.59E-17
1997 1.29E-16 7.55E-17 2.01E-16 5.66E-17 9.45E-16 1.06E-16 5.09E-17 5.40E-17 4.84E-17
1998 2.89E-16 8.22E-17 2.95E-16 9.43E-17 1.34E-15 1.21E-16 6.21E-17 6.71E-17 4.24E-17
1999 4.18E-16 1.29E-16 3.81E-16 1.02E-16 1.26E-15 1.46E-16 2.13E-16 8.27E-17 9.21E-17 5.90E-17
2000 3.37E-16 1.53E-16 4.64E-16 1.40E-16 2.38E-15 2.21E-16 4.60E-16 7.41E-17 4.64E-17 5.10E-17
2001 2.15E-16 2.09E-16 4.36E-16 1.38E-16 1.92E-15 1.51E-16 1.99E-16 7.01E-17 6.82E-17 5.16E-17
2002 1.55E-16 1.17E-16 2.34E-16 7.51E-17 3.83E-16 1.05E-16 1.14E-16 8.41E-17 6.07E-17 6.72E-17
2003 1.45E-16 1.10E-16 1.75E-16 8.02E-17 2.96E-16 1.23E-16 9.65E-17 9.70E-17 8.40E-17 8.93E-17
2004 7.81E-17 7.35E-17 1.41E-16 6.14E-17 3.30E-16 9.05E-17 8.14E-17 5.79E-17 6.26E-17 4.95E-17
2005 1.78E-16 1.56E-16 1.75E-16 1.97E-16 2.29E-15 2.49E-16 2.95E-16 1.08E-16 1.22E-16 9.58E-17
2006 4.10E-16 1.40E-16 2.17E-16 1.34E-16 7.52E-16 1.69E-16 1.42E-16 1.20E-16 1.03E-16 1.15E-16
2007 8.67E-16 1.11E-16 2.07E-16 1.00E-16 2.31E-16 1.16E-16 9.11E-17 1.09E-16 9.66E-17 1.11E-16
2008 7.92E-16 7.36E-17 2.00E-16 5.16E-17 1.78E-16 7.33E-17 5.71E-17 6.21E-17 5.91E-17 3.28E-17

4-17
Figure 4-8A Environmental Air
Average Annual 210Pb Concentrations 1979-2008
1.00E-15
1.00E-14
1.00E-13
1.00E-12
1979
1980
1981
1982
198319
8419
8519
8619
8719
8819
8919
9019
9119
9219
9319
9419
9519
9619
9719
9819
9920
0020
0120
0220
0320
0420
0520
0620
0720
08
Years
uCi/m
l
AS-202 AS-203 AS-204 AS-206 AS-209
Effluent C
oncentration
Figure 4-8B
Environmental Air Average Annual 210Pb Concentrations 1979-2008
0%
10%
20%
30%
40%
50%
60%
70%
80%
90%
100%
1979
1980
1981
1982
1983
1984
1985
1986
1987
1988
1989
1990
1991
1992
1993
1994
1995
1996
1997
1998
1999
2000
2001
2002
2003
2004
2005
2006
2007
2008
Years
% o
f EC
AS-202 AS-203 AS-204 AS-206 AS-209
Effluent Concentration
4-18
Figure 4-9A Environmental Air
Average Annual 210Pb Concentrations 1979-2008
1.00E-15
1.00E-14
1.00E-13
1.00E-12
1979
1980
1981
1982
1983
1984
1985
198619
8719
8819
8919
9019
9119
9219
9319
9419
9519
9619
9719
9819
9920
0020
0120
0220
0320
0420
0520
0620
0720
08
Years
uCi/m
l
AS-210 AS-212 CC #1 CC #2 LP #1 LP #2 OV-3
Effluent C
oncentration
Figure 4-9B
Environmental Air Average Annual 210Pb Concentrations 1979-2008
0%
10%
20%
30%
40%
50%
60%
70%
80%
90%
100%
1979
1980
1981
1982
1983
1984
1985
1986
1987
1988
1989
1990
1991
1992
1993
1994
1995
1996
1997
1998
1999
2000
2001
2002
2003
2004
2005
2006
2007
2008
Years
% o
f EC
AS-210 AS-212 CC #1 CC #2 LP #1 LP #2 OV-3
Effluent C
oncentration

4-19
Table 4-5 Environmental Air
Average Annual 210Pb Concentrations 1979-2008 (µCi/ml)
Year AS-202 AS-203 AS-204 AS-206 AS-209 AS-210 AS-212 LP #1 LP #2 CC #1 CC #2 OV-3
1979 2.11E-14 1.65E-14 2.08E-14 2.30E-14
1980 1.81E-14 1.69E-14 1.25E-14 1.86E-14 1.98E-14
1981 2.01E-14 1.72E-14 4.71E-14 2.34E-14 1.57E-14 1.70E-14 2.11E-14
1982 3.87E-14 4.35E-14 9.95E-14 4.07E-14 2.50E-14 3.31E-14 4.05E-14
1983 1.70E-14 1.73E-14 1.82E-14 1.95E-14 1.29E-14 1.79E-14 1.44E-14
1984 1.44E-14 1.46E-14 1.60E-14 1.43E-14 1.26E-14 1.15E-14 1.48E-14
1985 9.12E-15 8.12E-15 8.80E-15 9.30E-15 9.97E-15 1.14E-14 9.90E-15
1986 1.26E-14 1.19E-14 1.12E-14 1.22E-14 1.07E-14 1.22E-14 8.81E-15
1987 1.95E-14 1.92E-14 2.22E-14 2.35E-14 2.17E-14 2.01E-14 1.43E-14
1988 2.15E-14 1.94E-14 2.10E-14 1.93E-14 2.04E-14 2.11E-14 1.76E-14
1989 2.28E-14 2.30E-14 1.98E-14 2.34E-14 2.43E-14 2.35E-14 2.40E-14
1990 2.05E-14 2.10E-14 2.07E-14 2.07E-14 2.24E-14 2.00E-14 1.95E-14
1991 2.40E-14 2.15E-14 2.15E-14 2.13E-14 2.23E-14 2.34E-14 2.15E-14 2.33E-14 1.07E-14
1992 2.16E-14 2.00E-14 2.20E-14 2.19E-14 1.99E-14 2.11E-14 1.61E-14 2.05E-14 2.20E-14
1993 2.38E-14 2.35E-14 2.35E-14 2.49E-14 2.22E-14 2.13E-14 2.10E-14
1994 2.21E-14 2.07E-14 2.10E-14 2.24E-14 2.18E-14 2.33E-14 2.38E-14 2.06E-14
1995 2.07E-14 2.07E-14 2.02E-14 2.01E-14 2.11E-14 1.97E-14 2.03E-14 1.74E-14
1996 2.02E-14 2.01E-14 2.16E-14 2.21E-14 2.11E-14 2.08E-14 1.96E-14 1.98E-14
1997 2.21E-14 2.07E-14 2.12E-14 2.20E-14 2.26E-14 2.05E-14 2.13E-14 2.00E-14 1.98E-14
1998 2.01E-14 2.07E-14 1.98E-14 2.11E-14 2.01E-14 1.93E-14 2.01E-14 2.01E-14 1.93E-14
1999 2.14E-14 1.94E-14 1.83E-14 1.84E-14 2.03E-14 1.94E-14 2.03E-14 2.03E-14 1.94E-14 1.78E-14
2000 2.07E-14 2.05E-14 2.01E-14 2.23E-14 2.37E-14 2.00E-14 2.07E-14 2.16E-14 2.08E-14 2.03E-14
2001 3.10E-14 3.04E-14 2.91E-14 3.11E-14 3.06E-14 2.94E-14 3.12E-14 3.06E-14 2.96E-14 2.79E-14
2002 2.36E-14 2.20E-14 2.28E-14 2.25E-14 2.30E-14 2.37E-14 2.40E-14 2.46E-14 2.33E-14 2.17E-14
2003 2.19E-14 2.11E-14 2.16E-14 2.06E-14 2.28E-14 2.12E-14 2.18E-14 2.11E-14 1.94E-14 2.27E-14
2004 1.72E-14 1.64E-14 1.58E-14 1.60E-14 1.66E-14 1.45E-14 1.79E-14 1.56E-14 1.54E-14 1.59E-14
2005 2.45E-14 2.74E-14 2.82E-14 2.54E-14 3.11E-14 2.91E-14 2.92E-14 3.11E-14 3.15E-14 2.94E-14
2006 2.11E-14 2.31E-14 2.47E-14 2.31E-14 2.09E-14 2.08E-14 1.89E-14 1.98E-14 1.89E-14 2.12E-14
2007 1.88E-14 1.64E-14 1.79E-14 1.82E-14 1.54E-14 1.58E-14 1.49E-14 1.66E-14 1.61E-14 1.72E-14
2008 1.65E-14 1.48E-14 1.64E-14 1.93E-14 1.66E-14 1.73E-14 1.57E-14 1.67E-14 1.61E-14 1.61E-14

4-20
Figure 4-10A
Environmental Air Average Annual 232Th Concentrations 1979-2008
1.00E-18
1.00E-17
1.00E-16
1.00E-15
1.00E-14
2001
2002
2003
2004
2005
2006
2007
2008
Years
uCi/m
l
AS-202 AS-203 AS-204 AS-206 AS-209
Effluent C
oncentration
Figure 4-10B
Environmental Air Average Annual 232Th Concentrations 1979-2008
0%
10%
20%
30%
40%
50%
60%
70%
80%
90%
100%
2001
2002
2003
2004
2005
2006
2007
2008
Years
% o
f EC
AS-202 AS-203 AS-204 AS-206 AS-209
Effluent C
oncentration

4-21
Figure 4-11A Environmental Air
Average Annual 232Th Concentrations 1979-2008
1.00E-18
1.00E-17
1.00E-16
1.00E-15
1.00E-14
2001
2002
2003
2004
2005
2006
2007
2008
Years
uCi/m
l
AS-210 AS-212 CC #2 LP #2 OV-3
Effluent C
oncentration
Figure 4-11B
Environmental Air Average Annual 232Th Concentrations 1979-2008
0.0%
10.0%
20.0%
30.0%
40.0%
50.0%
60.0%
70.0%
80.0%
90.0%
100.0%
2001
2002
2003
2004
2005
2006
2007
2008
Years
% o
f EC
AS-210 AS-212 CC #2 LP #2 OV-3
Effluent Concentration

4-22
Table 4-6 Environmental Air
Average Annual 232Th Concentrations 1979-2008 (µCi/ml)
Year AS-202 AS-203 AS-204 AS-206 AS-209 AS-210 AS-212 LP #2 CC #2 OV-3
2001 5.78E-17 7.62E-17 6.97E-17 6.37E-17 8.32E-17 4.58E-17 6.67E-17 6.85E-17 8.33E-17 5.68E-17
2002 4.67E-17 3.81E-17 3.09E-17 4.55E-17 4.34E-17 3.17E-17 3.35E-17 5.36E-17 3.51E-17 4.68E-17
2003 4.57E-17 4.14E-17 4.84E-17 2.06E-17 5.72E-17 4.61E-17 3.71E-17 6.21E-17 4.61E-17 3.96E-17
2004 1.39E-17 2.53E-17 2.53E-17 1.40E-17 1.57E-17 1.99E-17 1.65E-17 3.24E-17 2.28E-17 2.39E-17
2005 2.83E-17 2.40E-17 2.86E-17 3.09E-17 3.36E-17 2.53E-17 3.42E-17 3.99E-17 3.57E-17 3.45E-17
2006 4.11E-17 5.18E-17 4.82E-17 4.29E-17 5.54E-17 4.33E-17 4.79E-17 6.25E-17 4.98E-17 3.65E-17
2007 4.07E-17 3.47E-17 4.60E-17 4.14E-17 4.12E-17 3.99E-17 3.51E-17 5.43E-17 4.48E-17 3.92E-17
2008 1.08E-17 1.63E-17 1.15E-17 9.89E-18 1.57E-17 2.30E-17 1.26E-17 3.13E-17 2.25E-17 2.03E-17
ENVIRONMENTAL RADON Beginning in the second (2nd) quarter of 2002 combined 220Rn (from natural thorium) and 222Rn (from natural uranium) measurements were conducted at all locations. Radon-220/222 levels measured for 2008 are all lower than for 2007 with the exception of AS-212 Nearest Resident and indicate a low range of concentrations for all monitors. Second (2nd) quarter 2008 results were lower than normal yet within historical levels. A significant part of the period was moist and may account for the lower results. Figures 4-12 through 4-14 and Table 4-7 show the concentrations for 220Rn/222Rn for 1979-2008 and indicate a similar pattern over time at all locations. This is indicative of natural fluctuations (i.e. background) in the release of 220Rn/222Rn (see discussion above relative to 210Pb monitoring under Environmental Air Particulate). Note that AS-206 is grouped with AS-210 and AS-212 because they use the same equilibrium fraction. As expected, 1979 through 2008 data (Table 4-7 and Figures 4-12 through 4-14) demonstrate slightly elevated readings at boundary locations with readings in residential areas at background levels. Comparison to the CDPHE required equilibrium factors and EC limits per the CDPHE letter of June 24, 2004 is shown in Table 4-8. Background mean is calculated for 2007 and 2008 as also specified in CDPHE letter of June 24, 2004. The background mean is added to the Alternate Effluent limits and compared to the annual average results. Therefore, in this case the measured 220Rn/222Rn is compared to background plus the equilibrium-based standard, thus comparing the actual measurement of 220Rn/222Rn attributable to CCMF’s operations against the established standard. All locations were well below the Effective Effluent Limit for the year 2008.

4-23
Figure 4-12
Environmental Air Average Annual 222Rn Concentration
0200400600800
10001200140016001800200022002400
1979
1980
1981
1982
1983
1984
1985
1986
1987
1988
1989
1990
1991
1992
1993
1994
1995
1996
1997
1998
1999
2000
2001
2002
2003
2004
2005
2006
2007
2008
Years
pCi/m
3 (a
vg)
AS-202 AS-203 AS-204 AS-209
Figure 4-13
Environmental Air Average Annual 222Rn Concentration
0
200
400
600
800
1000
1200
1400
1600
1800
2000
2200
2400
1979
1980
1981
1982
1983
1984
1985
1986
1987
1988
1989
1990
1991
1992
1993
1994
1995
1996
1997
1998
1999
2000
2001
2002
2003
2004
2005
2006
2007
2008
Years
pCi/m
3 (a
vg)
CC LP OV-3

4-24
Figure 4-14
Environmental Air Average Annual 222Rn Concentration
0200
400600
8001000
12001400
16001800
20002200
2400
1979
1980
1981
1982
1983
1984
1985
1986
1987
1988
1989
1990
1991
1992
1993
1994
1995
1996
1997
1998
1999
2000
2001
2002
2003
2004
2005
2006
2007
2008
Years
pCi/m
3 (a
vg)
AS-206 AS-210 AS-212

4-25
Table 4-7
222Rn (pCi/m3) 1979-2008
Year AS-202 AS-203 AS-204 AS-206 AS-209 AS-210 AS-212 CC LP OV-3 1979 420 460 785 707
1980 330 250 240 310 293
1981 380 378 520 970 260 260 395
1982 470 579 1360 923 657 1040 576
1983 916 705 875 1190 419 492 648
1984 610 720 650 850 414 544 895
1985 660 690 820 830 560 470 572
1986 1940 1510 1440 1090 1250 1370 1050
1987 775 675 800 875 775 400 475
1988 525 900 975 775 833 550 450
1989 725 1030 950 525 850 500 500
1990 500 375 500 325 325 375 158
1991 400 450 475 475 475 325 293
1992 725 750 650 500 500 575 475
1993 375 325 375 350 275 250 120
1994 590 580 650 690 980 560 500 540
1995 500 450 580 500 680 450 450 380
1996 680 650 900 780 1030 880 660 700 700
1997 820 720 750 600 800 720 690 720 560
1998 560 500 520 550 920 600 450 430 520
1999 750 725 700 550 1025 850 733 975 725 450
2000 1050 1000 1233 825 1533 1267 1250 1050 900 750
2001 192 375 325 160 350 218 192 192 268 267
2002 543 975 1125 693 1475 700 698 875 673 625
2003 700 825 775 900 625 675 700 375 800 567
2004 1500 850 1025 950 1100 850 925 825 875 825
2005 925 1025 850 700 1025 675 775 700 900 800
2006 1250 1275 1275 1450 1400 1125 1275 1075 1375 1200
2007 1000 1100 1175 1100 1250 975 825 925 1175 975
2008 850 900 925 950 1075 950 850 800 925 825

4-26
Table 4-8 Alternate Effluent Limit Comparison for 222Rn
2007 – 2008 Background Concentrations (pCi/ m3)
CC LP OV3 Background (BKG)
MEAN
Standard Deviation of
MEAN
BKG + 2 Standard
Deviations of MEAN
2008 2nd half Q1 N/A N/A N/A Q2 N/A N/A N/A Q3 900 1100 900 Q4 900 1000 1100 983 28 1040
2008 1st half Q1 1300 1300 1100 Q2 100 300 200 Q3 N/A N/A N/A Q4 N/A N/A N/A 717 166 1049
2007 2nd half Q1 N/A N/A N/A Q2 N/A N/A N/A Q3 1300 1700 1500 Q4 1300 1100 1100 1333 68 1468
Assumed Equilibrium
Fraction
Alternate Effluent
Limit
Effective Effluent Limit = Alternate Effluent Limit + BKG + 2
Standard Deviations of MEAN
Average Radon
(including BKG)
Year Sampler Location (pCi/m3) (pCi/m3) (pCi/m3) (pCi/m3) > Effluent Limit?
2008 2nd half AS 202 0.2 500 1540 800 no AS 203 0.2 500 1540 900 no AS 204 0.2 500 1540 1100 no AS 206 0.4 250 1290 1000 no AS 209 0.2 500 1540 1100 no AS 210 0.4 250 1290 900 no AS 212 0.4 250 1290 900 no
2008 1st half AS 202 0.2 500 1549 900 no AS 203 0.2 500 1549 850 no AS 204 0.2 500 1549 900 no AS 206 0.4 250 1299 900 no AS 209 0.2 500 1549 950 no AS 210 0.4 250 1299 950 no AS 212 0.4 250 1299 800 no
2007 2nd half AS 202 0.2 500 1968 1300 no AS 203 0.2 500 1968 1500 no AS 204 0.2 500 1968 1600 no AS 206 0.4 250 1718 1450 no AS 209 0.2 500 1968 1500 no AS 210 0.4 250 1718 1300 no AS 212 0.4 250 1718 1100 no

4-27
ENVIRONMENTAL TLD Environmental Thermoluminescent Dosimeters (TLDs) were used in 2008 at the environmental air sampler locations and 1979-2008 readings are displayed in Figures 4-15, 4-16, and Table 4-9. The range of exposure rates is from 10.2 µR/hr to 18.7 µR/hr. All locations were slightly higher than for 2007. All readings are within range of historical levels. Cañon City (CC-2) has been designated as the local background with a reading of 10.2 µR/hr which is equivalent to eighty-nine (89) mrem/year (0.89 mSv/y), dose from background external sources. The highest measured gamma level was 18.7 μR/hr (0.2 μGray/hour (μGy/h)) at AS-209, along the mill entrance road. This is a slightly higher than 2007 but lower than all previous years. The elevated exposure rate may be attributable to past spillage of ore and other materials along the entrance road over time. CCMF commissioned a study by MFG, Inc. entitled Assessment of Potential Dose to Members of the Public from Materials Along Roads Near the Cotter Corporation Canon City Milling Facility for the entrance road and the county road north past the Shadow Hills Golf Club. This report was to CDPHE and the community and demonstrated that the risk to nearby golfers and community residents was well within acceptable regulatory criteria. However, at the request of the Fremont County Independent Outreach Committee (FCIOC) an “As Low As Reasonably Achievable” (ALARA) based soil removal work plan for the entrance road was prepared by MFG, Inc. and was approved by CDPHE. Initial characterization and soil removal along part of the entry road was accomplished in the fall of 2006. Cleanup was completed in 2007.

4-28
Figure 4-15 Environmental Air
Average Annual Environmental TLD Concentrations 1979-2008
0
5
10
15
20
25
30
35
40
45
50
1979198
0198
1198
2198
3198
4198
5198
6198
7198
8198
9199
0199
1199
2199
3199
4199
5199
6199
7199
8199
9200
0200
1200
2200
3200
4200
5200
6200
7200
8
YearsAS-202 AS-203 AS-204 AS-206 AS-209
uR/h
r (a
vg)
Figure 4-16 Environmental Air
Average Annual Environmental TLD Concentrations 1979-2008
0
5
10
15
20
25
30
35
40
45
50
1979198
0198
1198
2198
3198
4198
5198
6198
7198
8198
9199
0199
1199
2199
3199
4199
5199
6199
7199
8199
9200
0200
1200
2200
3200
4200
5200
6200
7200
8
AS-210 AS-212 CC#2 LP#2 OV#3
uR/h
r (a
vg)

4-29
Table 4-9 Environmental TLD (µR/hr)
2008 Year AS-202 AS-203 AS-204 AS-206 AS-209 AS-210 AS-212 CC LP OV3 1979 14.0 12.6 12.7 11.8 11.4
1980 13.4 11.7 12.9 10.4 11.4
1981 14.3 12.8 12.7 10.6 12.3 12.3
1982 13.7 12.6 14.7 20.4 9.9 11.2 12.7
1983 13.6 12.6 14.2 15.6 10.6 11.6 12.0
1984 14.5 14.3 14.6 14.8 12.3 11.2 13.2
1985 14.3 13.5 14.5 14.8 10.5 11.2 12.3
1986 13.9 13.7 14.5 14.2 11.0 10.7 11.8
1987 12.9 12.5 12.6 12.6 9.6 9.7 10.4
1988 15.0 13.6 12.8 13.4 9.3 11.6 10.2
1989 14.7 14.9 15.3 15.9 10.6 13.7 11.9
1990 13.2 13.1 14.8 15.2 9.6 11.5 11.7
1991 14.1 13.2 15.7 17.5 10.0 12.9 12.4
1992 13.7 13.2 16.0 18.3 9.6 12.1 11.3
1993 12.5 12.6 14.4 15.6 8.6 10.7 10.9
1994 14.3 13.8 15.9 16.2 27.8 10.8 12.1 12.3
1995 12.5 13.7 14.0 15.4 23.0 9.2 10.3 11.3
1996 13.1 13.2 14.5 16.2 27.2 13.0 9.7 10.9 11.4
1997 12.6 13.1 13.8 15.7 29.1 12.3 9.1 10.2 11.1
1998 12.3 12.0 13.4 15.9 28.0 12.0 9.0 10.3 11.5
1999 12.7 12.0 13.8 16.0 29.6 12.2 9.1 9.3 10.6 10.9
2000 12.7 12.6 14.7 16.6 27.7 12.5 9.3 9.5 10.7 11.4
2001 13.7 14.3 15.4 18.6 26.2 13.9 9.7 10.4 12.0 12.2
2002 14.0 14.4 15.9 17.7 30.3 14.3 10.5 10.5 12.3 12.6
2003 12.8 13.3 14.8 15.5 27.7 13.3 10.0 10.0 11.7 11.8
2004 13.6 14.1 15.5 14.7 25.5 14.2 10.9 10.5 12.2 12.5
2005 12.8 13.5 14.8 13.8 22.9 12.9 9.9 10.1 11.5 11.5
2006 12.7 13.4 14.6 14.2 21.5 12.6 9.5 10.1 11.5 11.7
2007 12.9 13.2 14.6 14.1 17.8 12.7 9.5 10.1 11.5 11.6
2008 13.9 13.5 15.5 14.9 18.7 13.3 10.2 10.8 12.2 12.6

4-30
METEOROLOGICAL MONITORING The meteorological monitoring station performance was excellent in 2008. Overall data recovery during 2008 was ninety-nine point twenty-five percent (99.25%), compared to one hundred percent (100%) in 2007. Data for the 2007 and 2008 monitoring periods are shown in Table 4-10 and 4-11. The evaporation system operated from April 8th to October 24th, 2008. Total evaporation during the 2008 monitoring period was sixty-two point six (62.6) inches, which averages approximately zero point thirty-one (0.31) inches per day (one hundred ninety-nine (199) days measured). The average evaporation rate of zero point thirty-one (0.31) inches per day is about twenty percent (20%) higher than the rate for 2007 and prior years. The total precipitation for 2008 of five point eighteen (5.18) inches, measured at the meterological station, was much lower than the average annual precipitation of thirteen (13.0) inches. A manual rain gauge indicated annual precipitation of eight point forty-three (8.43) inches. The year 2006 was by far the wettest year during the 2000’s with an annual precipitation total of fourteen point zero one (14.01) inches, while the driest year was the drought year of 2002 with four point thirty-seven (4.37) inches of precipitation. The 2008 annual Wind Rose was generated based on eight thousand seven hundred eighteen (8,718) hours of wind data. The 2008 Wind Rose (Figure 4-18) indicates that the winds were predominantly westerly with a smaller easterly component and can be compared to the 2007 Wind Rose (Figure 4-17). The westerly (SW to NW) winds comprised fifty-five percent (55%) of the total winds whereas the easterly (NE to SE) winds comprised approximately twenty-six percent (26%) with the remaining nineteen percent (19%) of the winds distributed over the southerly and northerly directions. The calm winds less than four miles per hour (<4.0 mph) comprised twenty point four percent (20.4%) of the hourly readings. Wind speed averages reaching as high as a Class 6 rating greater than twenty four point seven miles per hour (>24.7 mph) did not occur during 2008. The wind speed averages ranged from zero point zero (0.0) to nineteen point one miles per hour (19.1 mph). The winds occurred at approximately the same speeds and frequency as in previous years. Winds in the Class 2 (4.0-7.5 mph) and the Class 3 (7.5-12.1 mph) ranges accounted for approximately sixty-seven percent (67%) of the winds in 2008. The Wind Rose data for 2008 is very comparable to 2007.
Table 4-10
2007 Meteorological Summary
WS mph
WD Deg
AT Deg-F
RH %
RN inch
BP inHg
Average 7.52 53.8 44.7% 24.46 Total 9.75 Max 24.0 95.8 96.2% 25.54 Min 0.0 -0.8 2.5% 23.14
% recovery 100% 100% 100% 100% 100% % recovery total 100%
East winds 26.06% West winds 55.5%
Evaporation Total inches 55.82 (April 2nd to November 2nd)

4-31
Table 4-11
2008 Meteorological Summary
WS mph
WD Deg
AT Deg-F
RH %
RN inch
BP inHg
Average 7.70 53.4 40.7% 24.43 Total 5.18 Max 24.6 94.9 96.8% 24.96 Min 0.0 -0.7 2.4% 23.76
% recovery 99.25% 99.25% 99.25% 99.25% 99.25% % recovery total 99.25%
East winds 25.80% West winds 54.6%
Evaporation Total inches 62.60 (April 8th to October 24th)
KEY: WS = Wind Speed WD = Wind Direction AT = Air Temperature RH = Relative Humidity RN = Rainfall BP = Barometric Pressure

4-32
Figure 4-17
Wind Rose Plot 2007

4-33
Figure 4-18
Wind Rose Plot 2008

4-34
VEGETATION Vegetation samples were collected three (3) times during the growing season in 2008. Vegetation samples were predominantly comprised of natural browse grass and were collected at the locations shown in Section 4 of the already submitted report (Figure 4-1). Sampling protocol and location selection criteria was modified in 2005 to comply with changes in the vegetation sampling procedure. Sample locations since 2005 were chosen based on the highest predicted levels of deposition as determined by MILDOS computer modeling. Samples for 2007 were analyzed for natU, 230Th, 226Ra, 210Pb, 232Th and Molybdenum (Table 4-11). Note that comparisons are made to historical results from the sampled locations as well as other locations. Please check the footnotes for clarity. The variability in sample concentrations can generally be attributed to plant growth, plant species variability, and precipitation. Vegetation samples are not washed prior to analysis; therefore, results may reflect the presence of dust on the plant material. The analytical results for 2008 are generally similar when compared to the range of historical sample results at these and other comparable locations.
• The highest 2008 natU concentration was 217 pCi/kg (8.0 Bq/kg) at AS-202 (East Boundary). The lowest 2008 natU concentration was 14.0 pCi/kg (0.52 Bq/kg) and was measured at AS-212 (Nearest Resident). Sample results are within the historical range of samples collected at these and nearby locations.
• The highest 230Th concentration was 395 pCi/kg (14.6 Bq/kg) at the AS-202 (East Boundary). The lowest concentration was 26 pCi/kg (1 Bq/kg) at AS-212 (Nearest Resident). One (1) sample result is above the historical range of samples collected at these and nearby locations.
• The highest 226Ra concentration was 371 pCi/kg (13.7 Bq/kg); at the AS-202 (East Boundary). The lowest concentration was 24 pCi/kg (0.9 Bq/kg); at the AS-212 (Nearest Resident). One (1) sample result is above the historical range of samples collected at these and nearby locations.
• The highest 210Pb concentration was 1,556 pCi/kg (57.6 Bq/kg); at the AS-202 (East Boundary). The lowest 210Pb concentration was 94 pCi/kg (3.5 Bq/kg); at the AS-209 (Mill Entrance Road). Two (2) sample results are above the historical range of samples collected at these and nearby locations.
• The highest 232Th concentration measured in 2008 was 16 pCi/kg (0.6 Bq/kg); at the AS-202 (East Boundary). The lowest concentration measured was 2 pCi/kg (0.07 Bq/kg) at the AS-212 (Nearest Resident). One (1) sample result is above the historical range of samples collected at these and nearby locations.
• The highest Molybdenum concentration measured in 2008 was 30 mg/kg at the AS-209 (Mill Entrance Road). The lowest molybdenum concentration measured was 2.1 mg/kg at the AS-202 (East Boundary). The 2008 results are near the historical range of samples collected at these and nearby locations.

4-35
Table 4-12 natU Vegetation
(pCi/kg)
Sample Date Historical
Range Location 05/31/2007 06/15/2007 07/17/2007 6/9/2008 7/21/2008 8/8/2008 1995 - 2006
AS-202 East Boundary 6 29 39 74 66 217 4.1 284
AS-204 West Boundary 13 23 21 -------- -------- -------- ------ -------
AS-209 Mill Entrance Rd 38 20 47 61 45 95 4.1 406.2
AS-210 Golf Course -------- -------- -------- -------- -------- -------- 5.4 108.3 AS-212 Nearest
Resident 1 3 1 54 14 18 3 237
Figure 4-19 natU Vegetation Sample
(pCi/kg)
0
100
200
300
400
500
600
700
800
900
1000
05/31/2007
06/15/2007
07/17/2007
6/9/2008
7/21/2008
8/8/2008
pCi/k
g
AS-202 East Boundary AS-204 West Boundary AS-209 Mill Entrance Rd AS-210 Golf Course AS-212 Nearest Resident

4-36
Table 4-13 230Th Vegetation
(pCi/kg)
Sample Date Historical Range
Location 05/31/2007 06/15/2007 07/17/2007 6/9/2008 7/21/2008 8/8/2008 1988 - 2006
AS-202 East Boundary 15 41 70 119 97 395 12.8 368
AS 204 West Boundary 17 27 54 -------- -------- -------- ------ -------
AS-209 Mill Entrance Rd 34 53 44 127 127 262 25 322
AS-210 Golf Course -------- -------- -------- -------- -------- -------- 2.7 134
AS-212 Nearest Resident 1 7 11 94 26 35 7 131
Figure 4-20
230Th Vegetation Samples (pCi/kg)
0
100
200
300
400
500
600
700
800
900
1000
05/31/2007
06/15/2007
07/17/2007
6/9/2008
7/21/2008
8/8/2008
pCi/k
g
AS-202 East Boundary AS 204 West Boundary AS-209 Mill Entrance Rd AS-210 Golf Course AS-212 Nearest Resident

4-37
Table 4-14 226Ra Vegetation
(pCi/kg)
Sample Date Historical Range
Location 05/31/2007 06/15/2007 07/17/2007 6/9/2008 7/21/2008 8/8/2008 1995 - 2006
AS-202 East Boundary 25 27 32 103 87 371 2 237
AS 204 West Boundary 37 24 27 -------- -------- -------- ------ -------
AS-209 Mill Entrance Rd 150 67 53 58 124 220 14 263
AS-210 Golf Course -------- -------- -------- -------- -------- -------- 3 112
AS-212 Nearest Resident 9 10 11 78 24 28 11 124
Figure 4-21 226Ra Vegetation Sample
(pCi/kg)
0
100
200
300
400
500
600
700
800
900
1000
05/31/2007
06/15/2007
07/17/2007
6/9/2008
7/21/2008
8/8/2008
pCi/k
g
AS-202 East Boundary AS 204 West Boundary AS-209 Mill Entrance Rd AS-210 Golf Course AS-212 Nearest Resident

4-38
Table 4-15 210PbVegetation
(pCi/kg)
Sample Date Historical Range Location 05/31/2007 06/15/2007 07/17/2007 6/9/2008 7/21/2008 8/8/2008 1988 - 2006
AS-202 East Boundary 56 37 93 997 378 1566 28 924 AS 204 West Boundary 76 58 79 -------- -------- -------- ------ -------
AS-209 Mill Entrance Rd 69 77 117 94 172 233 103 252 AS-210 Golf Course -------- -------- -------- -------- -------- -------- 41 831
AS-212 Nearest Resident 79 58 92 758 247 283 39 914
Figure 4-22 210Pb Vegetation Sample
(pCi/kg)
0
200
400
600
800
1000
1200
1400
1600
1800
2000
05/31/2007
06/15/2007
07/17/2007
6/9/2008
7/21/2008
8/8/2008
pCi/k
g
AS-202 East Boundary AS 204 West Boundary AS-209 Mill Entrance Rd AS-210 Golf Course AS-212 Nearest Resident

4-39
Table 4-16 232Th Vegetation
(pCi/kg)
Sample Date Historical
Range Location 05/31/2007 06/15/2007 07/17/2007 6/9/2008 7/21/2008 8/8/2008 1988 - 2006
AS-202 East Boundary 1 2 7 8 6 16 0 9 AS 204 West Boundary 0 1 1 -------- -------- -------- ------ ------- AS-209 Mill Entrance Rd 0 1 1 5 3 8 0 7 AS-210 Golf Course -------- -------- -------- -------- -------- -------- 0 1.3 AS-212 Nearest Resident 0 1 1 6 2 3 0 7
Figure 4-23
232Th Vegetation Sample (pCi/kg)
0
10
20
30
40
50
60
70
80
90
100
05/31/2007
06/15/2007
07/17/2007
6/9/2008
7/21/2008
8/8/2008
pCi/k
g
AS-202 East Boundary AS 204 West Boundary AS-209 Mill Entrance Rd AS-210 Golf Course AS-212 Nearest Resident

4-40
Table 4-17
Molybdenum Vegetation (mg/kg)
Sample Date Historical
Range
Location 05/31/2007 06/15/2007 07/17/2007 6/9/2008 7/21/2008 8/8/2008 1979-2006
AS-202 East Boundary 1.9 1.1 1.17 4.8 2.1 4.3 0.54 879
AS 204 West Boundary 23 26 24 -------- -------- -------- ------ -------
AS-209 Mill Entrance Rd 12 16 27 30 15 28 0.6 62
AS-210 Golf Course -------- -------- -------- -------- -------- -------- 0.5 41
AS-212 Nearest Resident 4.2 1.9 2 4.9 1.8 1.8 0.3 6
Figure 4-24 Molybdenum Vegetation
(mg/kg)
0
100
200
300
400
500
600
700
800
900
1000
05/31/2007
06/15/2007
07/17/2007
6/9/2008
7/21/2008
8/8/2008
mg/
kg
AS-202 East Boundary AS 204 West Boundary AS-209 Mill Entrance Rd AS-210 Golf Course AS-212 Nearest Resident

4-41
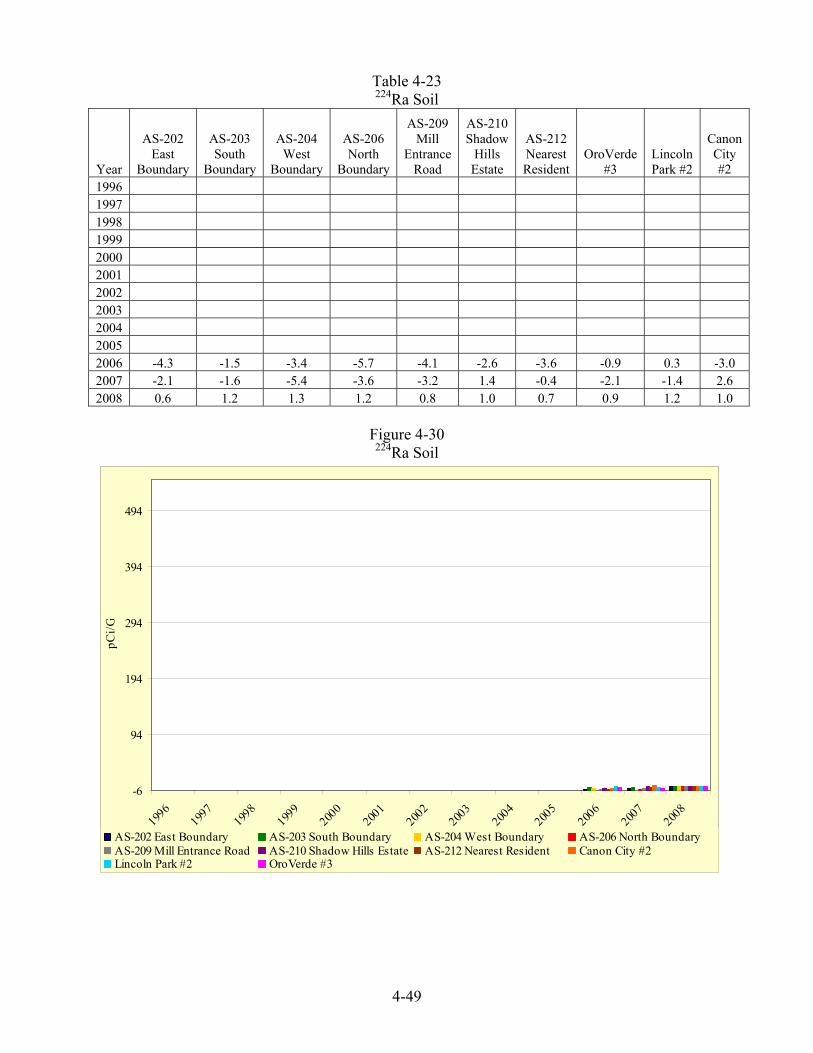
SOILS Soils collected in 2008 continue to show variability as expected based on historical levels. All of the samples showed levels within the historical range of concentrations. Samples have been historically analyzed for natU, 230Th, 226Ra, and Molybdenum. Thorium-228 and 224Ra are being reported for the third (3rd) time. (Tables 4-12 through 4-15)
• Natural uranium concentrations ranged from 2.9 pCi/g (0.11 Bq/g) LP-2 (Lincoln Park) to 9.4 pCi/g (0.4 Bq/g) AS-204 (West Boundary).
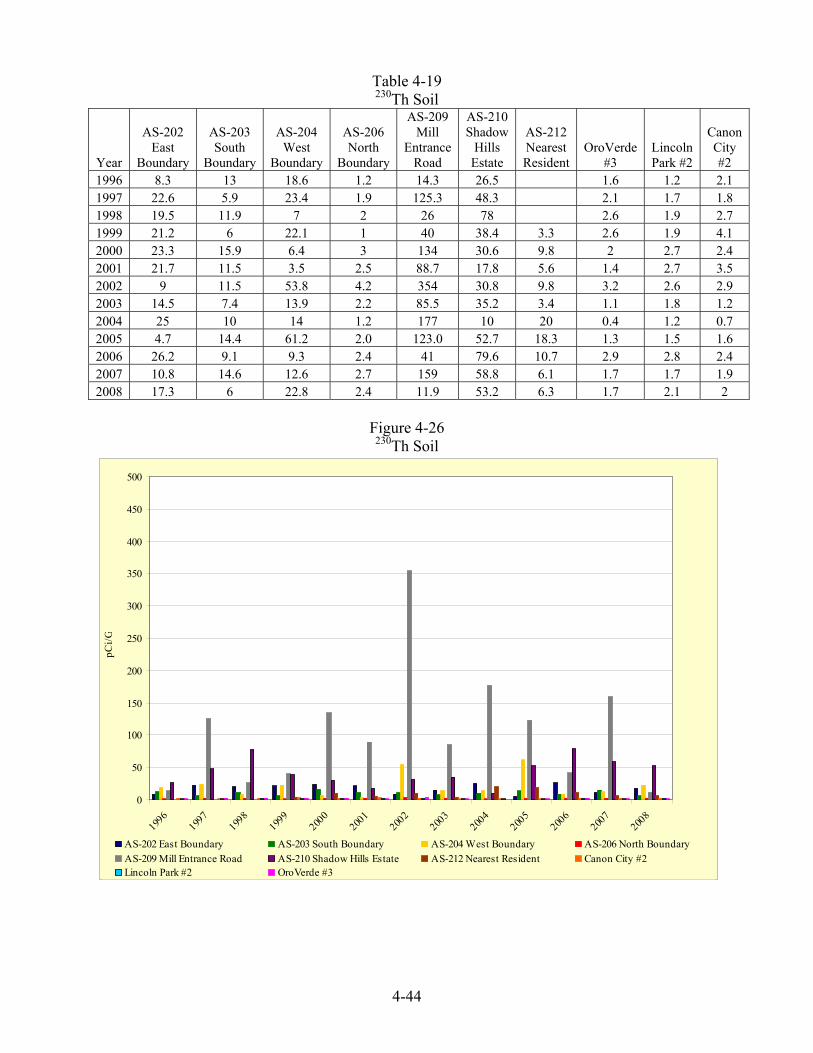
• Thorium-230 concentrations ranged from 2.0 pCi/g (0.07 Bq/g) at CC-2 (Canon City) to 53.2 pCi/g (2.0 Bq/g) AS-210 (Shadow Hills Estates).
• Radium-226 concentrations ranged from 1.1 pCi/g (0.04 Bq/g) at CC-2 (Canon City) to 8.6 pCi/g (0.41 Bq/g) at AS-202 (East Boundary). These sample results are within the range of historical sample results. Note: 2005 Radium data was not reported based on QA analysis.
• Thorium-232 concentrations ranged from 0.8 pCi/g (0.03 Bq/g) AS-202 (East Boundary) 1.4 pCi/g (0.03 Bq/g) at and AS-203 (South Boundary). These sample results are within the range of historical sample results. There appears to be no difference between on-site, nearby, and off-site concentrations which suggests that these are all background values.
• Thorium-228 concentrations ranged from 0.8 pCi/g (0.03 Bq/g) at AS-202 (East Boundary) to 1.5 pCi/g (0.06 Bq/g) at LP-2 (Lincoln Park). All other sampler locations were between 0.9 pCi/g (0.03 Bq/g) to 1.4 pCi/g (0.05 Bq/g). This appears to be background range.
• Radium-224 concentrations ranged from 0.6 pCi/g (0.03 Bq/g) at AS-202 (East Boundary) to 1.3 pCi/g (0.5 Bq/g) at three (3) locations. This appears to be background range.
Molybdenum results ranged from <2.2 µg/g which is background to 32.2 µg/g at AS-204 (West Boundary) has historically shown the highest level.

4-42
Table 4-18 Uranium Soil
Year AS-202 East
Boundary
AS-203 South
Boundary
AS-204 West
Boundary
AS-206 North
Boundary
AS-209 Mill Entrance
Road
AS-210 Shadow
Hills Estate
AS-212 Nearest Resident
OroVerde #3
Lincoln Park #2
Canon City #2
1979 6.4 3.4 3.2
1980 1.7 1.4 3.5 3.5 3.1
1980 7.3 4.3 14.5 4.3 7.8
1981 4.9 2.7 5.3 1.6 2.6
1982 1.1 0.2 1.1 <0.001 <0.001 <0.001 <0.001
1983 1.2 2 2.1 2.2 27 2.4 2
1983 3.6 2.1 3 9.8(21)* 1.8 1.9 6.6(4.2)*
1984 4.1 2.9 2.6 2.8 2.3 1.7 2.5
1985 2.3 2.3 3.2 4 2.3 2.3 2.3
1986 5.7 3.2 5 6.3 3.3 5.6 3.7
1986 0.9 1.3 2.2 3.2 0.9 3 1.4
1987 1.5 1.9 1 5.9 1.4 0.7 4.3
1988 3 3.2 3.2 5 2.6 3.7 3.2
1989 1.3 1.5 7.4 1.3 1.1 1.3 1.1
1989 0.5 1.6 3.7 0.7 0.9 2 0.6
1990 2.2 2.9 2.6 2 2.6 2.7 3.3
1991 3.7 1.8 4.1 5.1 7.7 1.7 1.7
1992 2.2 2.4 23.8 2.4 2.8 2.6 3.2
1992 1.9 1.8 5 0.8 1.4 1 0.9
1993 3.2 1.9 7.3 2.8 1.4 1 1.6
1994 3.1 2.7 4.9 1.8 14.9 2.3 2.3 2.2
1995 9.5 2.7 3.5 1.6 4.1 2 2 1.2
1996 2.6 2.8 4.9 1.6 4.9 7.4 2.2 2 2.2
1997 2.4 1.3 3.9 0.8 19.6 6.3 2.2 1.4 2.6
1998 5.5 2.7 3.2 1.4 6 6.4 2.4 2 3
1999 2 1.8 2.4 2 13.5 7.4 3.1 3 2 3.9
2000 7.4 3.9 6 1.7 67.7 8.1 5.3 1.2 2.6 1.8
2001 6 2.8 2.4 1.6 28.4 4.2 2.7 1.8 2.4 1.7
2002 3.2 3.3 20 2.4 73.6 6.4 5.8 2.8 2.6 2.4
2003 5.5 3.5 8.1 3.6 19.6 7.4 2 1.8 2.2 2.4
2004 12 4.8 8.2 1.6 56 10 13 2.1 2.7 1.9
2005 1.2 2 15.4 0.8 28.8 6.8 4.7 0.9 0.9 0.5
2006 3.9 2.0 3.3 1.4 12.2 7.4 3.2 1.9 1.4 0.4
2007 4.5 4.0 5.6 2.2 39.9 8.8 3.6 2.2 1.8 1.6
2008 7.1 3.7 9.4 3.9 7 10 5.5 2.9 3 3.2

4-43
Figure 4-25 Uranium Soil
0
100
200
300
400
500
1979
1980
1980
1981
1982
1983
1983
1984
1985
1986
1986
1987
1988
1989
1989
1990
1991
1992
1992
1993
1994
1995
1996
1997
1998
1999
2000
2001
2002
2003
2004
2005
2006
2007
2008
pCi/g
AS-202 East Boundary AS-203 South Boundary AS-204 West Boundary AS-206 North Boundary
AS-210 Shadow Hills Estate AS-212 Nearest Resident Canon City #2 Lincoln Park #2
4-44
Table 4-19 230Th Soil
Year
AS-202 East
Boundary
AS-203 South
Boundary
AS-204 West
Boundary
AS-206 North
Boundary
AS-209 Mill
Entrance Road
AS-210 Shadow
Hills Estate
AS-212 Nearest Resident
OroVerde #3
Lincoln Park #2
Canon City #2
1996 8.3 13 18.6 1.2 14.3 26.5 1.6 1.2 2.1 1997 22.6 5.9 23.4 1.9 125.3 48.3 2.1 1.7 1.8 1998 19.5 11.9 7 2 26 78 2.6 1.9 2.7 1999 21.2 6 22.1 1 40 38.4 3.3 2.6 1.9 4.1 2000 23.3 15.9 6.4 3 134 30.6 9.8 2 2.7 2.4 2001 21.7 11.5 3.5 2.5 88.7 17.8 5.6 1.4 2.7 3.5 2002 9 11.5 53.8 4.2 354 30.8 9.8 3.2 2.6 2.9 2003 14.5 7.4 13.9 2.2 85.5 35.2 3.4 1.1 1.8 1.2 2004 25 10 14 1.2 177 10 20 0.4 1.2 0.7 2005 4.7 14.4 61.2 2.0 123.0 52.7 18.3 1.3 1.5 1.6 2006 26.2 9.1 9.3 2.4 41 79.6 10.7 2.9 2.8 2.4 2007 10.8 14.6 12.6 2.7 159 58.8 6.1 1.7 1.7 1.9 2008 17.3 6 22.8 2.4 11.9 53.2 6.3 1.7 2.1 2
Figure 4-26
230Th Soil
0
50
100
150
200
250
300
350
400
450
500
1996
1997
1998
1999
2000
2001
2002
2003
2004
2005
2006
2007
2008
pCi/G
AS-202 East Boundary AS-203 South Boundary AS-204 West Boundary AS-206 North BoundaryAS-209 Mill Entrance Road AS-210 Shadow Hills Estate AS-212 Nearest Resident Canon City #2Lincoln Park #2 OroVerde #3

4-45
Table 4-20 232Th Soil
Year
AS-202 East
Boundary
AS-203 South
Boundary
AS-204 West
Boundary
AS-206 North
Boundary
AS-209 Mill
Entrance Road
AS-210 Shadow
Hills Estate
AS-212 Nearest Resident
OroVerde #3
Lincoln Park #2
Canon City #2
1996 1997 1998 1999 2000 2001 1.3 1.4 1 1.3 1.9 1.9 1.1 1.4 1.8 1.3 2002 1.2 1.6 1.6 1.9 7.9 1.8 1.1 1.4 1.8 1.6 2003 0.7 1.5 1.3 1.4 2.4 1.4 1 0.9 1.4 1.4 2004 0.7 1 1.2 1.1 1.7 1.1 0.7 0.9 1.1 0.5 2005 0.5 1.4 1.1 1.1 1.3 1.2 1.0 1.2 1.5 1.0 2006 0.9 1.3 1 1.1 1.2 1.3 0.9 1.4 1.9 1.3 2007 0.8 1.2 0.8 1.2 1.2 1.2 0.8 1.1 1.6 0.9 2008 0.8 1.4 1 1.1 1.1 1.1 1 1.2 1.4 1.2
Figure 4-27
232Th Soil
0
10
20
30
40
50
60
70
80
90
100
1996
1997
1998
1999
2000
2001
2002
2003
2004
2005
2006
2007
2008
pCi/G
AS-202 East Boundary AS-203 South Boundary AS-204 West Boundary AS-206 North BoundaryAS-209 Mill Entrance Road AS-210 Shadow Hills Estate AS-212 Nearest Resident Canon City #2Lincoln Park #2 OroVerde #3

4-46
Table 4-21 228Th Soil
Year
AS-202 East
Boundary
AS-203 South
Boundary
AS-204 West
Boundary
AS-206 North
Boundary
AS-209 Mill
Entrance Road
AS-210 Shadow
Hills Estate
AS-212 Nearest Resident
OroVerde #3
Lincoln Park #2
Canon City #2
1996 1997 1998 1999 2000 2001 2002 2003 2004 2005 2006 0.6 1.1 1.0 1.3 0.9 1.3 1.1 1.3 1.9 1.2 2007 0.7 1.4 0.7 1.1 1.2 1.3 0.9 1.1 1.6 1.4 2008 0.8 1.4 1.2 1.4 1.2 0.9 1.0 1.1 1.5 0.9
Figure 4-28
228Th Soil
0
10
20
30
40
50
60
70
80
90
100
1996
1997
1998
1999
2000
2001
2002
2003
2004
2005
2006
2007
2008
pCi/G
AS-202 East Boundary AS-203 South Boundary AS-204 West BoundaryAS-206 North Boundary AS-209 Mill Entrance Road AS-210 Shadow Hills EstateAS-212 Nearest Resident Canon City #2 Lincoln Park #2OroVerde #3

4-47
Table 4-22 226Ra Soil
Year
AS-202 East
Boundary
AS-203 South
Boundary
AS-204 West
Boundary AS-206 North
Boundary
AS-209 Mill
Entrance Road
AS-210 Shadow
Hills Estate
AS-212 Nearest Resident
OroVerde #3
Lincoln Park #2 Canon City #2
1979 13.3 1.9 2.4 1980 3.2 1.6 5.1 2.4 4.4 1980 6.9 2.4 4.1 1.4 1981 5.2 2.6 3.7 1.1 1.6 1982 3.5 <0.5 <0.5 <0.5 <0.5 <0.5 0.5 1983 2.2 2.5 2.1 4.7 0.8 1.6 1 1983 4 4.8 2.8 12(5.2)*(2.6)+ 1 1.2 9.8(10)*(1.1)+ 1984 7.3 2.2 2 3.2 1.6 2 1 1985 3 1.9 2.4 4.4 1.2 1.5 1.2 1986 3.3 1.2 4.6 6.8 1.4 1.7 1.8 1986 0.7 2.8 4 8.5 1 4.5 1.4 1987 0.5 0.5 1.1 2.2 0.8 0.8 2.3 1988 1.3 1.2 0.9 3.1 0.7 0.8 0.6 1989 2 2.7 7.7 1.4 1.3 1.6 1.2 1989 2.2 5.6 5.9 1.3 1.4 2 1.3 1990 2 4.9 2.1 0.9 1.5 1.7 1.5 1991 5.4 4.2 6.3 1.5 1.6 1.9 1.7 1992 1.5 3.7 18.1 1.6 1.4 1.4 2.4 1992 3.9 4.1 11.7 1 1.3 1.3 1.1 1993 10 1.9 9.1 1 1.3 0.4 1 1994 4.7 3.5 4.2 2.6 10.8 1.3 1.8 1.2 1995 15.3 4.2 4.3 1.1 3.2 1.2 1.6 1.3 1996 3.9 8.5 6.1 1.2 3.6 3.3 1.3 1.2 1.3 1997 12.3 3.4 8.3 1.6 21.9 6.6 1.8 1.4 1.5 1998 10.8 5.6 3.1 1.3 7.3 7.2 1.2 1.5 1.8 1999 10 3.1 9.3 1.4 11 3.8 1.4 1.4 0.7 1.4 2000 12.3 9.5 2 1.5 24 5.1 3 1.3 1.7 1.3 2001 10.5 6.3 1.5 1.5 18.7 2.9 2.1 1.5 2.3 1.4 2002 4.2 4.1 11.5 1.2 53.5 3.5 3 1.3 1.5 1.3 2003 7.6 4.1 3.8 1.4 17.9 4.1 1.4 1 1.2 1 2004 13 6.8 5 1.5 36 4.1 7.5 1.5 1.8 1.5 2005 ** ** ** ** ** ** ** ** ** ** 2006 11.0 4.6 3.3 1.6 9.1 5.8 3.0 1.5 1.8 1.3 2007 4.6 7.3 3.6 1.3 26.5 5.2 2 1.3 1.1 1.2 2008 8.6 3.7 5.8 1.6 3.9 3.8 2.5 1.2 1.2 1.1
*Reanalysis January 24, 1984 +Resampled January 24, 1984 ** Sample results not reported based on QA analysis

4-48
Figure 4-29 226Ra Soil
0
50
100
150
200
250
300
350
400
450
500
1979198
0198
0198
1198
2198
3198
3198
4198
5198
6198
6198
7198
8198
9198
9199
0199
1199
2199
2199
3199
4199
5199
6199
7199
8199
9200
0200
1200
2200
3200
4200
5200
6200
7200
8
pCi/G
AS-202 East Boundary AS-203 South Boundary AS-204 West Boundary AS-206 North BoundaryAS-209 Mill Entrance Road AS-210 Shadow Hills Estate AS-212 Nearest Resident Canon City #2Lincoln Park #2 OroVerde #3
4-49
Table 4-23 224Ra Soil
Year
AS-202 East
Boundary
AS-203 South
Boundary
AS-204 West
Boundary
AS-206 North
Boundary
AS-209 Mill
Entrance Road
AS-210 Shadow
Hills Estate
AS-212 Nearest Resident
OroVerde #3
Lincoln Park #2
Canon City #2
1996 1997 1998 1999 2000 2001 2002 2003 2004 2005 2006 -4.3 -1.5 -3.4 -5.7 -4.1 -2.6 -3.6 -0.9 0.3 -3.0 2007 -2.1 -1.6 -5.4 -3.6 -3.2 1.4 -0.4 -2.1 -1.4 2.6 2008 0.6 1.2 1.3 1.2 0.8 1.0 0.7 0.9 1.2 1.0
Figure 4-30
224Ra Soil
-6
94
194
294
394
494
1996
1997
1998
1999
2000
2001
2002
2003
2004
2005
2006
2007
2008
pCi/G
AS-202 East Boundary AS-203 South Boundary AS-204 West Boundary AS-206 North BoundaryAS-209 Mill Entrance Road AS-210 Shadow Hills Estate AS-212 Nearest Resident Canon City #2Lincoln Park #2 OroVerde #3

4-50
Table 4-24 Molybdenum Soil
Year
AS-202 East
Boundary
AS-203 South
Boundary
AS-204 West
Boundary
AS-206 North
Boundary
AS-209 Mill
Entrance Road
AS-210 Shadow
Hills Estate
AS-212 Nearest Resident
OroVerde #3
Lincoln Park #2
Canon City #2
1992 4.3 5.7 3.4 3.2 5.2 3.6 <1.25 1992 6.3 5.9 54.0 <2.50 3.1 <2.50 <2.50 1993 11.6 5.2 220.0 <1.05 <2.05 <2.50 <2.50 1994 6.9 2.5 22.0 <1.14 18.0 <1.30 <1.34 <1.00 1995 20.0 5.9 76.0 2.1 6.2 3.1 2.2 3.9 1996 3.9 2.3 55.0 2.4 3.8 <1.25 <1.25 <1.25 <1.25 1997 <1.25 <1.25 48.0 2.0 30.0 10.0 <1.25 <1.25 <1.25 1998 15.0 8.0 35.0 <1.25 13.0 5.6 2.7 4.6 1.6 1999 3.5 3.6 85.0 <1.2 10.8 2.4 2.3 <1.2 <1.2 1.5 2000 2.5 1.3 20.0 <1.25 13.0 1.4 1.6 <1.25 <1.25 1.7 2001 3.6 2.7 2.9 1.9 3.3 2.4 2.7 2.0 1.9 1.8 2002 3.0 4.4 251.3 2.6 138.5 4.4 9.5 1.8 2.1 1.8 2003 5.8 5.2 120.0 3.3 26.0 4.7 3.7 2.5 2.5 2.7 2004 11.0 3.2 95.0 0.8 43.0 2.9 16.0 1.1 1.2 1.4 2005 2.4 2.9 217.0 1.2 42.2 4.5 42.4 0.6 1.1 0.9 2006 5.6 <5 6.7 <5 13.0 12.0 9.3 <5 <5 <5 2007 <2.4 <2.4 12.0 <2.4 14.0 <2.4 <2.4 <2.4 <2.4 <2.4 2008 9.8 4.3 32.2 3.6 5.9 6.2 8.0 <2.2 3.5 3.2
Figure 4-31
Molybdenum
0.0
50.0
100.0
150.0
200.0
250.0
300.0
350.0
400.0
450.0
500.0
1992
1992
1993
1994
1995
1996
1997
1998
1999
2000
2001
2002
2003
2004
2005
2006
2007
2008
ug/g
AS-202 East Boundary AS-203 South Boundary AS-204 West Boundary AS-206 North BoundaryAS-209 Mill Entrance Road AS-210 Shadow Hills Estate AS-212 Nearest Resident Canon City #2Lincoln Park #2 OroVerde #3

4-51
Table 4-25 210Pb Soil
Year
AS-202 East
Boundary
AS-203 South
Boundary
AS-204 West
Boundary
AS-206 North
Boundary
AS-209 Mill
Entrance Road
AS-210 Shadow
Hills Estate
AS-212 Nearest Resident
OroVerde #3
Lincoln Park #2
Canon City #2
1996 1997 1998 1999 2000 2001 2002 2003 2004 2005 2006 9.0 4.8 3.8 2.5 8.7 6.8 4.2 3.0 3.7 3.5 2007 3.6 6.1 3.7 1.6 19.9 4.5 1.9 1.2 1.5 1.3 2008 6.2 3.3 6.2 1.7 3.1 4.6 2.6 1.9 2.2 1.5
Figure 4-32
210Pb
0
50
100
150
200
250
300
350
400
450
500
1996
1997
1998
1999
2000
2001
2002
2003
2004
2005
2006
2007
2008
pCi/G
AS-202 East Boundary AS-203 South Boundary AS-204 West Boundary AS-206 North BoundaryAS-209 Mill Entrance Road AS-210 Shadow Hills Estate AS-212 Nearest Resident Canon City #2Lincoln Park #2 OroVerde #3

4-52
RADON FLUX - TAILINGS IMPOUNDMENTS Radon Flux measurements for the Primary Impoundment were conducted in June 2008 with the resulting flux of nineteen point seven (19.7) pCi/m2-s compared to the 2007 flux of fourteen (14) pCi/m2-s versus the National Emission Standard for Hazardous Air Pollutants (NESHAPS) standard of twenty (20) pCi/m2-s. The 2008 report was filed with Environmental Protection Agency (EPA). When the 2008 Primary Impoundment preliminary results were received, Cotter initiated a program to cover the most highly elevated areas as an ALARA function. Approximately eight thousand eight hundred (8,800) cubic yards of soil cover averaging four (4) feet in depth was placed on approximately one (1) acre in the northwest corner of the exposed tailings beach encompassing tailings beach locations TB 69-72. This was completed in the latter part of 2008. Other areas were being covered in early 2009. The expected reduction in mean radon flux is about twenty-five percent (25%). For the Secondary Impoundment, the June 2008 sampling was conducted as an ALARA function and not for compliance with NESHAPS. The resulting measurements indicated a reading of fourteen (14) pCi/m2-s This result is the same (fourteen (14) pCi/m2-s) as the readings which were taken in October 2007 after some remedial ALARA actions were taken to reduce the flux of twenty-three point four (23.4) pCi/m2-s as measured in July 2007.
Figure 4-33 Average Calculated Mean Radon Flux
for the Primary and Secondary Impoundment 1999-2008
0
5
10
15
20
1999 2000 2001 2002 2003 2004 2005 2006 2007 2008
pCi/m
2 -s
Primary Impoundment Secondary Impoundment NESHAPS Standard
ALARA
ALARA

4-53
LAND USE (LC 28.8) Land use changes within a five (5) mile radius of the Cotter mill, southwest of Cañon City, Colorado, were investigated. The complete report is provided in Appendix A. Economic and developmental growth in the area is most directly impacted by availability of water, employment opportunity and fuel costs. Whereas the area water shed is healthy due to above average snow pack, the rising cost of fuel has shaken the economic confidence of Fremont County. Annual unemployment and tourism dollars indicated minimal positive change. Employment opportunities in the correctional industry were steady and the rebounding tourism industry leveled off. Average wages and tourism expenditures may be distorted by rising cost of goods rather than indicative of consumer confidence. The construction industry declined in 2007 with economic indicators continuing to deteriorate into 2008. Overall demographics indicate a net growth in Fremont County of three hundred ninety (390) individuals but increasing unemployment. Planning and permitting of large residential developments has been curbed by available funding and the mortgage crisis.