environmental performance index 2020 and ranking of states
TRANSCRIPT

Environmental Performance Index 2020 and ranking of states of India.Indrani Chandrasekharan*, Bhagyam Chandrasekharan@ and Shweta Srinivasan# Effective and balanced utilization of the country's resources is at the Core of India’s development strategy which also includes enhancing efforts towards compliance of national legislations and international commitments. Considering the influence of natural resources depletion and unabated pollution on health and many sectors of the economy an Environmental Performance Index (EPI) was constructed in 2013 to recognize the efforts made by the states to arrest degradation of the environment and rank them. An attempt has now been made to include four new criteria; Biodiversity, Agriculture, fisheries and Disaster management with 16 indicators and further refine the existing five criteria by adding seven more indicators taking the total of criteria to 9 ,indicators to 37 and evolve EPI 2020. This article, in addition to detailing the methodology for constructing EPI 2020, which could serve as a monitoring tool to gauge the performance of states and central government yearly will also enable monitoring progress in achieving related SDG and Sendai targets and goals. An attempt has also been made to compare the scores and ranking of EPI-2020 with Yale EPI 2018. Keywords: Air and water quality, environment, GSDP, performance index, scores and ranks, EPI
2013, Yale EPI 2018, SDG, Sendai, Biodiversity, Disaster Management.
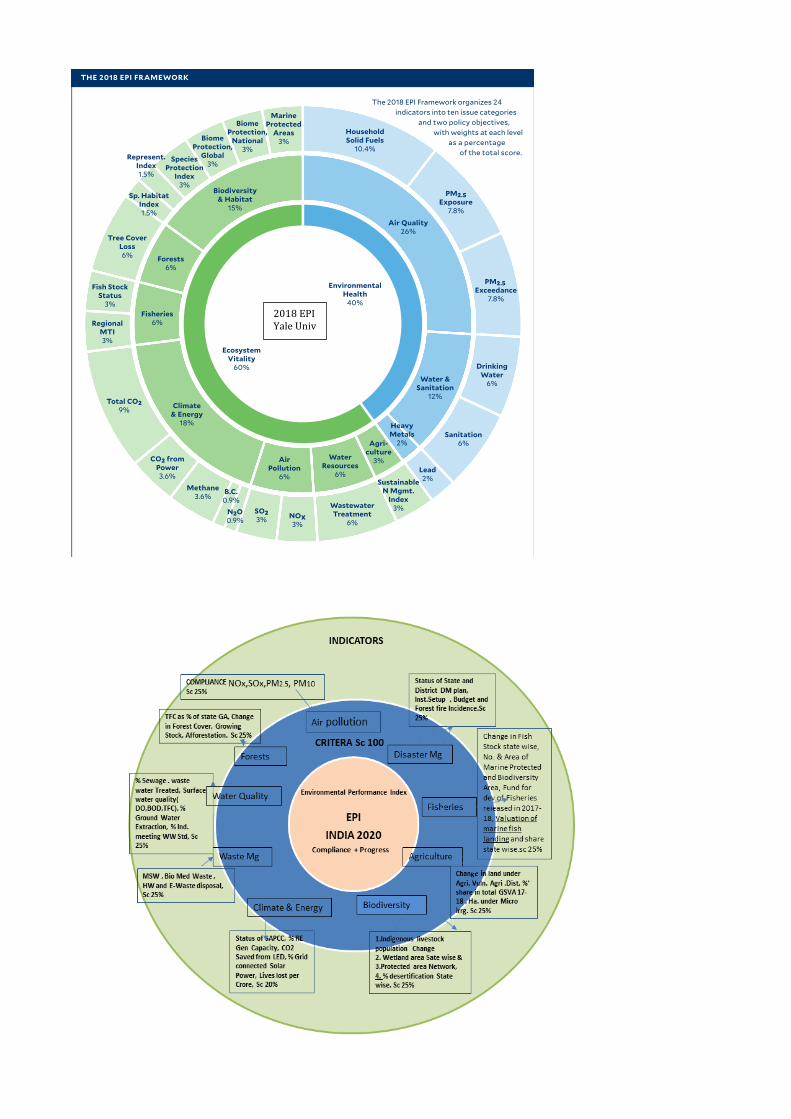
The Planning Commission Environmental Performance index PC-EPI1 2013 was evolved after careful perusal of all variables and categories considered under various studies in 2013. To begin with 5 criteria (Air pollution, Forests, water quality, waste management and climate change) comprising 16 indicators were chosen. and these integrated to arrive at a composite index. To make EPI-2013 comprehensive, Biodiversity, Agriculture, Fisheries and Disaster Management as criteria with 4 indicators each have now been added. In the existing criteria, Air Pollution, SPM has been split into PM 2.5 and PM10 as indicators, in water quality and waste management criteria one indicator each and two indicators in Climate Change have been added and EPI, 2020 evolved. EPI 2020 now comprises, 9 criteria and 37 indicators. To recognize the efforts made by the states to arrest degradation of the environment including Climate change effect ,while pursuing efforts to increase per capita GSDP a methodology to construct EPI 2020 +GDP index has now been evolved and based on scores states ranked. The EPI 2020 {{and EPI 2020+GDP}} index now evolved will not only enable better understanding and efforts made by the states in Environmental health and Ecosystem Vitality(2018 EPI framework)2 but also gauge the relationship between GSDP and sustainable development. ----------------------------------------------------------------------------------------------- *Dr Indrani Chandrasekharan is Former Adviser, Planning Commission, New Delhi 110 070, India** Dr Bhagyam Chandrasekharan, IFC , Knowledge Management Analyst, World Bank Group, Chennai, India and # Dr Shweta Srinivasan, Asst Prof of Finance , Rutgers University, Princeton, NY
For Correspondence (e-mail [email protected])

As EPI, 2020 is based on indicators for which yearly data is mandated by law to be collected and published by the GOI, it could also serve as a tool for monitoring the SDG and Sendai Goals and targets set out to start with. The relationship between economic growth and environmental sustainability of a country is complicated considering that large sections of the country’s population depend on natural resources for their livelihood. Industrialization/urbanization if not associated with the requisite level of governance can influence the environmental health and sustainability of a state and the nation. It is well recognized that environmental degradation leads to additional economic hardships to the vulnerable sections of the population.
Environmental problems therefore should no longer be viewed by the states as a consequence of development alone, but there should be continued focus on pollution abatement, promotion of adherence to environmental standards, natural resources conservation and adopting the 5Rs (Reduce ,Reuse, Recycle, Recover, and Remanufacture). Environmental indicators, Methodology and weightageSelection of the appropriate indicators, methodology and assigning scores for arriving at acceptable indicators under various criteria has been a subject of much debate and research. Many believe that environmental degradation due to pollution be measured by actual emission data and efforts made to meet the standards of hazardous substances, but others feel that it should include factors which influence its spread and intensity. Regional disparity and natural endowment of the state are also considered important when ranking the states.Many recent publications 3,4,5, and the three methodologies: (a) environmental quality index (EQI)6, (b) environmental indicators – Organization for Economic Co-operation and Development (OECD)7 are mentioned and (c) 2018 environmental performance index (EPI) of Yale University2 which has been evolved every two years and is discussed briefly in this article. After a careful study of the above, to make EPI-2013 comprehensive, Biodiversity, Agriculture, Fisheries and Disaster Management as criteria with 4 indicators each have now been added. In the existing criteria, Air Pollution, SPM has been split into PM 2.5 and PM10 as indicators, in water quality and waste management criteria one indicator each and two indicators in Climate Change have been added and EPI, 2020 evolved. EPI 2020 now comprises, 9 criteria and 37 indicators (Table-3) which calculates EPI scores for the selected criteria and indicators for all the states and Union Territories (UTs). (a) Environmental quality index Mukherjee and Chakraborty6 suggest that the EQI for the states is linearly dependent on a set of observable indicators and can be determined by adopting the Human Development Index (HDI) method, by putting the selected variable to start with under eight broad categories. The idea is that the 63 environmental variables under the 8 categories when combined would give a composite EQI ranking which is a measure of the environmental well-being of the states, i.e. those with higher scores are characterized by cleaner environment.

(b) Environment at a Glance Report
The Environment at a Glance report presents a digest of major environmental trends in OECD countries in areas such as climate change, air quality, biodiversity, water resources and circular economy. The analysis and key messages are based on indicators from the OECD Core Set of Environmental Indicators – a tool to monitor environmental progress and performance and to track the course towards sustainable development. It builds on the interactive Environment at a Glance web-based platform launched on 18 November 2019.
The OECD’s core set of indicators on the environment comprises climate change, ozone layer depletion, eutrophication, acidification, toxic contamination, urban environ- mental quality, biodiversity, cultural landscapes, waste, water resources, forest resources, fish resources, soil degradation (desertification, erosion), material resources and socio-economic, sectoral and general indicators.
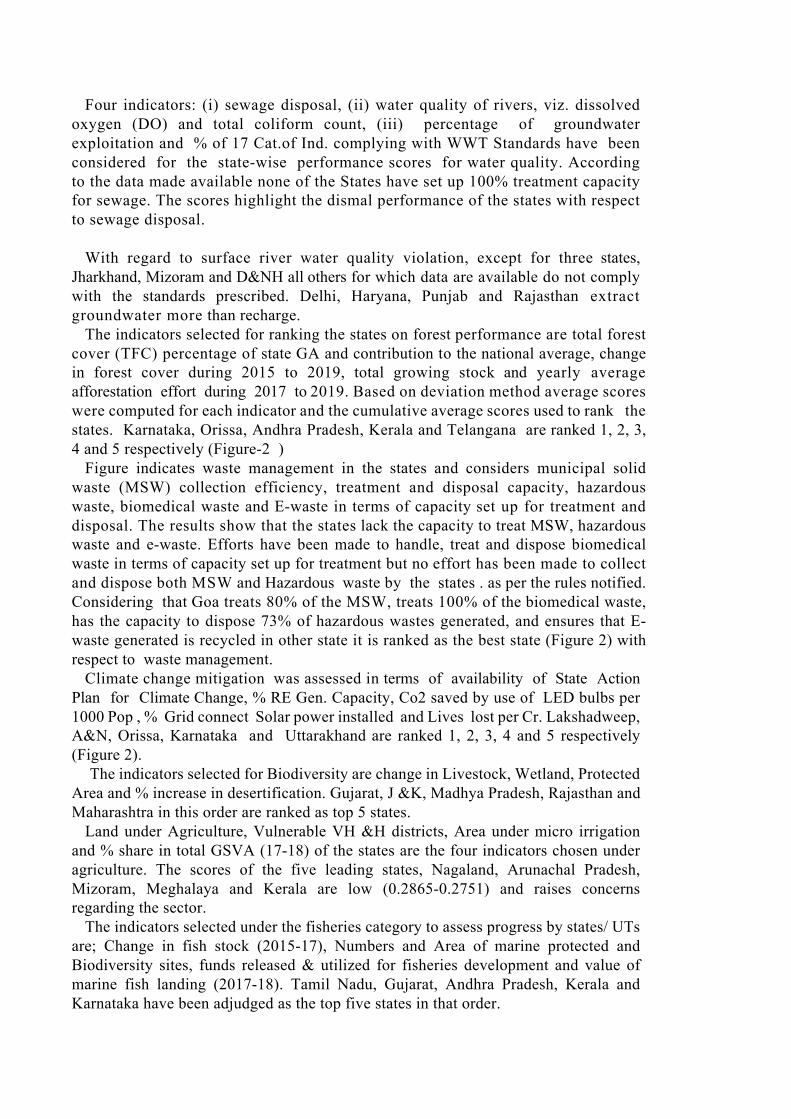
(c) 2018 environmental performance index The 2018 Environmental Performance Index (EPI) ranks 180 countries on 24
performance indicators across ten issue categories covering environmental health and ecosystem vitality. The 2020 EPI is expected sometime in June 2020. The EPI- offers a scorecard that highlights Scorers and strugglers in environmental performance, best practices, and provides guidance for countries that aspire to develop sustainably and achieve the SD Goals. The 2018 EPI data and methodology has generated new rankings founded on the advances in environmental science and analysis. The EPI builds on measures relevant to two core objectives – (i) reducing environmental stress to human health (the environmental health objective) and (ii) protecting ecosystems and natural resources (the ecosystem vitality objective).
Results of first ten countries are shown in Table -1. Switzerland leads the world based on strong performance across most issues, especially air quality and climate protection. In general, high scorers exhibit longstanding commitments to protecting public health, preserving natural resources, and decoupling greenhouse gas (GHG) emissions from economic activity.
As per the scores aggregated for the 24 indicators chosen under 10 criteria Table-2, India and Bangladesh are ranked at 177 and 199 respectively near the bottom of the rankings. Low scores on the EPI suggest the need for national sustainability efforts on a number of fronts, especially cleaning up air quality, protecting biodiversity, and reducing GHG emissions. As the EPI project has highlighted for two decades, better data collection, reporting, and verification across a range of environmental issues are urgently needed. The existing gaps are especially pronounced in the areas of sustainable agriculture, water resources, waste management, and threats to biodiversity. Supporting stronger global data systems thus emerges as essential to better management of sustainable development challenges.
The overall EPI rankings indicate which countries are doing best against the array of environmental pressure that every nation faces. From a policy perspective, greater value derives from drilling down into the data to analyze performance by specific issue, policy category, peer group, and country. Such an analysis can assist in refining policy choices, understanding the determinants of environmental progress, and maximizing the return on governmental investments.

Table-2: -India and Bangladesh Rank. Table-1. EPI 2018 Yale top ten Countries and India
The 2018 EPI represents a composite index. After collection of data on 24 individual metrics of environmental performance, as shown in Figure-1, these metrics were aggregated into a hierarchy beginning with ten issue categories: Air Quality, Water & Sanitation, Heavy Metals, Biodiversity & Habitat, Forests, Fisheries, Climate & Energy, Air Pollution, Water Resources and Agriculture. These issue categories are then combined into two policy objectives—Environmental Health and Ecosystem Vitality—and then finally consolidated into the overall EPI. To allow for meaningful comparisons, scores were constructed for each of the 24 indicators, placing them onto a common scale where 0 indicates worst performance and 100 indicates best performance. How far a country is from achieving international targets of sustainability determines its placement on this scale. The indicator scores are then multiplied by weights, shown in fig -1, and added together to produce scores at the levels of the issue categories, policy objectives, and the final EPI. These scores serve as the basis for country ranks. Indicators are constructed from the most recently available data for each of the 24 metrics of environmental performance. To track changes over time, the same methods to historic data in order to show what the EPI score for each country would be in a baseline year, generally ten years prior to the current report. To evolve performance of every country and aggregating those data into measurements of global performance and score these global aggregations the same 0–100 scale as individual countries, showing the state of the world on each indicator has been carried out. The results of the 2018 EPI—the scores, rankings, trends, and global aggregates— translate environmental data into terms that are comprehensive and comprehendible.
A comparison of the EPI 2020 ( 9 Category and 37 Indicators) now constructed with
2018 EPI Yale University ( 10 Category and 24 Indicators) clearly indicates that the Avg national Score of India is 0.3818 , the highest being 0.4967 (1st ranked state ) and lowest as 0.3172 (Haryana state) compared to yale study score which is 0.3057. India has been ranked 177 as per Yale report. Inclusion of Disaster Management as a Category and a relook at indicators and weightage could be considered in Yale EPI 2020.
EPI
RK
Country Score Reg.Std
170 Angola 37.44 40 171 Central African
Republic 36.42 41 172 Niger 35.74 42 173 Lesotho 33.78 43 174 Haiti 33.74 12 175 Madagascar 33.73 44 176 Nepal 31.44 24 177 India 30.57 25 178 Dem. Rep. Congo 30.41 45 179 Bangladesh 29.56 26 180 Burundi 27.43 46
Country epi rank EPI
scoreEnv. health
Eco System Vitality
India 177 30.57 9.32 44.74Switzerland 1 87.42 93.57 83.32France 2 83.95 95.71 76.11Denmark 3 81.6 98.2 70.53Malta 4 80.9 93.8 72.3Sweden 5 80.51 94.41 71.24UK 6 79.89 96.03 69.13Luxembourg 7 79.12 95.07 68.48Austria 8 78.97 86.38 74.03Ireland 9 78.77 95.92 67.34Finland 10 78.64 99.35 64.83

The Environmental Performance Index-2020
ThePC-EPI2013The PC EPI was evolved in 20138 after careful perusal of all variables and
categories considered under various studies. To begin with 5 categories comprising 16 indicators were chosen and the normal deviation and distance travelled method was used for indicators for which standards have been notified and in respect of indicators with no standards, i.e. forests, etc. a method was evolved and these integrated to arrive at a composite index. The idea was that the 16 indicators selected, when combined could give a composite EPI ranking of the states. The criteria were air pollution, water quality, forests, waste management and climate change. Indicators were sought to cover the full spectrum of issues underlying each of the major components of the environment, i.e. criteria identified. To ensure the use of the best-suited metrics, the indicator selection criteria applied were relevance (the indicator clearly tracks the environmental issue of concern), performance orientation (the indicator tracks ambient conditions or on-the-ground results to national standards and requirements) and data quality (the data used represent the measures taken by the states).
2018EPIYaleUniv

The Environmental Performance Index-2020 After a careful study of all the referred publications sited, to make PC-EPI-2013 comprehensive, Biodiversity, Agriculture, Fisheries and Disaster Management as criteria with 4 indicators each have now been added. In the existing criteria, Air Pollution, SPM has been split into PM 2.5 and PM10 as indicators, in water quality and waste management criteria one indicator each and two indicators in Climate Change have been added and EPI, 2020 evolved. EPI 2020 now comprises 9 criteria and 37 indicators (Table-3) which calculates EPI scores for the selected criteria and indicators for all the states and Union Territories (UTs). Table-4detailstheDatasetsusedforconstructionofIndicators.(appendix) Table-3: - EPI 2020 Criteria and indicators
S. No
Criteria
Indicators No. of variables
1 Air Pollution 1. NOx, 2. SOx, 3. PM2.5, PM10 4
2
Forests
1. TFC as % of state GA and Contribution to national FC, 2. Change in forest cover, 3. Growing Stock and 4. Afforestation efforts.
4
3
Water
quality
1. % Dom. Waste water treated, and 2. Surface water quality (.DO , BOD & TFC). 3. Ground water extraction % and 4. % of 17 Cat. Of Ind. complying with WWT Standards.
4
4
Waste
Management 1. MSW, 2. Bio-med.,3. Hazardous Wastes and 4.E- waste. 4
5
Climate
Change
1. Preparation of SAPCCs, 2. % RE Gen Capacity, 3.CO2 Saved from LED, 4. % Grid connected Solar Power,5. Lives lost per Crore population.
5
6
Biodiversity
1.Indigenous livestock population change, 2. change in wetland 3. change in Protected Area Network and 4. % desertification.
4
7 Agriculture
1.Change in land under Agriculture,2. Vuln. Agri.Dist., 3. %’ shares in total GSVA 17-18, 4. Land under Micro irrigation.
4
8 Fisheries 1. Fish Stock change, 2. Marine and Biodiversity Protected Area, 3. Funds for dev. of fisheries and 4. Valuation (Cr) of marine fish landing. 2017 +2018 and Share % of landing.
4
9 Disaster
Management
1. Status of State and District DM plan, 2. Inst.Setup 3. Budget and 4. Avg. Forest fire incidence ,2016+17.
4
TOTAL 9 37

To allow for meaningful comparisons, scores were constructed (Table-4) for each of the 37 indicators, placing them onto a common scale where 0 indicates worst performance and 100 indicates best performance. Table 5 presents EPI-2020 scores and ranking of the states and UTs as of Jan 2020 for the nine categories separately, based on arithmetic mean of scores of all the indicators covered under each category and ranking of the states, based on mean cumulative scores (Figure2). With an EPI score of 0.4967, 0.4821, 0.4805, 0.4686 and 0.4555, Gujarat, Andhra Pradesh, Karnataka, Kerala and Orissa in that order have been ranked as the best-performing states respectively. EPI 2020 with addition of 4 new Criteria and 16 new indicators on analysis ranks Gujarat (0.4977), Tamil Nadu (0.4361), West Bengal (0.3902), Andhra Pradesh (0.3750), and Kerala (0.3719) as five top ranking states in that order. Table 5.1-5.9 depicts the performance scores and ranking of the States and UTs of all the 37 indicators. The indicators considered for measuring the performance of AAQ are Sulphur dioxide (SOx), nitrogen oxide (NOx) PM2.5 and PM 10. The data in respect of all the four indicators is the annual average.
It is observed that all the states meet the prescribed national ambient air quality standards in respect of SOx of 50 µg/m3. In respect of NOx, Delhi, D&NH and D&D are the 3 UTs which do not meet the 40 µg/m3 national standard. In respect of PM 2.5 and PM10 except for Kerala, Manipur, Meghalaya, Mizoram, Sikkim, Telangana, Lakshadweep and Puducherry none of other states meets the national standard. States that meet the standards have been given a score of 1 for each indicator and the average scores derived from the cumulative score and the states ranked. Kerala, Manipur, Meghalaya, Mizoram, Sikkim, Telangana and Puducherry with an average score of 1 are ranked as the best states/UTs in terms of air quality. As discussed, the 5 criteria with 16 indicators in 2013 has now been compared after data updation and increased number of 21 indicators. (Table- 6 ). As can be seen, with score0.5386, 0.5328 ,0.5245, 0.4859 and 0.4790, Andhra Pradesh, Kerala, Goa, Karnataka and Arunachal Pradesh in that order emerge as the best performing States

Table-6:-Comparision of EPI-2013 and EPI- 2020
New 4 Cat 5 old Cat EPI 2020
S.No States Score Rank Score Rank Score Rank 1 Andhra Pradesh 0.3750 4 0.5386 1 0.4821 2 2 Aruna.Pradesh 0.3575 8 0.4790 5 0.4391 9 3 Assam 0.3140 27 0.4374 22 0.3956 21 4 Bihar 0.3043 32 0.3157 35 0.3186 34 5 Chhatisgarh 0.2733 36 0.4684 11 0.3909 22 6 Goa 0.3345 10 0.5245 3 0.4448 7 7 Gujarat 0.4977 1 0.4427 18 0.4967 1 8 Haryana 0.3067 28 0.3481 32 0.3172 35 9 Himachal Pradesh 0.3291 12 0.4515 15 0.4322 10
10 J & K UT 0.3701 7 0.4571 14 0.4197 14 11 Ladakh UT 0.3159 25 0.1258 37 0.1917 37 12 Jharkhand 0.2878 34 0.3415 33 0.3384 31 13 Karnataka 0.3710 6 0.4859 4 0.4805 3 14 Kerala 0.3719 5 0.5328 2 0.4686 4 15 Madhya Pradesh 0.2794 35 0.4691 9 0.3978 20 16 Maharashtra 0.3315 11 0.4419 19 0.4022 19 17 Manipur 0.3064 30 0.4351 23 0.3905 23 18 Meghalaya 0.3060 31 0.4685 10 0.4169 15 19 Mizoram 0.3242 15 0.4743 6 0.4306 11 20 Nagaland 0.3173 22 0.4488 16 0.3769 27 21 Orissa 0.3213 18 0.4735 7 0.4555 5 22 Punjab 0.3212 19 0.3673 30 0.3196 33 23 Rajasthan 0.3155 26 0.3491 31 0.3749 28 24 Sikkim 0.3268 13 0.4647 13 0.4212 13 25 Tamilnadu 0.4361 2 0.4700 8 0.4397 8 26 Telangana 0.2990 33 0.4347 24 0.3896 24 27 Tripura 0.3223 17 0.4444 17 0.4099 17 28 Uttar Pradesh 0.3166 24 0.4406 21 0.3776 26 29 Uttaranchal 0.3067 28 0.4008 27 0.4060 18 30 West Bengal 0.3902 3 0.4407 20 0.4133 16 31 Andn & Nicobar 0.3346 9 0.4663 12 0.4510 6 32 Chandigarh 0.3167 23 0.4150 26 0.3576 30 33 D & Nagar Haveli 0.3196 21 0.4003 28 0.3794 25 34 Daman & Diu 0.2627 37 0.2455 36 0.2673 36 35 Lakshadweep 0.3203 20 0.3182 34 0.4213 12 36 Delhi 0.3236 16 0.4342 25 0.3378 32 37 Pondicherry 0.3253 14 0.3911 29 0.3740 29
0.00000.20000.40000.60000.80001.00001.2000
A PAssa
m
Chsgarh Goa
Har
J & K UT
Jhar KerMah Meg
Nag
Punjab Sik Tel
U P W B
Chandi
D & Diu Pud
Fig-3 Scores and Ranking in 2020 as per 5 Criteria of EPI
AIRPOL* FOREST W. QUA. WASTE MG CC
Four indicators: (i) sewage disposal, (ii) water quality of rivers, viz. dissolved oxygen (DO) and total coliform count, (iii) percentage of groundwater exploitation and % of 17 Cat.of Ind. complying with WWT Standards have been considered for the state-wise performance scores for water quality. According to the data made available none of the States have set up 100% treatment capacity for sewage. The scores highlight the dismal performance of the states with respect to sewage disposal.
With regard to surface river water quality violation, except for three states,
Jharkhand, Mizoram and D&NH all others for which data are available do not comply with the standards prescribed. Delhi, Haryana, Punjab and Rajasthan extract groundwater more than recharge.
The indicators selected for ranking the states on forest performance are total forest cover (TFC) percentage of state GA and contribution to the national average, change in forest cover during 2015 to 2019, total growing stock and yearly average afforestation effort during 2017 to 2019. Based on deviation method average scores were computed for each indicator and the cumulative average scores used to rank the states. Karnataka, Orissa, Andhra Pradesh, Kerala and Telangana are ranked 1, 2, 3, 4 and 5 respectively (Figure-2 )
Figure indicates waste management in the states and considers municipal solid waste (MSW) collection efficiency, treatment and disposal capacity, hazardous waste, biomedical waste and E-waste in terms of capacity set up for treatment and disposal. The results show that the states lack the capacity to treat MSW, hazardous waste and e-waste. Efforts have been made to handle, treat and dispose biomedical waste in terms of capacity set up for treatment but no effort has been made to collect and dispose both MSW and Hazardous waste by the states . as per the rules notified. Considering that Goa treats 80% of the MSW, treats 100% of the biomedical waste, has the capacity to dispose 73% of hazardous wastes generated, and ensures that E-waste generated is recycled in other state it is ranked as the best state (Figure 2) with respect to waste management.
Climate change mitigation was assessed in terms of availability of State Action Plan for Climate Change, % RE Gen. Capacity, Co2 saved by use of LED bulbs per 1000 Pop , % Grid connect Solar power installed and Lives lost per Cr. Lakshadweep, A&N, Orissa, Karnataka and Uttarakhand are ranked 1, 2, 3, 4 and 5 respectively (Figure 2).
The indicators selected for Biodiversity are change in Livestock, Wetland, Protected Area and % increase in desertification. Gujarat, J &K, Madhya Pradesh, Rajasthan and Maharashtra in this order are ranked as top 5 states.
Land under Agriculture, Vulnerable VH &H districts, Area under micro irrigation and % share in total GSVA (17-18) of the states are the four indicators chosen under agriculture. The scores of the five leading states, Nagaland, Arunachal Pradesh, Mizoram, Meghalaya and Kerala are low (0.2865-0.2751) and raises concerns regarding the sector.
The indicators selected under the fisheries category to assess progress by states/ UTs are; Change in fish stock (2015-17), Numbers and Area of marine protected and Biodiversity sites, funds released & utilized for fisheries development and value of marine fish landing (2017-18). Tamil Nadu, Gujarat, Andhra Pradesh, Kerala and Karnataka have been adjudged as the top five states in that order.

The analysis of Disaster Management indicators; State and District DM plans, SDMA & DDMA setup, Budget available for DM, and Forest fire incidence, indicates that efforts have been made by all the UTs and only the state of Sikkim.
Monitoring progress of related SDG and Sendai targets and goals. EPI 2020 has been constructed based on 9 Category and 37 indicators. These relate to 12 SDG targets and 31 indicators. Table -7 indicates the SDG targets and corresponding indicators for each of the EPI 2020 Category and indicators. Thus EPI 2020 enables yearly assessing the progress made under the 31 indicators related to 12 SDG targets. Table-8 below indicates top 10 countries and India is ranked 115 with a score of 61.1 among 162 countries assessed. The global indicator framework includes 231 unique indicators. The total number of indicators listed in the global indicator framework of SDG indicators is 247. Twelve indicators are repeated under two or three different targets e.g. 1.5.1/13.1.1, 1.5.3/13.1.2 As per the Sustainable Development Report 2019, Governments need to have access to timely, disaggregated data on the SDGs. Given the breadth of the goals this requires greater investments in statistical capacity in all countries as well as the development of national indicators of progress towards the SDGs. The 2019 SDSN survey finds there is no common approach across countries for monitoring SDG implementation. The number of national indicators to monitor the SDGs varies greatly from 34 indicators in Belgium to 244 in Canada. The European Union, via Eurostat, has identified 100 indicators to monitor the implementation of the SDGs in the EU. The frequency and approach to measuring distance to SDG targets is also very different across countries. Few have undertaken quantitative assessments of distance to SDG targets.
Table-8-The2019SDGIndex
Rank Country Score1 Denmark 85.22 Sweden 85.03 Finland 82.84 France 81.55 Austria 81.16 Germany 81.17 CzechRepublic 80.78 Norway 80.79 Netherland 80.410 Estonia 80.2115 India 61.1
The Niti Aayog, GOI, has setup an SDG India Index Dashboard. The indicator set for SDG India Index 2019-2020 is large (100 indicators) as compared to SDG India Index 2018 (62 indicators) and hence the two indices are strictly not comparable. There are 40

indicators that are common across SDG India Index 2018 and SDG India Index 2019-2020. Fig-4 indicates the progress made by the 29 states in India.
Fig-4:- SDG India Index 2019-2020. Progress made by the 29 states in India.

Sendai Targets and Goals In order to accelerate implementation of the Sendai Framework for Disaster Risk Reduction (2015-2030) at local level, the ten Essentials map prepared indicates directly the action and its indicators for monitoring progress on disaster risk reduction. They are the critical and independent steps that need to be undertaken to build and maintain resilience. This document provides the rationale for each Essential, pointing out strategic areas of intervention and identifying key actions. The actions identified under each Essential should be part of the overall disaster risk reduction planning process and influence urban development planning and design. As indicated in Table-3 following 4 indicators under the category Disaster 1.Status of State DM Plan
2.Institutional setup state (SDMA) and District (DDMA) 3. Budget in Crores 18-19(Dec) 4. No. (2017) and average (2017 ,2016) Forest fire incidence,
Management of EPI 2020 which are also SDG indicators; 1.5.2, 1.5.3/13.1.1, 11.5.2, 11.b.1 and 11.2 are part of the following ten essentials map for monitoring DRR under Sendai Framework. 1. Organise for disaster resilience, 2. Identify, understand and use current and Strengthen future risk scenarios, 3 financial capability for resilience, 4. Pursue resilient urban development and design, 5. Safeguard natural buffers to enhance the Protective functions offered by natural capital , 6. Strengthen institutional capacity for resilience , 7. Understand and strengthen societal capacity For resilience , 8. Increase infrastructure resilience , 9. Ensure effective disaster response and 10. Expedite recovery and build back better. EPI 2020 enables assessing 7 of the 10 indicators for monitoring DRR under Sendai framework. Table-5 and Table-5.9 highlights the scores and rank of each Indian State and UT.
References 1. Mukherjee, S. and Kathuria, V., Is economic growth sustainable? Environmental
quality of Indian States after 1991. Int. J. Sustain. Dev., 2006, 9, 38–60. 2. Kadekodi, G. K. and Venkatachalam, L., Human development, environment and
poverty nexus in India. Institute for Social and Eco- nomic Change, Report prepared for the United Nations Development Programme, New Delhi, 2005.
3. Mukherjee, S. and Chakraborty, D., Environment, human development and economic growth after liberalization: an analysis of Indian States. Working Paper 16/2007, Madras School of Economics, Chennai, 2007.
4. OECD set of Environmental Indication 1989 as amended. 5. Environmental performance index. Yale and Columbia Universities in collaboration
with World Economic Forum, Geneva, and Joint Research Centre of the EU, Ispra, Italy, 2012.
6. Status of E-Waste in India- A Review Israel Cherukuri1, Nazia Sultana2 And Sankara Pitchaiah Podila3 1,2 ,3 Department of Geology, Acharya Nagarjuna University,

Nagarjuna Nagar, Guntur -522510, Andhra Pradesh, India *Corresponding Author-Israel cherukur.
7. IOSR Journal of Environmental Science, Toxicology and Food Technology (IOSR-JESTFT) e-ISSN: 2319-2402, p- ISSN: 2319-2399.Volume 12, Issue 11 Ver. I (November. 2018), PP 08-16 www.iosrjournals.org.
8. AMBIENT AIR QUALITY SCENARIO AT PORT BLAIR, ANDAMAN ISLAND M. Vasanthy, R. Velmurugan* and Babu Rajendran** P.G and Research Department of Environmental Sciences, Government Arts College, Ariyalur- 621 713, Tamil Nadu, India *Richardson and Cruddas (1972) Ltd., Chennai, India **Department of Ecobiotechnology, School of Environmental Sciences, Bharathidasan University, Trichy, Tamil Nadu, India.
9. Nature Environment and Pollution Technology © Technoscience Publications Vol. 6 No. 3 pp. 437-441 2007
10. OECD (2020), Environment at a Glance 2020, OECD Publishing, Paris, https://doi.org/10.1787/4ea7d35f-en.
11. Marine Fish Landings in India 2018, A. Gopalakrishnan, ICAR-Central Marine Fisheries Research Institute P. B. No. 1603, Ernakulam North P. O. Kochi - 682 018, Kerala, India
12. Indicators for sustainable fisheries: FAO’s work and perspective, G. Bianchi, FAO Marine and Inland Fisheries,2014.
13. National Wildlife Database, Wildlife Institute of India, India State of Forest Report 2017 (Forest Survey of India)
14. www. http://moef.gov.in/ 15. www. http://www.wiienvis.nic.in/Database/Maps_PAs_1267.aspx 16.file:///C:/Users/Indrani/Desktop/SDG%20India%20Index%20and%20Dashboard%20_%20iTech%20Mission.html
ACKNOWLEDGEMENTS We also thank Dr Nalini Bhat, Former Adviser, MoEF for her constructive ideas.

APPENDIX Table4:-DatasetsusedforconstructionofIndicators.
S.No Criteria Indicator Data Set Abbre 1 Air pollution 1.SOx Adherence to NAAQS
2.NOx 3.PM2.5 4.PM10
1.Sox, Ambient Concentration -Adherence to NAAQS by states. 2.NOx, Ambient Concentration -Adherence to NAAQS by states. 3.PM2.5, Ambient Concentration -Adherence to NAAQS by states. 4.PM10, Ambient Concentration- Adherence to NAAQS by states.
2 Forest 1.Total Forest Cover (TFC) 2.Change in Forest cover 3.Growing Stock 4. Afforestation efforts
1 Forest %of State GA & Contribution to National Forest Cover. 2. Change in state Forest cover, 2017-2019. 3. Forest Stock state wise in Million cu.m 4.Afforestation efforts made during 2017-18 in Ha.
TFC
3 Water Quality 1.% Sewage Waste water treated 2.Surface water quality (DO, BOD& FC) 3.Ground Water extraction % 4. % of 17 Categories of Industries complying with WWT Standards
1.Sewage generation and treatment capacity state wise. 2.River water quality; Dissolved oxygen (DO), Biological Oxygen Demand (DOB)and Total Fecal Coliform (FC) state wise. 3.% Ground water (GW) extracted state wise. 4.% of 17 categories of polluting industries notified adhering to Waste Water Treatment (WWT) standards.
FC WWT
4 Waste Management
1.MSW generated, collected and treated. 2.Haz. waste generated and treated 3.Biomedical waste generated and treated 4.E-Waste generated, treated and recycled.
1.Municipal Solid waste (MSW) generated, collected and treated by states Per year. 2.Hazardous Waste generated and treated by industries yearly in the states. 3. Biomedical waste (BMW) generated and treated by hospitals in the states yearly. 4. Electronic waste (EW) generated, treated and recycled by states per year.
MSW HW BMW EW
5 Climate and Energy 1.Status of SAPCC 2.%RE Gen. Capacity 3. Co2 saved from LED bulbs per 1000 Pop. 4.Instal. Grid connect Solar power % 5.Lives lost per crore population.
1.Status of preparation of State Action plan for Climate Change. 2. % capacity state wise of Renewable energy generation. 3.State wise. Co2 emission saved by use of LED bulbs per 1000 P. 4. State wise % Grid connection of Solar power installed. 5.Lives lost due to calamities per crore of population in states.
SAPCC RE
6 Biodiversity 1.Indigenous livestock population change 2. Wetland Area state wise 3. Protected area state wise 4. % desertification
1. Yearly Change in Livestock population state wise. 2. Total wetland Area recorded in 2019 in each state. 3.Protected Area in 2018 state wise. 4.Total land lost to desertification and State wise percent.
7 Agriculture 1.Land under Agriculture state wise 2.Agri districts and VH and H vulnerable districts. 3. Land (Ha) under Micro irrigation 4. % share in total Gross State Valuation of Agriculture 17-18
1.Land under Agriculture state wise 2.No. of Agri districts and Very high and highly vulnerable districts in each state. 3. State wise land under micro irrigation. 4.% share of Agriculture of all states in total Gross State Valuation (GSV) in 2017-18.
VH & H GSV
8 Fisheries 1.Change in Fish Stock in Tonnes 2. No. and Area of Marine, Protected and biodiversity Sites. 3. Funds released 2017-18 in Lakhs and % of funds received by states. 4. Valuation (in Cr) of marine fish landing in 2017 & 2018 and share of landing state wise
1. Change in Fish Stock in tonnes state wise. 2. State wise No. and Area of Marine, Protected and Biodiversity Sites notified. 3. Funds released under various fishery schemes in 2017-18 in Lakhs and % of funds received by each state. 4. Valuation (in Cr) of marine fish landing in 2017 & 2018 and share of landing state wise.
Cr
9 Disaster Management
1.Status of State Disaster Mg. Plan 2.Institutional setup state (SDMA) and District (DDMA) 3. Budget in Crores 18-19(Dec) 4. No. (2017) and average (2017 ,2016) Forest fire incidence
1.Status of preparation of State Disaster management Plan (SDMP) by the States. 2.Status of Setting up of State and District Disaster Management Authorities in the States. 3.Budget (Cr) allocated for Disaster Management to states in 2018-19. 4. No. (2017) and average (2017 ,2016) Forest fire incidence recorded state wise.
DM SDMP

S.No States /UtsAvg Sc * Rk Avg.Sc RK Avg.Sc RK Avg.Sc RK Avg.Sc RK Avg.Sc RK Avg.Sc RK Avg.Sc RK Avg.Sc RK Score Rank
1 Andhra Pradesh 0.9333 12 0.5370 3 0.4352 14 0.3018 18 0.4855 9 0.1466 11 0.2299 21 0.2697 3 0.8538 33 0.4659 2
2 Arunachal Pradesh 0.9565 9 0.3840 6 0.3817 20 0.2502 25 0.4227 16 0.1816 6 0.2825 2 0.0049 28 0.9609 21 0.4250 9
3 Assam 0.9231 13 0.2296 14 0.4485 13 0.1955 30 0.3904 19 0.1113 18 0.2553 17 0.0219 14 0.8677 32 0.3826 21
4 Bihar 0.8391 24 0.0744 28 0.3666 23 0.0599 33 0.2386 35 0.0802 19 0.1470 33 0.0105 23 0.9794 15 0.3106 34
5 Chhatisgarh 0.9020 17 0.3759 7 0.4840 8 0.3069 17 0.2735 31 0.1326 13 0.1767 29 0.0388 10 0.7452 35 0.3817 22
6 Delhi 0.6124 36 0.0202 35 0.1764 33 0.3622 8 0.4414 14 0.0325 27 0.2593 15 0.0030 32 0.9998 6 0.3230 32
7 Goa 0.9444 11 0.0957 26 0.6066 2 0.5344 1 0.3722 22 0.0279 29 0.2693 9 0.0422 9 0.9985 9 0.4324 7
8 Gujarat 0.8437 23 0.2304 13 0.4349 15 0.3326 13 0.4903 7 0.5263 1 0.1715 30 0.3316 2 0.9613 20 0.4803 1
9 Haryana 0.7901 28 0.0299 32 0.1570 35 0.2731 19 0.2904 30 0.0291 28 0.1831 26 0.0260 12 0.9886 11 0.3075 35
10 Himachal Pradesh 0.9231 13 0.3150 12 0.5882 3 0.1408 31 0.4664 11 0.1406 12 0.1828 27 0.0127 20 0.9801 14 0.4166 10
11 J & K UT 0.8009 27 0.3648 8 0.3803 21 0.2729 20 0.3674 24 0.2381 2 0.2504 19 0.0090 25 0.9831 12 0.4074 14
12 Ladakh UT 0.0117 37 0.2500 30 0.0000 36 0.1537 37 0.0137 35 0.2500 20 0.0000 35 1.0000 1 0.1866 37
13 Jharkhand 0.7790 31 0.1935 17 0.5515 5 0.0299 34 0.2615 33 0.0542 23 0.1553 32 0.0112 22 0.9307 24 0.3297 31
14 Karnataka 0.9198 15 0.5757 1 0.3199 28 0.3527 10 0.5166 4 0.1779 8 0.1779 28 0.2179 5 0.9104 29 0.4632 3
15 Kerala 1.0000 1 0.4270 4 0.3602 24 0.3603 9 0.4479 12 0.0586 21 0.2751 5 0.2416 4 0.9122 28 0.4536 4
16 Madhya Pradesh 0.9076 16 0.3636 9 0.3756 22 0.2506 23 0.4343 15 0.2244 3 0.1440 34 0.0185 17 0.7307 37 0.3833 20
17 Maharashtra 0.8608 20 0.3511 10 0.4265 16 0.1370 32 0.3988 17 0.1895 5 0.1852 25 0.1543 6 0.7969 34 0.3889 19
18 Manipur 1.0000 1 0.0430 30 0.4831 9 0.2504 24 0.3938 18 0.0212 31 0.2708 8 0.0102 24 0.9232 26 0.3773 23
19 Meghalaya 1.0000 1 0.1554 18 0.4767 11 0.3164 15 0.4454 13 0.0269 30 0.2784 4 0.0032 31 0.9155 27 0.4020 15
20 Mizoram 1.0000 1 0.1357 21 0.5404 6 0.2501 27 0.5013 6 0.1128 17 0.2796 3 0.0059 27 0.8987 30 0.4138 11
21 Nagaland 0.8254 25 0.1472 20 0.5197 7 0.2502 25 0.2924 29 0.0384 26 0.2865 1 0.0049 28 0.9396 22 0.3672 27
22 Orissa 0.8772 19 0.5571 2 0.4006 18 0.2403 28 0.5682 3 0.1570 9 0.2721 6 0.1227 8 0.7334 36 0.4365 5
23 Punjab 0.8075 26 0.0306 31 0.1690 34 0.2612 21 0.2486 34 0.0688 20 0.2233 22 0.0124 21 0.9804 13 0.3113 33
24 Rajasthan 0.7894 29 0.1126 25 0.2063 32 0.3887 5 0.4727 10 0.1897 4 0.0925 36 0.0033 30 0.9764 17 0.3591 28
25 Sikkim 1.0000 1 0.0841 27 0.5549 4 0.2118 29 0.4866 8 0.0466 25 0.2623 12 0.0000 35 0.9985 9 0.4050 13
26 Tamilnadu 0.9565 9 0.2026 15 0.3553 25 0.3488 11 0.2688 32 0.1190 16 0.1937 23 0.4614 1 0.9705 19 0.4307 8
27 Telangana 1.0000 1 0.3973 5 0.1188 37 0.3884 6 0.3122 28 0.1291 15 0.1578 31 0.0149 19 0.8941 31 0.3792 24
28 Tripura 0.9020 17 0.1307 22 0.4795 10 0.3977 4 0.3767 21 0.0515 24 0.2565 16 0.0085 26 0.9726 18 0.3973 17
29 Uttar Pradesh 0.9892 8 0.1992 16 0.3003 29 0.3374 12 0.2346 36 0.1313 14 0.1865 24 0.0212 15 0.9277 25 0.3697 26
30 Uttaranchal 0.7682 32 0.3291 11 0.3423 26 0.3296 14 0.5060 5 0.1480 10 0.1307 35 0.0165 18 0.9317 23 0.3891 18
31 West Bengal 0.7857 30 0.1285 23 0.3970 19 0.3861 7 0.3545 26 0.1782 7 0.2721 6 0.1339 7 0.9766 16 0.4014 16
32 Andaman & Nicobar0.8571 21 0.1522 19 0.6541 1 0.3135 16 0.5716 2 0.0547 22 0.2614 14 0.0232 13 0.9989 8 0.4319 6
33 Chandigarh 0.8502 22 0.0272 33 0.2067 31 0.4195 3 0.3443 27 0.0141 33 0.2526 18 0.0000 35 1.0000 1 0.3460 30
34 Dadra & Nagar Haveli0.6802 34 0.0601 29 0.4546 12 0.4626 2 0.3678 23 0.0151 32 0.2622 13 0.0011 34 1.0000 1 0.3671 25
35 Daman & Diu 0.7047 33 0.0256 34 0.1294 36 0.0001 35 0.3807 20 0.0137 35 0.0067 37 0.0303 11 1.0000 1 0.2546 36
36 Lakshadweep 0.6667 35 0.1251 24 0.4184 17 0.0000 36 1.0000 1 0.0137 35 0.2656 11 0.0018 33 1.0000 1 0.3879 12
37 Pondicherry 1 1 0.0148 36 0.3284 27 0.2509 22 0.3615 25 0.0138 34 0.2689 10 0.0188 16 0.9997 7 0.3619 29
FINAL SC & RK
Fig-5 FINAL EPI 2020 Scores and Ranking of States 29-4-20AIRPOL* FOREST WATER QUALITY WASTE MG CLIMATE CHANGE BIODIVERSITY AGRICULTURE FISHERIES DISASTER MG

Table-5.1: -AAQs Performance
Sl No State/UT (µg/
cum
)
NA
AQ
S
Scor
e-1
(µg/
cum
)
NA
AQ
S
Scor
e-2
Ann
. Avg
NA
AQ
S
Scor
e-3
Ann
. Avg
NA
AQ
S
Scor
e-4
Avg
Sc, 1
-3
Avg
. Sc
1-4 Ra
nk 1
-3
Rank 1-4
1 A. Pradesh 7 50 1.0000 22 40 1.0000 75 60 0.8000 40 0.9333 122 Aru. Pradesh 3 50 1.0000 7 40 1.0000 69 60 0.8696 40 0.9565 93 Assam 7 50 1.0000 15 40 1.0000 78 60 0.7692 40 0.9231 134 Bihar 9 50 1.0000 26 40 1.0000 116 60 0.5172 78 40 0.5128 0.8391 0.7575 24 175 Chhattisgarh 9 50 1.0000 22 40 1.0000 85 60 0.7059 45 40 0.8889 0.9020 0.8987 17 9
6 Delhi 7 50 1.0000 68 40 0.5882 241 60 0.2490 101 40 0.3960 0.6124 0.5583 36 19
7 Goa 7 50 1.0000 13 40 1.0000 72 60 0.8333 26 40 1.0000 0.9444 0.9583 11 3
8 Gujarat 15 50 1.0000 26 40 1.0000 113 60 0.5310 37 40 1.0000 0.8437 0.8827 23 119 Haryana 10 50 1.0000 17 40 1.0000 162 60 0.3704 40 0.7901 28
10 H. Pradesh 2 50 1.0000 12 40 1.0000 78 60 0.7692 30 40 1.0000 0.9231 0.9423 13 411 J&K 4 50 1.0000 18 40 1.0000 149 60 0.4027 40 0.8009 2712 Ladakh13 Jharkhand 21 50 1.0000 38 40 1.0000 178 60 0.3371 40 0.7790 3114 Karnataka 3 50 1.0000 21 40 1.0000 79 60 0.7595 37 40 1.0000 0.9198 0.9399 15 5
15 Kerala 4 50 1.0000 16 40 1.0000 48 60 1.0000 40 1.0000 116 M. Pradesh 11 50 1.0000 19 40 1.0000 83 60 0.7229 38 40 1.0000 0.9076 0.9307 16 6
17 Maharashtra 15 50 1.0000 36 40 1.0000 103 60 0.5825 40 40 1.0000 0.8608 0.8956 20 1018 Manipur 3 50 1.0000 19 40 1.0000 29 60 1.0000 40 1.0000 119 Meghalaya 5 50 1.0000 12 40 1.0000 59 60 1.0000 40 1.0000 120 Mizoram 2 50 1.0000 6 40 1.0000 38 60 1.0000 40 1.0000 121 Nagaland 2 50 1.0000 7 40 1.0000 126 60 0.4762 40 0.8254 2522 Orissa 6 50 1.0000 18 40 1.0000 95 60 0.6316 41 40 0.9756 0.8772 0.9018 19 823 Punjab 8 50 1.0000 3 40 1.0000 142 60 0.4225 40 0.8075 2624 Rajasthan 8 50 1.0000 11 40 1.0000 163 60 0.3681 40 0.7894 2925 Sikkim 6 50 1.0000 3 40 1.0000 33 60 1.0000 40 1.0000 126 Tamil Nadu 10 50 1.0000 5 40 1.0000 69 60 0.8696 32 40 1.0000 0.9565 0.9674 9 2
27 Telengana 8.68 50 1.0000 11.3 40 1.0000 32 60 1.0000 98 40 0.4087 1.0000 0.8522 1 12
28 Tripura (H) 23 50 1.0000 14 40 1.0000 85 60 0.7059 43 40 0.9302 0.9020 0.9090 17 729 UP 11 50 1.0000 19 40 1.0000 62 60 0.9677 40 40 1.0000 0.9892 0.9919 8 130 Uttarakhand 24 50 1.0000 39 40 1.0000 197 60 0.3046 119 40 0.3361 0.7682 0.6602 32 1831 West Bengal 7 50 1.0000 3 40 1.0000 168 60 0.3571 40 0.7857 3032 A & Nicobar 50 1.0000 12.8 40 1.0000 105 60 0.5714 55 40 0.7273 0.8571 0.8247 21 1333 Chandigarh 2 50 1.0000 16 40 1.0000 109 60 0.5505 64 40 0.6250 0.8502 0.7939 22 14
34 D&NH 15 50 1.0000 80 40 0.5000 111 60 0.5405 33 40 1.0000 0.6802 0.7601 34 16
35 Daman & Diu 14 50 1.0000 73 40 0.5479 106 60 0.5660 32 40 1.0000 0.7047 0.7785 33 1536 Lakshadweep NA 50 0.0000 14 40 1.0000 33 60 1.0000 40 0.6667 3537 Pudducherry 4.69 50 1.0000 31.1 40 1.0000 36 60 1.0000 1.0000 1
SOX NOX PM 10
AAQS (µg/cum) PERFORMANCE SCORES FOR STATES- FINAL-21/2/2020
PM2.5 Final

S.No StatesGA sq.km
SFR 2019
% of GA score
Cont to NFC Score
Score-1 RK
SFR 2017
Change %
Score-2 RK
Forest Stock
TOF stock
Total Stock Score-3 RK
Area 17-18
Score-4 RK Avg.Sc RK
1 Andhra Pradesh 162968 29137 17.88 0.1979 4.091 0.3761 0.2870 20 990 3.52 0.9659 2 156 62.3 218.3 0.4268 12 229409 0.4685 3 0.5370 3
2Arunachal Pradesh 83743 66688 79.63 0.8816 9.363 0.8607 0.8712 1 -276 -0.41 -0.3354 36 420.8 90.7 511.5 1.0000 1 0 0.0000 0.3840 6
3 Assam 78438 28327 36.11 0.3998 3.977 0.3656 0.3827 15 222 0.79 0.2166 7 133.1 30.2 163.3 0.3193 16 0 0.0000 0.2296 14
4 Bihar 94163 7306 7.76 0.0859 1.026 0.0943 0.0901 32 7 0.1 0.0068 23 28.5 37.5 66 0.1290 20 35114 0.0717 8 0.0744 28
5 Chhatisgarh 135191 55611 41.14 0.4554 7.808 0.7178 0.5866 4 64 0.12 0.0624 14 323.7 86.3 410 0.8016 5 26037 0.0532 10 0.3759 7
6 Delhi 1483 195.44 13.18 0.1459 0.027 0.0025 0.0742 33 3.03 1.57 0.0030 24 0.5 1.3 1.8 0.0035 32 0.0000 0.0202 35
7 Goa 3702 2237 60.43 0.6690 0.314 0.0289 0.3489 18 8 0.36 0.0078 21 9.5 3.8 13.3 0.0260 30 15 0.0000 0.0957 26
8 Gujarat 196022 14857 7.58 0.0839 2.086 0.1918 0.1378 27 100 0.68 0.0976 10 52 114 166 0.3245 15 177148 0.3618 4 0.2304 13
9 Haryana 44212 1602 3.62 0.0401 0.225 0.0207 0.0304 36 14 0.88 0.0137 19 5.4 15.5 20.9 0.0409 29 17000 0.0347 14 0.0299 32
10 Himachal Pradesh 55673 15434 27.72 0.3069 2.167 0.1992 0.2531 23 334 2.21 0.3259 5 315.6 23.2 338.8 0.6624 9 9200 0.0188 17 0.3150 12
11 J & K UT 53258 21122 39.66 0.4391 2.966 0.2726 0.3558 17 348 1.68 0.3395 4 232.8 146.1 378.9 0.7408 7 11371 0.0232 15 0.3648 8
12 Ladakh UT 169421 2490 1.47 0.0163 0.350 0.0321 0.0242 37 23 0.93 0.0224 18 0 0.0000 0.0000 0.0117 37
13 Jharkhand 79714 23611 29.62 0.3279 3.315 0.3047 0.3163 19 58 0.25 0.0566 15 117.1 64.4 181.5 0.3548 14 22729 0.0464 11 0.1935 17
14 Karnataka 191791 38575 20.11 0.2227 5.416 0.4979 0.3603 16 1025 2.73 1.0000 1 327.7 89.6 417.3 0.8158 3 62108 0.1268 5 0.5757 1
15 Kerala 38863 21144 54.41 0.6023 2.969 0.2729 0.4376 12 823 4.05 0.8029 3 167.1 51.9 219 0.4282 11 19235 0.0393 13 0.4270 4
16 Madhya Pradesh 308245 77482 25.14 0.2783 10.878 1.0000 0.6392 2 68 0.09 0.0663 13 285.6 97.5 383.1 0.7490 6 0.0000 0.3636 9
17 Maharashtra 307713 50778 16.50 0.1827 7.129 0.6554 0.4190 13 96 0.19 0.0937 11 252.6 164.5 417.1 0.8154 4 37393 0.0764 7 0.3511 10
18 Manipur 22327 16847 75.46 0.8353 2.365 0.2174 0.5264 6 -499 -2.88 -0.4868 37 53.2 7.8 61 0.1193 22 6442 0.0132 19 0.0430 30
19 Meghalaya 22429 17119 76.33 0.8450 2.404 0.2210 0.5330 5 -27 -0.16 -0.0263 34 38.7 17.3 56 0.1095 24 2743 0.0056 23 0.1554 18
20 Mizoram 21081 18006 85.41 0.9456 2.528 0.2324 0.5890 3 -180 -0.99 -0.1756 35 19.1 42.8 61.9 0.1210 21 4020 0.0082 22 0.1357 21
21 Nagaland 16579 12486 75.31 0.8337 1.753 0.1612 0.4974 9 -3 0.02 -0.0029 33 36.9 11.4 48.3 0.0944 25 0.0000 0.1472 20
22 Orissa 155707 51619 33.15 0.3670 7.247 0.6662 0.5166 7 274 0.53 0.2673 6 258 81.5 339.5 0.6637 8 382364 0.7809 2 0.5571 2
23 Punjab 50362 1849 3.67 0.0406 0.260 0.0239 0.0323 35 12 0.65 0.0117 20 12.9 20 32.9 0.0643 26 6845 0.0140 18 0.0306 31
24 Rajasthan 342239 16630 4.86 0.0538 2.335 0.2146 0.1342 28 58 0.35 0.0566 15 46.3 81.9 128.2 0.2506 17 4387 0.0090 21 0.1126 25
25 Sikkim 7096 3342 47.10 0.5214 0.469 0.0431 0.2823 21 -2 -0.06 -0.0020 32 26.3 2 28.3 0.0553 27 365 0.0007 25 0.0841 27
26 Tamilnadu 130058 26364 20.27 0.2244 3.702 0.3403 0.2823 21 83 0.32 0.0810 12 127.8 66.3 194.1 0.3795 13 33147 0.0677 9 0.2026 15
27 Telengana 112077 20582 18.36 0.2033 2.890 0.2656 0.2345 25 163 0.8 0.1590 8 60.5 39.7 100.2 0.1959 19 489673 1.0000 1 0.3973 5
28 Tripura 10486 7726 73.68 0.8157 1.085 0.0997 0.4577 11 0 0 0.0000 21.7 6.5 28.2 0.0551 28 4858 0.0099 20 0.1307 22
29 Uttar Pradesh 240928 14806 6.15 0.0680 2.079 0.1911 0.1296 29 127 0.87 0.1239 9 135.8 88.3 224.1 0.4381 10 51513 0.1052 6 0.1992 16
30 Uttarakhand 53483 24303 45.44 0.5031 3.412 0.3137 0.4084 14 8 0.03 0.0078 21 418.3 19.9 438.2 0.8567 2 21397 0.0437 12 0.3291 11
31 West Bengal 88752 16902 19.04 0.2108 2.373 0.2182 0.2145 26 55 0.33 0.0537 17 76.6 38.1 114.7 0.2242 18 10653 0.0218 16 0.1285 23
32Andaman & Nicobar 8249 6743 81.74 0.9049 0.947 0.0870 0.4960 10 1 0.01 0.0010 25 55.9 0.6 56.5 0.1105 23 713 0.0015 24 0.1522 19
33 Chandigarh 114 22.03 19.32 0.2139 0.003 0.0003 0.1071 30 0.47 2.18 0.0005 26 0.3 0.1 0.4 0.0008 33 176 0.0004 26 0.0272 33
34Dadra & Nagar Haveli 491 207 42.16 0.4667 0.029 0.0027 0.2347 24 0 0 0.0000 1.9 0.8 2.7 0.0053 31 200 0.0004 26 0.0601 29
35 Daman & Diu 111 20.49 18.46 0.2044 0.003 0.0003 0.1023 31 0 0 0.0000 0 0.1 0.1 0.0002 35 15 0.0000 0.0256 34
36 Lakshadweep 30 27.1 90.33 1.0000 0.004 0.0003 0.5002 8 0 0 0.0000 0 0.1 0.1 0.0002 35 0 0.0000 0.1251 24
37 Pondicherry 490 52.41 10.70 0.1184 0.007 0.0007 0.0595 34 -1.26 -2.35 -0.0012 31 0.1 0.3 0.4 0.0008 33 63 0.0001 27 0.0148 36
Overall
Table- 5.2 FOREST 2020 FinalForest
Afforestation efforts in HaChange in forest CoverTotal Forest Cover Forest Stock Million cum

GW*Table-5.3WaterQuality2020Surfacewaterquality %Ind.meetingWWStd F.Sc&RKSewageGen&Tret
1 A.Pradesh 1978.2 654 0.3306 16 12.3 0.8770 4.16 288 0.9584 42.56 632 0.5744 0.8033 44.15 0.5585 95.14 0.0486 0.4352 14
2 Aru.Pradesh NA NA NA NA 1.0000 0.3333 0.28 0.9972 80.38 0.1962 0.3817 20
3 Assam 386.6 0.0000 31 2.51 0.9749 5.31 188 0.9469 50.16 315 0.4984 0.8067 11.25 0.8875 90.01 0.0999 0.4485 13
4 Bihar 1117.1 137.5 0.1231 9 1.5 0.9850 55.6 135 0.4440 10.90 211 0.8910 0.7733 45.76 0.5424 97.24 0.0276 0.3666 23
5 Chhattisgarh 391.29 69 0.1763 8 0.67 0.9933 0 132 1.0000 3.00 120 0.9700 0.9878 44.43 0.5557 78.4 0.216 0.4840 8
6 Delhi 3800 2330 0.6132 1 68.4 0.3160 100 38 0.0000 92.00 140 0.0800 0.1320 119.61 -0.1961 84.34 0.1566 0.1764 33
7 Goa 23.68 18.18 0.7677 13 3.7 0.9630 3.7 27 0.9630 7.00 168 0.9300 0.9520 33.50 0.6650 95.82 0.0418 0.6066 2
8 Gujarat 1908.5 782.5 0.4100 23 21.3 0.7870 26.46 257 0.7354 25.00 235 0.7500 0.7575 63.89 0.3611 78.91 0.2109 0.4349 15
9 Haryana 670.21 312 0.4655 2 5.88 0.9412 100 31 0.0000 43.00 53 0.5700 0.5037 136.91 -0.3691 97.22 0.0278 0.1570 35
10 H.Pradesh 28.94 35.63 1.2312 11 2.26 0.9774 7.14 126 0.9286 2.00 255 0.9800 0.9620 86.37 0.1363 97.67 0.0233 0.5882 3
11 J&K 241.79 0 0.0000 5 10 0.9000 0 0 1.0000 57.00 7 0.4300 0.7767 29.47 0.7053 96.09 0.0391 0.3803 21
12 Ladakh 1 0.2500 30
13 Jharkhand 908.68 0 0.0000 13 0 1.0000 0 58 1.0000 0.00 156 1.0000 1.0000 27.73 0.7227 51.66 0.4834 0.5515 5
14 Karnataka 2023.8 55.62 0.0275 19 2.5 0.9750 12.5 272 0.8750 20.00 337 0.8000 0.8833 69.87 0.3013 93.26 0.0674 0.3199 28
15 Kerala 806.49 0 0.0000 45 9.12 0.9088 4.91 285 0.9509 8.00 442 0.9200 0.9266 51.27 0.4873 97.32 0.0268 0.3602 24
16 M.Pradesh 1379.6 195.1 0.1414 30 5.2 0.9480 0 238 1.0000 34.00 327 0.6600 0.8693 54.76 0.4524 96.06 0.0394 0.3756 22
17 Maharashtra 10200 4254.3 0.4171 30 9.04 0.9096 0 567 1.0000 87.00 1447 0.1300 0.6799 54.62 0.4538 84.49 0.1551 0.4265 16
18 Manipur 26.74 0 0.0000 6 0 1.0000 0 10 1.0000 16.00 57 0.8400 0.9467 1.44 0.9856 100 0 0.4831 9
19 Meghalaya 32.09 0 0.0000 5 0 1.0000 0 765 1.0000 40.00 3.74 0.6000 0.8667 2.28 0.9772 93.71 0.0629 0.4767 11
20 Mizoram 5.71 0 0.0000 2 0 1.0000 0 16 1.0000 0.00 16 1.0000 1.0000 3.82 0.9618 80.01 0.1999 0.5404 6
21 Nagaland 14.98 0 0.0000 3 12.5 0.8750 0 0 1.0000 0.00 32 1.0000 0.9583 0.99 0.9901 86.96 0.1304 0.5197 7
22 Orissa 739.15 53 0.0717 21 0.47 0.9953 25.7 214 0.7430 13.00 512 0.8700 0.8694 42.18 0.5782 91.71 0.0829 0.4006 18
23 Punjab 1685.7 453.8 0.2692 4 4.35 0.9565 49.57 115 0.5043 49.00 140 0.5100 0.6569 149.00 -0.4900 76.03 0.2397 0.1690 34
24 Rajasthan 1530.2 54 0.0353 4 1.9 0.9810 0 52 1.0000 13.00 80 0.8700 0.9503 140.00 -0.4000 76.06 0.2394 0.2063 32
25 Sikkim 4 0 1.0000 0 99 1.0000 84.00 168 0.1600 0.7200 0.06 0.9994 50 0.5 0.5549 4
26 TamilNadu 1261.9 362.72 0.2874 5 3.38 0.9662 0.38 265 0.9962 16.00 282 0.8400 0.9341 80.94 0.1906 99.1 0.009 0.3553 25
27 Telangana 65.45 0.3455 87.03 0.1297 0.1188 37
28 Tripura 24 0.0000 2 0 1.0000 0 15 1.0000 61.00 28 0.3900 0.7967 7.88 0.9212 80 0.2 0.4795 10
29 UP 3851.7 1252.7 0.3252 14 19.3 0.8070 59.4 352 0.4060 73.00 579 0.2700 0.4943 70.18 0.2982 91.65 0.0835 0.3003 29
30 Uttarakhand 186.04 24.33 0.1308 2 0 1.0000 70.2 47 0.2980 36.00 99 0.6400 0.6460 56.83 0.4317 83.94 0.1606 0.3423 26
31 WestBengal 2525.6 567.8 0.2248 8 4.5 0.9550 92.3 156 0.0770 41.00 260 0.5900 0.5407 44.60 0.5540 73.16 0.2684 0.3970 19
32 A&N 12 10.42 0.8683 NA NA NA NA 1.0000 0.3333 2.74 0.9726 55.77 0.4423 0.6541 1
33 Chandigarh 429.76 164.79 0.3834 NA NA NA NA 1.0000 0.3333 89.00 0.1100 100 0 0.2067 31
34 D&NH 1 0 1.0000 0 0 1.0000 1.0000 1.0000 31.34 0.6866 86.84 0.1316 0.4546 12
35 D&D NA NA NA NA 100.00 7 0.0000 0.0000 61.40 0.3860 86.84 0.1316 0.1294 36
36 Lakshadweep NA NA NA NA 1.0000 0.3333 65.99 0.3401 1 0.4184 17
37 Pondicherry 64.44 0 0.0000 4 0 1 0 0 1 20 5 0.8 0.9333 74.33 0.2567 87.66 0.1234 0.3284 27
%of17Cat.of
Ind.complingwithWWTStandards sco
re-4
SlNo
State/UT
Score-1
%GW
withdraw
al-
Avail.
Score
TotalColiform
Score
BOD
Score-2
Rivers
Monitored
DO
Score-3
FinalAvg.
Score
Rank
%
Violation
Score
Violation
(%)
Count
Violation
(%)
Count
SewageGen.
(MLD)
Treatment
Capacity

Gen Collect. Treat. Score-1 Gen. T.dispd Score-2 Quan. Treat. Score-3 Quan(ton) T & recy*Score-4 Score Rank1 A. Pradesh 6440 6331 500 0.0776 595749 29080.8 0.0488 10662 10662 1.0000 12780.30 0.0809 0.3018 182 Aru. Pradesh 13 11 0 0.0000 0 645.4 645.4 1.0000 131.70 0.0008 0.2502 253 Assam 650 350 0 0.0000 49043 0 0.0000 8565 6581.3 0.7684 2176.70 0.0138 0.1955 304 Bihar 1670 0 0 0.0000 3106 0 0.0000 33799 7439.4 0.2201 3055.60 0.0193 0.0599 335 Chhattisgarh 1896 1704 168 0.0886 103861 10029.3 0.0966 1104.5 1136.3 1.0288 2149.90 1650 0.0136 0.3069 176 Delhi 8370 8300 3240 0.3871 5528 0 0.0000 24667 24667 1.0000 9729.20 0.0616 0.3622 87 Goa 450 400 182 0.4044 26031 19011.2 0.7303 874 874 1.0000 427.40 0.0027 0.5344 18 Gujarat 10480 10480 2565 0.2448 4350000 124876 0.0287 29070 29070 1.0000 8994.30 37262 0.0569 0.3326 139 Haryana 3103 3103 188 0.0606 70957 244 0.0034 11663 11663 1.0000 4506.90 49981 0.0285 0.2731 1910 Him. Pradesh 276 207 125 0.4529 24455 0 0.0000 30188 3027.6 0.1003 1595.10 0.0101 0.1408 3111 J & K 1792 1322 320 0.1786 4496 0 0.0000 4618.6 4172.7 0.9035 1521.50 0.0096 0.2729 2012 Ladakh 0.0000 0.0000 3613 Jharkhand 3570 3570 65 0.0182 252467 152 0.0006 12498 1098 0.0879 2021.60 0.0128 0.0299 3414 Karnataka 8697 7288 3000 0.3449 315453 2573.75 0.0082 67339 67339 1.0000 9118.70 44621 0.0577 0.3527 1015 Kerala 1339 655 390 0.2913 115394 18750 0.1625 40990 38869 0.9483 6171.80 0.0391 0.3603 916 M. Pradesh 6678 4351 0 0.0000 251234 9516 0.0379 14824 13569 0.9153 7800.60 8985 0.0494 0.2506 2317 Maharashtra 21867 21867 6993 0.3198 499133 449.7 0.0009 61918 6118 0.0988 20270.60 47810 0.1283 0.1370 3218 Manipur 176 125 0 0.0000 0 529.14 529.14 1.0000 231.70 0.0015 0.2504 2419 Meghalaya 208 175 55 0.2644 459 0.0000 1061.7 1062 0.9999 211.60 0.0013 0.3164 1520 Mizoram 552 276 0 0.0000 0 747.63 748 1.0000 79.60 0.0005 0.2501 2721 Nagaland 344 193 0 0.0000 10 0.0000 626.5 626.5 1.0000 145.10 0.0009 0.2502 2522 Orissa 2575 2284 30 0.0117 646112 2027 0.0031 14197 13171 0.9277 2937.80 3000 0.0186 0.2403 2823 Punjab 4456 4435 3.72 0.0008 113367 0 0.0000 15203 15203 1.0000 6958.50 150 0.0440 0.2612 2124 Rajasthan 5037 2491 490 0.0973 762027 532714 0.6991 22503 16167 0.7185 6326.90 68670 0.0400 0.3887 525 Sikkim 49 49 0.3 0.0061 1051 0 0.0000 235.21 197.76 0.8408 78.10 0.0005 0.2118 2926 Tamil Nadu 14500 14234 1607 0.1108 576733 114774 0.1990 46819 46819 1.0000 13486.20 52427 0.0854 0.3488 1127 Telangana 6628 6225 3175 0.4790 249996 0 0.0000 15719 15719 1.0000 11800.00 11800 0.0747 0.3884 628 Tripura 415 368 250.4 0.6034 273 0 0.0000 1607 1582.9 0.9850 378.30 0.0024 0.3977 429 Uttar Pradesh 19180 19180 5197 0.2710 241867 3169.35 0.0131 43554 43554 1.0000 10381.10 86130 0.0657 0.3374 1230 Uttarakand 918 918 0 0.0000 20907 116.55 0.0056 2946 3837 1.3024 1641.10 28000 0.0104 0.3296 1431 West Bengal 9500 8075 851 0.0896 126573 49004 0.3872 29774 29895 1.0041 10059.40 600 0.0637 0.3861 732 A& N 70 70 5 0.0714 0 187 221 1.1818 92.20 0.0006 0.3135 1633 Chandigarh 370 360 250 0.6757 2116 0 0.0000 2503 2503 1.0000 359.70 0.0023 0.4195 334 D & NH 85 85 0 0.0000 4056.371 3448.47 0.8501 322 322 1.0000 29.40 0.0002 0.4626 235 Daman & Diu 40.80 0.0003 0.0001 3536 Lakshadweep 21 0 0 0.0000 0 0 423 0 0.0000 7.40 0.0000 0.0000 3637 Puducherry 495 485 0 26425 52 0.0020 5400 5400 1.0000 284.20 0.0018 0.2509 22
MSW TPD 2017-18 Hazardous waste Mg.MTA Bio-Medical Waste-KGD 2019Table-5.4 Waste Management* * Niti.gov.in 2020
Final Score RankStateS.No.
Electronic waste

corr
1 A.Pradesh Yes 1 39.74 0.3974 42.77 0.4277 33.99 0.3399 6 0.9932 0.6316 0.4855 9 70 22 Aru.Pradesh Yes 1 75.12 0.7512 38.81 0.3881 2.22 0.0222 362 0.5877 0.5498 0.4227 16 31 263 Assam Yes 1 30.79 0.3079 20.98 0.2098 7.74 0.0774 49 0.9442 0.5079 0.3904 19 47 144 Bihar No 0 8.67 0.0867 19.00 0.19 33.1 0.331 49 0.9442 0.3104 0.2386 35 43 185 Chhattisgarh No 0 5.45 0.0545 41.89 0.4189 30.53 0.3053 1.0000 0.3557 0.2735 31 29 276 Delhi Yes 1 12.89 0.1289 59.52 0.5952 14.7 0.147 1.0000 0.5742 0.4414 14 30 87 Goa No 0 0.84 0.0084 42.29 0.4229 98.96 0.9896 1.0000 0.4842 0.3722 22 41 198 Gujarat Yes 1 31.69 0.3169 66.10 0.661 25.23 0.2523 36 0.9590 0.6378 0.4903 7 63 59 Haryana No 0 21.88 0.2188 57.18 0.5718 9.8 0.098 1.0000 0.3777 0.2904 30 34 2510 H.Pradesh No 0 94.02 0.9402 120.58 1.2058 0.75 0.0075 105 0.8804 0.6068 0.4664 11 61 6
11 J&K No 0 73.41 0.7341 65.47 0.6547 0.76 0.0076 6 0.9932 0.4779 0.3674 24 59 312 Ladakh 0.0000 0 0 1.0000 0.2000 0.1537 37
13 Jharkhand No 0 13.19 0.1319 40.82 0.4082 16.09 0.1609 0 1.0000 0.3402 0.2615 33 27 2814 Karnataka Yes 1 62.92 0.6292 37.16 0.3716 36.06 0.3606 1 0.9989 0.6721 0.5166 4 71 115 Kerala Yes 1 44.79 0.4479 44.47 0.4447 6.19 0.0619 36 0.9590 0.5827 0.4479 12 56 1016 M.Pradesh Yes 1 33.65 0.3365 22.67 0.2267 26.18 0.2618 0 1.0000 0.5650 0.4343 15 47 1417 Maharashtra Yes 1 29.04 0.2904 18.55 0.1855 13.08 0.1308 11 0.9875 0.5188 0.3988 17 50 1218 Manipur Yes 1 40.41 0.4041 11.80 0.118 3.92 0.0392 0 1.0000 0.5123 0.3938 18 37 2119 Meghalaya Yes 1 73.95 0.7395 15.70 0.157 0.03 0.0003 0 1.0000 0.5794 0.4454 13 36 2420 Mizoram Yes 1 65.51 0.6551 59.05 0.5905 1.5 0.015 0 1.0000 0.6521 0.5013 6 45 1621 Nagaland No 0 52.34 0.5234 47.11 0.4711 1.12 0.0112 91 0.8964 0.3804 0.2924 29 51 1122 Orissa Yes 1 30.12 0.3012 124.84 1.2484 14.87 0.1487 2 0.9977 0.7392 0.5682 3 69 323 Punjab No 0 38.87 0.3887 4.95 0.0495 18.01 0.1801 1 0.9989 0.3234 0.2486 34 57 924 Rajasthan Yes 1 44.93 0.4493 22.62 0.2262 39.92 0.3992 0 1.0000 0.6149 0.4727 10 60 725 Sikkim Yes 1 90.64 0.9064 25.87 0.2587 0.01 0.0001 0 1.0000 0.6330 0.4866 8 38 2026 TamilNadu No 0 49.05 0.4905 5.97 0.0597 19.82 0.1982 0 1.0000 0.3497 0.2688 32 45 1627 Telangana 40.98 0.4098 6.34 0.0634 55.73 0.5573 0 1.0000 0.4061 0.3122 28 66 428 Tripura(H) Yes 1 12.41 0.1241 27.62 0.2762 10.02 0.1002 44 0.9499 0.4901 0.3767 21 37 2129 UP No 0 25.25 0.2525 11.97 0.1197 15.95 0.1595 5 0.9943 0.3052 0.2346 36 48 1330 Uttarakand Yes 1 70.98 0.7098 51.45 0.5145 12.72 0.1272 53 0.9396 0.6582 0.5060 5 59 831 WestBengal Yes 1 17.74 0.1774 10.13 0.1013 5.08 0.0508 21 0.9761 0.4611 0.3545 26 37 21
32 A&Nicobar Yes 1 30.34 0.3034 71.56 0.7156 69.9 0.699 0 1.0000 0.7436 0.5716 2 72 233 Chandigarh No 0 68.5 0.6850 28.75 0.2875 26.67 0.2667 0 1.0000 0.4478 0.3443 27 54 434 D&NH No 0 1.92 0.0192 37.30 0.373 100 1 0 1.0000 0.4784 0.3678 23 41 635 Dam&Diu No 0 7.49 0.0749 40.11 0.4011 100 1 0 1.0000 0.4952 0.3807 20 46 536 Lakshadweep Yes 1 100 1.0000 250.45 2.5045 100 1 1.0000 1.3009 1.0000 1 100 137 Pondicherry No 0 0.86 0.0086 34.31 0.3431 100 1 0 1.0000 0.4703 0.3615 25 39 7
Rank
NitiFinal
Avg.Sc2-5
NitiRank
1-5finalSc
Table- 5.5 Climate Change
Co2saved
LEDbulbs
per1000
Pop
score-3
Instal.Grid
connect
Solarpow
er
% Score-4
Liveslost
perCr
Score-5
S.No State/UT
SAPCC
Score-1
%REGen.
Capacity
Score-2

Population Change Sc-1 Rank Rec 2019 Sc-2 Rank Area 2018Changescore Sc-3 Rank Area Score sc-4Final Avg. Scr Rank
1 AndhraPradesh 48.19 15.79 0.0994 3 72358 0.0598 6 6298.25 0.6067 0.3683 15 1.37 0.0045 0.0591 0.1466 11
2 ArunachalPradesh 1.26 0.0026 24 68022 0.0562 7 9778.57 0.9420 0.5719 4 12.62 0.0413 0.0959 0.1816 6
3 Assam 13.83 0.0285 13 67857 0.0560 8 3817.93 0.3678 0.2233 16 25.23 0.0826 0.1372 0.1113 18
4 Bihar 27.16 10.67 0.0560 7 3992 0.0033 25 3237.32 0.3119 0.1893 18 5.35 0.0175 0.0721 0.0802 19
5 Chhatisgarh 13.49 0.0278 14 64398 0.0532 10 6659.37 0.6415 0.3895 12 1.6 0.0052 0.0598 0.1326 13
6 Delhi 0.37 0.0008 26 18 0.0000 33 27.82 0.0027 0.0016 32 22.25 0.0729 0.1275 0.0325 27
7 Goa 0.21 0.0004 29 1025 0.0008 30 754.91 0.0727 0.0442 24 3.49 0.0114 0.0660 0.0279 29
8 Gujarat 21.65 -0.95 0.0446 11 1210675 1.0000 1 17098.54 1.6472 1.0000 1 1.83 0.0060 0.0606 0.5263 1
9 Haryana 8.88 0.0183 16 1885 0.0016 29 281.46 0.0271 0.0165 28 7.75 0.0254 0.0800 0.0291 28
10 HimachalPradesh 5.12 0.0106 18 8221 0.0068 24 8387.48 0.8080 0.4905 8 0 0.0000 0.0546 0.1406 12
11 J&K 9.9 0.0204 15 36262 0.0300 16 14168 1.3649 0.8286 2 5.71 0.0187 0.0733 0.2381 212 Ladakh 0.0000 35 0.0000 33 0.0000 0.0000 36 0.0000 0.0546 0.0137 3513 Jharkhand 15.83 0.0326 12 16528 0.0137 20 1882.15 0.1813 0.1101 21 1.8 0.0059 0.0605 0.0542 23
14 Karnataka 25.62 4.7 0.0528 8 53119 0.0439 13 9570.57 0.9220 0.5597 5 0.14 0.0005 0.0551 0.1779 8
15 Kerala 3.48 0.0072 20 23157 0.0191 18 2486.4 0.2395 0.1454 19 2.45 0.0080 0.0626 0.0586 21
16 MadhyaPradesh 35.62 11.81 0.0734 6 162573 0.1343 3 10815.68 1.0419 0.6325 3 0.86 0.0028 0.0574 0.2244 3
17 Maharashtra 36.76 1.61 0.0758 5 116837 0.0965 4 8878.04 0.8553 0.5192 7 3.58 0.0117 0.0663 0.1895 5
18 Manipur 0.97 0.0020 25 12424 0.0103 21 224.81 0.0217 0.0131 29 1.49 0.0049 0.0595 0.0212 31
19 Meghalaya 1.55 0.0032 21 21470 0.0177 19 361.58 0.0348 0.0211 26 3.35 0.0110 0.0656 0.0269 30
20 Mizoram 0.28 0.0006 28 12456 0.0103 21 1245.75 0.1200 0.0729 23 95.52 0.3128 0.3674 0.1128 17
21 Nagaland 1.35 0.0028 23 11522 0.0095 23 222.36 0.0214 0.0130 30 22.48 0.0736 0.1282 0.0384 26
22 Orissa 23.39 0.0482 10 64627 0.0534 9 8085.35 0.7789 0.4729 9 -0.33 -0.0011 0.0535 0.1570 9
23 Punjab 8.61 0.0178 17 3068 0.0025 27 326.6 0.0315 0.0191 27 55.35 0.1812 0.2358 0.0688 20
24 Rajasthan 49.14 -1.6 0.1013 2 56341 0.0465 11 9539.45 0.9190 0.5579 6 -0.46 -0.0015 0.0531 0.1897 4
25 Sikkim 0.34 0.0007 27 2609 0.0022 28 2183.1 0.2103 0.1277 20 0.34 0.0011 0.0557 0.0466 25
26 Tamilnadu 0.0000 35 45219 0.0374 14 6464.97 0.6228 0.3781 13 1.8 0.0059 0.0605 0.1190 16
27 Telangana 24.94 22.21 0.0514 9 28239 0.0233 17 6708.38 0.6462 0.3923 11 -1.63 -0.0053 0.0493 0.1291 15
28 Tripura 1.46 0.0030 22 3879 0.0032 26 603.64 0.0582 0.0353 25 33.55 0.1099 0.1645 0.0515 24
29 UttarPradesh 58.53 -1.35 0.1207 1 42224 0.0349 15 6318.36 0.6087 0.3695 14 -16.69 -0.0546 0.0000 0.1313 14
30 Uttarakand 4.94 0.0102 19 54129 0.0447 12 7605.14 0.7326 0.4448 10 11.53 0.0378 0.0924 0.1480 10
31 WestBengal 41.62 23.32 0.0858 4 438476 0.3622 2 3423.77 0.3298 0.2002 17 3.08 0.0101 0.0647 0.1782 7
32 Andaman&Nicobar 0.19 0.0004 29 89022 0.0735 5 1543.33 0.1487 0.0903 22 0 0.0000 0.0546 0.0547 22
33 Chandigarh 0.031 0.0001 33 60 0.0000 33 26.01 0.0025 0.0015 33 0 0.0000 0.0546 0.0141 33
34 Dadra&NagarHaveli 0.078 0.0002 32 322 0.0003 31 92.16 0.0089 0.0054 31 0 0.0000 0.0546 0.0151 32
35 Daman&Diu 0.01 0.0000 35 0.0000 33 2.19 0.0002 0.0001 35 0 0.0000 0.0546 0.0137 35
36 Lakshadweep 0.052 0.0001 33 0.0000 33 0.01 0.0000 0.0000 36 0 0.0000 0.0546 0.0137 35
37 Pondicherry 0.13 0.0003 31 127 0.0001 32 3.9 0.0004 0.0002 34 0 0.0000 0.0546 0.0138 34
% desertification
S.No States
Table-5.6 Bio-diversity criteriaLivestock Wetland in Ha Protected Areas Final BD

1 A.Pradesh 275069 9047 0.0329 13 5 0.3846 0.6154 1584949 0.1565 34.37 0.1150 0.2299 212 Aru.Pradesh 83743 423 0.0051 14 0 0.0000 1.0000 613 0.0001 37.29* 0.1248 0.2825 23 Assam 78438 3364 0.0429 23 2 0.0870 0.9130 1221 0.0001 19.41* 0.0650 0.2553 174 Bihar 94163 6579 0.0699 37 21 0.5676 0.4324 114576 0.0113 22.23 0.0744 0.1470 335 Chhattisgarh 135191 5538 0.0410 16 7 0.4375 0.5625 297343 0.0294 22.16 0.0742 0.1767 296 Delhi 1483 53 0.0357 0 1.0000 0.0000 0.47 0.0016 0.2593 157 Goa 3702 197 0.0532 1 0 0 1.0000 2315 0.0002 7.09* 0.0237 0.2693 98 Gujarat 196022 12661 0.0646 25 14 0.5600 0.4400 1281136 0.1265 16.40* 0.0549 0.1715 309 Haryana 44212 3656 0.0827 19 9 0.4737 0.5263 594911 0.0587 19.27* 0.0645 0.1831 2610 H.Pradesh 55673 812 0.0146 12 4 0.3333 0.6667 9290 0.0009 14.62 0.0489 0.1828 2711 J&K 53258 1075 0.0202 12 1 0.0833 0.9167 80 0.0000 19.36* 0.0648 0.2504 1912 Ladakh 169421 0.0000 2 0 1.0000 0.0000 0.0000 0.2500 2013 Jharkhand 79714 4343 0.0545 18 9 0.5 0.5000 32412 0.0032 18.94 0.0634 0.1553 3214 Karnataka 191791 12827 0.0669 27 14 0.5185 0.4815 1286640 0.1270 10.82 0.0362 0.1779 2815 Kerala 38863 2266 0.0583 14 0 0.0000 1.0000 3128 0.0003 12.46* 0.0417 0.2751 516 M.Pradesh 308245 17252 0.0560 45 30 0.6667 0.3333 521425 0.0515 40.40* 0.1352 0.1440 3417 Maharashtra 307713 21099 0.0686 33 17 0.5152 0.4848 1545369 0.1526 10.37 0.0347 0.1852 2518 Manipur 22327 390 0.0175 9 0 0 1.0000 318 0.0000 19.63* 0.0657 0.2708 819 Meghalaya 22429 1056 0.0471 7 0 0 1.0000 615 0.0001 19.86 0.0665 0.2784 420 Mizoram 21081 367 0.0174 8 0 0 1.0000 4428 0.0004 29.99* 0.1004 0.2796 321 Nagaland 16579 694 0.0419 8 0 0 1.0000 5449 0.0005 30.90* 0.1034 0.2865 122 Orissa 155707 6784 0.0436 30 1 0.0333 0.9667 112649 0.0111 19.98 0.0669 0.2721 623 Punjab 50362 4285 0.0851 17 5 0.2941 0.7059 48281 0.0048 29.18* 0.0977 0.2233 2224 Rajasthan 342239 25511 0.0745 32 31 0.9688 0.0313 1836750 0.1813 24.76 0.0829 0.0925 3625 Sikkim 7096 97 0.0137 4 0 0 1.0000 9086 0.0009 10.33 0.0346 0.2623 1226 TamilNadu 130058 8112 0.0624 29 11 0.3793 0.6207 503206 0.0497 12.58 0.0421 0.1937 2327 Telangana 112077 6877 0.0614 10 5 0.5000 0.5000 221910 0.0219 14.28 0.0478 0.1578 3128 Tripura(H) 10486 272 0.0259 4 0 0.0000 1.0000 2095 0.0002 0.0000 0.2565 1629 UP 240928 18939 0.0786 70 30 0.4286 0.5714 99027 0.0098 25.7 0.0860 0.1865 2430 Uttarakand 53483 1549 0.0290 13 7 0.5385 0.4615 7863 0.0008 9.41 0.0315 0.1307 3531 WestBengal 88752 5655 0.0637 17 1 0.0588 0.9412 53317 0.0053 23.42 0.0784 0.2721 6
32 A&Nicobar 8249 28 0.0034 1 1.0000 0.0000 12.6* 0.0422 0.2614 1433 Chandigarh 114 1 0.0088 1.0000 0.0000 0.54* 0.0018 0.2526 1834 D&NH 491 24 0.0489 1 0 0 1.0000 0.0000 0.0000 0.2622 1335 Dam&Diu 112 3 0.0268 1 1 1 0.0000 0.0000 0.0000 0.0067 3736 Lakshadweep 32 2 0.0625 1.0000 0.0000 0.0000 0.2656 1137 Pondicherry 480 29 0.0604 1 0 0 1.0000 0.0000 4.5 0.0151 0.2689 10
FinalRank
Table-5.7 Agriculture
SlNo State/UTG.AreaSqKm
AgriLand,000Ha Sc-1
AgriDist.
AgriVul.Dis.VH&H sc-2 Rev.Sc
Ha.inMicroirrg Sc-3
%shareintotalGSVA17-18 Sc-4
FinalScore

Table5.8 Fisheries 2020
1 A.Pradesh 3449558 2352263 1097295 0.5643 1 20 1874.8 0.0909 5 2162.88 7.1651 0.1907 3 432 2662 5.1 0.233 6 0.2697 3
2 Aru.Pradesh 4250 4050 200 0.0001 30 0.0000 222.9 0.7384 0.0197 24 0 0.0049 28
3 Assam 327263 294200 33063 0.0170 11 0.0000 799.66 2.6491 0.0705 8 0 0.0219 14
4 Bihar 587850 506887 80963 0.0416 6 0.0000 2.25 0.0075 0.0002 33 0 0.0105 23
5 Chhattisgarh 457167.2 342299 114868.2 0.0591 4 0.0000 1091.92 3.6172 0.0963 5 0 0.0388 10
6 Delhi 801 710 91 0.0000 31 0.0000 136.29 0.4515 0.0120 29 0 0.0030 32
7 Goa 124607 11111 113496 0.0584 5 4 100.78 0.0049 10 265.24 0.8787 0.0234 19 1729 920 1.8 0.082 9 0.0422 9
8 Gujarat 819068 809540 9528 0.0049 17 17 3849.1 0.1867 3 1527.43 5.0600 0.1347 4 6639 11536 21.9 1 1 0.3316 2
9 Haryana 190000.9 121000 69000.9 0.0355 9 0.0000 779.36 2.5818 0.0687 9 0 0.0260 12
10 H.Pradesh 12765.36 11799 966.36 0.0005 23 0.0000 572.26 1.8957 0.0505 13 0 0.0127 20
11 J&K 20700 20080 620 0.0003 27 0.0000 404.69 1.3406 0.0357 17 0 0.0090 25
12 Ladakh 0 0.0000 31 0.0000 0.0000 0.0000 0 0.0000 35
13 Jharkhand 190000 115995 74005 0.0381 7 0.0000 75 0.2485 0.0066 31 0 0.0112 22
14 Karnataka 602522.2 580570 21952.2 0.0113 14 10 206.9 0.0100 9 3324.31 11.0126 0.2931 2 6397 6442 12.2 0.557 4 0.2179 5
15 Kerala 562621 727570 -164949 -0.0848 37 19 802.9 0.0389 8 812.34 2.6911 0.0716 7 9699 10827 20.6 0.941 2 0.2416 4
16 M.Pradesh 143419.7 115017 28402.7 0.0146 12 0.0000 672.02 2.2262 0.0592 11 0 0.0185 17
17 Maharashtra 606012 579685 26327 0.0135 13 16 1680.8 0.0815 6 226.81 0.7514 0.0200 22 6807 5771 11 0.502 11 0.1543 6
18 Manipur 33000 32035 965 0.0005 23 0.0000 456.15 1.5111 0.0402 16 0 0.0102 24
19 Meghalaya 11961 11343 618 0.0003 27 0.0000 139.6 0.4625 0.0123 28 0 0.0032 31
20 Mizoram 7643.35 6828 815.35 0.0004 25 0.0000 261.39 0.8659 0.0230 20 0 0.0059 27
21 Nagaland 8990.5 8220 770.5 0.0004 25 0.0000 219.4 0.7268 0.0193 25 0 0.0049 28
22 Orissa 684962 521279 163683 0.0842 2 17 4163.5 0.2020 2 1077.68 3.5701 0.0950 6 9931 1255 2.4 0.11 7 0.1227 8
23 Punjab 136638.5 120088 16550.5 0.0085 15 0.0000 465.36 1.5416 0.0410 15 0 0.0124 21
24 Rajasthan 54035.34 42461 11574.34 0.0060 16 0.0000 83.28 0.2759 0.0073 30 0 0.0033 30
25 Sikkim 380 402 -22 0.0000 31 0.0000 0 0.0000 0.0000 0 0.0000 35
26 TamilNadu 712036.9 709163.1 2873.79 0.0015 20 16 2058.6 0.0999 4 11342.8 37.5757 1.0000 1 1245 8576 16.3 0.744 3 0.4614 1
27 Telangana 270037 236752 33285 0.0171 10 0.0000 479.78 1.5894 0.0423 14 0 0.0149 19
28 Tripura(H) 76800 69055 7745 0.0040 18 0.0000 341.92 1.1327 0.0301 18 0 0.0085 26
29 UP 628749.1 504808 123941.1 0.0637 3 0.0000 238.14 0.7889 0.0210 21 0 0.0212 15
30 Uttarakand 4578.53 4138 440.53 0.0002 29 0.0000 746.16 2.4718 0.0658 10 0 0.0165 18
31 WestBengal 1742092 1671420 70672 0.0363 8 8 4214.6 0.2044 1 649.32 2.1510 0.0572 12 2679 2759 5.2 0.237 5 0.1339 7
32 A&Nicobar 39504 37325 2179 0.0011 21 106 1565.6 0.0759 7 179.89 0.5959 0.0159 26 0 0.0232 13
33 Chandigarh 136 128 8 0.0000 31 0.0000 0.0000 0.0000 0 0.0000 35
34 D&NH 0 0 0 0.0000 31 1 92.16 0.0045 11 0.0000 0.0000 0 0.0011 34
35 Dam&Diu 24680.07 23031 1649.07 0.0008 22 1 2.18 0.0001 13 226.69 0.7510 0.0200 22 5783 1156 2.2 0.1 8 0.0303 11
36 Lakshadweep 20774 15938.46 4835.54 0.0025 19 1 0.01 0.0000 53.57 0.1775 0.0047 32 0 0.0018 33
37 Pondicherry 49922.71 53807.9 -3885.19 -0.0020 36 1 4 0.0002 12 150 0.4969 0.0132 27 1089 733 1.4 0.064 10 0.0188 16
Shar
e % of
landin
g
Sl No Sta
te/U
T
Fish S
t. 17
-18
Fish S
t. 15
-16
Cng i
n Fis
h
Stoc
k Ton
Score-
4
scor
e-1
Rank No.o
f
Mr.P
rotec
t+
bio S
ites
Score-
3Ran
kFin
al Sc
.
F. Ran
k
Area
Score-
2Ran
kFu
nd 17
-18
Lak
% of
T.fu
nds
RankVa
l(Cr)
mar
ine f
ish
land.
17 +
18

Niti Score & RankTable-5.9 Disaster Management
1 A. Pradesh yes 13 13 1 Yes 1 1017.4 0.9130 1877 1788 0.5020 0.8538 33 64 67 32 Aru. Pradesh yes 25 25 1 Yes 1 159.49 0.9864 733 513 0.8571 0.9609 21 51 53 263 Assam yes 33 33 1 Yes 1 239.4 0.9795 1887 1827 0.4913 0.8677 32 49 55 234 Bihar yes 38 38 1 Yes 1 0 1.0000 272 296.5 0.9174 0.9794 15 48 50 285 Chhattisgarh yes 26 26 1 Yes 1 224.48 0.9808 4373 3591 0.0000 0.7452 35 58 56 216 Delhi yes 11 11 1 Yes 1 1.0000 5 3.5 0.9990 0.9998 6 62 61 57 Goa yes 2 2 1 Yes 1 1.8 0.9998 32 21 0.9942 0.9985 9 64 65 78 Gujarat yes 33 33 1 Yes 1 449.95 0.9615 574 418 0.8836 0.9613 20 64 64 99 Haryana yes 22 22 1 Yes 1 160.2 0.9863 185 114 0.9682 0.9886 11 55 57 18
10 H. Pradesh yes 12 12 1 Yes 1 329.83 0.9718 170 184.5 0.9486 0.9801 14 69 69 211 J&K yes 20 20 1 Yes 1 252.9 0.9784 113 165 0.9540 0.9831 12 53 59 812 Ladakh yes 2 2 1 Yes 1 1.0000 0 1.0000 1.0000 113 Jharkhand yes 24 24 1 Yes 1 189.45 0.9838 1133 936.5 0.7392 0.9307 24 50 53 2614 Karnataka yes 30 30 1 Yes 1 669.22 0.9428 1333 1082 0.6986 0.9104 29 64 66 615 Kerala yes 14 14 1 Yes 1 3097.5 0.7352 456 310.5 0.9135 0.9122 28 69 70 116 M. Pradesh yes 52 52 1 Yes 1 457.2 0.9609 4781 3728 -0.0383 0.7307 37 52 58 1517 Maharashtra yes 36 36 1 Yes 1 772.65 0.9340 3487 2681 0.2534 0.7969 34 64 64 918 Manipur yes 16 16 1 Yes 1 9.9 0.9992 1094 1100 0.6938 0.9232 26 59 60 1319 Meghalaya yes 11 11 1 Yes 1 12.6 0.9989 1454 1210 0.6630 0.9155 27 52 54 2520 Mizoram yes 8 8 1 Yes 1 9 0.9992 1587 1453 0.5955 0.8987 30 59 56 2121 Nagaland yes 11 11 1 Yes 1 205.89 0.9824 930 804 0.7761 0.9396 22 51 57 1822 Orissa yes 30 30 1 Yes 1 778.5 0.9335 4416 3590 0.0003 0.7334 36 51 58 1523 Punjab yes 22 22 1 Yes 1 321.99 0.9725 320 182.5 0.9492 0.9804 13 60 62 1224 Rajasthan yes 33 33 1 Yes 1 574.65 0.9509 260 163 0.9546 0.9764 17 59 57 1825 Sikkim yes 4 4 1 Yes 1 54.93 0.9953 8 4 0.9989 0.9985 9 58 65 726 Tamil Nadu yes 37 37 1 Yes 1 707.4 0.9395 301 207 0.9423 0.9705 19 66 67 327 Telangana yes 31 31 1 Yes 1 226.5 0.9806 1748 1451 0.5959 0.8941 31 61 67 328 Tripura (H) yes 8 8 1 Yes 1 16.2 0.9986 431 388.5 0.8918 0.9726 18 55 58 1529 UP yes 75 75 1 Yes 1 351.45 0.9700 1170 930.5 0.7408 0.9277 25 42 55 2330 Uttarakand yes 13 13 1 Yes 1 139.35 0.9881 376 938.5 0.7386 0.9317 23 60 64 931 West Bengal yes 23 23 1 Yes 1 269.1 0.9770 364 253 0.9295 0.9766 16 56 60 1332 A & Nicobar 3 3 1 Yes 1 1.0000 8 16 0.9955 0.9989 8 58 61 533 Chandigarh 1 1 1 Yes 1 1.0000 1 0.5 0.9999 1.0000 1 68 70 134 D&NH 1 1 1 Yes 1 1.0000 0 0 1.0000 1.0000 1 57 63 335 Dam & Diu 2 2 1 Yes 1 1.0000 0 0 1.0000 1.0000 1 63 61 536 Lakshadweep 1 1 1 Yes 1 1.0000 0 0 1.0000 1.0000 1 62 63 337 Pondicherry 4 4 1 Yes 1 1.0000 9 4.5 0.9987 0.9997 7 65 66 2
Forest fire incd
,2017
Avg. Forest
fire inciden
ce Score-3
Final S
core
Rank
sc-1
SDMA
Sc-2 Bdg
t Cr
Sc-4 Sc
18/60
Sc 19
/70
F.RK
Sl No Stat
e/U
TS.
Plan
Dists
D. Plan

Table-7: -Weightage of Criteria and Indicators and related SDG targets and Indicators.
S.No SDG & Targets
Category Criteria SLA
Total Wtg
Indicators SDG Indicator
Indicator Wtg
1 3,3.9,7,9,9.4 & 11, 11.1 & 11.6 12,12.2,12.4 &12.5
Air Pollution Airpol 100% 1.SOx Adherence to NAAQS 2.NOx 3.PM2.5 4.PM10
3.9, 9.4, 11., 11.6 12.4, 12.5
25% 25% 25% 25%
2 15,15.1,15.2,15. B 1,2,3,13
Forests Forest 100% 1.TFC as %of State GA & Contribution to NFC 2.Change in Forest cover 3.Growing Stock 4. Afforestation efforts
12.2, 15.1,15.2, 15. B
25% 25% 25% 25%
3 3, 3.3,3.9 6,6.1,6.26.3,6.5, 6. A
Water Quality
Watqua 100% 1.% Sewage Waste water treated 2.Surface water quality (DO, BOD& TFC) 3.Ground Water extraction % 4. % of 17 Categories of Industries complying with WWT Standards
3.3,3.9,6.1,6.26.3, 6.5 ,6. A
25% 25% 25% 25%
4 12. Waste Management
Wastmg 100% 1.MSW generated, collected and treated. 2.Haz. waste generated and treated 3.Biomedical waste generated and treated 4.Electronic waste generated, treated and recycled.
12.4 12.4.1 12.4.2 12.5
25% 25% 25% 25%
5 2,3,7,7.2,9,11,12, 12.2, 12.5, 1 & 1.5,11 & 11.5,13 , & 13.1, 14,15
Climate and Energy
Clieng 100% 1.Status of SAPCC 2.%RE Gen. Capacity 3. Co2 saved from LED bulbs per 1000 Pop. 4.Instal. Grid connect Solar power % 5.Lives lost per crore population.
7.2, 12.2,12.5 (1.5.1),11.5.1 &13.1.1
20% 20% 20% 20% 20%
6 14, 14.5 13,15.1,15.2, 15.5 16.4,
Biodiversity Biodty 100% 1.Indigenous livestock population change 2. Wetland Area state wise 3. Protected area state wise 4. % desertification
14.5 15.1,15.2, 15.5
25% 25% 25% 25%
7 2, 2.3,2.4, 2.5, 2.A & 2. B
Agriculture Agrcul 100% 1.Land under Agriculture state wise 2.Agri districts and VH and H vulnerable districts. 3. Ha. under Micro irrigation 4. % share in total Gross State Valuation of Agriculture 17-18
2.3,2.4, 2.5, 2.A & 2.B, 2.4.1
25% 25% 25% 25%
8 1,2,8,12, 14,14.4, 14.6, 14.7 & 14.8
Fisheries Fishre 100% 1.Change in Fish Stock in Tonnes 2. No. and Area of Marine, Protected and biodiversity Sites. 3. Funds released 2017-18 & % of funds received by states. 4. Valuation (in Cr) of marine fish landing of 2017 & 2018 and share of landing state wise.
14.4,14.5, 14.6, 14.7
25% 25% 25% 25%
9 1 &1.5 11, 11.5 & 11. b
Disaster Management
Disamg 100% 1.Status of State DM Plan 2.Institutional setup state (SDMA) and District (DDMA) 3. Budget in Crores 18-19(Dec) 4. No. (2017) and average (2017 ,2016) Forest fire incidence,
1.5.2, 1.5.3 11.5.2 13.1.2 11.b.1 & .2
25% 25% 25% 25%
10 Total 9 Criteria 37 Indicators
2018EPIYaleUniv

Fig.-1:-.Organizationofthe2018EPI,withabbreviations(TLAs),weights(Wt.)
WithineachlevelofaggregationPolicyIssueObjectiveCategoryTLAWt.Indicator TLA WtPg.
Environmental
Hea lth HLT (40%)
Household Solid Fuels HAD 40% 5
Air Qua lity AIR 65% PM2. 5 Exposure PME 30% 6
PM2.5 Exceedance PMW 30% 7
Water & H2O 30%
Drink ing Water UWD 50% 9
Sanitat ion Sanitat ion USD 50% 10
Heavy Metals HMT 5% Lead Exposure PBD 100% 11
Ecosyste m Vitality ECO
(60%)
Marine Protected Areas MPA 20% 12
Biome Protection (National) TBN 20% 13
Biodiversity & BDH 25%
Biome Protection (Globa l) TBG 20% 15
Habitat Species Protection Index SPI 20% 17
Represe ntat ivene ss Index PAR 10% 18
Species Habitat Index SHI 10% 19
Forests FOR 10% Tree Cover Loss TCL 100% 20
Fisheries FSH 10% Fish Stock Status FSS 50% 21
Regional Marine Trophic Index MTR 50% 23
CO2 Emissions – Total DCT 50% 29
CO2 Emissions – Power DPT 20% 30
Climate & Energy CCE 30% Methane Emissions DMT 20% 31
N2O Emissions DNT 5% 32
Black Carbon Emissions DBT 5% 33
Air Pollut ion APE 10% SO2 Emissions DST 50% 34
NOX Emissions DXT 50% 35
Water Resources WRS 10% Wastewater Treatment WWT 100% 36
Agriculture AGR 5% Sustainable Nitrogen Management SNM 100% 38
