eov 3 chapter 1 closed
TRANSCRIPT
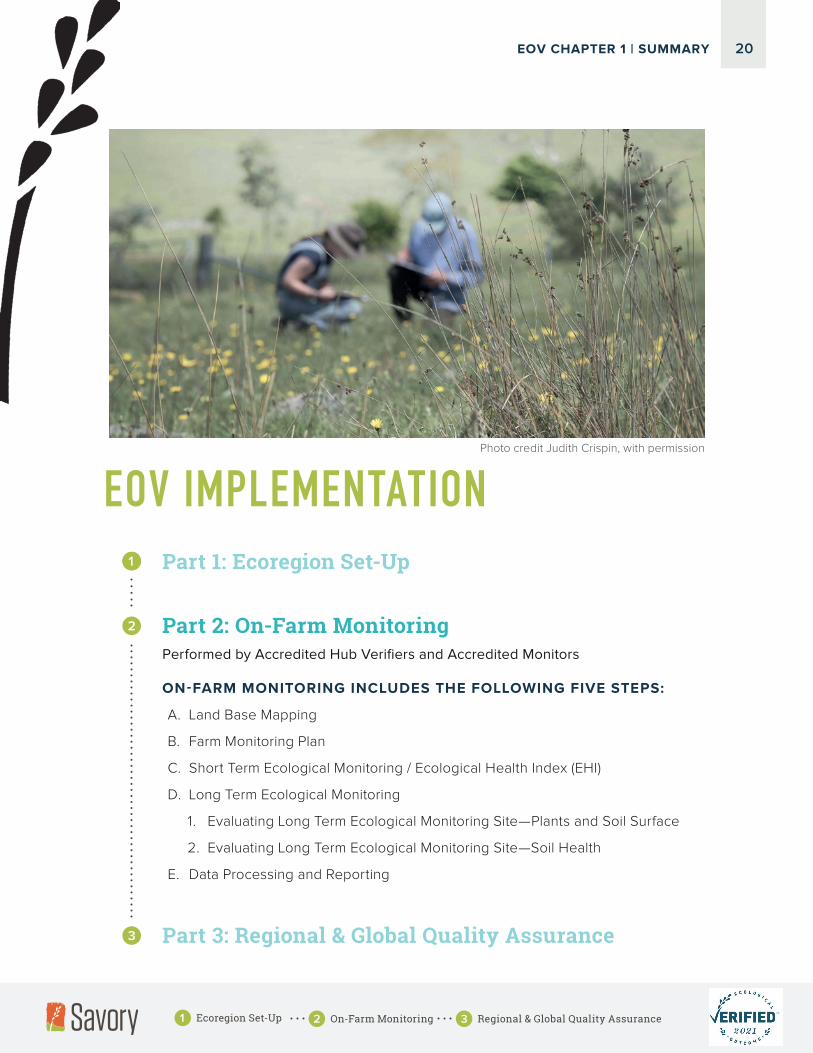
Photo credit Judith Crispin, with permission
1
CHAPTER 1EOV SUMMARY


4
Ecological Outcome Verification Overview
LAND TO MARKET OFFERS A FULL CIRCLE SOLUTION FOR REGENERATIVE SOURCING
Ecological Outcome Verification (EOV) is the “science inside” Savory Institute’s Land to
Market program. Land to Market (L2M) is a sourcing solution that connects conscientious
buyers, brands and retailers directly to farms and ranches that are verified to be regenerating
their land. EOV is the empirically based protocol used to verify farms and ranches to be eligi-
ble to participate in the L2M program.
EOV was developed in collaboration with leading soil scientists, ecologists, agronomists, and
an extensive network of regenerative land managers around the world. EOV is a practical and
scalable soil and landscape assessment methodology that tracks outcomes in biodiversity,
soil health, and ecosystem function (water cycle, mineral cycle, energy flow and community
dynamics). EOV applies to grassland environments, including natural and seeded grasslands,
as well as grazed orchards, sylvopastoral systems and mixed livestock-cropping systems
and/or forest areas. Pure cropping systems would not be included, except for Pilot projects.
Farms and ranches demonstrating positively trending outcomes in land regeneration through
EOV are eligible to be entered into a “Verified Regenerative Supplier Roster”, from which
participating buyers, brands, retailers and end consumers can access products or services
that have been produced on a verified regenerative land base.
EOV CHAPTER 1 | SUMMARY
EOV VERSION 3.0 MARCH 2021
9

5
EOV EthosEOV is designed to reflect the Savory Institute’s enduring commitment to farmer education,
support, and continuous improvement in community with their peers and with respect for their
given context. It is therefore designed according to the following strategic pillars:
Outcome Based
Contextually Relevant
Many certification schemes are process
based and simply inventory farmer practic-
es. The problem is that the use of practices
or tools does not guarantee that regenera-
tion will take place. Outcomes depend on
how and when practices and tools are man-
aged. Concurrently, that management
depends on contextual variances in cultural,
environmental, and economic conditions.
EOV provides empirical and tangible
outcomes, which in turn inform the farmer
with ongoing feedback from which to make better management decisions. EOV measures
and trends key indicators of ecosystem function, which in the aggregate indicate positive or
negative trends in the overall health of a landscape. In addition to providing an
outcome-based verification of the health of the land base, EOV also provides critical data to
the farmer as a steward and manager of the land. By recognizing both land regeneration
targets and trends, a farm or ranch is eligible for EOV verification and associated incentives
as long as land health moves in a net positive direction.
EOV is not a one-size-fits-all metric. Each EOV evaluation is contextualized within its given
ecoregion. Each ecoregion contains its own biodiversity of flora and fauna and has unique
characteristics such as climate, geology, biodiversity and soil types. Using well recognized
Ecoregions maps, contextualization occurs by
defining a catalogue of alternate states of soil
and vegetation within each ecoregion. These
are defined as State and Transition cata-
logues. Within an Ecoregion reference areas
are identified based on a desirable state
demonstrating higher biodiversity, resilience,
and ecosystem function e�ectiveness.
Reference areas in conjunction with a State
and Transitions catalogue are used to develop
an evaluation matrix of Ecological Health
consisting of ecological indicators. The result-
EOV CHAPTER 1 | SUMMARY
EOV VERSION 3.0 MARCH 2021
10
6
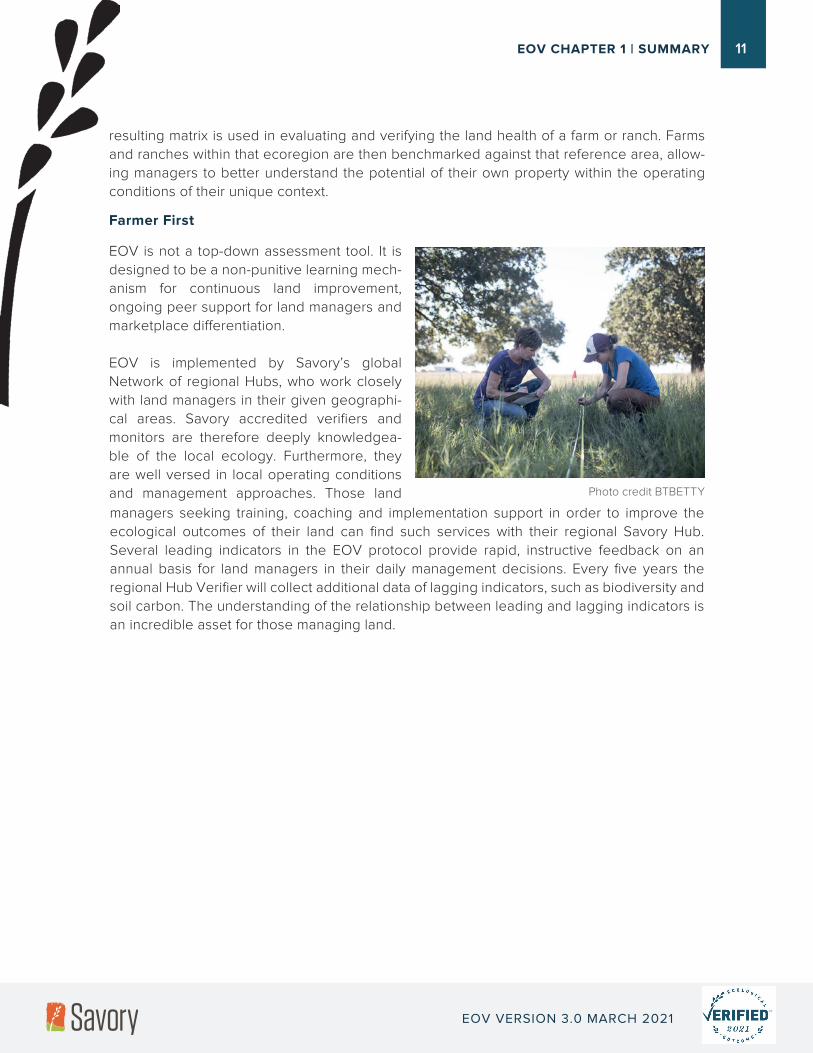
Farmer First
Photo credit BTBETTY
resulting matrix is used in evaluating and verifying the land health of a farm or ranch. Farms
and ranches within that ecoregion are then benchmarked against that reference area, allow-
ing managers to better understand the potential of their own property within the operating
conditions of their unique context.
EOV is not a top-down assessment tool. It is
designed to be a non-punitive learning mech-
anism for continuous land improvement,
ongoing peer support for land managers and
marketplace di�erentiation.
EOV is implemented by Savory’s global
Network of regional Hubs, who work closely
with land managers in their given geographi-
cal areas. Savory accredited verifiers and
monitors are therefore deeply knowledgea-
ble of the local ecology. Furthermore, they
are well versed in local operating conditions
and management approaches. Those land
managers seeking training, coaching and implementation support in order to improve the
ecological outcomes of their land can find such services with their regional Savory Hub.
Several leading indicators in the EOV protocol provide rapid, instructive feedback on an
annual basis for land managers in their daily management decisions. Every five years the
regional Hub Verifier will collect additional data of lagging indicators, such as biodiversity and
soil carbon. The understanding of the relationship between leading and lagging indicators is
an incredible asset for those managing land.
EOV CHAPTER 1 | SUMMARY
EOV VERSION 3.0 MARCH 2021
11
12
Photo credit BTBETTY
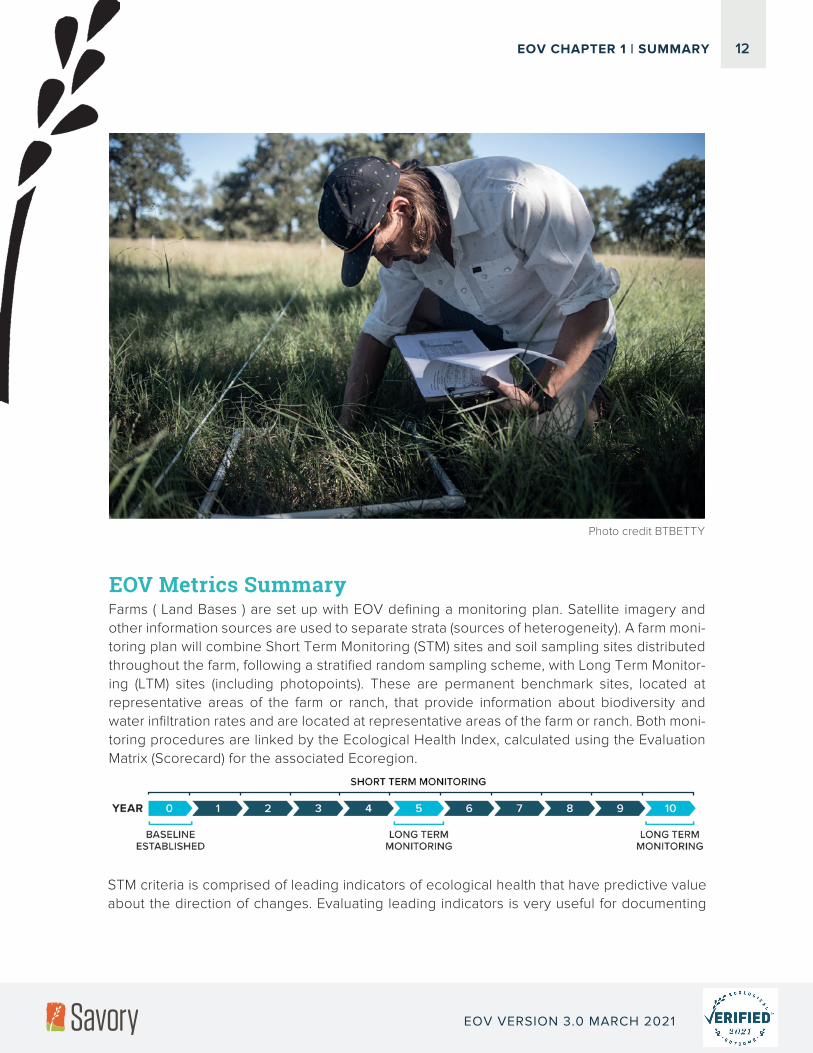
EOV Metrics SummaryFarms ( Land Bases ) are set up with EOV defining a monitoring plan. Satellite imagery and
other information sources are used to separate strata (sources of heterogeneity). A farm moni-
toring plan will combine Short Term Monitoring (STM) sites and soil sampling sites distributed
throughout the farm, following a stratified random sampling scheme, with Long Term Monitor-
ing (LTM) sites (including photopoints). These are permanent benchmark sites, located at
representative areas of the farm or ranch, that provide information about biodiversity and
water infiltration rates and are located at representative areas of the farm or ranch. Both moni-
toring procedures are linked by the Ecological Health Index, calculated using the Evaluation
Matrix (Scorecard) for the associated Ecoregion.
STM criteria is comprised of leading indicators of ecological health that have predictive value
about the direction of changes. Evaluating leading indicators is very useful for documenting
EOV CHAPTER 1 | SUMMARY
EOV VERSION 3.0 MARCH 2021
changes and informing management. STM indicators were selected from Allan Savory`s work
and many important references in the scientific literature. They include:
8
-
LTM criteria are comprised of all the STM criteria listed above, plus a suite of lagging indicators
for land regeneration such as canopy cover by species and functional groups, biodiversity
indicators, water infiltration, soil carbon, and soil health. All these indicators are measured using
acknowledged scientific methodologies. Unlike leading indicators, lagging indicator values
provide little opportunity for speedy management corrections. lagging indicators do provide
strong scientific validation of the existence and magnitude of regeneration processes that imply
relevant ecosystem services, like the increase of biodiversity, water infiltration and carbon
sequestration.
Live canopy abundance
Living organisms
Vigor and reproduction of contextually desirable Functional Groups (FG)
Warm season gras ses
Cool season grasses
Forbs and legumes
Trees and shrubs
Contextually desirable species
Contextually undesirable species
Litter abundance
Litter decomposition
Dung decomposition
Bare soil
Soil capping
Wind erosion
Water erosion
EOV CHAPTER 1 | SUMMARY
EOV VERSION 3.0 MARCH 2021
13
14
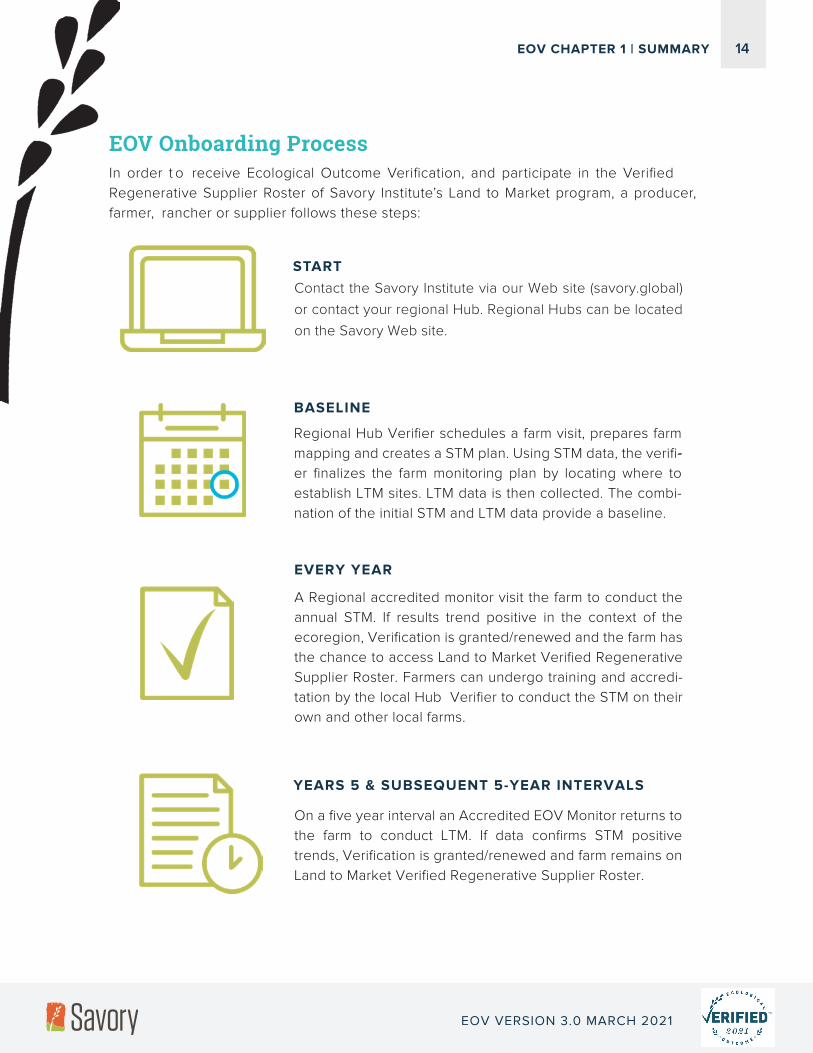
EOV Onboarding ProcessIn order t o receive Ecological Outcome Verification, and participate in the Verified
Regenerative Supplier Roster of Savory Institute’s Land to Market program, a producer,
farmer, rancher or supplier follows these steps:
EVERY YEAR
YEARS 5 & SUBSEQUENT 5-YEAR INTERVALS
BASELINE
-
STARTContact the Savory Institute via our Web site (savory.global)
or contact your regional Hub. Regional Hubs can be located
on the Savory Web site.
Regional Hub Verifier schedules a farm visit, prepares farm
mapping and creates a STM plan. Using STM data, the verifi-
er finalizes the farm monitoring plan by locating where to
establish LTM sites. LTM data is then collected. The combi-
nation of the initial STM and LTM data provide a baseline.
A Regional accredited monitor visit the farm to conduct the
annual STM. If results trend positive in the context of the
ecoregion, Verification is granted/renewed and the farm has
the chance to access Land to Market Verified Regenerative
Supplier Roster. Farmers can undergo training and accredi-
tation by the local Hub Verifier to conduct the STM on their
own and other local farms.
On a five year interval an Accredited EOV Monitor returns to
the farm to conduct LTM. If data confirms STM positive
trends, Verification is granted/renewed and farm remains on
Land to Market Verified Regenerative Supplier Roster.
EOV CHAPTER 1 | SUMMARY
EOV VERSION 3.0 MARCH 2021
11
1 Ecoregion Set-Up 2 On-Farm Monitoring 3 Regional & Global Quality Assurance
Photo credit Judith Crispin, with permission
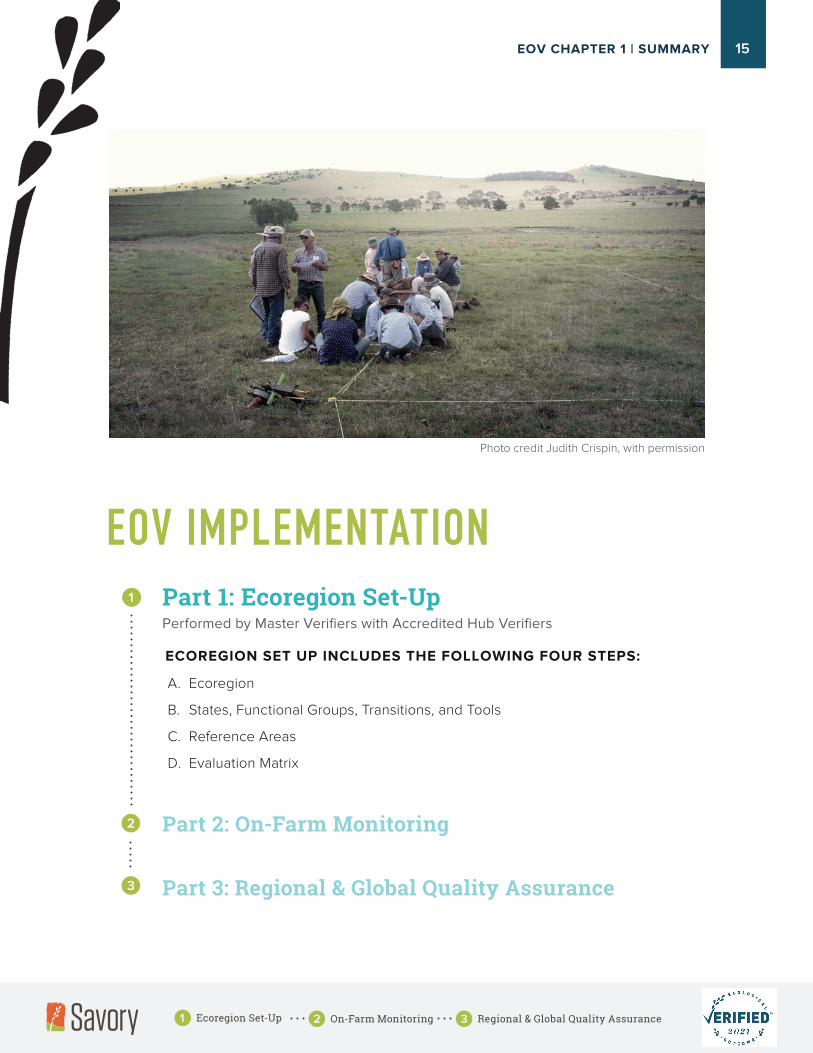
Part 1: Ecoregion Set-UpPerformed by Master Verifiers with Accredited Hub Verifiers
A. Ecoregion
B. States, Functional Groups, Transitions, and Tools
C. Reference Areas
D. Evaluation Matrix
Part 2: On-Farm Monitoring
Part 3: Regional & Global Quality Assurance
1
EOV IMPLEMENTATION
ECOREGION SET UP INCLUDES THE FOLLOWING FOUR STEPS:
EOV CHAPTER 1 | SUMMARY 15

Example of Ecological Regions in USA. Credit: The Nature Conservancy
16
A.
EXAMPLES OF ECOREGION MAPS
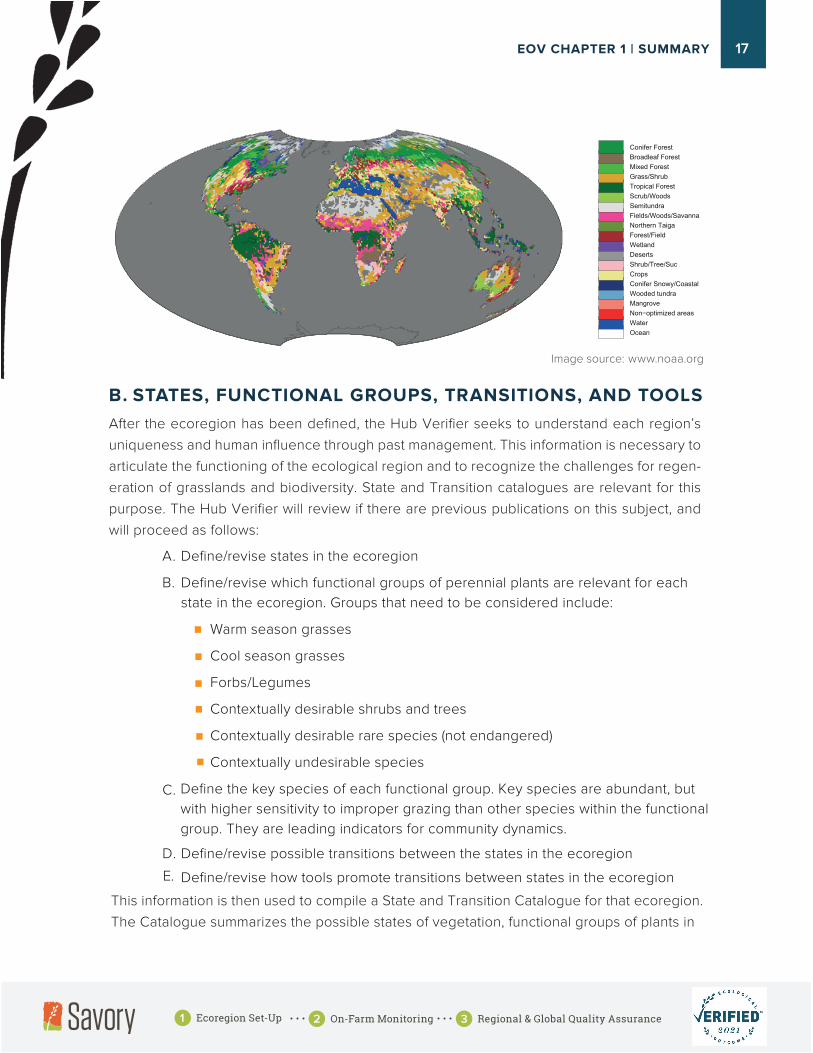
The areas covered by EOV will be separated into broad ecological regions, defined as areas
that contain characteristic geographically distinct assemblages of natural communities and
species. The biodiversity of flora, fauna and environments that characterize an ecological
region tends to be distinct from that of other ecological regions. Ecological regions are the
result of climate, geology, and landforms. They have a defined degree of brittleness and there-
fore have di�erential responses to management tools. To make comparisons between opera-
tions, di�erences between ecoregion must be taken into account. The ecological region is
selected based on an ecological map that is widely accepted by scientific literature. In the
United States, Hub Verifiers use The Nature Conservancy’s Ecoregions. Ecoregion maps on a
global basis are coordinated by the Savory Institute Quality Assurance team.
EOV CHAPTER 1 | SUMMARY
1 Ecoregion Set-Up 2 On-Farm Monitoring 3 Regional & Global Quality Assurance
After the ecoregion has been defined, the Hub Verifier seeks to understand each region’s
uniqueness and human influence through past management. This information is necessary to
articulate the functioning of the ecological region and to recognize the challenges for regen-
eration of grasslands and biodiversity. State and Transition catalogues are relevant for this
purpose. The Hub Verifier will review if there are previous publications on this subject, and
will proceed as follows:
This information is then used to compile a State and Transition Catalogue for that ecoregion.
The Catalogue summarizes the possible states of vegetation, functional groups of plants in
13
Conifer ForestBroadleaf ForestMixed ForestGrass/ShrubTropical ForestScrub/WoodsSemitundraFields/Woods/SavannaNorthern TaigaForest/FieldWetlandDesertsShrub/Tree/SucCropsConifer Snowy/CoastalWooded tundraMangroveNon−optimized areasWaterOcean
Image source: www.noaa.org
B. STATES, FUNCTIONAL GROUPS, TRANSITIONS, AND TOOLS
A. Define/revise states in the ecoregion
B. Define/revise which functional groups of perennial plants are relevant for each
state in the ecoregion. Groups that need to be considered include:
Warm season grasses
Cool season grasses
Forbs/Legumes
Contextually desirable shrubs and trees
Contextually desirable rare species (not endangered)
Contextually undesirable species
D.
Define/revise possible transitions between the states in the ecoregion
C. Define the key species of each functional group. Key species are abundant, but
with higher sensitivity to improper grazing than other species within the functional
group. They are leading indicators for community dynamics.
E.
Define/revise how tools promote transitions between states in the ecoregion
EOV CHAPTER 1 | SUMMARY
1 Ecoregion Set-Up 2 On-Farm Monitoring 3 Regional & Global Quality Assurance
17

each state, possible transitions between states, and the tools/events that promote a transition
from one state to another for the ecoregion. The State and Transition Catalogue that follows
shows the various States for an Ecoregion and the Transitions with corresponding
tools/events to promote a change between states.
In many cases there will not be any previous publications on a given ecoregion. In that case
research must be done in order to determine the characteristics needed to develop a State
and Transitions Catalogue. Universities, government agencies, and non-government organi-
zations are all good sources for the needed information to develop a States and Transitions
Catalogue.
T1. Holistic Planned Grazing, animal impact,
herd e�ect, technology, labor & Money, and
Human Creativity
T2. Partial rest for over grazing of perennials
T3. Rest, Partial Rest or over grazing of perenni-
als, repeated fires
T4. Animals such as goats to manage brush,
Holistic Planned Grazing, animal impact, herd
e�ect, technology, hand and clearing, Labor &
Money, and Human Creativity
T5. Rest, partial rest
T6. Technology/clearing/cultivation, Labor &
Money, and Human Creativity
T7. Rest, partial rest
T8. Holistic Planned Grazing, animal impact,
herd e�ect, technology, labor & Money, and
T9. Technology/clearing/cultivation, Labor &
Money, and Human Creativity
T10. Technology/planting, Labor & Money, and
Human Creativity
T11. Technology/logging/cultivation, Fire, Labor
& Money, and Human Creativity
T12. Rest
T13. Technology/logging/planting, Fire, Labor &
Money, and Human Creativity
T14. Technology/logging/cultivation, Fire, Labor
& Money, and Human Creativity,
Holistic Planned Grazing, animal impact, herd
e�ect
T15. Technology/planting, Labor & Money, and
Human Creativity
T16. Rest
18
SIMPLIFIED STATE & TRANSITION MODEL
T16
EOV CHAPTER 1 | SUMMARY
1 Ecoregion Set-Up 2 On-Farm Monitoring 3 Regional & Global Quality Assurance
15
C. REFERENCE AREAS
D.
Reference areas are the best-known expression of biodiversity, site stability, and ecosys-
tem function for a given ecoregion. Reference areas are the closest example of the
desired future resource base in a particular environment for a given context. It must be
noted that the concept of reference areas is dynamic, as proper management of land
bases can generate new reference areas and change the boundaries of what can be
achieved. Reference areas are established to create a benchmark and are used to devel-
op an Evaluation Matrix of leading ecological indicators for the specific ecoregion. Refer-
ence areas are located in relevant states of an ecoregion using local knowledge, satellite
imagery, information from scientific advisors, practical experience, and visual appraisal. A
LTM site will be installed at each reference area and analyzed according to EOV LTM
Protocols.
The Evaluation Matrix is a contextually relevant set of leading ecological indicators. Farms
and ranches in the ecological region are then monitored using the Evaluation Matrix and
receive an Ecological Health Index (EHI) score that is calibrated to the ecoregion. The EHI
score serves as an aggregated measure of ecosystem health. It is based on ecological
indicators associated with the four ecosystem processes – water cycle, mineral cycle,
energy flow, and community dynamics. Some of the ecological indicators are absolute and
the rest are calibrated relative to the reference areas for each ecological region. The
calibration is needed for certain ecological areas to account for di�erences related to the
degree of brittleness of an area and its potential. To calibrate an Evaluation Matrix, generic
descriptors for the ecological indicators are reviewed by Master Verifiers and the Hub
Verifier relative to the reference area in the region and their expertise of ecoregion varia-
bility. The indicator descriptions on the Evaluation Matrix are adjusted for the characteris-
tics of each ecoregion.
EOV CHAPTER 1 | SUMMARY
1 Ecoregion Set-Up 2 On-Farm Monitoring 3 Regional & Global Quality Assurance
19
20
Photo credit Judith Crispin, with permission
Part 1: Ecoregion Set-Up
Part 2: On-Farm MonitoringPerformed by Accredited Hub Verifiers and Accredited Monitors
A. Land Base Mapping
B. Farm Monitoring Plan
C. Short Term Ecological Monitoring / Ecological Health Index (EHI)
D. Long Term Ecological Monitoring
1. Evaluating Long Term Ecological Monitoring Site—Plants and Soil Surface
2. Evaluating Long Term Ecological Monitoring Site—Soil Health
E. Data Processing and Reporting
Part 3: Regional & Global Quality Assurance
1
EOV IMPLEMENTATION
EOV CHAPTER 1 | SUMMARY
1 Ecoregion Set-Up 2 On-Farm Monitoring 3 Regional & Global Quality Assurance
Mapping is an essential first step in the monitoring process to 1) assist in planning of Short
and Long Term ecological monitoring, 2) assess resources under management, and 3)
identify di�erent strata, that can be determined by topography, soil type, vegetation type,
past management and other sources of variation. Strata bondaries are defined and their
area calculated. Mapping can be done using online resources (e.g. Google Earth) or using
digital processing software on satellite imagery. This is done by an accredited EOV Monitor
in collaboration with the farmer.
A stratified monitoring plan is produced by an Accredited EOV Monitor. The plan deter-
mines the number and location of both STM and LTM sites.
17
A. LAND BASE MAPPING
B.
FARM MONITORING PLAN
1.
Short Term Monitoring Sites
2.
Long Term Monitoring Sites
STM procedures imply assessment of EHI score, with a minimum of 10 sites spread
across the farm, according to strata proportions. Optionally, STM will include going
through all the paddocks and assess forage quantity and quality. Farmers need to
provide information about livestock numbers, secondary production and manage-
ment activities.
The final number of LTM sites will depend on the number of strata and their size.The
EOV accredited Monitor will define the number, type, and location of LTM sites
according to the size and heterogeneity of the land base.
a) Soil Carbon Sampling. Soil C Stocks are estimated using stratified random sam-
pling. Soil samples are taking randomly at pre-defined sites, taking intact soil cores
from 0-30 cm.
b) Biodiversity and Water infiltration are assessed in permanent benchmark sites.
The number of sites depends on the number and size of strata (spatial variation).
EOV CHAPTER 1 | SUMMARY
1 Ecoregion Set-Up 2 On-Farm Monitoring 3 Regional & Global Quality Assurance
21
Minimal number of LTM sites may be 1 for small, homogeneous farms, up to 12 on large,
heterogeneous farms. Benchmark sites are assigned proportionally to the relative
area of strata. EHI from STM is used to inform LTM sites location.
minutes per checkpoint. Producers and professionals can learn to conduct STM in a
three-day training resulting in reliable EHI scores less than a standard deviation of 10
points among monitors.
The Ecological Health Index (EHI score) is the sum of the scores for each indicator. The
final score is dependent on the Evaluation Matrix for a given ecoregion. For example in an
ecoregion leaning toward the non-brittle end of the brittleness scale it can range between
-120 and +120 points.
Ecological Health Index
The Ecological Health Index score provides information regarding the current state of the
land base in relation to the desired future resource base as expressed by the reference
area. Landscape function indexes can be derived from the individual leading indicator
scores to evaluate the water cycle, mineral cycle, energy flow, and community dynamics
of that land base.
22
C. SHORT TERM ECOLOGICAL MONITORING / ECOLOGICAL
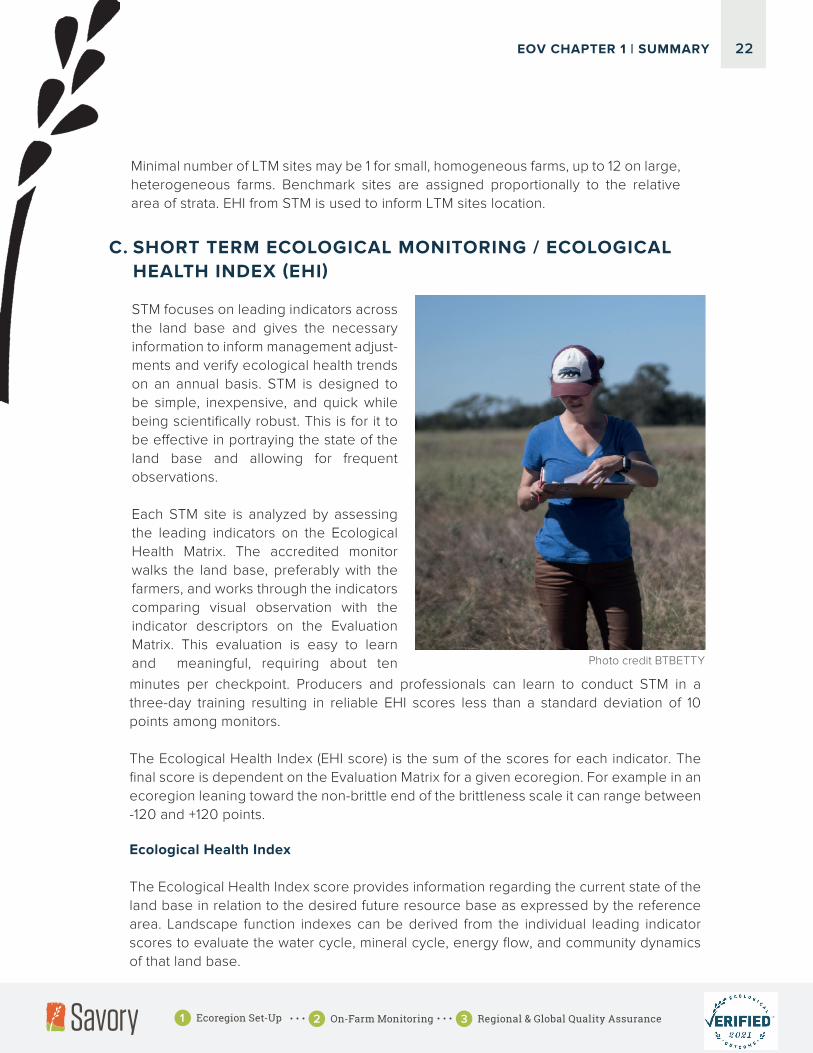
Photo credit BTBETTY
STM focuses on leading indicators across
the land base and gives the necessary
information to inform management adjust-
ments and verify ecological health trends
on an annual basis. STM is designed to
be simple, inexpensive, and quick while
being scientifically robust. This is for it to
be e�ective in portraying the state of the
land base and allowing for frequent
observations.
Each STM site is analyzed by assessing
the leading indicators on the Ecological
Health Matrix. The accredited monitor
walks the land base, preferably with the
farmers, and works through the indicators
comparing visual observation with the
indicator descriptors on the Evaluation
Matrix. This evaluation is easy to learn
and meaningful, requiring about ten
EOV CHAPTER 1 | SUMMARY
1 Ecoregion Set-Up 2 On-Farm Monitoring 3 Regional & Global Quality Assurance
19
D.
LONG TERM ECOLOGICAL MONITORING
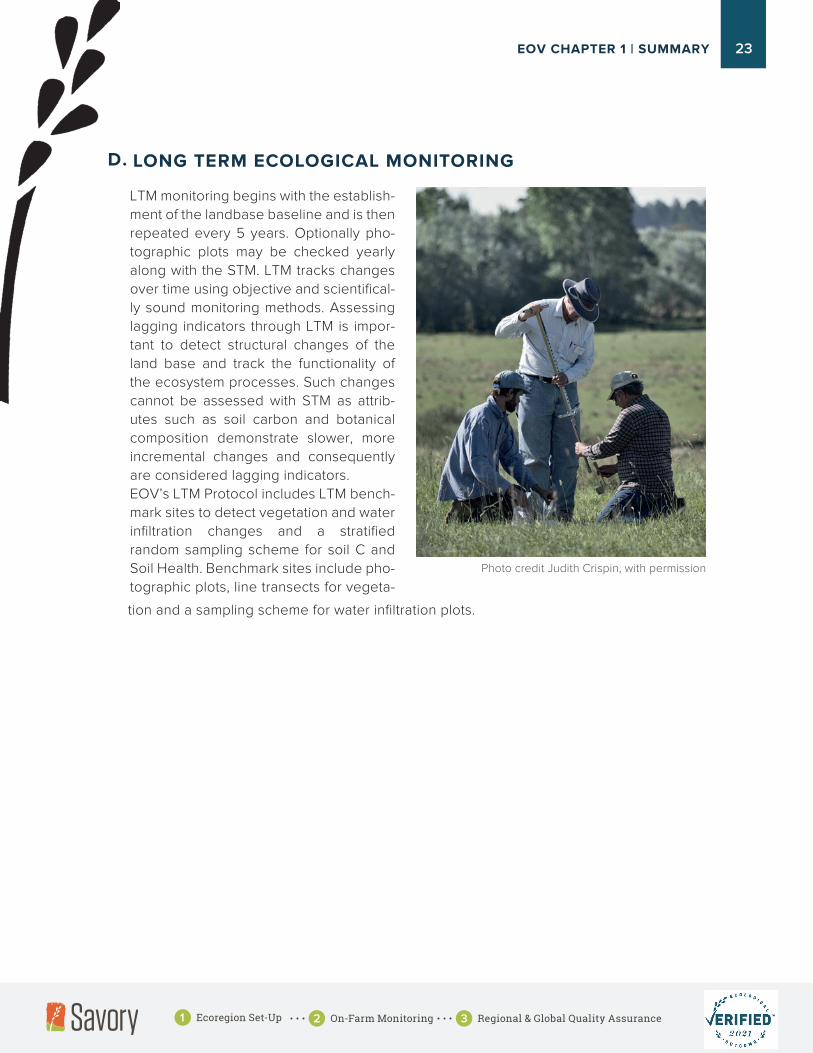
Photo credit Judith Crispin, with permission
LTM monitoring begins with the establish-
ment of the landbase baseline and is then
repeated every 5 years. Optionally pho-
tographic plots may be checked yearly
along with the STM. LTM tracks changes
over time using objective and scientifical-
ly sound monitoring methods. Assessing
lagging indicators through LTM is impor-
tant to detect structural changes of the
land base and track the functionality of
the ecosystem processes. Such changes
cannot be assessed with STM as attrib-
utes such as soil carbon and botanical
composition demonstrate slower, more
incremental changes and consequently
are considered lagging indicators.
EOV’s LTM Protocol includes LTM bench-
mark sites to detect vegetation and water
infiltration changes and a stratified
random sampling scheme for soil C and
Soil Health. Benchmark sites include pho-
tographic plots, line transects for vegeta-
tion and a sampling scheme for water infiltration plots.
Soil Carbon Content
Soil Carbon Content + Soil Health (Haney test or Cornell test)
Soil Health (Cornell test)
EOV CHAPTER 1 | SUMMARY
1 Ecoregion Set-Up 2 On-Farm Monitoring 3 Regional & Global Quality Assurance
23
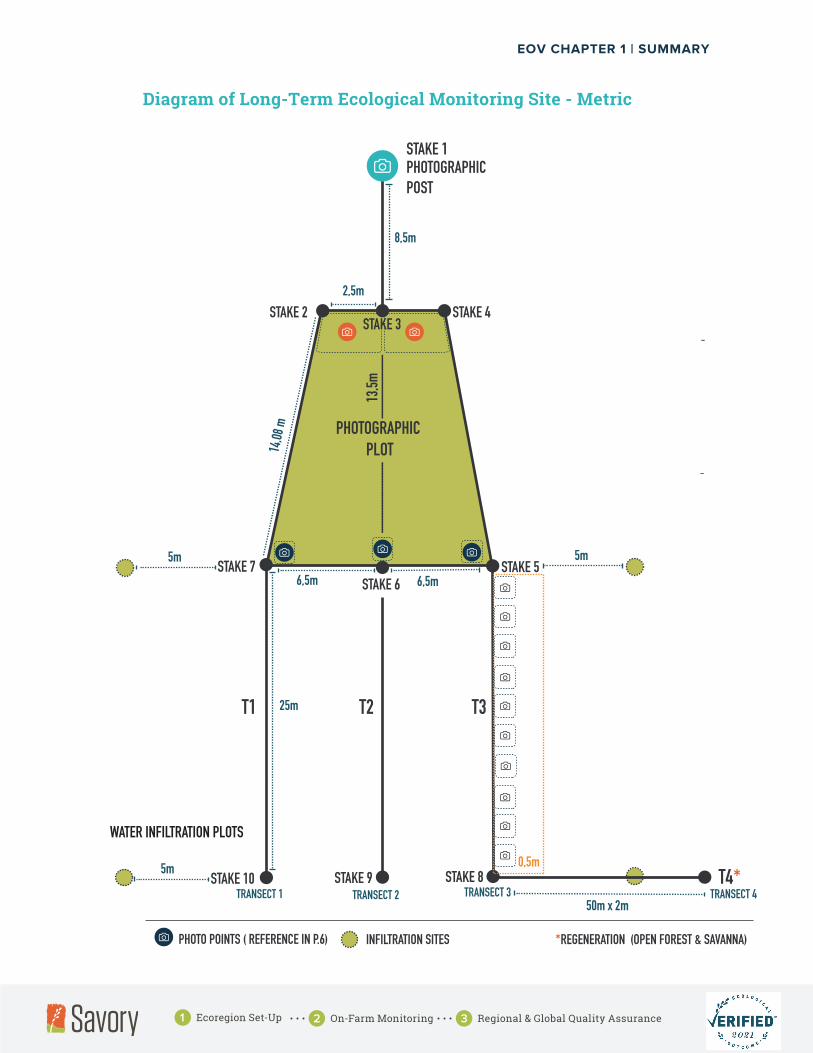
WATER INFILTRATION PLOTS
*REGENERATION (OPEN FOREST & SAVANNA)PHOTO POINTS ( REFERENCE IN P.6) INFILTRATION SITES
STAKE 2 STAKE 4
STAKE 10 STAKE 9 STAKE 8
STAKE 7STAKE 6
STAKE 5
STAKE 1PHOTOGRAPHIC POST
TRANSECT 1 TRANSECT 2 TRANSECT 3 TRANSECT 4T4*
T1 T2 T3
14,08
m
2,5m
8,5m
5m
6,5m
13,5m
6,5m
50m x 2m
25m
PHOTOGRAPHIC PLOT
Diagram of Long-Term Ecological Monitoring Site - Metric
STAKE 3
5m
5m 0,5m
III.
IV.
V.
2.
One of the following
Soil Carbon Content
Soil Carbon Content + Soil Health (Haney test or Cornell test)
Soil Health (Cornell test)
-
-
Soil Carbon Content
Soil Carbon Content + Soil Health (Haney test or Cornell test)
Soil Health (Cornell test)
EOV CHAPTER 1 | SUMMARY
1 Ecoregion Set-Up 2 On-Farm Monitoring 3 Regional & Global Quality Assurance

1.
EVALUATING VEGETATION AND WATER INFILTRATION CHANGE:
Plants and Soil Cover benchmark site includes a photographic plot and threetransects..
I. Transect 1 & 2: location for evaluating the Plant Composition/Soil Cover using
Line Point and Flexible Area Measurement which provides data regarding:
a. Bare Soil Cover
b. Litter Cover
c. Foliar Cover of Perennial Plants by Species
d. Cover Percentage by Functional Groups
e. Biodiversity indicators such as Species Richness and Shannon Wienner
Index
II. Transect 3: location for evaluating Ecological Health Index (EHI) score on a
quantitative sampling. Photographs are taken on 10 quadrats, and EHI is
estimated inside a belt of 0.5 x 25 m. The distance to the nearest perennial plant is measured with 10 replications.
Soil Carbon Content
Soil Carbon Content + Soil Health (Haney test or Cornell test)
Soil Health (Cornell test)
Data is recorded from each transect and uploaded to the Savory Global EOV
Platform. Data is analyzed in the context of the ecoregion and a report is pre
pared by Hub Verifier in each region. Audits are determined by EOV Quality
Assurance.
Regional data is sent to Quality Assurance for global analysis and additional
audit planning.
Results for each land base are sent to producer with follow-up if necessary.
Evaluating Soil Carbon content and Soil Health
Current soil indicator protocols include:
Iii. Water infiltration in the field (protocol for water infiltration is based on NRCS 1999).
IV. Data is recorded from each transect and uploaded to the Savory Global EOVPlatform. Data is analyzed in the context of the ecoregion and a report is prepared by EOV Monitor in each region. Audits are determined by EOV QualityAssurance.
EOV CHAPTER 1 | SUMMARY
1 Ecoregion Set-Up 2 On-Farm Monitoring 3 Regional & Global Quality Assurance
25

26
Soil Carbon Content
Soil sampling is distributed throughout the farm, following the STM mon-
itoring plan. At each location, 1 or 2 randomly distributed soil samples
are taken, at a depth of 0-30 cm.
Each sample is a composite of 3 cores. Fine soil bulk density is estimat-
ed from the total dry weight of the intact cores, corrected by the weight
of gravel. Soil C mass is estimated using Equivalent Soil Mass proce-
dure, as proposed by Wendt and Hauser (2013)
Samples are delivered to soil lab for dry weight, gravel weight and Soil
C determination. Total combustion using Walkley-Black is the preferred
method, although EOV adapts to each context.
V. Regional data is sent to Quality Assurance for global analysis and additionalaudit planning.
VI. Results for each land base are sent to producer with follow-up if necessary.
2. EVALUATING SOIL CARBON CONTENT AND SOIL HEALTH
Current soil indicators protocols include one of the following
Soil Carbon ContentSoil Carbon Content + Soil Health (Haney test or Cornell test)Soil Health (Cornell test)
EOV CHAPTER 1 | SUMMARY
1 Ecoregion Set-Up 2 On-Farm Monitoring 3 Regional & Global Quality Assurance
The test includes Soil pH, Organic Matter, Modified Morgan Extracta-
ble P, K, micronutrients, Soil Texture, Active Carbon, Wet Aggregate
Stability,Soil Respiration, Autoclave-Citrate Extractable (ACE) Protein
Test,Available Water Capacity. The test measures indicators of the
water cycle including wet aggregate stability and available water
capacity, water infiltration. Minimum Cash Scores are 60 points,
optimal soil structure and function correlates with scores above 80
points.
23
Soil Health
A. Method 1: Soil Health
The overall assessment of soil health and biology is derived from the
Haney test, developed by Dr. Rick Haney, USDA ARS. These mea-
sured indicators of soil health can give inference on next steps to
improve soil health.
i. Soil Microbial Activity
The Solvita 1-day CO2-C test is performed.
ii. Water Extractable Organic Carbon and Nitrogen (WEOC and WEON
WEOC and WEON represent the available nutrients (mineraliza-
tion) in the soil that feed the microbes.
iii. Haney Soil Health Calculation
(for more information, visit: www.wardlab.com/haney-info.php )
Soil health calculations can range from 0-50. Generally, soil health
scores should be above 7.
B. Method 2 : The Standard Soil Health Analysis Package of the Comprehensive Assessment of Soil Health (CASH) from CornellUniversity.
EOV CHAPTER 1 | SUMMARY
1 Ecoregion Set-Up 2 On-Farm Monitoring 3 Regional & Global Quality Assurance
27
All field data collected on reference areas and farms by accredited EOV Monitors and Hub
Verifiers are uploaded to the Savory Global EOV Data Platform. GPS coordinates, photos
and specific comments will also be hosted on the digital platform. This platform is able to
import farm production data and management plans crucial to inform outcomes and
opportunities for improvement or learning. It is the responsibility of the Accredited EOV
Short Term Monitor or Accredited EOV Monitor to add the data to the platform in a timely
and accurate manner according with local conditions and connectivity. A results report is
then given to the producer and opportunities for mentoring are outlined.
28
E. DATA PROCESSING AND REPORTING
EOV CHAPTER 1 | SUMMARY
1 Ecoregion Set-Up 2 On-Farm Monitoring 3 Regional & Global Quality Assurance

EOV IMPLEMENTATION
25
Photo credit BTBETTY
Part 1: Regional Hub Set-Up
Part 2: On-Farm Monitoring
Part 3: Regional & Global Quality AssurancePerformed by Global Quality Assurance Team, Master Verifiers and Hub Verifiers
1
EOV CHAPTER 1 | SUMMARY
1 Ecoregion Set-Up 2 On-Farm Monitoring 3 Regional & Global Quality Assurance
29
30
EOV QUALITY ASSURANCE
PROFESSIONAL ACCREDITATIONS FOR EOV
EOV Monitors:
EOV is supported by sound quality assurance procedures and protocols. Each monitoring
activity is carried out by accredited Verifiers and Monitors with deep knowledge and experi-
ence in the given regional context. Data uploaded onto the EOV platform is reviewed and
analyzed by the regional Hub Verifier and the Global Network of Master Verifiers. On an annual
basis, an average of 5% of all participating farms are subject to an on-site audit. The selection
of farms to be audited are a result of data analysis. Any farm with suspicious or inconsistent
data relative to the regional trends will be audited. Additionally, data from STM conducted by
Monitors who are the managers of the land base have an increased likelihood of being audited.
Random selection will be used to determine the remaining land bases that are audited in a
given year. Given the close relationship of Hubs to the producers they serve and support, and
the ability to e�ciently analyze large data sets from a given region using the digital platform as
well as the Hubs Verifiers knowledge of the region they serve greatly decrease the need for a
large number of farm audits.
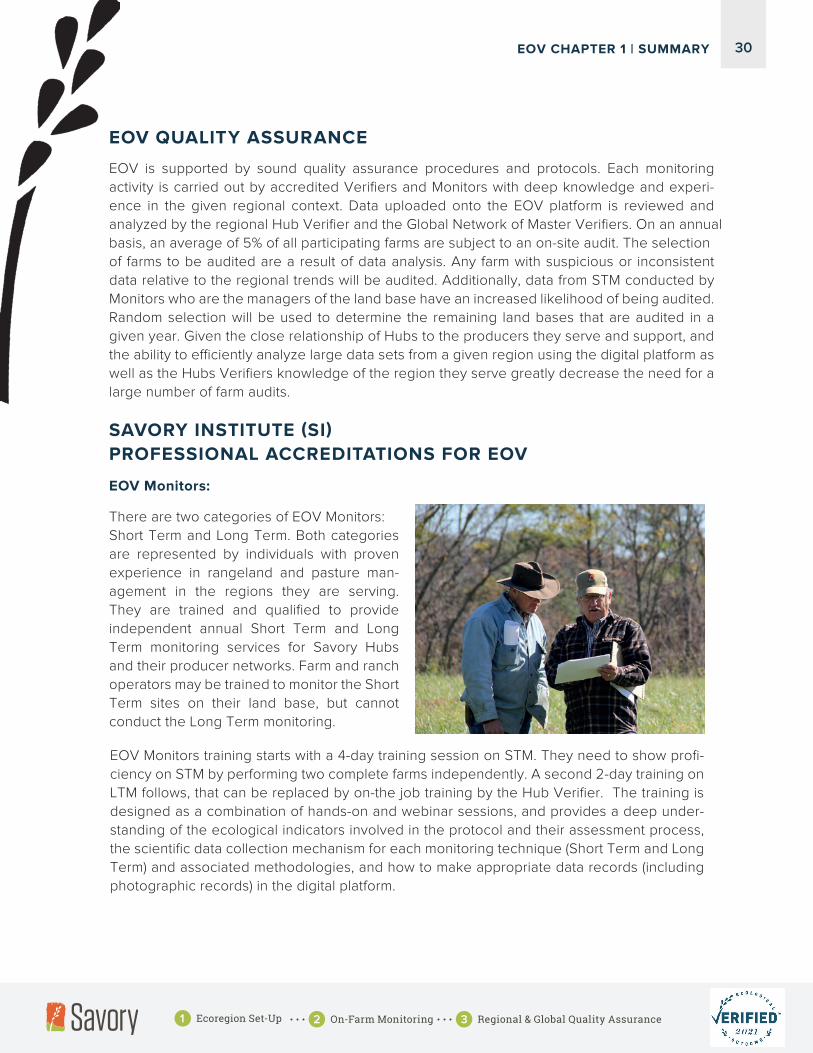
There are two categories of EOV Monitors:
Short Term and Long Term. Both categories
are represented by individuals with proven
experience in rangeland and pasture man-
agement in the regions they are serving.
They are trained and qualified to provide
independent annual Short Term and Long
Term monitoring services for Savory Hubs
and their producer networks. Farm and ranch
operators may be trained to monitor the Short
Term sites on their land base, but cannot
conduct the Long Term monitoring.
EOV Monitors training starts with a 4-day training session on STM. They need to show profi-
ciency on STM by performing two complete farms independently. A second 2-day training on
LTM follows, that can be replaced by on-the job training by the Hub Verifier. The training is
designed as a combination of hands-on and webinar sessions, and provides a deep under-
standing of the ecological indicators involved in the protocol and their assessment process,
the scientific data collection mechanism for each monitoring technique (Short Term and Long
Term) and associated methodologies, and how to make appropriate data records (including
photographic records) in the digital platform.
EOV CHAPTER 1 | SUMMARY
1 Ecoregion Set-Up 2 On-Farm Monitoring 3 Regional & Global Quality Assurance

27
HUB Verifiers:
HUB Verifiers are experienced land managers, and practitioners of Holistic Management
and regenerative agriculture. It is a prerequisite that they are accredited as Field Profession
tiveness of ecosystem processes and health. HUB Verifiers receive additional training in the
EOV protocol to ensure the development of consistent, robust and repeatable monitoring
practices across the globe. HUB verifiers play an important quality assurance role. HUB Veri-
fiers serve 4 primary roles:
A. Supporting the preparation of their Hub to engage in EOV set-up for producers, includ-
ing defining ecoregions, functional groups, states, and transitions, establishing reference
areas, and calibrating the Evaluation Matrix ( Scorecard) in each ecoregion. This is done
with guidance and support from Master Verifiers.
B. Set up STM and LTM in farms wishing to be EOV verified.
C.
D.
Training and QA of STM and LTM in their regions.
Training for HUB Verifiers includes:
Master Verifiers:
Hub Verifiers are a central piece of EOV QA. They have direct responsibility in the validi-
ty and consistency of the data uploaded to the EOV digital platform. They may receive
Hub Audits from Savory Institute. HUB Verifiers then create the report for the farmers
and bestow the verification or schedule audits as appropriate.
These are highly experienced land managers. They are Savory accredited Field Profes-
sionals and practitioners of Holistic Management with experience in regenerative agricul-
ture in an extensive range of ecological settings. Master Verifiers are responsible for train-
ing Hub Verifiers and facilitating the set-up of the Hub regions with their ecoregions. These
individuals provide Quality Assurance and support for the network of EOV Verifiers world-
wide. This growing global body contributes to the ongoing evolution of the EOV protocol.
A. Pre-training assignments: readings and ecoregion research.
B. Course 1 (5 days) EOV Preparatory work, STM and LTM taught by a Master Verifier.
C. Post Training activities: submit two complete farms into the EOV Digital Platform.
D. Course 2: EOV Verification. taught by EOV QA professional.
E. Accreditation as HUB Verifier by SI (after passing an exit review).
als with Savory Institute, to ensure a thorough and holistic understanding of the e�ec-
EOV CHAPTER 1 | SUMMARY
1 Ecoregion Set-Up 2 On-Farm Monitoring 3 Regional & Global Quality Assurance
31

32
Global Quality Assurance (QA):
A QA Team and Scientific Advisory Team will oversee quality control for EOV globally. All
the global data aggregated by HUB Verifiers around the world will be analyzed, correla-
tions established, and lessons learned. If there is data that looks inconsistent or suspicious,
the specific HUB Verifier and verification process will be audited and issues addressed.
All lessons and insights will be shared with the Savory Network and will form the basis for
Network communications to inform the public, media, market partners, policy makers, and
other stakeholders. Additionally, data will be published in scientific peer reviewed papers
by interested research institutions, advancing the credibility of the work globally. A Terms
of Use Agreement defines that the farmer is the only owner of the EOV data, but authorizes
the use of them for scientific and learning purposes.
All Hubs are encouraged to partner with local research institutions and scientific bodies to
add layers of monitoring relevant to their context. Many Hubs are partnering with Universi-
ties, conservation groups, wildlife groups, and others interested in measuring the impact of
management on target indicators. This adds transparency, robustness and additional data
to the learning platform and network.
EOV CHAPTER 1 | SUMMARY
1 Ecoregion Set-Up 2 On-Farm Monitoring 3 Regional & Global Quality Assurance
EOV FAQs
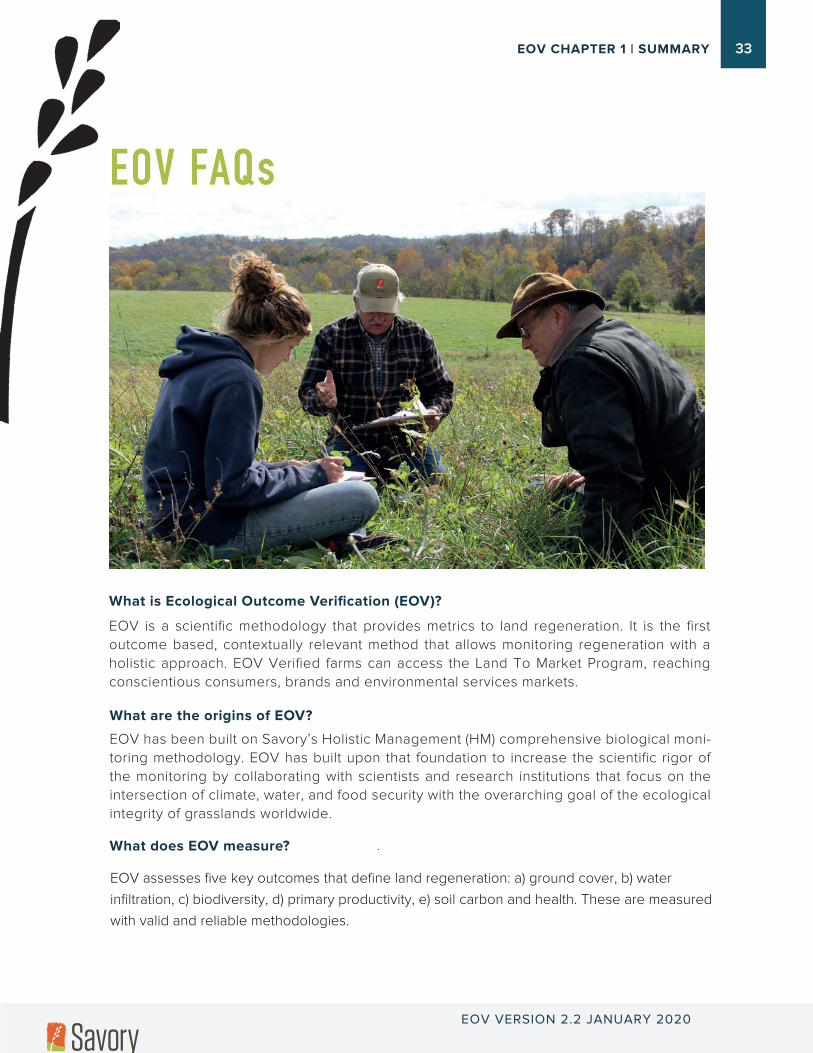
What is Ecological Outcome Verification (EOV)?
What are the origins of EOV?
What does EOV measure?
EOV is a scientific methodology that provides metrics to land regeneration. It is the first
outcome based, contextually relevant method that allows monitoring regeneration with a
holistic approach. EOV Verified farms can access the Land To Market Program, reaching
conscientious consumers, brands and environmental services markets.
EOV has been built on Savory’s Holistic Management (HM) comprehensive biological moni-
toring methodology. EOV has built upon that foundation to increase the scientific rigor of
the monitoring by collaborating with scientists and research institutions that focus on the
intersection of climate, water, and food security with the overarching goal of the ecological
integrity of grasslands worldwide.
EOV assesses five key outcomes that define land regeneration: a) ground cover, b) water
infiltration, c) biodiversity, d) primary productivity, e) soil carbon and health. These are measured
with valid and reliable methodologies.
EOV VERSION 2.2 JANUARY 2020
EOV CHAPTER 1 | SUMMARY 33
The EOV has been built on Savory’s Holistic Management (HM) comprehensive biological
monitoring methodology. EOV has built upon that foundation to increase the scientific rigor
of the monitoring by collaborating with scientists and research institutions that focus on the
intersection of climate, water, and food security with the overarching goal of the ecological
integrity of grasslands worldwide.
Each Hub in the Savory Global Network is a contributing organization and their producer
and scientific networks are constantly providing guidance and input. Ovis 21, a Savory Hub,
has led the creation of the scientific methodology, in collaboration with scientists at Michi-
gan State University (MSU), another Savory Hub, and with input from scientists and from
research institutions around the world. Ovis 21 and MSU are taking the lead in aggregating
and analyzing the emerging data from the participating Hubs and their producer networks.
They will be joined by other research institutions and scientist groups in our global Network
with the goal of creating one of the largest global databases for monitoring grassland health
and associated ecosystem services that will inform the public, policy makers and markets.
The primary di�erentiation is EOV is outcomes based while other certification programs are
process based. EOV is designed to engage farmers and ranchers around the world in con-
tinual learning and support toward their enduring success as business leaders and land
stewards. To that end, the key di�erence between EOV and other certification programs is
that it is driven by producers, from the bottom up, with outcome-based benchmarks, rather
than from the top down, with practice-based benchmarks. The goal of Land to Market is not
to compete with other certification programs, but rather to add value to them, by providing
producers with the critical tools and knowledge they need to a�ect a profound improve-
ment in ecological systems around the world for years to come.
Producers engage with their regional Savory Hub, which deploys a Hub Verifier to visit their
property and begin the process of establishing the farm’s baseline. STM is repeated and
renewed annually, with LTM occurring every five years. If the EOV verification is received,
the producer has the option to enter into the Land to Market Verified Regenerative Supplier
Roster. The roster is accessed by a�liated brands, retailers and end consumers for their
sourcing needs. Producers not receiving EOV (ecological outcomes trending negatively in
the context of their region) may continue to engage with their regional Hub for training and
implementation support. In short, the EOV is designed to invite the producer into a shared
process of continual improvement in community with their peers. Please see the onboard-
ing section of this document for more information.
34
How was EOV developed?
How is EOV di�erent from other certification programs?
How can I get involved as a farmer or rancher?
What product categories does EOV apply to?
Currently the EOV protocol is being deployed in land bases of livestock operations, namely meat,
dairy, wool and leather. Future phases of the program may incorporate land bases dedicated
EOV CHAPTER 1 | SUMMARY
EOV VERSION 3.0 MARCH 2021

Each regional Savory Hub sets up their own pricing structure for baseline and annual moni-
toring visits, and fees for participation are negotiated with and paid directly to the regional
Hub by the participating farmer or farmer group. Baseline and LTM visits typically involve 1-2
days of work by a Hub Verifier. STM will depend on the size of the farm, but typically will
take one to two days.
Please contact EOV Quality Assurance team at [email protected] or with your regional
Hub
31
How much does it cost to participate in EOV?
What if I don’t have a regional Hub in my area and I want to participate?
Savory Network Hubs are the program’s primary mechanism to evaluate and verify new produc-
ers. However, if your operation is not near an existing Hub we have a network of Master Verifi-
ers and Accredited Field Professionals who may be able to work with you. Please contact us via
our website and we will put you in touch with the appropriate representative.
I don’t see my question answered here. Where can I go for more information?
.
EOV CHAPTER 1 | SUMMARY
EOV VERSION 3.0 MARCH 2021
35
Soil Carbon Content
Soil Carbon Content + Soil Health (Haney test or Cornell test)
Soil Health (Cornell test)
The numeric score that EOV-enrolled land receives
after completion of data gathering and filling of the regionally calibrated Evaluation Matrix
(leading indicators only). Scores show the numerical distance to the potential of ecosystem
processes of the ecoregion, expressed by the reference area.
HUB Verifier: An HUB Verifier is an Accredited Field Professional with the Savory Institute
and working in close association with a Hub in a given region. They are trained in EOV to
be able to do the preparatory work in an ecoregion including understanding and diagram-
ming the states of land that can occur in an ecoregion, the ways to transition between
states, the functional groups of plants in that ecoregion, installing reference area LTM sites,
and the development of the Evaluation Matrix for the ecoregion. They also perform verifica-
tion and auditing of monitoring done by EOV Monitors.
Lagging indicator: Lagging indicators are largely captured in LTM and outcome indicators.
Unlike leading indicators, when we know lagging Indicator values there is little chance to
make corrections quickly. Evaluating these lagging indicators can be expensive and
require Long Term Monitoring to be performed. However, it provides us with strong scien-
tific validation on the function of the ecosystem processes.
36
GLOSSARY OF TERMSEcological Health Index (EHI Score):
Ecological indicators: of ecosystem processes. They are used on the Evaluation Matrix to evaluate Ecological Health
Index (EHI).
Ecoregion: Area that contains characteristic, geographically distinct assemblages of natural
communities and species. The biodiversity of flora, fauna and environments that character-
ize an ecological region tends to be distinct from that of other ecological regions. Ecological
regions are the result of climate, geology, and landforms. They have a defined degree of brit-
Evaluation Matrix : A matrix of up to 15 biological indicators (rows) and five possible situations
of each indicator. Determines the score for a particular site in a way that is contextualized for
a specific ecoregion.
Functional Groups: A set of plant species that share the same type and ecological role. The
relative proportion of functional groups of plants determine the state of the land. This includes
warm season grasses, cool season grasses, forbs/legumes and shrubs/trees.
EOV CHAPTER 1 | SUMMARY
EOV VERSION 3.0 MARCH 2021
Soil Carbon Content
Soil Carbon Content + Soil Health (Haney test or Cornell test)
Soil Health (Cornell test)
Soil Carbon Content
Soil Carbon Content + Soil Health (Haney test or Cornell test)
Soil Health (Cornell test)
33
Leading Indicator: leading indicators are those that usually change before others, and
therefore have some predictive value about the direction of changes. Leading indicators
are useful for documenting and influencing management and are largely covered in Short
Term ecological monitoring.
Long Term Monitoring: Baseline monitoring in year 0 and repeated every five years.
Quantitative estimations that combine stratified random sampling for Soil C Data, with
benchmark LTM sites where plant composition and soil cover are assessed, along with EHI
and water infiltration.
Master Verifier: Master Verifiers are a select group involved in the further development and
refinement of the EOV methodology. Master Verifiers provide training to Hub Verifiers.
Reference Area: LTM site in any land base (within or outside producer network) that is the
best known expression of biodiversity, site stability, and ecosystem function for a given
state in an ecoregion. It may or may not be inside the land base being verified. These areas
are benchmark points for the relevant states for the rest of the LTM sites in the land bases
in that ecoregion. The concept of reference areas is dynamic, as proper management can
generate new reference areas and change the parameters of what can be achieved.
Short Term Monitoring: Done across each land base annually in multiple paddocks.
Provides a score for each paddock and a weighted average for the farm. The weighted
average is used in the EOV verification of the farm.
State: States are alternative assemblages of functional groups and plant species, that
determine physiognomy, soil attributes, and ecosystem function inside an ecoregion. For
example, grassland, grassland/shrubland, shrubland, cropland, and savanna could be the
states within a given ecoregion.
Transitions: Transitions represent the change of vegetation and soil from one state to
another. If grasslands switch from one state to one that represents lower ecosystem health,
that transition is undesirable. Conversely, land regeneration could be defined as the man-
agement of transitions to create the most vibrant and e�ective state in terms of ecological
health and productivity. Transitions are always caused by the intended or accidental use of
tools: technology, fire, rest and living organisms. A transition catalogue describes how the
management of each tool promotes transitions.
EOV CHAPTER 1 | SUMMARY
EOV VERSION 3.0 MARCH 2021
37

Soil Carbon Content
Soil Carbon Content + Soil Health (Haney test or Cornell test)
Soil Health (Cornell test)