epa office of compliance sector notebook project: profile of the shipbuilding...
TRANSCRIPT

Shipbuilding and Repair Industry Sector Notebook Project
EPA/310-R-97-008
EPA Office of Compliance Sector Notebook Project:
PROFILE OF THE SHIPBUILDING AND REPAIR INDUSTRY
November 1997
Office of ComplianceOffice of Enforcement and Compliance Assurance
U.S. Environmental Protection Agency401 M St., SW (MC 2221-A)
Washington, DC 20460
Shipbuilding and Repair Industry Sector Notebook Project
Sector Notebook Project November 1997ii
This report is one in a series of volumes published by the U.S. Environmental Protection Agency(EPA) to provide information of general interest regarding environmental issues associated withspecific industrial sectors. The documents were developed under contract by Abt Associates(Cambridge, MA), Science Applications International Corporation (McLean, VA), and Booz-Allen & Hamilton, Inc. (McLean, VA). This publication may be purchased from theSuperintendent of Documents, U.S. Government Printing Office. A listing of available SectorNotebooks and document numbers is included at the end of this document.
All telephone orders should be directed to:
Superintendent of DocumentsU.S. Government Printing OfficeWashington, DC 20402(202) 512-1800FAX (202) 512-22508:00 a.m. to 4:30 p.m., EST, M-F
Using the form provided at the end of this document, all mail orders should be directed to:
U.S. Government Printing OfficeP.O. Box 371954Pittsburgh, PA 15250-7954
Complimentary volumes are available to certain groups or subscribers, such as public andacademic libraries, Federal, State, and local governments, and the media from EPA’s NationalCenter for Environmental Publications and Information at (800) 490-9198. For furtherinformation, and for answers to questions pertaining to these documents, please refer to thecontact names and numbers provided within this volume.
Electronic versions of all Sector Notebooks are available via Internet on the Enviro$en$e WorldWide Web. Downloading procedures are described in Appendix A of this document.
Cover photograph courtesy of Ingalls Shipbuilding Inc., Pascagoula, MS.

Shipbuilding and Repair Industry Sector Notebook Project
Sector Notebook Project November 1997iii
Sector Notebook Contacts
The Sector Notebooks were developed by the EPA’s Office of Compliance. Questions relating tothe Sector Notebook Project can be directed to:
Seth Heminway, Coordinator, Sector Notebook ProjectUS EPA Office of Compliance401 M St., SW (2223-A)Washington, DC 20460(202) 564-7017
Questions and comments regarding the individual documents can be directed to the appropriatespecialists listed below.
Document Number Industry Contact Phone (202)
EPA/310-R-95-001. Dry Cleaning Industry Joyce Chandler 564-7073EPA/310-R-95-002. Electronics and Computer Industry Steve Hoover 564-7007EPA/310-R-95-003. Wood Furniture and Fixtures Industry Bob Marshall 564-7021EPA/310-R-95-004. Inorganic Chemical Industry Walter DeRieux 564-7067EPA/310-R-95-005. Iron and Steel Industry Maria Malave 564-7027EPA/310-R-95-006. Lumber and Wood Products Industry Seth Heminway 564-7017EPA/310-R-95-007. Fabricated Metal Products Industry Scott Throwe 564-7013EPA/310-R-95-008. Metal Mining Industry Jane Engert 564-5021EPA/310-R-95-009. Motor Vehicle Assembly Industry Anthony Raia 564-6045EPA/310-R-95-010. Nonferrous Metals Industry Jane Engert 564-5021EPA/310-R-95-011. Non-Fuel, Non-Metal Mining Industry Robert Lischinsky 564-2628EPA/310-R-95-012. Organic Chemical Industry Walter DeRieux 564-7067EPA/310-R-95-013. Petroleum Refining Industry Tom Ripp 564-7003EPA/310-R-95-014. Printing Industry Ginger Gotliffe 564-7072EPA/310-R-95-015. Pulp and Paper Industry Maria Eisemann 564-7016EPA/310-R-95-016. Rubber and Plastic Industry Maria Malave 564-7027EPA/310-R-95-017. Stone, Clay, Glass, and Concrete Industry Scott Throwe 564-7013EPA/310-R-95-018. Transportation Equipment Cleaning Ind. Virginia Lathrop 564-7057
EPA/310-R-97-001. Air Transportation Industry Virginia Lathrop 564-7057EPA/310-R-97-002. Ground Transportation Industry Virginia Lathrop 564-7057EPA/310-R-97-003. Water Transportation Industry Virginia Lathrop 564-7057EPA/310-R-97-004. Metal Casting Industry Jane Engert 564-5021EPA/310-R-97-005. Pharmaceuticals Industry Emily Chow 564-7071EPA/310-R-97-006. Plastic Resin and Manmade Fiber Ind. Sally Sasnett 564-7074EPA/310-R-97-007. Fossil Fuel Electric Power Generation Ind. Rafael Sanchez 564-7028EPA/310-R-97-008. Shipbuilding and Repair Industry Anthony Raia 564-6045EPA/310-R-97-009. Textile Industry Belinda Breidenbach 564-7022EPA/310-R-97-010. Sector Notebook Data Refresh, 1997 Seth Heminway 564-7017
Shipbuilding and Repair Industry Sector Notebook Project
Sector Notebook Project November 1997iv
Page iv intentionally left blank.

Shipbuilding and Repair Industry Sector Notebook Project
Sector Notebook Project November 1997v
SHIPBUILDING AND REPAIR INDUSTRY(SIC 3731)
TABLE OF CONTENTS
LIST OF FIGURES . . . . . . . . . . . . . . . . . . . . . . . . . . . . . . . . . . . . . . . . . . . . . . . . . . . . . . . . . vii
LIST OF TABLES . . . . . . . . . . . . . . . . . . . . . . . . . . . . . . . . . . . . . . . . . . . . . . . . . . . . . . . . . vii
LIST OF ACRONYMS . . . . . . . . . . . . . . . . . . . . . . . . . . . . . . . . . . . . . . . . . . . . . . . . . . . . . viii
I. INTRODUCTION TO THE SECTOR NOTEBOOK PROJECT . . . . . . . . . . . . . . . . . . . . . 1A. Summary of the Sector Notebook Project . . . . . . . . . . . . . . . . . . . . . . . . . . . . . . . . 1B. Additional Information . . . . . . . . . . . . . . . . . . . . . . . . . . . . . . . . . . . . . . . . . . . . . . . 2
II. INTRODUCTION TO THE SHIPBUILDING AND REPAIR INDUSTRY . . . . . . . . . . . . 3A. Introduction, Background, and Scope of the Notebook . . . . . . . . . . . . . . . . . . . . . . 3B. Characterization of the Shipbuilding and Repair Industry . . . . . . . . . . . . . . . . . . . . . 3
1. Product Characterization . . . . . . . . . . . . . . . . . . . . . . . . . . . . . . . . . . . . . . . . 32. Industry Size and Geographic Distribution . . . . . . . . . . . . . . . . . . . . . . . . . . . 63. Economic Trends . . . . . . . . . . . . . . . . . . . . . . . . . . . . . . . . . . . . . . . . . . . . . . 9
III. INDUSTRIAL PROCESS DESCRIPTION . . . . . . . . . . . . . . . . . . . . . . . . . . . . . . . . . . . 13A. Industrial Processes in the Shipbuilding and Repair Industry . . . . . . . . . . . . . . . . . . 13
1. Shipyard Layout . . . . . . . . . . . . . . . . . . . . . . . . . . . . . . . . . . . . . . . . . . . . . 132. Docking and Launching Facilities . . . . . . . . . . . . . . . . . . . . . . . . . . . . . . . . . 143. Ship Construction Processes . . . . . . . . . . . . . . . . . . . . . . . . . . . . . . . . . . . . 164. Major Production Facilities . . . . . . . . . . . . . . . . . . . . . . . . . . . . . . . . . . . . . 185. Welding . . . . . . . . . . . . . . . . . . . . . . . . . . . . . . . . . . . . . . . . . . . . . . . . . . . . 196. Ship Repairing Processes . . . . . . . . . . . . . . . . . . . . . . . . . . . . . . . . . . . . . . . 207. Support Shops and Services . . . . . . . . . . . . . . . . . . . . . . . . . . . . . . . . . . . . . 218. Solvent Cleaning and Degreasing . . . . . . . . . . . . . . . . . . . . . . . . . . . . . . . . . 239. Surface Preparation . . . . . . . . . . . . . . . . . . . . . . . . . . . . . . . . . . . . . . . . . . . 2410. Painting Processes . . . . . . . . . . . . . . . . . . . . . . . . . . . . . . . . . . . . . . . . . . . 28
B. Raw Material Inputs and Pollutant Outputs . . . . . . . . . . . . . . . . . . . . . . . . . . . . . . . 331. Surface Preparation . . . . . . . . . . . . . . . . . . . . . . . . . . . . . . . . . . . . . . . . . . . 332. Painting . . . . . . . . . . . . . . . . . . . . . . . . . . . . . . . . . . . . . . . . . . . . . . . . . . . . 343. Metal Plating and Surface Finishing . . . . . . . . . . . . . . . . . . . . . . . . . . . . . . . 354. Fiberglass Reinforced Construction . . . . . . . . . . . . . . . . . . . . . . . . . . . . . . . 365. Machining and Metalworking . . . . . . . . . . . . . . . . . . . . . . . . . . . . . . . . . . . 366. Solvent Cleaning and Degreasing . . . . . . . . . . . . . . . . . . . . . . . . . . . . . . . . . 37
C. Management of Chemicals in Wastestream . . . . . . . . . . . . . . . . . . . . . . . . . . . . . . . 40

Shipbuilding and Repair Industry Sector Notebook Project
Sector Notebook Project November 1997vi
IV. CHEMICAL RELEASE AND TRANSFER PROFILE . . . . . . . . . . . . . . . . . . . . . . . . . . 43A. EPA Toxic Release Inventory for the Shipbuilding and Repair Industry . . . . . . . . . 47B. Summary of Selected Chemicals Released . . . . . . . . . . . . . . . . . . . . . . . . . . . . . . . . 52C. Other Data Sources . . . . . . . . . . . . . . . . . . . . . . . . . . . . . . . . . . . . . . . . . . . . . . . . 57D. Comparison of Toxic Release Inventory Between Selected Industries . . . . . . . . . . . 59
V. POLLUTION PREVENTION OPPORTUNITIES . . . . . . . . . . . . . . . . . . . . . . . . . . . . . . 63A. Surface Preparation . . . . . . . . . . . . . . . . . . . . . . . . . . . . . . . . . . . . . . . . . . . . . . . . 64B. Painting and Coating . . . . . . . . . . . . . . . . . . . . . . . . . . . . . . . . . . . . . . . . . . . . . . . 65
1. Application Equipment . . . . . . . . . . . . . . . . . . . . . . . . . . . . . . . . . . . . . . . . 652. Alternative Coatings . . . . . . . . . . . . . . . . . . . . . . . . . . . . . . . . . . . . . . . . . . 693. Good Operating Practices . . . . . . . . . . . . . . . . . . . . . . . . . . . . . . . . . . . . . . 70
C. Metal Plating and Surface Finishing . . . . . . . . . . . . . . . . . . . . . . . . . . . . . . . . . . . . 71D. Fiberglass Reinforced Construction . . . . . . . . . . . . . . . . . . . . . . . . . . . . . . . . . . . . 72E. Solvent Cleaning and Degreasing . . . . . . . . . . . . . . . . . . . . . . . . . . . . . . . . . . . . . . . 73F. Machining and Metalworking . . . . . . . . . . . . . . . . . . . . . . . . . . . . . . . . . . . . . . . . . 78
VI. SUMMARY OF FEDERAL STATUTES AND REGULATIONS . . . . . . . . . . . . . . . . . . 81A. General Description of Major Statutes . . . . . . . . . . . . . . . . . . . . . . . . . . . . . . . . . . 81B. Industry Specific Requirements . . . . . . . . . . . . . . . . . . . . . . . . . . . . . . . . . . . . . . . . 93C. Pending and Proposed Regulatory Requirements . . . . . . . . . . . . . . . . . . . . . . . . . . 97
VII. COMPLIANCE AND ENFORCEMENT HISTORY . . . . . . . . . . . . . . . . . . . . . . . . . . . 99A. Shipbuilding and Repair Industry Compliance History . . . . . . . . . . . . . . . . . . . . . . 103B. Comparison of Enforcement and Compliance Activity Between Selected Industries
. . . . . . . . . . . . . . . . . . . . . . . . . . . . . . . . . . . . . . . . . . . . . . . . . . . . . . . . . . . 105C. Review of Major Legal Actions . . . . . . . . . . . . . . . . . . . . . . . . . . . . . . . . . . . . . . 110
1. Review of Major Cases . . . . . . . . . . . . . . . . . . . . . . . . . . . . . . . . . . . . . . . . 1102. Supplementary Environmental Projects (SEPs) . . . . . . . . . . . . . . . . . . . . . . 110
VIII. COMPLIANCE ASSURANCE ACTIVITIES AND INITIATIVES . . . . . . . . . . . . . . 111A. Sector-related Environmental Programs and Activities . . . . . . . . . . . . . . . . . . . . . . 111B. EPA Voluntary Programs . . . . . . . . . . . . . . . . . . . . . . . . . . . . . . . . . . . . . . . . . . . 114C. Trade Associations . . . . . . . . . . . . . . . . . . . . . . . . . . . . . . . . . . . . . . . . . . . . . . . . 120
IX. CONTACTS/ACKNOWLEDGMENTS/RESOURCE MATERIALS . . . . . . . . . . . . . . . 123
Appendix A: Instructions for downloading this notebook . . . . . . . . . . . . . . . . . . . . . . . . . . . . A-1

Shipbuilding and Repair Industry Sector Notebook Project
Sector Notebook Project November 1997vii
LIST OF FIGURES
Figure 1: Profiles of Ship Types . . . . . . . . . . . . . . . . . . . . . . . . . . . . . . . . . . . . . . . . . . . . . . . . . 5Figure 2: Geographic Distribution of Shipyards . . . . . . . . . . . . . . . . . . . . . . . . . . . . . . . . . . . . . 8Figure 3: Example Shipyard Layout . . . . . . . . . . . . . . . . . . . . . . . . . . . . . . . . . . . . . . . . . . . . . 15Figure 4: General Ship Manufacturing Levels . . . . . . . . . . . . . . . . . . . . . . . . . . . . . . . . . . . . . . 17Figure 5: Typical Pickling Tank Arrangement . . . . . . . . . . . . . . . . . . . . . . . . . . . . . . . . . . . . . 27Figure 6: Summary of TRI Releases and Transfers by Industry . . . . . . . . . . . . . . . . . . . . . . . . . 60
LIST OF TABLES
Table 1: Facility Size Distribution for the Shipbuilding and Repair Industry . . . . . . . . . . . . . . . . 7Table 2: Top U.S. Companies with Shipbuilding and Repair Operations . . . . . . . . . . . . . . . . . . . 9Table 3: Material Inputs and Potential Pollutant Outputs for the Shipbuilding and Repair Industry . . . . . . . . . . . . . . . . . . . . . . . . . . . . . . . . . . . . . . . . 39Table 4: Source Reduction and Recycling Activity for Shipyards . . . . . . . . . . . . . . . . . . . . . . . 41Table 5: 1995 TRI Releases for Shipbuilding and Repair Facilities . . . . . . . . . . . . . . . . . . . . . . 49Table 6: 1995 TRI Transfers for Shipbuilding and Repair Facilities . . . . . . . . . . . . . . . . . . . . . 50Table 7:Top 10 TRI Releasing Shipbuilding and Repair Facilities Reporting Only SIC 3731 . . 51Table 8: Top 10 TRI Releasing Facilities Reporting Only SIC 3731
or SIC 3731 and Other SIC codes . . . . . . . . . . . . . . . . . . . . . . . . . . . . . . . . . . . . . . 52Table 9: Air Pollutant Releases (tons/year) . . . . . . . . . . . . . . . . . . . . . . . . . . . . . . . . . . . . . . . . 58Table 10: Toxics Release Inventory Data for Selected Industries . . . . . . . . . . . . . . . . . . . . . . . 61Table 11: Five-Year Enforcement and Compliance Summary for the
Shipbuilding and Repair Industry . . . . . . . . . . . . . . . . . . . . . . . . . . . . . . . . . . . . . . 103Table 12: Five-Year Enforcement and Compliance Summary for Selected Industries . . . . . . . 106Table 13: One-Year Enforcement and Compliance Summary for Selected Industries . . . . . . . 107Table 14: Five-Year Inspection and Enforcement Summary by Statute for Selected Industries 108Table 15: One-Year Inspection and Enforcement Summary by Statute for Selected Industries 109Table 16: Shipbuilding and Repair Industry Participation in the 33/50 Program . . . . . . . . . . . 115

Shipbuilding and Repair Industry Sector Notebook Project
Sector Notebook Project November 1997viii
LIST OF ACRONYMS
AFS - AIRS Facility Subsystem (CAA database)AIRS - Aerometric Information Retrieval System (CAA database)BIFs - Boilers and Industrial Furnaces (RCRA)BOD - Biochemical Oxygen Demand CAA - Clean Air ActCAAA - Clean Air Act Amendments of 1990CERCLA - Comprehensive Environmental Response, Compensation, and Liability ActCERCLIS - CERCLA Information SystemCFCs - ChlorofluorocarbonsCO - Carbon Monoxide COD - Chemical Oxygen Demand CSI - Common Sense Initiative CWA - Clean Water ActD&B - Dun and Bradstreet Marketing IndexELP - Environmental Leadership Program EPA - United States Environmental Protection AgencyEPCRA - Emergency Planning and Community Right-to-Know Act FIFRA - Federal Insecticide, Fungicide, and Rodenticide ActFINDS - Facility Indexing SystemHAPs - Hazardous Air Pollutants (CAA)HSDB - Hazardous Substances Data Bank IDEA - Integrated Data for Enforcement AnalysisLDR - Land Disposal Restrictions (RCRA)LEPCs - Local Emergency Planning Committees MACT - Maximum Achievable Control Technology (CAA)MCLGs - Maximum Contaminant Level Goals MCLs - Maximum Contaminant Levels MEK - Methyl Ethyl KetoneMSDSs - Material Safety Data Sheets NAAQS - National Ambient Air Quality Standards (CAA)NAFTA - North American Free Trade Agreement NCDB - National Compliance Database (for TSCA, FIFRA, EPCRA)NCP - National Oil and Hazardous Substances Pollution Contingency Plan NEIC - National Enforcement Investigation Center NESHAP - National Emission Standards for Hazardous Air PollutantsNO - Nitrogen Dioxide2
NOV - Notice of Violation NO - Nitrogen OxidesX
NPDES - National Pollution Discharge Elimination System (CWA)NPL - National Priorities List NRC - National Response Center

Shipbuilding and Repair Industry Sector Notebook Project
Sector Notebook Project November 1997ix
NSPS - New Source Performance Standards (CAA)OAR - Office of Air and RadiationOECA - Office of Enforcement and Compliance AssuranceOPA - Oil Pollution ActOPPTS - Office of Prevention, Pesticides, and Toxic SubstancesOSHA - Occupational Safety and Health Administration OSW - Office of Solid WasteOSWER - Office of Solid Waste and Emergency ResponseOW - Office of WaterP2 - Pollution PreventionPCS - Permit Compliance System (CWA Database)POTW - Publicly Owned Treatments Works RCRA - Resource Conservation and Recovery ActRCRIS - RCRA Information SystemSARA - Superfund Amendments and Reauthorization Act SDWA - Safe Drinking Water ActSEPs - Supplementary Environmental Projects SERCs - State Emergency Response Commissions SIC - Standard Industrial Classification SO - Sulfur Dioxide 2
SO - Sulfur OxidesX
TOC - Total Organic Carbon TRI - Toxic Release InventoryTRIS - Toxic Release Inventory System TCRIS - Toxic Chemical Release Inventory SystemTSCA - Toxic Substances Control ActTSS - Total Suspended Solids UIC - Underground Injection Control (SDWA)UST - Underground Storage Tanks (RCRA)VOCs - Volatile Organic Compounds
Shipbuilding and Repair Industry Sector Notebook Project
Sector Notebook Project November 1997x
Page x intentionally left blank.

Shipbuilding and Repair Industry Sector Notebook Project
Sector Notebook Project November 19971
SHIPBUILDING AND REPAIR INDUSTRY(SIC 3731)
I. INTRODUCTION TO THE SECTOR NOTEBOOK PROJECT
I.A. Summary of the Sector Notebook Project
Integrated environmental policies based upon comprehensive analysis of air,water, and land pollution are a logical supplement to traditional single-mediaapproaches to environmental protection. Environmental regulatory agenciesare beginning to embrace comprehensive, multi-statute solutions to facilitypermitting, enforcement and compliance assurance, education/ outreach,research, and regulatory development issues. The central concepts driving thenew policy direction are that pollutant releases to each environmental medium(air, water, and land) affect each other, and that environmental strategies mustactively identify and address these inter-relationships by designing policies forthe "whole" facility. One way to achieve a whole facility focus is to designenvironmental policies for similar industrial facilities. By doing so,environmental concerns that are common to the manufacturing of similarproducts can be addressed in a comprehensive manner. Recognition of theneed to develop the industrial “sector-based” approach within the EPA Officeof Compliance led to the creation of this document.
The Sector Notebook Project was originally initiated by the Office ofCompliance within the Office of Enforcement and Compliance Assurance(OECA) to provide its staff and managers with summary information foreighteen specific industrial sectors. As other EPA offices, states, the regulatedcommunity, environmental groups, and the public became interested in thisproject, the scope of the original project was expanded to its current form.The ability to design comprehensive, common sense environmental protectionmeasures for specific industries is dependent on knowledge of several inter-related topics. For the purposes of this project, the key elements chosen forinclusion are: general industry information (economic and geographic); adescription of industrial processes; pollution outputs; pollution preventionopportunities; Federal statutory and regulatory framework; compliancehistory; and a description of partnerships that have been formed betweenregulatory agencies, the regulated community, and the public.
For any given industry, each topic listed above could alone be the subject ofa lengthy volume. However, in order to produce a manageable document, thisproject focuses on providing summary information for each topic. Thisformat provides the reader with a synopsis of each issue, and references wheremore in-depth information is available. Text within each profile wasresearched from a variety of sources, and was usually condensed from moredetailed sources pertaining to specific topics. This approach allows for a widecoverage of activities that can be further explored based upon the citations

Shipbuilding and Repair Industry Sector Notebook Project
Sector Notebook Project November 19972
and references listed at the end of this profile. As a check on the informationincluded, each notebook went through an external review process. The Officeof Compliance appreciates the efforts of all those that participated in thisprocess and enabled us to develop more complete, accurate and up-to-datesummaries. Many of those who reviewed this notebook are listed as contactsin Section IX and may be sources of additional information. The individualsand groups on this list do not necessarily concur with all statements within thisnotebook.
I.B. Additional Information
Providing Comments
OECA’s Office of Compliance plans to periodically review and update thenotebooks and will make these updates available both in hard copy andelectronically. If you have any comments on the existing notebook, or if youwould like to provide additional information, please send a hard copy andcomputer disk to the EPA Office of Compliance, Sector Notebook Project,401 M St., SW (2223-A), Washington, DC 20460. Comments can also beuploaded to the Enviro$en$e World Wide Web for general access to all usersof the system. Follow instructions in Appendix A for accessing this system.Once you have logged in, procedures for uploading text are available from theon-line Enviro$en$e Help System.
Adapting Notebooks to Particular Needs
The scope of the industry sector described in this notebook approximates thenational occurrence of facility types within the sector. In many instances,industries within specific geographic regions or states may have uniquecharacteristics that are not fully captured in these profiles. The Office ofCompliance encourages state and local environmental agencies and othergroups to supplement or re-package the information included in this notebookto include more specific industrial and regulatory information that may beavailable. Additionally, interested states may want to supplement the"Summary of Applicable Federal Statutes and Regulations" section with stateand local requirements. Compliance or technical assistance providers mayalso want to develop the "Pollution Prevention" section in more detail. Pleasecontact the appropriate specialist listed on the opening page of this notebookif your office is interested in assisting us in the further development of theinformation or policies addressed within this volume. If you are interested inassisting in the development of new notebooks for sectors not covered in theoriginal eighteen, please contact the Office of Compliance at 202-564-2395.

Shipbuilding and Repair Industry Introduction
Sector Notebook Project November 19973
II. INTRODUCTION TO THE SHIPBUILDING AND REPAIR INDUSTRY
This section provides background information on the size, geographicdistribution, employment, production, sales, and economic condition of theship building and repair industry. Facilities described within this document aredescribed in terms of their Standard Industrial Classification (SIC) codes.
II.A. Introduction, Background, and Scope of the Notebook
The shipbuilding and repair industry builds and repairs ships, barges, and otherlarge vessels, whether self-propelled or towed by other craft. The industryalso includes the conversion and alteration of ships and the manufacture ofoffshore oil and gas well drilling and production platforms. The shipbuildingand repair industry described in this notebook is categorized by the Office ofManagement and Budget (OMB) under the Standard Industrial Classification(SIC) code 3731. This notebook does not cover the related sector SIC 3732Boat Building and Repairing. The boat building and repair industry isengaged in the manufacturing and repairing of smaller non-ocean goingvessels primarily used for recreation, fishing, and personnel transport. OMBis in the process of changing the SIC code system to a system based on similarproduction processes called the North American Industrial ClassificationSystem (NAICS). (In the NAIC system, shipbuilding and repair facilities areall classified as NAIC 336611.)
II.B. Characterization of the Shipbuilding and Repair Industry
Shipyards, or facilities that build and/or repair ships, operate on a job basis.With the exception of about nine U.S. Navy owned shipyards (which are notincluded in SIC 3731), the U.S. shipbuilding and repair industry is privatelyowned. Unlike most other industries, each year only a small number ofvaluable orders are received that often take years to fill. Orders for ships andship repairs are primarily placed by companies or the federal government.Companies that place orders often include commercial shipping companies,passenger and cruise companies, ferry companies, petrochemical companies,commercial fishing companies, and towing and tugboat companies. Theprincipal federal government agencies placing shipbuilding and repair ordersinclude the Naval Sea Systems Command, the Military Sealift Command, theArmy Corps of Engineers, the U.S. Coast Guard, the National Oceanic andAtmospheric Administration, the National Science Foundation, and theMaritime Administration.
II.B.1. Product Characterization
Shipyards are often categorized into a few basic subdivisions either by type ofoperations (shipbuilding or ship repairing), by type of ship (commercial ormilitary), and shipbuilding or repairing capacity (first-tier or second-tier).

Shipbuilding and Repair Industry Introduction
Sector Notebook Project November 19974
Ships themselves are often classified by their basic dimensions, weight(displacement), load-carrying capacity (deadweight), or their intended service.In the U.S., there are considerable differences between shipyard operationswhen constructing ships for commercial purposes and when constructing shipsfor the military.
Commercial Ships
An important difference between commercial ships and military ships is thatthe commercial ship market is much more cost competitive. Unlike themilitary market, the commercial ship market must also competeinternationally. The cost of building and maintaining a ship must be lowenough such that the owners can make a reasonable profit. This has asignificant impact on the manner in which commercial ships are built andrepaired. The intense global competition in this industry is the main reasonthat since World War II, U.S. shipyards have produced relatively fewcommercial ships. In this regard, since 1981 the U.S. shipyards received lessthan one percent of all commercial orders for large ocean going vessels in theworld, and no commercial orders for large ocean going cruise ships (ASA,1997).
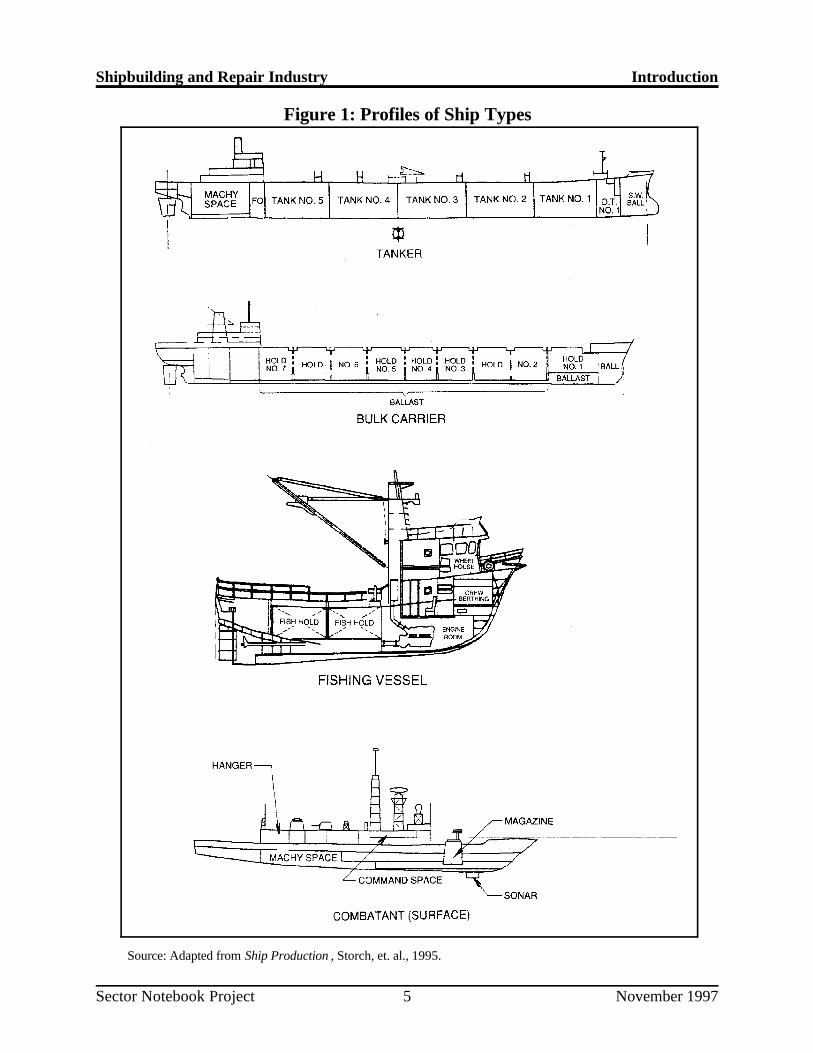
Commercial ships can be subdivided into a number of classes based on theirintended use. Commercial ship classes include dry cargo ships, tankers, bulkcarriers, passenger ships, fishing vessels, industrial vessels, and others (Storchet al., 1995). Dry cargo ships include break bulk, container, and roll-on/roll-off types. Profiles of a number of ship types are shown in Figure 1.
Military Ships
Military ship orders have been the mainstay of the industry for many years.The military ship market differs from the commercial market in that the majormarket drivers are agency budgets as set by government policy.
The military ship market can be divided into combatant ships and ships thatare ordered by the government, but are built and maintained to commercialstandards rather than military standards. (Storch et al., 1995) Combatantships are primarily ordered by the U.S. Navy and include surface combatants,submarines, aircraft carriers, and auxiliaries. Government owned non-combatant ships are mainly purchased by the Maritime Administration’sNational Defense Reserve Fleet (NDRF) and the Navy’s Military SealiftCommand (MSC). Other government agencies that purchase non-combatantships are the Army Corp of Engineers, National Oceanic and AtmosphericAdministration, and the National Science Foundation. Such ships ofteninclude cargo ships, transport ships, roll on/roll off ships, crane ships, tankers,patrol ships, and ice breakers.
Shipbuilding and Repair Industry Introduction
Sector Notebook Project November 19975
Source: Adapted from Ship Production , Storch, et. al., 1995.
Figure 1: Profiles of Ship Types

Shipbuilding and Repair Industry Introduction
Sector Notebook Project November 19976
Ship Repairing
Ship repair operations include repainting, overhauls, ship conversions, andalterations. Almost all shipyards that construct new ships also do major shiprepairs. In addition, about 200 shipyards concentrate solely on ship repairingand do not have the necessary facilities to construct ships (Storch et. al.,1995). Only about 31 shipyards have “major dry-docking facilities” capableof removing ships over 122 meters in length from the water (MARAD, 1995).Dry-docking facilities, or “full service” repair yards, allow repairs andmaintenance below a ship’s water line. The remaining repair yards can eitherdry-dock vessels under 122 meters or have no dry-docking facilities.Shipyards with no dry-docking facilities, called topside yards, perform above-water ship and barge repairs. Such facilities generally employ fewer than 100people and are often capable of transporting workers and materials to the ship(Storch et al., 1995).
First and Second-Tier Shipyards
U.S. shipyards are also classified by MARAD as either first-tier shipyards orsecond-tier shipyards. First-tier shipyards make up the “U.S. majorshipbuilding base” (MSB). As defined by MARAD and the Department ofTransportation in “Report on Survey of U.S. Shipbuilding and RepairFacilities,” 1995, the MSB is comprised of privately owned shipyards that areopen and have at least one shipbuilding position capable of accommodatinga vessel of 122 meters (383 feet) or more. With few exceptions, theseshipyards are also major repair facilities with drydocking capabilities (U.S.Industrial Outlook, 1994). In 1996 there were 16 of these major shipbuildingfacilities in the U.S.
Second-tier shipyards are comprised of the many small and medium-sizeshipyards that construct and repair smaller vessels (under 122 meters) such asmilitary and non-military patrol boats, fire and rescue vessels, casino boats,water taxis, tug and towboats, off-shore crew and supply boats, ferries, fishingboats, and shallow draft barges (MARAD, 1996). A number of second-tiershipyards are also able to make topside repairs to ships over 122 meters inlength.
II.B.2. Industry Size and Geographic Distribution
According to the 1992 Census of Manufacturers data (the most recent Censusdata available), there were approximately 598 shipbuilding and repairing yardsunder SIC code 3731. The payroll for this year totaled $3.6 billion for aworkforce of 118,000 employees, and value of shipments totaled $10.6billion. Based on the Census of Manufacturers data, the industry is very laborintensive. The value of shipments per employee (a measure of laborintensiveness) is $90,000, which is about one third that of the steel

Shipbuilding and Repair Industry Introduction
Sector Notebook Project November 19977
manufacturing industry ($245,000 per employee) and only five percent thatof the petroleum refining industry ($1.8 million per employee).
According to the Census of Manufacturers, most shipyards are small. About72 percent of the shipyards employ fewer than 50 people in 1992 (see Table1). It is the relatively few (but large) shipyards, however, that account for themajority of the industry’s employment and sales. Less than five percent of theshipyards account for almost 80 percent of the industry’s employment andsales.
Table 1: Facility Size Distribution for the Shipbuilding and Repair Industry
Employeesper Facility
Facilities Employees
Number of Percentage of Number of Percentage ofFacilities Facilities Employees Employees
1-9 230 38% 900 1%
10-49 203 34% 4,600 4%
50-249 113 19% 12,900 11%
250-499 25 4% 8,200 7%
500-2499 21 4% 17,100 14%
2500 or more 6 1% 74,600 63%
Total 598 100% 118,300 100%
Source: U.S. Department of Commerce, Census of Manufacturers, 1992.
Geographic Distribution
The geographic distribution of the shipbuilding and repair industry isconcentrated on the coasts. Other important areas are the southernMississippi River and Great Lakes regions. According to the 1992 U.S.Census of Manufacturers, there are shipyards in 24 states. The top states inorder are: Florida, California, Louisiana, Texas, Washington, and Virginia.Together, these states account for about 56 percent of U.S. shipyards. Figure2 shows the U.S. distribution of facilities based on data from the Census ofManufacturers.

0 - 5
36 - 70
21 - 35
6 - 20
Shipbuilding and Repair Industry Introduction
Sector Notebook Project November 19978
Figure 2: Geographic Distribution of Shipyards
Source: U.S. Census of Manufacturers, 1992.
Dun & Bradstreet’s Million Dollar Directory, compiles financial data on U.S.companies including those operating within the shipbuilding and repairindustry. Dun & Bradstreet ranks U.S. companies, whether they are a parentcompany, subsidiary or division, by sales volume within their assigned 4-digitSIC code. Readers should note that: (1) companies are assigned a 4-digitSIC that resembles their principal industry most closely; and (2) sales figuresinclude total company sales, including subsidiaries and operations (possiblynot related to shipbuilding and repair). Additional sources of companyspecific financial information include Standard & Poor’s Stock ReportServices, Ward’s Business Directory of U.S. Private and Public Companies,Moody’s Manuals, and annual reports.

Shipbuilding and Repair Industry Introduction
Sector Notebook Project November 19979
Table 2: Top U.S. Companies with Shipbuilding and Repair Operations
Rank Company (millions of dollars)a b1996 Sales
1 Newport News Shipbuilding and Dry Dock Co. 1,756Newport News, VA
2 Ingalls Shipbuilding Inc. - Pascagoula, MS 1,125
3 General Dynamics Corp. (Electric Boat) - Groton, CT 980
4 Bath Iron Works Corp. - Bath, ME 850
5 Avondale Industries Inc., Shipyards Division 576New Orleans, LA
6 National Steel and Shipbuilding Co. (NASSCO) 500San Diego, CA
7 Trinity Marine Group - Gulfport, MS 400
8 Norfolk Shipbuilding and Drydock Corp. - Norfolk, VA 212
9 American Commercial Marine Service Co. - 166Jeffersonville, IN
10 Atlantic Marine - Jacksonville, FL 121
Note: Not all sales can be attributed to the companies’ shipbuilding and repair operations.a
Companies shown listed SIC 3731. b
Source: Dunn & Bradstreet’s Million Dollar Directory - 1996.
II.B.3. Economic Trends
General Economic Health
In general, the U.S. shipbuilding and repair industry is in a depressed state.At its height in the mid-1970s, the industry held a significant portion of theinternational commercial market while maintaining its ability to supply allmilitary orders. Since then, new ship construction, the number of shipbuildingand repair yards, and overall industry employment have decreased sharply.The decline has been especially severe in the construction of commercialvessels at first tier shipyards which fell from about 77 ships (1,000 gross tonsor more) per year in the mid-1970s to only about eight ships total through thelate 1980s and early 1990s. In the 1980s, the industry’s loss of thecommercial market share was somewhat offset by a substantial increase inmilitary ship orders. Following the naval expansion, however, the industry

Shipbuilding and Repair Industry Introduction
Sector Notebook Project November 199710
entered the 1990s with a much smaller military market and a negligible shareof the commercial market.
The second tier shipyards and the ship repairing segment of the industry hasalso suffered in recent decades; however, its decline has not been as drastic.The second tier shipyards, comprised of small and medium size facilities, wereable to keep much of their mainly commercial market share. These shipyardsbuild vessels used on the inland and coastal waterways which by law must bebuilt in the U.S.
The U.S. shipbuilding and repairing industry’s loss of the commercialshipbuilding market has been attributed to a number of factors. First, a worldwide shipbuilding boom in the 1970s created a large quantity of surplustonnage which suppressed demand for years. Another significant factorreducing U.S. shipbuilding and repair industry’s ability to competeinternationally are the substantial subsidies that many nations provide to theirdomestic shipbuilding and repair industries. Also, until 1980, over 40 percentof U.S.-built merchant ships received Construction Differential Subsidies(CDS) based on the difference between foreign and domestic shipbuildingcosts. The program was eliminated in 1981, further reducing the industry’scompetitiveness.
Another trend in the industry has been a movement toward consolidation. Inrecent years many shipyards have been closed or purchased by larger shipbuilding and repair companies.
Government Influences
The U.S. shipbuilding and repair industry is highly dependent on the FederalGovernment, its primary market, for its continued existence. Direct purchasesof military ships and military ship repair services by the Federal Governmentaccount for about 80 percent of the industry’s sales (Census ofManufacturers, 1992). In addition, the industry receives a small amount ofsupport through a few federal tax incentives and financing assistanceprograms.
MARAD provides assistance to U.S. ship owners through the Federal ShipMortgage Insurance (Title XI) and Capital Construction Fund programs.Under Title XI, the Federal Government guarantees repayment of privatesector mortgage obligations for operators that purchase ships from U.S.shipyards. Although the Capital Construction Fund has not been funded inrecent years, in the past it has allowed operators to establish tax-deferredfunds for procuring new or reconstructed vessels from U.S. shipyards (U.S.Industrial Outlook, 1994). Another program, MARITECH, is jointly fundedby the Federal Government and industry and is administered by theDepartment of Defense’s Advanced Research Projects Agency (ARPA), in

Shipbuilding and Repair Industry Introduction
Sector Notebook Project November 199711
collaboration with MARAD. MARITECH provides matching Governmentfunds to encourage the shipbuilding industry to direct and lead in thedevelopment and application of advanced technology to improve itscompetitiveness and to preserve its industrial base. (For more information onMARITECH, see Section VIII.A.)
Such outside support is not unique to the U.S. Worldwide, many nationsprovide substantial subsidies to their shipbuilding and repair industries. Thegovernments of most trading nations support their domestic industries becausethey believe that it is in their best interest economically and militarily.Maintaining a shipbuilding industrial base helps to safeguard a nation’s controlover getting its products to foreign markets, and ensures that it will have themeans to replace its merchant or naval fleets in a time of national emergency.As a result of these external influences, the industry does not behaveaccording to the simple economic supply and demand model. Rather, thepolicies of national governments in conjunction with economic forces dictateeconomic activity in this sector.
Like many other nations, the U.S. has a policy of maintaining a shipbuildingand repair industrial base that can be expanded in time of war (Storch, et al.,1995). National policy, therefore, will continue to be the primary factorinfluencing the industry’s economic trends in the U.S.
Domestic Market
The military still is, and will continue to be, the primary source of work for theindustry. However, the Navy’s new ship procurement has sharply declinedsince the accelerated Navy ship construction in the 1980s. This work isexpected to continue to decline at least through the remainder of the 1990s.Some industry analysts predict that a number of the first tier shipyards, whichfill most of the military orders, will close in coming years.
While military shipbuilding is on the decline, the forecast for the commercialsector is more promising. Domestic demand for commercial shipbuilding andrepair has increased dramatically in recent years and is expected to continueto increase throughout the 1990s. There have been significant increases inbarge construction in recent years. In 1996, 1,070 hopper barges weredelivered by U.S. shipyards, more than double the number delivered in 1995.This number is expected to grow to over 1,500 in 1997. Demand is alsoexpected to be particularly high for tankers; especially for new double-hulltankers in response to the 1990 Oil Pollution Act requirements.

Shipbuilding and Repair Industry Introduction
Sector Notebook Project November 199712
International Market
Currently, the U.S. holds less than one half of one percent of the world marketshare of commercial shipbuilding and repair. South Korea and Japan currentlydominate the world market. Each holds about 30 percent of the grosstonnage of merchant ships on order. Germany, Poland, Italy, and China eachhold between four and five percent of the commercial market. However, anumber of major commercial ship orders were received by first and second tiershipyards in 1995 and 1996. The chief driving forces for this increase in U.S.commercial ship production is a general increase in worldwide demandstemming from an aging merchant fleet and an improving global economy.The elevated demand is expected to continue over the next three to five years.
Through the OECD in December 1994, an agreement was reached by theCommission of the European Communities, and the Governments of Finland,Japan, South Korea, Norway, Sweden and the United States to establish morenormal competitive conditions in the shipbuilding industry. The agreement isexpected to remove government support and unfair pricing practices in theindustry. If and when this agreement is implemented, it is expected to havea positive impact on the world market by discouraging “ship dumping”practices that are believed to have been damaging shipbuilders. It is hopedthat the agreement will also bring to light the actual economic advantage andcompetitiveness of the various countries and individual ship builders. Inaddition, the shipowners will no longer be able to buy ships at subsidized ordumped prices reducing the likelihood of speculative buying.
Recognizing the unique need for the Administration, Congress and theshipbuilding industry to work together in order for the U.S. to becomecompetitive once again in the international shipbuilding market, PresidentClinton submitted a Report to Congress entitled “Strengthening America’sShipyards: A Plan for Competing in the International Market.” In that report,the President outlined a number of steps to be taken “to ensure a successfultransition to a competitive industry in a truly competitive marketplace.” TheAdministration’s five step plan included:
Ensuring Fair International CompetitionImproving CompetitivenessEliminating Unnecessary Government RegulationFinancing Ship Sales Through Title XI Loan Guarantees, andAssisting International Marketing.

Shipbuilding and Repair Industry Industrial Process Description
Sector Notebook Project November 199713
III. INDUSTRIAL PROCESS DESCRIPTION
This section describes the major industrial processes within the shipbuildingand repair industry, including the materials and equipment used and theprocesses employed. The section is designed for those interested in gaininga general understanding of the industry, and for those interested in the inter-relationship between the industrial process and the topics described insubsequent sections of this profile -- pollutant outputs, pollution preventionopportunities, and Federal regulations. This section does not attempt toreplicate published engineering information that is available for this industry.Refer to Section IX for a list of resource materials and contacts that areavailable.
This section specifically contains a description of commonly used productionprocesses, associated raw materials, the by-products produced or released,and the materials either recycled or transferred off-site. This discussion,coupled with schematic drawings of the identified processes, provide aconcise description of where wastes may be produced in the process. Thissection also describes the potential fate (via air, water, and soil pathways) ofthese waste products.
III.A. Industrial Processes in the Shipbuilding and Repair Industry
The shipbuilding and repair industry has characteristics of both amanufacturing industry and the construction industry. The industry uses andproduces a wide variety of manufactured components in addition to basicconstruction materials. As with the construction industry, shipbuilding andrepair requires many workers with many different skills all working in anestablished organization structure.
New ship construction and ship repairing have many industrial processes incommon. They both apply of essentially the same manufacturing practices,processes, facilities, and support shops. Both ship repair and newconstruction work require highly skilled labor because many of the operations(especially in ship repair) have limited potential for automation. Both requireexcellent planning, engineering, and interdepartmental communications. Newship construction, however, generally requires a greater amount oforganization because of the size of the workforce, size of the workload,number of parts, and the complexity of the communications (e.g., productionplans and schedules) surrounding the shipbuilding work-flow (NSRP, 1993).
III.A.1. Shipyard Layout
Shipbuilding and repair facilities are generally made up of several specificfacilities laid out to facilitate the flow of materials and assemblies. Mostshipyards were built prior to the Second World War. Changes in shipyard

Shipbuilding and Repair Industry Industrial Process Description
Sector Notebook Project November 199714
layout were made piecemeal, responding to advances in technology, demandsfor different types of ships, and availability of land and waterfront. As aresult, there is no typical shipyard layout. There are, however, a number ofspecific facilities that are common to most large shipyards. These facilitiesinclude: drydocks, shipbuilding positions, piers and berthing positions,workshops (e.g., machine, electrical, pipe, assembly, paint and blast,carpenter, and sheet metal shops), work areas (steel storage, platen lines, andconstruction areas), warehouses, and offices. A shipyard layout containingmany of these facilities is shown in Figure 3.
III.A.2. Docking and Launching Facilities
There are few shipyards that have the capability to construct or repair vesselsunder cover; in most cases shipbuilding and repair are done largely out ofdoors. Much of this work is done over, in, under, or around water, which caninadvertently receive a portion of shipyard pollutant outputs. The dockingfacilities, or the mechanisms used to remove ships from the water for repairor to construct and launch ships, can affect waste generation andmanagement.
Ships can be either wet-docked or drydocked. A wet-dock or berth is a pieror a wet slip position that a ship can dock next to and tie up. A ship that hasits entire hull exposed to the atmosphere is said to be drydocked. A numberof different drydocking and launching facilities exist including building ways,floating drydocks, graving docks, and marine railways.
Building Ways
Building ways are used only for building ships and releasing them into theadjacent waters. New ships are constructed and launched from one of twomain types of building ways: longitudinal end launch ways and side launchways (NSRP, 1993).
Floating Drydocks
Floating drydocks are floating vessels secured to land that have the ability tobe lowered under the water’s surface in order to raise ships above the watersurface. Floating drydocks are generally used for ship repair, but in somecases ship construction is performed. When the drydock is submerged byfilling ballast tanks with water, ships are positioned over bilge and keel blockslocated on the deck of the drydock. The ship’s position over the drydock ismaintained while the ballast tanks are pumped out, which raises the dock andthe ship above the water surface (NSRP, 1993).

Shipbuilding and Repair Industry Industrial Process Description
Sector Notebook Project November 199715
Source: Maritime Administration, Report on Survey of U.S. Shipbuilding and Repair Facilities , 1995.
Figure 3: Example Shipyard Layout

Shipbuilding and Repair Industry Industrial Process Description
Sector Notebook Project November 199716
Graving Docks
Graving docks are man-made rectangular bays where water can be let in andpumped out. Ships are floated into the dock area when the dock is full ofwater. Water-tight gates are closed behind the ship and the water is pumpedfrom inside the dock area to the outside adjacent waters. Large pumpingsystems are typically used to remove all but a few inches of the water.Graving docks usually have a sloping dock floor which directs the water tochannels leading to smaller pumps which empty the final few inches of wateras well as any rain or water runoff which enters the dock (NSRP, 1993).
Marine Railways
Marine railways have the ability to retrieve and launch ships. They are similarto end-launch building ways, but usually much smaller. Marine railwaysessentially consist of a rail-car platform and a set of railroad tracks. The railsare secured to an inclined cement slab that runs the full length of the way andinto the water to a depth necessary for docking ships. Motor and pulleysystems are located at the head of marine railways to pull the rail-car platformand ship from the water (NSRP, 1993).
III.A.3. Ship Construction Processes
Most new ship construction projects are carried out using zone-orientedmethods, such as the hull block construction method (HBCM). In HBCM, theship structure is physically divided into a number of blocks. The definition ofhull blocks has an enormous impact on the efficiency of the ship construction.Therefore, blocks are carefully designed to minimize work and to avoidscheduling problems. Blocks are constructed and pieced together in fivegeneral manufacturing levels. Figure 4 summarizes the various manufacturinglevels.
The first level involves the purchasing and handling of raw materials andfabricating these materials into the most basic parts. The primary rawmaterials include steel plates, bars, and structural members. Parts fabricationor pre-assembling operations often involve cutting, shaping, bending,machining, blasting, and painting of these materials. Fabricated parts includesteel plates and steel members used as structural parts, machined parts, piping,ventilation ducts, electrical components (motors, lights, transformers, gauges,etc.), and a wide variety of other miscellaneous parts. Parts fabrication iscarried out throughout the shipyard in a number of different shops and workareas depending on the specific raw materials being handled (see SectionIII.A.7 for a description of typical operations conducted in shipyard shops).
Level 2 of new ship construction involves the joining of different fabricatedparts from Level 1 into assembled parts. In the third level of manufacturing

Shipbuilding and Repair Industry Industrial Process Description
Sector Notebook Project November 199717
Figure 4: General Ship Manufacturing Levels
Source: Adapted from NSRP, Introduction to Production Processes and Facilities in theSteel Shipbuilding and Repair Industry , 1993.
the fabricated and/or assembled parts are fitted together into a sub-blockassembly which are in turn fitted together in Level 4 to form blocks. Blocksare three dimensional sections of the ship and are the largest sections of theship to be assembled away from the erection site. Blocks are designed to bestable configurations that do not require temporary support or reinforcement.Often, at least one side of a block forms part of the outside hull of the ship.Blocks are built and transported through the shipyard and welded together ata building position where the ship is erected. The size of the blocks that ashipyard can build is dependent on the shipyard capacity to assemble,transport, and lift the blocks and units onto the ship under construction. InLevel 5 the ship is erected from the blocks (Storch, 1995).
Another important aspect of ship construction is outfitting. Outfitting, whichinvolves the fabrication and installation of all the parts of a ship that are notstructural in nature, is carried out concurrently with the hull construction.Outfit is comprised of the ship’s plumbing, derricks, masts, engines, pumps,ventilation ducts, electrical cable, stairs, doors, ladders, and other equipment.The basic raw materials include pipes, sheet metal, electrical components, and

Shipbuilding and Repair Industry Industrial Process Description
Sector Notebook Project November 199718
machinery. A zone-oriented method is typically used to assemble the partsthat form major machinery spaces onboard the ship including engine rooms,pump rooms, and auxiliary machinery spaces. Parts or fittings can beassembled onboard the ship during hull erection, on the blocks or subblocks,or independent of the hull structure in units of similar parts (NSRP, 1993).
III.A.4. Major Production Facilities
Most shipbuilding yards have in common the following major facilities, workareas, or specialized equipment.
Prime Line
The prime line is a large machine that blasts and primes (paints) raw steelsheets, preparing them for production. Steel sheets, parts, and shapes enterone end of the prime line, go through a blasting section, then through apriming section. The primer is referred to as construction primer, and is usedto prevent corrosion during the production process. Section III.A.9 discussessurface preparation and coating operations in more detail (NSRP, 1993).
Panel Lines
Panel lines typically consist of motor driven conveyors and rollers used tomove large steel plates together for joining. The use of panel lines introducedmanufacturing production line techniques into the steel shipbuilding industry.Joining of plates involves the welding of the seams either on one side or twosides. Two sided welding requires the panel line to be capable of turning thesteel plates over after one-side is welded. Vertical stiffeners are also weldedon the panel line often using automated welding machines. After welding,excess steel is cut off using gas cutting equipment. Panel assemblies aretypically moved through the line with the aid of magnetic cranes (NSRP,1993).
Platen Lines
The platen lines (or platens) are the area in the shipyard where blocks areassembled. Therefore, platens form assembly lines where the steel structuresof construction blocks are fabricated. Sub-assemblies from the panel line andplate shop are brought together at the platen and assembled into blocks. Theplaten mainly provides locations for sub-assembly construction, block layout,tack-welding, and final weld out. The platen lines are serviced by welding andsteel cutting equipment and cranes for materials movement (NSRP, 1993).

Shipbuilding and Repair Industry Industrial Process Description
Sector Notebook Project November 199719
Rolls
Rolls are large facilities that bend and shape steel plates into curved surfaceplates for the curved portion of the hull. Rolls consist of large cylindrical steelshafts and a motor drive. Rolls vary greatly in size and technology fromshipyard to shipyard. Some of the newer rolls are computer controlled, whilethe older machines are manually operated (NSRP, 1993).
Pin Jigs
Pin jigs are platen lines used to assemble the curved blocks that form theoutside of the hull’s curved surface. The pin jig is simply a series of verticalscrew jacks that support curved blocks during construction. A pin jig is setup specifically for the curved block under construction. The jig heights aredetermined from the ship’s engineering drawings and plans (NSRP, 1993).
Rotary Tables
Rotary tables are facilities that hull blocks are set into and which mechanicallyrotate the block. The ability to easily rotate an entire block in a single locationreduces the number of time-consuming crane lifts that would otherwise beneeded. Rotary tables also exploit the increased efficiencies experienced whenworkers are able to weld on a vertical line (down hand). Down hand weldingprovides a higher quality weld with higher efficiency rates. Turn tables arealso used for outfitting materials on the block because of easier access tooutfitting locations (NSRP, 1993).
Materials Handling
Materials handling is an important aspect of efficient shipbuilding.Considerable coordination is needed between materials delivery and theproduction schedule. Materials need to be delivered to the proper location inthe shipyard at the proper time to be installed on the construction block.Typical materials handling equipment includes conveyors, cranes, industrialvehicles (e.g., forklifts, flatbeds, carts, special lift vehicles, etc.), andcontainers (NSRP, 1993).
III.A.5. Welding
The structural framework of most ships is constructed of various grades ofmild and high strength steel. Aluminum and other nonferrous materials areused for some superstructures (deck-houses) and other areas requiringspecific corrosion resistance and structural requirements. However, othercommon materials such as stainless steel, galvanized steel, and copper nickelalloys, are used in far less quantities than steel (ILO, 1996).

Shipbuilding and Repair Industry Industrial Process Description
Sector Notebook Project November 199720
The primary raw material for ship construction is steel plate. Steel plates aretypically cut to the desired size by automatic burners before being weldedtogether to form the structural components of the vessel.
Shipyard welding processes are performed at nearly every location in theshipyard. The process involves joining metals by bringing the adjoiningsurfaces to extremely high temperatures to be fused together with a moltenfiller material. An electric arc or gas flame are used to heat the edges of thejoint, permitting them to fuse with molten weld fill metal in the form of anelectrode, wire, or rod. There are many different welding techniques used bythe industry. Most welding techniques can be classified as either electric arcor gas welding, with electric arc being the most common (ILO, 1996).
An important factor impacting the strength of welds is arc shielding, isolatingthe molten metal weld pool from the atmosphere. At the extremely hightemperatures used in welding, the molten metal reacts rapidly with oxygen andnitrogen in the atmosphere which decreases the weld strength. To protectagainst this weld impurity and ensure weld quality, shielding from theatmosphere is required. In most welding processes, shielding is accomplishedby addition of a flux, a gas, or a combination of the two. Where a fluxmaterial is used, gases generated by vaporization and chemical reaction at theelectrode tip result in a combination of flux and gas shielding that protect theweld from the atmosphere. The various types of electric arc welding (shieldedmetal arc, submerged arc, gas metal arc, gas tungsten arc, flux core arc, andplasma-arc) all use different methods to accomplish arc shielding (ILO, 1996).
III.A.6. Ship Repairing Processes
Ship repair generally includes all ship conversions, overhauls, maintenanceprograms, major damage repairs, and minor equipment repairs. Althoughspecific repair methods vary from job to job, many of the operations areidentical to new ship construction operations. Repair operations, however,are typically on a smaller scale and are performed at a faster pace. Jobs canlast anywhere from one day to over a year. Repair jobs often have severe timeconstraints requiring work to be completed as quickly as possible in order toget the ships back in service. In many cases, piping, ventilation, electrical, andother machinery are prefabricated prior to the ship’s arrival. Often, repair jobsare an emergency situation with very little warning, which makes ship repaira fast moving and unpredictable environment. Typical maintenance and repairoperations include:
Blasting and repainting the ship’s hull, freeboard, superstructure, andinterior tanks and work areas
Major rebuilding and installation of machinery such as diesel engines,turbines, generators, pump stations, etc.

Shipbuilding and Repair Industry Industrial Process Description
Sector Notebook Project November 199721
Systems overhauls, maintenance, and installation (e.g., piping systemflushing, testing, and installation)
System replacement and new installation of systems such asnavigational systems, combat systems, communication systems,updated piping systems, etc.
Propeller and rudder repairs, modification, and alignment
Creation of new machinery spaces through cut outs of the existingsteel structure and the addition of new walls, stiffeners, vertical,webbing, etc.
In addition, some larger shipyards are capable of large repair and conversionprojects that could include: converting supply ships to hospital ships, cuttinga ship in half and installing a new section to lengthen the ship, replacingsegments of a ship that has run aground, completing rip-out, structuralreconfiguration and outfitting of combat systems, major remodeling of ships’interiors or exteriors (NSRP, 1993).
III.A.7. Support Shops and Services
Shipyards typically have a number of support shops that either processspecific raw materials (e.g., pipes, electric, sheet metal, machinery, plates,paint, etc.) or provide specialty services (e.g., carpentry, maintenance,materials transporting, warehousing, etc.). In many ways, support shops aresmall manufacturers producing goods to support the production effort(NSRP, 1993). Common shipbuilding and repair yard support shops andservices are described below.
Pipe Shop
The pipe shop is responsible for manufacturing and assembling piping systems.Piping systems are the largest outfitting task in shipbuilding. Small pipesections known as “pipe spools” are assembled in the pipe shop andtransported to the stages of construction (i.e., assembly, on-block, on-unit,and on-board). Pipe spools are shaped and manufactured per engineeringdesign, are scheduled for construction, and sent to the various stages forinstallation. Many pipe shops will tag the spools to identify the location forinstallation on the block and ship. A typical ship may have anywhere from10,000 to 25,000 pipe spools. Some of the processes in the pipe shopinclude: pipe welding, pipe bending, flux removal, grit-blast, pickling,painting, galvanizing, and pressure testing. Some of the equipment used bythe pipe shop are as follows: pipe welders, lathes, pipe cutting saws, shears,grinders, chippers, hole cutters, pipe benders, pickling tanks, andtransportation equipment (NSRP, 1993).

Shipbuilding and Repair Industry Industrial Process Description
Sector Notebook Project November 199722
Machine Shop
The machine shop serves the entire shipyard’s machining needs though theexact functions of the shipyard machine shops vary throughout theshipbuilding industry. Shipyard machine shops perform functions rangingfrom rebuilding pumps to turning 25 foot long propeller drive shafts on lathes.Equipment in the machine shop consists of: end mills, lathes, drill presses,milling machines, band saws, large presses, work tables, and cleaning tanks(NSRP, 1993).
Sheet Metal Shop
The sheet metal shop is generally responsible for fabricating and installingventilation ducting and vent spools. Using engineering drawings and specialsheet metal tools this shop produces ventilation systems for new construction,as well as repair work. The shop cuts, shapes, bends, welds, stamps, paints,and performs a variety of manufacturing operations for ship ventilationsystems. Many sheet metal shops are also responsible for assembling largeducting fans and heating and air conditioning components. Sheet metalworkers perform the installation of the ducting in various stages ofconstruction such as on-block, on-unit, onboard (NSRP, 1993).
Electrical Shop
Electrical shops in the shipyard perform a variety of functions throughout theindustry. In many cases, the electrical shop installs, rebuilds, builds, and testselectrical components (e.g., motors, lights, transformers, gauges, etc.). Theelectrical shop electricians also install the electrical equipment on the shipeither on-block or onboard. On-block is where the electrical parts areinstalled and onboard is where cables are routed throughout the shipconnecting the electrical systems together. Electric shops generally haveplating tanks, dip tanks for lacquer coatings, electrical testing equipment, andother specialized equipment (NSRP, 1993).
Foundry/Blacksmith Shop
The blacksmith shop is an older term used for the shipyard shop that performsforging or castings. Forging and casting at shipyards are somewhat rare.Over the years, forging and casting functions have been shifted tosubcontractors off-site. The subcontractors are usually foundries whoseprimary function is forging and casting. Shipyards that have blacksmith shopsmaintain large furnaces and other foundry equipment (NSRP, 1993).

Shipbuilding and Repair Industry Industrial Process Description
Sector Notebook Project November 199723
Plate Shop
The plate shop is a generic term used for the area and process in the shipyardthat provides steel parts cutting, bending, and sub-assembly. The plate shopuses information from engineering drawings to produce plate shapes. Theshapes are cut and formed as needed. Most plate shops have manual andcomputer controlled machinery. The types of machinery commonly found inthe plate shop are cutting machines, steel bending machines and plate bendingrolls, shearing machines, presses, hole punching equipment, and furnaces forheat treatment. The plate shop sends the parts and sub-assemblies that theymanufacture to the stages of construction, or the platen area for installation(NSRP, 1993).
Production Services
Services provided by this department include: carpentry, scaffolding erection,crane operations, rigging, facility and equipment maintenance, and otherproduction support activities. The production services may be grouped intoone department or divided into unique shops for each service provided(NSRP, 1993).
III.A.8. Solvent Cleaning and Degreasing
Solvent cleaning and degreasing are common in the shipbuilding and repairindustry (although many facilities are replacing solvent cleaning anddegreasing with aqueous and alkaline cleaning and degreasing). Solventcleaning and degreasing are typically accomplished by either cold cleaning orvapor degreasing. Cold cleaning refers to operations in which the solvent isused at room temperature. The surfaces or parts are soaked in a tank ofsolvent, or sprayed, brushed, wiped, or flushed with solvent. Diphasecleaning is sometimes used to combine a water rinse before and after thesolvent cleaning into a single step. In diphase cleaning, water insolublehalogenated solvents and water are placed in a single tank where they separatewith the solvent on the bottom. Parts are lowered through the water bathbefore reaching the solvent and then are rinsed through the water level as theyare removed from the tank.
In vapor degreasing, parts and surfaces are cleaned with a hot solvent vapor.Solvent in a specially designed tank is boiled creating a solvent vapor in theupper portion of the tank. The parts are held in the vapor zone where solventvapor condenses on the surface removing dirt and oil as it drips back into theliquid solvent. In this way, only clean solvent vapors come in contact with thepart. A condensing coils at the top of the tank reduces the amounts ofsolvents escaping to the atmosphere (NSRP, 1993).
Shipbuilding and Repair Industry Industrial Process Description
Sector Notebook Project November 199724
III.A.9. Surface Preparation
To a large extent, the effectiveness of the surface coating relies on the qualityof surface preparation. All paints will fail eventually, but the majority ofpremature failures are due to loss of adhesion caused by improper surfacepreparation. Surface preparation is also typically one of the most significantsources of shipyard wastes and pollutant outputs. Section III.B.1 discusseswaste generation and pollution outputs from these operations.
Surface preparation techniques are used to remove surface contaminants suchas mill scale, rust, dirt, dust, salts, old paint, grease, and flux. Contaminantsthat remain on the surface are the primary causes of premature failure ofcoating systems. Depending on the surface location, contaminants, andmaterials, a number of different surface preparation techniques are used in theshipbuilding and repair industry:
Solvent, Detergent, and Steam CleaningBlasting Hand Tool PreparationWet Abrasive Blasting and Hydroblasting Chemical Preparation
Solvent, Detergent, and Steam Cleaning
The process of removing grease, oil and other contaminants with the aid ofsolvents, emulsions, detergents, and other cleaning compounds is frequentlyused for surface preparation in the shipbuilding industry. Solvent cleaninginvolves wiping, scrubbing, immersion in solvent, spraying, vapor degreasing,and emulsion cleaning the surface with rags or brushes until the surface iscleaned. The final wipe down must be performed with a clean rag or brush,and solvent. Inorganic compounds such as chlorides, sulfates, weld flux, rustand mill scale cannot be removed with organic solvents.
In many cases steam cleaning is a better alternative to solvent wipe down.Steam cleaning or high pressure washing is used to remove dirt and grime thatis present on top of existing paint and bare steel. Many hot steam cleanerswith detergents will remove most petroleum products and sometimes, oldchipping paint. After steam cleaning the part should be rinsed with freshwater and allowed to dry. Often the surface is ready to prime, although manysurfaces will require further preparation before painting.
Blasting
Abrasive blasting is the most common method for paint removal and surfacepreparation. Copper slag, coal slag, steel grit, and steel shot are commonblasting abrasives. Copper and steel grit consist of small angular particles,

Shipbuilding and Repair Industry Industrial Process Description
Sector Notebook Project November 199725
while steel shot is made up of small round balls. Copper slag can generally beused only once or twice before it becomes too small to be effective. Steel gritand shot can typically be used between 50 and 5,000 times before becomingineffective. Metallic grit and shot are available in varying ranges of hardnessand size.
Centrifugal blasting machines, also called roto-blasting or automatic blasting,are one of the more popular methods of blasting steel surfaces. In centrifugalblasting, metallic shot or grit is propelled to the surface to be prepared by aspinning wheel. Centrifugal blasting machines tend to be large and not easilymobilized. Therefore, they are not applicable to all shipyard blasting needs.Parts to be prepared must be brought to the machine and passed through ona conveyor or rotary table. On flat surfaces, centrifugal blasting machines canproduce uniform blasting results at high production rates. More time isrequired to prepare surfaces that are hard to reach. The process allows easyrecovery of abrasive materials for reuse and recycling which can result insignificant savings in materials and disposal costs. Large centrifugal blastingmachines are often found in the prime line for preparing raw steel sheetsbefore priming. Other centrifugal blasting machines are smaller and can beused to prepare small parts, pipe spools, and steel subassemblies prior topainting.
Air nozzle blasting (or dry abrasive blasting) is one of the most common typesof blasting in the shipbuilding and repair industry. In air nozzle blasting,abrasive is conveyed to the surface to be prepared in a medium of highpressure air (approximately 100 pounds per square inch) through a nozzle atvelocities approaching 450 feet per second. Abrasives are copper slag, coalslag and other metallic grit. Typically copper slag is used on the west coastand coal slag is used on the east coast. Traditionally sand was used, butmetallic grit has replaced it due to the adverse health and environmentaleffects of silica dust associated with sand. Air nozzle blasting is generallycarried out manually by shipyard workers either within a building or in theopen air, depending on the application. If the application allows, blast boothscan be used for containing abrasives.
Hand Tool Preparation
Hand tools such as grinders, wire brushes, sanders, chipping hammers, needleguns, rotary peening tools, and other impact tools are commonly used in theshipyard for surface preparation. The hand tools are ideal for small jobs, hardto reach areas, and areas where blasting grit would be too difficult to contain.Cleaning surfaces with hand tools seems comparatively slow although, whenremoving heavy paint formulations and heavy rust, they are effective andeconomical. Impact tools like chipping and needle guns are best for removingheavy deposits of brittle substances (e.g., rust and old paint). Hand tools aregenerally less effective when removing tight surface mill scale or surface

Shipbuilding and Repair Industry Industrial Process Description
Sector Notebook Project November 199726
rusting, because they can damage the metal surface. Surface preparation handtools are generally pneumatic instead of electric because they are lighter, easyto handle, do not overheat, and there is no risk of electric shock.
Wet Abrasive Blasting and Hydroblasting
Wet abrasive blasting and hydroblasting are generally performed on shipsbeing repaired in a floating drydock, graving dock, or other building or repairposition. Wet abrasive blasting involves blasting with a mixture of water, airand solid abrasives. Wet abrasive blasting does not occur throughout theshipyard like dry abrasive blasting because of the problem of water blastcontainment. In part due to lack of customer acceptance, wet abrasiveblasting is not common in the shipbuilding and repair industry at this time.Instead, hydroblasting is a widely used wet blasting technique which uses onlyhigh pressure water to remove chipping paint, marine growth, mud, and saltwater from the ship’s hull. A small amount of rust inhibitor may be used inthe water to prevent flash rusting. Hydro basting is often followed by airnozzle blasting for final surface preparation.
Chemical Preparation
Chemical surface preparations consist of paint removers, alkaline cleaningsolutions, chlorinated solvents, and pickling. Alkaline cleaning solutions comein a variety of forms and are used in a variety of manners. Alkaline cleanerscan be brushed on, sprayed on, and applied in a dip tank. Alkaline dip tanksof caustic soda solution are frequently used for cleaning parts and preparingthem for painting. After the surface is cleaned, it is thoroughly rinsed beforea coating system is applied. Many solvents and alkaline cleaners cannot beused for nonferrous materials, such as bronze, aluminum, and galvanized steelwhich are frequently found on ships.
Pickling is a process of chemical abrasion/etching which prepares surfaces forgood paint adhesion. The pickling process is used in shipyards mainly forpreparing pipe systems and small parts for paint. However, the process andqualities will vary from shipyard to shipyard. The process involves a systemof dip tanks. Figure 5 displays how the tanks can be arranged. In picklingsteel parts and piping systems, Tank #1 is used to remove any oil, grease, flux,and other contaminants on the surface being pickled. The content in tank #1are generally a 5-8% caustic soda and water mixture maintained attemperatures of between 180 -200 F. The part is then immersed into tank#2, which is the caustic soda rinse tank (pH 8-13). Next, the steel is dippedinto tank #3B, which is a 6-10% sulfuric acid/water mixture maintainedbetween 140 -160 F. Tank #4 is the acid rinse tank that is maintained at apH of 5-7. Finally the steel pipe or part is immersed in a rust preventative 5%phosphoric mixture in tank #5. The part is allowed to fully dry prior to paintapplication.

Steel Parts
Caustic Tank#1
Rinse Water#2
Sulfuric Acid#3B
Rinse Water#4
Rust Preventative
#5
Steel Parts
Copper andCopper-Nickel
Alloy Parts
Nitric Acid#3A
Copper andCopper-Nickel
Alloy Parts
Shipbuilding and Repair Industry Industrial Process Description
Sector Notebook Project November 199727
Figure 5: Typical Pickling Tank Arrangement
Some ships have large piping systems that are predominantly copper-nickelalloy or copper. Pickling of copper is generally only a two-step process. Thefirst step is to dip the pipe into tank #3A, a 3-6% nitric acid solutionmaintained at 140 -160 F. The nitric acid removes any flux and greases thatare present on the surface and prepares the surface for paint. Next, the pipeis dipped into the acid rinse tank (#4), after which it is considered to betreated. Once the part is dry, the final coating can be applied.
Metal Plating and Surface Treatment
Metal plating and surface treatment are used in shipyards to alter the surfaceproperties of the metal in order to increase corrosion or abrasion resistance,and to improve electrical conductivity (Kura, 1996). Metal plating andsurface treatment includes chemical and electrochemical conversion, casehardening, metallic coating, and electroplating. Thorough descriptions ofthese processes and their associated wastes are contained in the FabricatedMetal Products Industry Sector Notebook.

Shipbuilding and Repair Industry Industrial Process Description
Sector Notebook Project November 199728
III.A.10. Painting Processes
Proper surface coating system application is essential in the shipbuilding andrepair industry. The corrosion and deterioration associated with the marineenvironment has detrimental effects on ships and shipboard components.Maintaining ships’ structural integrity and the proper functioning of theircomponents are the main purposes of shipboard coating systems.
Painting is performed at almost every location within shipyards. This is dueto the wide variety of work performed throughout shipyards. The nature ofshipbuilding and repair requires several types of paints to be used for avariety of applications. Paint types range from water-based coatings to highperformance epoxy coatings. The type of paint needed for a certainapplication depends on the environment that the coating will be exposed. Ingeneral there are six areas where shipboard paint requirements exist:
Underwater (Hull Bottom)WaterlineTopside SuperstructuresInternal Spaces and TanksWeather DecksLoose Equipment
Because paint systems are often specified by the customer or are supplied bythe ship owner, shipyards often may not be able to choose or recommend aparticular system. Navy ships may require a specific type of paint for everyapplication through a military specification (Mil-spec). Many factors areconsidered when choosing a particular application. Among the factors areenvironmental conditions, severity of environmental exposure, drying andcuring times, application equipment and procedures, etc.
Paint Coating Systems
Paints are made up of three main ingredients: pigment, binder, and a solventvehicle. Pigments are small particles that generally determine the color as wellas many other properties associated with the coating. Examples of pigmentsinclude: zinc oxide, talc, carbon, coal tar, lead, mica, aluminum, and zinc dust.The binder can be thought of as the glue that holds the paint pigmentstogether. Many paints are referred to by their binder type (e.g., epoxy, alkyd,urethane, vinyl, phenolic, etc.). The binder is also very important fordetermining a coating’s performance characteristics (e.g., flexibility, chemicalresistance, durability, finish, etc.). The solvent is added to thin the paints sothat it will flow to the surface and then dry. The solvent portion of the paintevaporates when the paint dries. Some typical solvents include acetone,mineral spirits, xylene, methyl ethyl ketone, and water.

Shipbuilding and Repair Industry Industrial Process Description
Sector Notebook Project November 199729
Anticorrosive and antifouling paints are typically used on ship’s hulls and arethe main two types of paint used in the shipbuilding industry. Antifoulingpaints are used to prevent the growth of marine organisms on the hull ofvessels. Copper-based and tributyl-tin-based paints are widely used asantifouling paints. These paints release small quantities of toxics whichdiscourage marine life from growing on the hull. Anticorrosive paints areeither vinyl, lacquer, urethane, or newer epoxy-based coating systems (ILO,1996).
The first coating system applied to raw steel sheets and parts is generally pre-construction primer. This pre-construction primer is sometimes referred toas shop primer. This coat of primer is important for maintaining the conditionof the part throughout the construction process. Pre-construction priming isperformed on steel plates, shapes, sections of piping, and ventilation ducting.Most pre-construction primers are zinc-rich with organic or inorganic binders.Zinc silicates are predominant among the inorganic zinc primers. Zinc coatingsystems protect coatings in much the same manner as galvanizing. If zinc iscoated on steel, oxygen will react with the zinc to form zinc oxide, whichforms a tight layer that does not allow water or air to come into contact withthe steel (ILO, 1996).
Paint Application Equipment
There are many types of paint application equipment used in the shipbuildingindustry. Two main methods used are compressed air and airless sprayers.Compressed air sprayers are being phased out in the industry because of thelow transfer ability of the system. Air assisted paint systems spray both airand paint, which causes some paint to atomize and dry quickly prior toreaching the intended surface. The transfer efficiency of air assisted spraysystems can vary from 65% to 80%. This low transfer efficiency is due mainlyto overspray, drift, and the air sprayer’s inefficiencies (ILO, 1996).
The most widely used form of paint application in the shipbuilding industry isthe airless sprayer. The airless sprayer is a system that simply compressespaint in a hydraulic line and has a spray nozzle at the end. Airless sprayers usehydrostatic pressure instead of air to convey the paint. They are much cleanerto operate and have fewer leaking problems because the system requires lesspressure. Airless sprayers can have up to 90% transfer efficiency. A newtechnology that can be added to the airless sprayer is called High VolumeLow Pressure (HVLP). HVLP offers an even higher transfer efficiency, incertain conditions (ILO, 1996).
Thermal spray is the application of aluminum or zinc coatings to steel for longterm corrosion protection. Thermal spray can also be referred to as metalspray or flame spray. Thermal spray is significantly different thanconventional coating practices due to its specialized equipment and relatively

Shipbuilding and Repair Industry Industrial Process Description
Sector Notebook Project November 199730
slow production rates. The initial cost of thermal spray is usually highcompared to painting, although when the life-cycle is taken into account,thermal spray becomes more economically attractive. Many shipyards havetheir own thermal spray machines and other shipyards will subcontract theirthermal coating work. Thermal spray can occur in a shop or onboard the ship.There are two basic types of thermal coating machines: combustion wire andarc spray. The combustion wire type consists of combustible gasses and flamesystem with a wire feed controller. The combustible gasses melt the materialto be sprayed onto the parts. The electric arc spray machine instead uses apower supply arc to melt the flame sprayed material (ILO, 1996).
Painting Practices and Methods
Painting is performed in nearly every area in the shipyard from the initialpriming of the steel to the final paint detailing of the ship. Methods forpainting vary greatly from process to process. Mixing of paint is performedboth manually and mechanically and should be done in an area contained byberms, tarps, secondary containment pallets. Outdoor as well as indoorpainting occurs in the shipyard. Shrouding fences, made of steel, plastic, orfabric, are frequently used to help contain paint overspray by blocking thewind and catching paint particles (NSRP, 1996).
Hull painting occurs on both repair ships and new construction ships. Hullsurface preparation and painting on repair ships is normally performed whenthe ship is fully drydocked (i.e., graving-dock or floating drydock). For newconstruction, the hull is prepared and painted at a building position using oneof the techniques discussed in the previous sections. Paint systems aresprayed onto the hull using airless sprayers and high reach equipment such asman-lifts, scissor lifts, or portable scaffolding (ILO, 1996).
The superstructure of the ship consists of the exposed decks, deck houses,and structures above the main deck. In many cases, scaffolding is usedonboard the ship to reach antennas, houses, and other superstructures.Shrouding is usually put into place if it is likely that paint or blast material willfall into adjacent waters. On repair ships, the ship’s superstructure is paintedmostly while berthed. The painters access the superstructures with existingscaffolding, ladders, and various lifting equipment that was used duringsurface preparation. The shrouding system (if applicable) that was used forblast containment will stay in place to help contain any paint overspray (ILO,1996).
Tanks and compartments onboard ships must be coated and re-coated tomaintain the longevity of the ship. Re-coating of repair ship tanks requires alarge amount of surface preparation prior to painting. The majority of thetanks are at the bottom of the ship (e.g., ballast tanks, bilges, fuel, etc.). Thetanks are prepared for paint by using solvents and detergents to remove

Shipbuilding and Repair Industry Industrial Process Description
Sector Notebook Project November 199731
grease and oil build-up. The associated waste-water developed during tankcleaning must be properly treated and disposed of. After the tanks are dried,they are blasted with a mineral slag. Once the surface is blasted and the gritis removed, painting can begin. Adequate ventilation and respirators are astrict requirement for all tank and compartment surface preparation andpainting (ILO, 1996).
Painting is also carried out after the assembly of hull blocks. Once the blocksleave the assembly area, they are frequently transported to a blast area wherethe entire block is prepared for paint. At this point, the block is usuallyblasted back down to bare metal (i.e., the construction primer is removed).However, many shipyards are now moving towards implementing apreconstruction primer that does not need to be removed. The most frequentmethod for block surface preparation is air nozzle blasting. The paint systemis applied by painters generally using airless spray equipment on accessplatforms. Once the block’s coating system has been applied, the block istransported to the on-block stage where outfitting materials are installed (ILO,1996).
Many parts need to have a coating system applied prior to installation. Forexample, piping spools, vent ducting, foundations, and doors are paintedbefore they are installed on-block. Some small parts painting occurs in thevarious shops while others are painted in a standard location operated by thepaint department (ILO, 1996). Indoor painting of this type usually occurs ina spray booth. Spray booths capture overspray, control the introduction ofcontaminants to the workplace environment, and reduce the likelihood ofexplosions and fires. Paint booths are categorized by the method used forcollecting the overspray (EPA, 1995).
The two primary types of paint booths are dry filter and water wash booths.Dry filter booths use filter media (usually paper or cloth filters) to screen outthe paint solids by pulling prefiltered air through the booth, past the sprayingoperation, and through the filter media. Water wash booths use a “watercurtain” to capture paint overspray by pulling air containing entrained paintoverspray through a circulated water stream which “scrubs” the oversprayfrom the air. Water is periodically added to the paint booth reservoir tocompensate for evaporative losses, and chemicals are periodically added toimprove paint sludge formation. The sump is periodically discharged, usuallyduring general system cleaning or maintenance (EPA, 1995).
III.A.11. Fiberglass Reinforced Construction Operations
Many of the medium and small shipyards manufacture and repair fiberglassships and boats or construct fiberglass parts for steel ships. The processinvolves combining polymerizing resin with fiberglass reinforcing material. The resin is polymerized with a catalyst or curing agent. Once cured, the hard
Shipbuilding and Repair Industry Industrial Process Description
Sector Notebook Project November 199732
resin cannot be softened or reshaped and is stronger than composite plasticswithout the reinforcing. Fiberglass material consists of a woven mat of glass-like fibers. The fiberglass content of the reinforced product ranges from 25 to60 percent.
A number of different processes are used, but the mold-based process is themost common for this industry. Mold-based fiberglass reinforced constructiontypically involves either the hand application or spray application of fiberglassreinforcing. In the hand application method, the reinforcing material ismanually applied to a mold wetted with catalyzed resin mix or gelcoat andthen sprayed or brushed with more resin or gelcoat. In the sprayup method,catalyzed resin and fiberglass reinforcement are mechanically sprayed onto themold surface.
Molds are used to give structure and support to the shape of the structurebeing built. Most molds are made of wood with a plastic finish. Typical resinsused include: polyesters, epoxies, polyamides, and phenolics. The type ofresin to be used in a particular process depends on the specific propertiesrequired for the end product. The resin is supplied in liquid form and maycontain a solvent. Resin preparation involves mixing with solvents, catalysts,pigments, and other additives. Solvents are typically acetone, methanol,methyl ethyl ketone, and styrene. Catalysts are typically amines, anydrides,aldehyde condensation products, and Lewis acid products. Gelcoat is apigmented polyester resin or a polyester resin-based paint containingapproximately 35 percent styrene that is applied to the mold or surface withan air atomizer or airless spray gun. A catalyst is injected into the resin in aseparate line or by hand mixing in order to thermoset the polyester resin.
Shipbuilding and Repair Industry Industrial Process Description
Sector Notebook Project November 199733
III.B. Raw Material Inputs and Pollutant Outputs
Raw material inputs to the shipbuilding and repair industry are primarily steeland other metals, paints and solvents, blasting abrasives, and machine andcutting oils. In addition, a wide variety of chemicals are used for surfacepreparation and finishing such as solvent degreasers, acid and alkalinecleaners, and cyanide and metal bearing plating solutions. Pollutants andwastes generated typically include VOCs, particulates, waste solvents, oils andresins, metal bearing sludges and wastewater, waste paint, waste paint chips,and spent abrasives. The major shipyard activities that generate wastes andpollutant outputs are discussed below and are summarized in Table 3.
III.B.1. Surface Preparation
The materials used and wastes generated during surface preparation dependon the specific methods used. The surface preparation method is chosenbased on the condition of the metal surface (e.g., coated with paint, rust,scale, dirt, grease, etc.), the type of coating to be applied, the size, shape, andlocation of the surface, and the type of metal. Material inputs used forpreparing surfaces include: abrasive materials such as steel shot or grit, garnet,and copper or coal slag; and cleaning water, detergents, and chemical paintstrippers (e.g., methylene chloride-based solutions, caustic solutions, andsolvents). In the case of hydroblasting, only water and occasionally rustinhibitor are required (NSRP, 1996).
Air Emissions
Air emissions from surface preparation operations include particulateemissions of blasting abrasives, and paint chips. Particulates emissions canalso contain toxic metals which are a concern both in the immediate areasurrounding the work and if they are blown off-site or into surroundingsurface waters. Particulate emissions are typically controlled by preparingsurfaces indoors when possible or by surrounding the work area withshrouding fences made of steel, plastic, or fabric. Other air emissions thatcould potentially arise during surface preparation operations are VOCs andhazardous air pollutants (HAPs) arising from the use of solvent cleaners, paintstrippers, and degreasers.
Residual Wastes
The primary residual waste generated is a mixture of paint chips and usedabrasives. Paint chips containing lead or antifouling agents may be hazardous,but often in practice the concentration of toxic compounds is reduced due tothe presence of considerable amounts of spent blasting medium. The resultingmixed waste may be nonhazardous (Kura, 1996). Waste sludge containingpaint chips and surface contaminants may also be generated in the case of

Shipbuilding and Repair Industry Industrial Process Description
Sector Notebook Project November 199734
hydroblasting or wet abrasive blasting. Blasting abrasives and paint chips thatcollect in tank vessels, ship decks, or drydocks should be thoroughly cleanedup and collected after work is completed or before the drydock is flooded orsubmerged. Particular attention should be paid to the cleanup of paint chipscontaining the antifouling tributyl-tin (TBT) compounds which have beenshown to be highly toxic to oysters and other marine life (Levy, 1996).
Wastewater
Significant quantities of wastewater can be generated when cleaning shipcargo tanks, ballast tanks, and bilges prior to surface preparation and painting.Such wastewater is often contaminated with cleaning solvents, and oil and fuelfrom bilges and cargo tanks. Wastewater contaminated with paint chips andsurface contaminants is generated when hydroblasting and wet abrasiveblasting methods are used (EPA, 1991).
III.B.2. Painting
Material inputs for painting are primarily paints and solvents. Solvents areused in the paints to carry the pigment and binder to the surface, and forcleaning the painting equipment. VOCs and HAPs from painting solvents areone of the most important sources of pollutant outputs for the industry. Paints also may contain toxic pigments such as chromium, titanium dioxide,lead, copper, and tributyl-tin compounds. Water is also used for equipmentcleaning when water-based paints are used.
Air Emissions
Painting can produce significant emissions of VOCs and HAPs when thesolvents in the paint volatilize as the paint dries. Other sources of VOCs andHAPs may arise when solvents are used to clean painting equipment such asspray guns, brushes, containers, and rags. Sprayed paint that does not reachthe surface being coated, or overspray, is another source of painting airemissions. The solvents in the overspray rapidly volatilize and the remainingdry paint particles can drift off-site or into nearby surface waters.
Residual Wastes
Solid wastes associated with painting are believed to be the largest categoryof hazardous waste produced in shipyards (Kura, 1996). Typical wastesassociated with painting include leftover paint, waste paint containers, spentequipment, rags and other materials contaminated with paint, spent solvents,still bottoms from recycled cleaning solvents, and sludges from the sumps ofwater wash paint spray booths. Wastes associated with antifouling bottompaints are sometimes collected separately from the typically less toxic topsideand interior paints. Antifouling paints contain toxic metal or organometallic

Shipbuilding and Repair Industry Industrial Process Description
Sector Notebook Project November 199735
biocides such as cuprous oxide, lead oxide, and tributyl-tin compounds.(Kura, 1996)
Wastewater
Wastewater contaminated with paints and solvents may be generated duringequipment cleaning operations; however, water is typically only used incleaning water-based paints. Wastewater is also generated when watercurtains (water wash spray booths) are used during painting. Wastewaterfrom painting water curtains commonly contains organic pollutants as well ascertain metals. The wastewater can be treated at the source using filtration,activated carbon adsorption, or centrifugation and then reused instead ofbeing discharged (EPA, 1995).
III.B.3. Metal Plating and Surface Finishing
Material inputs for metal plating and finishing include the solutions of platingmetals such as chromium, aluminum, brass, bronze, cadmium, copper, iron,lead, nickel, zinc, gold, platinum, and silver. In addition, cyanide solutions,solvents, rinse water, and rust inhibitors are used. Many of the wastesgenerated from metal plating and surface finishing operations are consideredhazardous resulting from their toxicity. Thorough descriptions of theseprocesses and their associated wastes are contained in the Fabricated MetalProducts Industry Sector Notebook.
Air Emissions
Air emissions arise from metal mists, fumes, and gas bubbles from the surfaceof the liquid baths and the volatilization of solvents used to clean surfacesprior to plating or surface finishing.
Residual Wastes
Solid wastes include wastewater treatment sludges, still bottoms, spent metalplating solutions, spent cyanide solutions, and residues from tank cleaning.Often, the solid waste generated contains significant concentrations of toxicmetals, cyanides, acids, and alkalies.
Wastewater
Wastewaters are primarily rinse waters, quench water, and waste tankcleaning water contaminated with metals, cyanides, acids, alkalies, organics,and solvents. Wastewaters are typically either sent off-site for treatment ordisposal or are treated onsite by neutralization and conventional hydroxideprecipitation prior to discharging either to a POTW or surface waters underan NPDES permit.

Shipbuilding and Repair Industry Industrial Process Description
Sector Notebook Project November 199736
III.B.4. Fiberglass Reinforced Construction
Material inputs for fiberglassing operations include fiberglass, mold orreinforcing materials (wood and plastic), resins, solvents, and curing catalysts.Unsaturated polyester resins, such as orthophthalic polyester, isophthalicpolyester, and bisphenol polyester are the most commonly used resins. Otherresins include epoxies, polyamides and phenolic compounds. Resins typicallyare not hazardous; however, the solvent in which the resin is dissolved maybe hazardous. In addition, some catalysts may be hazardous. Catalysts includeamines (e.g., diethylenetriamine and triethylenetetramone), anhydrides,aldehyde condensation products, and Lewis acid catalysts.
Typical hazardous wastes include containers contaminated with residualchemicals, wash-down wastewater, spent cleaning solvents from equipmentcleanup, scrap solvated resin left over in mix tanks, diluted resin and partiallycured resin. For a detailed description of fiberglassing operations andassociated wastes, refer to EPA’s Pollution Prevention Guide for theFiberglass-Reinforced and Composite Plastics Industry, October 1991.
Air Emissions
Organic vapors consisting of VOCs are emitted from fresh resin surfacesduring the fabrication process and from the use of solvents for cleanup. Thepolyester resins used in gelcoating operations have a styrene content ofapproximately 35 percent. Emissions of styrene and other solvent VOCsduring spraying, mixing, brushing, and curing can be significant. In addition,emissions of solvent vapors arise when acetone and methylene chloride areused to clean fiber glassing equipment (Kura, 1996).
Residual Wastes
Residual wastes generated from fiberglass operations include, gelcoat andresin overspray, unused resins that have exceeded their shelf life, fiberglassboxes, gelcoat drums, waste solvents, and cleanup rags (Kura, 1996).
III.B.5. Machining and Metalworking
Machining and metal working operations such as cutting, pressing, boring,milling, and grinding, typically involve the use of a high speed cutting tool.Friction at the cutting edge of the blade creates heat that could permanentlydeform the metal being machined or the cutting tool. Coolants, such ascutting oils and lube oils are, therefore, supplied to the leading edge of thetool to remove excessive heat (Kura, 1996). Solvents are frequently used toclean parts and tools prior to and after machining.

Shipbuilding and Repair Industry Industrial Process Description
Sector Notebook Project November 199737
Air Emissions
Fugitive air emissions arise from the use of solvents for cleaning anddegreasing.
Residual Wastes
Waste cutting oils, lube oils, and degreasing solvents are the major residualwastes generated. Metal shavings and chips are also generated. Typicallythese are separated from coolants, if necessary, and recycled along with scrapmetal (Kura, 1996).
Wastewater
Wastewaters containing cleaning solvents and emulsified lubricants, coolants,and cutting oils may produced if parts are cleaned or rinsed with water. Inaddition, some modern lubricating oils and grease are being formulated withlimited or no mineral oil content. These lubricants are known as high watercontent fluids. When spent they can result in wastewater comprised of amaximum of 15 percent mineral oil emulsified in water (Water EnvironmentFederation, 1994).
III.B.6. Solvent Cleaning and Degreasing
The type of solvent used in parts and surface cleaning and degreasing dependson the type of contaminants to be removed, degree of cleaning needed,properties of the surfaces to be cleaned, and properties of the various solvents(stability, toxicity, flammability, and cost). Both halogenated andnonhalogenated solvents are used and mixtures of different solvents arecommon. Typical cleaning and degreasing solvents include mineral spirits,aromatic hydrocarbons (e.g., xylenes, toluene, etc.), aliphatic hydrocarbons,ketones, esters, alcohols, glycol ethers, phenols, turpentine, and varioushalogenated solvents (e.g., trichloroethylene, 1,1,1-trichloroethane,perchloroethylene, etc.).
Air Emissions
Solvent vapors comprised of VOCs and HAPs are a significant pollutantoutput of cleaning and degreasing operations. Fugitive emissions arise fromvapor degreasers, solvent tanks and containers, solvent stills, solvent soakedrags, and residual solvents on parts and surfaces.
Residual Wastes
Residual wastes may include contaminated or spent solvents, solvents thathave become contaminated or deteriorated due to improper storage or
Shipbuilding and Repair Industry Industrial Process Description
Sector Notebook Project November 199738
handling, solvent residues and sludges from tank bottoms and still bottoms,solvent contaminated rags and filter cartridges, and solvent contaminated soilfrom solvent spills.
Wastewater
Wastewater containing solvents are generated when cleaning or rinsing partsor surfaces, and when cleaning equipment, tanks, and process lines withwater. Wastewater contaminated with solvents is also generated when waterfrom diphase parts cleaning operations is replaced.

Shipbuilding and Repair Industry Industrial Process Description
Sector Notebook Project November 199739
Table 3: Material Inputs and Potential Pollutant Outputsfor the Shipbuilding and Repair Industry
Industrial Material ResidualProcess Inputs Air Emissions Wastewater Wastes
SurfacePreparation
Abrasives (steel Particulates (metal, Wastewater Paint chipsshot, lead shot, steel paint, and abrasives) contaminated with (potentiallygrit, garnet, copper and VOCs from paint chips, cleaning containing metals,slag, and coal slag), solvent cleaners and and paint stripping tributyl-tin), spentdetergents, solvent paint strippers. solvents, surface abrasives, surfacepaint strippers and contaminants, and contaminants, andcleaners, and caustic oil residues from cargo tank residues.solutions. bilges and cargo
tanks.
Metal Platingand SurfaceFinishing
Plating metals, Metal mists and Rinse and quench Sludge fromcyanide solutions, fumes, and VOCs water contaminated wastewatercleaning solvents, from solvents. with metals, treatment, spentrinse water, acid and cyanides, acids, plating solutions andcaustic solutions and alkalies, organics, cyanide solutions,rust inhibitors. and solvents. bath cleaning
residues.
Painting Paints, solvents, and VOCs from paint Waste equipment Leftover paint andwater. solvents and cleaning water and solvents, waste paint
equipment cleaning water wash spray and solventsolvents, and paint booth sump containers, spentoverspray. water contaminated paint booth filters,
with paints and and spentsolvents. equipment.
FiberglassReinforcedConstruction
Fiberglass, resin, VOC emissions Little or no Waste fiberglass,solvents, curing released during wastewater gelcoat, resin,catalysts, and wood construction generated. unused resin that hasand plastic operations and curing exceeded its shelfreinforcing (e.g., styrene) and life, spent solvents,materials. during cleaning with and used containers.
solvents (e.g., acetoneand methylenechloride).
Machiningand MetalWorking
Cutting oils, lube VOC emissions from Wastewater Waste cutting oils,oils, and solvents. the use of cleaning containing solvents, lube oils, and metal
and degreasing emulsified chips and shavings.solvents. lubricating and
cutting oils andcoolants.
Sources: Kura, Bhaskar, Typical Waste Streams in a Shipbuilding Facility , and U.S. EPA, Office of Research andDevelopment, Guides to Pollution Prevention, The Marine Maintenance and Repair Industry.

Shipbuilding and Repair Industry Industrial Process Description
Sector Notebook Project November 199740
III.C. Management of Chemicals in Wastestream
The Pollution Prevention Act of 1990 (PPA) requires facilities to reportinformation about the management of Toxics Release Inventory (TRI)chemicals in waste and efforts made to eliminate or reduce those quantities.These data have been collected annually in Section 8 of the TRI reportingForm R beginning with the 1991 reporting year. The data summarized belowcover the years 1993-1996 and is meant to provide a basic understanding ofthe quantities of waste handled by the industry, the methods typically used tomanage this waste, and recent trends in these methods. TRI wastemanagement data can be used to assess trends in source reduction withinindividual industries and facilities, and for specific TRI chemicals. Thisinformation could then be used as a tool in identifying opportunities forpollution prevention compliance assistance activities.
While the quantities reported for 1994 and 1995 are estimates of quantitiesalready managed, the quantities listed by facilities for 1996 and 1997 areprojections only. The PPA requires these projections to encourage facilitiesto consider future waste generation and source reduction of those quantitiesas well as movement up the waste management hierarchy. Future-yearestimates are not commitments that facilities reporting under TRI are requiredto meet.
Table 4 shows that the TRI reporting shipyards managed about six millionpounds of production related wastes (total quantity of TRI chemicals in thewaste from routine production operations in column B) in 1995. From theyearly data presented in column B, the total quantities of production relatedTRI wastes increased between 1994 and 1995. This is likely in part becausethe number of chemicals on the TRI list nearly doubled between those years.Production related wastes were projected to decrease between 1996 and1997.
Values in column C are intended to reveal the percentage of productionrelated wastes that are either transferred off-site or released to theenvironment. Column C is calculated by dividing the total TRI transfers andreleases (reported in Sections 5 and 6 of the TRI Form R) by the totalquantity of production-related waste (reported in Section 8). Since the TRIreleases and transfers from Sections 5 and 6 of the TRI Form R should all beaccounted for in Section 8 of Form R, the percentages shown in column Cshould always be less than 100 percent. For the shipbuilding and repairindustry, the TRI data shows that erroneous reporting in Form R by a numberof shipyards in both 1994 and 1995 has undermined the data resulting inunusually high values in Column C.
If it is assumed that the proportions of production related wastes managedonsite and off-site using the methods shown in columns D-I were reported

Shipbuilding and Repair Industry Industrial Process Description
Sector Notebook Project November 199741
correctly, the data would indicate that about 60 percent of the TRI wastes aremanaged off-site through recycling, energy recovery, or treatment (columnsG, H, and I, respectively) in 1995. Only about one percent of the wastes weremanaged on-site. The remaining portion of TRI chemical wastes (about 44percent), shown in column J, were released to the environment through directdischarges to air, land, water, and underground injection, or was disposed off-site.
Table 4: Source Reduction and Recycling Activity forShipyards (SIC 3731) as Reported within TRI
A B C JOn-Site Off-Site
Year (10 lbs.) Transferred Off-site
Quantity ofProduction- % Released
Related % Released andWaste and Disposed
6 a b
c
D E F G H I
% % Energy % % EnergyRecycled Recovery % Treated Recycled Recovery % Treated
1994 5.32 113% 1.1% 0.0% 0.7% 36.1% 12.6% 3.6% 46%
1995 6.45 100% 0.5% 0.0% 0.7% 45.7% 11.2% 2.2% 44%
1996 5.62 --- 0.7% 0.0% 0.7% 40.1% 11.3% 3.1% 44%
1997 5.59 --- 0.8% 0.0% 0.7% 40.6% 11.1% 3.1% 44%
Source: 1995 Toxics Release Inventory Database. Within this industry sector, non-production related waste < 1% of production related wastes for 1995.a
Total TRI transfers and releases as reported in Section 5 and 6 of Form R as a percentage of production related wastes.b
Percentage of production related waste released to the environment and transferred off-site for disposal.c

Shipbuilding and Repair Industry Industrial Process Description
Sector Notebook Project November 199742
Page 42 intentionally left blank.
Shipbuilding and Repair Industry Chemical Releases and Transfers
Sector Notebook Project November 199743
IV. CHEMICAL RELEASE AND TRANSFER PROFILE
This section is designed to provide background information on the pollutantreleases that are reported by this industry. The best source of comparativepollutant release information is the Toxic Release Inventory (TRI). Pursuantto the Emergency Planning and Community Right-to-Know Act, TRI includesself-reported facility release and transfer data for over 600 toxic chemicals.Facilities within SIC Codes 20 through 39 (manufacturing industries) thathave more than 10 employees, and that are above weight-based reportingthresholds are required to report TRI on-site releases and off-site transfers.The information presented within the sector notebooks is derived from themost recently available (1995) TRI reporting year (which includes over 600chemicals), and focuses primarily on the on-site releases reported by eachsector. Because TRI requires consistent reporting regardless of sector, it isan excellent tool for drawing comparisons across industries. TRI data providethe type, amount and media receptor of each chemical released or transferred.
Although this sector notebook does not present historical informationregarding TRI chemical releases over time, please note that in general, toxicchemical releases have been declining. In fact, according to the 1995 ToxicRelease Inventory Public Data Release, reported onsite releases of toxicchemicals to the environment decreased by 5 percent (85.4 million pounds)between 1994 and 1995 (not including chemicals added and removed from theTRI chemical list during this period). Reported releases dropped by 46percent between 1988 and 1995. Reported transfers of TRI chemicals to off-site locations increased by 0.4 percent (11.6 million pounds) between 1994and 1995. More detailed information can be obtained from EPA's annualToxics Release Inventory Public Data Release book (which is availablethrough the EPCRA Hotline at 800-535-0202), or directly from the ToxicRelease Inventory System database (for user support call 202-260-1531).
Wherever possible, the sector notebooks present TRI data as the primaryindicator of chemical release within each industrial category. TRI dataprovide the type, amount and media receptor of each chemical released ortransferred. When other sources of pollutant release data have been obtained,these data have been included to augment the TRI information.
TRI Data Limitations
Certain limitations exist regarding TRI data. Release and transfer reportingare limited to the approximately 600 chemicals on the TRI list. Therefore, alarge portion of the emissions from industrial facilities are not captured byTRI. Within some sectors, (e.g. dry cleaning, printing and transportationequipment cleaning) the majority of facilities are not subject to TRI reportingbecause they are not considered manufacturing industries, or because they arebelow TRI reporting thresholds. For these sectors, release information from

Shipbuilding and Repair Industry Chemical Releases and Transfers
Sector Notebook Project November 199744
other sources has been included. In addition, many facilities report more thanone SIC code reflecting the multiple operations carried out onsite. Therefore,reported releases and transfers may or may not all be associated with theindustrial operations described in this notebook.
The reader should also be aware that TRI "pounds released" data presentedwithin the notebooks is not equivalent to a "risk" ranking for each industry.Weighting each pound of release equally does not factor in the relativetoxicity of each chemical that is released. The Agency is in the process ofdeveloping an approach to assign toxicological weightings to each chemicalreleased so that one can differentiate between pollutants with significantdifferences in toxicity. As a preliminary indicator of the environmental impactof the industry's most commonly released chemicals, the notebook brieflysummarizes the toxicological properties of the top five chemicals (by weight)reported by each industry.
Definitions Associated With Section IV Data Tables
General Definitions
SIC Code -- the Standard Industrial Classification (SIC) is a statisticalclassification standard used for all establishment-based Federal economicstatistics. The SIC codes facilitate comparisons between facility and industrydata.
TRI Facilities -- are manufacturing facilities that have 10 or more full-timeemployees and are above established chemical throughput thresholds.Manufacturing facilities are defined as facilities in Standard IndustrialClassification primary codes 20-39. Facilities must submit estimates for allchemicals that are on the EPA's defined list and are above throughputthresholds.
Data Table Column Heading Definitions
The following definitions are based upon standard definitions developed byEPA’s Toxic Release Inventory Program. The categories below represent thepossible pollutant destinations that can be reported.
RELEASES -- are an on-site discharge of a toxic chemical to theenvironment. This includes emissions to the air, discharges to bodies ofwater, releases at the facility to land, as well as contained disposal intounderground injection wells.
Releases to Air (Point and Fugitive Air Emissions) -- Include all airemissions from industry activity. Point emissions occur through confined air

Shipbuilding and Repair Industry Chemical Releases and Transfers
Sector Notebook Project November 199745
streams as found in stacks, vents, ducts, or pipes. Fugitive emissions includeequipment leaks, evaporative losses from surface impoundments and spills,and releases from building ventilation systems.
Releases to Water (Surface Water Discharges) -- encompass any releasesgoing directly to streams, rivers, lakes, oceans, or other bodies of water.Releases due to runoff, including storm water runoff, are also reportable toTRI.
Releases to Land -- occur within the boundaries of the reporting facility.Releases to land include disposal of toxic chemicals in landfills, landtreatment/application farming, surface impoundments, and other land disposalmethods (such as spills, leaks, or waste piles).
Underground Injection -- is a contained release of a fluid into a subsurfacewell for the purpose of waste disposal. Wastes containing TRI chemicals areinjected into either Class I wells or Class V wells. Class I wells are used toinject liquid hazardous wastes or dispose of industrial and municipalwastewaters beneath the lowermost underground source of drinking water.Class V wells are generally used to inject non-hazardous fluid into or abovean underground source of drinking water. TRI reporting does not currentlydistinguish between these two types of wells, although there are importantdifferences in environmental impact between these two methods of injection.
TRANSFERS -- is a transfer of toxic chemicals in wastes to a facility thatis geographically or physically separate from the facility reporting under TRI.Chemicals reported to TRI as transferred are sent to off-site facilities for thepurpose of recycling, energy recovery, treatment, or disposal. The quantitiesreported represent a movement of the chemical away from the reportingfacility. Except for off-site transfers for disposal, the reported quantities donot necessarily represent entry of the chemical into the environment.
Transfers to POTWs -- are wastewater transferred through pipes or sewersto a publicly owned treatments works (POTW). Treatment or removal of achemical from the wastewater depend on the nature of the chemical, as wellas the treatment methods present at the POTW. Not all TRI chemicals canbe treated or removed by a POTW. Some chemicals, such as metals, may beremoved, but are not destroyed and may be disposed of in landfills ordischarged to receiving waters.
Transfers to Recycling -- are sent off-site for the purposes of regeneratingor recovery by a variety of recycling methods, including solvent recovery,metals recovery, and acid regeneration. Once these chemicals have beenrecycled, they may be returned to the originating facility or sold commercially.

Shipbuilding and Repair Industry Chemical Releases and Transfers
Sector Notebook Project November 199746
Transfers to Energy Recovery -- are wastes combusted off-site in industrialfurnaces for energy recovery. Treatment of a chemical by incineration is notconsidered to be energy recovery.
Transfers to Treatment -- are wastes moved off-site to be treated througha variety of methods, including neutralization, incineration, biologicaldestruction, or physical separation. In some cases, the chemicals are notdestroyed but prepared for further waste management.
Transfers to Disposal -- are wastes taken to another facility for disposalgenerally as a release to land or as an injection underground.

Shipbuilding and Repair Industry Chemical Releases and Transfers
Sector Notebook Project November 199747
IV.A. EPA Toxic Release Inventory for the Shipbuilding and Repair Industry
This section summarizes TRI data of shipbuilding and repair facilitiesreporting operations under SIC code 3731. Of the 598 shipbuilding and repairestablishments reported by the 1992 Census of Manufacturers, 43 reportedto TRI in 1995.
According to the 1995 TRI data, the reporting shipbuilding and repairfacilities released and transferred 39 different TRI chemicals for a total ofapproximately 6.5 million pounds of pollutants during calendar year 1995.These releases and transfers are dominated by volatile organic compounds(VOCs) and metal-bearing wastes which make up 52 percent and 48 percent,respectively, of total releases and transfers.
Transfers of TRI chemicals account for 58 percent of shipbuilding and repairfacilities’ total TRI-reportable chemicals (3.5 million pounds) while releasesmake up 42 percent (2.5 million pounds).
Releases
Releases to the air, water, and land accounted for 37 percent (2.4 millionpounds) of shipyard’s total reportable chemicals (see Table 5). Of thesereleases, over 98 percent are released to the air from fugitive (75 percent) orpoint (24 percent) sources. VOCs accounted for about 86 percent of theshipbuilding and repair industry’s reported TRI releases. The remainder of thereleases were primarily metal-bearing wastes. Xylenes, n-butyl alcohol,toluene, methyl ethyl ketone, and methyl isobutyl ketone account for about 65percent of the industry’s reported releases. These organic compounds aretypically found in solvents which are used extensively by the industry inthinning paints and for cleaning and degreasing metal parts and equipment. Styrene, reported by eight facilities, accounts for about 4 percent of theindustry’s releases. Styrene comprises a substantial portion of the resinmixtures and gelcoat used in fiberglass reinforced construction. Finally,copper-, zinc-, and nickel-bearing wastes account for about 14 percent of theindustry’s reported releases. They are released primarily as fugitive emissionsduring metal plating operations and as overspray in painting operations andcan also be released as fugitive dust emissions during blasting operations.
Transfers
Off-site transfers of TRI chemicals account for 63 percent of shipyard’s totalTRI reportable chemicals (4.1 million pounds). Over 72 percent of theshipbuilding and repair industry’s TRI transfers are sent off-site for recyclingfollowed by about 18 percent sent off-site for energy recovery (see Table 6).Metals accounted for about 67 percent of the industry’s reported transfers.VOCs made up almost all of the remainder of transferred TRI chemicals.

Shipbuilding and Repair Industry Chemical Releases and Transfers
Sector Notebook Project November 199748
About 60 percent of the metals transferred were recycled, and almost all ofthe remainder were either treated or disposed off-site. Copper, zinc, andchromium made up about 70 percent of the metals transferred off-site. Mostof these are in the form of scrap metal, metal shavings and dust, spent platingbaths, wastewater treatment sludges, and in paint chips and spent blastingabrasives. About 53 percent of the VOCs transferred were sent off-site forenergy recovery with the remainder primarily going to off-site recycling andtreatment. Waste solvents containing xylene, n-butyl alcohol, methanol,carbon tetrachloride, and methyl ethyl ketone make up almost 70 percent ofthe VOCs transferred off-site. These wastes were primarily transferred forenergy recovery.

Shipbuilding and Repair Industry Chemical Releases and Transfers
Sector Notebook Project November 199749
Tab
le 5
: 199
5 T
RI
Rel
ease
s fo
r Sh
ipbu
ildin
g an
d R
epai
r F
acili
ties
(SIC
373
1),
by N
umbe
r of
Fac
iliti
es R
epor
ting
(Rel
ease
s re
port
ed in
pou
nds/
year
)
CH
EM
ICA
L N
AM
E#
RE
POR
TIN
GC
HE
MIC
AL
FUG
ITIV
EA
IRPO
INT
AIR
WA
TE
RD
ISC
HA
RG
ES
UN
DE
RG
RO
UN
DIN
JEC
TIO
NL
AN
DD
ISPO
SAL
TO
TA
LR
EL
EA
SES
AV
G. R
EL
EA
SES
PER
FA
CIL
ITY
XY
LE
NE
(MIX
ED
ISO
ME
RS)
3085
3,86
399
,379
9,29
20
096
2,53
432
,084
N-B
UT
YL
AL
CO
HO
L15
278,
218
60,8
022,
691
00
341,
711
22,7
81C
OPP
ER
CO
MPO
UN
DS
891
,410
03,
968
025
095
,628
11,9
54ST
YR
EN
E8
7,20
987
,069
250
00
94,5
2811
,816
ZIN
C C
OM
POU
ND
S6
75,4
1727
,278
2,92
00
250
105,
865
17,6
44Z
INC
(FU
ME
OR
DU
ST)
581
,088
08,
260
00
89,3
4817
,870
CH
RO
MIU
M C
OM
POU
ND
S4
631
7,25
025
60
08,
137
2,03
4M
ET
HY
L E
TH
YL
KE
TO
NE
477
,928
00
00
77,9
2819
,482
TO
LU
EN
E4
25,8
0630
,239
00
056
,045
14,0
11PR
OPY
LE
NE
475
525
00
00
1,00
525
1N
ICK
EL
420
016
00
369
CO
PPE
R4
200
261
00
281
70N
ICK
EL
CO
MPO
UN
DS
330
,592
029
40
250
31,1
3610
,379
ME
TH
AN
OL
32,
172
13,2
2225
00
015
,644
5,21
51,
2,4-
TR
IME
TH
YL
BE
NZ
EN
E3
42,3
9918
,100
00
060
,499
20,1
66M
ET
HY
L IS
OB
UT
YL
KE
TO
NE
355
,979
00
00
55,9
7918
,660
MA
NG
AN
ESE
33,
884
00
00
3,88
41,
295
CH
RO
MIU
M3
260
010
00
270
90L
EA
D C
OM
POU
ND
S2
546
026
10
250
1,05
752
9M
AN
GA
NE
SE C
OM
POU
ND
S2
620
025
00
250
1,12
056
0FR
EO
N 1
132
14,6
720
00
014
,672
7,33
6E
TH
YL
BE
NZ
EN
E2
16,9
931,
159
00
018
,152
9,07
6E
TH
YL
EN
E G
LY
CO
L2
256
260
00
282
141
ME
TH
YL
TE
RT
-BU
TY
L E
TH
ER
242
599
,555
250
00
100,
230
50,1
15B
AR
IUM
CO
MPO
UN
DS
13,
600
00
00
3,60
03,
600
CE
RT
AIN
GL
YC
OL
ET
HE
RS
122
,000
5,00
00
00
27,0
0027
,000
BE
NZ
EN
E1
426
84,9
990
00
85,4
2585
,425
1,1,
1-T
RIC
HL
OR
OE
TH
AN
E1
67,0
000
00
067
,000
67,0
00D
ICH
LO
RO
ME
TH
AN
E1
8,40
00
00
08,
400
8,40
0D
ICH
LO
RO
TE
TR
AFL
UO
RO
ET
HA
NE
(CFC
-114
)1
250
00
00
250
250
DIC
YC
LO
PEN
TA
DIE
NE
118
6,07
20
00
6,09
06,
090
TR
ICH
LO
RO
ET
HY
LE
NE
115
,600
00
00
15,6
0015
,600
CU
ME
NE
17
2,61
10
00
2,61
82,
618
1,2-
DIC
HL
OR
OE
TH
AN
E1
312,
634
00
02,
665
2,66
5A
CR
YL
ON
ITR
ILE
125
05
250
00
505
505
N-H
EX
AN
E1
5711
,608
00
011
,665
11,6
652-
ET
HO
XY
ET
HA
NO
L1
012
,975
00
012
,975
12,9
75C
YC
LO
HE
XA
NE
116
3,86
40
00
3,88
03,
880
LE
AD
10
00
00
00
____
____
____
____
___
____
____
____
___
____
____
____
431,
778,
818
574,
097
29,4
790
1,25
02,
383,
644
55,4
34
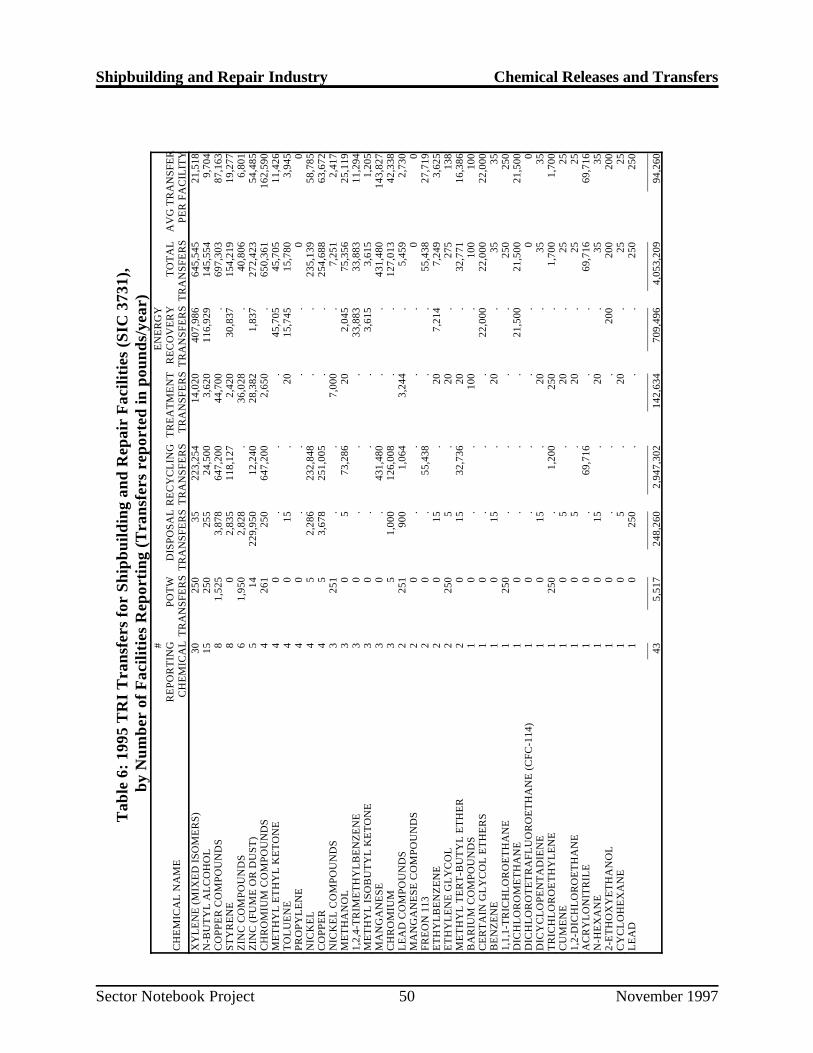
Shipbuilding and Repair Industry Chemical Releases and Transfers
Sector Notebook Project November 199750
Tab
le 6
: 199
5 T
RI
Tra
nsfe
rs fo
r Sh
ipbu
ildin
g an
d R
epai
r F
acili
ties
(SIC
373
1),
by N
umbe
r of
Fac
iliti
es R
epor
ting
(Tra
nsfe
rs r
epor
ted
in p
ound
s/ye
ar)
CH
EM
ICA
L N
AM
E
#R
EPO
RT
ING
CH
EM
ICA
LPO
TW
TR
AN
SFE
RS
DIS
POSA
LT
RA
NSF
ER
SR
EC
YC
LIN
GT
RA
NSF
ER
ST
RE
AT
ME
NT
TR
AN
SFE
RS
EN
ER
GY
RE
CO
VE
RY
TR
AN
SFE
RS
TO
TA
LT
RA
NSF
ER
SA
VG
TR
AN
SFE
RPE
R F
AC
ILIT
YX
YL
EN
E (M
IXE
D IS
OM
ER
S)30
250
3522
3,25
414
,020
407,
986
645,
545
21,5
18N
-BU
TY
L A
LC
OH
OL
1525
025
524
,500
3,62
011
6,92
914
5,55
49,
704
CO
PPE
R C
OM
POU
ND
S8
1,52
53,
878
647,
200
44,7
00.
697,
303
87,1
63ST
YR
EN
E8
02,
835
118,
127
2,42
030
,837
154,
219
19,2
77Z
INC
CO
MPO
UN
DS
61,
950
2,82
8.
36,0
28.
40,8
066,
801
ZIN
C (F
UM
E O
R D
UST
)5
1422
9,95
012
,240
28,3
821,
837
272,
423
54,4
85C
HR
OM
IUM
CO
MPO
UN
DS
426
125
064
7,20
02,
650
.65
0,36
116
2,59
0M
ET
HY
L E
TH
YL
KE
TO
NE
40
..
.45
,705
45,7
0511
,426
TO
LU
EN
E4
015
.20
15,7
4515
,780
3,94
5PR
OPY
LE
NE
40
..
..
00
NIC
KE
L4
52,
286
232,
848
..
235,
139
58,7
85C
OPP
ER
45
3,67
825
1,00
5.
.25
4,68
863
,672
NIC
KE
L C
OM
POU
ND
S3
251
..
7,00
0.
7,25
12,
417
ME
TH
AN
OL
30
573
,286
202,
045
75,3
5625
,119
1,2,
4-T
RIM
ET
HY
LB
EN
ZE
NE
30
..
.33
,883
33,8
8311
,294
ME
TH
YL
ISO
BU
TY
L K
ET
ON
E3
0.
..
3,61
53,
615
1,20
5M
AN
GA
NE
SE3
0.
431,
480
..
431,
480
143,
827
CH
RO
MIU
M3
51,
000
126,
008
..
127,
013
42,3
38L
EA
D C
OM
POU
ND
S2
251
900
1,06
43,
244
.5,
459
2,73
0M
AN
GA
NE
SE C
OM
POU
ND
S2
0.
..
.0
0FR
EO
N 1
132
0.
55,4
38.
.55
,438
27,7
19E
TH
YL
BE
NZ
EN
E2
015
.20
7,21
47,
249
3,62
5E
TH
YL
EN
E G
LY
CO
L2
250
5.
20.
275
138
ME
TH
YL
TE
RT
-BU
TY
L E
TH
ER
20
1532
,736
20.
32,7
7116
,386
BA
RIU
M C
OM
POU
ND
S1
0.
.10
0.
100
100
CE
RT
AIN
GL
YC
OL
ET
HE
RS
10
..
.22
,000
22,0
0022
,000
BE
NZ
EN
E1
015
.20
.35
351,
1,1-
TR
ICH
LO
RO
ET
HA
NE
125
0.
..
.25
025
0D
ICH
LO
RO
ME
TH
AN
E1
0.
..
21,5
0021
,500
21,5
00D
ICH
LO
RO
TE
TR
AFL
UO
RO
ET
HA
NE
(CFC
-114
)1
0.
..
.0
0D
ICY
CL
OPE
NT
AD
IEN
E1
015
.20
.35
35T
RIC
HL
OR
OE
TH
YL
EN
E1
250
.1,
200
250
.1,
700
1,70
0C
UM
EN
E1
05
.20
.25
251,
2-D
ICH
LO
RO
ET
HA
NE
10
5.
20.
2525
AC
RY
LO
NIT
RIL
E1
0.
69,7
16.
.69
,716
69,7
16N
-HE
XA
NE
10
15.
20.
3535
2-E
TH
OX
YE
TH
AN
OL
10
..
.20
020
020
0C
YC
LO
HE
XA
NE
10
5.
20.
2525
LE
AD
10
250
..
.25
025
0__
___
____
____
___
____
____
___
____
___
____
____
____
___
____
___
435,
517
248,
260
2,94
7,30
214
2,63
470
9,49
64,
053,
209
94,2
60

Shipbuilding and Repair Industry Chemical Releases and Transfers
Being included on this list does not mean that the release is associated with non-compliance with environmental laws.1
Sector Notebook Project November 199751
The TRI database contains a detailed compilation of self-reported, facility-specific chemical releases. The top reporting facilities for the shipbuilding andrepair industry are listed below in Tables 7 and 8. Facilities that have reportedonly the primary SIC codes covered under this notebook appear on Table 7.Table 8 contains additional facilities that have reported the SIC codes coveredwithin this notebook, or SIC codes covered within this notebook and one ormore SIC codes that are not within the scope of this notebook. Therefore, thesecond list may include facilities that conduct multiple operations -- some thatare under the scope of this notebook, and some that are not. Currently, thefacility-level data do not allow pollutant releases to be broken apart byindustrial process.
Table 7:Top 10 TRI Releasing Shipbuilding and Repair Facilities ReportingOnly SIC 3731 1
Rank Facility in PoundsTotal TRI Releases
1 Newport News Shipbuilding - Newport News, VA 309,0002 Atlantic Marine Inc. - Mobile, AL 268,670
3 Platzer Shipyard Inc. - Houston, TX 268,442
4 Norshipco - Norfolk, VA 229,000
5 Bethlehem Steel Corp.-Port Arthur, TX 133,020
6 Cascade General, Inc. - Portland, OR 116,929
7 Trinity Industries-Gulfport, MS 90,983
8 Todd Pacific Shipyards - Seattle, WA 85,081
9 Avondale Industries Inc. - Avondale, LA 84,650
10 Jeffboat - Jeffersonville, IN 82,108
Source: US Toxics Release Inventory Database, 1995.

Shipbuilding and Repair Industry Chemical Releases and Transfers
Being included on this list does not mean that the release is associated with non-compliance with enviromental laws.2
Sector Notebook Project November 199752
Table 8: Top 10 TRI Releasing Facilities Reporting Only SIC 3731 or SIC 3731 and Other SIC codes 2
Rank Reported in TRI Facility in PoundsSIC Codes Total TRI Releases
1 3731, 3441, 3443 Ingalls Shipbuilding Inc.-Pascagoula, MS 723,560
2 3731 Newport News Shipbuilding - Newport News, VA 309,000
3 3731 Atlantic Marine Inc. - Mobile, AL 268,670
4 3731 Platzer Shipyard Inc. - Houston, TX 268,442
5 3731 Norshipco - Norfolk, VA 229,000
6 3731 Bethlehem Steel Corp.-Port Arthur, TX 133,020
7 3731 Cascade General, Inc. - Portland, OR 116,929
8 3731 Trinity Industries-Gulfport, MS 90,983
9 3731 Todd Pacific Shipyards - Seattle, WA 85,081
10 3731 Avondale Industries Inc. - Avondale, LA 84,650 Source: US Toxics Release Inventory Database, 1995.
IV.B. Summary of Selected Chemicals Released
The following is a synopsis of current scientific toxicity and fate informationfor the top chemicals (by weight) that facilities within this sector self-reportedas released to the environment based upon 1995 TRI data. Because thissection is based upon self-reported release data, it does not attempt to provideinformation on management practices employed by the sector to reduce therelease of these chemicals. Information regarding pollutant release reductionover time may be available from EPA’s TRI and 33/50 programs, or directlyfrom the industrial trade associations that are listed in Section IX of thisdocument. Since these descriptions are cursory, please consult the sourcesreferenced below for a more detailed description of both the chemicalsdescribed in this section, and the chemicals that appear on the full list of TRIchemicals appearing in Section IV.A.
The brief descriptions provided below were taken from the HazardousSubstances Data Bank (HSDB) and the Integrated Risk Information System(IRIS). The discussions of toxicity describe the range of possible adversehealth effects that have been found to be associated with exposure to thesechemicals. These adverse effects may or may not occur at the levels releasedto the environment. Individuals interested in a more detailed picture of thechemical concentrations associated with these adverse effects should consult

Shipbuilding and Repair Industry Chemical Releases and Transfers
TOXNET is a computer system run by the National Library of Medicine that includes a number of toxicological3
databases managed by EPA, National Cancer Institute, and the National Institute for Occupational Safety and Health.For more information on TOXNET, contact the TOXNET help line at 800-231-3766. Databases included in TOXNETare: CCRIS (Chemical Carcinogenesis Research Information System), DART (Developmental and ReproductiveToxicity Database), DBIR (Directory of Biotechnology Information Resources), EMICBACK (Environmental MutagenInformation Center Backfile), GENE-TOX (Genetic Toxicology), HSDB (Hazardous Substances Data Bank), IRIS(Integrated Risk Information System), RTECS (Registry of Toxic Effects of Chemical Substances), and TRI (ToxicChemical Release Inventory). HSDB contains chemical-specific information on manufacturing and use, chemical andphysical properties, safety and handling, toxicity and biomedical effects, pharmacology, environmental fate and exposurepotential, exposure standards and regulations, monitoring and analysis methods, and additional references.
Sector Notebook Project November 199753
a toxicologist or the toxicity literature for the chemical to obtain moreinformation. The effects listed below must be taken in context of theseexposure assumptions that are more fully explained within the full chemicalprofiles in HSDB. For more information on TOXNET , contact the3
TOXNET help line at 1-800-231-3766.
Xylenes (Mixed Isomers) (CAS: 1330-20-7)
Sources. Xylenes are used extensively as cleaning solvents and in thinningpaints.
Toxicity. Xylenes are rapidly absorbed into the body after inhalation,ingestion, or skin contact. Short-term exposure of humans to high levels ofxylene can cause irritation of the skin, eyes, nose, and throat, difficulty inbreathing, impaired lung function, impaired memory, and possible changes inthe liver and kidneys. Both short- and long-term exposure to highconcentrations can cause effects such as headaches, dizziness, confusion, andlack of muscle coordination. Reactions of xylene (see environmental fate) inthe atmosphere contribute to the formation of ozone in the lower atmosphere.Ozone can affect the respiratory system, especially in sensitive individualssuch as asthma or allergy sufferers.
Carcinogenicity. There is currently no evidence to suggest that this chemicalis carcinogenic.
Environmental Fate. A portion of releases to land and water will quicklyevaporate, although some degradation by microorganisms will occur. Xylenesare moderately mobile in soils and may leach into groundwater, where theymay persist for several years. Xylenes are volatile organic chemicals. Assuch, xylene in the lower atmosphere will react with other atmosphericcomponents, contributing to the formation of ground-level ozone and otherair pollutants.

Shipbuilding and Repair Industry Chemical Releases and Transfers
Sector Notebook Project November 199754
Zinc and Zinc Compounds (CAS: 7440-66-6; 20-19-9)
Sources. To protect metal from oxidizing, it is often coated with a materialthat will protect it from moisture and air. In the galvanizing process, steel iscoated with zinc.
Toxicity. Zinc is a nutritional trace element; toxicity from ingestion is low.Severe exposure to zinc might give rise to gastritis with vomiting due toswallowing of zinc dusts. Short-term exposure to very high levels of zinc islinked to lethargy, dizziness, nausea, fever, diarrhea, and reversiblepancreatic and neurological damage. Long-term zinc poisoning causesirritability, muscular stiffness and pain, loss of appetite, and nausea.
Zinc chloride fumes cause injury to mucous membranes and to the skin.Ingestion of soluble zinc salts may cause nausea, vomiting, and purging.
Carcinogenicity. There is currently no evidence to suggest that thischemical is carcinogenic.
Environmental Fate. Significant zinc contamination of soil is only seen inthe vicinity of industrial point sources. Zinc is a relatively stable soft metal,though burns in air. Zinc bioconcentrates in aquatic organisms.
n-Butanol (n-Butyl Alcohol) (CAS: 71-36-3)
Sources. n-Butanol is used extensively for thinning paints and equipmentcleaning.
Toxicity. Short-term exposure usually results in depression of the centralnervous system, hypotension, nausea, vomiting, and diarrhea. Butanols maycause gastrointestinal hemorrhaging. Eye contact may cause burning andblurred vision. Hypotension and cardiac arrhythmias may occur. Inhaling n-butanol may cause pulmonary edema. Headache, dizziness, and giddiness mayoccur. Liver injury may occur but is probably rare. Dermatitis andhypoglycemia may result from exposure to this chemical. Chronic exposuremay result in dry, cracked skin, and eye inflammation. Workers haveexhibited systemic effects of the auditory nerve as well as vestibular injury.
Carcinogenicity. There are currently no long-term studies in humans oranimals to suggest that this chemical is carcinogenic. Based on this evidence,U.S. EPA has indicated that this chemical cannot be classified as to its humancarcinogenicity. There is some evidence of chromosomal abnormalities inshort-term tests in bacteria and hamster cells, which may suggest potentialcarcinogenicity.

Shipbuilding and Repair Industry Chemical Releases and Transfers
Sector Notebook Project November 199755
Environmental Fate. This chemical may volatilize from soil surface. Inaddition, the chemical may biodegrade from the soil, and leach togroundwater. n-Butanol released to water is expected to biodegrade andvolatilize from the water surface, and is not expected to bioconcentrate in fish.People are exposed primarily from contact with products containing n-butanol.
Copper and Copper Compounds (CAS: 7440-50-8)
Sources. Copper and copper compounds are commonly used as biocides inanti-fouling paints. Many ship parts requiring anti-corrosive characteristics(e.g., piping) are fabricated or plated with copper and copper alloys.
Toxicity. Metallic copper probably has little or no toxicity, although coppersalts are more toxic. Inhalation of copper oxide fumes and dust has beenshown to cause metal fume fever, irritation of the upper respiratory tract,nausea, sneezing, coughing, chills, aching muscles, gastric pain, and diarrhea.However, the respiratory symptoms may be due to a non-specific reaction tothe inhaled dust as a foreign body in the lung, and the gastrointestinalsymptoms may be attributed to the conversion of copper to copper salts in thebody.
It is unclear whether long-term copper poisoning exists in humans. Somehave related certain central nervous system disorders, such as giddiness, lossof appetite, excessive perspiration, and drowsiness to copper poisoning.Long-term exposure to copper may also cause hair, skin, and teethdiscoloration, apparently without other adverse effects.
People at special risk from exposure to copper include those with impairedpulmonary function, especially those with obstructive airway diseases, sincethe breathing of copper fumes might cause exacerbation of pre-existingsymptoms due to its irritant properties.
Ecologically, copper is a trace element essential to many plants and animals.However, high levels of copper in soil can be directly toxic to certain soilmicroorganisms and can disrupt important microbial processes in soil, such asnitrogen and phosphorus cycling.
Carcinogenicity. There is currently no evidence to suggest that this chemicalis carcinogenic.
Environmental Fate. Copper is typically found in the environment as a solidmetal in soils and soil sediment in surface water. There is no evidence thatbiotransformation processes have a significant bearing on the fate andtransport of copper in water.

Shipbuilding and Repair Industry Chemical Releases and Transfers
Sector Notebook Project November 199756
Styrene (CAS: 100-42-5)
Sources. Styrene is a major constituent of fiberglass resins and gelcoats.
Toxicity. Short-term exposure may cause irritation to eyes, lungs, stomach,and skin. Problems may occur in the central nervous system as a result ofserious exposure and may also occur in the peripheral nervous system. Short-term exposure from inhalation is commonly associated with “styrenesickness”, which includes vomiting, loss of appetite, and a drunken feeling.Short-term exposure also irritates the respiratory tract, and is associated withasthma and pulmonary edema.
Long-term exposure in those working with styrene has been associated withimpaired nervous system functions including memory, learning, and motorskills and impaired psychiatric functioning. Styrene may also cause genemutations and birth defects. Styrene has been shown to cause liver damage.
Carcinogenicity. The International Agency for Research on Cancer notesthat evidence of carcinogenicity in experimental animals indicates that styreneis a possible carcinogen in humans. However, U.S. EPA is currentlyreviewing the evidence for carcinogenicity of styrene, and may arrive at adifferent decision.
Environmental Fate and Potential for Human Exposure. If styrene isreleased to air, it will quickly react with hydroxyl radicals and ozone. Atnight, air concentrations of styrene will degrade by reacting with nitrateradicals. Styrene released to water volatilizes and biodegrades, but does nothydrolyze. In soil, styrene biodegrades and is fairly immobile in soil. Styrenehas been found in drinking water, but not in 945 groundwater supplies. Thechemical has been found in industrial effluents and in air surrounding industrialsources and in urban areas. The chemical has been found in some foodpackaged in polystyrene containers.
Shipbuilding and Repair Industry Chemical Releases and Transfers
Sector Notebook Project November 199757
IV.C. Other Data Sources
The toxic chemical release data obtained from TRI captures only about sevenpercent of the facilities in the shipbuilding and repair industry. However, itallows for a comparison across years and industry sectors. Reportedchemicals are limited to the approximately 600 TRI chemicals. A largeportion of the emissions from shipbuilding and repair facilities, therefore, arenot captured by TRI. The EPA Office of Air Quality Planning and Standardshas compiled air pollutant emission factors for determining the total airemissions of priority pollutants (e.g., total hydrocarbons, SOx, NOx, CO,particulates, etc.) from many shipbuilding and repair sources.
The Aerometric Information Retrieval System (AIRS) contains a wide rangeof information related to stationary sources of air pollution, including theemissions of a number of air pollutants which may be of concern within aparticular industry. With the exception of volatile organic compounds(VOCs), there is little overlap with the TRI chemicals reported above. Table9 summarizes annual releases (from the industries for which a SectorNotebook Profile was prepared) of carbon monoxide (CO), nitrogen dioxide(NO ), particulate matter of 10 microns or less (PM10), total particulate2
matter (PT), sulfur dioxide (SO ), and volatile organic compounds (VOCs).2
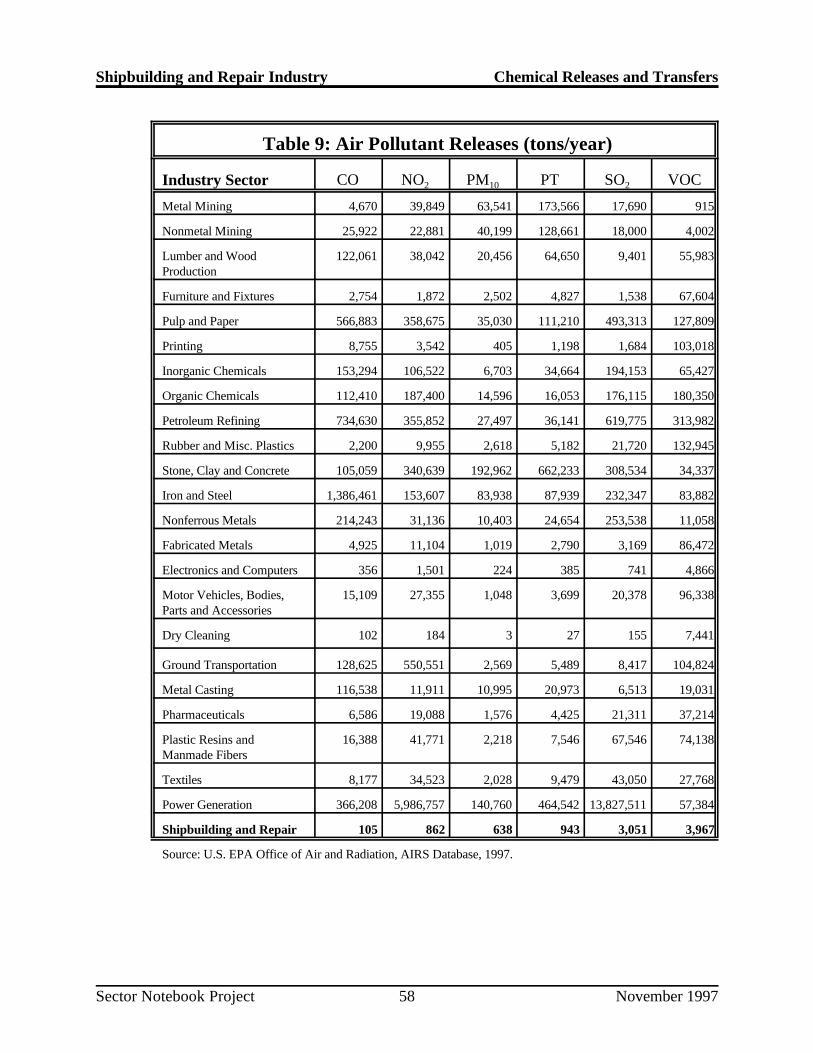
Shipbuilding and Repair Industry Chemical Releases and Transfers
Sector Notebook Project November 199758
Table 9: Air Pollutant Releases (tons/year)
Industry Sector CO NO PM PT SO VOC2 10 2
Metal Mining 4,670 39,849 63,541 173,566 17,690 915
Nonmetal Mining 25,922 22,881 40,199 128,661 18,000 4,002
Lumber and Wood 122,061 38,042 20,456 64,650 9,401 55,983Production
Furniture and Fixtures 2,754 1,872 2,502 4,827 1,538 67,604
Pulp and Paper 566,883 358,675 35,030 111,210 493,313 127,809
Printing 8,755 3,542 405 1,198 1,684 103,018
Inorganic Chemicals 153,294 106,522 6,703 34,664 194,153 65,427
Organic Chemicals 112,410 187,400 14,596 16,053 176,115 180,350
Petroleum Refining 734,630 355,852 27,497 36,141 619,775 313,982
Rubber and Misc. Plastics 2,200 9,955 2,618 5,182 21,720 132,945
Stone, Clay and Concrete 105,059 340,639 192,962 662,233 308,534 34,337
Iron and Steel 1,386,461 153,607 83,938 87,939 232,347 83,882
Nonferrous Metals 214,243 31,136 10,403 24,654 253,538 11,058
Fabricated Metals 4,925 11,104 1,019 2,790 3,169 86,472
Electronics and Computers 356 1,501 224 385 741 4,866
Motor Vehicles, Bodies, 15,109 27,355 1,048 3,699 20,378 96,338Parts and Accessories
Dry Cleaning 102 184 3 27 155 7,441
Ground Transportation 128,625 550,551 2,569 5,489 8,417 104,824
Metal Casting 116,538 11,911 10,995 20,973 6,513 19,031
Pharmaceuticals 6,586 19,088 1,576 4,425 21,311 37,214
Plastic Resins and 16,388 41,771 2,218 7,546 67,546 74,138Manmade Fibers
Textiles 8,177 34,523 2,028 9,479 43,050 27,768
Power Generation 366,208 5,986,757 140,760 464,542 13,827,511 57,384
Shipbuilding and Repair 105 862 638 943 3,051 3,967
Source: U.S. EPA Office of Air and Radiation, AIRS Database, 1997.

Shipbuilding and Repair Industry Chemical Releases and Transfers
Sector Notebook Project November 199759
IV.D. Comparison of Toxic Release Inventory Between Selected Industries
The following information is presented as a comparison of pollutant releaseand transfer data across industrial categories. It is provided to give a generalsense as to the relative scale of TRI releases and transfers within each sectorprofiled under this project. Please note that the following figure and table donot contain releases and transfers for industrial categories that are notincluded in this project, and thus cannot be used to draw conclusionsregarding the total release and transfer amounts that are reported to TRI.Similar information is available within the annual TRI Public Data ReleaseBook.
Figure 10 is a graphical representation of a summary of the 1995 TRI data forthe shipbuilding and repair industry and the other sectors profiled in separatenotebooks. The bar graph presents the total TRI releases and total transferson the vertical axis. The graph is based on the data shown in Table 10 and ismeant to facilitate comparisons between the relative amounts of releases,transfers, and releases per facility both within and between these sectors. Thereader should note, however, that differences in the proportion of facilitiescaptured by TRI exist between industry sectors. This can be a factor of poorSIC matching and relative differences in the number of facilities reporting toTRI from the various sectors. In the case of the shipbuilding and repairindustry, the 1995 TRI data presented here covers 43 facilities. These facilitieslisted SIC 3731 (Shipbuilding and Repair) as primary SIC codes.

0
100
200
300
400
500
60022 24 25
2611
-263
1
2711
-278
9
2812
-281
9
2821
, 282
3, 2
824
2833
, 283
4
2861
-286
9
2911 30 32 331
332,
336
333,
334 34 36 371
3731
SIC Range
To
tal P
ou
nd
s (m
illio
ns)
Total Releases Total Transfers
Shipbuilding and Repair Industry Chemical Releases and Transfers
Sector Notebook Project November 199760
Figure 6: Summary of TRI Releases and Transfers by Industry
Source: US EPA 1995 Toxics Release Inventory Database.
SIC Range Industry Sector SIC Range Industry Sector SIC Range Industry Sector22 Textiles 2833, 2834 Pharmaceuticals 333, 334 Nonferrous Metals24 Lumber and Wood Products 2861-2869 Organic Chem. Mfg. 34 Fabricated Metals25 Furniture and Fixtures 2911 Petroleum Refining 36 Electronic Equip. and Comp.2611-2631 Pulp and Paper 30 Rubber and Misc. Plastics 371 Motor Vehicles, Bodies,
Parts, and Accessories2711-2789 Printing 32 Stone, Clay, and Concrete 3731 Shipbuilding and Repair2812-2819 Inorganic Chemical 331 Iron and Steel
Manufacturing2821, Plastic Resins and Manmade 332, 336 Metal Casting2823, 2824 Fibers
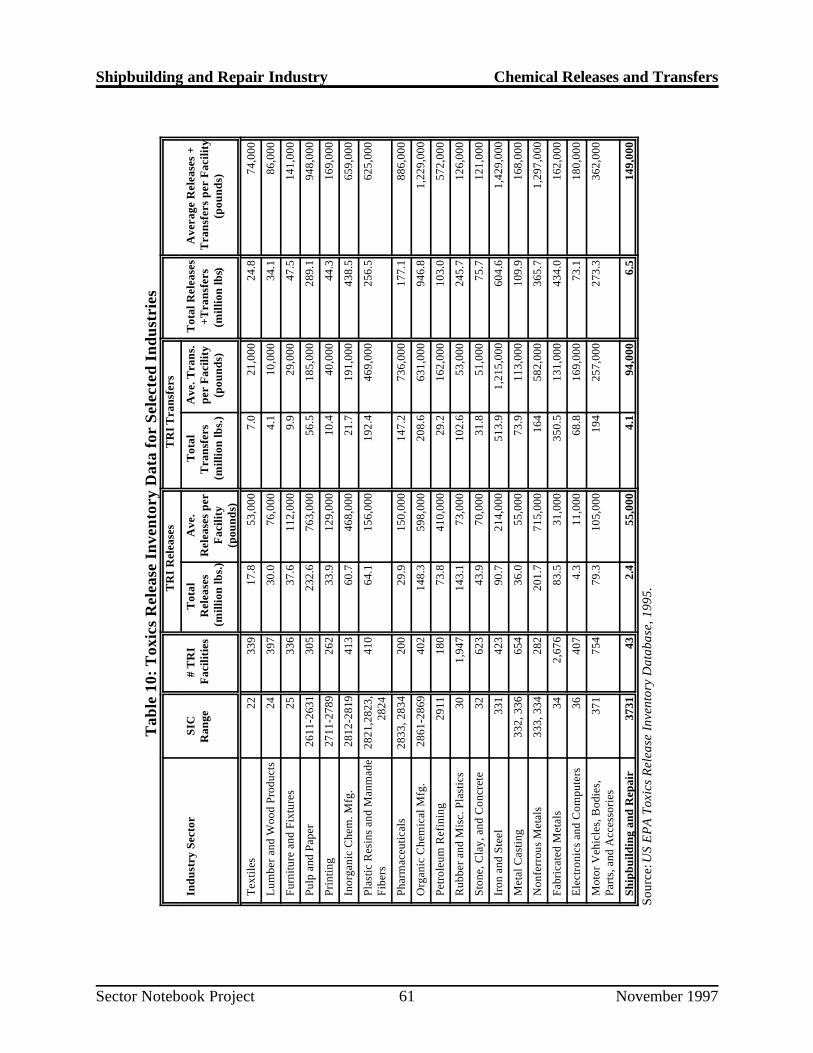
Shipbuilding and Repair Industry Chemical Releases and Transfers
Sector Notebook Project November 199761
Tab
le 1
0: T
oxic
s R
elea
se I
nven
tory
Dat
a fo
r Se
lect
ed I
ndus
trie
sT
RI
Rel
ease
sT
RI T
rans
fers
Indu
stry
Sec
tor
SIC
Ran
ge
# T
RI
Fac
iliti
esT
otal
Rel
ease
s(m
illio
n lb
s.)
Ave
.R
elea
ses
per
Fac
ility
(pou
nds)
Tot
alT
rans
fers
(mill
ion
lbs.
)
Ave
. Tra
ns.
per
Fac
ility
(pou
nds)
Tot
al R
elea
ses
+Tra
nsfe
rs(m
illio
n lb
s.)
Ave
rage
Rel
ease
s +
Tra
nsfe
rs p
er F
acili
ty(p
ound
s)
Tex
tiles
2233
917
.853
,000
7.0
21,
000
24.8
74,0
00
Lum
ber a
nd W
ood
Prod
ucts
2439
730
.076
,000
4.1
10,0
0034
.186
,000
Furn
iture
and
Fix
ture
s25
336
37.6
112,
000
9.9
29,0
0047
.514
1,00
0
Pulp
and
Pap
er26
11-2
631
305
232.
676
3,00
056
.518
5,00
028
9.1
948,
000
Prin
ting
2711
-278
926
233
.912
9,00
010
.440
,000
44.3
169,
000
Inor
gani
c C
hem
. Mfg
.28
12-2
819
413
60.7
468,
000
21.7
191,
000
438.
565
9,00
0
Plas
tic R
esin
s an
d M
anm
ade
Fibe
rs28
21,2
823,
2824
410
64.1
156,
000
192.
446
9,00
025
6.5
625,
000
Phar
mac
eutic
als
2833
, 283
420
029
.915
0,00
014
7.2
736,
000
177.
188
6,00
0
Org
anic
Che
mic
al M
fg.
2861
-286
940
214
8.3
598,
000
208.
663
1,00
094
6.8
1,22
9,00
0
Petr
oleu
m R
efin
ing
2911
180
73.8
410,
000
29.2
162,
000
103.
057
2,00
0
Rub
ber a
nd M
isc.
Pla
stic
s30
1,94
714
3.1
73,0
0010
2.6
53,0
0024
5.7
126,
000
Ston
e, C
lay,
and
Con
cret
e32
623
43.9
70,0
0031
.851
,000
75.7
121,
000
Iron
and
Ste
el33
142
390
.721
4,00
051
3.9
1,21
5,00
060
4.6
1,42
9,00
0
Met
al C
astin
g33
2, 3
3665
436
.055
,000
73.9
113,
000
109.
916
8,00
0
Non
ferr
ous
Met
als
333,
334
282
201.
771
5,00
016
458
2,00
036
5.7
1,29
7,00
0
Fabr
icat
ed M
etal
s34
2,67
683
.531
,000
350.
513
1,00
043
4.0
162,
000
Ele
ctro
nics
and
Com
pute
rs36
407
4.3
11,0
0068
.816
9,00
073
.118
0,00
0
Mot
or V
ehic
les,
Bod
ies,
Part
s, a
nd A
cces
sori
es37
175
479
.310
5,00
019
425
7,00
027
3.3
362,
000
Ship
build
ing
and
Rep
air
3731
432.
455
,000
4.1
94,0
006.
514
9,00
0
Sour
ce: U
S E
PA
Tox
ics
Rel
ease
Inve
ntor
y D
atab
ase,
199
5.

Shipbuilding and Repair Industry Chemical Releases and Transfers
Sector Notebook Project November 199762
Page 62 intentionally left blank.

Shipbuilding and Repair Pollution Prevention Opportunities
Sector Notebook Project November 199763
V. POLLUTION PREVENTION OPPORTUNITIES
The best way to reduce pollution is to prevent it in the first place. Somecompanies have creatively implemented pollution prevention techniques thatimprove efficiency and increase profits while at the same time minimizingenvironmental impacts. This can be done in many ways such as reducingmaterial inputs, re-engineering processes to reuse by-products, improvingmanagement practices, and employing substitution of toxic chemicals. Somesmaller facilities are able to actually get below regulatory thresholds just byreducing pollutant releases through aggressive pollution prevention policies.
The Pollution Prevention Act of 1990 established a national policy ofmanaging waste through source reduction, which means preventing thegeneration of waste. The Pollution Prevention Act also established as nationalpolicy a hierarchy of waste management options for situations in which sourcereduction cannot be implemented feasibly. In the waste managementhierarchy, if source reduction is not feasible the next alternative is recyclingof wastes, followed by energy recovery, and waste treatment as a lastalternative.
In order to encourage these approaches, this section provides both generaland company-specific descriptions of some pollution prevention advances thathave been implemented within the shipbuilding and repair industry. While thelist is not exhaustive, it does provide core information that can be used as thestarting point for facilities interested in beginning their own pollutionprevention projects. This section provides summary information fromactivities that may be, or are being implemented by this sector. Whenpossible, information is provided that gives the context in which the techniquecan be used effectively. Please note that the activities described in this sectiondo not necessarily apply to all facilities that fall within this sector. Facility-specific conditions must be carefully considered when pollution preventionoptions are evaluated, and the full impacts of the change must examine howeach option affects air, land and water pollutant releases.
Much of the information contained in this Section was obtained fromHazardous Waste Minimization Guide for Shipyards, produced by theNational Shipbuilding Research Program (NSRP) in cooperation with the U.S.Navy and National Steel and Shipbuilding Company (NASSCO). The Guideprovides and extensive discussion of pollution prevention opportunitiesavailable to shipyards which could not all be reproduced in this document.For further details on pollution prevention opportunities for shipyards, readersare encouraged to consult the Guide and the additional references listed inSection IX of this sector notebook. In addition, many of the pollutionprevention opportunities listed in the Profile of the Fabricated MetalProducts Industry Sector Notebook can also be applied to the shipbuilding andrepair industry.

Shipbuilding and Repair Pollution Prevention Opportunities
Sector Notebook Project November 199764
V.A. Surface Preparation
The majority of wastes generated during surface preparation are spentabrasives mixed with paint chips. One way the volume of waste generated canbe reduced is by using blast media that is relatively easy to reuse. Someabrasives, such as mineral abrasives, are not easily reused. Copper slag hasa very low reuse factor and in general, can be used no more than twice beforebreaking down.
Steel Shot and Grit
One of the most widely used reusable abrasives is steel grit, which is a crushedform of steel shot. While slags and sands can only be used a couple of times,steel abrasives can be used 50 times or more. With reused steel abrasive, caremust be taken to watch that the abrasive does not become rounded. Theabrasive works best if it has a sharp angular shape. Steel shot and grit requirea high initial outlay of capital, but they can be used repeatedly to the point thatthey are more cost effective than copper slag. This medium is only deemedhazardous when it is contaminated with a sufficient amount of paint chips.
Improving Recyclability of Abrasive Blasting Media
In order to realize the maximum usage of reusable grit, measures must betaken to ensure it can be reused. Some media, such as steel shot, can bereused hundreds of times. It is important that the used grit is recovered asmuch as possible. With wheelabrator type equipment, this is doneautomatically. The used abrasive may be vacuumed up or mechanically fed tothe blasting equipment. Containment of the abrasive allows it to be recovered,where otherwise it could suffer from loss to overspray. Protection from theweather, such as rain, will also prolong the life of the grit. It is very importantthat waste streams, especially hazardous waste, are not mixed with usedblasting media. Outside debris and other waste could render the grit unfit forreuse.
Often, air powered cleaning equipment is used to screen abrasive to separateit from large paint particles. These systems may also remove lighter dust fromthe heavy abrasive. This media separation can be especially important whenthe paint being removed contains heavy metals. An alternative to on-sitereclamation is to send it for processing off-site.
Plastic Media Blasting
As a substitute for other blast media, the military has experimented extensivelywith plastic media stripping. This process is particularly good for strippingcoatings from parts with fragile substrates such as zinc, aluminum, andfiberglass. It can be a lengthy process because it strips paint layer by layer.

Shipbuilding and Repair Pollution Prevention Opportunities
Sector Notebook Project November 199765
The same types and quantities of waste are generated as with grit blasting, butthe plastic medium is more recyclable with the use of pneumatic mediaclassifiers that are part of the stripping equipment. The only waste requiringdisposal is the paint waste itself. However, the use of plastic media is fairlylimited in shipyards. Plastic blasting media do not work well on epoxy paints.In addition, the blasting equipment is expensive and requires trainedoperators.
Water Jet Stripping (Hydroblasting)
Hydroblasting is a cavitating high pressure water jet stripping system that canremove most paints. These system may use pressures as high as 50,000 psig.Hydroblasting is an excellent method for removing even hard coatings frommetal substrates. The process can be used for stripping hulls, removing scalesand deposits from heat exchangers, and removing rubber liners. Somesystems automatically remove the paint chips or stripped material from thewater and reuse the water for further blasting. By recirculating the water inthis manner, the amount of waste is greatly reduced. Wastewater from thisprocess is usually suitable for sewer disposal after the paint particles areremoved. Although this process produces very little waste, it is not always asefficient as abrasive grit blasting and has relatively high capital andmaintenance costs.
V.B. Painting and Coating
Painting and coating operations are typically the largest single source of VOCemissions from shipyards. In addition, paint waste can account for more thanhalf of the total hazardous waste generated at shipyards. Paint waste at ashipyard may include leftover paint in containers, overspray, paint that is nolonger usable (Non-spec paint), and rags and other materials contaminatedwith paint. In many cases, the amount of paint waste generated can bereduced through the use of improved equipment, alternative coatings, andgood operating practices.
Regulations under the CAA aimed at reducing VOC emissions by limitingVOC content in paints were finalized in 1996. Shipyards required to complywith these rules and wishing to implement the pollution prevention optionsdiscussed below, should consult the regulations to determine the practical andlegal implications of these options.
V.B.1. Application Equipment
In order to effectively reduce paint waste and produce a quality coating,proper application techniques should be supplemented with efficientapplication equipment. Through the use of equipment with high transferefficiencies, the amount of paint lost to overspray is minimized.

Shipbuilding and Repair Pollution Prevention Opportunities
Sector Notebook Project November 199766
High Volume Low Pressure (HVLP) Spray Guns
The HVLP spray gun is basically a conventional air spray gun withmodifications and special nozzles that atomize the paint at very low airpressures. The atomizing pressure of HVLP systems is often below 10 psi.The design of this gun allows better transfer efficiency and reduced overspraythan that of conventional air guns. The low application pressure decreasesexcessive bounceback and allows better adhesion of the coating to thesubstrate.
Although improvements are consistently being made to overcome itslimitations, most HVLP systems have some definite drawbacks, includingdifficulty atomizing viscous coatings, sensitivity to variations in incomingpressure, sensitivity to wind, and slow application rates.
Airless Spray Guns
Instead of air passing through the spray gun, an airless system applies staticpressure to the liquid paint. As the paint passes through the nozzle, thesudden drop in pressure atomizes the paint and it is carried to the substrate byits own momentum. Pressure is applied to the paint by a pump located at aremote supply. These systems have become favorable over conventional air-spray systems for three main reasons: 1) reduced overspray and rebound, 2)high application rates and transfer efficiency, and 3) permits the use of high-build coatings with the result that fewer coats are required to achieve specificfilm thickness.
One major disadvantage of some airless spray systems is the difficultyapplying very thin coats. If coatings with less than a mil in thickness arerequired, such as primers applied to objects that require weld ability, it maybe difficult to use an airless system.
Electrostatic Spray
Electrostatic spray system utilize paint droplets that are given a negativecharge in the vicinity of a positively charged substrate. The droplets areattracted to the substrate and a uniform coating is formed. This system workswell on cylindrical and rounded objects due to its “wrap-around” effect thatnearly allows the object to be coated from one side. Very little paint is lost tooverspray, and it has been noted to have a transfer efficiency of over 95%.
In order for an electrostatic system to operate properly, the correct solventbalance is needed. The evaporation rate must be slow enough for the chargeddroplets to reach the substrate in a fluid condition to flow out into a smoothfilm, but fast enough to avoid sagging. The resistivity of the paint must alsobe low enough to enable the paint droplets to acquire the maximum charge.

Shipbuilding and Repair Pollution Prevention Opportunities
Sector Notebook Project November 199767
Although the operating costs of electrostatic spray systems are relatively low,the initial capital investment can be high. This system has been found to workextremely well in small parts painting applications. Sometimes the installationof an electrostatic powder coating system can replace a water curtain spraypaint booth.
Heated Spray
When paint is heated, its viscosity is reduced allowing it to be applied with ahigher solids content, thus requiring less solvent. When the paint is heated ina special container and supplied to the gun at 140 to 160 F, coatings of 2 to4 mils dry-film thickness can be applied in one operation, resulting inconsiderable savings in labor cost. In addition, much of the associated solventemissions are eliminated.
Heating the coating prior to application can be used with both conventionaland airless spray applications. An in-line heater is used to heat the coatingbefore it reaches the gun. As the coating is propelled through the air, it coolsrapidly and increases viscosity after it hits the surface, allowing for betteradhesion to the substrate.
Plural Component Systems
A common problem that shipyards face when working with two-part coatingsis overmixing. Once the component parts of a catalyst coating are mixed, thecoating must be applied. Otherwise, the excess unused coating will cure andrequire disposal. Additionally, the coating equipment must be cleanedimmediately after use.
One large advantage of plural component technology is the elimination ofpaint waste generated by mixing an excess amount of a two part coating. Thisis achieved through the use of a special mixing chamber that mixes thepigment and catalyst seconds before the coating is applied. Each componentis pumped through a device that controls the mixing ratio and then iscombined in a mixing chamber. From the mixing chamber, the mixed coatingtravels directly to the spray guns. The only cleaning that is required is themixing chamber, gun, and the length of supply hose connecting them.
Recycle Paint Booth Water
Various methods and equipment are used to reduce or eliminate the dischargeof the water used in water-wash booths (water curtain). These methods andequipment prevent the continuous discharge of booth waters by conditioning(i.e., adding detacifiers and paint-dispersing polymers) and removing paintsolids. The most basic form of water maintenance is the removal of paintsolids by manual skimming and/or raking. This can be performed without

Shipbuilding and Repair Pollution Prevention Opportunities
Sector Notebook Project November 199768
water conditioning since some portion of solvent-based paints usually floatand/or sink. With the use of detacifiers and paint-dispersing polymertreatments, more advanced methods of solids removal can be implemented.Some common methods are discussed below.
Wet-Vacuum Filtration. Wet-vacuum filtration units consist of an industrialwet-vacuum head on a steel drum containing a filter bag. The unit is used tovacuum paint sludge from the booth. The solids are filtered by the bag andthe water is returned to the booth. Large vacuum units are also commerciallyavailable that can be moved from booth to booth by forklift or permanentlyinstalled near a large booth.
Tank-Side Weir. A weir can be attached to the side of a side-draft boothtank, allowing floating material to overflow from the booth and be pumped toa filtering tank for dewatering.
Consolidator. A consolidator is a separate tank into which booth water ispumped. The water is then conditioned by the introduction of chemicals.Detacified paint floats to the surface of the tank, where it is skimmed by acontinuously moving blade. The clean water is recycled to the booth.
Filtration. Various types of filtration units are used to remove paint solidsfrom booth water. This is accomplished by pumping the booth water to theunit where the solids are separated and returning the water to the booth. Thesimplest filtration unit consists of a gravity filter bed utilizing paper or clothmedia. Vacuum filters are also employed, some of which require precoatingwith diatomaceous earth.
Centrifuge Methods. Two common types of centrifugal separators are thehydrocyclone and the centrifuge. The hydrocyclone is used to concentratesolids. The paint booth water enters a cone-shaped unit under pressure andspins around the inside surface. The spinning imparts an increased force ofgravity, which causes most of the solid particles to be pulled outward to thewalls of the cone. Treated water exits the top of the unit and the solids exitfrom the bottom. Some systems have secondary filtration devices to furtherprocess the solids. The centrifuge works in a similar manner, except that thebooth water enters a spinning drum, which imparts the centrifugal forceneeded for separating the water and solids. Efficient centrifugation requiresclose control of the booth water chemistry to ensure a uniform feed. Also,auxiliary equipment such as booth water agitation equipment may be needed(EPA, 1995).
Convert Wash-Water Booths to Dry Filter Booths
Water-wash booths can be converted to or replaced by dry filter booths. Thedry filter booths have the potential to eliminate the discharge of wastewater,
Shipbuilding and Repair Pollution Prevention Opportunities
Sector Notebook Project November 199769
but they create a solid waste stream. The choice between using a water-washbooth or a dry filter booth is primarily based on the quantity of overspray. Itis usually cost effective to use a dry filter booth when paint usage does notexceed 20 gallons/8 hour shift/10 feet of chamber width.
A 1989 Navy study concluded that conversion from wet to dry booths can becost effectively performed over a range of operational scenarios. The Navywork included a survey of military and industrial facilities that havesuccessfully made the conversion and an economic analysis based on typicalNavy painting operational parameters (EPA, 1995).
V.B.2. Alternative Coatings
The use of solvent-based coatings can lead to high costs to meet air and waterquality regulations. In efforts to reduce the quantity and toxicity of wastepaint disposal, alternative coatings have been developed that do not requirethe use of solvents and thinners.
Powder Coatings
Metal substrates can be coated with certain resins by applying the powderedresin to the surface, followed by application of heat. The heat melts the resin,causing it to flow and form a uniform coating. The three main methods in usefor applying the powder coating are fluidized bed, electrostatic spray, andflame spraying.
Flame spraying is the most applicable method for shipyards. The resin powderis blown through the gun by compressed air. The particles are melted in ahigh temperature flame and propelled against the substrate. This process isused widely with epoxy powders for aluminum surfaces.
The electrostatic application method uses the same principles as theelectrostatic spray. The resin powder is applied to the surfaceelectrostatically. Heat is applied to the covered surface and the powder meltsto form the coating. The transfer efficiency and recyclability of this methodis very high.
The elimination of environmental problems associated with many liquid basedsystems is one of the major advantages of powder coatings. The use ofpowder coatings eliminates the need for solvents and thereby emits negligiblevolatile organic compounds (VOCs). Powder coatings also reduce the wasteassociated with unused two-part coatings that have already been mixed. Sincepowder overspray can be recycled, material utilization is high and solid wastegeneration is low. Recent case studies demonstrate that powder coatingsystems can be cleaner, more efficient, and more environmentally acceptable,while producing a higher quality finish than many other coating systems.

Shipbuilding and Repair Pollution Prevention Opportunities
Sector Notebook Project November 199770
Water-Based Paints
Water-based coatings are paints containing a substantial amount of waterinstead of volatile solvents. Alkyd, polyester, acrylic, and epoxy polymers canbe dissolved and dispersed by water. In addition to reduction inenvironmental hazards due to substantially lower air emissions, a decrease inthe amount of hazardous paint sludge generated can reduce disposal cost.
The application for water-based coatings in the shipyard are limited. Some ofthe areas of use may include the inside of the superstructure of a vessel, andother surfaces that are protected from extreme conditions.
V.B.3. Good Operating Practices
In many cases, simply altering a painting process can reduce wastes throughbetter management.
Coating Application
A good manual coating application technique is very important in reducingwaste. Most shipyards rely primarily on spraying methods for coatingapplication. If not properly executed, spraying techniques have a highpotential for creating waste; therefore, proper application techniques are veryimportant.
Reducing Overspray One of the most common means of producing paintwaste at shipyards is overspray. Overspray not only wastes some of thecoating, it also presents environmental and health hazards. It is important thatshipyards try to reduce the amount of overspray as much as possible.Techniques for reducing overspray include: 1) triggering the paint gun at theend of each pass instead of carrying the gun past the edge of the surfacebefore reversing directions, 2) avoiding excessive air pressure, and 3) keepingthe gun perpendicular to the surface being coated.
Uniform Finish Application of a good uniform finish provides the surface withquality coating with a higher performance than an uneven finish. An unevencoating does not dry evenly and commonly results in using excess paint.
Overlap An overlap of 50 percent can reduce the amount of waste byincreasing the production rate and overall application efficiency. Overlap of50 percent means that for every pass that the operator makes with the spraygun, 50 percent of the area covered by the previous pass is also sprayed. Ifless than a 50 percent overlap is used, the coated surface may appear streaked.If more than a 50 percent overlap is used, the coating is wasted and morepasses are required to coat the surface.

Shipbuilding and Repair Pollution Prevention Opportunities
Sector Notebook Project November 199771
General Housekeeping
Small quantities of paint and solvents are frequently lost due to poorhousekeeping techniques. There are a variety of ways that can beimplemented to control and minimize spills and leaks. Specific approaches toproduct transfer methods and container handling can effectively reduceproduct loss.
The potential for accidents and spills is at the highest point when thinners andpaints are being transferred from bulk drum storage to the process equipment.Spigots, pumps, and funnels should be used whenever possible.
Evaporation can be controlled by using tight fitting lids, spigots, and otherequipment. The reduction in evaporation will increase the amount of availablematerial and result in lower solvent purchase cost.
Paint Containers
A significant portion of paint waste is the paint that remains inside a containerafter the container is emptied, and paint that is placed in storage, not used,and becomes outdated or non-spec. Shipyards should try to consolidate paintuse to facilitate the purchase of paint in bulk. Since large bulk containers haveless surface area than an equivalent volume of small cans, the amount of drag-on paint waste is reduced. Large bulk containers can sometimes be returnedto the paint supplier to be cleaned for reuse.
If the purchase of paint in bulk containers is not practical, the paint should bepurchased in the smallest amount required to minimize outdated or non-specpaint waste. Workers should not have to open a gallon can when only a quartis required. Usually, any paint that is left in the can will require disposal ashazardous waste.
V.C. Metal Plating and Surface Finishing
Pollution prevention opportunities in metal plating and surface finishingoperations are discussed in detail in NSRP’s Hazardous Waste MinimizationGuide for Shipyards and in the Profile of the Fabricated Metal ProductsIndustry Sector Notebook. Readers are encouraged to consult thesedocuments for pollution prevention information relating to metal plating andsurface finishing.

Shipbuilding and Repair Pollution Prevention Opportunities
Sector Notebook Project November 199772
V.D. Fiberglass Reinforced Construction
Material Application
Major waste reduction is available by optimizing material applicationprocesses. These processes include spray delivery systems and non-sprayresin application methods. Non-spray application methods include closedmold systems, vacuum bag mold systems, resin roller dispensers, presprayfiber reinforcing, and in-house resin impregnation. These no-spray techniquesreduce material waste and energy costs during application. The lowerapplication pressures reduce the cost and maintenance of pressure lines,pumps, controls, and fittings. Routine cleanups of work areas are alsoreduced.
Spray Delivery Systems
The fabrication process for fiberglass construction and the wastes producedare highly dependent on the equipment and procedures used. The currentsystem of resin and gelcoat delivery systems include high-pressure air,medium-pressure airless, and low-pressure air-assisted airless spray guns.
• The high-pressure air system is used less due to the large amount ofexpensive high-pressure compressed air required and significant airemissions generated.
• The airless method produces a pressurized resin streamelectrostatically atomized through a nozzle. The nozzle orifice andspray angle can be varied by using different tips. The size of theorifice affects the delivery efficiency, with larger orifices resulting ingreater raw material loss. Airless spray guns are considered to be veryefficient in the delivery of resin to the work surface.
• The air-assisted airless technology modifies the airless gun byintroducing pressurized air on the outer edge of the resin stream as itexits the pressure nozzle. The air stream forms an envelope whichfocuses the resin to follow a controllable spray pattern. Since moreresin ends up on the mold with this technology, the amount ofspraying is reduced leading to a reduction in air emissions. It isestimated that a savings of 5 to 20 percent in net loss of resin spraywaste for the air-assisted airless gun is achieved compared to theairless gun.

Shipbuilding and Repair Pollution Prevention Opportunities
Sector Notebook Project November 199773
Resin Roller Application
This application uses pumped resin and catalyst from drums or bulkcontainers. The resin and catalyst are precisely metered in a gun-type linemuch like the paint plural component systems. A resin roller dispensertransfers the catalyzed resin to the mold surface. This eliminates the materiallost due to overspray and bounceback of the resin. Air emissions are alsogreatly reduced with this type of delivery system.
Thermoplastic Resins
Thermoplastic resins have the advantage of being easily recycled by applyingheat which returns the resin to a liquid state. In its liquid state, the resin canbe reused in the manufacture of other fiberglass components in shipbuilding.The use of thermoplastics offers faster curing cycles, lower emission duringprocessing, lower costs per pound of raw material used, ease of recyclingmaterial, and, in some cases, lower labor costs. With the recent advances inthe processing technologies and thermoplastic resin systems, the shipbuildingindustries are reexamining the application of thermoplastics versus thermosetsmaterial systems.
V.E. Solvent Cleaning and Degreasing
Shipyards often use large quantities of solvents in a variety of cleaning anddegreasing operations including parts cleaning, process equipment cleaning,and surface preparation for coating applications. The final cost of solventused for various cleanup operations is nearly twice the original purchase priceof the virgin solvent. The additional cost is primarily due to the fact that foreach drum purchased, extra disposal cost, hazardous materials transportationcost, and manifesting time and expense are incurred. With the rising cost ofsolvents and waste disposal services, combined with continuously developingregulation, reducing the quantities of solvents used and solvent wastesgenerated can be extremely cost effective.
Eliminating the Use of Solvents
Eliminating the use of solvents avoids any waste generation associated withspent solvent. Elimination can be achieved by utilization of non-solventcleaning agents or eliminating the need for cleaning altogether. Solventelimination applications include the use of water-soluble cutting fluids,protective peel coatings, aqueous cleaners, and mechanical cleaning systems.
Water-soluble Cutting Fluids. Water-soluble cutting fluids can often be usedin place of oil-based fluids. The cutting oils usually consist of an oil-in-wateremulsion used to reduce friction and dissipate heat. If these fluids need to beremoved after the machining process is complete, solvents may be needed.

Shipbuilding and Repair Pollution Prevention Opportunities
Sector Notebook Project November 199774
In efforts to eliminate solvent degreasing and its subsequent waste, specialwater-soluble cutting fluids have been developed. Systems are available thatcan clean the cutting fluid and recycle the material back to the cuttingoperation. Obstacles to implementing this method are: cost (water-solublefluids are generally more expensive), procurement (there are only a fewsuppliers available), and the inability to quickly switch between fluid typeswithout thoroughly cleaning the equipment.
Aqueous Cleaners Aqueous cleaners, such as alkali, citric, and caustic base,are often useful substitutes for solvents. There are many formulations that aresuited for a variety of cleaning requirements. Many aqueous cleaners havebeen found to be as effective as the halogenated solvents that are commonlyemployed.
The advantages of substituting aqueous cleaners include minimizing worker’sexposure to solvent vapors, reducing liability and disposal problemsassociated with solvent use, and cost. Aqueous cleaners do not volatilize asquickly as other solvents, thereby reducing losses due to evaporation. Sincemost aqueous cleaners are biodegradable, disposal is not a problem once theorganic or inorganic contaminants are removed.
The use of aqueous cleaners can also result in cost savings. Although someaqueous cleaners may cost less than an equivalent amount of solvent, thepurchase price of each is about the same. The cost of disposal, loss due toevaporation, and associated liabilities, however, favor aqueous cleaners.
The disadvantages of aqueous cleaners in place of solvents may include:possible inability of the aqueous cleaners to provide the degree of cleaningrequired, incompatibility between the parts being cleaned and the cleaningsolution, need to modify or replace existing equipment, and problemsassociated with moisture left on parts being cleaned. Oils removed from theparts during cleaning may float on the surface of the cleaning solution andmay interfere with subsequent cleaning. Oil skimming is usually required.
Mechanical Cleaning Systems Utilizing mechanical cleaning systems can alsoreplace solvents in degreasing and cleaning operations. In many cases, a highpressure steam gun or high pressure parts washer can clean parts and surfacesquicker and to the same degree of cleanliness as that of the solvents theyreplace. Light detergents can be added to the water supply for improvedcleaning. The waste produced by these systems is usually oily wastewater.This wastewater can be sent through an oil/water separator, the removedwater discharged to the sewer, and the oil residue sent to a petroleumrecycler. Some hot water wash and steam systems can be supplemented byemulsifying solutions to speed the process. Although these additives speedthe cleaning process, they can make separation of the oil from the water verydifficult and create problems with disposal of the waste.

Shipbuilding and Repair Pollution Prevention Opportunities
Sector Notebook Project November 199775
Non-Solvent Based Paint Stripping Non-solvent based paint strippingmethods are viable substitutes for solvent stripping. Paint stripping isnormally performed by soaking, spraying, or brushing surfaces with astripping agent such as methylene chloride, chromates, phenols, or strongacids. After the agent has remained on the parts for a period, the surface isrinsed with water and the loosened paint is sprayed or brushed off. Thealternatives to solvent stripping agents include aqueous striping agents, useof abrasives, cryogenic stripping, and thermal stripping.
Aqueous stripping agents, such as caustic soda (NaOH), are often employedin place of methylene chloride based strippers. Caustic solutions have theadvantage of eliminating solvent vapor emissions. A typical caustic bathconsists of about 40 percent caustic solution heated to about 200 degreesFahrenheit. Caustic stripping is generally effective on alkyl resins and oilpaints.
Cryogenic stripping utilizes liquid nitrogen and non-abrasive plastic beads asblasting shot. This method relies on the freezing effect of the liquid nitrogenand the impact of the plastic shot. Subjecting the surface to extremely lowtemperatures creates stress between the coating and the substrate causing thecoating to become brittle. When the plastic shot hits the brittle coating,debonding occurs. The process is non-abrasive, and will not damage thesubstrate, but effects of the metal shrinkage, due to extremely lowtemperatures, should be monitored. The process does not produce liquidwastes, and nitrogen, chemically inert, is already present in the atmosphere(U.S. EPA, March 1997).
The most common form of non-solvent paint stripping in shipyards is the useof abrasive blasting. The use of various metallic grit propelled at highpressure against the surface is very effective to remove marine coatings.
Thermal stripping methods can be useful for objects that cannot be immersed.In this process, superheated air is directed against the surface of the object.The high temperatures cause some paints to flake off. The removal resultsfrom the drying effects of the air and the uneven expansion of the paint andthe substrate. Some paints will melt at high temperatures, allowing the paintto be scraped off. Hand-held units are available that produce a jet of hot air.Electric units and open flame or torch units are also used. While this systemis easy to implement, it is limited to items that are not heat sensitive and tocoatings that are affected by the heat.
Reducing the Use of Solvent
By eliminating the use or need for solvent cleaning, the problems associatedwith disposal of spent solvent are also eliminated. In cases where theelimination of solvent use is not possible or practical, utilization of various

Shipbuilding and Repair Pollution Prevention Opportunities
Sector Notebook Project November 199776
solvent waste reduction techniques can lead to a substantial savings in solventwaste.
Methods of reducing solvent usage can be divided into three categories:source control of air emissions, efficient use of solvent and equipment, andmaintaining solvent quality. Source control of air emissions addresses waysin which more of the solvent can be kept inside a container or cleaning tankby reducing the chances for evaporation loss. Efficient use of solvent andequipment through better operating procedures can reduce the amount ofsolvent required for cleaning. Maintaining the quality of solvent will extendthe lifecycle effectiveness of the solvent.
Source Control of Air Emissions Source control of air emissions can beachieved through equipment modification and proper operation of equipment.Some simple control measures include installation and use of lids, an increaseof freeboard height of cleaning tanks, installation of freeboard chillers, andtaking steps to reduce solvent drag-out.
All cleaning units, including cold cleaning tanks and dip tanks, should havesome type of lid installed. When viewed from the standpoint of reducing airemissions, the roll-type cover is preferable to the hinge type. Lids that swingdown can cause a piston effect and force the escape of solvent vapor. Inoperations such as vapor degreasing, use of lids can reduce solvent loss from24 percent to 50 percent. For tanks that are continuously in use, covers havebeen designed that allow the work pieces to enter and leave the tank while thelid remains closed.
In an open top vapor degreaser, freeboard is defined as the distance from thetop of the vapor zone to the top of the tank. Increasing the freeboard willsubstantially reduce the amount of solvent loss. A freeboard chiller may alsobe installed above the primary condenser coil. This refrigerated coil, muchlike the cooling jacket, chills the air above the vapor zone and creates asecondary barrier to vapor loss. Reduction in solvent usage, by use offreeboard chillers, can be as high as 60 percent. The major drawback with afreeboard chiller is that it can introduce water (due to condensation from air)into the tank.
In addition to measures that reduce air emissions through equipmentmodification, it is also possible to reduce emissions through proper equipmentlayout, operation, and maintenance. Cleaning tanks should be located in areaswhere air turbulence and temperature do not promote vapor loss.
Maximize the Dedication of the Process Equipment In addition to reductionin vapor loss, reducing the amount of solvent used can be achieved throughbetter operating practices that increase the efficiency of solvent cleaningoperations. Maximizing the dedication of the process equipment reduces the

Shipbuilding and Repair Pollution Prevention Opportunities
Sector Notebook Project November 199777
need for frequent cleaning. By using a mix tank consistently for the sameformulation, the need to clean equipment between batches is eliminated.
Avoid Unnecessary Cleaning Avoiding unnecessary cleaning also offerspotential for waste reduction. For example, paint mixing tanks for two-partpaints are often cleaned between batches of the same product. The effect ofcross-contamination between batches should be examined from a productquality control viewpoint to see if the cleaning step is always necessary.
Process pipelines are often flushed with some type of solvent to removedeposits on the pipe walls. Cleaning the pipelines can be achieved by usingan inert gas propellant to remove deposits. This method can only be used ifthe pipelines do not have many bends or sharp turns.
Proper Production Scheduling Proper production scheduling can reducecleaning frequency by eliminating the need for cleaning between theconclusion of one task and the start of the next. A simple example of thisprocedure is to have a small overlap between shifts that perform the sameoperation with the same equipment. This allows the equipment that wouldnormally be cleaned and put away at the end of each shift, such as paintingequipment, to be taken over directly by the relief.
Clean Equipment Immediately Cleaning equipment immediately after useprevents deposits from hardening and avoids the need for consuming extrasolvent. Letting dirty equipment accumulate and be cleaned later can alsoincrease the time required for cleaning.
Better Operating Procedures Better operating procedures can minimizeequipment clean-up waste. Some of the methods already discussed areexamples of better operating procedures. Better operator training, education,closer supervision, improved equipment maintenance, and increasing the useof automation are very effective in waste minimization.
Reuse Solvent Waste Reuse of solvent waste can reduce or eliminate wasteand result in a cost savings associated with a decrease in raw materialconsumption. The solvent from cleaning operations can be reused in othercleaning processes in which the degree of cleanliness required is much less.This will be discussed in more detail in the next section.
Solvent Recycling
Although not a preferable as source reduction, solvent recycling may be aviable alternative for some shipyards. The goal of recycling is to recover fromthe waste solvent, a solvent of a similar purity to that of the virgin solvent foreventual reuse in the same operation, or of a sufficient purity to be used inanother application. Recycling can also include the direct use of solvent waste

Shipbuilding and Repair Pollution Prevention Opportunities
Sector Notebook Project November 199778
from one waste stream in another operation. There are a number of techniquesthat shipyards can use onsite to separate solvents from contaminants includingdistillation, evaporation, sedimentation, decanting, centrifugation, filtering,and membrane separation.
V.F. Machining and Metalworking
Coolant fluids account for the largest waste stream generated by machiningoperations. Waste metalworking fluids are created when the fluids are nolonger usable due to contamination by oils or chemical additives. If thecontamination rate of the metalworking fluids is reduced, the need to replacethem will be less frequent. This will reduce the waste generated.
Preventing Fluid Contamination
Fluid can become hazardous waste if it is contaminated. Although it is notpossible to eliminate contamination, it is possible to reduce the rate ofcontamination and thereby prolong its use.
The primary contaminant in these waste fluids is tramp oil. One way topostpone contamination is to promote better maintenance of the wipers andseals. A preventative maintenance program should be installed and enforcedin the machine shop. Scheduled sump and machine cleaning as well asperiodic inspections of the wipers and oil seals should be carried out. Theresponsibility for this should be assigned to some person or group in aposition of authority to ensure its success.
Synthetic Fluids
Synthetic fluids have many advantages over the non-synthetic counterparts.Usually the synthetic varieties do not lubricate as effectively, but they are lesssusceptible to contamination and highly resistant to biological breakdown.Most synthetic fluids have superior longevity and can operate over a largetemperature range without adverse side effects. Straight oils should bereplaced with synthetic ones when possible.
Recycling Fluids
Once all of the source reduction options have been considered, it is time toexplore the possibilities of reuse. It should be noted that in many cases, afterthe majority of the contaminants have been removed, further treatment withchemicals or concentrated fluid is necessary before the fluids can berecirculated through the machines.
Filtration. Filtration is a common way to remove particles from the fluid aswell as tramp oils or other contaminants. Many different types of filters can

Shipbuilding and Repair Pollution Prevention Opportunities
Sector Notebook Project November 199779
be used depending on the medium to be filtered and the amount of filtrationdesired. Contaminated cutting fluids can be passed through a bag, disc, orcartridge filter or separated in a centrifuge.
Skimming and Flotation. Although it is a slow process, skimming ofcontaminants is inexpensive and can be very effective. The principle is to letthe fluid sit motionless in a sump or a tank, and after a predetermined amountof time, the unwanted oils are skimmed off the surface and the heavierparticulate matter is collected off the bottom. A similar technique, flotation,injects high pressure air into contaminated cutting fluid. As the air comes outof solution and bubbles to the surface, it attaches itself to suspendedcontaminants and carries them up to the surface. The resulting sludge isskimmed off the surface and the clean fluid is reused.
Centrifugation . Centrifugation uses the same settling principles as flotation,but the effects of gravity are multiplied thousands of times due to the spinningaction of the centrifuge. This will increase the volume of fluids which can becleaned in a given amount of time.
Pasteurization. Pasteurization uses heat treatment to kill microorganisms inthe fluid and reduce the rate at which rancidity (biological breakdown) willoccur. Unfortunately, heat can alter the properties of the fluid and render itless effective. Properties lost in this way are usually impossible to recover.
Downgrading. Sometimes it is possible to use high quality hydraulic oils ascutting fluids. After the oils have reached their normal usable life, they nolonger meet the high standards necessary for hydraulic components. At thistime they are still good enough to be used for the less demanding jobs. It maybe necessary to treat the fluid before it can be reused, but changing fluid’sfunctions in this manner has proven successful in the past.

Shipbuilding and Repair Pollution Prevention Opportunities
Sector Notebook Project November 199780
Page 80 intentionally left blank.
Shipbuilding and Repair Industry Federal Statutes and Regulations
Sector Notebook Project November 199781
VI. SUMMARY OF FEDERAL STATUTES AND REGULATIONS
This section discusses the Federal regulations that may apply to this sector.The purpose of this section is to highlight and briefly describe the applicableFederal requirements, and to provide citations for more detailed information.The three following sections are included:
Section VI.A. contains a general overview of major statutesSection VI.B. contains a list of regulations specific to this industrySection VI.C. contains a list of pending and proposed regulations
The descriptions within Section VI are intended solely for generalinformation. Depending upon the nature or scope of the activities at aparticular facility, these summaries may or may not necessarily describe allapplicable environmental requirements. Moreover, they do not constituteformal interpretations or clarifications of the statutes and regulations. Forfurther information, readers should consult the Code of Federal Regulationsand other state or local regulatory agencies. EPA Hotline contacts are alsoprovided for each major statute.
VI.A. General Description of Major Statutes
Resource Conservation and Recovery Act
The Resource Conservation And Recovery Act (RCRA) of 1976, whichamended the Solid Waste Disposal Act, addresses solid (Subtitle D) andhazardous (Subtitle C) waste management activities. The Hazardous andSolid Waste Amendments (HSWA) of 1984 strengthened RCRA’s wastemanagement provisions and added Subtitle I, which governs undergroundstorage tanks (USTs).
Regulations promulgated pursuant to Subtitle C of RCRA (40 CFR Parts260-299) establish a “cradle-to-grave” system governing hazardous wastefrom the point of generation to disposal. RCRA hazardous wastes include thespecific materials listed in the regulations (commercial chemical products,designated with the code "P" or "U"; hazardous wastes from specificindustries/sources, designated with the code "K"; or hazardous wastes fromnon-specific sources, designated with the code "F") or materials which exhibita hazardous waste characteristic (ignitability, corrosivity, reactivity, or toxicityand designated with the code "D").
Regulated entities that generate hazardous waste are subject to wasteaccumulation, manifesting, and record keeping standards. Facilities mustobtain a permit either from EPA or from a State agency which EPA hasauthorized to implement the permitting program if they store hazardouswastes for more than 90 days (or 180 days depending on the amount of waste

Shipbuilding and Repair Industry Federal Statutes and Regulations
Sector Notebook Project November 199782
generated) before treatment or disposal. Facilities may treat hazardous wastesstored in less-than-ninety-day tanks or containers without a permit providedthe procedure is approved by a state agency having RCRA delegationauthority. Subtitle C permits contain general facility standards such ascontingency plans, emergency procedures, record keeping and reportingrequirements, financial assurance mechanisms, and unit-specific standards.RCRA also contains provisions (40 CFR Part 264 Subpart S and §264.10) forconducting corrective actions which govern the cleanup of releases ofhazardous waste or constituents from solid waste management units atRCRA-regulated facilities.
Although RCRA is a Federal statute, many States implement the RCRAprogram. Currently, EPA has delegated its authority to implement variousprovisions of RCRA to 47 of the 50 States and two U.S. territories.Delegation has not been given to Alaska, Hawaii, or Iowa.
Most RCRA requirements are not industry specific but apply to any companythat generates, transports, treats, stores, or disposes of hazardous waste.Here are some important RCRA regulatory requirements:
Identification of Solid and Hazardous Wastes (40 CFR Part 261)lays out the procedure every generator must follow to determinewhether the material in question is considered a hazardous waste,solid waste, or is exempted from regulation.
Standards for Generators of Hazardous Waste (40 CFR Part 262)establishes the responsibilities of hazardous waste generators includingobtaining an EPA ID number, preparing a manifest, ensuring properpackaging and labeling, meeting standards for waste accumulationunits, and recordkeeping and reporting requirements. Generators canaccumulate hazardous waste for up to 90 days (or 180 days dependingon the amount of waste generated) without obtaining a permit.
Land Disposal Restrictions (LDRs) (40 CFR Part 268) areregulations prohibiting the disposal of hazardous waste on landwithout prior treatment. Under the LDRs program, materials mustmeet LDR treatment standards prior to placement in a RCRA landdisposal unit (landfill, land treatment unit, waste pile, or surfaceimpoundment). Generators of waste subject to the LDRs must providenotification of such to the designated TSD facility to ensure propertreatment prior to disposal.
Used Oil Management Standards (40 CFR Part 279) imposemanagement requirements affecting the storage, transportation,burning, processing, and re-refining of the used oil. For parties that

Shipbuilding and Repair Industry Federal Statutes and Regulations
Sector Notebook Project November 199783
merely generate used oil, regulations establish storage standards. Fora party considered a used oil processor, re-refiner, burner, or marketer(one who generates and sells off-specification used oil), additionaltracking and paperwork requirements must be satisfied.
RCRA contains unit-specific standards for all units used to store,treat, or dispose of hazardous waste, including Tanks andContainers. Tanks and containers used to store hazardous wastewith a high volatile organic concentration must meet emissionstandards under RCRA. Regulations (40 CFR Part 264-265, SubpartCC) require generators to test the waste to determine theconcentration of the waste, to satisfy tank and container emissionsstandards, and to inspect and monitor regulated units. Theseregulations apply to all facilities that store such waste, including largequantity generators accumulating waste prior to shipment off-site.
Underground Storage Tanks (USTs) containing petroleum andhazardous substances are regulated under Subtitle I of RCRA.Subtitle I regulations (40 CFR Part 280) contain tank design andrelease detection requirements, as well as financial responsibility andcorrective action standards for USTs. The UST program alsoincludes upgrade requirements for existing tanks that must be met byDecember 22, 1998.
Boilers and Industrial Furnaces (BIFs) that use or burn fuelcontaining hazardous waste must comply with design and operatingstandards. BIF regulations (40 CFR Part 266, Subpart H) addressunit design, provide performance standards, require emissionsmonitoring, and restrict the type of waste that may be burned.
EPA's RCRA, Superfund and EPCRA Hotline, at (800) 424-9346, respondsto questions and distributes guidance regarding all RCRA regulations. TheRCRA Hotline operates weekdays from 9:00 a.m. to 6:00 p.m., ET, excludingFederal holidays.
Comprehensive Environmental Response, Compensation, and Liability Act
The Comprehensive Environmental Response, Compensation, and LiabilityAct (CERCLA), a 1980 law known commonly as Superfund, authorizes EPAto respond to releases, or threatened releases, of hazardous substances thatmay endanger public health, welfare, or the environment. CERCLA alsoenables EPA to force parties responsible for environmental contamination toclean it up or to reimburse the Superfund for response costs incurred by EPA.The Superfund Amendments and Reauthorization Act (SARA) of 1986revised various sections of CERCLA, extended the taxing authority for the
Shipbuilding and Repair Industry Federal Statutes and Regulations
Sector Notebook Project November 199784
Superfund, and created a free-standing law, SARA Title III, also known as theEmergency Planning and Community Right-to-Know Act (EPCRA).
The CERCLA hazardous substance release reporting regulations (40 CFRPart 302) direct the person in charge of a facility to report to the NationalResponse Center (NRC) any environmental release of a hazardous substancewhich equals or exceeds a reportable quantity. Reportable quantities are listedin 40 CFR §302.4. A release report may trigger a response by EPA, or by oneor more Federal or State emergency response authorities.
EPA implements hazardous substance responses according to proceduresoutlined in the National Oil and Hazardous Substances Pollution ContingencyPlan (NCP) (40 CFR Part 300). The NCP includes provisions for permanentcleanups, known as remedial actions, and other cleanups referred to asremovals. EPA generally takes remedial actions only at sites on the NationalPriorities List (NPL), which currently includes approximately 1300 sites.Both EPA and states can act at sites; however, EPA provides responsibleparties the opportunity to conduct removal and remedial actions andencourages community involvement throughout the Superfund responseprocess.
EPA's RCRA, Superfund and EPCRA Hotline, at (800) 424-9346, answersquestions and references guidance pertaining to the Superfund program.This Hotline, which addresses CERCLA issues, operates weekdays from 9:00a.m. to 6:00 p.m., ET, excluding Federal holidays.
Emergency Planning And Community Right-To-Know Act
The Superfund Amendments and Reauthorization Act (SARA) of 1986created the Emergency Planning and Community Right-to-Know Act(EPCRA, also known as SARA Title III), a statute designed to improvecommunity access to information about chemical hazards and to facilitate thedevelopment of chemical emergency response plans by State and localgovernments. EPCRA required the establishment of State emergencyresponse commissions (SERCs), responsible for coordinating certainemergency response activities and for appointing local emergency planningcommittees (LEPCs).
EPCRA and the EPCRA regulations (40 CFR Parts 350-372) establish fourtypes of reporting obligations for facilities which store or manage specifiedchemicals:
EPCRA §302 requires facilities to notify the SERC and LEPC of thepresence of any extremely hazardous substance (the list of suchsubstances is in 40 CFR Part 355, Appendices A and B) if it has suchsubstance in excess of the substance's threshold planning quantity, and

Shipbuilding and Repair Industry Federal Statutes and Regulations
Sector Notebook Project November 199785
directs the facility to appoint an emergency response coordinator.
EPCRA §304 requires the facility to notify the SERC and the LEPCin the event of a release equaling or exceeding the reportable quantityof a CERCLA hazardous substance or an EPCRA extremelyhazardous substance.
EPCRA §311 and §312 require a facility at which a hazardouschemical, as defined by the Occupational Safety and Health Act, ispresent in an amount exceeding a specified threshold to submit to theSERC, LEPC and local fire department material safety data sheets(MSDSs) or lists of MSDSs and hazardous chemical inventory forms(also known as Tier I and II forms). This information helps the localgovernment respond in the event of a spill or release of the chemical.
EPCRA §313 requires manufacturing facilities included in SIC codes20 through 39, which have ten or more employees, and whichmanufacture, process, or use specified chemicals in amounts greaterthan threshold quantities, to submit an annual toxic chemical releasereport. This report, known commonly as the Form R, covers releasesand transfers of toxic chemicals to various facilities and environmentalmedia, and allows EPA to compile the national Toxic ReleaseInventory (TRI) database.
All information submitted pursuant to EPCRA regulations is publiclyaccessible, unless protected by a trade secret claim.
EPA's RCRA, Superfund and EPCRA Hotline, at (800) 424-9346, answersquestions and distributes guidance regarding the emergency planning andcommunity right-to-know regulations. The EPCRA Hotline operatesweekdays from 9:00 a.m. to 6:00 p.m., ET, excluding Federal holidays.
Clean Water Act
The primary objective of the Federal Water Pollution Control Act, commonlyreferred to as the Clean Water Act (CWA), is to restore and maintain thechemical, physical, and biological integrity of the nation's surface waters.Pollutants regulated under the CWA include "priority" pollutants, includingvarious toxic pollutants; "conventional" pollutants, such as biochemicaloxygen demand (BOD), total suspended solids (TSS), fecal coliform, oil andgrease, and pH; and "non-conventional" pollutants, including any pollutant notidentified as either conventional or priority.
The CWA regulates both direct and indirect discharges. The NationalPollutant Discharge Elimination System (NPDES) program (CWA §502)controls direct discharges into navigable waters. NPDES permits, issued by

Shipbuilding and Repair Industry Federal Statutes and Regulations
Sector Notebook Project November 199786
either EPA or an authorized State (EPA has authorized 42 States toadminister the NPDES program), contain industry-specific, technology-basedand/or water quality-based limits, and establish pollutant monitoringrequirements. A facility that intends to discharge into the nation's watersmust obtain a permit prior to initiating its discharge. A permit applicant mustprovide quantitative analytical data identifying the types of pollutants presentin the facility's effluent. The permit will then set the conditions and effluentlimitations on the facility discharges.
A NPDES permit may also include discharge limits based on Federal or Statewater quality criteria or standards, that were designed to protect designateduses of surface waters, such as supporting aquatic life or recreation. Thesestandards, unlike the technological standards, generally do not take intoaccount technological feasibility or costs. Water quality criteria and standardsvary from State to State, and site to site, depending on the use classificationof the receiving body of water. Most States follow EPA guidelines whichpropose aquatic life and human health criteria for many of the 126 prioritypollutants.
Storm Water Discharges
In 1987 the CWA was amended to require EPA to establish a program toaddress storm water discharges. In response, EPA promulgated the NPDESstorm water permit application regulations. These regulations require thatfacilities with the following storm water discharges apply for an NPDESpermit: (1) a discharge associated with industrial activity; (2) a dischargefrom a large or medium municipal storm sewer system; or (3) a dischargewhich EPA or the State determines to contribute to a violation of a waterquality standard or is a significant contributor of pollutants to waters of theUnited States.
The term "storm water discharge associated with industrial activity" means astorm water discharge from one of 11 categories of industrial activity definedat 40 CFR 122.26. Six of the categories are defined by SIC codes while theother five are identified through narrative descriptions of the regulatedindustrial activity. If the primary SIC code of the facility is one of thoseidentified in the regulations, the facility is subject to the storm water permitapplication requirements. If any activity at a facility is covered by one of thefive narrative categories, storm water discharges from those areas where theactivities occur are subject to storm water discharge permit applicationrequirements.
Those facilities/activities that are subject to storm water discharge permitapplication requirements are identified below. To determine whether aparticular facility falls within one of these categories, consult the regulation.
Shipbuilding and Repair Industry Federal Statutes and Regulations
Sector Notebook Project November 199787
Category i: Facilities subject to storm water effluent guidelines, new sourceperformance standards, or toxic pollutant effluent standards.
Category ii: Facilities classified as SIC 24-lumber and wood products(except wood kitchen cabinets); SIC 26-paper and allied products (exceptpaperboard containers and products); SIC 28-chemicals and allied products(except drugs and paints); SIC 291-petroleum refining; and SIC 311-leathertanning and finishing, 32 (except 323)-stone, clay, glass, and concrete, 33-primary metals, 3441-fabricated structural metal, and 373-ship and boatbuilding and repairing.
Category iii: Facilities classified as SIC 10-metal mining; SIC 12-coalmining; SIC 13-oil and gas extraction; and SIC 14-nonmetallic mineralmining.
Category iv: Hazardous waste treatment, storage, or disposal facilities.
Category v: Landfills, land application sites, and open dumps that receive orhave received industrial wastes.
Category vi: Facilities classified as SIC 5015-used motor vehicle parts; andSIC 5093-automotive scrap and waste material recycling facilities.
Category vii: Steam electric power generating facilities.
Category viii: Facilities classified as SIC 40-railroad transportation; SIC 41-local passenger transportation; SIC 42-trucking and warehousing (exceptpublic warehousing and storage); SIC 43-U.S. Postal Service; SIC 44-watertransportation; SIC 45-transportation by air; and SIC 5171-petroleum bulkstorage stations and terminals.
Category ix: Sewage treatment works.
Category x: Construction activities except operations that result in thedisturbance of less than five acres of total land area.
Category xi: Facilities classified as SIC 20-food and kindred products; SIC21-tobacco products; SIC 22-textile mill products; SIC 23-apparel relatedproducts; SIC 2434-wood kitchen cabinets manufacturing; SIC 25-furnitureand fixtures; SIC 265-paperboard containers and boxes; SIC 267-convertedpaper and paperboard products; SIC 27-printing, publishing, and alliedindustries; SIC 283-drugs; SIC 285-paints, varnishes, lacquer, enamels, andallied products; SIC 30-rubber and plastics; SIC 31-leather and leatherproducts (except leather tanning and finishing); SIC 323-glass products; SIC34-fabricated metal products (except fabricated structural metal); SIC 35-

Shipbuilding and Repair Industry Federal Statutes and Regulations
Sector Notebook Project November 199788
industrial and commercial machinery and computer equipment; SIC 36-electronic and other electrical equipment and components; SIC 37-transportation equipment (except ship and boat building and repair); SIC 38-measuring, analyzing, and controlling instruments; SIC 39-miscellaneousmanufacturing industries; and SIC 4221-4225-public warehousing andstorage.
Pretreatment Program
Another type of discharge that is regulated by the CWA is one that goes toa publicly-owned treatment works (POTW). The national pretreatmentprogram (CWA §307(b)) controls the indirect discharge of pollutants toPOTWs by "industrial users." Facilities regulated under §307(b) must meetcertain pretreatment standards. The goal of the pretreatment program is toprotect municipal wastewater treatment plants from damage that may occurwhen hazardous, toxic, or other wastes are discharged into a sewer systemand to protect the quality of sludge generated by these plants. Discharges toa POTW are regulated primarily by the POTW, rather than the State or EPA.
EPA has developed technology-based standards for industrial users ofPOTWs. Different standards apply to existing and new sources within eachcategory. "Categorical" pretreatment standards applicable to an industry ona nationwide basis are developed by EPA. In addition, another kind ofpretreatment standard, "local limits," are developed by the POTW in order toassist the POTW in achieving the effluent limitations in its NPDES permit.
Regardless of whether a State is authorized to implement either the NPDESor the pretreatment program, if it develops its own program, it may enforcerequirements more stringent than Federal standards.
Spill Prevention, Control and Countermeasure Plans
The 1990 Oil Pollution Act requires that facilities that could reasonably beexpected to discharge oil in harmful quantities prepare and implement morerigorous Spill Prevention Control and Countermeasure (SPCC) Plan requiredunder the CWA (40 CFR §112.7). There are also criminal and civil penaltiesfor deliberate or negligent spills of oil. Regulations covering response to oildischarges and contingency plans (40 CFR Part 300), and Facility ResponsePlans to oil discharges (40 CFR §112.20) and for PCB transformers and PCB-containing items were revised and finalized in 1995.
EPA’s Office of Water, at (202) 260-5700, will direct callers with questionsabout the CWA to the appropriate EPA office. EPA also maintains abibliographic database of Office of Water publications which can beaccessed through the Ground Water and Drinking Water resource center, at(202) 260-7786.

Shipbuilding and Repair Industry Federal Statutes and Regulations
Sector Notebook Project November 199789
Safe Drinking Water Act
The Safe Drinking Water Act (SDWA) mandates that EPA establishregulations to protect human health from contaminants in drinking water.The law authorizes EPA to develop national drinking water standards and tocreate a joint Federal-State system to ensure compliance with these standards.The SDWA also directs EPA to protect underground sources of drinkingwater through the control of underground injection of liquid wastes.
EPA has developed primary and secondary drinking water standards under itsSDWA authority. EPA and authorized States enforce the primary drinkingwater standards, which are, contaminant-specific concentration limits thatapply to certain public drinking water supplies. Primary drinking waterstandards consist of maximum contaminant level goals (MCLGs), which arenon-enforceable health-based goals, and maximum contaminant levels(MCLs), which are enforceable limits set as close to MCLGs as possible,considering cost and feasibility of attainment.
The SDWA Underground Injection Control (UIC) program (40 CFR Parts144-148) is a permit program which protects underground sources of drinkingwater by regulating five classes of injection wells. UIC permits includedesign, operating, inspection, and monitoring requirements. Wells used toinject hazardous wastes must also comply with RCRA corrective actionstandards in order to be granted a RCRA permit, and must meet applicableRCRA land disposal restrictions standards. The UIC permit program isprimarily State-enforced, since EPA has authorized all but a few States toadminister the program.
The SDWA also provides for a Federally-implemented Sole Source Aquiferprogram, which prohibits Federal funds from being expended on projects thatmay contaminate the sole or principal source of drinking water for a givenarea, and for a State-implemented Wellhead Protection program, designed toprotect drinking water wells and drinking water recharge areas.
EPA’s Safe Drinking Water Hotline, at (800) 426-4791, answers questionsand distributes guidance pertaining to SDWA standards. The Hotlineoperates from 9:00 a.m. through 5:30 p.m., ET, excluding Federal holidays.
Toxic Substances Control Act
The Toxic Substances Control Act (TSCA) granted EPA authority to createa regulatory framework to collect data on chemicals in order to evaluate,assess, mitigate, and control risks which may be posed by their manufacture,processing, and use. TSCA provides a variety of control methods to preventchemicals from posing unreasonable risk.

Shipbuilding and Repair Industry Federal Statutes and Regulations
Sector Notebook Project November 199790
TSCA standards may apply at any point during a chemical’s life cycle. UnderTSCA §5, EPA has established an inventory of chemical substances. If achemical is not already on the inventory, and has not been excluded by TSCA,a premanufacture notice (PMN) must be submitted to EPA prior tomanufacture or import. The PMN must identify the chemical and provideavailable information on health and environmental effects. If available dataare not sufficient to evaluate the chemicals effects, EPA can imposerestrictions pending the development of information on its health andenvironmental effects. EPA can also restrict significant new uses of chemicalsbased upon factors such as the projected volume and use of the chemical.
Under TSCA §6, EPA can ban the manufacture or distribution in commerce,limit the use, require labeling, or place other restrictions on chemicals thatpose unreasonable risks. Among the chemicals EPA regulates under §6authority are asbestos, chlorofluorocarbons (CFCs), and polychlorinatedbiphenyls (PCBs).
Under TSCA §8, EPA requires the producers and importers of chemicals toreport information on chemicals’ production, use, exposure, and risks.Companies producing and importing chemicals can be required to reportunpublished health and safety studies on listed chemicals and to collect andrecord any allegations of adverse reactions or any information indicating thata substance may pose a significant risk to humans or the environment.
EPA’s TSCA Assistance Information Service, at (202) 554-1404, answersquestions and distributes guidance pertaining to Toxic Substances ControlAct standards. The Service operates from 8:30 a.m. through 4:30 p.m., ET,excluding Federal holidays.
Clean Air Act
The Clean Air Act (CAA) and its amendments, including the Clean Air ActAmendments (CAAA) of 1990, are designed to “protect and enhance thenation's air resources so as to promote the public health and welfare and theproductive capacity of the population.” The CAA consists of six sections,known as Titles, which direct EPA to establish national standards for ambientair quality and for EPA and the States to implement, maintain, and enforcethese standards through a variety of mechanisms. Under the CAAA, manyfacilities will be required to obtain permits for the first time. State and localgovernments oversee, manage, and enforce many of the requirements of theCAAA. CAA regulations appear at 40 CFR Parts 50-99.
Pursuant to Title I of the CAA, EPA has established national ambient airquality standards (NAAQSs) to limit levels of "criteria pollutants," includingcarbon monoxide, lead, nitrogen dioxide, particulate matter, volatile organiccompounds (VOCs), ozone, and sulfur dioxide. Geographic areas that meet

Shipbuilding and Repair Industry Federal Statutes and Regulations
Sector Notebook Project November 199791
NAAQSs for a given pollutant are classified as attainment areas; those that donot meet NAAQSs are classified as non-attainment areas. Under section 110of the CAA, each State must develop a State Implementation Plan (SIP) toidentify sources of air pollution and to determine what reductions are requiredto meet Federal air quality standards. Revised NAAQSs for particulates andozone were proposed in 1996 and may go into effect as early as 1997.
Title I also authorizes EPA to establish New Source Performance Standards(NSPSs), which are nationally uniform emission standards for new stationarysources falling within particular industrial categories. NSPSs are based on thepollution control technology available to that category of industrial source.
Under Title I, EPA establishes and enforces National Emission Standards forHazardous Air Pollutants (NESHAPs), nationally uniform standards orientedtowards controlling particular hazardous air pollutants (HAPs). Title I,section 112(c) of the CAA further directed EPA to develop a list of sourcesthat emit any of 189 HAPs, and to develop regulations for these categories ofsources. To date EPA has listed 174 categories and developed a schedule forthe establishment of emission standards. The emission standards will bedeveloped for both new and existing sources based on "maximum achievablecontrol technology" (MACT). The MACT is defined as the controltechnology achieving the maximum degree of reduction in the emission of theHAPs, taking into account cost and other factors. Title I, section 112(r)directed EPA to develop a list of hazardous chemicals and regulations tocontrol and prevent accidental releases of these chemicals. Owners andoperators of facilities at which such substances are present in more than athreshold quantity will have to prepare risk management plans for eachsubstance used at the facility. EPA may also require annual audits and safetyinspections to prevent leaks and other episodic releases.
Title II of the CAA pertains to mobile sources, such as cars, trucks, buses,and planes. Reformulated gasoline, automobile pollution control devices, andvapor recovery nozzles on gas pumps are a few of the mechanisms EPA usesto regulate mobile air emission sources.
Title IV of the CAA establishes a sulfur dioxide and nitrogen oxides emissionsprogram designed to reduce the formation of acid rain. Reduction of sulfurdioxide releases will be obtained by granting to certain sources limitedemissions allowances, which, beginning in 1995, will be set below previouslevels of sulfur dioxide releases.
Title V of the CAA of 1990 created a permit program for all "major sources"(and certain other sources) regulated under the CAA. One purpose of theoperating permit is to include in a single document all air emissionsrequirements that apply to a given facility. States are developing the permitprograms in accordance with guidance and regulations from EPA. Once a

Shipbuilding and Repair Industry Federal Statutes and Regulations
Sector Notebook Project November 199792
State program is approved by EPA, permits will be issued and monitored bythat State.
Title VI of the CAA is intended to protect stratospheric ozone by phasing outthe manufacture of ozone-depleting chemicals and restrict their use anddistribution. Production of Class I substances, including 15 kinds ofchlorofluorocarbons (CFCs) and chloroform, were phased out (except foressential uses) in 1996.
EPA's Clean Air Technology Center, at (919) 541-0800, provides generalassistance and information on CAA standards. The Stratospheric OzoneInformation Hotline, at (800) 296-1996, provides general information aboutregulations promulgated under Title VI of the CAA, and EPA's EPCRAHotline, at (800) 535-0202, answers questions about accidental releaseprevention under CAA §112(r). In addition, the Clean Air TechnologyCenter’s website includes recent CAA rules, EPA guidance documents, andupdates of EPA activities (www.epa.gov/ttn then select Directory and thenCATC).

Shipbuilding and Repair Industry Federal Statutes and Regulations
Sector Notebook Project November 199793
VI.B. Industry Specific Requirements
Resource Conservation and Recovery Act (RCRA)
A material is classified under RCRA as a hazardous waste if the materialmeets the definition of solid waste (40 CFR 261.2), and that solid wastematerial exhibits one of the characteristics of a hazardous waste (40 CFR261.20-40) or is specifically listed as a hazardous waste (40 CFR 261.31-33).A material defined as a hazardous waste may then be subject to Subtitle Cgenerator (40 CFR 262), transporter (40 CFR 263), and treatment, storage,and disposal facility (40 CFR 264 and 265) requirements. The shipbuildingand repair industry must be concerned with the regulations addressing all ofthese.
Several common shipyard operations have the potential to generate RCRAhazardous wastes. Some of these wastes are identified below by process.
Machining and Other Metalworking
Metalworking fluids contaminated with oils, phenols, creosol, alkalies,phosphorus compounds, and chlorine
Cleaning and Degreasing
Solvents (F001, F002, F003, F004, F005)Alkaline and Acid Cleaning Solutions (D002)Cleaning filter sludges with toxic metal concentrations
Metal Plating and Surface Finishing and Preparation
Wastewater treatment sludges from electroplating operations (F006)Spent cyanide plating bath solutions (F007)Plating bath residues from the bottom of cyanide plating baths (F008)Spent stripping and cleaning bath solutions from cyanide platingoperations (F009)
Surface Preparation, Painting and Coating
Paint and paint containers containing paint sludges with solvents ortoxic metals concentrationsSolvents (F002, F003)Paint chips with toxic metal concentrationsBlasting media contaminated with paint chips

Shipbuilding and Repair Industry Federal Statutes and Regulations
Sector Notebook Project November 199794
Vessel Cleaning
Vessel sludgesVessel cleaning wastewaterVessel cleaning wastewater sludges
Fiberglass Reinforced Construction
Solvents (F001, F002, F003, F004, F005)Chemical additives and catalysts
Shipbuilding and repair facilities may also generate used lubricating oils whichare regulated under RCRA but may or may not be considered a hazardouswaste (40 CFR 266).
United States Code, Title 10, Section 7311
Title 10, Section 7311 of the U.S. Code applies specifically to the handling ofhazardous waste (as defined by RCRA) during the repair and maintenance ofnaval vessels. The Code requires the navy to identify the types and amountsof hazardous wastes that will be generated or removed by a contractorworking on a naval vessel and that the navy compensate the contractor for theremoval, handling, storage, transportation, or disposal of the hazardouswaste. The Code also requires that waste generated solely by the navy andhandled by the contractor bears a generator identification number issued tothe navy; wastes generated and handled solely by the contractor bears a generator identification number issued to the contractor; and waste generatedby both the navy and the contractor and handled by the contractor bears agenerator identification number issued to the contractor and a generatoridentification number issued to the navy.
Clean Air Act
Under Title III of the 1990 Clean Air Act Amendments (CAAA), EPA isrequired to develop national emission standards for 189 hazardous airpollutants (NESHAP). EPA is developing maximum achievable controltechnology (MACT) standards for all new and existing sources. The NationalEmission Standards for Shipbuilding and Repair Operations (Surface Coating)(40 CFR Part 63 Subpart II) were finalized in 1995 and apply to major sourceshipbuilding and ship repairing facilities that carry out surface coatingoperations. Shipyards that emit ten or more tons of any one HAP or 25 ormore tons of two or more HAPs combined are subject to the MACTrequirements. The MACT requirements set VOC limits for different types ofmarine coatings and performance standards to reduce spills, leaks, andfugitive emissions. EPA estimates that there are approximately 35 majorsource shipyards affected by this regulation. Shipbuilding and repair facilities

Shipbuilding and Repair Industry Federal Statutes and Regulations
Sector Notebook Project November 199795
may also be subject to National Emissions Standards for Asbestos (40 CFRPart 61 Subpart M). Both NESHAPs require emission limits, work practicestandards, record keeping, and reporting.
Under Title V of the CAAA 1990 (40 CFR Parts 70-72) all of the applicablerequirements of the Amendments are integrated into one federal renewableoperating permit. Facilities defined as "major sources" under the Act mustapply for permits within one year from when EPA approves the state permitprograms. Since most state programs were not approved until afterNovember 1994, Title V permit applications, for the most part, began to bedue in late 1995. Due dates for filing complete applications vary significantlyfrom state to state, based on the status of review and approval of the state’sTitle V program by EPA.
A facility is designated as a major source for Title V if it releases a certainamount of any one of the CAAA regulated pollutants (SO , NO , CO, VOC,x x
PM , hazardous air pollutants, extremely hazardous substances, ozone10
depleting substances, and pollutants covered by NSPSs) depending on theregion's air quality category. Title V permits may set limits on the amountsof pollutant emissions; require emissions monitoring, and record keeping andreporting. Facilities are required to pay an annual fee based on the magnitudeof the facility's potential emissions. It is estimated that approximately 35shipyards will be designated as major sources and therefore must apply for aTitle V permit.
Clean Water Act
Shipbuilding and repair facility wastewater released to surface waters isregulated under the CWA. National Pollutant Discharge Elimination System(NPDES) permits must be obtained to discharge wastewater into navigablewaters (40 Part 122). Facilities that discharge to a POTW may be requiredto meet National Pretreatment Standards for some contaminants. Generalpretreatment standards applying to most industries discharging to a POTWare described in 40 CFR Part 403. In addition, effluent limitation guidelines,new source performance standards, pretreatment standards for new sources,and pretreatment standards for existing sources may apply to someshipbuilding and repair facilities that carryout electroplating or metal finishingoperations. Requirements for the Electroplating Point Source Category andthe Metal Finishing Point Source Category are listed under 40 CFR Part 413and 40 CFR Part 433, respectively.
Storm water rules require certain facilities with storm water discharge fromany one of 11 categories of industrial activity defined in 40 CFR 122.26 besubject to the storm water permit application requirements (see SectionVI.A). Many shipbuilding and repair facilities fall within these categories. Todetermine whether a particular facility falls within one of these categories, the
Shipbuilding and Repair Industry Federal Statutes and Regulations
Sector Notebook Project November 199796
regulation should be consulted. Required treatment of storm water flows areexpected to remove a large fraction of both conventional pollutants, such assuspended solids and biochemical oxygen demand (BOD), as well as toxicpollutants, such as certain metals and organic compounds.
Comprehensive Environmental Response, Compensation, and Liability Act (CERCLA)
The Comprehensive Environmental Response, Compensation, and LiabilityAct (CERCLA) and the Superfund Amendments and Reauthorization Act of1986 (SARA) provide the basic legal framework for the federal “Superfund”program to clean up abandoned hazardous waste sites (40 CFR Part 305). Metals and metal compounds often found in shipyards’ air emissions, waterdischarges, or waste shipments for off-site disposal include chromium,manganese, aluminum, nickel, copper, zinc, and lead. Metals are frequentlyfound at CERCLA's problem sites. When Congress ordered EPA and thePublic Health Service's Agency for Toxic Substances and Disease Registry(ATSDR) to list the hazardous substances most commonly found at problemsites and that pose the greatest threat to human health, lead, nickel, andaluminum all made the list.

Shipbuilding and Repair Industry Federal Statutes and Regulations
Sector Notebook Project November 199797
VI.C. Pending and Proposed Regulatory Requirements
Clean Water Act
Effluent limitation guidelines for wastewater discharges from metal productsand machinery (MP&M) industries are being developed. MP&M industrieshave been divided into two groups that originally were to be covered undertwo separate phases of the rulemaking. Effluent guidelines for Phase Iindustries and Phase II industries (which includes the shipbuilding and repairindustry) will now be covered under a single regulation to be proposed inOctober 2000 and finalized in December 2002. (Steven Geil, U.S. EPA,Office of Water, Engineering and Analysis Division, (202) 260-9817, email:[email protected])
Clean Air Act
In August 1996, EPA published Control Technique Guidelines (CTG) for thecontrol of VOC emissions from surface coating operations in the shipbuildingand ship repair industry. The CTG was issued to assist states in analyzing anddetermining reasonably available control technology (RACT) standards formajor sources of VOCs in the shipbuilding and repair operations locatedwithin ozone NAAQS nonattainment areas. EPA estimates that there areapproximately 100 facilities that will fall within this category in addition to theapproximately 35 major sources identified for the NESHAP MACT standards.Within one year of the publication of the CTG, states must adopt a RACTregulation at least as stringent as the limits recommended in the CTG. UnderSection 183(b)(4) of the Clean Air Act, EPA is required to issue the CTG forthe shipbuilding and repair industry based on “best available controlmeasures” (BACM) for emissions of VOCs and particulates. In developingthe CTG, EPA determined that the MACT standard of the 1995 NESHAP forShipbuilding and Repair Operations (Surface Coating) is the onlytechnologically and economically feasible level of control for these sources.Therefore, for shipbuilding and repair operations, EPA considers the RACT,BACM, and MACT standards to be identical. For particulate emissions, EPAdetermined the BACM to be no control. (Mohamed Serageldin, U.S. EPA,Office of Air Quality Planning and Standards, (919) 541-2379)

Shipbuilding and Repair Industry Federal Statutes and Regulations
Sector Notebook Project November 199798
Page 98 intentionally left blank.
Shipbuilding and Repair Industry Compliance and Enforcement History
Sector Notebook Project November 199799
VII. COMPLIANCE AND ENFORCEMENT HISTORY
Background
Until recently, EPA has focused much of its attention on measuringcompliance with specific environmental statutes. This approach allows theAgency to track compliance with the Clean Air Act, the ResourceConservation and Recovery Act, the Clean Water Act, and otherenvironmental statutes. Within the last several years, the Agency has begunto supplement single-media compliance indicators with facility-specific,multimedia indicators of compliance. In doing so, EPA is in a better positionto track compliance with all statutes at the facility level, and within specificindustrial sectors.
A major step in building the capacity to compile multimedia data for industrialsectors was the creation of EPA's Integrated Data for Enforcement Analysis(IDEA) system. IDEA has the capacity to "read into" the Agency's single-media databases, extract compliance records, and match the records toindividual facilities. The IDEA system can match Air, Water, Waste,Toxics/Pesticides/EPCRA, TRI, and Enforcement Docket records for a givenfacility, and generate a list of historical permit, inspection, and enforcementactivity. IDEA also has the capability to analyze data by geographic area andcorporate holder. As the capacity to generate multimedia compliance dataimproves, EPA will make available more in-depth compliance andenforcement information. Additionally, sector-specific measures of successfor compliance assistance efforts are under development.
Compliance and Enforcement Profile Description
Using inspection, violation and enforcement data from the IDEA system, thissection provides information regarding the historical compliance andenforcement activity of this sector. In order to mirror the facility universereported in the Toxic Chemical Profile, the data reported within this sectionconsists of records only from the TRI reporting universe. With this decision,the selection criteria are consistent across sectors with certain exceptions.For the sectors that do not normally report to the TRI program, data havebeen provided from EPA's Facility Indexing System (FINDS) which tracksfacilities in all media databases. Please note, in this section, EPA does notattempt to define the actual number of facilities that fall within each sector.Instead, the section portrays the records of a subset of facilities within thesector that are well defined within EPA databases.
As a check on the relative size of the full sector universe, most notebookscontain an estimated number of facilities within the sector according to theBureau of Census (See Section II). With sectors dominated by smallbusinesses, such as metal finishers and printers, the reporting universe within

Shipbuilding and Repair Industry Compliance and Enforcement History
EPA Regions include the following states: I (CT, MA, ME, RI, NH, VT); II (NJ, NY, PR, VI); III (DC, DE, MD, PA,4
VA, WV); IV (AL, FL, GA, KY, MS, NC, SC, TN); V (IL, IN, MI, MN, OH, WI); VI (AR, LA, NM, OK, TX); VII(IA, KS, MO, NE); VIII (CO, MT, ND, SD, UT, WY); IX (AZ, CA, HI, NV, Pacific Trust Territories); X (AK, ID, OR,WA).
Sector Notebook Project November 1997100
the EPA databases may be small in comparison to Census data. However, thegroup selected for inclusion in this data analysis section should be consistentwith this sector's general make-up.
Following this introduction is a list defining each data column presentedwithin this section. These values represent a retrospective summary ofinspections and enforcement actions, and reflect solely EPA, State, and localcompliance assurance activities that have been entered into EPA databases.To identify any changes in trends, the EPA ran two data queries, one for thepast five calendar years (April 1, 1992 to March 31, 1997) and the other forthe most recent twelve-month period (April 1, 1996 to March 31, 1997). Thefive-year analysis gives an average level of activity for that period forcomparison to the more recent activity.
Because most inspections focus on single-media requirements, the dataqueries presented in this section are taken from single media databases. Thesedatabases do not provide data on whether inspections are state/local or EPA-led. However, the table breaking down the universe of violations does givethe reader a crude measurement of the EPA's and states' efforts within eachmedia program. The presented data illustrate the variations across EPARegions for certain sectors. This variation may be attributable to state/local4
data entry variations, specific geographic concentrations, proximity topopulation centers, sensitive ecosystems, highly toxic chemicals used inproduction, or historical noncompliance. Hence, the exhibited data do notrank regional performance or necessarily reflect which regions may have themost compliance problems.
Compliance and Enforcement Data Definitions
General Definitions
Facility Indexing System (FINDS) -- this system assigns a common facilitynumber to EPA single-media permit records. The FINDS identificationnumber allows EPA to compile and review all permit, compliance,enforcement and pollutant release data for any given regulated facility.
Integrated Data for Enforcement Analysis (IDEA) -- is a data integrationsystem that can retrieve information from the major EPA program officedatabases. IDEA uses the FINDS identification number to link separate datarecords from EPA’s databases. This allows retrieval of records from acrossmedia or statutes for any given facility, thus creating a master list” of

Shipbuilding and Repair Industry Compliance and Enforcement History
Sector Notebook Project November 1997101
records for that facility. Some of the data systems accessible through IDEAare: AIRS (Air Facility Indexing and Retrieval System, Office of Air andRadiation), PCS (Permit Compliance System, Office of Water), RCRIS(Resource Conservation and Recovery Information System, Office of SolidWaste), NCDB (National Compliance Data Base, Office of Prevention,Pesticides, and Toxic Substances), CERCLIS (Comprehensive Environmentaland Liability Information System, Superfund), and TRIS (Toxic ReleaseInventory System). IDEA also contains information from outside sourcessuch as Dun and Bradstreet and the Occupational Safety and HealthAdministration (OSHA). Most data queries displayed in notebook sectionsIV and VII were conducted using IDEA.
Data Table Column Heading Definitions
Facilities in Search -- are based on the universe of TRI reporters within thelisted SIC code range. For industries not covered under TRI reportingrequirements (metal mining, nonmetallic mineral mining, electric powergeneration, ground transportation, water transportation, and dry cleaning), orindustries in which only a very small fraction of facilities report to TRI (e.g.,printing), the notebook uses the FINDS universe for executing data queries.The SIC code range selected for each search is defined by each notebook'sselected SIC code coverage described in Section II.
Facilities Inspected --- indicates the level of EPA and state agencyinspections for the facilities in this data search. These values show whatpercentage of the facility universe is inspected in a one-year or five-yearperiod.
Number of Inspections -- measures the total number of inspectionsconducted in this sector. An inspection event is counted each time it isentered into a single media database.
Average Time Between Inspections -- provides an average length of time,expressed in months, between compliance inspections at a facility within thedefined universe.
Facilities with One or More Enforcement Actions -- expresses the numberof facilities that were the subject of at least one enforcement action within thedefined time period. This category is broken down further into federal andstate actions. Data are obtained for administrative, civil/judicial, and criminalenforcement actions. Administrative actions include Notices of Violation(NOVs). A facility with multiple enforcement actions is only counted oncein this column, e.g., a facility with 3 enforcement actions counts as 1 facility.

Shipbuilding and Repair Industry Compliance and Enforcement History
Sector Notebook Project November 1997102
Total Enforcement Actions -- describes the total number of enforcementactions identified for an industrial sector across all environmental statutes. Afacility with multiple enforcement actions is counted multiple times, e.g., afacility with 3 enforcement actions counts as 3.
State Lead Actions -- shows what percentage of the total enforcementactions are taken by state and local environmental agencies. Varying levelsof use by states of EPA data systems may limit the volume of actionsrecorded as state enforcement activity. Some states extensively reportenforcement activities into EPA data systems, while other states may use theirown data systems.
Federal Lead Actions -- shows what percentage of the total enforcementactions are taken by the United States Environmental Protection Agency.This value includes referrals from state agencies. Many of these actions resultfrom coordinated or joint state/federal efforts.
Enforcement to Inspection Rate -- is a ratio of enforcement actions toinspections, and is presented for comparative purposes only. This ratio is arough indicator of the relationship between inspections and enforcement. Itrelates the number of enforcement actions and the number of inspections thatoccurred within the one-year or five-year period. This ratio includes theinspections and enforcement actions reported under the Clean Water Act(CWA), the Clean Air Act (CAA) and the Resource Conservation andRecovery Act (RCRA). Inspections and actions from the TSCA/FIFRA/EPCRA database are not factored into this ratio because most of the actionstaken under these programs are not the result of facility inspections. Also,this ratio does not account for enforcement actions arising from non-inspection compliance monitoring activities (e.g., self-reported waterdischarges) that can result in enforcement action within the CAA, CWA, andRCRA.
Facilities with One or More Violations Identified -- indicates thepercentage of inspected facilities having a violation identified in one of thefollowing data categories: In Violation or Significant Violation Status(CAA); Reportable Noncompliance, Current Year Noncompliance, SignificantNoncompliance (CWA); Noncompliance and Significant Noncompliance(FIFRA, TSCA, and EPCRA); Unresolved Violation and Unresolved HighPriority Violation (RCRA). The values presented for this column reflect theextent of noncompliance within the measured time frame, but do notdistinguish between the severity of the noncompliance. Violation status maybe a precursor to an enforcement action, but does not necessarily indicate thatan enforcement action will occur.
Shipbuilding and Repair Industry Compliance and Enforcement History
Sector Notebook Project November 1997103
Media Breakdown of Enforcement Actions and Inspections -- fourcolumns identify the proportion of total inspections and enforcement actionswithin EPA Air, Water, Waste, and TSCA/FIFRA/EPCRA databases. Eachcolumn is a percentage of either the Total Inspections,” or the TotalActions” column.
VII.A. Shipbuilding and Repair Industry Compliance History
Table 11 provides an overview of the reported compliance and enforcementdata for the shipbuilding and repair industry over the past five years (April1992 to April 1997). These data are also broken out by EPA Region therebypermitting geographical comparisons. A few points evident from the data arelisted below.
About half of shipbuilding and repair facility inspections and almost70 percent of enforcement actions occurred in Regions IV and VI,where most facilities in the database search (60 percent) were located.
In Region III, a relatively large number of inspections (66) werecarried out in relation to the number of facilities (6) found in thisRegion. This is reflected in the relatively low average time betweeninspections (5 months). However, the Region had the lowest rate ofenforcement actions to inspections (0.02).
Region X showed three facilities in the database search and only eightinspections over the past five years, giving the Region the highestaverage time between inspections (23 months). However,enforcement actions were brought against all three facilities in thistime period, resulting in the highest enforcement to inspection rate(0.38).

Shipbuilding and Repair Industry Compliance and Enforcement History
Sector Notebook Project November 1997104
Tab
le 1
1: F
ive-
Yea
r E
nfor
cem
ent a
nd C
ompl
ianc
e Su
mm
ary
for
the
Ship
build
ing
and
Rep
air
Indu
stry
AB
CD
EF
GH
IJ
Reg
ion
Fac
iliti
esin
Sea
rch
Fac
iliti
esIn
spec
ted
Num
ber
ofIn
spec
tion
sA
vera
geM
onth
sB
etw
een
Insp
ecti
ons
Fac
iliti
esw
ith
1 or
Mor
eE
nfor
cem
ent
Act
ions
Tot
alE
nfor
cem
ent
Act
ions
Per
cent
Stat
eL
ead
Act
ions
Per
cent
Fed
eral
Lea
dA
ctio
ns
Enf
orce
men
tto
Ins
pect
ion
Rat
e
I6
634
114
683
%17
%0.
18
II0
00
--0
00%
0%--
III
65
665
11
100%
0%0.
02
IV13
949
165
810
0%0%
0.16
V1
18
80
00%
0%--
VI
1312
7211
814
79%
21%
0.19
VII
00
0--
00
0%0%
--
VII
I0
00
--0
00%
0%--
IX2
16
200
00%
0%--
X3
38
232
367
%33
%0.
38
TO
TA
L44
3724
39
2032
84%
16%
0.13

Shipbuilding and Repair Industry Compliance and Enforcement History
Sector Notebook Project November 1997105
VII.B. Comparison of Enforcement and Compliance Activity Between Selected Industries
Tables 12 and 13 allow the compliance history of the shipbuilding and repairsector to be compared to the other industries covered by the industry sectornotebook project. Comparisons between Tables 12 and 13 permit theidentification of trends in compliance and enforcement records of the industryby comparing data covering the last five years (April 1992 to April 1997) tothat of the past year (April 1996 to April 1997). Some points evident fromthe data are listed below.
Of the sectors shown, the shipbuilding and repair industry had, by far,the smallest number of facilities (44) in the database search. (Thefacilities presented only include those facilities that report to TRI.)
The shipbuilding and repair industry had one of the highestenforcement to inspection rates over the past five years (0.13).However, this rate decreased significantly over the past year (0.08).
Compared to the other sectors shown, the industry was about averagein terms of the percent of facilities with violations (86 percent) andenforcement actions (14 percent) in the past year, and in the averagetime between inspections over the past five years (9 months).
Tables 14 and 15 provide a more in-depth comparison between theshipbuilding and repair industry and other sectors by breaking out thecompliance and enforcement data by environmental statute. As in theprevious Tables (Tables 12 and 13), the data cover the last five years (Table14) and the last one year (Table 15) to facilitate the identification of recenttrends. A few points evident from the data are listed below.
Inspections carried out under CAA and RCRA accounted for 81percent and 89 percent of inspections over the past five years and oneyear, respectively. RCRA inspections made up only 14 percent ofinspections in the past five years, but accounted for 25 percent ofenforcement actions.
Over the past year, a larger percentage of inspections were carried outunder CAA (54 percent) compared to the past five years (39 percent).
Meaningful comparisons of enforcement actions taken under eachstatute over the past year are not possible since only four enforcementactions (two under RCRA and two under CWA) were taken in thisperiod.

Shipbuilding and Repair Industry Compliance and Enforcement History
Sector Notebook Project November 1997106
Tab
le 1
2: F
ive-
Yea
r E
nfor
cem
ent a
nd C
ompl
ianc
e Su
mm
ary
for
Sele
cted
Ind
ustr
ies
AB
CD
EF
GH
IJ
Indu
stry
Sec
tor
Fac
iliti
esin
Sear
ch
Fac
iliti
esIn
spec
ted
Num
ber
ofIn
spec
tion
sA
vera
geM
onth
sB
etw
een
Insp
ecti
ons
Fac
iliti
es w
ith
1or
Mor
eE
nfor
cem
ent
Act
ions
Tot
alE
nfor
cem
ent
Act
ions
Per
cent
Stat
e L
ead
Act
ions
Per
cent
Fed
eral
Lea
dA
ctio
ns
Enf
orce
men
tto
Insp
ecti
onR
ate
Met
al M
inin
g1,
232
378
1,60
046
6311
153
%47
%0.
07
Coa
l Min
ing
3,25
674
13,
748
5288
132
89%
11%
0.04
Oil
and
Gas
Ext
ract
ion
4,67
61,
902
6,07
146
149
309
79%
21%
0.05
Non
-Met
allic
Min
eral
Min
ing
5,25
62,
803
12,8
2625
385
622
77%
23%
0.05
Tex
tiles
355
267
1,46
515
5383
90%
10%
0.06
Lum
ber a
nd W
ood
712
473
2,76
715
134
265
70%
30%
0.10
Furn
iture
499
386
2,37
913
6591
81%
19%
0.04
Pulp
and
Pap
er48
443
04,
630
615
047
880
%20
%0.
10
Prin
ting
5,86
22,
092
7,69
146
238
428
88%
12%
0.06
Inor
gani
c C
hem
ical
s44
128
63,
087
989
235
74%
26%
0.08
Res
ins
and
Man
mad
e Fi
bers
329
263
2,43
08
9321
976
%24
%0.
09
Phar
mac
eutic
als
164
129
1,20
18
3512
280
%20
%0.
10
Org
anic
Che
mic
als
425
355
4,29
46
153
468
65%
35%
0.11
Petr
oleu
m R
efin
ing
156
148
3,08
13
124
763
68%
32%
0.25
Rub
ber a
nd P
last
ic1,
818
981
4,38
325
178
276
82%
18%
0.06
Ston
e, C
lay,
Gla
ss a
nd C
oncr
ete
615
388
3,47
411
9727
775
%25
%0.
08
Iron
and
Ste
el34
927
54,
476
512
130
571
%29
%0.
07
Met
al C
astin
gs66
942
42,
535
1611
319
171
%29
%0.
08
Non
ferr
ous
Met
als
203
161
1,64
07
6817
478
%22
%0.
11
Fabr
icat
ed M
etal
Pro
duct
s2,
906
1,85
87,
914
2236
560
075
%25
%0.
08
Ele
ctro
nics
1,25
086
34,
500
1715
025
180
%20
%0.
06
Aut
omob
ile A
ssem
bly
1,26
092
75,
912
1325
341
382
%18
%0.
07
Ship
build
ing
and
Rep
air
4437
243
920
3284
%16
%0.
13
Gro
und
Tra
nspo
rtat
ion
7,78
63,
263
12,9
0436
375
774
84%
16%
0.06
Wat
er T
rans
port
atio
n51
419
281
638
3670
61%
39%
0.09
Air
Tra
nspo
rtat
ion
444
231
973
2748
9788
%12
%0.
10
Foss
il Fu
el E
lect
ric
Pow
er3,
270
2,16
614
,210
1440
378
976
%24
%0.
06
Dry
Cle
anin
g6,
063
2,36
03,
813
9555
6695
%5%
0.02
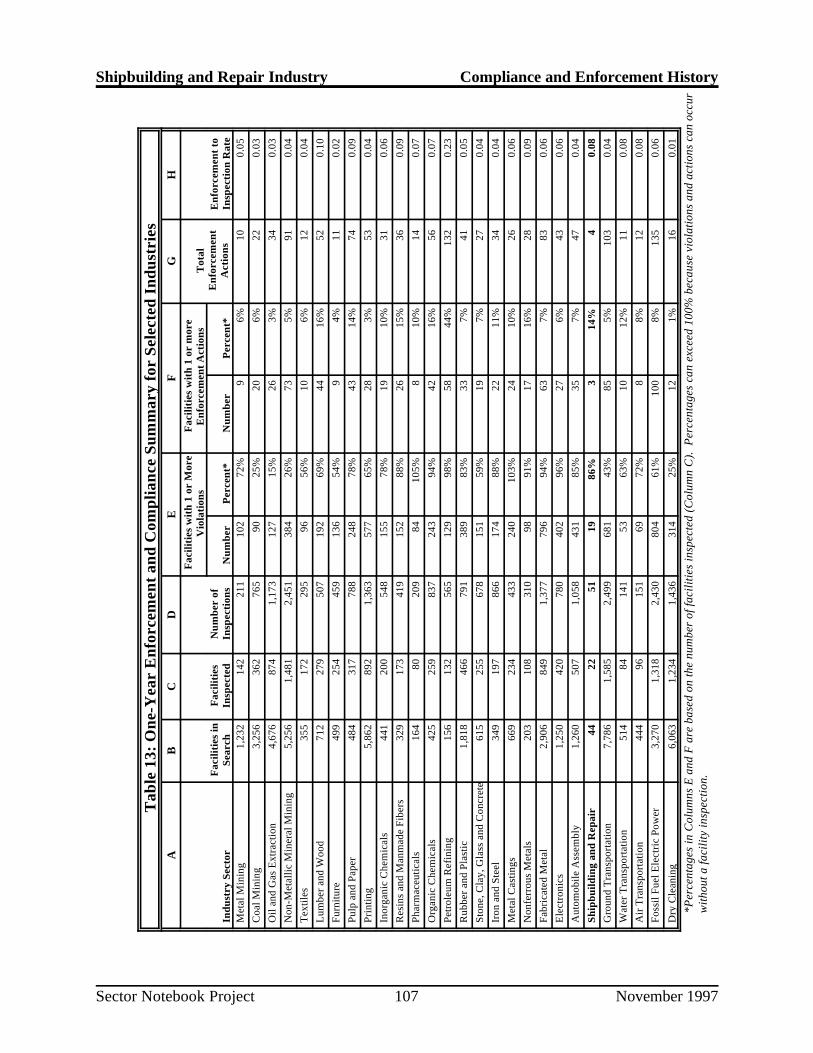
Shipbuilding and Repair Industry Compliance and Enforcement History
Sector Notebook Project November 1997107
Tab
le 1
3: O
ne-Y
ear
Enf
orce
men
t and
Com
plia
nce
Sum
mar
y fo
r Se
lect
ed I
ndus
trie
sA
BC
DE
FG
HF
acili
ties
wit
h 1
or M
ore
Vio
lati
ons
Fac
iliti
es w
ith
1 or
mor
eE
nfor
cem
ent A
ctio
nsT
otal
Enf
orce
men
tA
ctio
nsIn
dust
ry S
ecto
rF
acili
ties
inSe
arch
Fac
iliti
esIn
spec
ted
Num
ber
ofIn
spec
tion
sN
umbe
rP
erce
nt*
Num
ber
Per
cent
*E
nfor
cem
ent t
oIn
spec
tion
Rat
eM
etal
Min
ing
1,23
214
221
110
272
%9
6%10
0.05
Coa
l Min
ing
3,25
636
276
590
25%
206%
220.
03O
il an
d G
as E
xtra
ctio
n4,
676
874
1,17
312
715
%26
3%34
0.03
Non
-Met
allic
Min
eral
Min
ing
5,25
61,
481
2,45
138
426
%73
5%91
0.04
Tex
tiles
355
172
295
9656
%10
6%12
0.04
Lum
ber a
nd W
ood
712
279
507
192
69%
4416
%52
0.10
Furn
iture
499
254
459
136
54%
94%
110.
02Pu
lp a
nd P
aper
484
317
788
248
78%
4314
%74
0.09
Prin
ting
5,86
289
21,
363
577
65%
283%
530.
04In
orga
nic
Che
mic
als
441
200
548
155
78%
1910
%31
0.06
Res
ins
and
Man
mad
e Fi
bers
329
173
419
152
88%
2615
%36
0.09
Phar
mac
eutic
als
164
8020
984
105%
810
%14
0.07
Org
anic
Che
mic
als
425
259
837
243
94%
4216
%56
0.07
Petr
oleu
m R
efin
ing
156
132
565
129
98%
5844
%13
20.
23R
ubbe
r and
Pla
stic
1,81
846
679
138
983
%33
7%41
0.05
Ston
e, C
lay,
Gla
ss a
nd C
oncr
ete
615
255
678
151
59%
197%
270.
04Ir
on a
nd S
teel
349
197
866
174
88%
2211
%34
0.04
Met
al C
astin
gs66
923
443
324
010
3%24
10%
260.
06N
onfe
rrou
s M
etal
s20
310
831
098
91%
1716
%28
0.09
Fabr
icat
ed M
etal
2,90
684
91,
377
796
94%
637%
830.
06E
lect
roni
cs1,
250
420
780
402
96%
276%
430.
06A
utom
obile
Ass
embl
y1,
260
507
1,05
843
185
%35
7%47
0.04
Ship
build
ing
and
Rep
air
4422
5119
86%
314
%4
0.08
Gro
und
Tra
nspo
rtat
ion
7,78
61,
585
2,49
968
143
%85
5%10
30.
04W
ater
Tra
nspo
rtat
ion
514
8414
153
63%
1012
%11
0.08
Air
Tra
nspo
rtat
ion
444
9615
169
72%
88%
120.
08Fo
ssil
Fuel
Ele
ctri
c Po
wer
3,27
01,
318
2,43
080
461
%10
08%
135
0.06
Dry
Cle
anin
g6,
063
1,23
41,
436
314
25%
121%
160.
01
*Per
cent
ages
in C
olum
ns E
and
F a
re b
ased
on
the
num
ber
of fa
cilit
ies
insp
ecte
d (C
olum
n C
). P
erce
ntag
es c
an e
xcee
d 10
0% b
ecau
se v
iola
tions
and
act
ions
can
occ
urw
ithou
t a fa
cilit
y in
spec
tion.

Shipbuilding and Repair Industry Compliance and Enforcement History
Sector Notebook Project November 1997108
Tab
le 1
4: F
ive-
Yea
r In
spec
tion
and
Enf
orce
men
t Sum
mar
y by
Sta
tute
for
Sele
cted
Ind
ustr
ies
Indu
stry
Sec
tor
Fac
iliti
esIn
spec
ted
Tot
alIn
spec
tion
s
Tot
alE
nfor
cem
ent
Act
ions
Cle
an A
ir A
ctC
lean
Wat
er A
ctR
CR
AF
IFR
A/T
SCA
/E
PC
RA
/Oth
er
% o
f Tot
alIn
spec
tion
s%
of
Tot
alA
ctio
ns
% o
f Tot
alIn
spec
tion
s%
of
Tot
alA
ctio
ns
% o
f Tot
alIn
spec
tion
s%
of
Tot
alA
ctio
ns
% o
f Tot
alIn
spec
tion
s%
of
Tot
alA
ctio
ns
Met
al M
inin
g37
81,
600
111
39%
19%
52%
52%
8%12
%1%
17%
Coa
l Min
ing
741
3,74
813
257
%64
%38
%28
%4%
8%1%
1%O
il an
d G
as E
xtra
ctio
n1,
902
6,07
130
975
%65
%16
%14
%8%
18%
0%3%
Non
-Met
allic
Min
eral
Min
ing
2,80
312
,826
622
83%
81%
14%
13%
3%4%
0%3%
Tex
tiles
267
1,46
583
58%
54%
22%
25%
18%
14%
2%6%
Lum
ber a
nd W
ood
473
2,76
726
549
%47
%6%
6%44
%31
%1%
16%
Furn
iture
386
2,37
991
62%
42%
3%0%
34%
43%
1%14
%Pu
lp a
nd P
aper
430
4,63
047
851
%59
%32
%28
%15
%10
%2%
4%Pr
intin
g2,
092
7,69
142
860
%64
%5%
3%35
%29
%1%
4%In
orga
nic
Che
mic
als
286
3,08
723
538
%44
%27
%21
%34
%30
%1%
5%R
esin
s an
d M
anm
ade
Fibe
rs26
32,
430
219
35%
43%
23%
28%
38%
23%
4%6%
Phar
mac
eutic
als
129
1,20
112
235
%49
%15
%25
%45
%20
%5%
5%O
rgan
ic C
hem
ical
s35
54,
294
468
37%
42%
16%
25%
44%
28%
4%6%
Petr
oleu
m R
efin
ing
148
3,08
176
342
%59
%20
%13
%36
%21
%2%
7%R
ubbe
r and
Pla
stic
981
4,38
327
651
%44
%12
%11
%35
%34
%2%
11%
Ston
e, C
lay,
Gla
ss a
nd C
oncr
ete
388
3,47
427
756
%57
%13
%9%
31%
30%
1%4%
Iron
and
Ste
el27
54,
476
305
45%
35%
26%
26%
28%
31%
1%8%
Met
al C
astin
gs42
42,
535
191
55%
44%
11%
10%
32%
31%
2%14
%N
onfe
rrou
s M
etal
s16
11,
640
174
48%
43%
18%
17%
33%
31%
1%10
%Fa
bric
ated
Met
al1,
858
7,91
460
040
%33
%12
%11
%45
%43
%2%
13%
Ele
ctro
nics
863
4,50
025
138
%32
%13
%11
%47
%50
%2%
7%A
utom
obile
Ass
embl
y92
75,
912
413
47%
39%
8%9%
43%
43%
2%9%
Ship
build
ing
and
Rep
air
3724
332
39%
25%
14%
25%
42%
47%
5%3%
Gro
und
Tra
nspo
rtat
ion
3,26
312
,904
774
59%
41%
12%
11%
29%
45%
1%3%
Wat
er T
rans
port
atio
n19
281
670
39%
29%
23%
34%
37%
33%
1%4%
Air
Tra
nspo
rtat
ion
231
973
9725
%32
%27
%20
%48
%48
%0%
0%Fo
ssil
Fuel
Ele
ctri
c Po
wer
2,16
614
,210
789
57%
59%
32%
26%
11%
10%
1%5%
Dry
Cle
anin
g2,
360
3,81
366
56%
23%
3%6%
41%
71%
0%0%
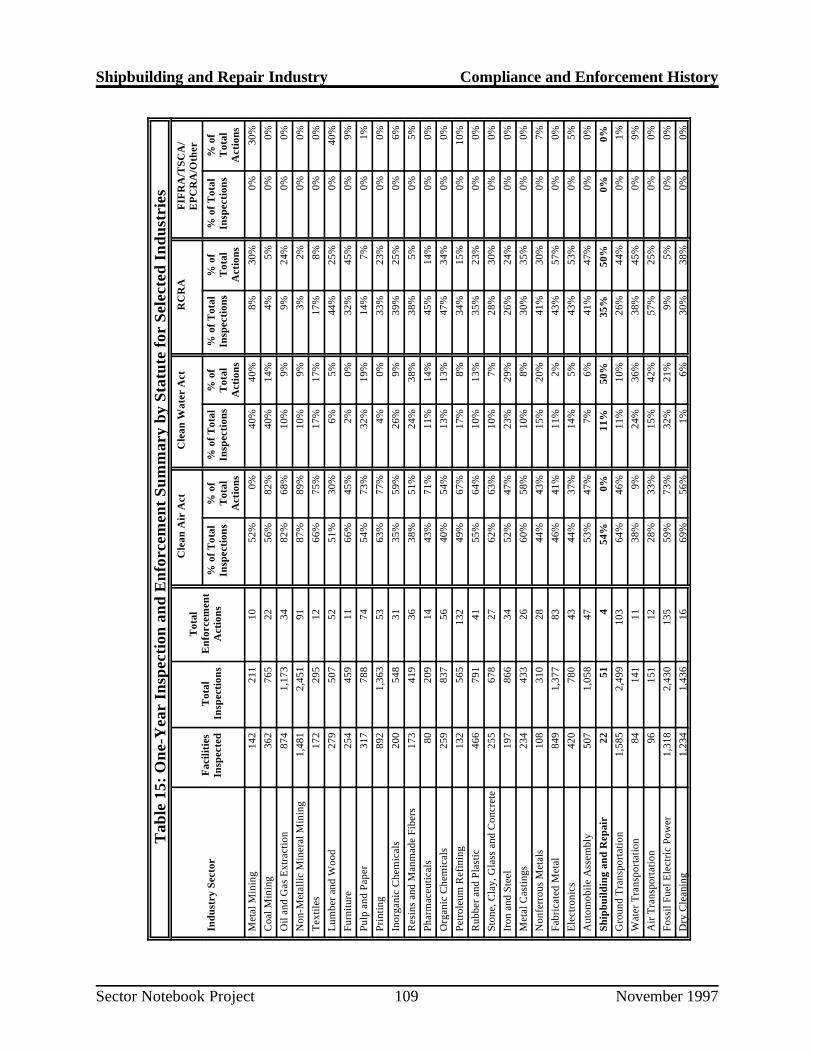
Shipbuilding and Repair Industry Compliance and Enforcement History
Sector Notebook Project November 1997109
Tab
le 1
5: O
ne-Y
ear
Insp
ecti
on a
nd E
nfor
cem
ent S
umm
ary
by S
tatu
te fo
r Se
lect
ed I
ndus
trie
s
Fac
iliti
esIn
spec
ted
Tot
alIn
spec
tion
s
Tot
alE
nfor
cem
ent
Act
ions
Cle
an A
ir A
ctC
lean
Wat
er A
ctR
CR
AF
IFR
A/T
SCA
/E
PC
RA
/Oth
er
Indu
stry
Sec
tor
% o
f Tot
alIn
spec
tion
s%
of
Tot
alA
ctio
ns
% o
f Tot
alIn
spec
tion
s%
of
Tot
alA
ctio
ns
% o
f Tot
alIn
spec
tion
s%
of
Tot
alA
ctio
ns
% o
f Tot
alIn
spec
tion
s%
of
Tot
alA
ctio
ns
Met
al M
inin
g14
221
110
52%
0%40
%40
%8%
30%
0%30
%C
oal M
inin
g36
276
522
56%
82%
40%
14%
4%5%
0%0%
Oil
and
Gas
Ext
ract
ion
874
1,17
334
82%
68%
10%
9%9%
24%
0%0%
Non
-Met
allic
Min
eral
Min
ing
1,48
12,
451
9187
%89
%10
%9%
3%2%
0%0%
Tex
tiles
172
295
1266
%75
%17
%17
%17
%8%
0%0%
Lum
ber a
nd W
ood
279
507
5251
%30
%6%
5%44
%25
%0%
40%
Furn
iture
254
459
1166
%45
%2%
0%32
%45
%0%
9%Pu
lp a
nd P
aper
317
788
7454
%73
%32
%19
%14
%7%
0%1%
Prin
ting
892
1,36
353
63%
77%
4%0%
33%
23%
0%0%
Inor
gani
c C
hem
ical
s20
054
831
35%
59%
26%
9%39
%25
%0%
6%R
esin
s an
d M
anm
ade
Fibe
rs17
341
936
38%
51%
24%
38%
38%
5%0%
5%Ph
arm
aceu
tical
s80
209
1443
%71
%11
%14
%45
%14
%0%
0%O
rgan
ic C
hem
ical
s25
983
756
40%
54%
13%
13%
47%
34%
0%0%
Petr
oleu
m R
efin
ing
132
565
132
49%
67%
17%
8%34
%15
%0%
10%
Rub
ber a
nd P
last
ic46
679
141
55%
64%
10%
13%
35%
23%
0%0%
Ston
e, C
lay,
Gla
ss a
nd C
oncr
ete
255
678
2762
%63
%10
%7%
28%
30%
0%0%
Iron
and
Ste
el19
786
634
52%
47%
23%
29%
26%
24%
0%0%
Met
al C
astin
gs23
443
326
60%
58%
10%
8%30
%35
%0%
0%N
onfe
rrou
s M
etal
s10
831
028
44%
43%
15%
20%
41%
30%
0%7%
Fabr
icat
ed M
etal
849
1,37
783
46%
41%
11%
2%43
%57
%0%
0%E
lect
roni
cs42
078
043
44%
37%
14%
5%43
%53
%0%
5%A
utom
obile
Ass
embl
y50
71,
058
4753
%47
%7%
6%41
%47
%0%
0%Sh
ipbu
ildin
g an
d R
epai
r22
514
54%
0%11
%50
%35
%50
%0%
0%G
roun
d T
rans
port
atio
n1,
585
2,49
910
364
%46
%11
%10
%26
%44
%0%
1%W
ater
Tra
nspo
rtat
ion
8414
111
38%
9%24
%36
%38
%45
%0%
9%A
ir T
rans
port
atio
n96
151
1228
%33
%15
%42
%57
%25
%0%
0%Fo
ssil
Fuel
Ele
ctri
c Po
wer
1,31
82,
430
135
59%
73%
32%
21%
9%5%
0%0%
Dry
Cle
anin
g1,
234
1,43
616
69%
56%
1%6%
30%
38%
0%0%

Shipbuilding and Repair Industry Compliance and Enforcement History
Sector Notebook Project November 1997110
VII.C. Review of Major Legal Actions
Major Cases/Supplemental Environmental Projects
This section provides summary information about major cases that haveaffected this sector, and a list of Supplemental Environmental Projects(SEPs).
VII.C.1. Review of Major Cases
As indicated in EPA’s Enforcement Accomplishments Report, FY1995 andFY1996 publications, two significant enforcement actions were resolvedbetween 1995 and 1996 for the shipbuilding industry.
U.S. v. First Marine Shipyard Inc., et al. (E.D.NY): On September 30, 1996the U.S. filed a complaint for CERCLA cost recovery and penalties relatedto Region II’s cleanup of the barge Nathan Berman. The complaint seeksrecovery of approximately $1,8 million from First Marine Shipyard, MarineFacilities Inc., Marine Movements, Inc., and Peter Frank and Jane FrankKresch individually. It also includes a second cause of action against FirstMarine Shipyard for failure to comply with an administrative CERCLA §106order issued to it in March of 1993.
Cascade General: Cascade General, a ship repair facility in Portland, Oregon,agreed to a penalty of $78,568 for alleged EPCRA violations. The companyagreed to pay $39,284 in cash and install air filtration dust collector andsolvent recovery systems and to switch to water-based paint to remediate thebalance of the penalty. The SEPs will cost about $117,000 to implement. Thedust collector will improve air quality in the facility by reducing dust in workareas. The solvent recovery system will reduce by 90% the amount of solventsdischarged to the air by recovering batch solvents for reuse in the facility. ForTRI reporting years 1988-1993, total releases were reported at 253,000pounds.
VII.C.2. Supplementary Environmental Projects (SEPs)
Supplemental environmental projects (SEPs) are enforcement options thatrequire the non-compliant facility to complete specific projects. Informationon SEP cases can be accessed via the internet at EPA’s Enviro$en$e website:http://es.inel.gov/sep.
Shipbuilding and Repair Activities and Initiatives
Sector Notebook Project November 1997111
VIII. COMPLIANCE ASSURANCE ACTIVITIES AND INITIATIVES
This section highlights the activities undertaken by this industry sector andpublic agencies to voluntarily improve the sector's environmentalperformance. These activities include those independently initiated byindustrial trade associations. In this section, the notebook also contains alisting and description of national and regional trade associations.
VIII.A. Sector-related Environmental Programs and Activities
National Shipbuilding Research Program Panel SP-1
The National Shipbuilding Research Program (NSRP) is a jointindustry/government program aimed at improving the global competitivenessof American shipyards. NSRP’s mission is to assist the shipbuilding and shiprepair industry in achieving and maintaining global competitiveness withrespect to quality, time, cost, and customer satisfaction. The program is alsoexpected to significantly reduce the costs and delivery times of ships orderedby the U.S. Navy. NSRP’s objectives are reached through individual projectswhich form the content of the shipbuilding technology program. JointGovernment and industry meetings are held to identify final projectdescriptions. NSRP utilizes a panel structure to develop project proposalsand implement projects. The Panel SP-1 focuses on shipbuilding and repairfacilities and environmental effects.
The mission of Panel SP-1, Facilities and Environmental Effects, is to supportthe NSRP by providing leadership and expertise to the shipbuilding and repairindustry, with respect to facilities and environmental issues. The followinggoals have been established by SP-1:
increase participation of shipyards and other Maritime Associationsby 100 percent;
improve communication and visibility between NSRP Panels, with theExecutive Control Board, within NSRP participating shipyards andbeyond NSRP;
be proactive in representing industry views regarding regulatorymatters;
identify, develop and implement cost-effective technologies infacilities and environmental areas;
educate and assist the shipbuilding and repair industry and itscustomers in meeting environmental and regulatory requirements; and

Shipbuilding and Repair Activities and Initiatives
Sector Notebook Project November 1997112
maintain and continue to improve SP-1 expertise.
Panel SP-1 has a number of active and proposed projects. The following isa list of active projects:
Environmental Studies and Testing
Environmental Training Modules
Feasibility and Economic Study of the Treatment, Recycling &Disposal of Spent Abrasives
Solid Waste Segregation & Recycling
Title V Permit for Shipyards Strategy Guide for Development ofGenerated Permit
Wastewater Treatment Technology Survey
Impact on Shipyards from the Reauthorization of the Federal CleanWater Act
Development of Guidance for Selecting Legitimate RecyclingProducts and Processes
Developing a Shipyard Program for NPDES Compliance
More information on Panel SP-1 activities can be obtained from theEnvironmental Resources and Information Center (ERIC), a division of theGulf Coast Region Maritime Technology Center at the University of NewOrleans at (504) 286-6053.
National Defense Center for Environmental Excellence
The National Defense Center for Environmental Excellence (NDCEE) wasestablished by the Department of Defense to provide the military and privatesector industrial base clients with environmentally compliant technologies.NDCEE conducts environmental technology research and disseminatesinformation on environmental technologies and regulations. At the Army’sArmament Research, Development and Engineering Center at PicatinnyArsenal, NJ, NDCEE has established an industrial-scale facility for thedemonstration of nonpolluting surface coatings. The NDCEE demonstrationfacility is used to validate cost, schedules and performance parameters of newcoating technologies. NDCEE also provides assistance in the form ofequipment, site engineers, economic analyses, training, and troubleshootingfor those clients implementing demonstrated coating technologies at their

Shipbuilding and Repair Activities and Initiatives
Sector Notebook Project November 1997113
industrial facility. In its powder coating demonstration line, industrial partsare cleaned, pretreated, sprayed with nonpolluting organic powders, thencured in a process than nearly eliminates volatile organic compounds andhazardous wastes. Contact: Dr. Dale A. Denny, Executive Director, NDCEE,(814) 269-2432.
MARITECH
MARITECH is a five-year jointly funded by the Federal Government andindustry and is administered by the Department of Defense’s AdvancedResearch Projects Agency (ARPA), in collaboration with MARAD.MARITECH provides matching Government funds to encourage theshipbuilding industry to direct and lead in the development and application ofadvanced technology to improve its competitiveness and to preserve itsindustrial base. In the near-term MARITECH aims to assist industry inpenetrating the international marketplace with competitive ship designs,market strategies, and modern shipbuilding processes and procedures. In thelong-term, the program is meant to encourage advanced ship and shipbuildingtechnology projects for promoting continuous product and processimprovement in order to maintain and enlarge the U.S. share of thecommercial and international market. MARITECH funded $30 million inFY94, $40 million in FY95, $50 million in FY96, and $50 million in FY97 forvessel design and shipyard technology projects.

Shipbuilding and Repair Activities and Initiatives
Sector Notebook Project November 1997114
VIII.B. EPA Voluntary Programs
33/50 Program
The "33/50 Program" is EPA's voluntary program to reduce toxic chemicalreleases and transfers of seventeen chemicals from manufacturing facilities.Participating companies pledge to reduce their toxic chemical releases andtransfers by 33% as of 1992 and by 50% as of 1995 from the 1988 baselineyear. Certificates of Appreciation have been given out to participants meetingtheir 1992 goals. The list of chemicals includes seventeen high-use chemicalsreported in the Toxics Release Inventory. Table 16 lists those companiesparticipating in the 33/50 program that reported the four-digit SIC code 3731to TRI. Some of the companies shown also listed facilities that are notbuilding or repairing ships. The number of facilities within each company thatare participating in the 33/50 program and that report the shipbuilding andrepair SIC code is shown. Where available and quantifiable against 1988releases and transfers, each company’s 33/50 goals for 1995 and the actualtotal releases and transfers and percent reduction between 1988 and 1994 arepresented. TRI 33/50 data for 1995 was not available at the time ofpublication.
Twelve of the seventeen target chemicals were reported to TRI byshipbuilding and repair facilities in 1994. Of all TRI chemicals released andtransferred by the shipbuilding and repair industry, xylenes (a 33/50 targetchemical), was released and transferred most frequently (32 facilities), andwas the top chemical by volume released and transferred. Toluene, the nextmost frequently reported 33/50 chemical, was reported by six facilities. Theremaining 33/50 chemicals were each reported by four or fewer facilities.
Table 16 shows that 7 companies comprised of 15 facilities reporting SIC3731 are participating in the 33/50 program. For those companies shownwith more than one shipyard, all shipyards may not be participating in 33/50.The 33/50 goals shown for companies with multiple shipyards are company-wide, potentially aggregating more than one shipyard and facilities notcarrying out shipbuilding and repair operations. In addition to company-widegoals, individual facilities within a company may have their own 33/50 goalsor may be specifically listed as not participating in the 33/50 program. Sincethe actual percent reductions shown in the last column apply to all of thecompanies’ shipbuilding and repair facilities and only shipbuilding and repairfacilities, direct comparisons to those company goals incorporating non-shipbuilding and repair facilities or excluding certain facilities may not bepossible. For information on specific facilities participating in 33/50, contactDavid Sarokin (202-260-6907) at the 33/50 Program Office.

Shipbuilding and Repair Activities and Initiatives
Sector Notebook Project November 1997115
Table 16: Shipbuilding and Repair Industry Participation in the 33/50 Program
Parent Company (Headquarters Location)
Company- Company- 1988 TRI 1994 TRI Actual %Owned Wide % Releases and Releases and Reduction for
Shipyards Reduction Transfers of Transfers of ShipyardsReporting 33/50 Goal 33/50 Chemicals 33/50 Chemicals (1988-1994)
Chemicals (1988 to 1995) (pounds) (pounds)
1
Avondale Industries Inc.Avondale, LA
3 54 1,558,614 20,285 99
Bethlehem Steel Corp.Bethlehem, PA
2 50 92,000 129,020 -40
Fulcrum II Limited Partner.(Bath Iron Works)New York, NY
4 24 116,500 15,331 87
General Dynamics Corp.Falls Church, VA
2 84 316,777 8,182 97
Tenneco Inc.(Newport News)Houston, TX
1 8 896,292 268,950 70
U.S. Air ForceWashington, DC
1 *** 0 108,835 -
Unimar International Inc.Seattle, WA
1 * 0 0 -
TOTAL 15 -- 2,980,183 550,603 86Source: U.S. EPA 33/50 Program Office, 1996.
Company-Wide Reduction Goals aggregate all company-owned facilities which may include1
facilities not building and repairing ships.
* = Reduction goal not quantifiable against 1988 TRI data.** = Use reduction goal only.*** = No numeric reduction goal.

Shipbuilding and Repair Activities and Initiatives
Sector Notebook Project November 1997116
Environmental Leadership Program
The Environmental Leadership Program (ELP) is a national initiativedeveloped by EPA that focuses on improving environmental performance,encouraging voluntary compliance, and building working relationships withstakeholders. EPA initiated a one year pilot program in 1995 by selecting 12projects at industrial facilities and federal installations which woulddemonstrate the principles of the ELP program. These principles include:environmental management systems, multimedia compliance assurance, third-party verification of compliance, public measures of accountability, pollutionprevention, community involvement, and mentor programs. In return forparticipating, pilot participants received public recognition and were given aperiod of time to correct any violations discovered during these experimentalprojects.
EPA is making plans to launch its full-scale Environmental LeadershipProgram in 1997. The full-scale program will be facility-based with a 6-yearparticipation cycle. Facilities that meet certain requirements will be eligibleto participate, such as having a community outreach/employee involvementprograms and an environmental management system (EMS) in place for 2years. (Contact: http://es.inel.gov/elp or Debby Thomas, ELP DeputyDirector, at 202-564-5041)
Project XL
Project XL was initiated in March 1995 as a part of President Clinton’sReinventing Environmental Regulation initiative. The projects seek toachieve cost effective environmental benefits by providing participantsregulatory flexibility on the condition that they produce greater environmentalbenefits. EPA and program participants will negotiate and sign a Final ProjectAgreement, detailing specific environmental objectives that the regulatedentity shall satisfy. EPA will provide regulatory flexibility as an incentive forthe participants’ superior environmental performance. Participants areencouraged to seek stakeholder support from local governments, businesses,and environmental groups. EPA hopes to implement fifty pilot projects infour categories, including industrial facilities, communities, and governmentfacilities regulated by EPA. Applications will be accepted on a rolling basis.For additional information regarding XL projects, including applicationprocedures and criteria, see the May 23, 1995 Federal Register Notice.(Contact: Fax-on-Demand Hotline 202-260-8590, Web:http://www.epa.gov/ProjectXL, or Christopher Knopes at EPA’s Office ofPolicy, Planning and Evaluation 202-260-9298)
Shipbuilding and Repair Activities and Initiatives
Sector Notebook Project November 1997117
Climate Wise Program
Climate Wise is helping US industries turn energy efficiency and pollutionprevention into a corporate asset. Supported by the technical assistance,financing information and public recognition that Climate Wise offers,participating companies are developing and launching comprehensiveindustrial energy efficiency and pollution prevention action plans that savemoney and protect the environment. The nearly 300 Climate Wise companiesexpect to save more than $300 million and reduce greenhouse gas emissionsby 18 million metric tons of carbon dioxide equivalent by the year 2000.Some of the actions companies are undertaking to achieve these resultsinclude: process improvements, boiler and steam system optimization, aircompressor system improvements, fuel switching, and waste heat recoverymeasures including cogeneration. Created as part of the President’s ClimateChange Action Plan, Climate Wise is jointly operated by the Department ofEnergy and EPA. Under the Plan many other programs were also launchedor upgraded including Green Lights, WasteWi$e and DoE’s Motor ChallengeProgram. Climate Wise provides an umbrella for these programs whichencourage company participation by providing information on the range ofpartnership opportunities available. (Contact: Pamela Herman, EPA, 202-260-4407 or Jan Vernet, DoE, 202-586-4755)
Energy Star Buildings Program
EPA’s ENERGY STAR Buildings Program is a voluntary, profit-based programdesigned to improve the energy-efficiency in commercial and industrialbuildings. Expanding the successful Green Lights Program, ENERGY STARBuildings was launched in 1995. This program relies on a 5-stage strategydesigned to maximize energy savings thereby lowering energy bills, improvingoccupant comfort, and preventing pollution -- all at the same time. Ifimplemented in every commercial and industrial building in the United States,ENERGY STAR Buildings could cut the nation’s energy bill by up to $25 billionand prevent up to 35% of carbon dioxide emissions. (This is equivalent totaking 60 million cars of the road). ENERGY STAR Buildings participantsinclude corporations; small and medium sized businesses; local, federal andstate governments; non-profit groups; schools; universities; and health carefacilities. EPA provides technical and non-technical support includingsoftware, workshops, manuals, communication tools, and an informationhotline. EPA’s Office of Air and Radiation manages the operation of theENERGY STAR Buildings Program. (Contact: Green Light/Energy Star Hotlineat 1-888-STAR-YES or Maria Tikoff Vargas, EPA Program Director at 202-233-9178 or visit the ENERGY STAR Buildings Program website athttp://www.epa.gov/appdstar/buildings/)
Shipbuilding and Repair Activities and Initiatives
Sector Notebook Project November 1997118
Green Lights Program
EPA’s Green Lights program was initiated in 1991 and has the goal ofpreventing pollution by encouraging U.S. institutions to use energy-efficientlighting technologies. The program saves money for businesses andorganizations and creates a cleaner environment by reducing pollutantsreleased into the atmosphere. The program has over 2,345 participants whichinclude major corporations, small and medium sized businesses, federal, stateand local governments, non-profit groups, schools, universities, and healthcare facilities. Each participant is required to survey their facilities andupgrade lighting wherever it is profitable. As of March 1997, participants hadlowered their electric bills by $289 million annually. EPA provides technicalassistance to the participants through a decision support software package,workshops and manuals, and an information hotline. EPA’s Office of Air andRadiation is responsible for operating the Green Lights Program. (Contact:Green Light/Energy Star Hotline at 1-888-STARYES or Maria TikoffVargar, EPA Program Director, at 202-233-9178 the )
WasteWi$e Program
The WasteWi$e Program was started in 1994 by EPA’s Office of Solid Wasteand Emergency Response. The program is aimed at reducing municipal solidwastes by promoting waste prevention, recycling collection and themanufacturing and purchase of recycled products. As of 1997, the programhad about 500 companies as members, one third of whom are Fortune 1000corporations. Members agree to identify and implement actions to reducetheir solid wastes setting waste reduction goals and providing EPA withyearly progress reports. To member companies, EPA, in turn, providestechnical assistance, publications, networking opportunities, and national andregional recognition. (Contact: WasteWi$e Hotline at 1-800-372-9473 orJoanne Oxley, EPA Program Manager, 703-308-0199)
NICE3
The U.S. Department of Energy is administering a grant program called TheNational Industrial Competitiveness through Energy, Environment, andEconomics (NICE ). By providing grants of up to 45 percent of the total3
project cost, the program encourages industry to reduce industrial waste atits source and become more energy-efficient and cost-competitive throughwaste minimization efforts. Grants are used by industry to design, test, anddemonstrate new processes and/or equipment with the potential to reducepollution and increase energy efficiency. The program is open to allindustries; however, priority is given to proposals from participants in theforest products, chemicals, petroleum refining, steel, aluminum, metal castingand glass manufacturing sectors. (Contact: http//www.oit.doe.gov/access/nice3, Chris Sifri, DOE, 303-275-4723 or Eric Hass, DOE, 303-275-4728.)

Shipbuilding and Repair Activities and Initiatives
Sector Notebook Project November 1997119
Design for the Environment (DfE)
DfE is working with several industries to identify cost-effective pollutionprevention strategies that reduce risks to workers and the environment. DfEhelps businesses compare and evaluate the performance, cost, pollutionprevention benefits, and human health and environmental risks associated withexisting and alternative technologies. The goal of these projects is toencourage businesses to consider and use cleaner products, processes, andtechnologies. For more information about the DfE Program, call (202) 260-1678. To obtain copies of DfE materials or for general information aboutDfE, contact EPA’s Pollution Prevention Information Clearinghouse at (202)260-1023 or visit the DfE Website at http://es.inel.gov/dfe.

Shipbuilding and Repair Activities and Initiatives
Sector Notebook Project November 1997120
VIII.C. Trade Associations
American Shipbuilding Association Members: 6600 Pennsylvania Ave. Suite 305 Contact: Frank LoseyWashington, DC 20003 (202)-544-9614Phone: (202)-544-8170 Fax: (202)-544-9618
The American Shipbuilding Association (ASA) is a private, non-profit tradeassociation comprising America’s six largest private sector shipyards. The shipyardsare: Avondale Industries, Bath Iron Works, Electric Boat, Ingalls Shipbuilding,National Steel & Shipbuilding Company, and Newport News Shipbuilding. These sixshipyards employ the large majority of shipbuilding employees in the U.S. More than98 percent of the Navy’s shipbuilding budget is spent on ships constructed in ASAshipyards. The goals of ASA are to preserve and promote the U.S. naval shipbuildingindustrial base as well as to educate the U.S. public and government to theimportance of shipbuilding to the country. ASA publishes American ShipbuilderNewsletter monthly.
National Shipyard Association Members: 44 companies1600 Wilson Blvd. Staff: 6Arlington, VA 22209Phone: (703) 351-6734Fax: (703) 351-6736
The National Shipyard Association (NSA) is a national trade association representingthe commercial shipbuilding, repair, and cleaning industry. NSA represents 44shipyard companies that own and operate over 90 shipyards in 17 states along theGulf, Pacific, and Atlantic coasts of the U.S. NSA also has among its membership 16companies that supply services and products to the shipbuilding and repair industry.NSA aims to promote high standards of health, safety, and environmental awarenessthroughout the industry. NSA publishes a monthly newsletter, NSA Newsline.
Shipyard Association for Members: 67Environmental Responsibility Staff: 5Post Office Box 250 Contact: Scott TheriotLockport, LA 70374Phone: (504)-532-7272 Fax: (202)-532-7295
The Shipyard Association for Environmental Responsibility (SAFER) was formed by67 shipbuilding and repair facilities in the states of Alabama, Louisiana, Mississippi,and Texas. The goal of SAFER is to work cooperatively with the federal and state

Shipbuilding and Repair Activities and Initiatives
Sector Notebook Project November 1997121
agencies to ensure that environmental standards truly reflect the environmentalconcerns of the vastly different sizes and capabilities of the Gulf Coast shipyards.
Shipbuilders Council of America Members: 10901 No. Washington St. Suite 204 Staff: 10Arlington, VA 22314 Contact: Penny EastmanPhone: (703) 548-7447
The Shipbuilders Council of America (SCA) was founded in 1921 and is made up ofcompanies engaged in the construction and repair of vessels and other marine craft;manufacturers of all types of propelling machinery, boilers, marine auxiliaries, marineequipment and supplies; and drydock operators. SCA promotes and maintains soundprivate shipbuilding and ship repairing industries and adequate mobilization potentialof shipbuilding and repairing facilities, organizations, and skilled personnel in timesof national emergencies. A newsletter, Shipyard Chronicle, is published weekly.

Shipbuilding and Repair Activities and Initiatives
Sector Notebook Project November 1997122
Page 122 intentionally left blank.
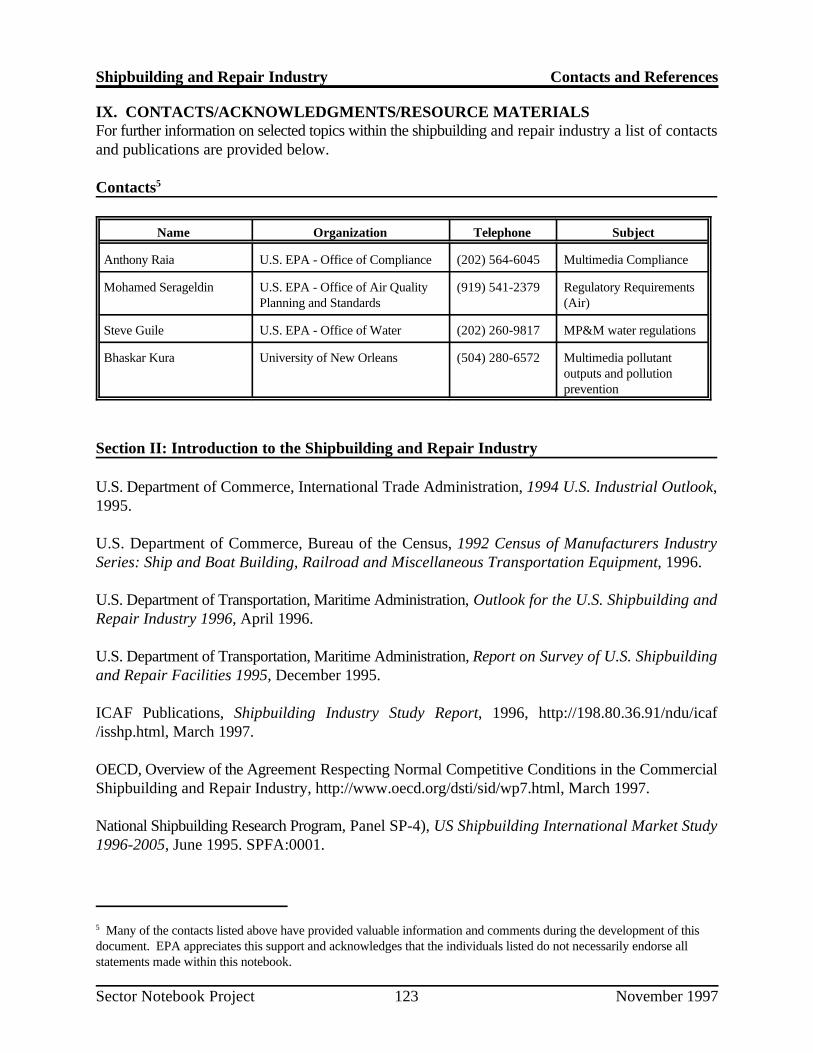
Shipbuilding and Repair Industry Contacts and References
Many of the contacts listed above have provided valuable information and comments during the development of this5
document. EPA appreciates this support and acknowledges that the individuals listed do not necessarily endorse allstatements made within this notebook.
Sector Notebook Project November 1997123
IX. CONTACTS/ACKNOWLEDGMENTS/RESOURCE MATERIALSFor further information on selected topics within the shipbuilding and repair industry a list of contactsand publications are provided below.
Contacts5
Name Organization Telephone Subject
Anthony Raia U.S. EPA - Office of Compliance (202) 564-6045 Multimedia Compliance
Mohamed Serageldin U.S. EPA - Office of Air Quality (919) 541-2379 Regulatory RequirementsPlanning and Standards (Air)
Steve Guile U.S. EPA - Office of Water (202) 260-9817 MP&M water regulations
Bhaskar Kura University of New Orleans (504) 280-6572 Multimedia pollutantoutputs and pollutionprevention
Section II: Introduction to the Shipbuilding and Repair Industry
U.S. Department of Commerce, International Trade Administration, 1994 U.S. Industrial Outlook,1995.
U.S. Department of Commerce, Bureau of the Census, 1992 Census of Manufacturers IndustrySeries: Ship and Boat Building, Railroad and Miscellaneous Transportation Equipment, 1996.
U.S. Department of Transportation, Maritime Administration, Outlook for the U.S. Shipbuilding andRepair Industry 1996, April 1996.
U.S. Department of Transportation, Maritime Administration, Report on Survey of U.S. Shipbuildingand Repair Facilities 1995, December 1995.
ICAF Publications, Shipbuilding Industry Study Report, 1996, http://198.80.36.91/ndu/icaf/isshp.html, March 1997.
OECD, Overview of the Agreement Respecting Normal Competitive Conditions in the CommercialShipbuilding and Repair Industry, http://www.oecd.org/dsti/sid/wp7.html, March 1997.
National Shipbuilding Research Program, Panel SP-4), US Shipbuilding International Market Study1996-2005, June 1995. SPFA:0001.

Shipbuilding and Repair Industry Contacts and References
Sector Notebook Project November 1997124
Section III: Industrial Process Description
Kura, Bhaskur (University of New Orleans) and Lacoste, Steve (Avondale Industries, Avondale, LA),Typical Waste Streams in a Shipbuilding Facility, 1996.
Storch, R.L., Hammon, C.P., Bunch, H.M., & Moore, R.C., Ship Production, 2nd ed., The Societyof Naval Architects and Marine Engineers, Jersey City, New Jersey, 1995.
Thornton, James R., Ship and Boat Building and Repair, ILO Encyclopaedia of OccupationalHealth and Safety 4th ed., International Labour Office, Geneva, Switzerland, 1996.
Development Document for the Proposed Effluent Limitations Guidelines and Standards for theMetal Products and Machinery Phase 1 Point Source Category, 1995, U.S. EPA, Office of Water,(EPA-821-R-95-021).
Water Environment Federation, Pretreatment of Industrial Wastes, Manual of Practice No. FD-3,Alexandria, Virginia, 1994.
National Shipbuilding Research Program, Hazardous Waste Minimization Guide for Shipyards, U.S.Navy and National Steel and Shipbuilding Company (NASSCO), January 1994.
National Shipbuilding Research Program, Introduction to Production Processes and Facilities in theSteel Shipbuilding and Repair Industry, U.S. Navy and National Steel and Shipbuilding Company(NASSCO), February 1993.
Levy, Doug, Boat Paint Tied to Dolphin Deaths, USA Today, December 31, 1996.
Section IV: Chemical Release and Transfer Profile
1994 Toxics Release Inventory Public Data Release, U.S. EPA Office of Pollution Prevention andToxics, June 1996. (EPA 745-R-96-002)
Section V: Pollution Prevention Opportunities
National Shipbuilding Research Program, Hazardous Waste Minimization Guide for Shipyards, U.S.Navy and National Steel and Shipbuilding Company (NASSCO), January 1994.
Guides to Pollution Prevention, The Marine Maintenance and Repair Industry, U.S. EPA, Officeof Research and Development, Cincinnati, OH, October 1991. (EPA/625/7-91/015)
Development Document for the Proposed Effluent Limitations Guidelines and Standards for theMetal Products and Machinery Phase 1 Point Source Category, 1995, U.S. EPA, Office of Water,(EPA-821-R-95-021).

Shipbuilding and Repair Industry Contacts and References
Sector Notebook Project November 1997125
Natan, Thomas E., Jr., Examples of Successful Pollution Prevention Programs, from IndustrialPollution Prevention Handbook, ed. Freeman, Harry M., McGraw-Hill, Inc., New York, 1995. pp.142-144.
Identification of Pollution for Possible Inclusion in Enforcement Agreements Using SupplementalEnvironmental Projects (SEPs) and Injunctive Relief, Final Report, March 1997. U.S. EPA, Officeof Enforcement and Compliance Assurance, (EPA-300-R-97-001).
Section VI: Summary of Applicable Federal Statutes and Regulations
Personal Correspondence with Mohamed Serageldin, U.S. EPA, Office of Air Quality Planning andStandards, Research Triangle Park, North Carolina, March 1997.
Personal Correspondence with Steve Guile, U.S. EPA, Office of Water, Engineering and AnalysisDivision, Washington, DC, April 1997.
Section VIII: Compliance Activities and Initiatives
National Shipbuilding Research Program, SNAME Panel SP-1 Newsletter, Volume 1, Number 1,Summer 1996.
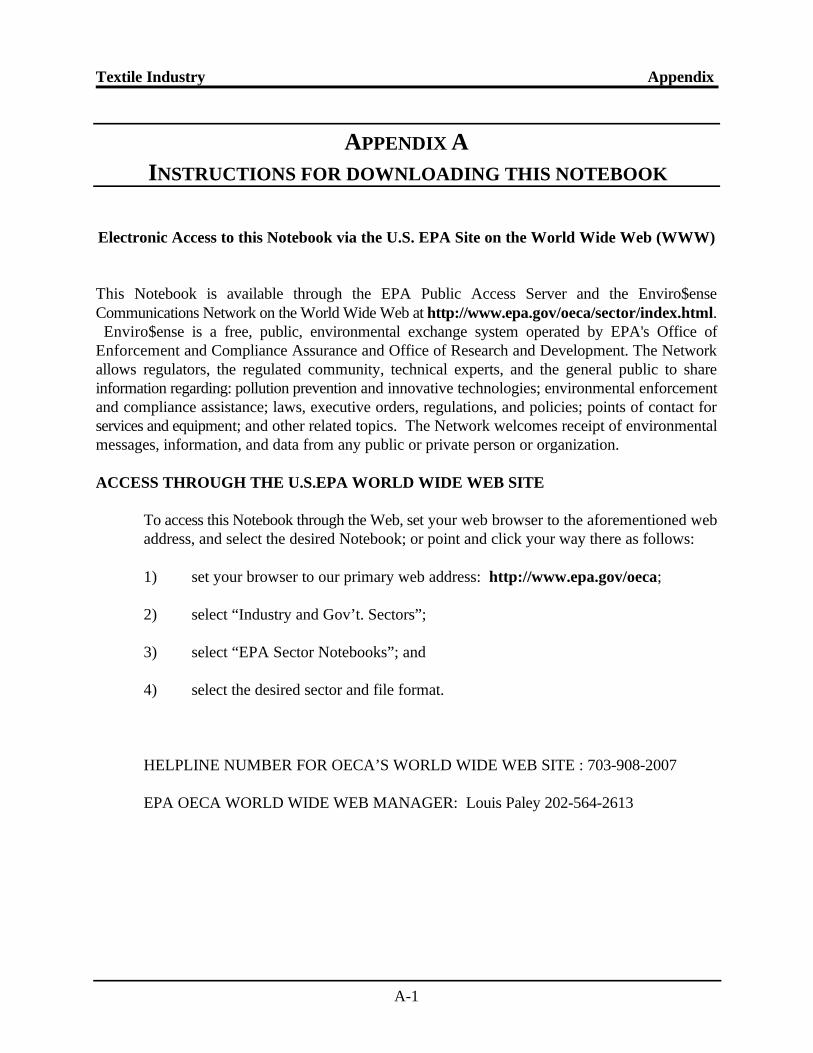
Textile Industry Appendix
A-1
APPENDIX AINSTRUCTIONS FOR DOWNLOADING THIS NOTEBOOK
Electronic Access to this Notebook via the U.S. EPA Site on the World Wide Web (WWW)
This Notebook is available through the EPA Public Access Server and the Enviro$enseCommunications Network on the World Wide Web at http://www.epa.gov/oeca/sector/index.html. Enviro$ense is a free, public, environmental exchange system operated by EPA's Office ofEnforcement and Compliance Assurance and Office of Research and Development. The Networkallows regulators, the regulated community, technical experts, and the general public to shareinformation regarding: pollution prevention and innovative technologies; environmental enforcementand compliance assistance; laws, executive orders, regulations, and policies; points of contact forservices and equipment; and other related topics. The Network welcomes receipt of environmentalmessages, information, and data from any public or private person or organization.
ACCESS THROUGH THE U.S.EPA WORLD WIDE WEB SITE
To access this Notebook through the Web, set your web browser to the aforementioned webaddress, and select the desired Notebook; or point and click your way there as follows:
1) set your browser to our primary web address: http://www.epa.gov/oeca;
2) select “Industry and Gov’t. Sectors”;
3) select “EPA Sector Notebooks”; and
4) select the desired sector and file format.
HELPLINE NUMBER FOR OECA’S WORLD WIDE WEB SITE : 703-908-2007
EPA OECA WORLD WIDE WEB MANAGER: Louis Paley 202-564-2613