epidemiological analysis of the maine prescription monitoring
TRANSCRIPT
Epidemiological Analysis of the Maine Prescription Monitoring Program (PMP) Data
Final Report September 30, 2009
Authors Susan Payne, PhD, MPH Deborah Thayer, MBA

Acknowledgements
We would like to thank Daniel Eccher, MPH, the Prescription Monitoring Program Coordinator, for his valuable suggestions and comments and for facilitating initiation and completion of the project and the PMP Advisory Group for insightful comments on an earlier draft of the report. We are grateful for the capable assistance of Christopher Riccardo and Karen Pearson of the Cutler Institute, Muskie School of Public Service, in preparing the report. This project was supported by Grant No. 2006-PM-BX-0014 awarded by the Bureau of Justice Assistance. The Bureau of Justice Assistance is a component of the Office of Justice Programs, which also includes the Bureau of Justice Statistics, the National Institute of Justice, the Office of Juvenile Justice and Delinquency Prevention, and the Office for Victims of Crime. Points of view or opinions in this document are those of the authors and do not represent the official position or policies of the U. S. Department of Justice. The project also received support from the Muskie School of Public Service. The opinions do not reflect the position, policies, or opinions of the Muskie School, the Maine Department of Health and Human Services, or the Office of Substance Abuse.

Table of Contents
Executive Summary i Introduction 1 Data and methods 2 Results 4 The patient
Age Residence Number of prescribers and pharmacies
The prescription
Drug category DEA Class Payer
Summary, comments, strengths and limitations, 7 and recommendations References 11 Figures and Tables 15

Epidemiological Analysis of the Maine Prescription Monitoring Program (PMP) Data
Executive Summary
Introduction Drugs that pose a risk of addiction, dependency, and health or psychological risk and are abused are controlled by the US Drug Enforcement Agency (DEA). Many controlled substances are commonly used prescription medications, including pain relievers, tranquilizers, sedatives, and stimulants. The Maine Prescription Monitoring Program (PMP) was developed to provide information to the Maine Office of Substance Abuse (OSA) for surveillance and identifying individuals who may be misusing or overusing prescription drugs. OSA makes the PMP data available to other State agencies to gather evidence for investigations of potentially inappropriate prescribing. Health care providers and pharmacists can access the PMP database for information on the PMP medications used by their patients and customers. The Maine PMP is one of over 30 state-based PMPs in the United States. Goal The goal of this project is to support OSA’s policy development, strategic planning, and public health initiatives. The aims are to measure trends over time in the use of prescription drugs tracked by the PMP and to identify potential problem areas for monitoring or intervention. The focus is on changes in use rates over time by patient characteristics and by category of drug. Data and methods This is a retrospective, observational study using existing data. The study population is individuals living in Maine who filled a prescription for one of the study medications during state fiscal years 2005 through 2008 and whose age is included in the PMP database. The PMP collects information from all pharmacies for all prescriptions for Maine residents for DEA Schedule II through Schedule IV drugs, which include pain relievers, tranquilizers, sedatives, stimulants, hormone replacements, and miscellaneous other drugs. We also used Maine population counts and estimates from the US Census. We analyzed trends by the demographic characteristics (age, urban/rural area of residence, and payer) of the persons for whom the prescriptions were written (the patients) by medication category and by DEA schedule. We also examined changes in the number of prescribers and pharmacies used per patient, which are measures of potential “doctor shopping.” Results The number of patients with prescriptions for the study drugs increased by 11.0% from 2005 to 2008. In contrast, the estimated Maine population only increased by 0.4%
i

during this period. The number of prescriptions increased by 24.4% during this period and the number of prescriptions per patient increased by 12.1%. In 2008, over 2.3 million prescriptions were written for the study medications; 547,636 individuals (41.6% of the estimated Maine population) received prescriptions for these medications. Age: Patients age 45-64 were the single age group with the most patients (35.0% of the total). They represented 30.2% of the estimated state population in 2008. This age group also had the most prescriptions (39.1% of the total) and the highest number of prescriptions per patient (4.7) in 2008. Children (patients age 0 – 17) were 6.5% of the total patients and 10.7% of the estimated state population in 2008. They received 6.1% of the total prescriptions. Children had the greatest growth in the number of prescriptions per patient of any age group (an increase of 16.5%) in 2008. Rural/urban area: The urban core and small town/rural areas each had about 33% of the prescriptions and the patients in the study years. Suburban areas had the smallest percentage of prescriptions and patients (15.2% and 16.4%, respectively, in 2008), but they experienced the greatest growth in these measures, with increases of 27.4% in the number of prescriptions and 14.7% in the number of patients. Small town/rural areas had the highest number of prescriptions per patient in each year (4.4 in 2008, compared to 4.2 for all areas). Prescriber and pharmacy: The average number of prescribers was 1.5 in 2008 and the average number of pharmacies was about 1.0 (ranging from 1.05 to 1.01) during the study period, indicating that most patients used a single prescriber and pharmacy. However, in 2008, 5 individuals each used over 19 prescribers and 5 individuals each used over 10 pharmacies. The average numbers of prescribers and pharmacies changed very little during the study period, but there is some evidence of a drop in the numbers among those at the extreme high end of each measure. Drug category: Pain relievers were the most frequently prescribed category by far in 2008, with 52.1% of the prescriptions and 67.0% of the patients. Tranquilizers were second, with 25.7% of the prescriptions and 30.1% of the patients. There are distinct differences in the drug categories used by age group. The drugs most commonly used by children in 2008 were stimulants (82.3% of their prescriptions), which are often used to treat attention deficit disorder and hyperactivity. The drugs most commonly used by adults were pain relievers, which were over half the prescriptions for each adult age group. Stimulants were the fastest growing drug category for each age group. DEA Schedule: The largest percentage of prescriptions filled in 2008 was for Class IV drugs, which are considered to have the least potential for abuse; the largest percentage of patients used Class III drugs. However, Class II drugs, which are considered to have the highest potential for abuse, had the greatest rate of increase for
ii

each age group in the numbers of prescriptions (up by 34.0%) and patients (up by 34.4%). Most of the Class II drugs prescribed in 2008 were pain relievers (67.6%). The fastest growing Class II drugs were sedatives (up by 80.0%) and stimulants (up by 44.6%), both of which started from a small base. Payer: In 2008, 56.6% of the prescriptions were paid for by commercial pharmacy benefit managers (PBMs). The second most frequently used payment source was Medicaid (17.4%). Major medical and cash were each the source of payment for about 10% of the prescriptions. From 2005 to 2008, there was a dramatic increase in the percentage of prescriptions paid for by Medicare (up by 182.8%) (although from a very small base, only 4.3% of the prescriptions) and by PBMs (up by 86.7%). The number of prescriptions covered by Maine Medicaid (MaineCare) dropped by 13.6%, and the number of prescriptions paid for with cash increased by 18.2%. The shifts in payment had the biggest impact on the elderly, who experienced the largest increases of any of the age groups between 2005 and 2008 in coverage by PBMs (up by 103.8%) and by cash (up by 38.2%), and the largest decrease for MaineCare (down by 65.4%). Most of the changes in payer occurred between 2005 and 2007. Summary and comments In 2008, over 2.3 million prescriptions were written for the study medications and 42% of the estimated Maine population received prescriptions for these medications. The number of patients with prescriptions for the study drugs increased by 11.0% during the study period, while the estimated state population was static. The number of prescriptions increased by 24.4% during this period and the number of prescriptions per patient increased by 12.1%. Maine is not unique in these trends. Nationally, from 2004 to 2007, the use of narcotic pain relievers increased by 18.2%, use of sedatives increased by 16.7%, and use of anti-anxiety drugs increased by 12.5%. Several of the results deserve comment: The growth in the number of prescriptions per patient: This may indicate a potential problem if it is due to the use of more different drugs by patients, which can make medical monitoring more complex, or due to more “doctor shopping” or “pharmacy hopping” to avoid monitoring or limits on the PMP drugs. Or, it may indicate improved monitoring by prescribers, who sometimes write prescriptions for shorter periods of time to allow for more frequent contact with the patients to manage their care. The decrease in the numbers of prescribers and pharmacies used by patients with the highest numbers for these measures: This trend suggests that the PMP may have had an effect on these measures. However, the continuing high number of prescribers and pharmacies used by individual patients points to potential problems. Further study is needed to distinguish between patients who use multiple prescribers to
iii
get more access to controlled substances, which may indicate a potential for abuse, and patients who are getting coordinated care from multiple prescribers, which may not be a sign of a potential problem. The rapid growth in the Schedule II drugs, which have the highest potential for dependency and risk: Schedule II drugs had the largest increase for each age group in the number of prescriptions, patients, and prescriptions per patient. Use of pain relievers and stimulants warrants attention. The shifts in payer among the elderly from Medicaid to PBMs and Medicare: Many of the shifts in payer are no doubt due to the advent of the Medicare Part D prescription drug benefit in January, 2006, which added drug coverage for many Medicare beneficiaries previously without such coverage and shifted medication coverage for dual eligibles from Medicaid to Medicare private prescription drug plans (Pharmacy Benefit Managers or PBMs). Part D may also account for the drop in the percent of prescriptions covered by MaineCare after 2006/2007. The increasing reliance on cash payments by the elderly: Possible reasons for this include lingering financial gaps in coverage under the Medicare Part D prescription drug benefit (the “doughnut hole”) and the continued use by Part D enrollees of medications such as benzodiazepines, which are not covered by Part D for enrollees eligible for Medicare only. Strengths and limitations The PMP database is noteworthy because it includes prescriptions for many drugs that are commonly used and that are important in terms of abuse potential and patient safety. It includes data from all payers, which is especially important for tracking Medicare Part D use and cash payments. The data are timely and allow for tracking trends over time. The study is limited in that it was conducted in one state. Maine’s population is older, less diverse racially and more rural, and has lower per capita income and higher per capita health care expenditures than the national average. While the PMP data have some limitations, their timeliness and availability compensate for these limitations. The accuracy of the data is sufficient for drawing conclusions about population groups and subgroups. While this study was conducted in a single state, over 30 other states have PMPs, and we expect that the methods used and the issues noted will be relevant in other states Recommendations Because of the strengths of the PMP database, it offers good potential for studying quality of care and prescribing appropriateness, for targeting outreach and quality improvement programs for prescribers and pharmacists, and for providing input to the state’s new academic detailing initiative, the Maine Independent Clinical Information Service. The results suggest several issues for monitoring, interventions, public awareness campaigns, and further study:
iv
v
• Study the use of the PMP medications by specific age groups, such as children, adults age 45-64, and the elderly and by patients with high numbers of medications or medications that duplicate each other or may cause drug-drug interactions (e.g., sleeping medications and narcotics); distinguish among patients with high numbers of prescriptions because of short refill periods or because of using many different medications; and study the factors associated with the use of cash payments, especially by the elderly.
• Study the use of specific drugs; the appropriateness of the use of opiates and other pain relievers, which are subject to both over-use and under-use; the use by children of stimulants, which have been found to be both under- and over-used; the increasing and long-term use by young adults of stimulants as “brain steroids”; and the use by the elderly of long-acting benzodiazepines, which are contra-indicated for them based on efficacy or safety.
• Improve the usefulness of the PMP data base by modifying the study ID to allow
for tracking by individual over time; including information on the secondary payer; and improving the accuracy of information on the drug category and the schedule.
Introduction The growing problem of prescription drug misuse: Prescription drugs can dramatically improve health and well being -- curing disease, managing long-term health problems, and easing pain. However, some prescription drugs, even when used correctly, can increase the risk of side effects, injury, and dependency (Kohn et al., 2000). Drugs that pose a risk of addiction, dependency, and health or psychological risk and that are abused are controlled by the US Drug Enforcement Administration (DEA) (US DEA, 2005 and 2008, April). Many commonly used prescription medications are controlled substances, including pain relievers, tranquilizers, sedatives, stimulants, and some hormone replacements. Through the popular press, problems with the theft or illegal distribution of controlled substances to get “high” or enhance athletic performance are well known. However, the significant and growing national problem in the misuse of legally prescribed controlled substances is less familiar (Manchikanti, 2007). Prescription drug misuse can occur when a patient is prescribed the wrong drug for his or her condition, a drug that interacts with another drug, or a drug that is ineffective. Overuse can occur if the patient takes too much of a drug or takes it for too long (Kohn et al., 2000). Prescription drug misuse and overuse are major public health problems in Maine. The number of drug-related deaths increased in Maine from 34 in 1997 to 154 in 2007 (Sorg, 2008). The proportion of drug-related deaths in which pharmaceuticals were the cause or a contributor increased from 78% in 2001 to 94% in 2003 (Eccher, 2008). Treatment admissions for the primary drug of “other opiates and synthetics” increased from 1,148 in 2003 to 3,656 in 2008; and in 2008, 39% of Maine Drug Enforcement Agency arrests were related to pharmaceutical drugs, up from 26% in 2006 (Maine DHHS, 2009a). This growth is expected to continue due to the aging of the baby boomers and the projected increase in first-time users (Manchikanti, 2007). The Maine Prescription Monitoring Program (PMP): The Maine PMP collects information for prescriptions dispensed to Maine residents by commercial pharmacies and legally purchased from mail order and internet sources for US DEA Schedule II through Schedule IV drugs. These include pain relievers, tranquilizers, sedatives, stimulants, hormone replacements, and miscellaneous other drugs. Figure 1 lists drugs by category (type of drug) and DEA Class or Schedule. (The figures and tables are after the list of references.) The drugs in DEA schedules II – IV have accepted medical uses in treatment. They are divided into schedules based on their potential for abuse and for psychological or physical dependence if abused. Class II drugs have high abuse potential and potential for severe psychological or physical dependence if abused, Class III drugs have relatively less abuse potential with a moderate or low potential for dependence relative to Class II drugs, and Class IV drugs have the least abuse potential (US DEA, 2005).
1

The Maine PMP is maintained by the Maine Office of Substance Abuse (OSA) and supported through state and federal (Department of Justice) funding (Maine DHHS, 2009b). Legislation creating the Maine PMP was passed in 2003 and data collection began in July, 2004. The aims of the Maine PMP are to improve patient care by giving health care providers comprehensive information, curb misuse of prescription drugs, get individuals who are addicted into appropriate substance abuse treatment, help prevent prescription drug overdoses, ensure that individuals who do need prescription medications continue to receive them, educate the public on the dangers of prescription drug abuse, and inform public policy surrounding prescription drug regulation (Maine DHHS, 2009b). OSA uses the PMP data for surveillance and identifying individuals who may be receiving dangerous levels of prescription drugs or “doctor shopping.” OSA makes the PMP data available to other State agencies to gather evidence of potentially inappropriate prescribing. Health care providers and pharmacists can access the PMP database, after completing appropriate registration processes to protect confidentiality, for information on the PMP medications used by their patients and customers. The data are available, by subpoena, to the Attorney General’s office regarding a given suspect. OSA staff has worked to raise the visibility of the PMP data and increase its use by prescribers through a website (http://www.mainepmp.org), presentations, and commissioning applied research projects. As of September 2, 2009, 1,375 (31%) of the approximately 4,400 active prescribers in Maine had registered to request data through the PMP (Maine DHHS, 2009b). (It is important to note that, although less than one-third of prescribers currently access the PMP, the database includes information on all Schedule II – IV prescriptions dispensed by commercial pharmacies or legally purchased from mail order and internet pharmacies.) Over 30 other states have legislation or regulations to establish PMPs (US DOJ, 2008, November). It is similar to PMPs in many of the other states in the drugs it includes; 27 other PMPs include Schedule II - IV drugs. (Four states cover either Schedule II or Schedule II and III drugs only.) Goal and aims: The goal of the project reported on here is to support OSA policy development, strategic planning, and public health initiatives. The aims are to measure trends over time in the use of prescription drugs tracked by the PMP and to identify potential problem areas for monitoring or intervention. The focus is on changes in use rates over time by patient characteristic and by category of drug. Data and methods Study design: This is a retrospective, observational study using existing data.
2

Study population: The study population is Maine residents who filled a prescription for one of the medications included in DEA Schedules II through IV and whose age is in the Maine PMP database. Units of analysis: Prescriptions, patients, prescriptions per patient, and prescriptions per capita (for counties and public health districts). Goold Health Systems (GHS), the OSA data contractor, uses personal identifiers to link records at the individual level during a fiscal year. It creates a study ID number for use by researchers and others, which allow the user to study person-level data in the PMP database but not to identify individuals. The counts of patients indicate the number of unique individuals in each year that had at least one prescription filled for one of the study drugs. An individual can be counted in more than one year. The counts of the average number of prescriptions per patient can include refills for a single medication or different medications, or both. Study years: State fiscal years 2005 through 2008 Data: We used information from the Maine OSA PMP database, which is described above. Use of the data for the project is governed by a Data Use Agreement between USM and OSA. The project was approved by the USM Institutional Review Board for protection of human subjects and by the University of Maine System HIPAA officer for protection of privacy. The variables in the Maine PMP database are listed in Figure 2. The variables we studied are in bold face type. We used US Census counts for 2000 and annual population estimates for 2005 through 2008 by age group to estimate the impact on the number of patients due to changes in population during the study period (US Census Bureau, 2009). Preparation of the data: We excluded people whose state of residence was not Maine and whose age was not included in the database. We cleaned and edited the data and resolved questions about possible miscoding or data entry errors through discussions with staff from OSA and GHS. Drug category: GHS classifies drugs as pain relievers, stimulants, tranquilizers, and other based on the National Drug Codes (NDCs) in the claims. We divided the PMP tranquilizer category to separate tranquilizers and sedatives, to conform to categories in the report “Guidance for Harold Rogers Prescriptions Drug Monitoring Program (PDMP) Grantees on Responding to Performance Measures” (USDOJ, Bureau of Justice Assistance, 2008). In each year, about 42,000 claims (about 2% of the total number of prescriptions in the PMP data) had NDCs that did not match the GHS list and so were not classified into a drug category. We reviewed the name of each drug with missing drug category against
3

published references (US DEA, 2005; Wolfe et al., 2005; Silverman, 2008). Several thousand of these prescriptions were for hormone replacements (e.g., depo-testosterone and androgel), and this group of drugs was one of the fastest growing in Maine. We therefore created a separate category, “hormone replacements.” We also merged information on drugs that were chemically the same but had different names in the PMP database to create a more accurate count by category of drug and class. Patient’s residence: Based on the patient’s zip code of residence, we classified the prescriptions by Rural-Urban Commuting Area (RUCA) category, county, and public health district. If the person had more than one zip code during a calendar year, the most recent (latest) code was used. We used four RUCA categories: urban core, suburban, large town, small town and rural (WWAMI Rural Health Research Center, 2006), the16 Maine counties, and the 8 public health districts. Payer: Each prescription has one source of payment in the PMP database, but an individual patient can have health insurance coverage from more than one payer (such as those who are dually eligible for Medicaid and Medicare or those who change coverage during a year). Because of this, we calculated information at the prescription level but not at the individual patient level. Analysis: We calculated descriptive statistics to show changes over time and by age group, geographic region, drug categories, DEA class, and payer. Results The patient In 2008, 2,311,323 prescriptions were written for the study medications and 547,636 individuals received prescriptions for the study medications (Table 1). This represents 41.6% of the estimated Maine population of 1,316,456 in 2008 (Table 2). Patients had an average of 4.2 prescriptions each in 2008. The number of prescriptions for the study drugs increased by 24.4% from 2005 to 2008, the number of patients increased by 11.0%, and the number of prescriptions per patient increased by 12.1%. As a point of comparison, the estimated Maine population only increased by 0.4% from 2005 to 2008. Age: Almost all (88.7%) of the prescriptions were written for patients aged 25 and older in 2008 (Table 1). This age group represented 70.5% of the estimated population in 2008. Patients age 45-64 were the single age group with the most prescriptions (39.1% of the total), the most patients (35.0%), and the highest number of prescriptions per patient in
4
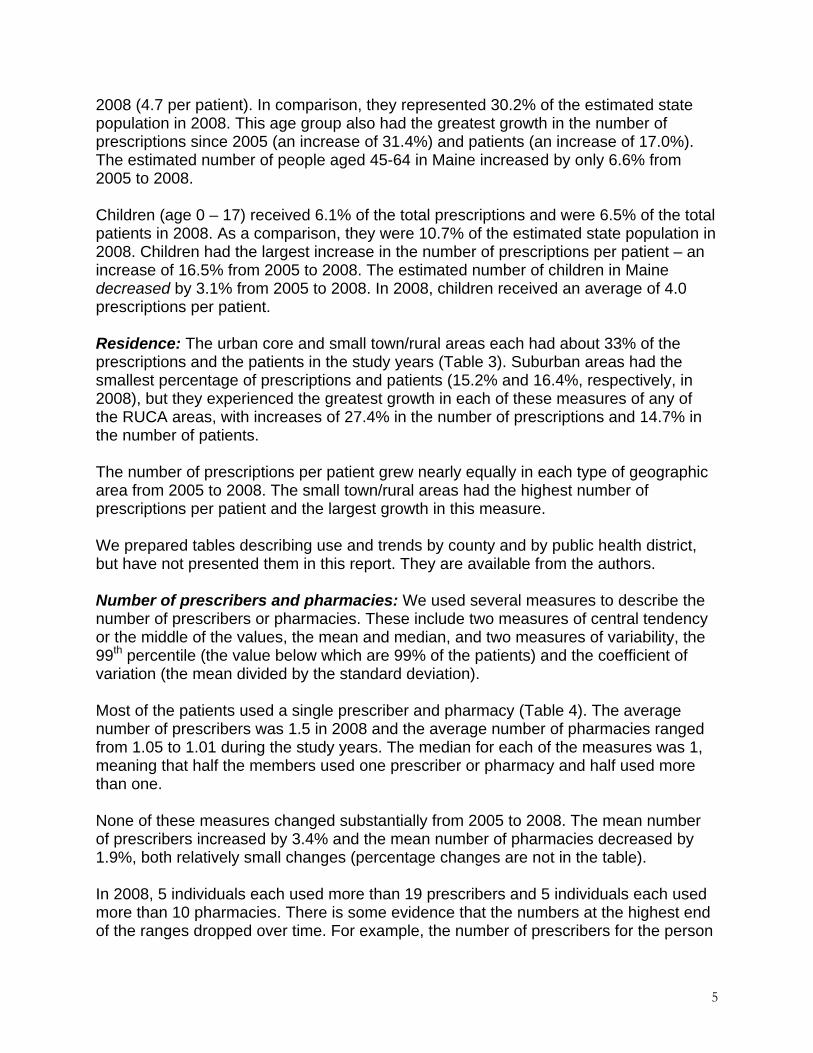
2008 (4.7 per patient). In comparison, they represented 30.2% of the estimated state population in 2008. This age group also had the greatest growth in the number of prescriptions since 2005 (an increase of 31.4%) and patients (an increase of 17.0%). The estimated number of people aged 45-64 in Maine increased by only 6.6% from 2005 to 2008. Children (age 0 – 17) received 6.1% of the total prescriptions and were 6.5% of the total patients in 2008. As a comparison, they were 10.7% of the estimated state population in 2008. Children had the largest increase in the number of prescriptions per patient – an increase of 16.5% from 2005 to 2008. The estimated number of children in Maine decreased by 3.1% from 2005 to 2008. In 2008, children received an average of 4.0 prescriptions per patient. Residence: The urban core and small town/rural areas each had about 33% of the prescriptions and the patients in the study years (Table 3). Suburban areas had the smallest percentage of prescriptions and patients (15.2% and 16.4%, respectively, in 2008), but they experienced the greatest growth in each of these measures of any of the RUCA areas, with increases of 27.4% in the number of prescriptions and 14.7% in the number of patients. The number of prescriptions per patient grew nearly equally in each type of geographic area from 2005 to 2008. The small town/rural areas had the highest number of prescriptions per patient and the largest growth in this measure. We prepared tables describing use and trends by county and by public health district, but have not presented them in this report. They are available from the authors. Number of prescribers and pharmacies: We used several measures to describe the number of prescribers or pharmacies. These include two measures of central tendency or the middle of the values, the mean and median, and two measures of variability, the 99th percentile (the value below which are 99% of the patients) and the coefficient of variation (the mean divided by the standard deviation). Most of the patients used a single prescriber and pharmacy (Table 4). The average number of prescribers was 1.5 in 2008 and the average number of pharmacies ranged from 1.05 to 1.01 during the study years. The median for each of the measures was 1, meaning that half the members used one prescriber or pharmacy and half used more than one. None of these measures changed substantially from 2005 to 2008. The mean number of prescribers increased by 3.4% and the mean number of pharmacies decreased by 1.9%, both relatively small changes (percentage changes are not in the table). In 2008, 5 individuals each used more than 19 prescribers and 5 individuals each used more than 10 pharmacies. There is some evidence that the numbers at the highest end of the ranges dropped over time. For example, the number of prescribers for the person
5

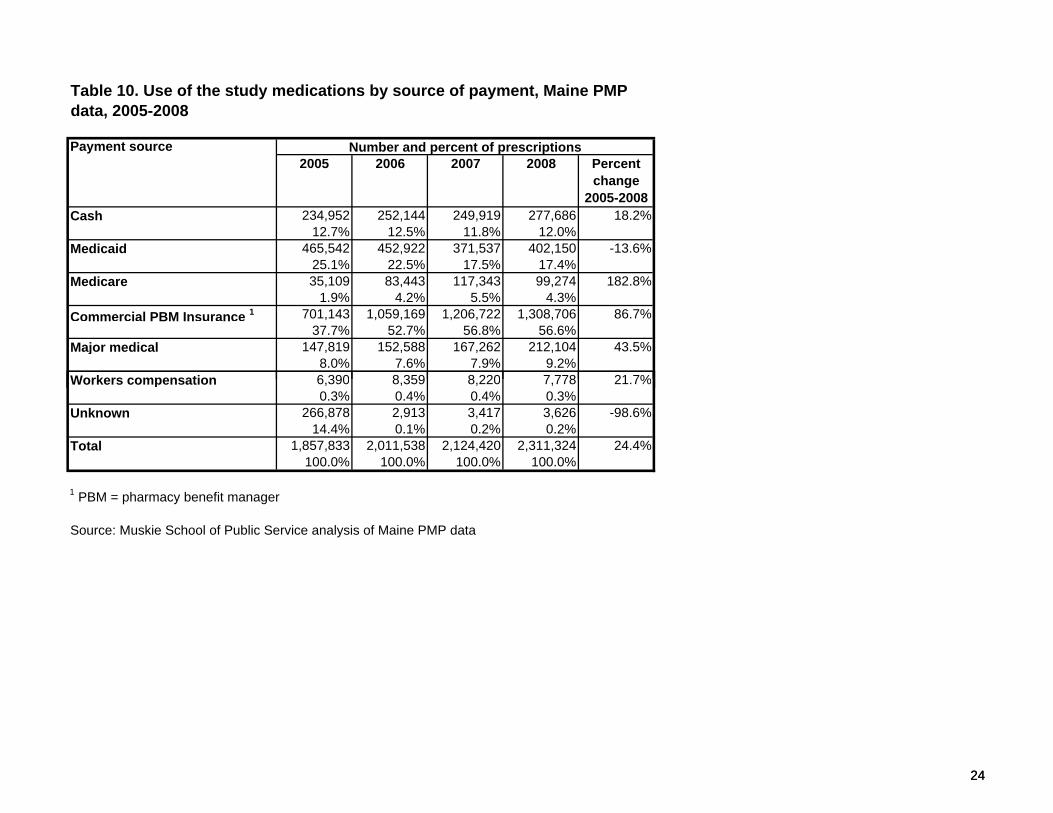
with the fifth highest number of prescribers dropped from 37 in 2005 to 20 in 2008. The comparable number for pharmacies dropped from 19 in 2005 to 11 in 2008. The prescription Drug category: Pain relievers were the most frequently prescribed category by far in 2008, accounting for 52.1% of the prescriptions and 67.0% of the patients (Table 5). Tranquilizers were second, accounting for 25.7% of the prescriptions and 30.1% of the patients. Use of these two categories increased by about 20% during the study period. Although less commonly prescribed, and starting from a small base, the number of prescriptions and patients for sedatives, hormone replacements, and stimulants grew the most during the study period. There was a wide range in the number of prescriptions per patient among the drug categories, from a low of 2.9 for hormone replacements to a high of 4.8 for stimulants. There are distinct differences in the drug categories used by age group (Table 6). The most commonly used drugs by children in 2008 were stimulants (82.3% of their prescriptions), which are often used to treat attention deficit disorder and hyperactivity in children (Angold et al., 2000; Zuvekas et al., 2006). The most commonly used drug for adults was pain relievers, which accounted for over half the prescriptions for each adult age group. Stimulants were the fastest growing drug category for each age group up to 44 (up by from 20.3% to 92.1% for the different age groups). For patients 45 and older, the use of stimulants also increased rapidly, but from very small baseline levels. DEA class: The largest percentage of prescriptions filled in 2008 was for Class IV drugs, which are considered by DEA to have the least potential for abuse (Table 7). The largest percentage of patients used Class III drugs. However, Class II drugs, which are considered to have the highest potential for abuse, had the greatest rate of increase in the number of prescriptions, the number of patients, and the number of prescriptions per patient. Because of their high potential for abuse and their fast growth, the rest of this discussion focuses on Class II drugs. Class II drugs had the greatest increase in the number of prescriptions and patients from 2005 to 2008 for each age group (Table 8). Most of the Class II drugs prescribed in 2008 were pain relievers (67.6%) (Table 9). The fastest growing Class II drugs were sedatives (up by 80.0%) and stimulants (up by 44.6%), both of which started from a small base. Payer: In 2008, over half (56.6%) of the prescriptions were paid for by commercial pharmacy benefit managers (PBMs) (Table 10). The second most frequently used payment source was Medicaid (17.4%). Major medical and cash were each the source of payment for about 10% of the prescriptions.
6

For the variables described so far in this report, there were fairly steady levels over time and relatively small increases or decreases from year to year. This is not true for trends by payer, however. From 2005 to 2008, there was a dramatic increase in the percentage of prescriptions paid for by Medicare (an increase of 182.8%). The actual number of prescription covered by Medicare remained small, though, and even after this dramatic increase only 4.3% of the prescriptions in 2008 were paid for by Medicare. The second largest increase was for prescriptions covered by PBMs, which increased by 86.7% from 2005 to 2008. This increase was from a fairly large base -- 700,000 or 37.7% of the prescriptions in 2005 were covered by PBMs. Most of the increases in Medicare and PBM prescriptions occurred between 2005 and 2006. There was also an increase from 2005 to 2006 in the number of prescriptions paid for with cash. The percentage of PMP prescriptions covered by Maine Medicaid (MaineCare) dropped by 13.6% from 2005 to 2008, with the greatest drop occurring between 2006 and 2007. The shifts in payment had the biggest impact on the elderly (Table 11). They experienced the largest increase in coverage by Medicare and PBMs and by cash of any of the age groups between 2005 and 2008. There was also some shifting among people younger than 65, who were probably covered by Medicare due to being disabled. The Medicare Prescription Drug Benefit (Part D), introduced in 2006, is run by commercial PBMs in large part, which accounts for the jump in the number of prescriptions they covered from 2005 to 2006. Medications dispensed to elderly patients (65 and older) are paid for by five payer sources – prescription benefits manager (PBM), Medicare, major medical, Medicaid, and cash, which suggests the complexity in tracking the source of payment for older people. Summary, comments, strengths and limitations, and recommendations To summarize, in Maine over 2.3 million prescriptions were written for the study medications in 2008 and 42% of the estimated Maine population received prescriptions for these medications. The number of patients with prescriptions for the study drugs increased by 11.0% during the study period, while the estimated state population was static. The number of prescriptions increased by 24.4% during this period and the number of prescriptions per patient increased by 12.1%. Maine is not unique in these trends. Nationally, from 2004 to 2007, the use of narcotic pain relievers increased by 18.2%, use of sedatives increased by 16.7%, and use of anti-anxiety drugs increased by 12.5% (Rannazzisi, 2009; Manchikanti, 2007). Several results deserve comment:
7

The growth in the number of prescriptions per patient: This may indicate a potential problem if it is due to the use of more different drugs by patients, which can make medical monitoring more complex, or to more “doctor shopping” or “pharmacy hopping” to avoid monitoring or limits on the PMP drugs. Or, it may indicate improved monitoring by prescribers, who sometimes write prescriptions for shorter periods of time to allow for more frequent contact with the patients to manage their care. Further study of these possible reasons may be indicated. The decrease in the numbers of prescribers and pharmacies used by patients with the highest numbers for these measures: This trend suggests that the PMP may have had an effect on these measures. However, the continuing high number of prescribers and pharmacies used by many patients points to potential problems. At this time, it is not possible to know if patients with multiple prescribers are “doctor shopping” to get more access to controlled substances, which may indicate a potential for abuse, or if they are getting prescriptions from doctors with different DEA numbers who work in the same health care system or from a primary care doctor and several specialists, which may not be a sign of a problem. The rapid growth in the Schedule II drugs, which have the highest potential for dependency and risk: Schedule II drugs had the largest increase for each age group in the number of prescriptions, patients, and prescriptions per patient. Use of pain relievers and stimulants warrants attention. The shifts in payer among the elderly from Medicaid to PBMs and Medicare: Many of the shifts in payer are no doubt due to the advent of the Medicare Part D prescription drug benefit in January, 2006, which added drug coverage for many Medicare beneficiaries previously without such coverage and shifted medication coverage for dual eligibles from Medicaid to Medicare private prescription drug plans (Pharmacy Benefit Managers or PBMs). MaineCare continued to cover some dually eligible beneficiaries during the transition to Part D and provided supplemental coverage for low-income Medicare beneficiaries not eligible for MaineCare. These changes in coverage may account for the fact that the MaineCare coverage dropped more after 2007 than after 2006, when Part D was introduced. (Shifts in payer can also be caused by changes in the number of elderly and disabled in the population and by changes in the number with low incomes qualifying for MaineCare.) PBMs are required to monitor medications used by Part D enrollees for appropriateness, but the effectiveness of this monitoring is unknown (Spooner, 2007). The increasing reliance on cash payments by the elderly: Possible reasons for this include use of benzodiazepines, which are not covered by Part D for enrollees who are eligible for Medicare only, and lingering financial gaps in coverage under the Medicare Part D prescription drug benefit. Part D coverage ends when a beneficiary’s drug expenses for a calendar year reach a specified amount. Coverage begins again that year after the beneficiary has spent a given amount from his or her own funds (e. g, cash or “out of pocket”). During this gap in coverage (the so-called “doughnut hole”),
8

Medicare beneficiaries who are not also eligible for Medicaid must either have other coverage or pay for the drugs from their own funds. This study has several strengths. The PMP database is noteworthy because it includes prescriptions from all payers. This is especially important for tracking Medicare Part D use, due to the fact that CMS has not yet released Medicare Part D claims data. It also includes cash payments, which are not included in payer-based information such as the Maine All Payer Database. The PMP data includes information on three DEA schedules and drugs that are important in terms of abuse potential and patient safety. The PMP data are released within a two or three months after the end of the reporting period. This is in contrast with many payer-based databases, which do not release data until nine to 15 months after the end of the reporting period. The PMP database covers four years, allowing for tracking trends over time. This study enhanced the PMP data by improving the accuracy of counts by drug category and by class by combining drugs that were the same chemically but had different names, classifying patients by zip code of residence and prescriptions by payer, and conducting analyses to understand the possible factors underlying trends. The study also has limitations. The PMP data are limited in that gender is not included (it is included in the 2009 data, however), information is not available on the patient’s diagnosis or the reason for the prescription, and multiple prescribers can use the same DEA number. Information on the prescribers’ names or their practices is not included, so it is not possible to distinguish between “doctor shopping” and coordinated care (getting prescriptions from specialists with knowledge of primary care physician or getting prescriptions from multiple physicians in the same practice). We attempted to use the metric strength variable to track changes in the quantity prescribed, but did not pursue that because of missing information on many drugs of interest (notably those in combination with acetaminophen). We also attempted to replicate the analyses of milligrams prescribed per capita, as reported in the Automation of Reports and Consolidated Orders System (ARCOS) reports (US DOJ, 2008, July), but did not pursue that because of the difficulty of replicating the ARCOS definitions of the drugs reported to assure comparable results and the fact that the ARCOS reports do not update the population counts used in the denominators. The PMP database does not include drugs purchased illegally or from Canada. It is difficult to identify long-term care pharmacies. It is not possible to link information at the individual level from the PMP database to other databases, and so outcomes of care or health care costs associated with abuse/overuse cannot be tracked directly. At this time it is not possible to track individuals’ use from year to year, but future iterations of the PMP database may allow for this. The study was conducted in one state. Maine’s population is older, less diverse racially and more rural, and has lower per capita income and higher per capita health care expenditures than the US (Kaiser Family Foundation, 2007). While the substantive findings may not be applicable to other states, we expect that the methods used and the issues noted will be applicable to the PMPs in each state, especially in the 27 other states that track Schedules II – IV.
9

The timeliness and availability of the PMP data compensate for these limitations. The accuracy of the data is sufficient for drawing conclusions about population groups and subgroups but not for drawing conclusions about individual patients or prescribers, which is not the goal of the study. Because of the strengths of the PMP database, it offers good potential for studying quality of care and prescribing appropriateness, for targeting outreach and quality improvement programs for prescribers and pharmacists, and providing input for the state’s new academic detailing initiative, the Maine Independent Clinical Information Service (123rd Maine State Legislature, 2007). The addition of gender to the PMP database in 2009 will increase its usefulness for surveillance and research. Future refinements could include restructuring the study ID to allow for tracking by individual across fiscal years, making the source of payment category include information on the patient as well as the prescription (such as indicating primary and secondary payer), and linking information by NDC to increase the accuracy of counts by drug category and schedule. The results of this study point to issues for further monitoring, interventions, public awareness campaigns, and further study:
• Study the use of the PMP medications by specific age groups, such as children, adults age 45-64, and the elderly and by patients with high numbers of medications or medications that duplicate each other or may cause drug-drug interactions (e.g., sleeping medications and narcotics); distinguish among patients with high numbers of prescriptions because of short refill periods or because of using many different medications; and study the factors associated with the use of cash payments, especially by the elderly.
• Study the use of specific drugs; the appropriateness of the use of opiates and other pain relievers, which are subject to both over-use and under-use; the use by children of stimulants, which have been found to be both under- and over-used to treat attention deficit disorder and hyperactivity in rural areas (Angold et al., 2000) and to be connected with diversion to non-medical use in Canada (Poulin, 2007); the increasing and long-term use by young adults of stimulants as “brain steroids” (Talbot, 2009); and the use by the elderly of long-acting benzodiazepines, which are contra-indicated for them based on efficacy or safety (Fick et al., 2003).
• Improve the usefulness of the PMP data base by modifying the study ID to allow
for tracking by individual over time; including information on the secondary payer; and improving the accuracy of information on the drug category and the schedule.
10

References
123rd Maine State Legislature, First Session. An Act To Establish a Prescription Drug Academic
Detailing Program. (2007, June 19). Public Law, Chapter 327, LD 839, Sec. 1. 22 MRSA c. 603, sub-c. 1-A http://www.mainelegislature.org/legis/bills/bills_123rd/chappdfs/PUBLIC327.pdf
Angold, A., Erkanli, A., Egger, H.L., & Costello, E.J. (2000 Aug). Stimulant treatment for children: A community perspective. Journal of the American Academy of Child and Adolescent Psychiatry, 39(8), 975-84; discussion 984-94.
Eccher, D.J. (2008). Preventing prescription drug misuse in Maine: Maine's Prescription Monitoring Program. (PowerPoint). Augusta, ME: Maine Department of Health and Human Services, Office of Substance Abuse. http://maine.gov/dhhs/osa/data/pmp/files/PMPOverview.pdf
Fick, D.M., Cooper, J.W., Wade, W.E., Waller, J.L., & Maclean, J.R. (2003). Updating the Beers criteria for potentially inappropriate medication use in older adults: Results of a US consensus panel of experts. Archives of Internal Medicine, 163(22), 2716-24.
Kaiser Family Foundation. (2007, August). Health care costs: A primer: Key information on health care costs and their impact. (Pub No. 7670). Menlo Park, CA: The Henry J. Kaiser Family Foundation.
Kohn, L.T., Corrigan, J.M., Donaldson, M.S., eds., & Committee on Quality Health Care in America, Institute of Medicine. (2000). To err is human. Building a safer health system. Washington, D.C.: National Academy Press.
Maine Department of Health and Human Services. Office of Substance Abuse. (2009a). Updated statistics. [Online]. http://www.maine.gov/dhhs/osa/data/pmp/update.htm. [Accessed 2009, July 7].
Maine Department of Health and Human Services. Office of Substance Abuse. (2009b). Maine’s Prescription Monitoring Program. [Online]. http://www.maine.gov/dhhs/osa/data/pmp. [Accessed 2009, August 31].
Maine Office of Substance Abuse. (n.d.). Prescription Monitoring Program. [Online]. http://mainepmp.org/. [Accessed 2009, August 19].
Manchikanti, L. (2007 May). National drug control policy and prescription drug abuse: Facts and fallacies. Pain Physician, 10(3), 399-424.
Poulin, C. (2007 May). From attention-deficit/hyperactivity disorder to medical stimulant use to the diversion of prescribed stimulants to non-medical stimulant use: connecting the dots. Addiction, 102(5), 740-51.
Rannazzisi, J. (Deputy Assistant Director, Office of Diversion Control, Drug Enforcement
Administration). (2009, February 11). The Diversion and Abuse of Pharmaceutical Controlled Substances, Legend Drugs and Dietary Supplements. Presented at the CADCA (Community Anti-Drug Coalitions of America) 19th Annual National Leadership
11

Forum, National Harbor, MD. Silverman, H.M. (2008). The pill book (13th ed.). New York, NY: Bantam Books.
Sorg, M.H. (2008, May 28). Data on Maine deaths due to drug overdose. Presented at the 17th Annual Practice Education Seminar of the Maine Medical Association, Augusta, ME.
Spooner, J.J. (2007, April). Medication therapy management programs: when will the outcomes
come out? Journal of Managed Care Pharmacy, 13(3), 276-7.
Talbot, M. (2009, April 27). Brain gain: The underground world of "neuro-enhancing" drugs. New Yorker, 85(11), 32-43.
U.S. Census Bureau. Population Division. (2009, May 13). Annual Estimates of the Resident Population by Selected Age Groups and Sex for Counties: April 1, 2000 to July 1, 2008. [Online]. http://www.census.gov/popest/counties/asrh/files/cc-est2008-agesex-23.csv. [Accessed 2009, August 18].
U.S. Department of Justice. Drug Enforcement Administration. (2008, April 28). Controlled Substances. [Online]. http://www.deadiversion.usdoj.gov/schedules/schedules.htm. [Accessed 2009, July 9].
U.S. Department of Justice. Drug Enforcement Administration. (2005). The Controlled Substances Act. In D.E. Joseph (Editor), Drugs of Abuse. Washington, DC: U.S. Department of Justice, Drug Enforcement Administration.
U.S. Department of Justice. Drug Enforcement Administration. Office of Diversion Control. (2008, July). Automation of Reports and Consolidated Orders System (ARCOS) Retail Drug Summary. [Online]. http://www.deadiversion.usdoj.gov/arcos/retail_drug_summary/index.html. [Accessed 2009, August 18].
U.S. Department of Justice. Drug Enforcement Administration. Office of Diversion Control. (2008, November). State Prescription Monitoring Drug Programs. [Online]. http://www.deadiversion.usdoj.gov/faq/rx_monitor.htm. [Accessed 2009, August 19].
U.S. Department of Justice. Office of Justice Programs' Bureau of Justice Assistance. (2008, December). Guidance for Harold Rogers Prescription Drug Monitoring Program (PDMP) Grantees on Responding to Performance Measures. Washington, DC: Bureau of Justice Assistance.
Wolfe, S.M., Sasich, L.D., Hope, R.-E., & Public Citizen's Health Research Group. (1999). Worst pills, best pills: A consumer's guide to avoiding drug-induced death or illness. New York: Pocket Books.
WWAMI Rural Health Research Center. (2006, May 31). Rural-Urban Commuting Area (RUCA) Codes. [Online]. http://depts.washington.edu/uwruca. [Accessed 2009, July 9].
Zuvekas, S.H., Vitiello, B., & Norquist, G.S. (2006, April). Recent trends in stimulant medication use among U.S. children. American Journal of Psychiatry, 163(4), 579-585.
12

Figure 1. Examples of Schedule II – IV prescription drugs
Drug type and schedule Drug name
Pain control (II) Dextropropoxyphene (Darvon) Pain control (IV) Pentazocine (Talwin) Sedative (IV) Flurazepam (Dalmane) Sedative (IV) Meprobamate (Equanil, Miltown) Sedative (IV) Lorazepam (Ativan) Sedative (IV) Oxazepam (Serax) Sedative (IV) Alprazolam (Xanax) Sedative (IV) Temazepam (Restoril) Sedative (IV) Triazolam (Halcion) Sedative (IV) Chlordiazepoxide (Librium, libritabs, Limbitrol) Sedative (IV) Diazepam (Valium, Diastat) Sedative (IV) Quazepam (Doral) Sedative (IV) Helazepam (Paxipam) Sedative (IV) Clorazepate (Tranxene) Sedative (II) Pentobarbital (Nembutal) Sedative (II) Secobarbital (Seconal, Tuinal) Pain control (II) Meperidine (Demerol) Stimulant (II) Amphetamine (Dexedrine, Adderall) Sedative (III) Butabarbital (Butasol, Busodium) Stimulant (II) Methylphenidate (Ritalin, Concerta, Methylin) Stimulant (II) Methamphetamine (Desoxyn) Stimulant (IV) Pemoline (Cylert)
Source: US DEA, Controlled Substances http://www.deadiversion.usdoj.gov/schedules/alpha/alphabetical.htm. Note, in this study we divided the drug type sedative into sedatives and tranquilizers.
13

Figure 2. Information available in the Maine PMP database (variables studied are bolded)
The person the medication was prescribed for (the patient)
Study ID (this is a unique person-level identifier assigned by the PMP) Year of birth (age category) Zip code (used to classify the residence as urban/rural and by county and public health district)
The prescription Month and year data were submitted National Drug Code identifying the drug (category) DEA Schedule (II, III, or IV) Date (year) prescription was filled Prescription number Refill (yes/no) Quantity dispensed (in metric units) Days supply Number of refills authorized Origin of prescription (written, called in, not specified) Date prescription was written Generic drug name, trade mark (brand) name Dosage Source of payment/Payer The prescriber Study ID (scrambled) State where prescriber practices Number of prescribers/patient The dispensing pharmacy Name State
Number of pharmacies/patient
14

Table 1. Use of the study medications by age group, Maine PMP data, 2005-2008
Age
122,498 129,543 133,683 141,831 15.8% 35,712 34,987 34,121 35,498 -0.6% 3.4 3.7 3.9 4.0 16.5%6.6% 6.4% 6.3% 6.1% 7.2% 6.9% 6.7% 6.5%
104,883 109,307 112,752 120,256 14.7% 42,138 42,545 42,485 44,639 5.9% 2.5 2.6 2.7 2.7 8.2%5.7% 5.4% 5.3% 5.2% 8.5% 8.4% 8.3% 8.2%
536,373 556,334 582,120 627,823 17.0% 147,867 148,817 149,616 158,295 7.1% 3.6 3.7 3.9 4.0 9.3%28.9% 27.7% 27.4% 27.2% 30.0% 29.4% 29.4% 28.9%
687,388 758,576 819,801 903,364 31.4% 163,911 170,514 174,588 191,857 17.0% 4.2 4.4 4.7 4.7 12.3%37.0% 37.7% 38.6% 39.1% 33.2% 33.7% 34.3% 35.0%
406,690 457,777 476,062 518,049 27.4% 103,673 108,700 108,405 117,347 13.2% 3.9 4.2 4.4 4.4 12.5%21.9% 22.8% 22.4% 22.4% 21.0% 21.5% 21.3% 21.4%
1,857,832 2,011,537 2,124,418 2,311,323 24.4% 493,301 505,563 509,215 547,636 11.0% 3.8 4.0 4.2 4.2 12.1%100.0% 100.0% 100.0% 100.0% 100.0% 100.0% 100.0% 100.0% 100.0% 100.0%
2006 2007 2008
65+
Total
0 to 17
18 to 24
25 to 44
45 to 64
Number of prescriptions per patientPercent change
2005-2008
Number and percent of prescriptionsPercent change
2005-2008
Number and percent of patients2005 2006 2007 2008 2008Percent
change 2005-2008
2005 2006 20072005
15
100.0% 100.0% 100.0% 100.0% 100.0% 100.0% 100.0% 100.0% 100.0% 100.0%
Source: Muskie School of Public Service analysis of Maine PMP data
15

Age group
Number Percent Number Percent0-17 145,663 11.1% 141,211 10.7%18-24 113,331 8.6% 112,682 8.6%25-44 346,767 26.4% 331,809 25.2%45-64 373,190 28.5% 397,911 30.2%65 + 190,760 14.6% 199,187 15.1%Total 1,311,044 100.0% 1,316,456 100.0%
Source: http://www.census.gov/popest/counties/asrh/files/cc-est2008-agesex-23.csv
Table 2. US Census population estimates for Maine by age group, 2005 & 2008
4.4%
2005 2008
0.4%
-3.1%-0.6%-4.3%6.6%
Number and percent of population Percent change
2005 - 2008
1616

Table 3. Use of the study medications by urban/rural commuting area categories, Maine PMP data, 2005-2008
Rural/urban commuting area category 1
604,444 648,772 687,812 758,006 25.4% 162,731 163,577 167,170 181,405 11.5% 3.7 4.0 4.1 4.2 12.5%32.5% 32.3% 32.4% 32.8% 33.0% 32.4% 32.8% 33.1%
275,358 302,008 319,260 350,747 27.4% 78,280 80,081 81,246 89,755 14.7% 3.5 3.8 3.9 3.9 11.1%14.3% 15.0% 15.0% 15.2% 15.9% 15.8% 16.0% 16.4%
356,030 378,499 404,652 431,253 21.1% 93,021 95,249 97,339 102,008 9.7% 3.8 4.0 4.2 4.2 10.5%19.2% 18.8% 19.1% 18.7% 18.9% 18.8% 19.1% 18.6%
613,130 672,192 702,741 761,606 24.2% 156,444 163,784 160,756 171,969 9.9% 3.9 4.1 4.4 4.4 13.0%33.0% 33.4% 33.1% 33.0% 31.7% 32.4% 31.6% 31.4%8,870 10,066 9,953 9,711 9.5% 2,825 2,872 2,704 2,499 -11.5% 3.1 3.5 3.7 3.9 23.8%0.5% 0.5% 0.5% 0.4% 0.6% 0.6% 0.5% 0.5%
1,857,832 2,011,537 2,124,418 2,311,323 24.4% 493,301 505,563 509,215 547,636 11.0% 3.8 4.0 4.2 4.2 12.1%100.0% 100.0% 100.0% 100.0% 100.0% 100.0% 100.0% 100.0% 100.0% 100.0%
1 Rural-urban commuting area (WWAMI Rural Health Research Center, 2006)2 Examples: Auburn Bangor Biddeford Cape Elizabeth Falmouth Freeport Gorham Kittery Kittery Point Lewiston Portland Scarborough South Freeport Westbrook Windham and Yarmouth
2005
Small town and rural
Total
Missing
Urban core 2
Suburban
Large town 3
2008
Number of prescriptions per patient
Percent change
2005-2008
2005 2006 2007 2008 2005 2006 2007 2008
Number and percent of prescriptions Number and percent of patients
Percent change 2005-
2008
Percent change
2005-2008
2006 2007
17
Examples: Auburn, Bangor, Biddeford, Cape Elizabeth, Falmouth, Freeport, Gorham, Kittery, Kittery Point, Lewiston, Portland, Scarborough, South Freeport, Westbrook, Windham, and Yarmouth3 Examples: Acton, Albion, Gardiner, Georgetown, Hallowell, Harpswell, and Mount Vernon.
Source: Muskie School of Public Service analysis of Maine PMP data
17

MeasurePrescribers 1 2005 2006 2007 2008Mean 1.45 1.48 1.50 1.50Coeficient of variation 2 68.0 68.6 68.1 67.0Median 1 1 1 199% -ile 5 5 5 5Maximum 3 53 37 83 40 83 23 61 20
PharmaciesMean 1.03 1.03 1.02 1.01Coefficient of variation 34.8 34.7 32.5 32.1Median 1 1 1 199% -ile 2 1 1 1Maximum 3 30 19 35 24 30 16 28 11
Year
Table 4. Number of prescribers and pharmacies per patient, Maine PMP data, 2005-2008
18
1 Based on prescribers' Drug Enforcement Agency numbers2 Coefficient of variation = standard deviation/mean3 Superscript numbers in the year columns indicate value for the 5th highest observation.
Source: Muskie School of Public Service analysis of Maine PMP data
18

Table 5. Use of the study medications by drug category, Maine PMP data, 2005-2008
Drug category
997,219 1,079,994 1,127,992 1,204,786 20.8% 331,307 342,464 346,725 366,663 10.7% 3.0 3.2 3.3 3.3 9.2%53.7% 53.7% 53.1% 52.1% 67.2% 67.7% 68.1% 67.0%
149,949 169,726 190,477 218,483 45.7% 52,036 56,471 59,092 65,664 26.2% 2.9 3.0 3.2 3.3 15.5%8.1% 8.4% 9.0% 9.5% 10.6% 11.2% 11.6% 12.0%
181,463 203,120 223,627 257,153 41.7% 42,859 44,819 45,944 53,576 25.0% 4.2 4.5 4.9 4.8 13.4%1.0% 10.1% 10.5% 11.1% 8.7% 8.9% 9.0% 9.8%
493,306 523,456 547,019 593,506 20.3% 144,844 148,755 150,732 164,762 13.8% 3.4 3.5 3.6 3.6 5.8%26.6% 26.0% 25.8% 25.7% 29.4% 29.4% 29.6% 30.1%8,387 8,700 10,002 12,208 45.6% 3,007 3,100 3,337 4,146 37.9% 2.8 2.8 3.0 2.9 5.6%0.5% 0.4% 0.5% 0.5% 0.6% 0.6% 0.7% 0.8%
27,509 26,542 25,303 25,188 -8.4% 20,164 19,281 18,688 18,902 -6.3% 1.4 1.4 1.4 1.3 -2.3%1.5% 1.3% 1.2% 1.1% 4.1% 3.8% 3.7% 3.5%
1,857,833 2,011,538 2,124,420 2,311,324 24.4% 493,301 505,563 509,215 547,636 11.0% 3.8 4.0 4.2 4.2 12.1%100.0% 100.0% 100.0% 100.0% 100.0% 100.0% 100.0% 100.0% 100.0%
Source: Muskie School of Public Service analysis of Maine PMP data
Sedative
Stimulant
Tranquilizer
Hormone replacement
Total
Number of prescriptions per patient2005 2006 2007 2008 Percent
change 2005-2008
2008 Percent change
2005-2008Pain reliever
Percent change
2005-2008
2005 2006
Other
2005 20072006 2007 2008Number and percent of prescriptions Number and percent of patients
1919

Table 6. Use of the study medications by drug category and age group, Maine PMP data, 2005-2008
Drug category
% in 2008 % change 2005-2008
% in 2008 % change 2005-2008
% in 2008 % change 2005-2008
% in 2008 % change 2005-2008
% in 2008 % change 2005-2008
% in 2008 % change 2005-2008
Pain reliever 9.8% -1.4% 53.0% 4.2% 56.5% 9.2% 55.0% 29.7% 53.3% 28.7% 52.1% 20.8%
Sedative 3.5% 4.2% 3.1% 31.1% 7.1% 52.4% 11.0% 54.0% 12.7% 35.6% 9.5% 45.7%
Stimulant 82.3% 20.3% 28.2% 44.3% 9.4% 92.1% 4.6% 57.0% 1.3% 60.6% 11.1% 41.7%
Tranquilizer 3.8% 13.9% 14.8% 10.4% 25.7% 12.9% 27.5% 25.5% 31.1% 22.0% 25.7% 20.3%
Hormone replacement 0.1% -26.6% 0.2% 24.8% 0.4% 23.1% 0.8% 53.3% 0.4% 55.6% 0.5% 45.6%
Percent of all prescriptions and percent change in the number of prescriptions0 to 17 18 to 24 25 to 44 45 to 64 65+ Total
20
p
Other 0.7% -49.7% 0.7% -21.1% 1.0% -13.8% 1.2% -3.4% 1.2% 3.5% 1.1% -8.4%
Total 141,831 120,256 627,824 903,364 518,049 2,311,324100.0% 15.8% 100.0% 14.7% 100.0% 17.1% 100.0% 31.4% 100.0% 27.4% 100.0% 24.4%
Source: Muskie School of Public Service analysis of Maine PMP data
20

Table 7. Use of the study medications by Drug Enforcement Agency (DEA) class, Maine PMP data, 2005-2008
DEA Class
558,772 631,093 681,269 748,630 34.0% 156,967 167,190 171,819 188,089 19.8% 3.6 3.8 4.0 4.0 11.8%30.1% 31.4% 32.1% 32.4% 31.8% 33.1% 33.7% 34.4%
531,488 567,738 594,063 641,580 20.7% 234,201 241,127 245,185 258,438 10.3% 2.3 2.4 2.4 2.5 9.4%28.6% 28.2% 28.0% 27.8% 47.5% 47.7% 48.2% 47.2%
767,573 812,707 849,088 921,114 20.0% 221,753 225,114 225,467 243,198 9.7% 3.5 3.6 3.8 3.8 9.4%41.3% 40.4% 40.0% 39.9% 45.0% 44.5% 44.3% 44.4%
1,857,833 2,011,538 2,124,420 2,311,324 24.4% 493,301 505,563 509,215 547,636 11.0% 3.8 4.0 4.2 4.2 12.1%100.0% 100.0% 100.0% 100.0% 100.0% 100.0% 100.0% 100.0%
Source: Muskie School of Public Service analysis of Maine PMP data
2007Number of prescriptions per patient
2005 2006 2007 2008 Percent change
2005-2008
2006 Percent change
2005-2008
2006 2007Number and percent of patients
200820082005 Percent change
2005-2008
2005
Class III
Class IV
Total
Number and percent of prescriptions
Class II
2121

DEA Class
% in 2008 % change 2005-2008
% in 2008 % change 2005-2008
% in 2008 % change 2005-2008
% in 2008 % change 2005-2008
% in 2008 % change 2005-2008
% in 2008 % change 2005-2008
Class II 84.4% 20.7% 40.4% 29.1% 29.1% 25.7% 29.6% 44.7% 25.1% 42.0% 32.4% 34.0%Class III 8.0% -12.1% 39.6% 6.9% 34.8% 14.2% 27.1% 26.2% 22.9% 34.6% 27.8% 20.7%Class IV 7.6% 3.9% 20.0% 6.1% 36.0% 13.5% 43.2% 26.7% 52.0% 18.7% 39.9% 20.0%Total 141,831 141,831 627,824 903,364 518,049 2,311,324
100.0% 15.8% 100.0% 14.7% 100.0% 17.1% 100.0% 31.4% 100.0% 27.4% 100.0% 24.4%
Source: Muskie School of Public Service analysis of Maine PMP data
Table 8. Use of the study medications by Drug Enforcement Agency (DEA) class and by age group, Maine PMP data, 2005-2008.
Percent of prescriptions and percent change0 to 17 18 to 24 25 to 44 45 to 64 65+ Total
2222

Drug category 1
2005 2006 2007 2008 Percent change
2005-2008Pain reliever 391,000 440,661 470,981 506,099 27.1%
70.0% 69.8% 69.1% 67.6%Sedative 25 74 142 45 80.0%
0.0% 0.0% 0.0% 0.0%Stimulant 167,688 190,292 210,048 242,411 44.6%
30.0% 30.2% 30.8% 32.4%Other 59 66 98 75 27.1%
0.0% 0.0% 0.0% 0.0%Total 558,772 631,093 681,269 748,630 34.0%
21 3% 24 1% 26 0% 28 6%
Number and percent of prescriptions
Table 9. Use of Class II medications by drug category, Maine PMP data, 2005-2008
23
21.3% 24.1% 26.0% 28.6%
Source: Muskie School of Public Service analysis of Maine PMP data
1 No class II drugs are tranquilizers or hormone replacements, so those drug categories are not listed.
23
Payment source
Cash 234,952 252,144 249,919 277,686 18.2%12.7% 12.5% 11.8% 12.0%
Medicaid 465,542 452,922 371,537 402,150 -13.6%25.1% 22.5% 17.5% 17.4%
Medicare 35,109 83,443 117,343 99,274 182.8%1.9% 4.2% 5.5% 4.3%
Commercial PBM Insurance 1 701,143 1,059,169 1,206,722 1,308,706 86.7%37.7% 52.7% 56.8% 56.6%
Major medical 147,819 152,588 167,262 212,104 43.5%8.0% 7.6% 7.9% 9.2%
Workers compensation 6 390 8 359 8 220 7 778 21 7%
Table 10. Use of the study medications by source of payment, Maine PMP data, 2005-2008
2005 2006 2007 2008 Percent change
2005-2008
Number and percent of prescriptions
24
Workers compensation 6,390 8,359 8,220 7,778 21.7%0.3% 0.4% 0.4% 0.3%
Unknown 266,878 2,913 3,417 3,626 -98.6%14.4% 0.1% 0.2% 0.2%
1,857,833 2,011,538 2,124,420 2,311,324 24.4%100.0% 100.0% 100.0% 100.0%
1 PBM = pharmacy benefit manager
Source: Muskie School of Public Service analysis of Maine PMP data
Total
24
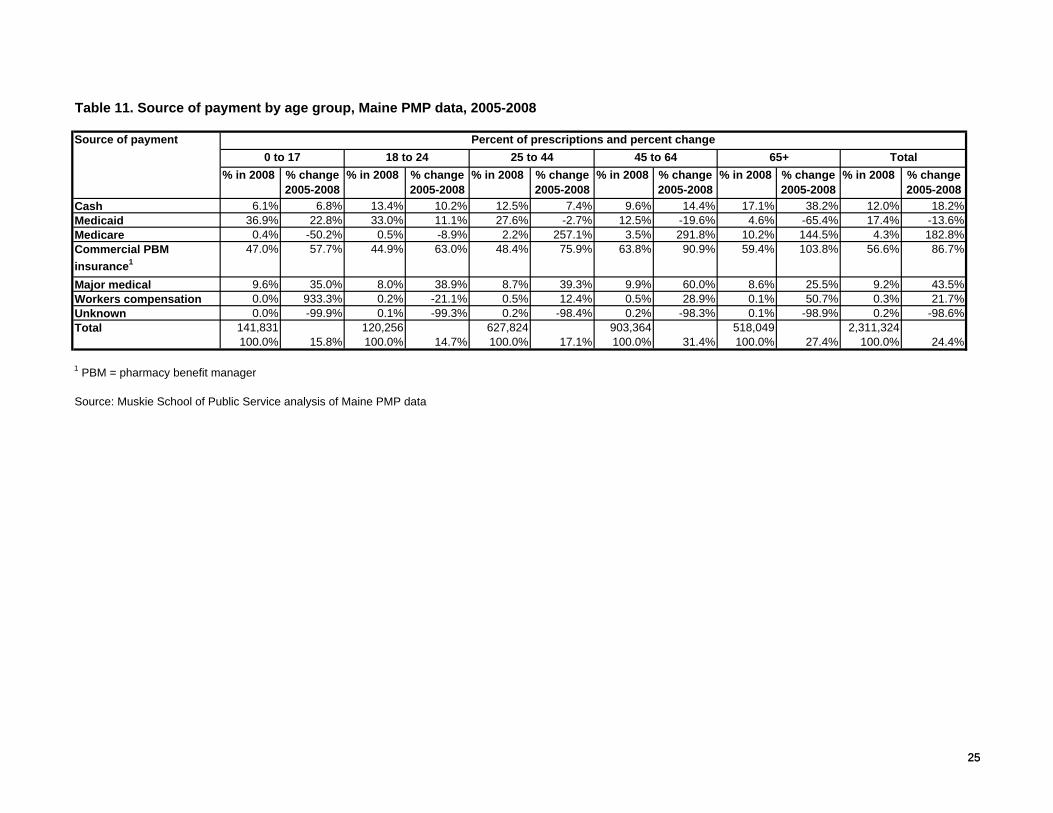
Table 11. Source of payment by age group, Maine PMP data, 2005-2008
Source of payment
% in 2008 % change 2005-2008
% in 2008 % change 2005-2008
% in 2008 % change 2005-2008
% in 2008 % change 2005-2008
% in 2008 % change 2005-2008
% in 2008 % change 2005-2008
Cash 6.1% 6.8% 13.4% 10.2% 12.5% 7.4% 9.6% 14.4% 17.1% 38.2% 12.0% 18.2%Medicaid 36.9% 22.8% 33.0% 11.1% 27.6% -2.7% 12.5% -19.6% 4.6% -65.4% 17.4% -13.6%Medicare 0.4% -50.2% 0.5% -8.9% 2.2% 257.1% 3.5% 291.8% 10.2% 144.5% 4.3% 182.8%Commercial PBM insurance1
47.0% 57.7% 44.9% 63.0% 48.4% 75.9% 63.8% 90.9% 59.4% 103.8% 56.6% 86.7%
Major medical 9.6% 35.0% 8.0% 38.9% 8.7% 39.3% 9.9% 60.0% 8.6% 25.5% 9.2% 43.5%Workers compensation 0.0% 933.3% 0.2% -21.1% 0.5% 12.4% 0.5% 28.9% 0.1% 50.7% 0.3% 21.7%Unknown 0.0% -99.9% 0.1% -99.3% 0.2% -98.4% 0.2% -98.3% 0.1% -98.9% 0.2% -98.6%Total 141,831 120,256 627,824 903,364 518,049 2,311,324
100.0% 15.8% 100.0% 14.7% 100.0% 17.1% 100.0% 31.4% 100.0% 27.4% 100.0% 24.4%
1 PBM = pharmacy benefit manager
Percent of prescriptions and percent change0 to 17 18 to 24 25 to 44 45 to 64 65+ Total
25
Source: Muskie School of Public Service analysis of Maine PMP data
25