epidemiology report: increase in overdose deaths involving ... · 2010 census population. rates are...
TRANSCRIPT
Epidemiology report: Increase in overdose deaths involving opioids – Chicago, 2015-2016 October 2017
Table 1. Overdose deaths involving opioids – Chicago, 2015-2016 2015 2016
# % rateii # % rateii
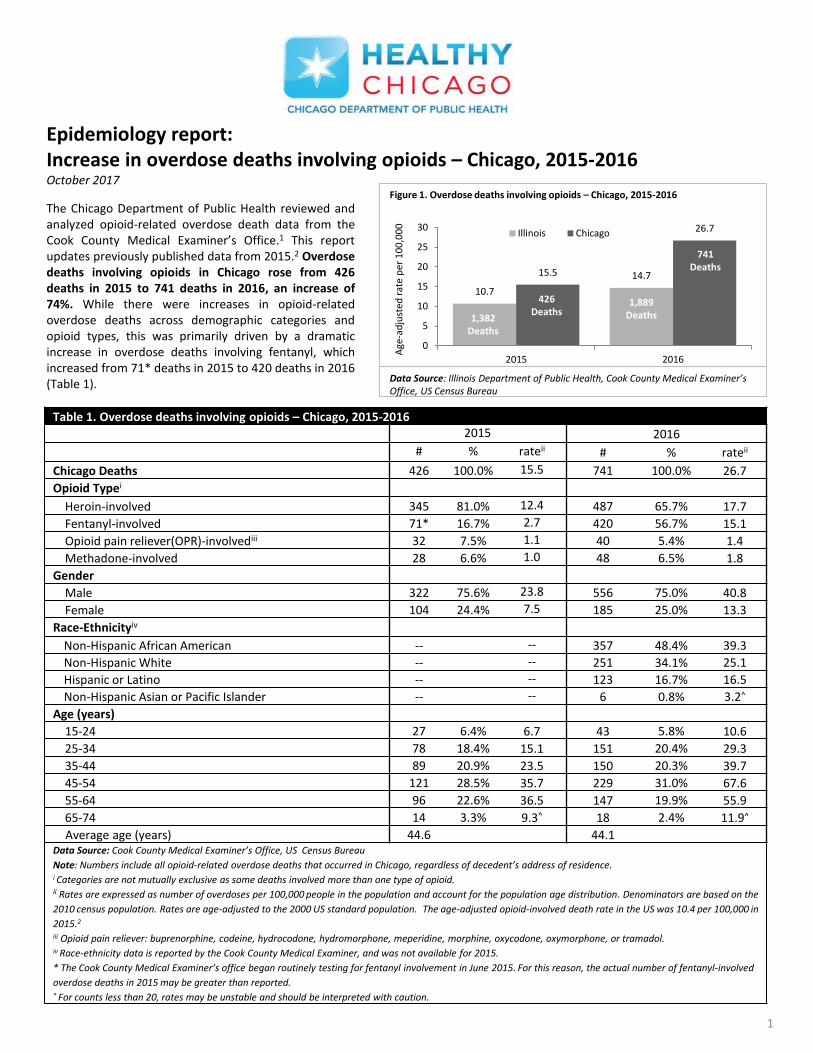
Chicago Deaths 426 100.0% 15.5 741 100.0% 26.7
Opioid Typei
Heroin-involved 345 81.0% 12.4 487 65.7% 17.7
Fentanyl-involved 71* 16.7% 2.7 420 56.7% 15.1
Opioid pain reliever(OPR)-involvediii 32 7.5% 1.1 40 5.4% 1.4
Methadone-involved 28 6.6% 1.0 48 6.5% 1.8
Gender
Male 322 75.6% 23.8 556 75.0% 40.8
Female 104 24.4% 7.5 185 25.0% 13.3
Race-Ethnicityiv
Non-Hispanic African American -- -- 357 48.4% 39.3
Non-Hispanic White -- -- 251 34.1% 25.1
Hispanic or Latino -- -- 123 16.7% 16.5
Non-Hispanic Asian or Pacific Islander -- -- 6 0.8% 3.2^
Age (years)
15-24 27 6.4% 6.7 43 5.8% 10.6
25-34 78 18.4% 15.1 151 20.4% 29.3
35-44 89 20.9% 23.5 150 20.3% 39.7
45-54 121 28.5% 35.7 229 31.0% 67.6
55-64 96 22.6% 36.5 147 19.9% 55.9
65-74 14 3.3% 9.3^ 18 2.4% 11.9^
Average age (years) 44.6 44.1 Data Source: Cook County Medical Examiner’s Office, US Census Bureau
Note: Numbers include all opioid-related overdose deaths that occurred in Chicago, regardless of decedent’s address of residence. i Categories are not mutually exclusive as some deaths involved more than one type of opioid. ii Rates are expressed as number of overdoses per 100,000 people in the population and account for the population age distribution. Denominators are based on the
2010 census population. Rates are age-adjusted to the 2000 US standard population. The age-adjusted opioid-involved death rate in the US was 10.4 per 100,000 in
2015.2 iii Opioid pain reliever: buprenorphine, codeine, hydrocodone, hydromorphone, meperidine, morphine, oxycodone, oxymorphone, or tramadol. iv Race-ethnicity data is reported by the Cook County Medical Examiner, and was not available for 2015.
* The Cook County Medical Examiner’s office began routinely testing for fentanyl involvement in June 2015. For this reason, the actual number of fentanyl-involved
overdose deaths in 2015 may be greater than reported. ^ For counts less than 20, rates may be unstable and should be interpreted with caution.
The Chicago Department of Public Health reviewed and analyzed opioid-related overdose death data from the Cook County Medical Examiner’s Office.1 This report updates previously published data from 2015.2 Overdose deaths involving opioids in Chicago rose from 426 deaths in 2015 to 741 deaths in 2016, an increase of 74%. While there were increases in opioid-related overdose deaths across demographic categories and opioid types, this was primarily driven by a dramatic increase in overdose deaths involving fentanyl, which increased from 71* deaths in 2015 to 420 deaths in 2016 (Table 1).
1
10.7
14.7 15.5
26.7
0
5
10
15
20
25
30
2015 2016
Age
-ad
just
ed r
ate
per
10
0,0
00
Illinois Chicago
741 Deaths
Data Source: Illinois Department of Public Health, Cook County Medical Examiner’s Office, US Census Bureau
Figure 1. Overdose deaths involving opioids – Chicago, 2015-2016
426 Deaths
1,382 Deaths
1,889 Deaths
• Overdose deaths involving opioids increased from 2015 to 2016 by both gender and age. Men continued to have higher death rates than women, and persons aged 45-54 years had higher death rates than other age categories (Table 1).
• Beginning in 2016, CDPH was
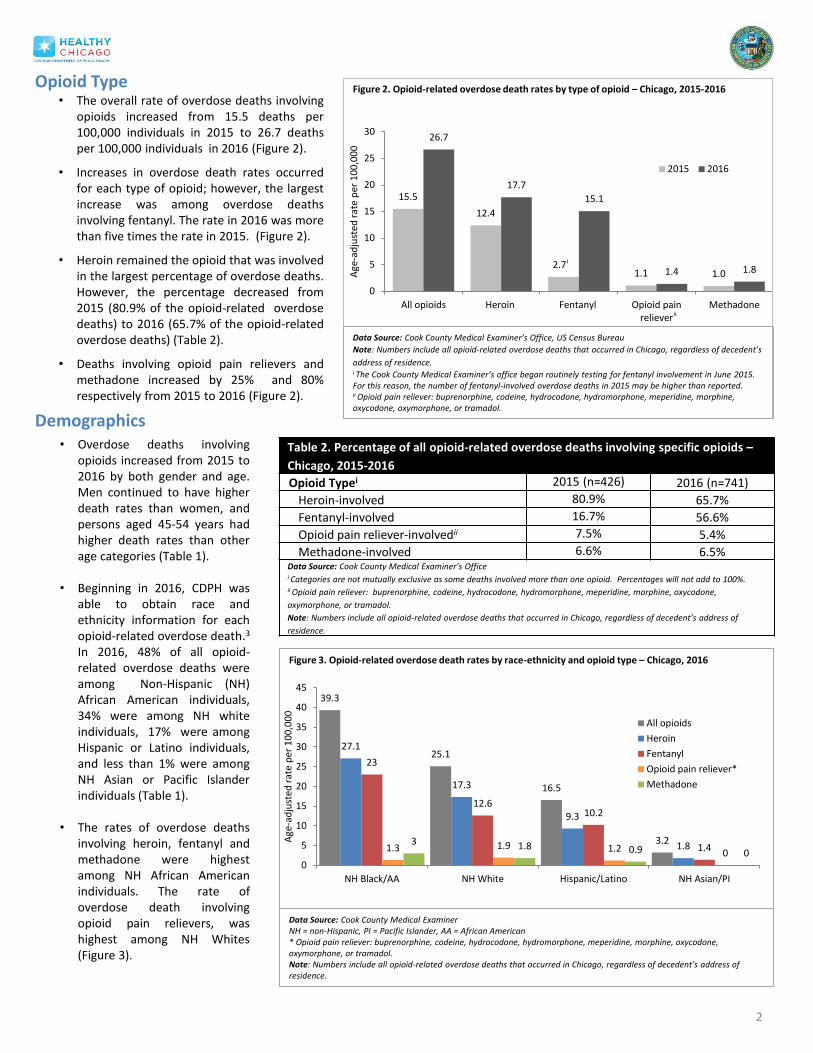
able to obtain race and ethnicity information for each opioid-related overdose death.3 In 2016, 48% of all opioid-related overdose deaths were among Non-Hispanic (NH) African American individuals, 34% were among NH white individuals, 17% were among Hispanic or Latino individuals, and less than 1% were among NH Asian or Pacific Islander individuals (Table 1).
• The rates of overdose deaths
involving heroin, fentanyl and methadone were highest among NH African American individuals. The rate of overdose death involving opioid pain relievers, was highest among NH Whites (Figure 3).
2
39.3
25.1
16.5
3.2
27.1
17.3
9.3
1.8
23
12.6 10.2
1.4 1.3 1.9 1.2 0 3 1.8 0.9 0
0
5
10
15
20
25
30
35
40
45
NH Black/AA NH White Hispanic/Latino NH Asian/PI
Age
-ad
just
ed r
ate
per
10
0,0
00
All opioids
Heroin
Fentanyl
Opioid pain reliever*
Methadone
Figure 3. Opioid-related overdose death rates by race-ethnicity and opioid type – Chicago, 2016
Data Source: Cook County Medical Examiner NH = non-Hispanic, PI = Pacific Islander, AA = African American * Opioid pain reliever: buprenorphine, codeine, hydrocodone, hydromorphone, meperidine, morphine, oxycodone, oxymorphone, or tramadol. Note: Numbers include all opioid-related overdose deaths that occurred in Chicago, regardless of decedent’s address of residence.
• The overall rate of overdose deaths involving opioids increased from 15.5 deaths per 100,000 individuals in 2015 to 26.7 deaths per 100,000 individuals in 2016 (Figure 2).
• Increases in overdose death rates occurred for each type of opioid; however, the largest increase was among overdose deaths involving fentanyl. The rate in 2016 was more than five times the rate in 2015. (Figure 2).
• Heroin remained the opioid that was involved in the largest percentage of overdose deaths. However, the percentage decreased from 2015 (80.9% of the opioid-related overdose deaths) to 2016 (65.7% of the opioid-related overdose deaths) (Table 2).
• Deaths involving opioid pain relievers and methadone increased by 25% and 80% respectively from 2015 to 2016 (Figure 2).
Table 2. Percentage of all opioid-related overdose deaths involving specific opioids –
Chicago, 2015-2016
Opioid Typei 2015 (n=426) 2016 (n=741)
Heroin-involved 80.9% 65.7%
Fentanyl-involved 16.7% 56.6%
Opioid pain reliever-involvedii 7.5% 5.4%
Methadone-involved 6.6% 6.5% Data Source: Cook County Medical Examiner’s Office i Categories are not mutually exclusive as some deaths involved more than one opioid. Percentages will not add to 100%. ii Opioid pain reliever: buprenorphine, codeine, hydrocodone, hydromorphone, meperidine, morphine, oxycodone,
oxymorphone, or tramadol.
Note: Numbers include all opioid-related overdose deaths that occurred in Chicago, regardless of decedent’s address of
residence.
Opioid Type
Demographics
15.5
12.4
2.7 1.1 1.0
26.7
17.7
15.1
1.4 1.8
0
5
10
15
20
25
30
All opioids Heroin Fentanyl Opioid painreliever
Methadone
Age
-ad
just
ed r
ate
per
10
0,0
00
2015 2016
Data Source: Cook County Medical Examiner’s Office, US Census Bureau
Note: Numbers include all opioid-related overdose deaths that occurred in Chicago, regardless of decedent’s
address of residence. i The Cook County Medical Examiner’s office began routinely testing for fentanyl involvement in June 2015. For this reason, the number of fentanyl-involved overdose deaths in 2015 may be higher than reported. ii Opioid pain reliever: buprenorphine, codeine, hydrocodone, hydromorphone, meperidine, morphine, oxycodone, oxymorphone, or tramadol.
i
ii
Figure 2. Opioid-related overdose death rates by type of opioid – Chicago, 2015-2016

Table 3. Opioid-related overdose deaths – Cook County, IL (2015 – 2016)
Chicago
Population: 2,695,598
Suburban Cook Population: 2,499,077
2015 2016 2015 2016
Drug Typei # Rateii # Rateii # Rateii # Rateii
All opioids 426 15.5 741 26.8 221 8.8 340 13.7
Heroin-involved 345 12.4 487 17.7 152 6.2 206 8.5
Fentanyl-involved 71* 2.7 420 15.1 32* 1.3 140 5.7
Opioid pain reliever-
involvediii
32 1.1 40 1.4 45 1.7 64
2.4
Methadone-involved 28 1.0 48 1.8 19 0.8+ 13 0.6+
Gender
Male 322 23.8 557 40.8 149 12.0 245 20.5
Female 104 7.5 185 13.3 72 5.6 95 7.2
Race-Ethnicityiv
NH AA/Black -- -- 358 39.3 -- -- 41 10.0
NH White -- -- 253 25.2 -- -- 261 19.9
Hispanic or Latino -- -- 123 16.5 -- -- 34 7.5
NH Asian or PI -- -- 6 3.2+ -- -- <5 ++
Age
15-24 27 6.7 43 10.6 20 6.1 39 11.9
25-34 78 15.1 151 29.3 62 19.6 97 30.7
35-44 89 23.5 151 39.9 42 12.7 75 22.6
45-54 121 35.7 229 67.6 52 13.7 70 18.5
55-64 96 36.5 147 55.9 39 12.7 52 17.0
65-74 14 9.3+ 18 11.9+ <5 ++ 7 4.0+ Data Source: Cook County Medical Examiner’s Office, US Census Bureau
Note: Geographic designations are based on address of incident, regardless of decedent’s address of residence. i Categories are not mutually exclusive as some deaths involved more than one type of opioid. ii Rates express then number of overdoses per 100,000 people in the population. Denominators are based on the 2010 census
population. Rates are age-adjusted to the 2000 US standard population. Iii Opioid pain reliever: buprenorphine, codeine, hydrocodone, hydromorphone, meperidine, morphine, oxycodone, oxymorphone,
or tramadol. iv Race-ethnicity data not available for 2015. Race-ethnicity data provided by the Cook County Medical Examiner. NH = non-
Hispanic, AA = African American, PI = Pacific Islander.
* The Cook County Medical Examiner’s office began routinely testing for fentanyl involvement in June 2015. For this reason, the
actual number of fentanyl-involved overdose deaths in 2015 may be greater than reported. + For counts less than 20, rates may be unstable and should be interpreted with caution. ++ For counts less than 5, rates are not reported.
Table 4. Percentage of all opioid-related overdose deaths involving
specific opioids – Cook County, IL (2016)
Drug Typei Chicago (n=741)
Suburban Cook (n=340)
Heroin-involved 65.7% 60.6% Fentanyl-involved 56.7% 41.2% Opioid pain reliever-involvedii 5.4% 18.8% Methadone-involved 6.5% 3.8%
Data Source: Cook County Medical Examiner’s Office.
Note: Geographic designations are based on address of incident, regardless of decedent’s address
of residence. i Categories are not mutually exclusive as some deaths involved more than one type of opioid.
Percentages will not add to 100% ii Opioid pain reliever: buprenorphine, codeine, hydrocodone, hydromorphone, meperidine,
morphine, oxycodone, oxymorphone, or tramadol.
other racial/ethnic groups. The rate was highest in the 25-34 year old age group compared to other age groups (Table 3).
As in 2015, in 2016, heroin was the drug involved in the majority of overdose deaths in both Chicago and suburban Cook County (65.7% and 60.6% respectively). However, in both jurisdictions, the percentage of fentanyl-involved overdose deaths increased substantially from 2015 to 2016. The percentage of overdose deaths involving opioid pain relievers in suburban Cook County (18.8%) was more than three times the percentage in Chicago (5.4%) (Table 4).
In addition to the 741 opioid-related overdose deaths that occurred in Chicago, another 340 occurred in suburban Cook County. While the rate of opioid-related overdose deaths in Chicago (26.8 per 100,000 individuals) was substantially higher than the rate in Illinois (14.7 per 100,000 individuals), the rate in suburban Cook County (13.7 per 100,000) was slightly lower than the state rate (Table 3). • In both Chicago and suburban
Cook County, the rate of overdose deaths involving heroin was higher than the rate of deaths involving other types of opioids in 2016 (Table 3).
• The rate of overdose deaths among men was higher than the rate of overdose deaths among women in both Chicago and suburban Cook County (Table 3).
• In Chicago, the rate of opioid-related overdose death was highest among non-Hispanic African American or Black individuals compared to other racial/ethnic groups. The rate was highest in the 45-54 year old age group compared to other age groups (Table 3).
• In suburban Cook County, the rate of opioid-related overdose death was highest among non-Hispanic white individuals compared to
Geography – Cook County, IL
3
4
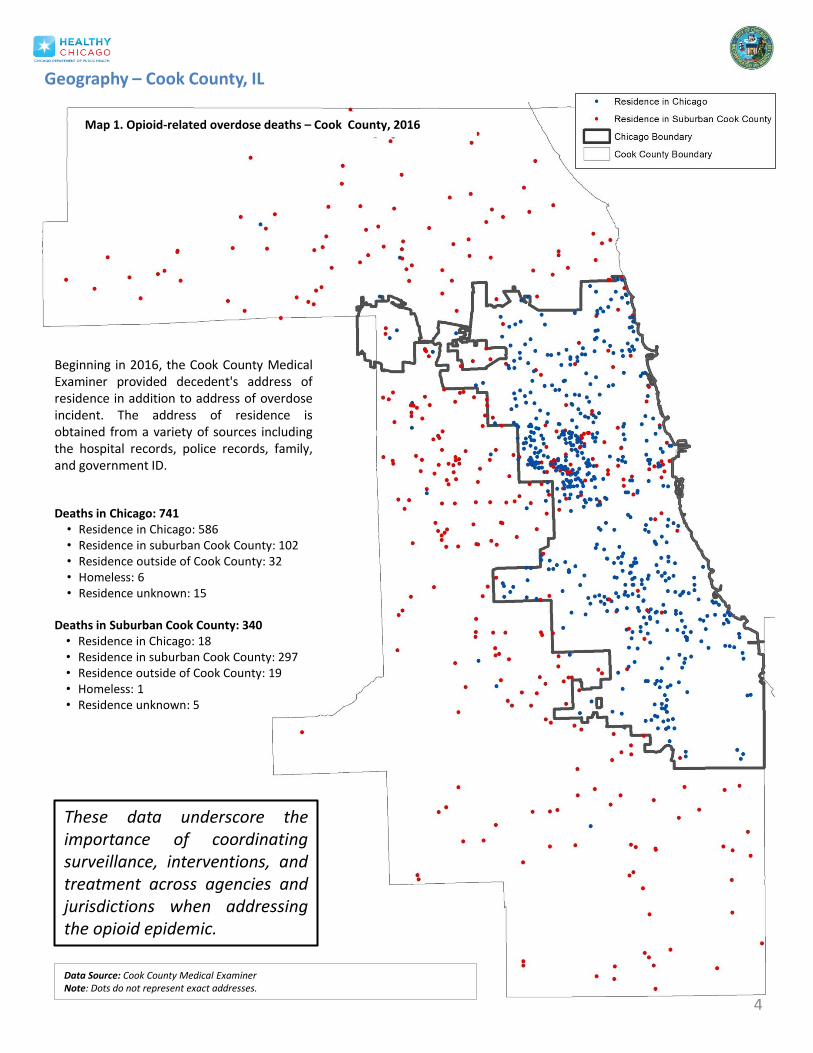
Deaths in Chicago: 741 • Residence in Chicago: 586 • Residence in suburban Cook County: 102 • Residence outside of Cook County: 32 • Homeless: 6 • Residence unknown: 15
Deaths in Suburban Cook County: 340 • Residence in Chicago: 18 • Residence in suburban Cook County: 297 • Residence outside of Cook County: 19 • Homeless: 1 • Residence unknown: 5
Beginning in 2016, the Cook County Medical Examiner provided decedent's address of residence in addition to address of overdose incident. The address of residence is obtained from a variety of sources including the hospital records, police records, family, and government ID.
Map 1. Opioid-related overdose deaths – Cook County, 2016
Geography – Cook County, IL
These data underscore the importance of coordinating surveillance, interventions, and treatment across agencies and jurisdictions when addressing the opioid epidemic.
Data Source: Cook County Medical Examiner Note: Dots do not represent exact addresses.

Table 5. Opioid-related overdose deaths that occurred in Chicago by decedent’s address of residence – Chicago, 2016
Address of residence in Chicago (n=586)
Address of residence in suburban Cook (n = 102)
# % # %
Race-ethnicity
NH African American 312 53.2% 26 25.5%
NH White 169 28.8% 60 58.8%
Hispanic or Latino 99 16.9% 16 15.7%
NH Asian or Pacific Islander 5 0.9% 0 0
Age (years)
15-24 29 4.9% 9 8.8%
25-34 106 18.1% 29 28.4%
35-44 123 21.0% 16 15.7%
45-54 187 31.9% 28 27.5%
55-64 126 21.5% 16 15.7%
65-74 13 2.2% 4 3.9%
Average age (years) 44.9 41.5
Data Source: Cook County Medical Examiner’s Office.
5
• Of the 741 opioid-related overdose deaths that occurred in Chicago in 2016, 586 decedents had a residence address in Chicago, while 102 decedents had a residence address in suburban Cook County (Table 5).
• Chicago residents who died of an opioid-
related overdose were more likely to be NH African American (52.3%) and older (average age of 50 years). However, non-residents who died of an overdose were more likely to be NH White (59%) and younger (average age of 42 years) (Table 5).
• 275 (37%) of the opioid-related overdose deaths that occurred in Chicago occurred at the decedent’s home address.
Geography - Chicago Opioid-related overdose deaths occurred across Chicago – with decedents having resided in 73 of the 77 (95%) community areas. Top five community areas (number of deaths)
1) Austin (50) 2) North Lawndale (29) 3) Humboldt Park (28) 4) West Town (19) and South Shore (19) 5) Roseland (18)
Community areas with zero deaths
1) Edison Park 2) North Park 3) Armor Square 4) Morgan Park
Map 2. Overdose deaths involving opioids among Chicago residents (2016)
Data Source: Cook County Medical Examiner Note: Numbers include opioid-related overdose deaths that occurred among Chicago residents regardless of overdose incident location. Dots do not represent exact addresses.
• Decedent’s address of residence (n=604)
Opioid-related overdose deaths occurred in 95% of Chicago community areas in 2016.
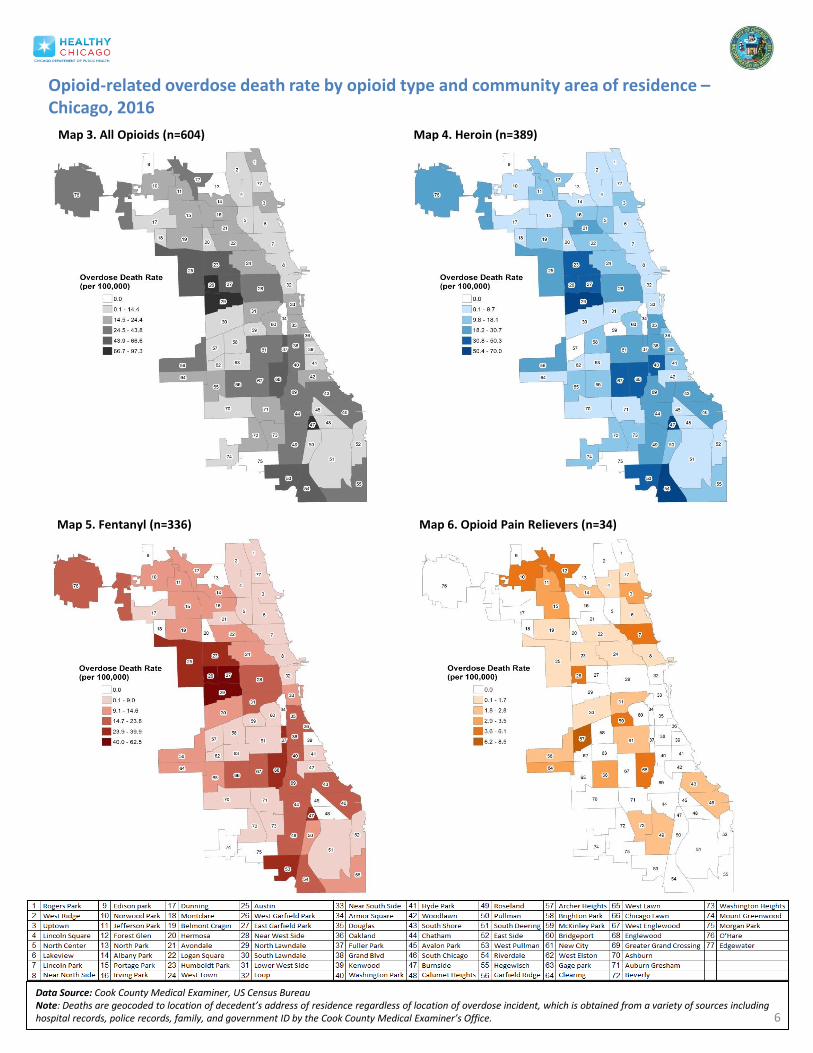
Data Source: Cook County Medical Examiner, US Census Bureau Note: Deaths are geocoded to location of decedent’s address of residence regardless of location of overdose incident, which is obtained from a variety of sources including hospital records, police records, family, and government ID by the Cook County Medical Examiner’s Office.
Opioid-related overdose death rate by opioid type and community area of residence – Chicago, 2016
Map 6. Opioid Pain Relievers (n=34)
Map 3. All Opioids (n=604) Map 4. Heroin (n=389)
Map 5. Fentanyl (n=336)
6
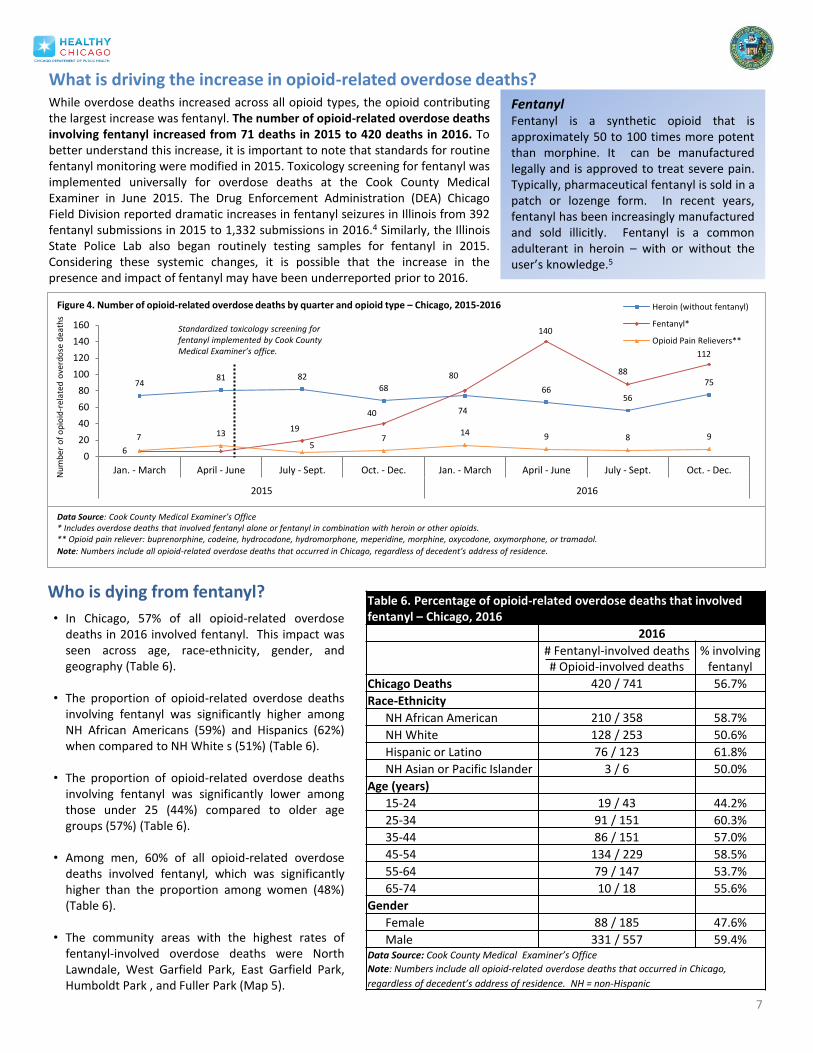
What is driving the increase in opioid-related overdose deaths? While overdose deaths increased across all opioid types, the opioid contributing the largest increase was fentanyl. The number of opioid-related overdose deaths involving fentanyl increased from 71 deaths in 2015 to 420 deaths in 2016. To better understand this increase, it is important to note that standards for routine fentanyl monitoring were modified in 2015. Toxicology screening for fentanyl was implemented universally for overdose deaths at the Cook County Medical Examiner in June 2015. The Drug Enforcement Administration (DEA) Chicago Field Division reported dramatic increases in fentanyl seizures in Illinois from 392 fentanyl submissions in 2015 to 1,332 submissions in 2016.4 Similarly, the Illinois State Police Lab also began routinely testing samples for fentanyl in 2015. Considering these systemic changes, it is possible that the increase in the presence and impact of fentanyl may have been underreported prior to 2016.
Fentanyl Fentanyl is a synthetic opioid that is approximately 50 to 100 times more potent than morphine. It can be manufactured legally and is approved to treat severe pain. Typically, pharmaceutical fentanyl is sold in a patch or lozenge form. In recent years, fentanyl has been increasingly manufactured and sold illicitly. Fentanyl is a common adulterant in heroin – with or without the user’s knowledge.5
7
• In Chicago, 57% of all opioid-related overdose deaths in 2016 involved fentanyl. This impact was seen across age, race-ethnicity, gender, and geography (Table 6).
• The proportion of opioid-related overdose deaths
involving fentanyl was significantly higher among NH African Americans (59%) and Hispanics (62%) when compared to NH White s (51%) (Table 6).
• The proportion of opioid-related overdose deaths
involving fentanyl was significantly lower among those under 25 (44%) compared to older age groups (57%) (Table 6).
• Among men, 60% of all opioid-related overdose
deaths involved fentanyl, which was significantly higher than the proportion among women (48%) (Table 6).
• The community areas with the highest rates of
fentanyl-involved overdose deaths were North Lawndale, West Garfield Park, East Garfield Park, Humboldt Park , and Fuller Park (Map 5).
Table 6. Percentage of opioid-related overdose deaths that involved fentanyl – Chicago, 2016
2016
# Fentanyl-involved deaths # Opioid-involved deaths
% involving fentanyl
Chicago Deaths 420 / 741 56.7%
Race-Ethnicity
NH African American 210 / 358 58.7%
NH White 128 / 253 50.6%
Hispanic or Latino 76 / 123 61.8%
NH Asian or Pacific Islander 3 / 6 50.0%
Age (years)
15-24 19 / 43 44.2%
25-34 91 / 151 60.3%
35-44 86 / 151 57.0%
45-54 134 / 229 58.5%
55-64 79 / 147 53.7%
65-74 10 / 18 55.6%
Gender
Female 88 / 185 47.6%
Male 331 / 557 59.4% Data Source: Cook County Medical Examiner’s Office
Note: Numbers include all opioid-related overdose deaths that occurred in Chicago,
regardless of decedent’s address of residence. NH = non-Hispanic
Who is dying from fentanyl?
74 81 82
68
74
66 56
75
6
19
40
80
140
88
112
7 13
5 7
14 9 8 9
0
20
40
60
80
100
120
140
160
Jan. - March April - June July - Sept. Oct. - Dec. Jan. - March April - June July - Sept. Oct. - Dec.
2015 2016
Nu
mb
er o
f o
pio
id-r
elat
ed o
verd
ose
dea
ths
Heroin (without fentanyl)
Fentanyl*
Opioid Pain Relievers**
Data Source: Cook County Medical Examiner’s Office * Includes overdose deaths that involved fentanyl alone or fentanyl in combination with heroin or other opioids. ** Opioid pain reliever: buprenorphine, codeine, hydrocodone, hydromorphone, meperidine, morphine, oxycodone, oxymorphone, or tramadol.
Note: Numbers include all opioid-related overdose deaths that occurred in Chicago, regardless of decedent’s address of residence.
Standardized toxicology screening for fentanyl implemented by Cook County Medical Examiner’s office.
Figure 4. Number of opioid-related overdose deaths by quarter and opioid type – Chicago, 2015-2016
8
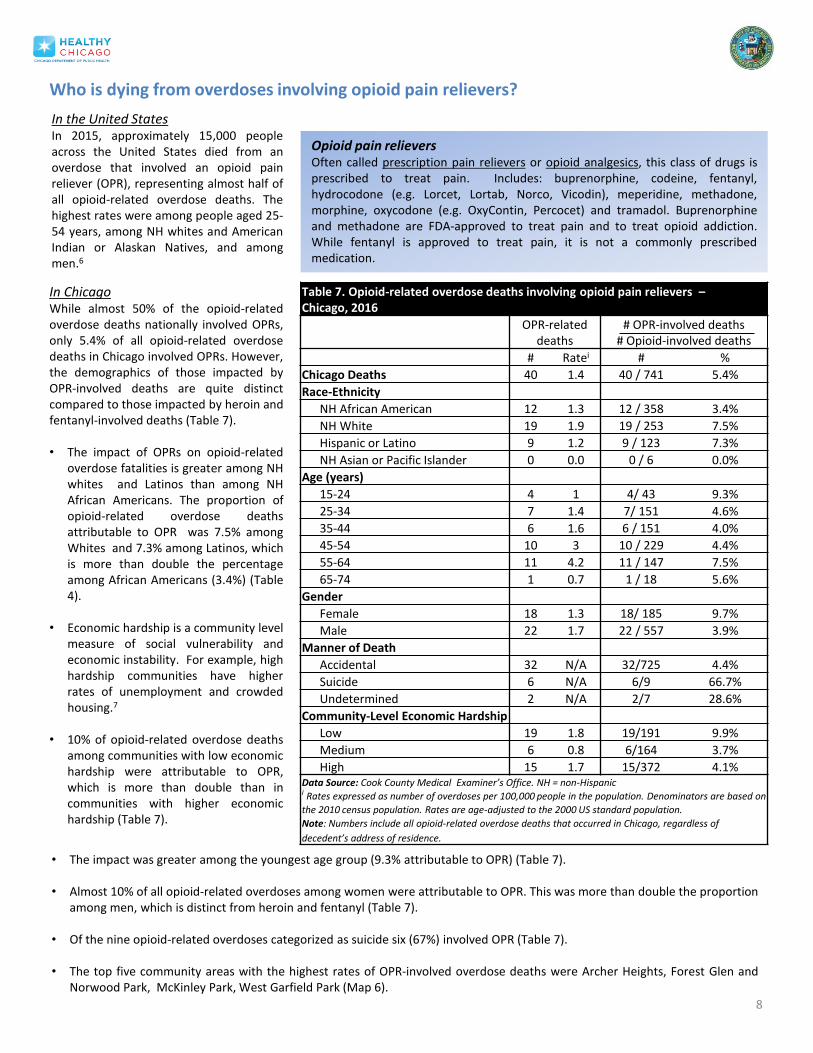
Who is dying from overdoses involving opioid pain relievers?
Table 7. Opioid-related overdose deaths involving opioid pain relievers – Chicago, 2016
OPR-related deaths
# OPR-involved deaths # Opioid-involved deaths
# Ratei # %
Chicago Deaths 40 1.4 40 / 741 5.4%
Race-Ethnicity
NH African American 12 1.3 12 / 358 3.4%
NH White 19 1.9 19 / 253 7.5%
Hispanic or Latino 9 1.2 9 / 123 7.3%
NH Asian or Pacific Islander 0 0.0 0 / 6 0.0%
Age (years)
15-24 4 1 4/ 43 9.3%
25-34 7 1.4 7/ 151 4.6%
35-44 6 1.6 6 / 151 4.0%
45-54 10 3 10 / 229 4.4%
55-64 11 4.2 11 / 147 7.5%
65-74 1 0.7 1 / 18 5.6%
Gender
Female 18 1.3 18/ 185 9.7%
Male 22 1.7 22 / 557 3.9%
Manner of Death
Accidental 32 N/A 32/725 4.4%
Suicide 6 N/A 6/9 66.7%
Undetermined 2 N/A 2/7 28.6%
Community-Level Economic Hardship
Low 19 1.8 19/191 9.9%
Medium 6 0.8 6/164 3.7%
High 15 1.7 15/372 4.1% Data Source: Cook County Medical Examiner’s Office. NH = non-Hispanic i Rates expressed as number of overdoses per 100,000 people in the population. Denominators are based on
the 2010 census population. Rates are age-adjusted to the 2000 US standard population.
Note: Numbers include all opioid-related overdose deaths that occurred in Chicago, regardless of
decedent’s address of residence.
Opioid pain relievers Often called prescription pain relievers or opioid analgesics, this class of drugs is prescribed to treat pain. Includes: buprenorphine, codeine, fentanyl, hydrocodone (e.g. Lorcet, Lortab, Norco, Vicodin), meperidine, methadone, morphine, oxycodone (e.g. OxyContin, Percocet) and tramadol. Buprenorphine and methadone are FDA-approved to treat pain and to treat opioid addiction. While fentanyl is approved to treat pain, it is not a commonly prescribed medication.
In the United States In 2015, approximately 15,000 people across the United States died from an overdose that involved an opioid pain reliever (OPR), representing almost half of all opioid-related overdose deaths. The highest rates were among people aged 25-54 years, among NH whites and American Indian or Alaskan Natives, and among men.6
In Chicago While almost 50% of the opioid-related overdose deaths nationally involved OPRs, only 5.4% of all opioid-related overdose deaths in Chicago involved OPRs. However, the demographics of those impacted by OPR-involved deaths are quite distinct compared to those impacted by heroin and fentanyl-involved deaths (Table 7). • The impact of OPRs on opioid-related
overdose fatalities is greater among NH whites and Latinos than among NH African Americans. The proportion of opioid-related overdose deaths attributable to OPR was 7.5% among Whites and 7.3% among Latinos, which is more than double the percentage among African Americans (3.4%) (Table 4).
• Economic hardship is a community level measure of social vulnerability and economic instability. For example, high hardship communities have higher rates of unemployment and crowded housing.7
• 10% of opioid-related overdose deaths among communities with low economic hardship were attributable to OPR, which is more than double than in communities with higher economic hardship (Table 7).
• The impact was greater among the youngest age group (9.3% attributable to OPR) (Table 7). • Almost 10% of all opioid-related overdoses among women were attributable to OPR. This was more than double the proportion
among men, which is distinct from heroin and fentanyl (Table 7).
• Of the nine opioid-related overdoses categorized as suicide six (67%) involved OPR (Table 7).
• The top five community areas with the highest rates of OPR-involved overdose deaths were Archer Heights, Forest Glen and Norwood Park, McKinley Park, West Garfield Park (Map 6).
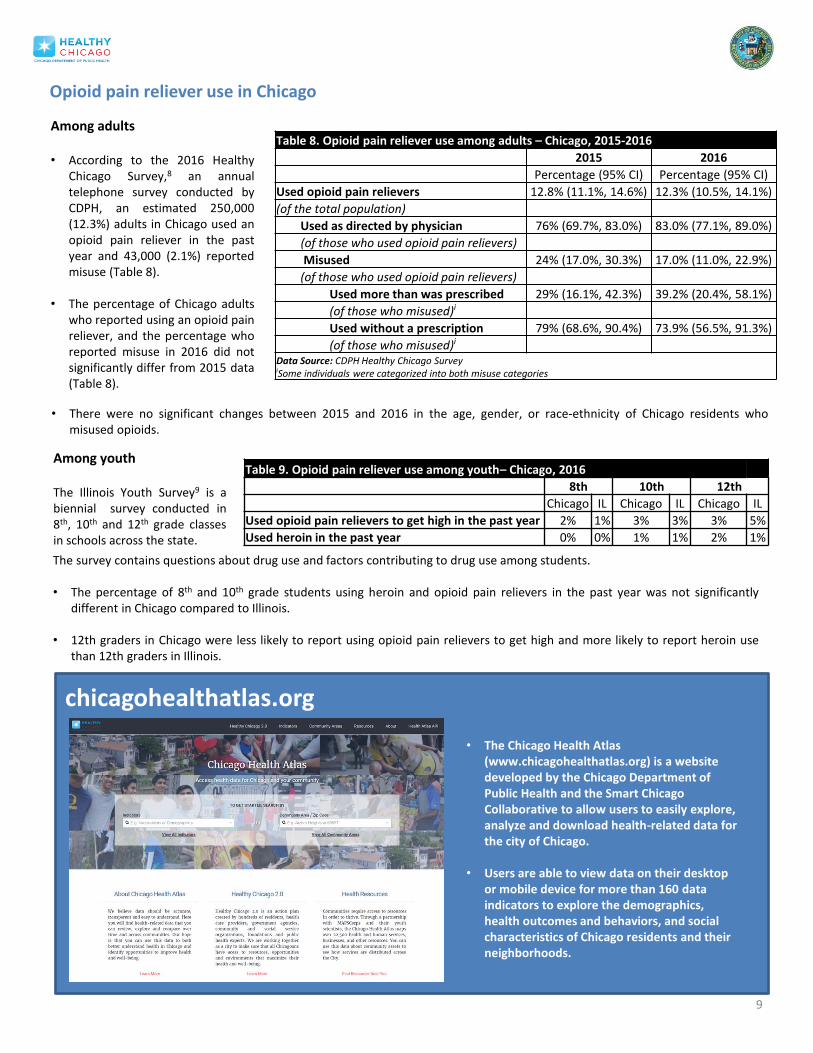
Opioid pain reliever use in Chicago
Among adults • According to the 2016 Healthy
Chicago Survey,8 an annual telephone survey conducted by CDPH, an estimated 250,000 (12.3%) adults in Chicago used an opioid pain reliever in the past year and 43,000 (2.1%) reported misuse (Table 8).
• The percentage of Chicago adults
who reported using an opioid pain reliever, and the percentage who reported misuse in 2016 did not significantly differ from 2015 data (Table 8).
Table 8. Opioid pain reliever use among adults – Chicago, 2015-2016
2015 2016
Percentage (95% CI) Percentage (95% CI)
Used opioid pain relievers 12.8% (11.1%, 14.6%) 12.3% (10.5%, 14.1%)
(of the total population)
Used as directed by physician 76% (69.7%, 83.0%) 83.0% (77.1%, 89.0%)
(of those who used opioid pain relievers)
Misused 24% (17.0%, 30.3%) 17.0% (11.0%, 22.9%)
(of those who used opioid pain relievers)
Used more than was prescribed 29% (16.1%, 42.3%) 39.2% (20.4%, 58.1%)
(of those who misused)i
Used without a prescription 79% (68.6%, 90.4%) 73.9% (56.5%, 91.3%)
(of those who misused)i Data Source: CDPH Healthy Chicago Survey iSome individuals were categorized into both misuse categories
9
Table 9. Opioid pain reliever use among youth– Chicago, 2016
8th 10th 12th
Chicago IL Chicago IL Chicago IL
Used opioid pain relievers to get high in the past year 2% 1% 3% 3% 3% 5%
Used heroin in the past year 0% 0% 1% 1% 2% 1%
• There were no significant changes between 2015 and 2016 in the age, gender, or race-ethnicity of Chicago residents who
misused opioids.
Among youth The Illinois Youth Survey9 is a biennial survey conducted in 8th, 10th and 12th grade classes in schools across the state.
The survey contains questions about drug use and factors contributing to drug use among students. • The percentage of 8th and 10th grade students using heroin and opioid pain relievers in the past year was not significantly
different in Chicago compared to Illinois.
• 12th graders in Chicago were less likely to report using opioid pain relievers to get high and more likely to report heroin use than 12th graders in Illinois.
• The Chicago Health Atlas (www.chicagohealthatlas.org) is a website developed by the Chicago Department of Public Health and the Smart Chicago Collaborative to allow users to easily explore, analyze and download health-related data for the city of Chicago.
• Users are able to view data on their desktop or mobile device for more than 160 data indicators to explore the demographics, health outcomes and behaviors, and social characteristics of Chicago residents and their neighborhoods.
chicagohealthatlas.org
10
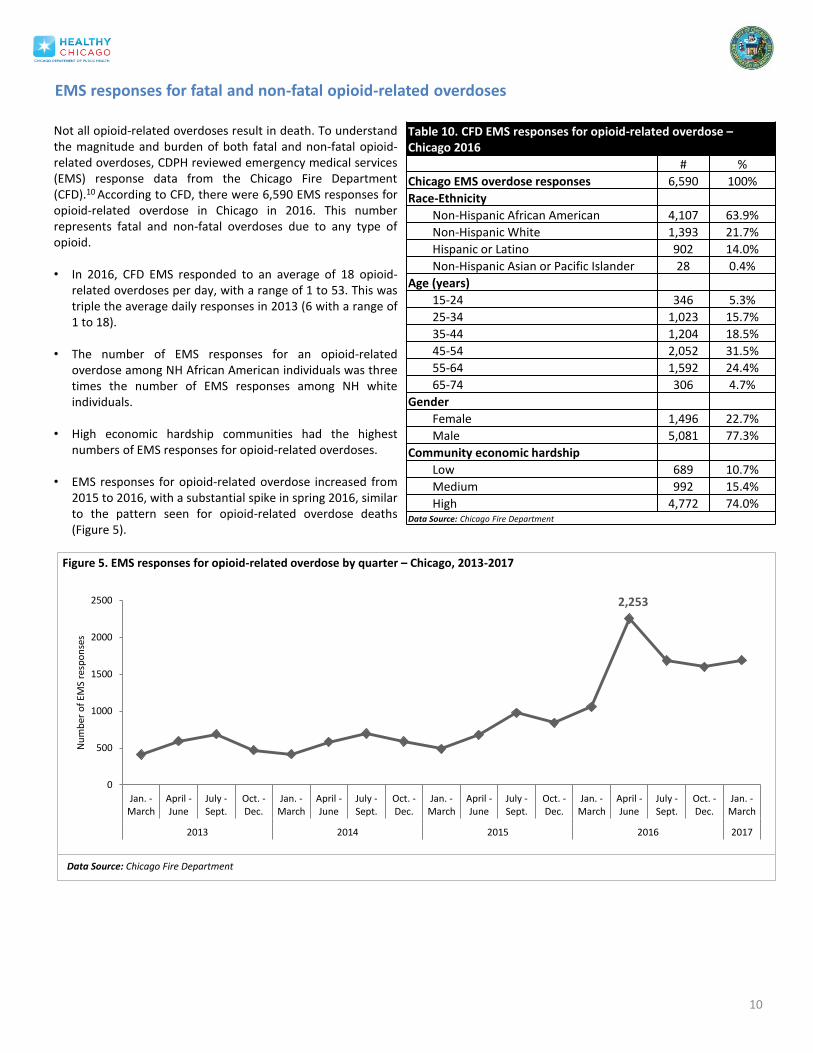
Table 10. CFD EMS responses for opioid-related overdose – Chicago 2016
# %
Chicago EMS overdose responses 6,590 100%
Race-Ethnicity
Non-Hispanic African American 4,107 63.9%
Non-Hispanic White 1,393 21.7%
Hispanic or Latino 902 14.0%
Non-Hispanic Asian or Pacific Islander 28 0.4%
Age (years)
15-24 346 5.3%
25-34 1,023 15.7%
35-44 1,204 18.5%
45-54 2,052 31.5%
55-64 1,592 24.4%
65-74 306 4.7%
Gender
Female 1,496 22.7%
Male 5,081 77.3%
Community economic hardship
Low 689 10.7%
Medium 992 15.4%
High 4,772 74.0% Data Source: Chicago Fire Department
Not all opioid-related overdoses result in death. To understand the magnitude and burden of both fatal and non-fatal opioid-related overdoses, CDPH reviewed emergency medical services (EMS) response data from the Chicago Fire Department (CFD).10 According to CFD, there were 6,590 EMS responses for opioid-related overdose in Chicago in 2016. This number represents fatal and non-fatal overdoses due to any type of opioid. • In 2016, CFD EMS responded to an average of 18 opioid-
related overdoses per day, with a range of 1 to 53. This was triple the average daily responses in 2013 (6 with a range of 1 to 18).
• The number of EMS responses for an opioid-related
overdose among NH African American individuals was three times the number of EMS responses among NH white individuals.
• High economic hardship communities had the highest numbers of EMS responses for opioid-related overdoses.
• EMS responses for opioid-related overdose increased from 2015 to 2016, with a substantial spike in spring 2016, similar to the pattern seen for opioid-related overdose deaths (Figure 5).
EMS responses for fatal and non-fatal opioid-related overdoses
2,253
0
500
1000
1500
2000
2500
Jan. -March
April -June
July -Sept.
Oct. -Dec.
Jan. -March
April -June
July -Sept.
Oct. -Dec.
Jan. -March
April -June
July -Sept.
Oct. -Dec.
Jan. -March
April -June
July -Sept.
Oct. -Dec.
Jan. -March
2013 2014 2015 2016 2017
Nu
mb
er o
f EM
S re
spo
nse
s
Figure 5. EMS responses for opioid-related overdose by quarter – Chicago, 2013-2017
Data Source: Chicago Fire Department

11 Data Source: Chicago Fire Department and US Census Bureau Note: Addresses and zip codes are geocoded to location of incident regardless of address of residence. Some zip codes are aggregated to account for changes in boundaries and low population size.
Zip code # EMS responses
Map 7. EMS responses for fatal and non-fatal opioid-related overdose by zip code of incident – Chicago, 2016
Top five Chicago zip codes:
60624 (Austin, E/W Garfield Park, North Lawndale, and Humboldt Park): 864
60651 (Austin, Humboldt Park, West Town): 715 60644 (Austin West Garfield Park): 494 60612 (Near West Side, West Town, East Garfield Park,
Humboldt Park, North Lawndale): 492 60623 (Brighton Park, N/S Lawndale): 309
Lowest five Chicago zip codes:
60631 (Edison Park, Jefferson Park, Norwood Park): 8 60656 (Jefferson Park, Norwood Park): 12 60655 (Beverly, Morgan Park, Mount Greenwood):14 60659 (Forest Glen, Lincoln Square, North Park, West Ridge): 15 60707,60635 (Austin, Belmont Cragin, Montclare): 16
In 2016, CFD EMS responded to 6,590 opioid-related overdoses occurring throughout all Chicago communities.
Reported by Tamara Rushovich,1 Elizabeth Salisbury-Afshar,1 Ponni Arunkumar,2 Mark Kiely,3 Steven Aks,4 Allison Arwady,1 Nikhil Prachand1 1 Chicago Department of Public Health, 2 Cook County Medical Examiner’s Office, 3 Chicago Fire Department, 4 Cook County Health and Hospital System
References
1 Cook County Medical Examiner’s Office. 2 Chicago Department of Public Health. Epidemiology Brief: Characterizing Opioid Use, Misuse, and Overdose in Chicago, IL, 2015. June 2017 (https://www.cityofchicago.org/content/dam/city/depts/cdph/CDPH/Healthy%20Chicago/ChicagoOpioid Brief3_6162017.pdf) 3 The Cook County Medical Examiner’s office assigns race and ethnicity classifications based on clarification and communication with the decedent's family (when possible). 4 DEA Chicago Field Division. The Opioid Threat in the Chicago Field Division. DEA Intelligence Report; June 2017. 5 Centers for Disease Control and Prevention. What is fentanyl? National Center for Injury Prevention and Control, Division of Unintentional Injury Prevention; 2017 (https://www.cdc.gov/drugoverdose/opioids/fentanyl.html). (Accessed September 20, 2017) 6 Centers for Disease Control and Prevention. Prescription Opioid Overdose Data. August 1, 2017. (https://www.cdc.gov/drugoverdose/data/overdose.html) (Accessed October 23, 2017). 7 Lisa M. Montiel, Richard P. Nathan, and David J. Wright. An Update on Urban Hardship. The Nelson A Rockefeller Institute of Government. 2004 (http://rockinst.org/pdf/cities_and_neighborhoods/2004-08-an_update_on_urban_hardship.pdf) 8 Healthy Chicago Survey (2016): HCS is a random digit dial telephone survey conducted annually by the Chicago Department of Public Health and Abt SRBI of all non-institutionalized adults over age 18 in Chicago, IL. Data are weighted to represent the household population of adults 18 years of age and older who reside in the City of Chicago. 9 Center for Prevention Research and Development. (2017). Illinois Youth Survey 2016 Frequency Report: City of Chicago. Champaign, IL: CPRD, School of Social Work, University of Illinois (https://iys.cprd.illinois.edu/results/state). 10 Chicago Fire Department Emergency Medical Services. Data provided reflect all EMS responses where naloxone was administered and where there was indication of opioid involvement. Race and ethnicity data are recorded by the EMS staff on the scene.
Definitions
Common terms Opioid: Broad term that includes naturally occurring opiates, semi-synthetic and synthetic opioids. Opiate: Naturally occurring substances that are derived from opium. Classes of opioids Natural opiates: Drugs that are fully derived from opium; examples include morphine and codeine. Semi-synthetic opioids: Drugs that are derived from a combination of natural and synthetic opioids; examples include heroin, oxycodone, hydrocodone, hydromorphone, and oxymorphone. Synthetic opioids: Drugs that are created to work in a similar way as naturally occurring opiates but are completely man-made; examples include fentanyl, tramadol and methadone. Specific opioids Heroin: A highly addictive and illegally produced drug derived from morphine. Fentanyl: A highly potent synthetic opioid that is prescribed to treat severe pain. In the US, there has been an increase in the development and distribution of illegally produced fentanyl. Most of the fentanyl involved in overdose deaths is thought to be from an illicit source. Fentanyl is a common adulterant in heroin – often without the user’s knowledge. Methadone: A synthetic opioid that is FDA-approved to treat both pain and opioid use disorder. Opioid pain relievers: Often called prescription pain relievers or opioid analgesics, this class of drugs is prescribed to treat pain. Includes: buprenorphine, codeine, fentanyl, hydrocodone (e.g. Lorcet, Lortab, Norco, Vicodin), meperidine, methadone, morphine, oxycodone (e.g. OxyContin, Percocet) and tramadol. Buprenorphine and methadone are FDA-approved to treat pain, however are more commonly used for addiction treatment. While fentanyl is approved to treat pain, it is rarely prescribed.
12
Appendix
13
Additional information about overdose death data and categories of opioids Data were received directly from the medical examiner’s office. All cases labeled “morphine,” “opiate,” or “opioid” were re-reviewed with the medical examiner. The medical examiner re-reviewed the toxicology report, the police review, and the case history to determine the specific opioids involved in the death. Ultimately, 103 cases of the opioid-related overdose deaths that occurred in 2016 were re-reviewed and about 75% were re-categorized as heroin. The remaining 25% were categorized as unknown opioid, unknown prescription opioid, morphine, heroin, fentanyl, codeine, or deemed not an opioid-related overdose and removed. Heroin-involved deaths: 487 deaths were categorized as heroin-related deaths. 250 overdose deaths involved heroin alone, 204 involved heroin and fentanyl combined, 17 involved heroin and methadone, 10 involved heroin, methadone and fentanyl, 3 involved heroin and an opioid pain reliever, 1 involved heroin, fentanyl and an opioid pain reliever, 1 involved heroin, methadone, and an opioid pain reliever, and 1 involved heroin, methadone, fentanyl, and an opioid pain reliever. This category includes two types of deaths:
• Deaths labeled heroin on the death certificate • Deaths originally labeled “opiate” or “morphine” (morphine is a breakdown product of heroin) but determined to be
likely due to heroin after re-reviewing the toxicology reports, circumstances of death, and history with the Cook County Medical Examiner.
Fentanyl-involved deaths: 420 deaths were categorized as involving fentanyl or fentanyl analogs by the Cook County Medical Examiner. 196 overdose deaths involved only fentanyl, 204 involved fentanyl and heroin, 10 involved fentanyl, methadone and heroin, 6 involved fentanyl and an opioid pain reliever, 2 involved fentanyl and methadone, 1 involved fentanyl, heroin, and an opioid pain reliever, and 1 involved heroin, methadone, fentanyl, and an opioid pain reliever. Opioid pain reliever-involved deaths: 40 deaths were categorized an involving an opioid pain reliever. The drugs found were: buprenorphine, codeine , hydrocodone, hydromorphone, meperidine, morphine, oxycodone , tramadol, and unknown prescription opiates. The morphine-related deaths included in this category were determined by the medical examiner’s office to be more likely related to an actual morphine overdose rather than a heroin metabolite. 27 overdose deaths involved only opioid pain relievers, 3 involved heroin and opioid pain relievers, 6 involved fentanyl and opioid pain relievers, 1 involved methadone and opioid pain relievers, 1 involved heroin, methadone, and opioid pain relievers, 1 involved heroin, fentanyl, and opioid pain relievers and 1 involved heroin, fentanyl, methadone, and opioid pain relievers. Methadone-involved deaths: 48 deaths were categorized as methadone-related overdose. 16 overdose deaths involved methadone only, 17 involved methadone and heroin, 10 involved methadone, heroin and fentanyl, 2 involved methadone and fentanyl, 1 involved methadone and an opioid pain reliever, 1 involved methadone, an opioid pain reliever and heroin, 1 involved methadone, heroin, fentanyl, and an opioid pain reliever. Unknown opioid-involved deaths: 3 deaths were identified as “opiate” deaths where no further information was available. Typically, these were cases where the individual died in a hospital setting where opiates had been confirmed by hospital testing, but it was no longer possible for the medical examiner’s office to send out confirmatory toxicology testing to determine the type of opiate that had been involved(because of the length of time between drug use and eventual death).
General Resources for Opioid Addiction:
Substance Abuse and Mental Health Services Administration (SAMHSA) National Helpline: 800.662.HELP(4357)
For SAMHSA’s Behavioral Health Treatment Services Locator click HERE
For questions about medications, call the Illinois Poison Center at 800.222.1222
For information about safe disposal of medications click HERE
IL Department of Human Services Consumer (DHS) Hotline: 866.213.0548