epl 0000835 article
TRANSCRIPT
8/18/2019 EPL 0000835 Article
http://slidepdf.com/reader/full/epl-0000835-article 1/13
1. Introduction
Since their origin in the 1930s, cellular plastics or
polymeric foams have received wide success in
industrial and consumer applications due to the low
material costs, high strength-to-weight ratios, widerange of properties, and ease of processing. More-
over, these materials are particularly attractive
since they can be produced with average cell sizes
ranging from few microns to hundreds of microns.
For any given polymer, the use of different blowing
agents and process conditions can yield ‘new mate-
rials’ with different densities, structures, and prop-
erties.
Foaming consists of generating tiny gas bubbles in
the polymer melt phase in order to produce light-weight materials without sacrificing mechanical
and physical properties of the polymer. Gas bub-
bles can be generated by means of physical or
chemical blowing agents. The final foam products
usually possess better insulation properties, as well
as higher degrees of impact resistance with respectto the starting material, thanks to the presence of
the gas bubbles in the polymer melt [1].
There are many types of polymer foaming
processes, such as foam extrusion, foam injection
molding, compression molding, and micro-foaming
[2, 3]. The final foam density depends on the origi-
nal gas loading, the gas losses to the environment,
and the foam expansion at quenching. The cell size
and the cell size distribution depend on the inten-
sity and kinetics of nucleation, on the characteris-tics of the bubble growth processes following
84
*Corresponding author, e-mail: [email protected]
© BME-PT and GTE
Theoretical and experimental study of foaming process with
chain extended recycled PET
I. Coccorullo* , L. Di Maio, S. Montesano, L. Incarnato
Department of Chemical and Food Engineering, University of Salerno, via Ponte don Melillo,
I-84084 Fisciano (Salerno), Italy
Received 31 October 2008; accepted in revised form 30 December 2008
Abstract. The theoretical and experimental study of a thermoplastic polymer foaming process is presented. Industrial
scraps of PET were used for the production of foamed sheets. The process was performed by making use of a chemical
blowing agent (CBA) in the extrusion process. Due to the low intrinsic viscosity of the recycled PET, a chain extender was
also used in order to increase the molecular weight of the polymer matrix. Pyromellitic dianhydride (PMDA) and Hydro-
cerol CT 534 were chosen as chain extender and CBA, respectively. The reactive extrusion and foaming were performed in
a two step process.
Rheological characterization was carried out on PET samples previously treated with PMDA, as well as the morphological
study was performed to define the cellular structure of the foams produced. Moreover, in order to predict the morphology
of the foam, a non isothermal model was developed by taking into account both mass transfer phenomenon and viscous
forces effect. Model results were compared with experimental data obtained analyzing the foamed samples. The model wasvalidated in relation to working conditions, chemical blowing agent percentage and initial rheological properties of recy-
cled polymer. A pretty good agreement between experimental and calculated data was achieved.
Keywords: processing technologies, modeling and simulations, recycling, industrial applications
eXPRESS Polymer Letters Vol.3, No.2 (2009) 84–96
Available online at www.expresspolymlett.com
DOI: 10.3144/expresspolymlett.2009.12
8/18/2019 EPL 0000835 Article
http://slidepdf.com/reader/full/epl-0000835-article 2/13
nucleation, and on the degree of cell wall collaps-
ing, or cell coalescence, during expansion. Since
the performance of foamed polymer is strongly
related to many aspects of bubble growth, it is cru-
cial to understand and control the bubble growth
during the melt processing [1].
In the last few years the production of poly(ethyl-
ene terephthalate) (PET) foamed items, particularly
sheets for insulating applications, is encountering a
rising interest. Moreover, by the contrast to the
commonly used thermoplastic resins, attention was
paid to recycled materials [4, 5]. In order to increase
the polymer viscosity and to enhance the foamabil-
ity of recycled PET, various techniques have been
investigated, including chain extension by reactive
extrusion [4–10].The results obtained with this technique are encour-
aging since it allows to perform in a single step the
rheological upgrading of recycled polymer and
foaming process.
However, in recent years the quality control require-
ments for plastic foamed products have become
increasingly stringent. Therefore, researchers have
attempted to optimize the foaming processes in
order to produce high quality final products.
One of the most used methods for the optimizationof the manufacturing process, as well as final prod-
uct quality is numerical modeling: a large number
of mathematical models for bubble growth were
presented in the literature [11–21].
Some models have been written for bubble growth
assumed to be governed by mass transfer alone,
while others assumed momentum transfer alone.
Using an integral method, the combination of these
phenomena was presented by some authors. Exten-
sive reviews and references can be found in a
monograph edited by Lee and Ramesh [22].
The goal of this work is twofold:
– starting from preliminary results obtained in a
previous work [7], the first goal of this work is to
improve the process of extrusion foaming by
chemical blowing agent (CBA) in order to pro-
duce high density foams from PET industrial
scraps with a very low viscosity;
– the second goal of this work is to develop a sim-
ple and useful tool which can help the companies
in choosing foaming conditions without per-
forming complicated laboratory tests. With this
aim, according to literature indications [11, 14,
16], the growth of a spherical bubble in a poly-
meric liquid has been theoretically studied by
taking into account both mass transfer phenome-
non and viscous forces effect. Moreover, with
the aim of predicting the morphology of the final
foam, a non isothermal model was developed.
Model results were compared with experimental
data obtained analyzing foamed sheets produced
in laboratory starting from industrial scraps of
PET and using a chemical blowing agent. The
model was validated in relation to working con-
ditions, chemical blowing agent percentage and
initial rheological properties of recycled poly-
mer.
2. Experimental
2.1. Materials
PET industrial scraps of low intrinsic viscosity,
coming from the fibre production of a national
company (Montefibre, Italy) were used. The chain
extender used in this work is the Pyromellitic dian-
hydride (PMDA) purchased by Aldrich. The chem-
ical modification, in the proportion required for the
aim of extrusion foaming, is achieved with very
low content of PMDA in PET; specifically three
levels of PMDA contents were analyzed: 0.25, 0.50and 0.75 weight% which proved to be the right
compromise to tailor the required rheological mod-
ification and suitable foaming processability of
PET. As far as the foam production is concerned,
the choice was directed to a chemical foaming
agent based process. In particular Hydrocerol
CT 534, kindly supplied by Clariant, was used as a
chemical foaming agent and specifically two levels
of Hydrocerol contents were analyzed: 0.30 and
0.50 weight%. It was provided in powder form, and
it is classified as an endothermic foaming agent,
recommended for PET foaming, based on a mixture
of both organic and inorganic foaming substances.
The gas yielding during the process is reported as
non toxic, presumably a blend of N2, CO2 and O2
with a very low level of water.
2.2. Reactive and foaming processes
The reactive processing of PET with the PMDA
and the foaming extrusion process were both per-
formed with a Brabender single screw extruder
( D = 20 mm, L / D = 20). The operation was accom-
plished in two steps.
85
Coccorullo et al. – eXPRESS Polymer Letters Vol.3, No.2 (2009) 84–96

8/18/2019 EPL 0000835 Article
http://slidepdf.com/reader/full/epl-0000835-article 3/13
The main operative conditions for chemical modifi-
cation and foaming process are reported in Table 1.
The recycled PET was tailored by the chain exten-
sion reaction with the PMDA. The modified poly-mers were then used for the foam production.
2.2.1. Reactive processing
The reactive processing of PET with the PMDA
was realized by making use of the mentioned
extruder equipped with a static mixer to allow the
required residence time for the reaction between
PET and PMDA. The temperature profile used for
the extrusion process was the following: extrudertemperature (2 zones) 280°C; mixer temperature
290°C; die temperature 270°C. In Table 1, the
working conditions for reactive process are
reported.
Modified PET was characterized in terms of rheo-
logical properties (flow curves, melt strength and
breaking stretching ratio (BSR)), mechanical prop-
erties (tensile and flexural properties) and densities.
Rheological properties
Rheological behavior of the modified PET was
carefully analyzed in this work because this param-
eter strongly affects the foam morphology.
The dynamic flow properties of the polymer matrix
produced by the chain extension process were
measured with a Rheometrics Dynamic Spectrome-
ter Mod. RDS-II (Rheometrics, Inc.) using a paral-
lel plates geometry (plate radius = 25 mm; gap =
2 mm). Frequency sweep tests (ω = 0.1÷100 rad/s
were made at 280°C at a constant strain amplitude
(10% strain) under a nitrogen gas purge in order to
minimize thermo-oxidative degradation phenom-
ena.
Rheological measurement in shear flow were per-
formed using a Capillary Extrusion Rheometer
(Bohlin Instruments) with a die radius of 1 mm and
a 16:1 length/diameter, equipped with a twin bore
for the Bagley correction. Viscosity measurements
were performed at 280°C within a shear rate range
of 20÷10 000 s–1. As the shear rate at the wall is
greater for pseudoplastic than for Newtonian fluids
at a given volumetric flow rate, the Rabinowitsch
corrections were applied in all cases. The Capillary
Extrusion Rheometer is equipped with a tensile
module. The measurements were performed using a
1 mm diameter capillary die ( L / D = 20) with the
tensile module situated about 20 cm from the extru-sion die. An extrusion temperature of 280°C and a
wall shear rate of 125 s–1 were used. The tests
allowed the determination of the melt strength and
the breaking stretching ratio (BSR). The samples
for testing were dried at 120°C in a vacuum oven
for 12 h.
Mechanical properties and densities
The tensile properties were analyzed according tothe standard ASTM D-638, the flexural ones were
analyzed according to the standard ASTM D-790
and the densities were measured according to the
standard ASTM D-1622.
2.2.2. Foaming process
The second step of processing consisted in the foam
production by extruding the modified PET with the
chemical blowing agent (CBA). Dry blends of
treated PET and CBA powder were fed to the previ-
ously described extruder apparatus, which was
operated without the static mixer. In Table 1 the
working conditions for the processes of polymer
foaming are reported. Further details on reactive
process and foaming can be found elsewhere [7].
Foam produced was characterized in terms of rheo-
logical properties (flow curves, melt strength and
BSR), mechanical properties (tensile and flexural
properties), densities and finally in terms of cell
size and cell size distribution by means of scanning
electronic microscopy.
86
Coccorullo et al. – eXPRESS Polymer Letters Vol.3, No.2 (2009) 84–96
Table 1. Operating conditions for chemical modification
and foaming process
Reactive extrusion process
Extruder temperature (hopper, barrel) [°C] 280, 280
Static mixer temperature [°C] 290
Die temperature [°C] 270Screw speed [revolution per minute] 040
Foam extrusion process
Extruder temperature (hopper, barrel) [°C] 270, 280
Die temperature [°C] 280
Extrusion die: slit die [mm2] 30×1
Screw speed [revolution per minute] 040
8/18/2019 EPL 0000835 Article
http://slidepdf.com/reader/full/epl-0000835-article 4/13
Cell size and cell distribution
Cell size and cell distribution was evaluated by
means of electronic scanning microscopy (SEM).
In order to evaluate cell size and cell distribution
from the SEM micrographs, a software for image
analysis was developed and implemented in Lab-
view (National Instruments). This software locates,
counts, and measures objects in a rectangular
search area. The software uses a threshold on the
pixel intensities to segment the objects from their
background. Optional filters give the capability to
ignore the objects smaller or larger than given
sizes. Other options allow rejecting the objects
touching the borders of the search area and ignoring
the holes that the segmentation process may create
in the objects. The segmented objects are thenlocated and measured. The software can also over-
lay on the image returned the position of the search
area, the centers and bounding boxes of the objects
detected.
3. Experimental results
3.1. Characterization of modified PET
Modified PET was characterized in terms of rheo-
logical properties (flow curves, melt strength andBSR), mechanical properties (tensile and flexural
properties) and densities. In Table 2 main experi-
mental results obtained analyzing modified PET
samples were reported.
3.1.1. Rheological properties
Rheological behavior of the modified PET was
carefully analyzed in this work because this param-
eter strongly affects the foam morphology.
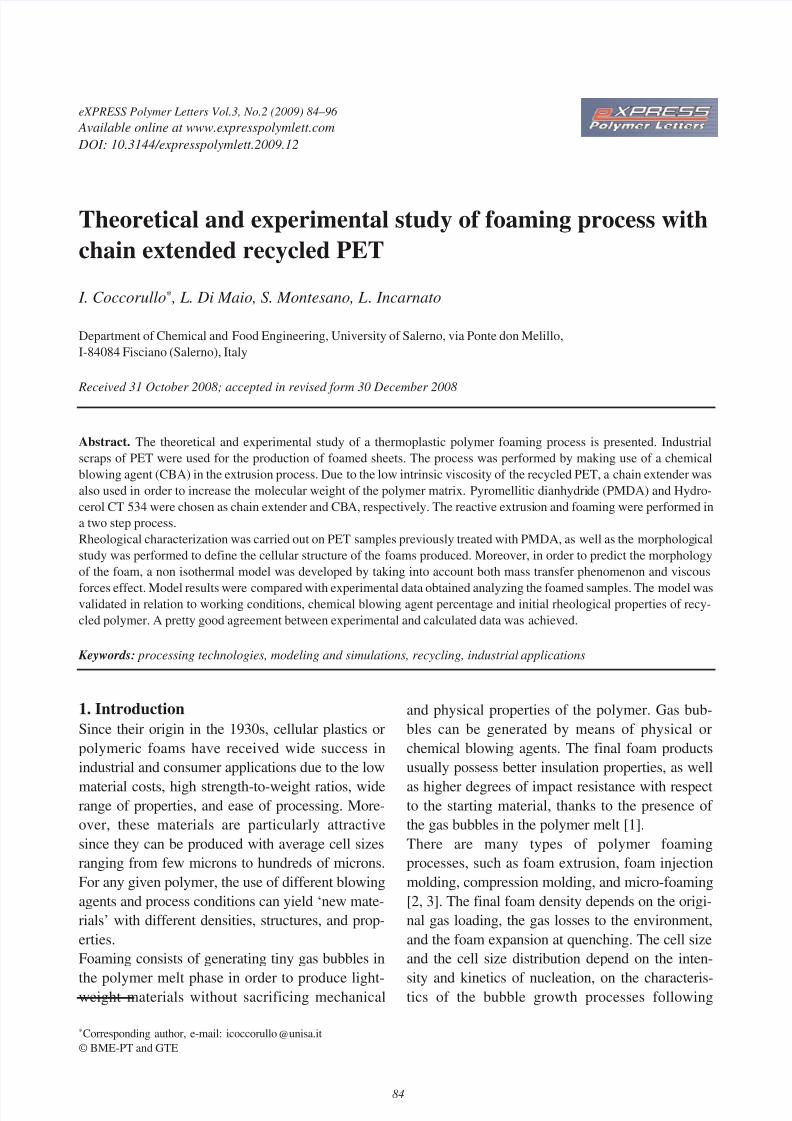
A significant increase in viscosity due to the use of
PMDA as chain extender in PET scraps (PET) is
evident from the flow curves reported in Figure 1.
These samples also exhibit a pronounced shear
thinning behavior particularly the blend PET+
PMDA 0.75%.
Values of zero shear viscosity, obtained analyzing
rheological data, are reported in Table 2 for unmod-
ified and modified PET samples.Moreover, in order to verify if the modified PET
possesses melt properties suitable for foaming
process, melt strength measurements were per-
formed and the results being reported in Table 2.
As it can be seen in Table 2, a sharp increase in
melt strength is encountered with increasing PMDA
content. Both the effects, the shear thinning behav-
iour and melt strength improvement, can be
ascribed to the structural changes occurring during
the chain extension process, i.e. the increase in M w,the broadening of M w / M n and branching phenom-
ena accomplished during the reactive extrusion.
Actually, too large values of the MS tend to inhibit
the bubble growth during the foaming process. As
reported later, the parameters so obtained allow in
all cases the production of foams, although with
some differences. However, the sample treated
with 0.50% of PMDA appears as the best accom-
plishment between the two parameters.
Since the polymer matrix was produced by a chain
extension process, we considered the viscosity
changing with the chain extender content using a
polynomial fittings curve to interpolate the experi-
mental data of η0 vs. %PMDA [11] using Equa-
tion (1):
87
Coccorullo et al. – eXPRESS Polymer Letters Vol.3, No.2 (2009) 84–96
Table 2. Main properties of the modified PET samples
Code %PMDA η0 [Pa·s]
(T=280°C)
Melt strength
[10–2 N]BSR
Density
[kg/m3]
η[dl/g]
PET 0 0108 not meas. not meas. 1410 0.49
PET_PMDA025 0.25 0543 0.005 080 1414 0.59
PET_PMDA050 0.50 1275 0.012 120 1425 0.67
PET_PMDA075 0.75 3355 0.054 092 1435 0.77
Figure 1. Flow curves for unmodified and modified PET
samples (T =280°C)
8/18/2019 EPL 0000835 Article
http://slidepdf.com/reader/full/epl-0000835-article 5/13
η0 (%PMDA) =
6577 (%PMDA)2 – 742.64 (%PMDA) + 160 (1)
Viscosity is related to temperature by an Arrhenius
expression [23] and its variation with thermal pro-
file is given by Equation (2):
(2)
where E a is an activation energy for viscous flow
(94 000 J/mol [23]), η0 and η0T r are the zero shear
viscosity corresponding to T and T r , respectively.
The effectiveness of the foaming process is
strongly dependent on the viscosity of the polymer
matrix and, consequently, on concentration of thechain extender. With an amount of PMDA lower
than 0.5% no foam can be obtained.
3.2. Characterization of foam
Foam produced was characterized in terms of rheo-
logical properties (flow curves, melt strength and
BSR), mechanical properties (tensile and flexural
properties), densities and finally in terms of cell
size and cell size distribution by means of scanning
electronic microscopy. In Table 3 main experimen-
tal results obtained analyzing foamed samples were
reported.
Data reported in Table 3 show that without signifi-
cantly sacrifice the mechanical and physical prop-
erties (see results of tensile modulus and strength)
it is possible to produce lightweight materials.
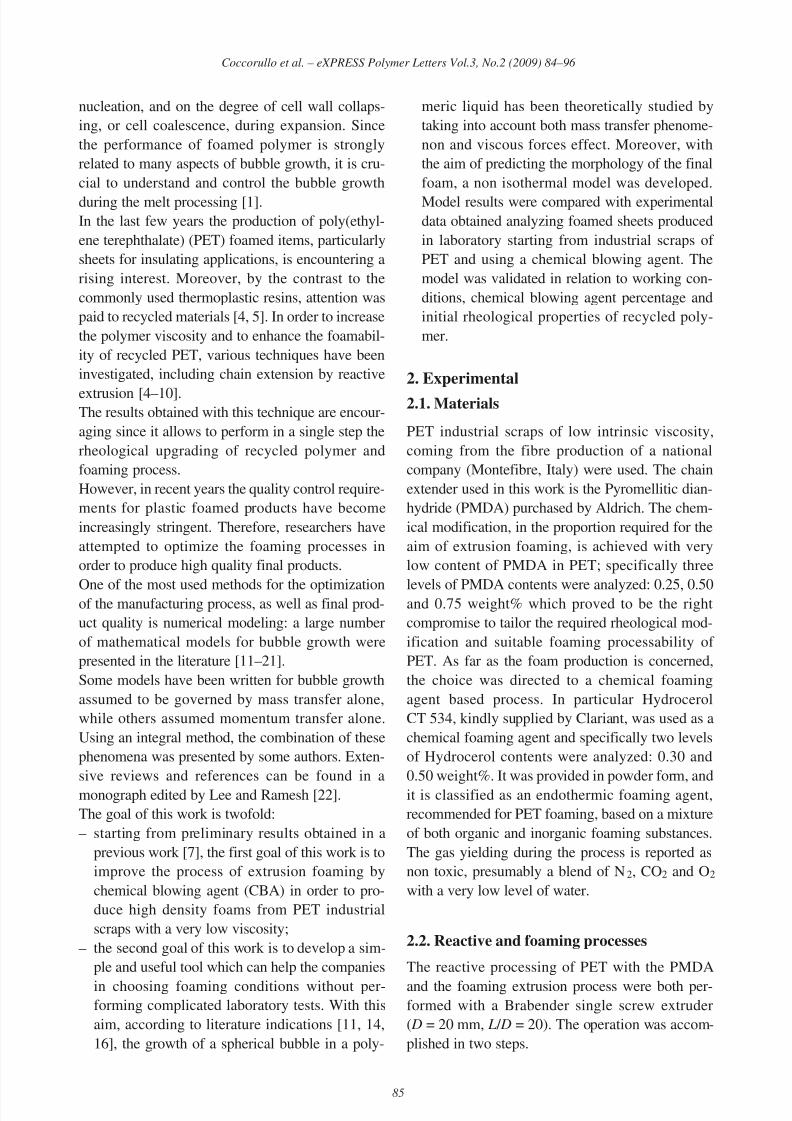
3.2.1. Cell size and cell distribution
The foamed strips obtained have a closed-cell
structure (see SEM micrographs). Closed-cell
foams are most suitable for thermal insulation and
are produced when the cell membranes are suffi-
ciently strong to withstand rupture at the maximum
foam rise.
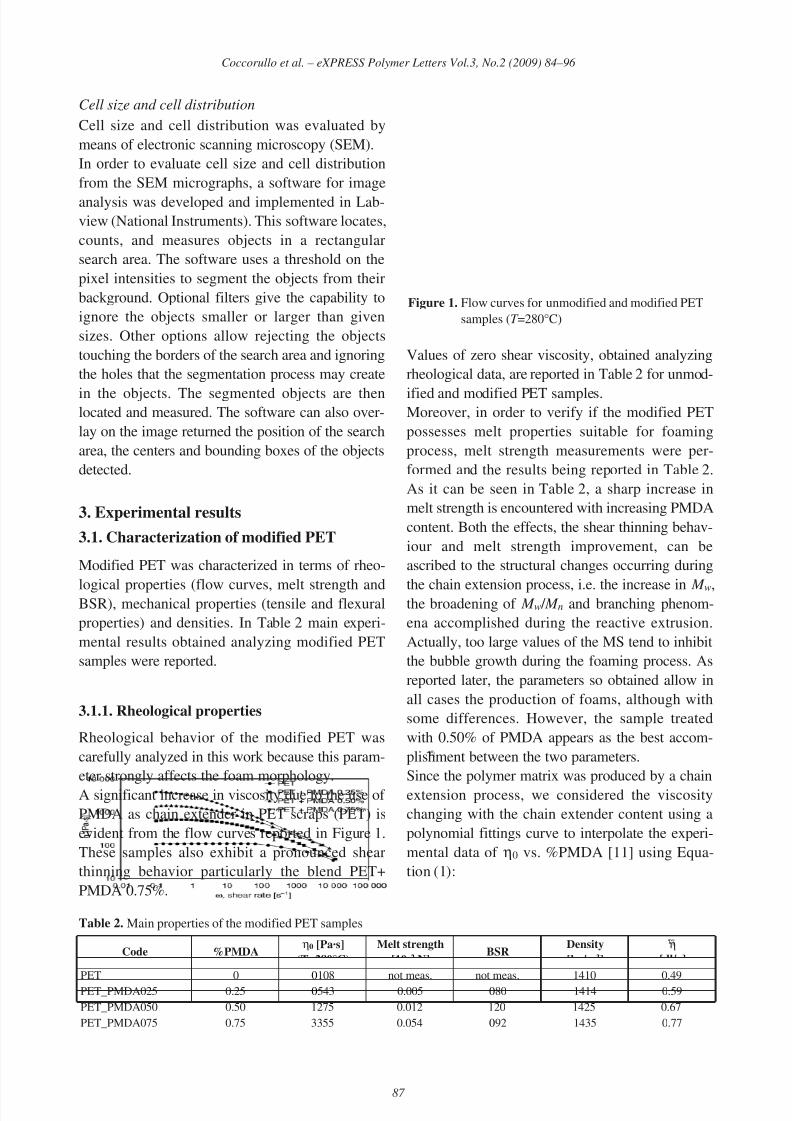
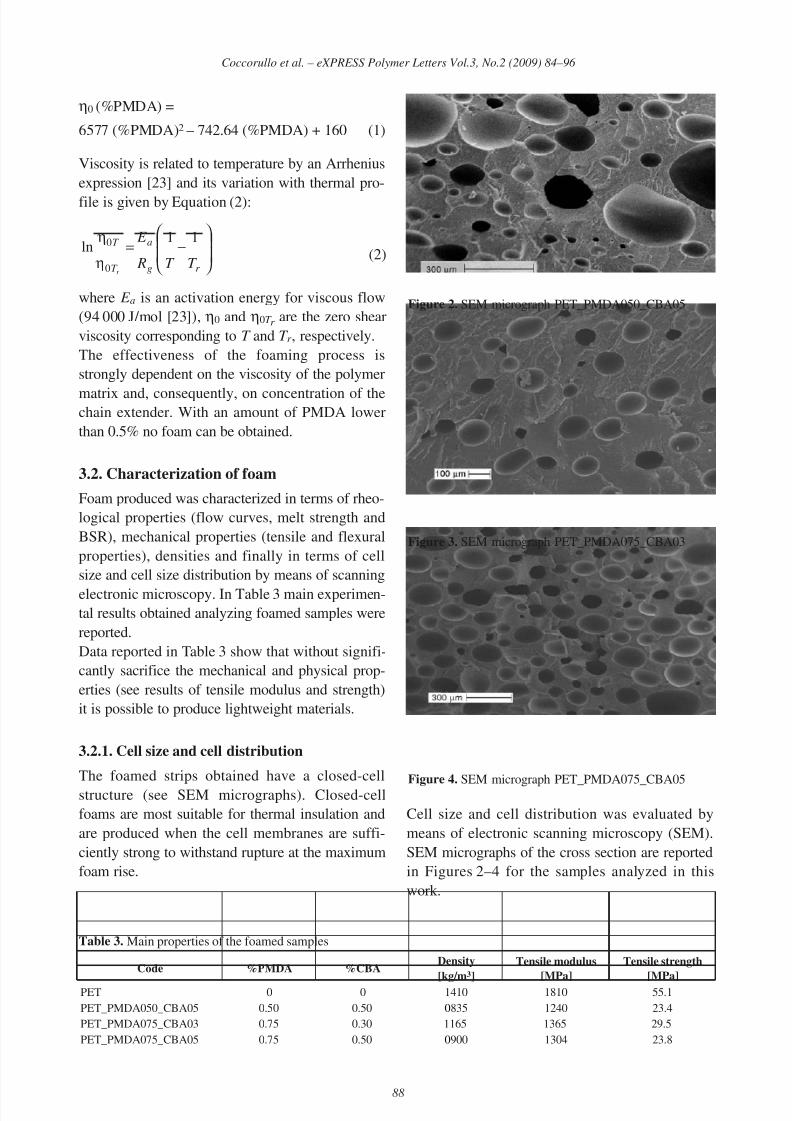
Cell size and cell distribution was evaluated by
means of electronic scanning microscopy (SEM).
SEM micrographs of the cross section are reported
in Figures 2–4 for the samples analyzed in this
work.
−=
η
η
r g
a
T
T
T T R
E
r
11ln
0
0
88
Coccorullo et al. – eXPRESS Polymer Letters Vol.3, No.2 (2009) 84–96
Figure 2. SEM micrograph PET_PMDA050_CBA05
Table 3. Main properties of the foamed samples
Code %PMDA %CBADensity
[kg/m3]
Tensile modulus
[MPa]
Tensile strength
[MPa]
PET 0 0 1410 1810 55.1
PET_PMDA050_CBA05 0.50 0.50 0835 1240 23.4
PET_PMDA075_CBA03 0.75 0.30 1165 1365 29.5
PET_PMDA075_CBA05 0.75 0.50 0900 1304 23.8
Figure 3. SEM micrograph PET_PMDA075_CBA03
Figure 4. SEM micrograph PET_PMDA075_CBA05

8/18/2019 EPL 0000835 Article
http://slidepdf.com/reader/full/epl-0000835-article 6/13
Bubble dimensions, as evaluated by the image
analysis software, are almost constant in the sam-
ple, confirming the assumption that temperature is
constant along thickness direction.
The cell size and cell distribution, reported in
Table 4, are strongly dependent, during the foam-
ing process, on the concentration of the chain
extender and, consequently, on the high viscosityof the polymer matrix.
4. Modeling
4.1. Bubble growth dynamics (Theoretical
background)
Consider a polymer melt that has a dissolved gas
concentration c0 in equilibrium with the gas at
some elevated pressure P B0. With the release of
pressure at t = 0, the solution becomes supersatu-rated, and nucleation and bubble growth begin. As
the bubble growth proceeds, the pressure inside the
bubble and the dissolved gas concentration at the
bubble surface decrease. With time, gas diffuses
into the bubble and a concentration gradient propa-
gates radially in the polymer melt. A schematic of
the bubble growth is shown in Figure 5. The radius
and the dissolved gas concentration are denoted by
R(t ) and c(r,t ).
In analyzing the bubbles growth process, the fol-
lowing assumptions can be made:
1. The bubble is spherically symmetric when it
nucleates and remains so for the entire period of
growth.
2. The gas pressure in the bubble P B(t ) is related to
the dissolved gas concentration at the bubble sur-
face c( R,t ) by the Henry law: c( R,t ) = K H P B(t ).
3. There are no chemical reactions during bubble
growth.
4. Gravitational effects and latent heat of solution
are neglected.
5. Inertial effects are neglected and the fluid isassumed to be incompressible and Newtonian.
6. The surface tension at the gas-liquid interface
has a constant value σ.
7. The effect of foam densities on thermal conduc-
tivity of gas-filled polymeric bubble system is
neglected.
The material properties such as polymer structure,
molecular weight and its distribution, crystallinity
and others are independent of the dissolved gas
concentration and are ignored.The neglect of inertia and the assumption of New-
tonian behavior is imposed because the fluids are
very viscous and the initial bubble growth rates are
very small. Nevertheless, Amon and Denson [13]
studied heat transfer analysis in polymer-gas sys-
tems in great detail. They found from reliable
empirical correlations that the effective thermal
conductivity of gas-filled polymeric bubble system
changes by no more than a few percentage points
over the whole range of foam densities. Moreover,
as for thermoplastic foam extrusion, growth occurs
in the molten-to-solid transition state. The polymer
is cooled from 280°C (die temperature) to 25°C
(ambient temperature) in a relatively short time:
since in these circumstances all physical properties
of the system undergo a rapid change, a transient
heat transfer problem is considered here.
4.2. Governing equations for the bubble
growth
In view of the above restrictions, the equation of
motion, integral mass (gas) balance over the bubble
and differential mass (dissolved gas) balance in the
89
Coccorullo et al. – eXPRESS Polymer Letters Vol.3, No.2 (2009) 84–96
Figure 5. Schematic of single bubble growth
Table 4. The cell size and cell distribution for samples ana-
lyzed in this work
SamplesN bubble
[N/mm3]
Cell radius
[µm]
PET_PMDA050_CBA05 ~110 44 ± 15
PET_PMDA075_CBA03 ~330 31 ± 10PET_PMDA075_CBA05 ~290 37 ± 15
8/18/2019 EPL 0000835 Article
http://slidepdf.com/reader/full/epl-0000835-article 7/13
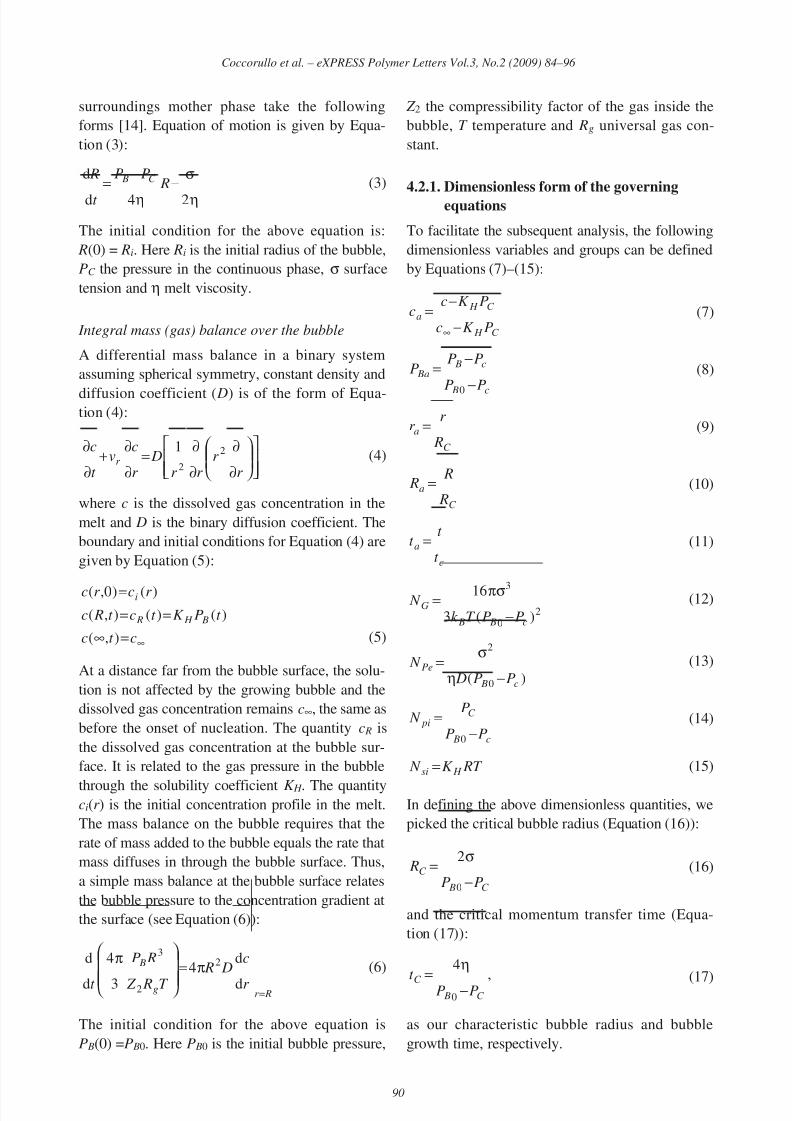
surroundings mother phase take the following
forms [14]. Equation of motion is given by Equa-
tion (3):
(3)
The initial condition for the above equation is:
R(0) = Ri. Here Ri is the initial radius of the bubble,
PC the pressure in the continuous phase, σ surface
tension and η melt viscosity.
Integral mass (gas) balance over the bubble
A differential mass balance in a binary system
assuming spherical symmetry, constant density and
diffusion coefficient ( D) is of the form of Equa-tion (4):
(4)
where c is the dissolved gas concentration in the
melt and D is the binary diffusion coefficient. The
boundary and initial conditions for Equation (4) are
given by Equation (5):
(5)
At a distance far from the bubble surface, the solu-
tion is not affected by the growing bubble and the
dissolved gas concentration remains c∞, the same as
before the onset of nucleation. The quantity c R is
the dissolved gas concentration at the bubble sur-
face. It is related to the gas pressure in the bubble
through the solubility coefficient K H . The quantityci(r ) is the initial concentration profile in the melt.
The mass balance on the bubble requires that the
rate of mass added to the bubble equals the rate that
mass diffuses in through the bubble surface. Thus,
a simple mass balance at the bubble surface relates
the bubble pressure to the concentration gradient at
the surface (see Equation (6)):
(6)
The initial condition for the above equation is
P B(0) =P B0. Here P B0 is the initial bubble pressure,
Z 2 the compressibility factor of the gas inside the
bubble, T temperature and Rg universal gas con-
stant.
4.2.1. Dimensionless form of the governing
equations
To facilitate the subsequent analysis, the following
dimensionless variables and groups can be defined
by Equations (7)–(15):
(7)
(8)
(9)
(10)
(11)
(12)
(13)
(14)
(15)
In defining the above dimensionless quantities, we
picked the critical bubble radius (Equation (16)):
(16)
and the critical momentum transfer time (Equa-
tion (17)):
(17)
as our characteristic bubble radius and bubble
growth time, respectively.
,
4
0 C BC PP
t
−
η
=
C B
C
PP R
−
σ=
0
2
RT K N H si
=
c B
C pi
PP
P N
−=
0
)( 0
2
c B
Pe
PP D
N
−η
σ=
20
3
)(3
16
c B B
G
PPT k N
−πσ=
c
a
t
t t =
C
a
R
R R =
C
a
R
r r =
c B
c B Ba
PP
PPP
−
−=
0
C H
C H a
PK c
PK cc
−
−=
∞
Rr g
B
r
c D R
T R Z
RP
t =
π=
π
d
d4
3
4
d
d 2
2
3
∞=∞==
=
ct c
t PK t ct Rc
r cr c
B H R
i
),(
)()(),(
)()0,(
∂
∂
∂
∂=
∂
∂+
∂
∂
r
r
r r
D
r
cv
t
c
r
2
2
1
η
σ−
η
−=
24d
d R
PP
t
R C B
90
Coccorullo et al. – eXPRESS Polymer Letters Vol.3, No.2 (2009) 84–96
8/18/2019 EPL 0000835 Article
http://slidepdf.com/reader/full/epl-0000835-article 8/13
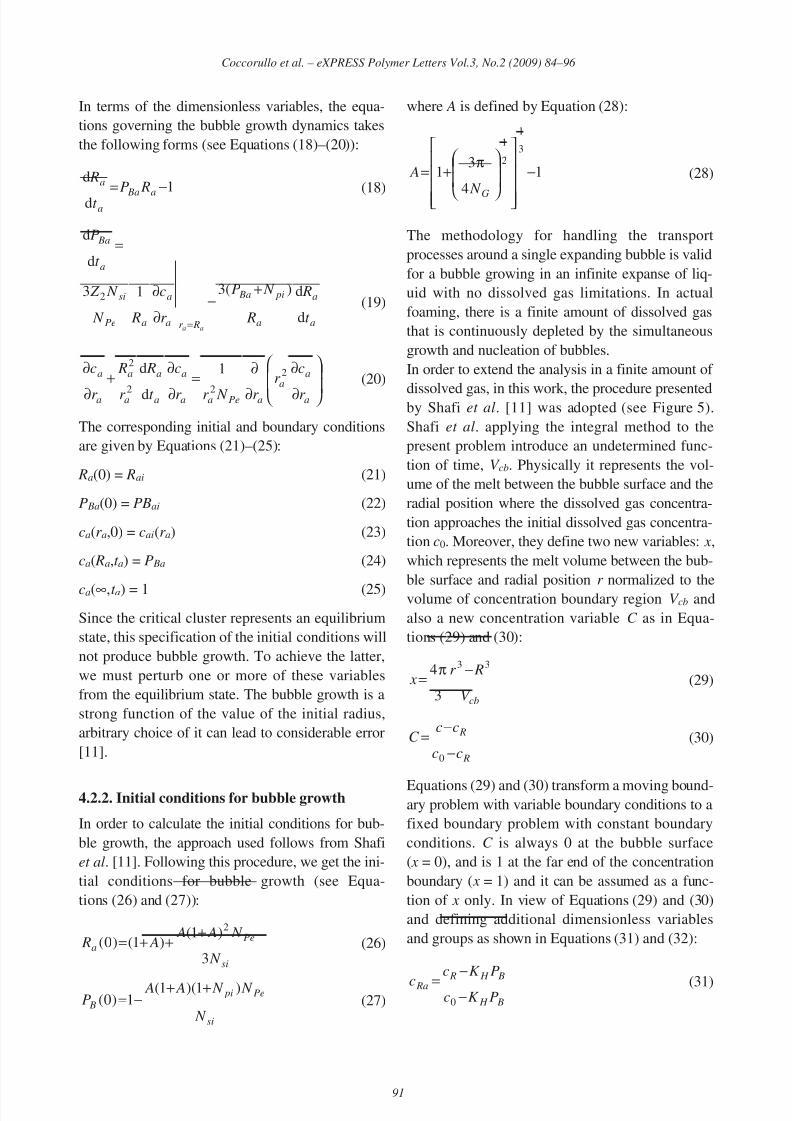
In terms of the dimensionless variables, the equa-
tions governing the bubble growth dynamics takes
the following forms (see Equations (18)–(20)):
(18)
(19)
(20)
The corresponding initial and boundary conditions
are given by Equations (21)–(25):
Ra(0) = Rai (21)
P Ba(0) = PBai (22)
ca(r a,0) = cai(r a) (23)
ca( Ra,t a) = P Ba (24)
ca(∞,t a) = 1 (25)
Since the critical cluster represents an equilibrium
state, this specification of the initial conditions will
not produce bubble growth. To achieve the latter,
we must perturb one or more of these variables
from the equilibrium state. The bubble growth is a
strong function of the value of the initial radius,
arbitrary choice of it can lead to considerable error
[11].
4.2.2. Initial conditions for bubble growth
In order to calculate the initial conditions for bub-
ble growth, the approach used follows from Shafi
et al. [11]. Following this procedure, we get the ini-
tial conditions for bubble growth (see Equa-
tions (26) and (27)):
(26)
(27)
where A is defined by Equation (28):
(28)
The methodology for handling the transport
processes around a single expanding bubble is valid
for a bubble growing in an infinite expanse of liq-
uid with no dissolved gas limitations. In actual
foaming, there is a finite amount of dissolved gas
that is continuously depleted by the simultaneous
growth and nucleation of bubbles.
In order to extend the analysis in a finite amount of
dissolved gas, in this work, the procedure presentedby Shafi et al. [11] was adopted (see Figure 5).
Shafi et al. applying the integral method to the
present problem introduce an undetermined func-
tion of time, V cb. Physically it represents the vol-
ume of the melt between the bubble surface and the
radial position where the dissolved gas concentra-
tion approaches the initial dissolved gas concentra-
tion c0. Moreover, they define two new variables: x ,
which represents the melt volume between the bub-
ble surface and radial position r normalized to the
volume of concentration boundary region V cb and
also a new concentration variable C as in Equa-
tions (29) and (30):
(29)
(30)
Equations (29) and (30) transform a moving bound-ary problem with variable boundary conditions to a
fixed boundary problem with constant boundary
conditions. C is always 0 at the bubble surface
( x = 0), and is 1 at the far end of the concentration
boundary ( x = 1) and it can be assumed as a func-
tion of x only. In view of Equations (29) and (30)
and defining additional dimensionless variables
and groups as shown in Equations (31) and (32):
(31) B H
B H R Ra
PK c
PK c
c −
−=
0
R
R
cc
ccC
−
−=
0
cbV
Rr x
33
3
4 −π=
1
4
31
3
1
2
1
−
π+=
G N
A
si
Pe pi
B
N
N N A AP
)1)(1(1)0(
++−=
si
Pe
a
N
N A A A R
3
)1()1()0(
2+++=
∂
∂
∂
∂=
∂
∂+
∂
∂
a
aa
aPeaa
a
a
a
a
a
a
a
r
cr
r N r r
c
t
R
r
R
r
c 2
22
21
d
d
a
a
a
pi Ba
Rr a
a
aPe
si
a
Ba
t
R
R
N P
r
c
R N
N Z
t
P
aa
d
d)(313
d
d
2 +
−∂
∂
=
=
1d
d−=
a Baa
a RPt
R
91
Coccorullo et al. – eXPRESS Polymer Letters Vol.3, No.2 (2009) 84–96
8/18/2019 EPL 0000835 Article
http://slidepdf.com/reader/full/epl-0000835-article 9/13
(32)
the equations governing the bubble growth dynam-
ics in terms of dimensionless quantities can berewritten by Equations (33)–(35):
(33)
(34)
(35)
With the initial conditions given by Equations (36)
and (37):
(36)
(37)
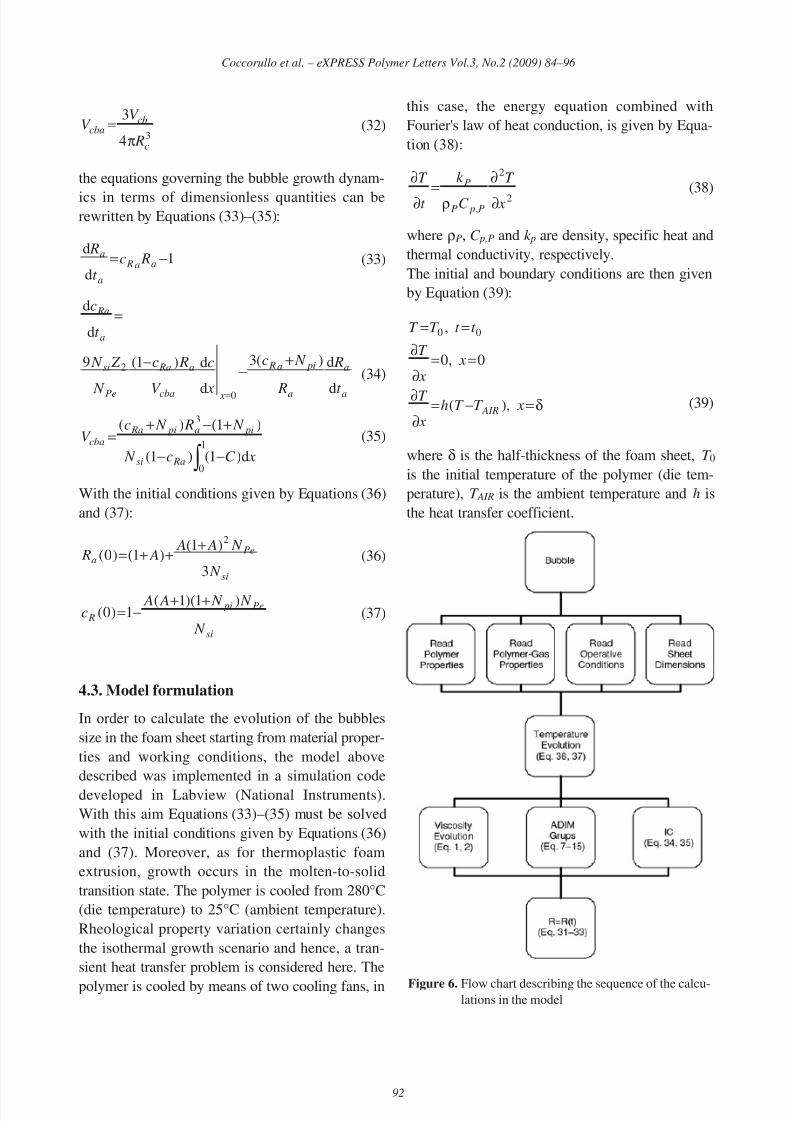
4.3. Model formulation
In order to calculate the evolution of the bubbles
size in the foam sheet starting from material proper-
ties and working conditions, the model above
described was implemented in a simulation code
developed in Labview (National Instruments).
With this aim Equations (33)–(35) must be solved
with the initial conditions given by Equations (36)
and (37). Moreover, as for thermoplastic foam
extrusion, growth occurs in the molten-to-solid
transition state. The polymer is cooled from 280°C
(die temperature) to 25°C (ambient temperature).
Rheological property variation certainly changes
the isothermal growth scenario and hence, a tran-
sient heat transfer problem is considered here. The
polymer is cooled by means of two cooling fans, in
this case, the energy equation combined with
Fourier's law of heat conduction, is given by Equa-
tion (38):
(38)
where ρP, C p,P and k p are density, specific heat and
thermal conductivity, respectively.
The initial and boundary conditions are then given
by Equation (39):
(39)
where δ is the half-thickness of the foam sheet, T 0
is the initial temperature of the polymer (die tem-
perature), T AIR is the ambient temperature and h is
the heat transfer coefficient.
δ=−=∂∂
==∂
∂
==
x T T h x
T
x x
T
t t T T
AIR ),(
0,0
, 00
2
2
, x
T
C
k
t
T
P pP
P
∂
∂
ρ=
∂
∂
si
Pe pi
R
N
N N A Ac
)1)(1(1)0(
++−=
si
Pe
a
N
N A A A R
3
)1()1()0(
2+++=
∫ −−
+−+=
1
0
3
d)1()1(
)1()(
x C c N
N R N cV
Rasi
pia pi Ra
cba
a
a
a
pia R
x cba
a Ra
Pe
si
a
Ra
t
R
R
N c
x
c
V
Rc
N
Z N
t
c
d
d)(3
d
d)1(9
d
d
0
2 +
−−
=
=
1d
d−= aa R
a
a Rct
R
34
3
c
cbcba
R
V V
π=
92
Coccorullo et al. – eXPRESS Polymer Letters Vol.3, No.2 (2009) 84–96
Figure 6. Flow chart describing the sequence of the calcu-lations in the model

8/18/2019 EPL 0000835 Article
http://slidepdf.com/reader/full/epl-0000835-article 10/13
A flow chart describing the sequence of the calcula-
tions is reported in Figure 6. In Table 5, the main
variables involved in the model are reported.
4.3.1. Solution methodology
The equations governing the bubble growth
dynamics are highly nonlinear and stiff. These
equations were solved using the Gear’s method.
The nonlinear equations are solved by Brown’s
method. The equations were solved using a finite
difference scheme.
It is worth mentioning that in the model adopted in
this work there are no involved adjustable parame-
ters so that the model starting from data of materi-
als properties and the operative conditions is able to
predict bubble dimensions.
5. Model results
Model developed in this work following the litera-
ture indications allows to calculate the evolution of
the temperature, of the bubble pressure and radius
starting from the operative conditions and material
properties (Tables 1 and 6). Consistently with
experimental data, with an amount of chain exten-
der lower that 0.5% according to the model theclusters are not sufficiently large compared to the
critical cluster in order to grow spontaneously to a
macroscopic bubble and no foam can be obtained.
In Figure 7, the calculated evolution of temperature
and bubble radius during the foaming process are
reported for PET_PMDA050_CBA05 and
PET_PMDA075_CBA05. Figures show that bub-
bles growth takes about one second, after this time
temperature become too low and viscosity too high.
In Figure 8, the calculated evolution of bubble
pressure and radius during the foaming process are
reported for PET_PMDA050_CBA05 and
PET_PMDA075_CBA05.
93
Coccorullo et al. – eXPRESS Polymer Letters Vol.3, No.2 (2009) 84–96
Table 5. Main variables involved in the model adopted in
this work
σ surface tension D binary diffusion coeffi-
cient
η melt viscosity Z 2 compressibility factor of
the gasK H solubility coeffi-
cient
Rg Universal gas constant
P B0 initial bubble pres-
sure
c∞ initial gas concentration
Ri initial radius of the
bubble
ci(r ) initial gas concentration
profile
R(t ) bubble radius c(r,t ) dissolved gas concentra-
tion
P B(t ) gas pressure in the
bubble
c( R,t )=c R dissolved gas concentra-
tion at the bubble sur-
face
PC Pressure in the con-
tinuous phase
V cb volume of the melt between the bubble surface and the
radial position where the dissolved gas concentration
approaches the initial dissolved gas concentration c0
Figure 7. Temperature profile for the bubble growth simulation of extrusion. a – PET_PMDA050_CBA05;
b – PET_PMDA075_CBA05
Table 6. Physical properties [23] and operative conditions
used in the model
Physical properties Operative conditions
PET specific heat C p 1130 J/(kg·K)
Thermal conductivity K 0.218 W/(m·K)
Activation energy for viscous flow E a 94 000 J/mol
Rheological reference temperature 553 K
Surface tension σ 0.0446 N/m
Diffusivity 3·10–12 m2 /s
Die pressure 1.5·106 Pa
Ambient pressure 1.01·105 Pa
Die temperature T 0 543 K

8/18/2019 EPL 0000835 Article
http://slidepdf.com/reader/full/epl-0000835-article 11/13
The bubble pressure start from a maximum and
decreases to a value close to the ambient pressure.
The evolution of the bubble radius for the samples
analyzed in this work was compared in Figure 9.
As it can be seen from the figure, the radius of the
bubbles in the sample coded as
PET_PMDA050_CBA05 is bigger than the one of
the bubbles in PET_PMDA075_CBA05. From fig-
ure the effect of the PMDA content is evident, in
fact, the bubble radius increases on decreasing of
the PMDA content: this is mainly due to the higher
melt strength (shown by the
PET_PMDA075_CBA05) which limits the growth
of the bubbles.
The comparison between experimental results and
model prediction for the bubble radius is reported
in Figure 10. Because at the moment only few
experimental data are available, literature data [25,
26] are also reported in figure. Moreover, the model
described in this work was adopted in order to cal-
culate the evolution of the bubble radius in litera-
ture experimental conditions and results were also
reported in figure. The satisfactorily agreement
between literature experimental data and model
predictions is a further validation of the model
adopted in this work.
In order to underline results achieved in this work,
the comparison between experimental results and
model prediction for the bubble radius for
PET_PMDA050_CBA05,
PET_PMDA075_CBA03,
PET_PMDA075_CBA05 is reported in Table 7.
Comparison shows that model seems to be able to
predict experimental data of bubble radius, even if,
at the moment only few experimental data are
available.
94
Coccorullo et al. – eXPRESS Polymer Letters Vol.3, No.2 (2009) 84–96
Figure 8. Pressure profile for the bubble growth simulation of extrusion foaming, a – PET_PMDA050_CBA05;
b – PET_PMDA075_CBA05
Figure 9. Evolution of the bubble radius for
PET_PMDA050_CBA05 and
PET_PMDA075_CBA05
Table 7. Comparison between experimental results and
model prediction for the bubble radius
SamplesExperimental
cell radius [µm]
Calculated
cell radius [µm]
PET_PMDA050_CBA05 44 ± 15 49
PET_PMDA075_CBA03 31 ± 10 33
PET_PMDA075_CBA05 37 ± 15 33
Figure 10. Comparison between experimental results and
model prediction for the bubble radius (litera-
ture data are also reported in figure)
8/18/2019 EPL 0000835 Article
http://slidepdf.com/reader/full/epl-0000835-article 12/13
The comparison between experimental data and
model prediction shown in Figure 10 is satisfacto-
rily, however, better results of prediction of the
evolution of the bubble radius during foaming
process could be achieved by means of a better rhe-
ological description, that is adopting more complex
models which better describe viscoelastic proper-
ties of the material.
5. Conclusions
In this work, the process of extrusion foaming by
chemical blowing agent (CBA) was improved in
order to produce high density foams from PET
industrial scraps with a very low viscosity. Due to
the low intrinsic viscosity of the recycled PET(IV = 0.48 dl/g), a chain extender was also used in
order to increase the molecular weight of the poly-
mer matrix. The reactive processing of PET and the
foaming extrusion process were both performed
with a Brabender single screw extruder. The opera-
tion was accomplished in two steps. The chemical
modification, in the proportion required for the aim
of extrusion foaming, is achieved with very low
content of PMDA in PET; specifically three levels
of PMDA contents were analyzed: 0.25, 0.50 and0.75 weight% which resulted to be the right com-
promise to tailor the required rheological modifica-
tion and suitable foaming processability of PET. As
far as the foam production is concerned, the choice
was directed to a chemical foaming agent based
process. In particular Hydrocerol CT 534 was used
as a chemical foaming agent and specifically two
levels of Hydrocerol contents were analyzed: 0.30
and 0.50 weight%.
Modified PET was characterized in terms of rheo-
logical properties (flow curves, melt strength and
BSR), mechanical properties (tensile and flexural
properties) and densities. Foam produced was char-
acterized in terms of rheological properties (flow
curves, melt strength and BSR), mechanical prop-
erties (tensile and flexural properties), densities and
finally in terms of cell size and cell size distribution
by means of scanning electronic microscopy.
Finally, the growth of a spherical bubble in a poly-
meric liquid has been theoretically studied by tak-
ing into account both mass transfer phenomenon
and viscous forces effect.
Model results were compared with experimental
data obtained analyzing foamed sheets produced in
laboratory starting from industrial scraps of PET.
As for thermoplastic foam extrusion, growth occurs
in the molten-to-solid transition state. Rheological
property variation certainly changes the isothermal
growth scenario and hence, a transient heat transfer
problem is considered and a non isothermal model
for bubble growth was developed.
The model was validated in relation to working
conditions, chemical blowing agent percentage and
initial rheological properties of recycled polymer.
A good agreement between experimental and cal-
culated data was achieved, even if, at the moment
only preliminary experimental data are available.
In order to achieve a better understanding of the
foaming process, future work will consider an addi-
tional validation by comparing model results with awider set of experimental data and the analysis of
the bubble nucleation.
References
[1] Lee C. H., Lee K-J., Jeong H. G., Kim S. W.: Growth
of gas bubbles in the foam extrusion process.
Advances in Polymer Technology, 19, 97–112 (2000).
DOI: 10.1002/(SICI)1098-2329(200022)19:2<97::
AID-ADV3>3.0.CO;2-B
[2] Kumar V., Suh N. P.: Process for making microcellu-
lar thermoplastic parts. Polymer Engineering and Sci-
ence, 30, 1323–1329 (1990).
DOI: 10.1002/pen.760302010
[3] Baldwin D. F., Suh N. P., Park C. B., Cha S. W.:
Supermicrocellular foamed materials, U.S. Patent
5334356, USA (1994).
[4] Xanthos M., Dey S.: Foam extrusion of polyethylene
terephthalate (PET). in ‘Foam extrusion: Principles
and practice’ (ed.: Lee S. T.) Technomic, Lancaster,
307–336 (2000).
[5] Branch G. L., Wardle T.: Manufacture of fully recy-
clable foamed polymer from recycled material. Inter-
national Patent PCT/US2004/015245 (2004).
[6] Incarnato L., Scarfato P., Di Maio L., Acierno D.:
Structure and rheology of recycled PET modified by
reactive extrusion. Polymer, 41, 6825–6831 (2000).
DOI: 10.1016/S0032-3861(00)00032-X
[7] Di Maio L., Coccorullo I., Montesano S., Incarnato L.:
Chain extension and foaming of recycled PET in
extrusion equipment. Macromolecular Symposia, 228,
185–200 (2005).
DOI: 10.1002/masy.200551017
[8] Awaja F., Dumitru P.: Statistical models for optimisa-
tion of properties of bottles produced using blends of
reactive extruded recycled PET and virgin PET. Euro-pean Polymer Journal, 41, 2097–2106 (2005).
DOI: 10.1016/j.eurpolymj.2005.04.010
95
Coccorullo et al. – eXPRESS Polymer Letters Vol.3, No.2 (2009) 84–96
8/18/2019 EPL 0000835 Article
http://slidepdf.com/reader/full/epl-0000835-article 13/13
[9] Japon S., Boogh L., Leterrier Y., Manson J. A. E.:
Reactive processing of poly(ethylene terephthalate)
modified with multifunctional epoxy-based additives.
Polymer, 41, 5809–5818 (2000).
DOI: 10.1016/S0032-3861(99)00768-5
[10] Awaja F., Pavel D.: Injection stretch blow moulding
process of reactive extruded recycled PET and virgin
PET blends. European Polymer Journal, 41, 2614–
2634 (2005).
DOI: 10.1016/j.eurpolymj.2005.05.036
[11] Shafi M. A., Lee J. G., Flumerfelt R. W.: Prediction of
cellular structure in free expansion polymer foam pro-
cessing. Polymer Engineering and Science, 36, 1950–
1959 (1996).
DOI: 10.1002/pen.10591
[12] Venerus D. C.: Diffusion-induced bubble growth in
viscous liquids of finite and infinite extent. Polymer
Engineering and Science, 41, 1390–1398 (2001).
DOI: 10.1002/pen.10839[13] Amon M., Denson C. D.: A study of the dynamics of
foam growth: Analysis of the growth of closely spaced
spherical bubbles. Polymer Engineering and Science,
24, 1026–1034 (1984).
DOI: 10.1002/pen.760241306
[14] Favelukis M., Zhang Z., Pai V.: On the growth of a
non-ideal gas bubble in a solvent-polymer solution.
Polymer Engineering and Science, 40, 1350–1359
(2000).
DOI: 10.1002/pen.11264
[15] Ramesh N. S., Rasmussen D. H., Campbell G. A.: The
heterogeneous nucleation of microcellular foamsassisted by the survival of microvoids in polymers
containing low glass transition particles. Part I: Math-
ematical modeling and numerical simulation. Polymer
Engineering and Science, 34, 1685–1697 (1994).
DOI: 10.1002/pen.760342206
[16] Patel R. D.: Bubble growth in a viscous Newtonian
liquid. Chemical Engineering Science, 35, 2352–2356
(1980).
[17] Joshi K., Lee J. G., Shafi M. A., Flumerfelt R. W.:
Prediction of cellular structure in free expansion of
viscoelastic media. Journal of Applied Polymer Sci-
ence, 67, 1353–1368 (1998).
DOI: 10.1002/(SICI)1097-4628(19980222)67:
8<1353::AID-APP2>3.0.CO;2-D
[18] Yue P., Feng J. J., Bertelo C. A., Hu H. H.: An arbi-
trary Lagrangian-Eulerian method for simulating bub-
ble growth in polymer foaming. Journal of
Computational Physics, 226, 2229–2249 (2007).
DOI: 10.1016/j.jcp.2007.07.007
[19] Otsuki Y., Kanai T.: Numerical simulation of bubble
growth in viscoelastic fluid with diffusion of dissolved
foaming agent. Polymer Engineering and Science, 45,
1277–1287, (2005).
DOI: 10.1002/pen.20395
[20] Everitt S. L., Harlen O. G., Wilson H. J.: Competition
and interaction of polydisperse bubbles in polymer
foams. Journal of Non-Newtonian Fluid Mechanics,137, 60–71 (2006).
DOI: 10.1016/j.jnnfm.2006.03.005
[21] Favelukis M.: Dynamics of foam growth: Bubble
growth in a limited amount of liquid. Polymer Engi-
neering and Science, 44, 1900–1906 (2004).
DOI: 10.1002/pen.20192
[22] Lee J. G., Ramesh N. S.: Polymeric foams: Mecha-
nisms and materials. CRC Press, New York (2004).
[23] Van Krevelen D. W.: Properties of polymers. Elsevier,
New York (1990).
[24] Amon M., Denson C. D.: A study of the dynamics of
foam growth: Simplified analysis and experimentalresults for bulk density in structural foam molding.
Polymer Engineering and Science, 26, 255–267
(1986).
DOI: 10.1002/pen.760260311
[25] Han C. D., Yoo H. J.: Studies on structural foam pro-
cessing. 4. Bubble growth during mold filling. Poly-
mer Engineering and Science, 21, 518–533 (1981).
[26] Xu D., Pop-Iliev R., Park C. B., Fenton R. G., Jiang
H.: Fundamental study of CBA-blown bubble growth
and collapse under atmospheric pressure. Journal of
Cellular Plastics, 41, 519–538 (2005).
DOI: 10.1177/0021955X05059031
96
Coccorullo et al. – eXPRESS Polymer Letters Vol.3, No.2 (2009) 84–96