equatorial atmosphere radar (ear): system …tsato/publ-pdf/2002rs002767.pdfequatorial atmosphere...
TRANSCRIPT

Equatorial Atmosphere Radar (EAR): System description and first
results
Shoichiro Fukao, Hiroyuki Hashiguchi, Mamoru Yamamoto, Toshitaka Tsuda,
Takuji Nakamura, and Masayuki K. Yamamoto
Radio Science Center for Space and Atmosphere, Kyoto University, Kyoto, Japan
Toru Sato
Graduate School of Informatics, Kyoto University, Kyoto, Japan
Masahiro Hagio and Yoshiyuki Yabugaki
Communication Systems Center, Mitsubishi Electric Corporation, Hyogo, Japan
Received 25 August 2002; revised 20 February 2003; accepted 19 March 2003; published 13 June 2003.
[1] A VHF Doppler radar with an active phased-array antenna system, called theEquatorial Atmosphere Radar (EAR), was established recently at the equator nearBukittinggi, West Sumatra, Indonesia (0.20�S, 100.32�E, 865 m above sea level). TheEAR is a large monostatic radar which operates at 47.0 MHz with peak output power of100 kW. The EAR uses a circular antenna array, approximately 110 m in diameter, whichconsists of 560 three-element Yagi antennas. Each antenna is driven by a solid-statetransmitter-receiver module. This system configuration allows the antenna beam to besteered electronically up to 5,000 times per second. The scientific objective of the EAR isto advance knowledge of dynamical and electrodynamical coupling processes in theequatorial atmosphere from the near-surface region to the upper atmosphere. Theequatorial atmosphere over Indonesia is considered to play an important role in globalchange of the Earth’s atmosphere. This paper presents the system description of the EAR,including observational results of the equatorial atmosphere made for the first time withaltitude resolution of 75–150 m. INDEX TERMS: 3360 Meteorology and Atmospheric Dynamics:
Remote sensing; 3394 Meteorology and Atmospheric Dynamics: Instruments and techniques; 3374
Meteorology and Atmospheric Dynamics: Tropical meteorology; 3334 Meteorology and Atmospheric
Dynamics: Middle atmosphere dynamics (0341, 0342); KEYWORDS: atmospheric radar, equatorial Indonesia,
phased array
Citation: Fukao, S., H. Hashiguchi, M. Yamamoto, T. Tsuda, T. Nakamura, M. K. Yamamoto, T. Sato, M. Hagio, and
Y. Yabugaki, Equatorial Atmosphere Radar (EAR): System description and first results, Radio Sci., 38(3), 1053,
doi:10.1029/2002RS002767, 2003.
1. Introduction
[2] The western Pacific region, called the IndonesianArchipelago, is a center of intense atmospheric motionsclosely associated with global atmospheric change. Theworld’s most active convective clouds are generated inthis region. The mechanisms responsible for these atmo-spheric changes and fluctuations, however, have not yetbeen clearly identified because of the sparseness of
observational data from that region. The mechanismsthat cause atmospheric changes in the equatorial regionare thought to have a hierarchical (or multiple) structure,one that would require observations of the atmosphere atdifferent horizontal scales for comprehensive description[Nakazawa, 1988]. Ideally, it is necessary to conductcoordinated experiments that include various ground-based and space-based instruments to derive a compre-hensive understanding of these mechanisms. To this end,we established the Equatorial Atmosphere Radar (EAR)at the equator near Bukittinggi, West Sumatra in theRepublic of Indonesia (0.20�S, 100.32�E, 865 m above
RADIO SCIENCE, VOL. 38, NO. 3, 1053, doi:10.1029/2002RS002767, 2003
Copyright 2003 by the American Geophysical Union.
0048-6604/03/2002RS002767$11.00
19 - 1

sea level), in June 2001, to be a key ground-basedfacilities for these kinds of studies.[3] Recently, efforts for networking atmospheric radars
(reputable for their reliable and continuous operation)have been initiated by scientists from the United States ofAmerica (USA), France, Germany, Australia, Canada,and Japan. One such network near the equator is theTrans-Pacific Profiler Network (TPPN) operated by theU.S. National Oceanic and Atmospheric Administration(NOAA) [e.g., Gage et al., 1991] since 1994. Theoriginal network consisted of six radars aligned alongthe Pacific equator from Piura, Peru in South America toBiak, Indonesia in the western Pacific. The radars atPiura and San Cristobal continuously operate today,although TPPN was closed in 2002. Similar but lesssensitive radars are also operating in Thailand andIndonesia [e.g., Hashiguchi et al., 1995]. However,coverage of the western Pacific region is not yet ade-quate for elucidating the mechanisms of atmosphericchange. A few more radars are needed. The EAR isexpected to be a key facility that will provide importantcomplementary data.[4] This paper presents a description of the EAR system
and the first observational results obtained with the EAR.In Sections 2 and 3 we describe the EAR system designand details of the system configuration. A short descrip-tion is given of its capability to perform frequency-domain interferometry in Section 4. In Section 5 wedescribe measurements of the antenna pattern obtainedby using radio star emissions and Moon reflections assignal sources, and comparisons of wind profiles obtainedby the EAR and radiosondes. In Section 6 we presentinitial observations of the EAR. Finally, we present ourconclusions in Section 7.
2. System Design
[5] The EAR, a large-aperture Doppler radar forstudying the equatorial atmosphere, is located at BukitKototabang, about 19 km to the north of Bukittinggi inWest Sumatra, Indonesia (0.20�S, 100.32�E, 865 mabove sea level). The EAR was designed to have thefollowing capabilities: (1) ability to measure the tropo-spheric and lower stratospheric wind field up to 20 kmaltitude, (2) ability to steer the antenna beam on a pulse-to-pulse basis to any directions within 30� from zenithso that it can observe the detailed three-dimensionalstructure of small-scale processes in the equatorialatmosphere [e.g., Worthington et al., 1999], (3) abilityto measure altitude profiles of temperature by using theRASS (radio acoustic sounding system) technique [e.g.,Marshall et al., 1972; Tsuda et al., 1994], (4) ability toobserve the 3-m-scale (i.e., half the radar wavelength)field-aligned irregularities (FAIs) in the ionospheric Eand F regions [Fejer and Kelley, 1980; Fukao et al.,
1988, 1991; Yamamoto et al., 1991], (5) a single-pulserange resolution of 75 m, and even better accuracy fordetermining vertical displacement of thin atmosphericstructures by using the frequency domain interferometry(FDI) technique [e.g., Kudeki and Stitt, 1987] or thefrequency domain interferometric imaging (FII) tech-nique [Palmer et al., 1999; Luce et al., 2001b], (6) asystem recovery that is fast enough to obtain useful dataat altitudes as low as 1.5 km, and (7) a facilityoptimized for ease of operation and maintenance be-cause it will be installed at a remote site in WestSumatra, Indonesia.[6] An active phased-array system, similar to that of
the MU (middle and upper atmosphere) radar in Japan[Fukao et al., 1985a, 1985b, 1990], was selected,based upon the established performance of the MUradar’s fast beam steerability. In this kind of systemphase shift and signal division and combination oper-ations are carried out at low signal levels by electronicdevices. Binary phase codes, such as Barker andcomplementary codes [e.g., Schmidt et al., 1979;Woodman, 1980], are utilized for pulse compressiontechniques by which the signal-to-noise ratio can beimproved without compromising range resolution. Inaddition to these two codes the EAR is able to useoptimal complementary codes for decoding sampled data(Spano codes) [Spano and Ghebrebrhan, 1996a, 1996b,1996c]. Details of the EAR system, including severalnew inventions made for the EAR, are described in thefollowing section.
3. System Configuration
[7] The EAR uses a quasi-circular antenna array with adiameter of approximately 110 m, which consists of 560three-element Yagi antennas. It is an active phased-arraysystem with each antenna driven by a solid-state trans-mitter-receiver module (TR module). With this systemconfiguration the antenna beam can be steered electri-cally on a pulse-to-pulse basis by controlling phaseshifters in the TR modules. The beam can be steeredwithin 20 ms, and up to 5,000 times per second. The EARsystem is similar to the MU radar, built in Shigaraki,Japan in 1984 [Fukao et al., 1985a, 1985b, 1990], but itimplements a few new ideas and devices that haveappeared in the last decade. In particular, efforts havebeen dedicated to modularize various subsystems andunits by using commercial devices, where available.[8] Table 1 shows the specifications of the EAR
system. Its operating frequency is 47.0 MHz and itsbandwidth is 4 MHz. The maximum peak and averageradiation powers are 100 kW and 5 kW, respectively (themaximum duty ratio is 5%). A subpulse width as short as0.5 ms can be accommodated by the 4-MHz bandwidth ofthe system to satisfy the requirement for a maximum
19 - 2 FUKAO ET AL.: EQUATORIAL ATMOSPHERE RADAR (EAR)

range resolution of 75 m. The nominal one way halfpower antenna beam width is 3.4�.[9] The hardware of the EAR consists mainly of five
subsystems; the antenna array (ANT), the transmitter andreceiver (TRX), the signal modulator and demodulator(SMD), the signal processor (SP), and the host computer(HC). Figure 1 shows the schematic block diagram of theEAR system.[10] The SMD generates a code-modulated RF signal,
which is sent to the TRX for amplification to thespecified power and radiated by the ANT into free space.[11] The signal scattered from the atmosphere is re-
ceived by the ANT, amplified by the TRX, and sent tothe SMD. In the SMD the signal is detected andconverted to a digital signal, which is subsequently sentto the SP for time-domain processing. The processedsignal is then sent to HC for frequency-domain dataprocessing to generate altitude profiles of wind velocity.[12] The EAR system is connected to a backup electric
power generator, which automatically starts to supplypower within 1 min following a commercial powerfailure. Until electric power is available from the gen-erator, the entire radar system, except for the TR
modules, is backed up by uninterruptible power supplies(UPSs).
3.1. Antenna Array (ANT)
[13] Figures 2 and 3 show views of the entire EARantenna field and part of the Yagi array. The Yagiantennas are arrayed on grids of equilateral triangleswith a side that is 4.5 m (approximately 0.7l: l iswavelength) long, as shown in Figure 4. For this elementspacing no grating lobe is formed at beam positionswithin 30� of zenith. The voltage standing wave ratio(VSWR) is less than 2.0.[14] The array is divided for ease of signal distribution
into 24 subarrays as shown in Figure 4. Each subarray,except for eight of those along the periphery in the northand south, consists of 24 antennas and an identicalnumber of TR modules. Each of the eight subarraysalong the periphery contains one to three fewer antennas(and TR modules) to produce a quasi-circular arraypattern.[15] The echoes returned from the atmosphere and
ionosphere are received by the antennas and sent to theTR modules via duplexers (see Figure 5). The duplexerswitching time is made less than 10 ms, which limits theclosest range (1.5 km) from which data can be sampledand recorded. It is noted that the electromagnetic antennanear field effect prevents accurate observations with the
Table 1. Specifications of the Equatorial Atmosphere Radar
(EAR) System
Item Specification
Location: 0.20�S, 100.32�E,865 m above sea level
Geomagnetic latitudeand longitude:
10.63�S, 171.93�E
Radar system: Monostatic pulse Doppler radarOperating frequency: 47.0 MHzAntenna: Quasi-circular antenna array of
560 three-element Yagi antennasAperture: 110 m in diameterBeam width: 3.4� (half power width; one way)Beam directionin azimuth:
0–360� in 0.1� steps
Beam zenith angle: 0–30� in 0.1� steps (no grating lobe)Gain: 33 dBi
TransmitterPeak power: 100 kW (sum of all TR modules)Average power: 5 kW (max; sum of all TR modules)Number of TR modules: 560 units (same as Yagi antennas)Single TR module’spower:
180 W/unit
Pulse width: 0.5–256 msIPP: 200 ms-10 ms (variable in 200 ms steps)
ReceiverType: Single super heterodyneNoise figure: 5 dB (TR modules)Pulse compression: Barker, complementary and
Spano codes (1 to 16 bits)Subpulse width: 0.5, 1.0, 2.0, 4.0, 8.0, 16.0 ms (variable)Dynamic range: 70 dBA/D converter: 14 bitsNumber of range gates: 256 (max.)
Figure 1. Schematic block diagram of the EquatorialAtmosphere Radar (EAR) system located at the equatornear Bukittinggi, West Sumatra, Indonesia. The antennaarray (ANT) and the transmitter and receiver (TRX)except for the indoor divider and combiner unit areinstalled in the antenna field. Other equipment isinstalled in the Observation House. STALO and COHOare abbreviations for stable local oscillator and coherentoscillator, respectively.
FUKAO ET AL.: EQUATORIAL ATMOSPHERE RADAR (EAR) 19 - 3
EAR below 1.9 km altitude. Wind velocity measure-ments below the 1.5–2 km altitude are covered by an L-band boundary layer radar collocated at the EAR site[Renggono et al., 2001].[16] The antennas have a single linear polarization
aligned in the north-south direction. Although use oflinear polarization has the disadvantage of producingamplitude fading on signals propagated through theionosphere because of Faraday rotation, it has no nega-tive consequences for signals backscattered from thelower and middle atmosphere.
3.2. Transmitter and Receiver (TRX)
[17] A schematic block diagram of the TRX is shownin Figure 5. Each TR module is installed in a waterproofbox that is mounted near the ground on the pole of itsantenna (see Figure 3). The TRX is composed of apreamplifier (Pre-amp), an indoor divider and combinerunit (DCU), 24 outdoor DCUs, and 560 TR modules.[18] For transmission, the RF (47.0-MHz) signal from
the SMD is amplified by the Pre-amp and dividedequally into 560 signals by the indoor and outdoorDCUs. Each of the 560 signals is sent at a low powerlevel (0.3 mW or �5 dBm) to a TR module andamplified to the final transmitting power level of 180W (peak; 52.5 dBm). Figure 6 shows an example of thetransmitted pulse with a 16-bit optimal code with asubpulse width of 1 ms.[19] During reception, the signal received from each
antenna is amplified by a low-noise amplifier in each TRmodule, and the output signals from 560 TR modules arecombined into one signal by the indoor and outdoorDCUs. The received signal is amplified further by thePre-amp and sent to the SMD. The five-bit phase shifterin each TR module can change the phase in steps of11.25� and provides the phase shifts required for bothtransmitted and received signals.[20] The indoor DCU, which is installed within the
Observation House, provides DC power and controlsignals to the outdoor DCUs and divides and combines
the RF signals. The outdoor DCUs are installed in theantenna field, and each unit supplies the RF signal, theDC power and control signals to 24 TR modules (or to21 to 23 TR modules in the eight peripheral subarrays, asmentioned above). The 24 outdoor DCUs drive andcontrol all of the TR modules.[21] The TR module is composed of a driver amplifier,
a power amplifier, a low-noise amplifier, an input du-plexer, an output duplexer, a phase shifter for transmittedand received signals, a directional coupler for monitoringthe transmitted power, and a control circuit for monitor-ing and controlling operations (Figure 5). The driveramplifier is a push-pull class AB power amplifier with again of 36.8 dB, while the power amplifier unit iscomposed of a two-stage push-pull class AB amplifierwith a gain of 35.0 dB. The total loss due to insertion,filters, switches, and attenuators in a TR module is 14.3dB. Therefore, the total effective gain becomes 57.5 dB.The Pre-amp is identical to a TR module.[22] A photograph of a TR module is shown in Figure
7. Chassis dimensions are 37 cm � 55 cm � 24 cm(height, width and depth), and its weight is about 20 kg.The driver and high-power amplifiers are installed on the
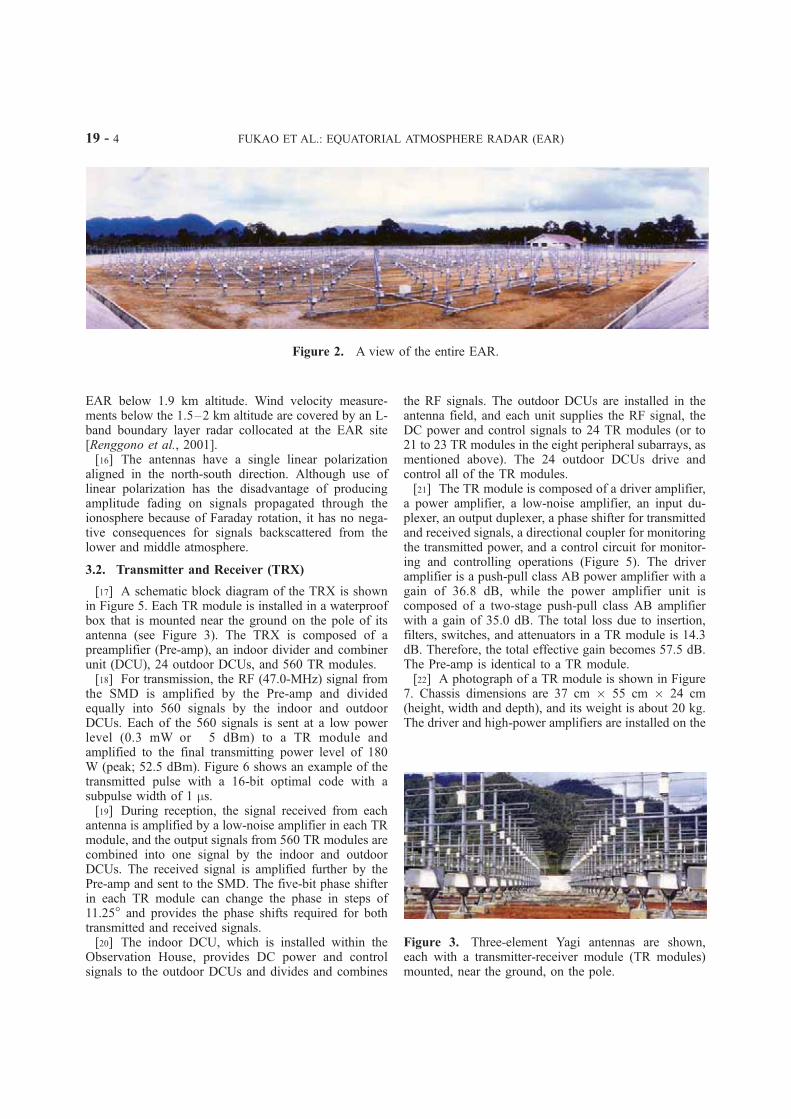
Figure 2. A view of the entire EAR.
Figure 3. Three-element Yagi antennas are shown,each with a transmitter-receiver module (TR modules)mounted, near the ground, on the pole.
19 - 4 FUKAO ET AL.: EQUATORIAL ATMOSPHERE RADAR (EAR)

right in Figure 7 while the output duplexer and low-passfilter are on the left top and the input duplexer and phaseshifter are on the left bottom. A low-pass filter is insertedafter the output duplexer to prevent transmission ofharmonics (not shown in Figure 5). The mean timebetween failures (MTBF) of the TR modules is about160,000 hours. This implies that approximately 30 TRmodules need to be repaired every year. Each TR modulecontinuously monitors its transmission power and sendsa warning signal to the HC through the SP whenever thetransmitting power drops.[23] All cables leading from the indoor DCU to the
balun of each antenna are physically of equal length. Thebalun is similar to the one used for the MU radar [Fukaoet al., 1985a]. The cable lengths between the indoor andoutdoor DCUs, the outdoor DCU and TR module, andTR module and balun, are 150 m, 33 m and 2.7 m,respectively. The feed-cable loss that needs to be con-
sidered is 0.27 dB, which occurs between the TR moduleand the balun.
3.3. Signal Modulator and Demodulator (SMD)
[24] A schematic block diagram of the SMD is alsoshown in Figure 1. This subsystem is described briefly asfollows: The SMD is composed of a stable local oscil-lator (STALO) of 37 MHz, a coherent oscillator (COHO)of 10 MHz, two frequency conversion units (one ofwhich forms a super-heterodyne receiver), a phase de-tector, two analog-to-digital converters (A/Ds), and aradar controller (RC). The receiver noise level is �104dBm, which is comparable to the minimum measuredcosmic noise level of �103.6 dBm. This high noise levelseems to be caused primarily by noise from the TRX andpartly due to the low gain of the MDL. The receiver has awide dynamic range of more than 70 dB.
Figure 4. The EAR antenna array. Each dot represents the location of a three-element Yagiantenna and TR module.
FUKAO ET AL.: EQUATORIAL ATMOSPHERE RADAR (EAR) 19 - 5

[25] The IF (intermediate frequency) transmitter sourcesignal of 10 MHz is generated by applying a specifiedphase-modulation and pulse-modulation to the COHOsignal in the modulator. The source signal is up-convertedto the RF transmitted signal of 47.0 MHz by mixing itwith the STALO signal in the frequency conversion unit.The RF signal is then sent to the TRX through a band-pass filter.[26] The pulse width for transmission is determined by
the subpulse width (0.5, 1.0, 2.0, 4.0, 8.0 or 16.0 ms)times the number of bits (1–16) used for phase modu-lation. The maximum pulse width available is 256 ms (16ms � 16 bits). The IF band-pass filter is selected to matchthe subpulse width.[27] The signal received at 47.0 MHz is down-con-
verted to the IF of 10 MHz in the frequency conversionunit. The IF signal is subsequently down-converted to avideo signal (analog signal) by the COHO and into in-phase (I) and quadrature-phase (Q) signals by a phasedetector. In the case of the RASS mode the centerfrequency of the I and Q video signals is shifted 100Hz below that of the normal mode (i.e., 10 MHz-100 Hz)in order to detect the acoustic line spectra. The I and Qvideo signals are then converted to 14-bit digital signals.The sampling interval is equal to the subpulse width. It ispossible to delay the start of sampling by 1 to 1024 timesthe inter-pulse period (IPP) in order to receive Moon-reflection echoes for the purpose of antenna calibration(the delayed sampling mode).[28] All timing signals for EAR operation are gener-
ated by the timing generator in the Radar Controller(RC). They are generated from the COHO signal of10 MHz. The RC sends parameters of operation to thereceiver and TRX.
[29] A GPS satellite receiver (not shown in Figure 1)receives the GPS time and reference signal. The RCutilizes this reference signal to synchronize the timecounter to the GPS clock.
3.4. Signal Processor (SP)
[30] The SP performs a series of signal processingoperations (pulse decoding, coherent integration, fastFourier transform (FFT), incoherent integration), andsends the processed data to the host computer (HC).The interface between the SP and HC is a LAN 100Base-T.[31] A schematic diagram for the signal processing of
the EAR is shown in Figure 8. The digitized I and Qsignals are stored in the FIFO (First-In/First-Out) mem-ory (double-buffered memory) in the A/D converters (seeFigure 1). The output is sent to the pulse decoding andcoherent integration units with header data added. Pulsedecoding can be performed for any binary code withlengths up to 16 bits, such as Barker codes, ordinarycomplementary codes, and Spano codes [Spano andGhebrebrhan, 1996a, 1996b, 1996c]. The maximumnumber of a code sequence is 32.[32] After pulse decoding, the digitized I and Q signals
are coherently integrated for each beam and range. Thecoherent integration unit adds a specified number of Iand Q signals and outputs 32-bit data to double-bufferedmemory. The data from the ranges to be processed areselected and sent to the digital signal processing (DSP)unit.[33] The integrated I and Q signals are stored in the
buffered memory of the DSP unit, and rearranged intotime series at respective ranges. The DSP then performs
Figure 5. Schematic block diagram of the transmitterand receiver (TRX) of the EAR.
Figure 6. Photograph of the transmitted pulse with 16-bit optimal code and subpulse width of 1 ms.
19 - 6 FUKAO ET AL.: EQUATORIAL ATMOSPHERE RADAR (EAR)

complex FFT and power spectrum calculations on thesetime series. The computed power spectrum consists of32-bit floating-point values. The DSP also performs aspecified number of incoherent integrations of the powerspectra. After incoherent integration the power spectraare sent to the HC via a 100 Base-T LAN interface. Timeseries of the digitized I and Q data (before FFT opera-tion) can also be stored for specific off-line processings,such as frequency domain interferometric modes.
3.5. Host Computer (HC)
[34] The HC sends operating parameters to the RC andcontrols start/stop of operation of the entire system. TheHC is a workstation having a CPU (Central ProcessingUnit) with 450 MHz clock and 512 MB main memory.The operating system is Solaris-UNIX. The observationsoftware of the workstation has the following functions:(1) to set up observation parameters and to control theradar system, (2) to receive data from the SP, (3) toprocess data to estimate spectral parameters, (4) to recorddata on digital data storage (DDS) tapes, and (5) todisplay data graphically during observations.[35] Observation software includes programs named
‘‘Observation Control,’’ ‘‘Data Taking,’’ ‘‘Signal Pro-cessing,’’ ‘‘Tape Control,’’ and ‘‘Quick Look.’’ Obser-vation Control sets up observation parameters to controlobservations. Data Taking sends radar control com-
mands to the RC and takes data from the SP through a100 Base-T LAN interface. Signal Processing performssignal processing, such as the estimation of spectralparameters from data taken by the Data Taking programand the writing of results to hard disk. Tape Controltransfers data stored on hard disk to DDS tape withoutinterrupting observations. Quick Look is an on-line data-viewing program that reads data from the hard disk andplots them to the graphic display of the workstation. Tocontrol programs effectively, we use UNIX system calls
Figure 7. Photograph of the TR module.
Figure 8. Schematic diagram of the signal processor(SP). The SP consists of two units: pulse decoding andintegration unit and digital signal processing (DSP) unit.
FUKAO ET AL.: EQUATORIAL ATMOSPHERE RADAR (EAR) 19 - 7

such as ‘‘creation of process,’’ ‘‘semaphore,’’ and‘‘shared memory.’’[36] The EAR system is under full supervision of the
HC. The communication of the HC with the SP and RCis performed via a 100 Base-T LAN interface. Commu-nications between the RC and each TR module areperformed via RS-422 serial I/O interface. It takes lessthan 1 s to send the parameters to the RC and TRmodules via the 100 Base-T LAN and serial interfaces.By utilizing this capability, the EAR can cyclicallyinterleave the parameters (observation range, range (oraltitude) resolution, time resolution, etc.) in such a shorttime and almost simultaneously observe, for instance,different altitude regions with different altitude and timeresolutions most suitable to the respective regions. Six-teen different sets of observational parameters can beprogrammed within one cycle of observations.
4. Frequency Domain Interferometry
Capability
[37] Interferometric modes using multiple frequenciesadjoining 47.0 MHz have been implemented to improvethe accuracy of vertical displacement of thin structures inthe atmosphere. These modes are particularly useful forinvestigations of thin turbulent or stable layers. Wave-induced instabilities that generate such thin structures areexpected to be observed within the lower stratosphere inthe equatorial atmosphere.[38] For FDI (frequency domain interferometry) and
FII (frequency domain interferometric imaging) obser-vational modes four preselected frequencies, 47.0 MHz ±250 kHz and 47.0 MHz ± 500 kHz, are transmitted on apulse-to-pulse basis by changing the STALO frequencyaccordingly. These values lead to redundant frequencyspacings but should be adequate for our objectivesaccording to simulations and observations made byPalmer et al. [1999], Luce et al. [2001b], and Smainiet al. [2002]. The EAR is consequently capable of dualFDI observations with maximum frequency difference Df = 1.0 MHz and a minimum range resolution Dr = 150 m,which represent an improvement by a factor of two (ofboth the initial resolution and frequency spacing used)over prior FDI observations at VHF. From observationsusing four frequencies different data processing schemescan be performed off-line, such as Fourier-based imaging,the Capon method [Palmer et al., 1999; Luce et al.,2001b], the Lagunas/Gasull method [Smaini et al.,2002], and Singular Value Decomposition (SVD) withthe MUSIC algorithm [Luce et al., 2001b; Smaini et al.,2002]. Preliminary results from the EAR data will bepresented in a subsequent paper.[39] Spatial-domain interferometry is not applicable
because the EAR has only a single receiving channelavailable. The RASS capability [Tsuda et al., 1994] has
also been applied effectively with the EAR; those resultswill be presented elsewhere.
5. Evaluation of Technical Reliability
[40] The EAR generally utilizes pulse-to-pulse beamsteerability for its observations. It is necessary to confirmthis capability by measuring the antenna pattern inoperation. For this purpose, measurements of the antennapattern have been made by using emissions from aradio star and radar reflections from the Moon. Theperformance concerned with measurements of windprofiles in the troposphere and lower stratosphere hasbeen confirmed by comparisons with GPS radiosondesoundings.
5.1. Radio Star Measurements for ReceivingAntenna Pattern
[41] The antenna pattern in the receiving mode (with-out transmission) can be measured by using emissionsfrom radio stars [e.g., Guidice and Castelli, 1971;Czechowsky et al., 1984; Fukao et al., 1985c]. We usedCygnus-A, which is the most intense point radio sourcedetectable by the EAR and has a luminance temperatureof 53,000 K at the EAR operating frequency of 47.0MHz [Maeda et al., 1999]. The proper steering of theantenna beam can be confirmed by determining thereceived power that maximizes at the expected timeand zenith angle where the star crosses the meridian ofthe EAR.[42] This kind of measurement was conducted between
0530 and 0640 LT on 25 April 2001. The beam wassteered to eight different directions in 1.5� steps from34.8� to 45.3� north of zenith. The northward beam at40.8� zenith angle encountered Cygnus-A at 0607 LT.The antenna pattern approximately in the east-westdirection can be measured by utilizing the Earth’s rota-tion. However, it is noted that absolute calibrations ofdirectivity and gain are not allowed at this zenith angle,since grating lobes appear and deteriorate the radiationpattern significantly.[43] Doppler spectra were calculated to remove intense
interference which often entered the EAR bandwidth.Also, coherent integration was conducted to reduce theamount of data transferred from the SP to the HC, sincethe observations otherwise halted during the data transfer.Data were sampled at 128 points with 150-m interval,and coherent integration was performed 16 times. Then256-point complex FFTs were calculated to obtain Dopp-ler spectra every 6.6 s, which were averaged for approx-imately 20 s. The antenna gain was obtained in referenceto the noise level of the resultant spectrum, and byplotting it versus time (or corresponding azimuth anglefrom the meridian).
19 - 8 FUKAO ET AL.: EQUATORIAL ATMOSPHERE RADAR (EAR)

[44] Figure 9 shows a cross section of the measured(solid curve) and theoretical (dashed curve) relative gainsof the EAR approximately in the east-west direction. Themeasured directivity above �10 dB is reliable. Bothdirection and gain measured for the main beam coincidewell with the theoretical values. The antenna pattern inthe north-south direction was measured by steering theantenna beam in the meridional plane and also found tobe in good agreement with the theoretical pattern.Similar measurements were made using radiation fromthe Sun, but the measured pattern was occasionally morefluctuating than that obtained with Cygnus-A.
5.2. Moon Reflection Measurement forTotal Antenna Pattern
[45] Since an ordinary antenna array has antennapatterns that are reciprocal for transmission (TX) andreception (RX), it is enough to measure the pattern inreceiving mode only. On the other hand, the TX and RXpatterns of an active phased array are, in general, not thesame and are inseparably related to the distributed trans-mitter and receiver characteristics [Fukao et al., 1985a,1985c]. Therefore, it is necessary to measure the EARantenna patterns by taking amplitude and phase character-istics of all TR modules into consideration. The outputphase and power of every TR module of the EAR is keptequal, to an accuracy of 7� and 0.2 dB. Considering thatamplitude and phase errors are generally distributedrandomly among the TR modules, there is no significanterror in gain and direction of the main beam, while the
low-elevation sidelobes increase in proportion to themagnitudes of the errors.[46] A two-way array pattern in a plane which contains
the Moon orbit was measured during passage of theMoon. The measurement was conducted during a one-hour period from 1515 to 1615 LT on 27 April 2001. Thebeam was fixed to 22.8� in zenith and 351.9� in azimuthwhere the apparent velocity of the Moon relative to theEAR on the Earth became zero at 1544 LT. A 256-mspulse was transmitted with an IPP of 5.2 ms. The echoeswere over-sampled at 256 points with 2.4-km interval.No coherent integration was performed. Then 512-pointcomplex FFTs were calculated in real time to obtainDoppler spectra every 2.7 s. The resultant power spectrawere averaged for approximately 30 s. Since the distancebetween the EAR and the Moon surface is about 368,000km, we do not receive any echoes from the moon duringthe first 2.45 s but we do receive range-aliased echoesafterward. The antenna pattern was obtained by choosingthe peak value of the spectrum at the range of themaximum echo power of each 30-s data set and plottingit versus time (or corresponding azimuth angle).[47] Figure 10 shows a cross section of the measured
(solid curve) and the theoretical (dashed curve) relativegains of the EAR approximately in the east-west direc-tion. Both the measured direction and gain of the mainbeam are in close agreement with theoretical values. Thesignal-to-noise ratio exceeded 15 dB. Consequently, thefluctuations of the measured values are thought not to beproduced by noise fluctuations but by ionospheric scin-tillations, which have been found to be active during
Figure 9. Relative gain of the EAR antenna pattern(solid curve) in receiving mode measured by usingemission from the radio star Cygnus-A and thecorresponding theoretical gain (dashed curve). Theantenna beam is directed to 40.8� north of zenith.
Figure 10. Relative gain of the EAR two-way antennapattern (solid curve) measured by receiving Moonreflection echoes and the corresponding theoretical gain(dashed curve). The antenna beam is directed 22.8� fromzenith and 351.9� in azimuth.
FUKAO ET AL.: EQUATORIAL ATMOSPHERE RADAR (EAR) 19 - 9

equinoctial seasons over Sumatra in Indonesia. On theother hand, information on the sidelobes is not availabledue to limited sensitivity.
5.3. Simultaneous Wind Measurements of EARWith GPS Radiosondes
[48] Because of uncertainties in absolute range andecho direction from system biases and scattering charac-teristics, it is important to validate wind profiles obtained
by the EAR with other wind-measuring techniques. Forthis purpose we compared EAR wind profiles with thoseobtained simultaneously with GPS rawinsondes in No-vember 2001. More than 170 GPS radiosondes werelaunched from the radar site every 3 or 6 hours by theFrontier Observation Research System for GlobalChange of Japan.[49] The beam of the EAR was steered to five direc-
tions (vertical, and north, south, east, and west) every
Figure 11. Zonal (upper panel; westerly or eastward positive) and meridional (lower panel;southerly or northward positive) wind profiles observed simultaneously with the EAR (thickcurves) and GPS radiosondes (thin curves) around 13 LT on 5–8 November 2001. Height from theantenna field of the EAR is indicated.
19 - 10 FUKAO ET AL.: EQUATORIAL ATMOSPHERE RADAR (EAR)

IPP (400 ms). We chose a zenith angle of 10� because ithas been used for routine observations of the troposphereand the lower stratosphere with the MU radar since 1986and repeated validations of those measured winds havebeen made with radiosonde measurements [e.g., Luce etal., 2001a]. A 16-bit optimal code with a subpulse widthof 1 ms was used. The data were sampled at 150 rangeswith 150-m intervals and coherent integration was per-formed 32 times. Then 256-point complex FFTs werecalculated in real time to obtain Doppler spectra every16.4 s. The resultant power spectra were averaged forapproximately 80 s.[50] Figure 11 compares the altitude profiles of wind
velocities obtained by the EAR with those obtainedwith the GPS radiosondes launched around 13 LT on5–8 November 2001. The EAR data were averaged forone hour around the rawinsonde launch time. The windprofiles are in good agreement in the altitude range of1 to 20 km, although some EAR data are missing belowthe tropopause region, 15–17 km, due to low signal-to-noise ratios that are commonly encountered by 50-MHzatmospheric radars with similar sensitivities [Hocking,1997].[51] Figure 12 shows scatterplots of horizontal winds
obtained with the EAR and radiosondes during the entiremonth of November 2001. All data in the altitude rangefrom 1.5 to 10 km, where effective data were obtainedwith both instruments, are utilized. The wind velocitiesare in good agreement, obtaining correlation coefficientsof 0.98 (zonal) and 0.95 (meridional). Best fit linear-regression lines are shown, for both regression of rawin-sonde data on radar data (i.e., zero error is assumed in theradar data; solid line) and vice versa (i.e., zero error isassumed in the rawinsonde data; dotted line). The smalldifferences seen may be plausibly attributed to errors
associated with both radar and rawinsonde measurements[Hocking, 2001]. However, the random error of horizon-tal winds measured by radars with a good detectability isestimated to be about 0.7 ms�1 [Yamamoto et al., 1988].This value is substantially smaller than the scatter of thedata points in Figure 12. This result demonstrates thevalidity of EAR wind measurements, although furtherinvestigation may be needed regarding effects of partialreflection.
6. Preliminary Observational Results
6.1. Atmospheric Observations
[52] The EAR is the first radar in equatorial regions tomake observations with a resolution as fine as 75–150 m.Radars in the Trans-Pacific Profiler Network (TPPN)operated by NOAA use range resolutions of approxi-mately 1 km. The Gadanki radar in India (13.5�N,79.2�E) has a resolution of 150 m [Rao et al., 1995],but it is located far from the equator. The EAR has beenin full continuous operation since 1 July 2001, with onlyoccasional interruptions to repair and maintain hardwareand software.[53] Figure 13 shows an altitude-time intensity plot of
one-hour averages of atmospheric echoes observed withthe EAR from July to late December in 2001. The shortdata gaps were caused mainly by commercial electric-power failures, which the EAR engine generator couldnot successfully compensate for. The echo intensity wasweaker from late August to late October than in other
Figure 12. Scatterplots of zonal (left panel) andmeridional (right panel) wind velocities observed below10 km altitude with the EAR and radiosondes from 1 to28 November 2001. Best fit linear-regression lines areshown, for both the regression of rawinsonde data on theradar data (solid line), and vice versa (dotted line).
Figure 13. Altitude-time intensity plot of echo powerobserved in the vertical beam of the EAR from July toDecember 2001. The echo power is given in arbitraryunits. The echo power is about 8 dB weaker from lateAugust to late October than in other periods because oftrouble with the preamplifier (Pre-amp).
FUKAO ET AL.: EQUATORIAL ATMOSPHERE RADAR (EAR) 19 - 11

periods because of initial trouble with the band-pass filterin the preamplifier (Pre-amp).[54] We note that multiple layers of intense radar
echoes appear in the plot at altitudes between 15 and19 km. The lowest layer usually corresponds in altitudewith the minimum temperature (or the cold-point tropo-pause) observed with the GPS radiosondes. However,when the cold-point tropopause is occasionally displacedto a higher altitude (as determined from rawinsondedata), radar echoes sometimes continue to be observedfrom the original tropopause altitude, while additionalechoes appear at the new tropopause location, as seenduring 7–9 and 20–23 November (see Figure 14). Apossible interpretation would be in terms of local tem-perature minima produced by the presence of Kelvinwaves that are known to be active above the tropopause[e.g., Andrews et al., 1987].[55] On the other hand, the echo intensity, especially
below 10 km, varies considerably with altitude and timedue primarily to changes in humidity. This feature seemsto be associated with cloud activity inferred from theimages of the GMS (Geostationary Meteorological Sat-ellite). More detailed discussion will be left to subse-quent papers.[56] Figure 15 shows altitude-time intensity plots of
the vertical, zonal, and meridional components of thewind averaged over one hour during the same period.Short-period fluctuations due to buoyancy waves, withperiods of less than a day, are more dominant in thevertical wind than in the horizontal wind, similar to casesobserved at middle and high latitudes.[57] In the troposphere the westerlies (eastward wind)
are dominant below 10 km while the easterlies (westwardwind) are dominant above that altitude. Although not yet
well understood, the observed zonal wind varies withperiods from 30 to 60 days below 10 km, and seems tobe associated with the Madden-Julian Oscillation (MJO)[Madden and Julian, 1994]. Strong vertical shear in thezonal wind accompanied by an intense echo layer nearthe cold-point tropopause is also observed. Recurringdownward phase progression with periods of approxi-mately 10 days above the cold-point tropopause isassociated with Kelvin waves [Fujiwara et al., 2003].[58] On the other hand, shorter-period fluctuations are
dominant in the meridional wind in both the troposphere(approximately 10 days) and lower stratosphere (4–5days). These may be mixed Rossby-gravity waves [Yanaiand Maruyama, 1966; Wheeler and Kiladis, 1999;Widiyatmi et al., 1999, 2001].[59] Changes in the vertical structure of atmospheric
waves and turbulence over Sumatra, associated withFigure 14. Altitude-time intensity plot of echo powerobserved in the vertical beam of the EAR during 1–28November 2001. The cold-point tropopause defined byGPS rawinsonde measurements is indicated by crosses.
Figure 15. Altitude-time intensity plots of vertical (toppanel), zonal (middle panel), and meridional (bottompanel) winds observed with the EAR from July toDecember 2001. Positive values indicate updraft,westerly (eastward), and southerly (northward) winds.
19 - 12 FUKAO ET AL.: EQUATORIAL ATMOSPHERE RADAR (EAR)

MJO and possible changes of MJO due to the Sumatramountain ridge [Murata et al., 2002], will be investigatedwith the EAR in the future. Also, it will be interesting tostudy effects of El Nino and La Nina on dynamics overSumatra with the EAR.
6.2. Ionospheric Observations
[60] The MU radar has been shown to be fullycapable of operating as a ‘‘coherent scatter’’ radar,and intensive efforts have been dedicated to the under-standing of 3-m-scale field-aligned irregularities (FAIs)at midlatitudes [e.g., Fukao et al., 1988, 1991; Yama-moto et al., 1991, 1992, 1994]. The EAR is a similarVHF radar which is also capable of viewing theionosphere in directions perpendicular to the geomag-netic field, but it is the first one established in thegeomagnetic southern hemisphere (10.63�S, 171.93�E).It is located in altitude outside of the equatorial elec-trojet (EEJ) but within the equatorial (or Appleton)anomaly region.[61] The EAR has been applied to study F region FAIs
associated with equatorial spread F (ESF) from nearly10�S (geomagnetic latitude). Such studies have beenconducted extensively by the Jicamarca radar at thegeomagnetic equator in South America [e.g., Woodmanand Hoz, 1976]. The EAR has also been utilized forobservations of E region FAIs in regions outside the EEJ,where their characteristics are not well known because
only a few such radar observations have been made [e.g.,Woodman et al., 1999; Chau and Woodman, 1999;Choudhary et al., 1996; Patra et al., 2002].[62] Figure 16 shows altitude-time-intensity plots of
FAI echo power from the E region in four beamdirections near due south: (160.0�, 22.1�), (170.0�,21.2�), (180.0�, 21.0�), and (190.0�, 21.3�) in azimuthand zenith, respectively, A single pulse of 4-ms width (or600 m range resolution) was used. The condition ofperpendicularity to the geomagnetic field for the 3.4�antenna beam width is satisfied over the entire altituderange 80 to 150 km. The echoes appear extended inaltitude, from 95 to 140 km, and the maximum echointensity is more than 35 dB larger than the noise level.Features similar to those reported for other locations arecommonly observed above 100 km: Quasi-periodicstriations, downward (toward the radar) progression ofecho regions, and relatively wide spectral widths. Theunique capability of the EAR to observe in differentdirections simultaneously will help investigation of thespatial structure and movements of FAIs. For instance,some echoes occur almost simultaneously in the four
Figure 16. Altitude-time plots of FAI echo intensity infour directions near due south perpendicular to thegeomagnetic field in the E region on 2 November 2001.
Figure 17. As for Figure 16, but for the F region on 27March 2002. The black line shows the solar terminator.
FUKAO ET AL.: EQUATORIAL ATMOSPHERE RADAR (EAR) 19 - 13

beam directions, while others show westward propaga-tion with a phase velocity of 15 to 20 ms�1, as observedat midlatitudes.[63] Intense FAI echoes have also been observed over
a wide altitude range in the nighttime F region, asshown in Figure 17. A 13-bit Barker-coded pulse witha 16-ms subpulse (or 2.4 km range resolution) was used.The time resolution is 62 s. The radial drift velocitiesare usually less than 100 ms�1 but occasionally exceed200 ms�1. Upward-developing plumes and upwelling ofthe bottom-side F layer, commonly associated with ESF[Tsunoda and White, 1981] have been detected also withthe EAR near 10�S, as well as with the Gadanki radar at6.3�N [Rao et al., 1997]. These results will be discussedelsewhere.[64] As mentioned above, the EAR is approximately
10 dB less sensitive than the MU radar. However, theionospheric density is, at least, two-to-three times largerin the equatorial anomaly than at midlatitudes [e.g.,Rishbeth and Garriott, 1969], and the very weak inco-herent scattering (IS) originating from the free electronsis also detectable with the EAR [Sato et al., 1989]. Apreliminary measurement of the IS power profile hasalready been made using a 7-bit Barker coded pulse of224-ms width (7 bits � 32 ms).
[65] Figure 18 shows a sequence of such profilesobtained from 1843 LT on 7 November 2001 to 0545LT on the following day. The beam was directed,sequentially, with a 10� zenith angle toward the north,east, south, and west on a pulse-to-pulse basis, and theprofiles shown are averages of the four beams. Theobservation was made in a one-hour cycle changingsequentially between five different modes. The IS power-profile mode was operated for approximately 10 mineach hour. The feature of the electron density profile thatis typical of the low-latitude ionosphere is the high Flayer peak in the evening followed by a subsequentlowering of the layer toward midnight. Fluctuations withvertical scale of 10 to 15 km are seen in the echo powerprofile. This is consistent with altitude fluctuationscaused by Faraday rotation, estimated with electrondensity profiles from the International Reference Iono-sphere [Bilitza, 1997].[66] Multipulse transmission capability, similar to that
used with the MU radar [Sato et al., 1989], will beimplemented in the near future for spectral measurementsto observe F region temperature, drift velocity, andelectron density as well. Also, it is noted that the geo-magnetic conjugate point of the EAR is 16.69�N and100.17�E, north of Bangkok, Thailand, that will provide
Figure 18. Altitude profiles of incoherent scatter echo intensity observed with the EAR from1843 LT on 7 November 2001 to 0545 LT on the following day. The echo intensity is given inarbitrary linear units with range divergence compensated.
19 - 14 FUKAO ET AL.: EQUATORIAL ATMOSPHERE RADAR (EAR)

unique convenience for conjugate point observations withan ionosonde, an airglow imager, etc., in the future.
7. Concluding Remarks
[67] In this paper we have described the EAR recentlyinstalled at the Indonesian equator (0.20�S, 100.32�E;geomagnetic latitude 10.63�S). The EAR is a 47-MHzDoppler radar with an active phased-array system. Thesystem is composed of 560 three-element Yagi antennasand an equivalent number of solid state power amplifiers(TR modules). The nominal beam width is 3.4� while thenominal peak and maximum average radiation powersare 100 kW and 5 kW, respectively.[68] The antenna pattern of the EAR has been favor-
ably calibrated by using emissions from Cygnus-A andreflections from the Moon. Also, we have presented theresults of simultaneous wind observations with GPSradiosondes. These results have demonstrated the EARas a reliable tool for observing wind profiles in thetroposphere and lower stratosphere and 3-m scale field-aligned irregularities (FAIs) in the ionosphere over theIndonesian Archipelago.[69] The EAR is now being continuously operated and
provides valuable data day by day. High-resolution obser-vations with the EAR, never before realized, must play animportant role in various studies of the equatorial atmo-sphere and ionosphere. It is expected that the EAR will beoperated in collaboration with other existing networks ofradars, such as those mentioned in the Introduction,satellites such as TIMED (Thermosphere IonosphereMesosphere Energetics and Dynamics) of the USA andROCSAT-1 of the Republic of China (Taiwan) [Su et al.,2001], and other ground-based radio and optical sensors.The EAR is expected to proceed to study the hierarchicalstructure of atmospheric variations in the equatorialregion using the data from these instruments in the future.
[70] Acknowledgments. The authors are indebted to theNational Institute of Aeronautics and Space of Indonesia(LAPAN) for their collaboration. Thanks are also due tocolleagues of the Agency for the Assessment and Applicationof Technology (BPPT) of Indonesia, the Agency of Meteorol-ogy and Geophysics (BMG) of Indonesia and the RadioScience Center for Space and Atmosphere of Kyoto University(RASC) for their continuing support. We thank M.-D. Yama-naka, S. Mori, and J. Hamada of the Frontier ObservationResearch System for Global Change of Japan for providing theGPS radiosonde data. Some of the preliminary observationspresented in the paper were conducted in collaboration withH. Luce (RASC), Y. Otsuka (Solar-Terrestrial EnvironmentLaboratory, Nagoya University), and A. Saito (GeophysicalInstitute, Kyoto University), and we are grateful to them.T. Horinouchi and M. Fujiwara (RASC) are also acknowledgedfor their valuable comments in regard to the data analysis. Wethank R. T. Tsunoda (SRI International) for careful reading of
the original manuscript and W. L. Oliver (Boston University)for editing of its revised version. The authors express theirgratitude to I. Hirota, Professor Emeritus of Kyoto University,for his continuing encouragement. Special thanks are due toS. Kato, Professor Emeritus of Kyoto University, for his adviceand support. This project is partially supported by Grant-in-Aidfor Scientific Research on Priority Area-764 of the Ministry ofEducation, Culture, Sports, Science and Technology of Japan.The operation of EAR is based upon the agreement betweenRASC and LAPAN signed on 8 September 2000.
References
Andrews, D. G., J. R. Holton, and C. B. Leovy, Middle Atmo-
sphere Dynamics, Int. Geophys. Ser., vol. 40, Academic, San
Diego, Calif., 1987.
Bilitza, D., International Reference Ionosphere—Status 1995/
96, Adv. Space Res., 20, 1751–1754, 1997.
Chau, J. L., and R. F. Woodman, Low-latitude quasiperiodic
echoes observed with the Piura VHF radar in the E region,
Geophys. Res. Lett., 26, 2167–2170, 1999.
Choudhary, R. K., K. K. Mahajan, S. Singh, K. Kumar, and
V. K. Anandan, First VHF radar observations of tropical
latitude fs-region field aligned irregularities, Geophys. Res.
Lett., 23, 3683–3686, 1996.
Czechowsky, P., G. Schmidt, and R. Ruster, The mobile
SOUSY Doppler radar: Technical design and first results,
Radio Sci., 19, 441–450, 1984.
Fejer, B. G., and M. C. Kelley, Ionospheric irregularities, Rev.
Geophys., 18, 401–454, 1980.
Fujiwara, M., M. K. Yamamoto, H. Hashiguchi, T. Horinouchi,
and S. Fukao, Turbulence at the tropopause due to breaking
Kelvin waves observed by the Equatorial Atmosphere
Radar, Geophys. Res. Lett., 30(4), 1171, doi:10.1029/
2002GL016278, 2003.
Fukao, S., T. Sato, T. Tsuda, S. Kato, K. Wakasugi, and
T. Makihira, The MU radar with an active phased array
system: 1. Antenna and power amplifiers, Radio Sci., 20,
1155–1168, 1985a.
Fukao, S., T. Tsuda, T. Sato, S. Kato, K. Wakasugi, and
T. Makihira, The MU radar with an active phased array
system: 2. In-house equipment, Radio Sci., 20, 1169–
1176, 1985b.
Fukao, S., T. Sato, and S. Kato, Monitoring of the MU radar
antenna pattern by satellite OHZORA (EXOS-C), J. Geo-
magn. Geoelectr., 37, 431–441, 1985c.
Fukao, S., J. P. McClure, A. Ito, T. Sato, I. Kimura, T. Tsuda,
and S. Kato, First VHF radar observation of midlatitude
F-region field-aligned irregularities, Geophys. Res. Lett.,
15, 768–771, 1988.
Fukao, S., T. Sato, T. Tsuda, M. Yamamoto, M. D. Yamanaka,
and S. Kato, MU radar: New capabilities and system cali-
brations, Radio Sci., 25, 477–485, 1990.
Fukao, S., M. C. Kelley, T. Shirakawa, T. Takami, M. Yama-
moto, T. Tsuda, and S. Kato, Turbulent upwelling of the
midlatitude ionosphere: 1. Observational results by the
MU radar, J. Geophys. Res., 96, 3725–3746, 1991.
FUKAO ET AL.: EQUATORIAL ATMOSPHERE RADAR (EAR) 19 - 15

Gage, K. S., B. B. Balsley, W. L. Ecklund, D. A. Carter, and
J. R. McAfee, Wind profiler-related research in the tropical
Pacific, J. Geophys. Res., 96, 3209–3220, 1991.
Guidice, D. A., and J. P. Castelli, The use of extraterrestrial
radio sources in the measurement of antenna parameters,
IEEE Trans. Aerosp. Electron. Syst., 7, 226–234, 1971.
Hashiguchi, H., S. Fukao, T. Tsuda, M. D. Yamanaka, D. L.
Tobing, T. Sribimawati, S. W. B. Harijono, and H. Wiryo-
sumarto, Observations of the planetary boundary layer over
equatorial Indonesia with an L-band clear-air Doppler radar:
Initial results, Radio Sci., 30, 1043–1054, 1995.
Hocking, W. K., Recent advances in radar instrumentation and
techniques for studies of the mesosphere, stratosphere, and
troposphere, Radio Sci., 32, 2241–2270, 1997.
Hocking, W. K., VHF tropospheric scatterer anisotropy at
Resolute Bay and its implications for tropospheric radar-
derived wind accuracies, Radio Sci., 36, 1777–1793,
2001.
Kudeki, E., and F. R. Stitt, Frequency domain interferometry: A
high resolution radar technique for studies of atmospheric
turbulence, Geophys. Res. Lett., 14, 198–201, 1987.
Luce, H., S. Fukao, M. Yamamoto, C. Sidi, and F. Dalaudier,
Validation of winds measured by MU radar with GPS radio-
sondes during the MUTSI campaign, J. Atmos. Oceanic
Technol., 18, 817–829, 2001a.
Luce, H., M. Yamamoto, S. Fukao, D. Helal, and M. Crochet, A
frequency radar interferometric imaging applied with high
resolution methods, J. Atmos. Sol. Terr. Phys., 63, 221–234,
2001b.
Madden, R. A., and P. R. Julian, Observations of the 40–50-day
tropical oscillation—A review, Mon. Weather Rev., 122,
814–837, 1994.
Maeda, K., H. Alvarez, J. Aparici, J. May, and P. Reich, A
45-MHz continuum survey of the northern hemisphere,
Astron. Astrophys., 140, 145–154, 1999.
Marshall, J. M., A. M. Peterson, and A. A. Barnes Jr. Combined
radar-acoustic sounding system, Appl. Opt., 11, 108–112,
1972.
Murata, F., M. D. Yamanaka, M. Fujiwara, S. Ogino, H. Ha-
shiguchi, S. Fukao, M. Kudsy, T. Sribimawati, S. W. B.
Harijono, and E. Kelena, Relationship between wind and
precipitation observed with UHF radar, GPS rawinsondes
and surface meteorological instruments at Kototabang, West
Sumatera during September–October 1998, J. Meteorol.
Soc. Jpn., 80, 347–360, 2002.
Nakazawa, T., Tropical super clusters within intraseasonal var-
iations over the western Pacific, J. Meteorol. Soc. Jpn., 66,
823–839, 1988.
Palmer, R. D., T. Y. Yu, and P. B. Chilson, Range imaging using
frequency diversity, Radio Sci., 34, 1485–1496, 1999.
Patra, A. K., P. B. Rao, V. K. Anandan, A. R. Jain, and
G. Viswanathan, Evidence of intermediate layer characteris-
tics in the Gadanki radar observations of the upper E region
field-aligned irregularities, Geophys. Res. Lett., 29(14),
doi:10.1029/2001GL013773, 2002.
Rao, P. B., A. R. Jain, P. Kishore, P. Balamuralidhar, S. H.
Damle, and G. Viswanathan, Indian MST radar: 1. System
description and sample vector wind measurements in ST
mode, Radio Sci., 30, 1125–1138, 1995.
Rao, P. B., A. K. Patra, T. V. Chandrasekhar Sarma, B. V.
Krishna Marthy, K. S. V. Subba Rao, and S. S. Hari, Radar
observations of updrafting and downdrafting plasma deple-
tions associated with the equatorial spread F, Radio Sci., 32,
1215–1227, 1997.
Renggono, F., et al., Precipitating clouds observed by L-band
boundary layer radars in equatorial Indonesia, Ann. Geo-
phys., 19, 889–897, 2001.
Rishbeth, H., and O. K. Garriott, Introduction to Ionospheric
Physics, Int. Geophys. Ser., vol. 14, Academic, San Diego,
Calif., 1969.
Sato, T., A. Ito, W. L. Oliver, S. Fukao, T. Tsuda, S. Kato, and
I. Kimura, Ionospheric incoherent scatter measurements
with the middle and upper atmosphere radar: Techniques
and capability, Radio Sci., 24, 85–98, 1989.
Schmidt, G., R. Ruster, and P. Czechowsky, Complementary
code and digital filtering for detection of weak VHF radar
signals from the mesosphere, IEEE Trans. Geosci. Electron.,
17, 154–161, 1979.
Smaini, L., H. Luce, M. Crochet, and S. Fukao, An improved
high-resolution processing method for a frequency domain
interferometric imaging (FII) technique, J. Atmos. Oceanic
Technol., 19, 954–966, 2002.
Spano, E., and O. Ghebrebrhan, Pulse coding techniques for ST/
MST radar systems: A general approach based on a matrix
formulation, IEEE Trans. Geosci. Remote Sens., 34, 304–
316, 1996a.
Spano, E., and O. Ghebrebrhan, Complementary sequences
with high sidelobe suppression factors for ST/MST radar
applications, IEEE Trans. Geosci. Remote Sens., 34, 317–
329, 1996b.
Spano, E., and O. Ghebrebrhan, Sequences of complementary
codes for the optimum decoding of truncated ranges and
high sidelobe suppression factors for ST/MST radar systems,
IEEE Trans. Geosci. Remote Sens., 34, 330–345, 1996c.
Su, S.-Y., H. C. Yeh, and R. A. Heelis, ROCSAT 1 ionospheric
plasma and electrodynamics instrument observations of
equatorial spread F: An early transitional scale result,
J. Geophys. Res., 106, 29,153–29,159, 2001.
Tsuda, T., T. Adachi, Y. Masuda, S. Fukao, and S. Kato, Ob-
servations of tropospheric temperature fluctuations with the
MU radar-RASS, J. Atmos. Oceanic Technol., 11, 50–64,
1994.
Tsunoda, R. T., and B. R. White, On the generation and
growth of equatorial backscatter plumes: 1. Wave structure
in the bottomside F layer, J. Geophys. Res., 86, 3610–
3616, 1981.
Wheeler, M., and G. N. Kiladis, Convectively coupled equato-
rial waves: Analysis of clouds and temperature in the wave-
number-frequency domain, J. Atmos. Sci., 56, 374–399,
1999.
19 - 16 FUKAO ET AL.: EQUATORIAL ATMOSPHERE RADAR (EAR)

Widiyatmi, I., M. D. Yamanaka, H. Hashiguchi, S. Fukao,
T. Tsuda, S. Ogino, S. W. B. Harijono, and H. Wiryosumarto,
Quasi 4 day mode observed by a boundary layer radar at
Serpong (6�S, 107�E), Indonesia, J. Meteorol. Soc. Jpn.,
77, 1177–1184, 1999.
Widiyatmi, I., H. Hashiguchi, S. Fukao, M. D. Yamanaka, S.-Y.
Ogino, K. S. Gage, S. W. B. Harijono, S. Diharto, and
H. Djojodihardjo, Examination of 3–6 day disturbances
over equatorial Indonesia based on boundary layer radar
observations during 1996–1999 at Bukittinggi, Serpong
and Biak, J. Meteorol. Soc. Jpn., 79, 317–331, 2001.
Woodman, R. F., High-altitude resolution stratospheric mea-
surements with the Arecibo 430-MHz radar, Radio Sci.,
15, 423–430, 1980.
Woodman, R. F., and C. L. Hoz, Radar observations of F region
equatorial irregularities, J. Geophys. Res., 81, 5447–5466,
1976.
Woodman, R. F., J. L. Chau, and F. Aquino, Low-latitude
field aligned irregularities observed in the E region with
the Piura VHF radar: First results, Radio Sci., 34, 983–
990, 1999.
Worthington, R. M., R. D. Palmer, and S. Fukao, An investiga-
tion of tilted aspect-sensitive scatterers in the lower atmo-
sphere using the MU and Aberystwyth VHF radars, Radio
Sci., 34, 413–426, 1999.
Yamamoto, M., T. Sato, P. T. May, T. Tsuda, S. Fukao, and
S. Kato, Estimation error of spectral parameters of meso-
sphere-stratosphere-troposphere radars obtained by least
squares fitting methods and its lower bound, Radio
Sci., 23, 1013–1021, 1988.
Yamamoto, M., S. Fukao, R. F. Woodman, T. Ogawa, T. Tsuda,
and S. Kato, Midlatitude E-region field-aligned irregularities
observed with the MU radar, J. Geophys. Res., 96, 15,943–
15,949, 1991.
Yamamoto, M., S. Fukao, T. Ogawa, T. Tsuda, and S. Kato,
A morphological study on mid-latitude E-region field-
aligned irregularities observed with the MU radar, J. Atmos.
Terr. Phys., 54, 769–777, 1992.
Yamamoto, M., N. Komoda, S. Fukao, R. T. Tsunoda, T. Ogawa,
and T. Tsuda, Spatial structure of the E-region field-aligned
irregularities revealed by the MU radar, Radio Sci., 29, 337–
347, 1994.
Yanai, M., and T. Maruyama, Stratospheric wave disturbances
propagating over the equatorial Pacific, J. Meteorol. Soc.
Jpn., 44, 291–294, 1966.
������������S. Fukao, H. Hashiguchi, T. Nakamura, T. Tsuda,
M. Yamamoto, and M. K. Yamamoto, Radio Science Center
for Space and Atmosphere, Kyoto University, Uji, 611-0011
Kyoto, Japan. ([email protected])
M. Hagio and Y. Yabugaki, Communication Systems Center,
Mitsubishi Electric Corporation, 8-1-1 Tsukaguchi-Honmachi,
Amagasaki, 661-8661 Hyogo, Japan.
T. Sato, Graduate School of Informatics, Kyoto University,
Sakyo, 606-8501 Kyoto, Japan.
FUKAO ET AL.: EQUATORIAL ATMOSPHERE RADAR (EAR) 19 - 17