equilibrium isotherm and kinetic studies for the simultaneous … · 2017-09-21 · introduction...
TRANSCRIPT

ORIGINAL ARTICLE
Equilibrium isotherm and kinetic studies for the simultaneousremoval of phenol and cyanide by use of S. odorifera (MTCC5700) immobilized on coconut shell activated carbon
Neetu Singh1 • Chandrajit Balomajumder1
Received: 15 March 2016 / Accepted: 1 September 2016 / Published online: 14 September 2016
� The Author(s) 2016. This article is published with open access at Springerlink.com
Abstract In this study, simultaneous removal of phenol
and cyanide by a microorganism S. odorifera (MTCC
5700) immobilized onto coconut shell activated carbon
surface (CSAC) was studied in batch reactor from mono
and binary component aqueous solution. Activated carbon
was derived from coconut shell by chemical activation
method. Ferric chloride (Fecl3), used as surface modifica-
tion agents was applied to biomass. Optimum biosorption
conditions were obtained as a function of biosorbent
dosage, pH, temperature, contact time and initial phenol
and cyanide concentration. To define the equilibrium iso-
therms, experimental data were analyzed by five mono
component isotherm and six binary component isotherm
models. The higher uptake capacity of phenol and cyanide
onto CSAC biosorbent surface was 450.02 and 2.58 mg/g,
respectively. Nonlinear regression analysis was used for
determining the best fit model on the basis of error func-
tions and also for calculating the parameters involved in
kinetic and isotherm models. The kinetic study results
revealed that Fractal-like mixed first second order model
and Brouser–Weron–Sototlongo models for phenol and
cyanide were capable to offer accurate explanation of
biosorption kinetic. According to the experimental data
results, CSAC with immobilization of bacterium S. odor-
ifera (MTCC 5700) seems to be an alternative and effective
biosorbent for the elimination of phenol and cyanide from
binary component aqueous solution.
Keywords Cyanide � Impregnation � Phenol � Kinetic �Microorganism � Multicomponent modeling
Nomenclature
Qo Langmuir model constant (mg/g)
b Langmuir model constant
Qe;i Amount of ith component adsorbed per gram of
adsorbent at equilibrium (mg/g)
Qo;i Constant in modified Langmuir model for ith
component (mg/g)
Ce;i Concentration of ith component in the binary
mixture at equilibrium (mg/L)
KF Freundlich model constant (mg/g)
n Freundlich, Toth model constant
KF;i Extended Freundlich model constant (mg/g)
KRP Redlich-Peterson model constant (L/g)
aRP Redlich-Peterson model constant (Lmg)
b Redlich-Peterson model constant
gRP;i Binary component Redlich-Peterson model
constant (L/g)
aRP;i Binary component Redlich-Peterson model
constant (L/mg)
bj Binary component Redlich-Peterson model
constant
xi ; yi ; zi Constant in modified Redlich-Peterson model
N Number of observations in the experimental
isotherm
P Number of parameter in the regression model
Qexpe;i Experimental value of Qe (mg/g)
Qcale;i
Predicted value of Qe (mg/g)
a1 Constant in Fritz–Schlunder isotherm (mg/g)/
(mg/L)b1
a2 Constant in Fritz–Schlunder isotherm (mg/L) - b2b1b2 Constants in Fritz–Schlunder isotherm
& Neetu Singh
Chandrajit Balomajumder
1 Department of Chemical Engineering, Indian Institute of
Technology, Roorkee, India
123
Appl Water Sci (2017) 7:3241–3255
DOI 10.1007/s13201-016-0470-8
Introduction
Currently, with the rapid increase of industries, water
pollution problem has become progressively serious
(Doney 2010). Among all pollutants enclosed in industrial
wastewater, phenol and cyanide are considered the most
hazardous compounds for the environment (Busca et al.
2008; Vedula and Balomajumder 2011). Phenol and cya-
nide are regularly derived from wastewater generated from
synthetic fuel processing, petrochemicals, and steel man-
ufacturing industries comprises high concentrations of
phenol (700–6000 mg/L), and cyanide (10–150 mg/L)
(Kim et al. 2008; Liu et al. 1996). Moreover, phenol and
cyanide can also increase risks of heart pains, thyroid gland
enlargement, breathing disorders, headaches, gastroin-
testinal disorders, skin and eyes injuries, central nervous
system, kidney, liver, lung damage, and even death
(ATSDR 2006, 2008). Because of its several harmful
effects, the elimination of phenol and cyanide from
industrial wastewaters before their release into water bod-
ies is measured to be essential (Lu et al. 2012). The max-
imum tolerance limit for phenol and cyanide in drinking
water according to the Minimum Nationals Standards
(MINAS) of the Central Pollution Control Board (CPCB)
in India and US Environmental Protection Agency
(USEPA), is 0.5 and 0.2 mg/L, respectively (Busca et al.
2008; Akcil 2003). Numerous methods have been used for
elimination of phenol and cyanide from wastewater com-
prising biosorption, solvent extraction, electrochemical
oxidation, membrane separation, chemical coagulation, and
photocatalytic degradation, etc. (Akcil 2003; Dash et al.
2009; Kujawski et al. 2004). Out of these treatment
methods, biosorption has been established to be the supe-
rior method. It is a well-organized and inexpensive method
for elimination of phenol and cyanide (Agarwal et al. 2013;
Lin and Juang 2009; Singh et al. 2016). Therefore,
numerous biosorbents have been established and widely
used for biosorption of phenol and cyanide (Agarwal et al.
2013; Lin and Juang 2009; Singh et al. 2016; Daffalla et al.
2013).
Coconut shell activated carbon is most widely used as
biosorbent for the treatment of industrial effluents (Kir-
ubakaran et al. 1991; Su et al. 2003). Furthermore, to
enhance the biosorption capacity of biosorbents, surface
modification by metal impregnation technique has been
employed. Several authors were using metal impregnation
technique in the literature for the removal of pollutants due
to its high removal efficiency (Deveci et al. 2006; Mondal
et al. 2008).
Though, since biosorption is just a process of focussing
the toxicants onto the biosorbent surface, the biosorbent will
no longer be useful when the active sites available onto
surface have been exhausted. The spent biosorbent converts
a secondary waste and will essential to be either discarded or
regenerated. The use of microorganisms to regenerate the
surface of the biosorbent for more removal is known as
bioregeneration/bioaccumulation. Studies based on the
simultaneous biosorption and bioregeneration/bioaccumu-
lation of biosorbents have been reported by many
researchers (Agarwal and Balomajumder 2013; Dash et al.
2008; Silva et al. 2004). As a promising knowledgeS,
bioregeneration process defined by which the surface of the
biosorbent is being regenerated by the action of microor-
ganisms, thus increasing the removal capacity of biosorbent.
The encouraging effects of the simultaneous biosorption and
bioaccumulation processes for the treatment of toxic com-
pounds are esteemed in the enhancement of the bioaccu-
mulation rate and an increase in the removal capacity of
biosorbents. Some of the bacteria having phenol and cyanide
degradability capacity are S. odorifera, R. erythropolis, P.
putida, Bacillus, A. chroococcum 446, etc. (Agarwal and
Balomajumder 2012; Dash et al. 2008, 2009a, 2014; Prieto
et al. 2002).
However, the main intention of this current investigation
are, (1) to develop an environmental friendly and cost
effective biosorbent from coconut shell, (2) to determine
the optimum value of experimental parameters affecting
the process viz. biosorbent dose, pH, contact time, tem-
perature and initial concentration of phenol and cyanide for
simultaneous elimination of phenol and cyanide by the use
of immobilized culture of S. odorifera (MTCC 5700) onto
the surface of CSAC, (3) to determine the parameters of
mono component and binary component adsorption equi-
librium isotherms models, and (4) to determine the kinetics
of process and find out the best fit kinetic models.
Materials and methods
Preparation of biosorbent
Coconut shell was collected from local market of Roorkee,
India. Coconut shell was first washed with double distilled
water to eliminate the impurities like dirt and dried at
60 �C temperature in an oven for 12 h. After drying,
coconut shell was crushed in a high-speed rotary mill into
2–3 mm size of pieces and stored for additional processing
in a muffle furnace (Amudaa et al. 2007; Sodeinde 2012).
To prepare the coconut shell activated carbon using
chemical activation method, the dried coconut shell was
soaked with 2N H2S04 in a muffle furnace at temperature
300 �C for 12 h in 1:3 ratio of solid to liquid to enhance the
surface area. The coconut shell activated carbon was
washed with Millipore water to eliminate residual
3242 Appl Water Sci (2017) 7:3241–3255
123
chemicals and then the sample was dried at 110 �C tem-
perature for 24 h. The surface modification of CSAC was
achieved by impregnation with ferric chloride (Fecl3). The
impregnation was carried out at 70 �C in an oven until the
complete evaporation of water was detected, and then the
CSAC was dried at 110 �C for 24 h (Mondal et al. 2008).
The dried sample was washed with Millipore water until
the washing liquid was free from iron, and then dried to
constant weight and used as impregnated activated carbon
for further studies.
Chemicals and preparation of adsorbate solutions
All analytical reagent grade chemicals were used without
additional purification in this study and supplied by
Himedia Laboratories Pvt. Mumbai, India. Double dis-
tilled, deionized water (Milli-Q Millipore 18.2 M/cm
conductivity) was used for preparation of all solutions. A
stock solution of phenol and cyanide were prepared by
dissolving measured amount of phenol and sodium cyanide
in 1 L of deionized water with varying concentrations of
phenol 100–1000 mg/L and cyanide 10–100 mg/L.
Acclimatization and immobilization
of microorganism
The strain S. odorifera (MTCC 5700) was isolated from
coke industry wastewater in the laboratory, by Agarwal and
Balomajumder (2012). The composition of growth mineral
media was Na2HPO4, KH2PO4, NaCl, NH4Cl, MgSO4-
7H2O and glucose in distilled water. All inoculations were
achieved in aseptic environments in laminar air flow unit
(Rescholar Equipment, INDIA). Acclimatization process
was accompanied for familiarization of strain to phenol and
cyanide environment. The pH was pre adjusted to 8 and the
growth medium sterilized using autoclave at 121 �C for
15 min. To acclimatize the strain, 2 % glucose was sup-
plemented for suitable growth of the strain in growth
medium comprising substrate phenol and cyanide. Strain
was acclimatized by revealing them to the toxic solution in
a sequence of 250 mL conical flasks with working volume
of 100 mL. Glucose concentration was reduced regularly
with increasing concentration of the phenol and cyanide
into the growth medium for a period of 30 days. After
acclimatization, the medium was solidified with 2 % of
pure agar (Merck). The flasks were incubated at 30 �C in
an incubator cum orbital shaker (Metrex, MO-250, India)
with shaking speed 120 rpm in the dark to avoid photo-
destruction of phenol and cyanide. The cultures were
streaking on agar plates added with phenol and cyanide and
incubated at 30 �C for 48 h. The growth curve of
microorganism S. odorifera (MTCC 5700) was obtained by
centrifuge the cultivated cells of S. odorifera (MTCC 5700)
at 8000 rpm for 15 min. Thereafter, the pellet was formed
at the bottom of the centrifuge tube. The pellet was washed
with double distilled water and observed its optical density
(O.D.) at 600 nm at time interval of 2 h in UV–Vis spec-
trophotometer (Hach, USA). Maximum growth of strain
was obtained at 30 h, and continues till 42 h, further than
the strain starts to decline.
Batch experimental procedure
The biosorption of phenol and cyanide onto CSAC was
carried out by batch process in an orbital shaker. The batch
biosorption experiments were accomplished in 250 mL
glass flasks with 100 mL of phenol and cyanide solutions
of known concentration. The solution was continuously
stirred at fixed temperature for an assured time to attain the
equilibrium. The time after which no change in percentage
removal or concentration is detected, will be the equilib-
rium time. After attaining an equilibrium process, the
biosorbent gets separated from samples using Whatman
filter No. 41 and microorganism separated by centrifuge at
10,000 rpm. Thereafter, concentration of phenol and cya-
nide was determined using UV–Vis spectrophotometer
(APHA 1998). To examine the influence of biosorption
parameters on biosorption of phenol and cyanide onto
CSAC, such as biosorbent dosage (5–60 g/L), pH (4–12),
initial phenol concentration (100–1000 mg/L), initial cya-
nide concentration (10–100 mg/L), contact time (2–50 h)
and temperature (20–40 �C), were calculated in a batch
approach.
The total amount of phenol and cyanide adsorbed per
unit mass of the biosorbent at equilibrium (Qe) and at time t
(Qt) was designed using the following equation,
Qt ¼ ðCi � CtÞV=M ð1ÞQe ¼ ðCi � CeÞV=M ð2Þ
The percent removal of phenol and cyanide was
calculated as follows:
Percentage removal ¼ ðCi � CfÞ=Cið Þ � 100 ð3Þ
where:
Qe is the amount of phenol and cyanide adsorbed on to
the per unit mass of biosorbent at equilibrium (mg/g), Qt is
the uptake of phenol and cyanide at time t (mg/g), Cf is the
final concentration of phenol and cyanide (mg/L), Ct is the
liquid phase concentration of phenol and cyanide at time
t (h), Ci is the initial pollutant concentration (mg/L), Ce is
the concentration of adsorbate at equilibrium (mg/L), V is
the volume of the solution (L), M is the weight of the
biosorbent (g).
Equilibrium isotherm was achieved by changing the
initial concentration of phenol and cyanide solution
100–1000 and 10–100 mg/L, respectively. Kinetic studies
Appl Water Sci (2017) 7:3241–3255 3243
123

were accomplished by changing the phenol and cyanide
concentration and samples were collected at several time
intervals till the equilibrium reached.
Equilibrium isotherm modeling
Adsorption equilibrium isotherms are defining the equilib-
rium interactions between the adsorbed ions in the aqueous
solution at a specified temperature. To relate the isotherm
equilibrium data, five monocomponent isotherm models
and six binary component isotherm models are designated
from the literature. Monocomponent isotherm models, such
as Langmuir, Freundlich, Redlich–Peterson, Toth and
Fritz–Schlunder, and binary component isotherm, such as
non-modified Langmuir, modified Langmuir, extended
Langmuir, extended Freundlich, non-modified Redlich-
Peterson and modified Redlich-Peterson models were used.
The Langmuir model recommends a monolayer uptake
of the adsorbate onto homogeneous surface of biosorbent,
having equal adsorption energies for all available binding
sites without any collaboration between the biosorbent
(Sawalha et al. 2006). The nonlinear form of the Langmuir
isotherm model is represented by the subsequent equation:
Qeq ¼ ðQ0bCeÞ=ð1þ bCeÞ ð4Þ
The Langmuir model parameters can be used to
calculate the attraction between the biosorbent and
adsorbate using dimensionless separation factor (RL). RL
is designed by the following equation:
RL ¼ 1=ð1þ bC0Þ ð5Þ
The value of RL shows the nature of the isotherm to be
either favorable (0\RL\ 1), unfavorable (RL[ 1), linear
(RL = 1), or irreversible (RL = 0).
In Freundlich isotherm model, KF is the measurement of
the biosorption capacity and n is the measurement of the
intensity of biosorption (Sawalha et al. 2006). The non-
linearized form of Freundlich isotherm equation is shown
by the following equation:
Qeq ¼ KFC1=ne ð6Þ
Redlich-Peterson model combines the features of the
Langmuir and Freundlich isotherm models. A nonlinear
form of Redlich-Peterson model is given below:
Qeq ¼ KRP � Ceq
.1þ aRP:C
beq ð7Þ
where KRP and aRP are the Redlich-Peterson isotherm
model constants and b is the exponent of Redlich-Peterson
isotherm, which lies between 0 and 1 (Carvalho et al.
2007).
Toth and Fritz–Schlunder models are not common in use
to define adsorption of organic compounds onto CSAC.
Toth model and Fritz–Schlunder model equation are given
below:
Toth model:
Qeq ¼ qto � Ceq
.ðaþ Cn
eqÞ1=n ð8Þ
Fritz–Schlunder:
Qeq ¼ a1 � Cb1eq
.1þ a2C
b2eq ð9Þ
TheMarquardt’s percent standard deviation (MPSD) error
functionwas used to correlate the experimental and calculated
values for isotherm and kinetic models are given below:
MPSD ¼ 100
ffiffiffiffiffiffiffiffiffiffiffiffiffiffiffiffiffiffiffiffiffiffiffiffiffiffiffiffiffiffiffiffiffiffiffiffiffiffiffiffiffiffiffiffiffiffiffiffiffi1
n� p
Xp
i¼1
Qexpe;i � Qcal
e;i
Qexpe;i
!vuut2
ð10Þ
The solution containing binary components has a
complicated biosorption mechanism with competition
between components and biosorbents sites. The isotherm
model Eqs. (11–17) given below have been used to
evaluate binary component biosorption behavior (Aksu
and Akpinar 2008; Panagou and Kodogiannis 2009).
Non-modified Langmuir:
Qe;i ¼ ðQ0;ibiCe;iÞ=ð1þXN
j¼1bjðCe;j=njÞÞ ð11Þ
Modified Langmuir:
Qe;i ¼ ðQ0;ibiCe;i=niÞ=ð1þXN
j¼1bjðCe;j=njÞÞ ð12Þ
Extended Langmuir:
Qe;i ¼ ðQ0;ibiCe;iÞ=ð1þXN
j¼1bjCe;jÞ ð13Þ
Extended Freundlich:
Qe;i ¼ ðKF;iC1=niþxie;i Þ=ðCxi
e;i þ y1Cz;ie;jÞ ð14Þ
Qe;j ¼ ðKF;jC1=njþxje;j Þ=ðCxj
e;j þ y2Cz;je;iÞ ð15Þ
Non-modified Redlich-Peterson model
Qe;i ¼ KRPi � Ceqi
,1þ
XNj¼1
aRPjðCeqjÞbj ð16Þ
Modified Redlich-Peterson model
Qe;i ¼ KRPi :Ceqi
gRP;i
!,1þ
XNj¼1
aRPjCeq;i
gRP;i
!bj
ð17Þ
The ratio of capacities of adsorption process (Qq,i) is
defined by given formula:
Qq;i ¼ Qi;multi
�Qi;single ð18Þ
where Qi,multi is the binary component adsorption capacity
for component i in the binary solution and Qi,single is the
3244 Appl Water Sci (2017) 7:3241–3255
123

monocomponent adsorption capacity of the same pollutant
at the similar operating conditions of the binary solution.
Parameter Qq,i permits to relate the binary component
biosorbent performance with the results acquired in
monocomponent systems using the same operating
environments.
Literature designates that (Reynel-Avila et al. 2011) (1)
if Qq,i[ 1, the presence of other component in binary
component systems increases the biosorption of component
i (i.e., synergistic adsorption), (2) if Qq,i = 1, there is no
effect on the binary component biosorption of component i,
and (3) if Qq,i\ 1, the biosorption of component i, is
decrease by the presence of other component in the binary
component aqueous solution (i.e., antagonistic adsorption).
Kinetic modeling
Adsorption kinetic modeling was established to recognize
the mechanism of phenol and cyanide biosorption on to
biosorbents. Kinetics studies distribute the information
about the possible mechanism of biosorption that com-
prises the diffusion (external, intraparticle and bulk) and
chemical reactions. In general, the adsorbate transport
follows in the few steps.
(1) The transport of adsorbate in the bulk solution, (2) the
external diffusion from the bulk solution to the exterior sur-
face of the biosorbent, (3) the transport of the adsorbate
through the boundary layer (4) the transfer of adsorbate in the
pores of the biosorbent and lastly uptake of adsorbate mole-
cules by the active sites, and (5) the biosorption and des-
orption of adsorbate (Michalak et al. 2013). To evaluate the
dynamic biosorption behavior of phenol and cyanide onto S.
odorifera MTCC 5700 immobilized on CSAC, fourteen
kinetic models were used in this study assuming that con-
centrations of adsorbate on the adsorbent surface are equal to
the measured concentrations. Among them, fractional power
model, pseudo first order and pseudo second order are the
empirical models, though their major shortcoming is that they
may only define the adsorption kinetics at some situations
(Haerifar and Azizian 2013). Elovich kinetic model, frac-
tional power, Ritchie second order and exponential kinetic
models are two the parametric empirical models to analyze
the kinetic data. Other three parametric kinetic models, for
example, Avrami, modified pseudo second order, and mixed
first, second order equations have been suggested for
adsorption kinetics at the solid/solution interface.
Equations (19)–(32) describes various kinetic models
used in this study.
Fractional power model:
qt ¼ kfptv ð19Þ
Where kfp is the fractional power model rate constant
(mg g-1 h-1), v is the adjustment parameter.
Pseudo first order:
qt ¼ qeð1� expð�k1tÞÞ ð20Þ
where k1 is the pseudo first order adsorption rate constant
(h-1).
The pseudo second order kinetics model is expressed as:
Pseudo second order:
qt ¼ k2q2e t=ð1þ qek2tÞ ð21Þ
where k2 is the pseudo second order adsorption rate con-
stant (g mg-1 h-1).
Elovich model:
qt ¼2:3
bel
� �� log
t þ 1
aelbel
� �� 2:3
bel
� �� log
1
aelbel
� �ð22Þ
where, ael Elovich coefficient representing the initial
adsorption rate (g mg-1 h-1), bel Elovich coefficient rep-
resenting desorption constant (g mg-1).
Avrami model:
qt ¼ qe 1� exp½�ðkavtÞ�navð Þ ð23Þ
where, kav the Avrami kinetic rate coefficient (h-1), nav the
constant corresponding to the mechanism of adsorption.
Modified second order model:
qt ¼ qe 1� 1
b1m þ k1mt
� �� �ð24Þ
where, k1m is the modified second order rate coefficient
(h-1), b1m constant.
Ritchie second order model:
qt ¼ qe 1� 1
1þ k1Rt
� �� �ð25Þ
where, k1R is the Ritchie second order rate coefficient (h-1)
Exponential kinetic model:
qt ¼ qeðln½2:72� 1:72 expð�kextÞ�Þ ð26Þ
where, kex is the exponential rate coefficient (mg/g)
Mixed first, second order model:
qt ¼ qe1� expð�kmtÞ1� f2 expð�kmtÞ
� �ð27Þ
where, km is the mixed first, second order rate coefficient
(h-1), f2 is the involvement of pseudo second order model.
Fractal-like mixed first, second order model:
qt ¼ qe1� expð�kfmt
aÞ1� feq expð�kfmtaÞ
� �ð28Þ
where, kfm is the Fractal-like mixed first, second order rate
coefficient (h-1)a , ta is the Fractal time.
Fractal-like first order model:
qt ¼ qeð1� expðkff taÞÞ ð29Þ
Appl Water Sci (2017) 7:3241–3255 3245
123
where, kff is the Fractal-like pseudo first order kinetic rate
coefficient (h-1)
Fractal-like second order model:
qt ¼ kfsq2e ta=ð1þ qekfst
aÞ ð30Þ
where, kfs is the Fractal-like pseudo second order kinetic
rate coefficient (h-1).
Fractal-like exponential model:
qt ¼ qeðln½2:72� 1:72 expð�kfextaÞ�Þ ð31Þ
where, kfex is the Fractal-like exponential rate coefficient
(h-1)
Brouser–Weron–Sototlongo model:
qt ¼ qe 1� 1þ nbws � 1ð Þ t
tbws;a
� �a� ��1=ðnbws�1Þ" #
ð32Þ
where, tbws,a the time required for adsorbing half the
maximum amount, nbws is the fractional reaction order.
Results and discussion
Characterization of biosorbent
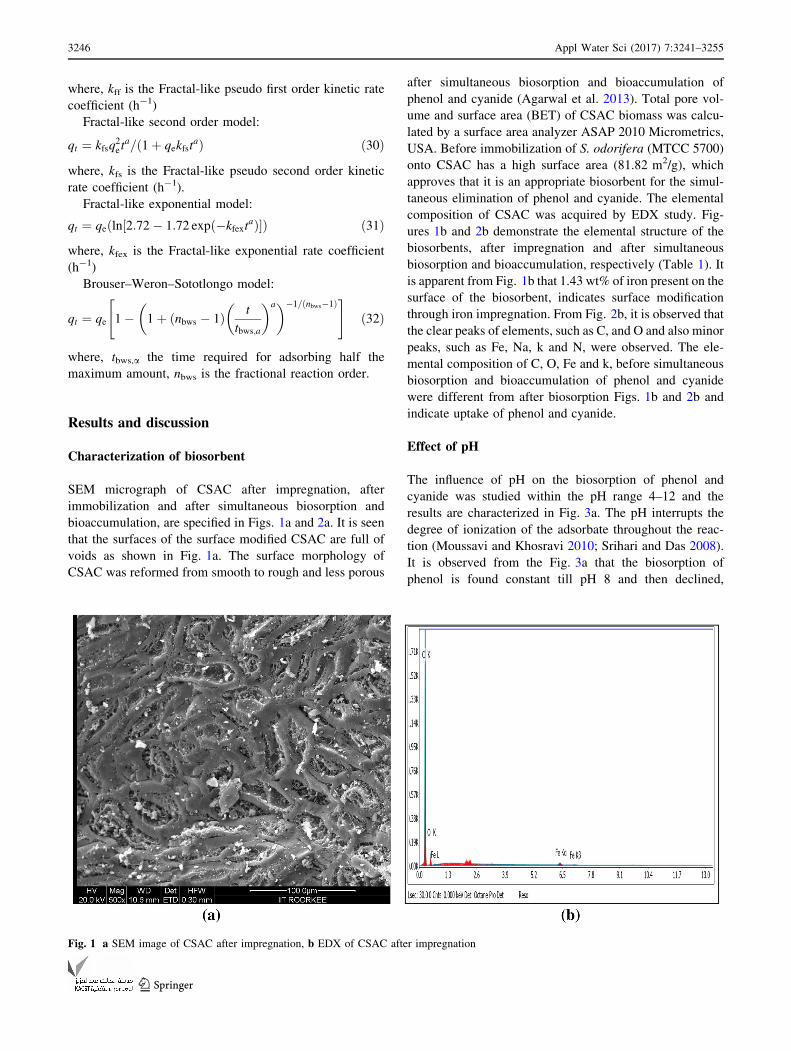
SEM micrograph of CSAC after impregnation, after
immobilization and after simultaneous biosorption and
bioaccumulation, are specified in Figs. 1a and 2a. It is seen
that the surfaces of the surface modified CSAC are full of
voids as shown in Fig. 1a. The surface morphology of
CSAC was reformed from smooth to rough and less porous
after simultaneous biosorption and bioaccumulation of
phenol and cyanide (Agarwal et al. 2013). Total pore vol-
ume and surface area (BET) of CSAC biomass was calcu-
lated by a surface area analyzer ASAP 2010 Micrometrics,
USA. Before immobilization of S. odorifera (MTCC 5700)
onto CSAC has a high surface area (81.82 m2/g), which
approves that it is an appropriate biosorbent for the simul-
taneous elimination of phenol and cyanide. The elemental
composition of CSAC was acquired by EDX study. Fig-
ures 1b and 2b demonstrate the elemental structure of the
biosorbents, after impregnation and after simultaneous
biosorption and bioaccumulation, respectively (Table 1). It
is apparent from Fig. 1b that 1.43 wt% of iron present on the
surface of the biosorbent, indicates surface modification
through iron impregnation. From Fig. 2b, it is observed that
the clear peaks of elements, such as C, and O and also minor
peaks, such as Fe, Na, k and N, were observed. The ele-
mental composition of C, O, Fe and k, before simultaneous
biosorption and bioaccumulation of phenol and cyanide
were different from after biosorption Figs. 1b and 2b and
indicate uptake of phenol and cyanide.
Effect of pH
The influence of pH on the biosorption of phenol and
cyanide was studied within the pH range 4–12 and the
results are characterized in Fig. 3a. The pH interrupts the
degree of ionization of the adsorbate throughout the reac-
tion (Moussavi and Khosravi 2010; Srihari and Das 2008).
It is observed from the Fig. 3a that the biosorption of
phenol is found constant till pH 8 and then declined,
Fig. 1 a SEM image of CSAC after impregnation, b EDX of CSAC after impregnation
3246 Appl Water Sci (2017) 7:3241–3255
123

Fig. 2 a SEM image of CSAC after simultaneous biosorption and bioaccumulation, b EDX of CSAC after simultaneous biosorption and
bioaccumulation
Table 1 Surface properties of coconut shell activated carbon (CSAC)
BET surface
area (m2/g)
Monolayer
volume (cm2/g)
Total pore
volume (m3/g)
1. Raw CSAC 67.85 11.76 0.0086
2. Before immobilization with S. odorifera 81.82 15.56 0.011
3. After immobilization with S. odorifera 56.98 3.87 0.010
4. After simultaneous biosorption and
bioaccumulation of phenol and cyanide
9.99 0.098 0.008
Fig. 3 a Effect of pH on % removal of phenol and cyanide. b Effect of dose on % removal of phenol and cyanide
Appl Water Sci (2017) 7:3241–3255 3247
123

whereas biosorption of the cyanide is found to be increased
initially from pH 4–8 and after pH 8 it become constant
(Dash et al. 2009b). The maximum biosorption of phenol
and cyanide was observed at pH 8 as 89.06 and 93.62 %,
respectively (Moussavi and Khosravi 2010; Kilic et al.
2011). This may be owing to the variance in the concen-
trations of OH- and H? in the aqueous solutions. The H?
ions at low pH atmospheres can deactivate negative sites,
decrease the hindrance to distributions of pollutants ions,
and therefore increase the probabilities of their biosorption.
High pH atmospheres lead to more concentration of OH-,
which can raise the interference to the diffusions of ions,
and thus decrease the probabilities of biosorption
(Mukherjee et al. 2007; Stavropoulos et al. 2015). The
reduction of phenol biosorption at high pH was due to the
electrostatic repulsions between the negative charge onto
biosorbent surface and phenol anions in the solution. The
major increase in the adsorption of cyanide was found
above pH 7 in NaCN solution. This is due to the fact that
cyanide is hydrolyzed in solution to form HCN. The pKa
value of hydrocyanic acid is 9.4. So, at pH[ 9.4, HCN
dissociates to CN- ions, whereas at pH\ 9.4 cyanide
occurs in HCN (Stavropoulos et al. 2015; Dash et al. 2009).
Then, CN- is a nucleophilic ion and when it comes in
contact with the negatively charged biosorbent, it fixes with
the anionic functional groups available on the biosorbent
surface, and thus increases adsorption. Mostly, researches
detected higher biosorption of cyanide at pH values 8–11
(Stavropoulos et al. 2015).
Effect of biosorbent dose
The effect of biosorbent dosage on the biosorption of
phenol and cyanide was determined within the range of
biosorbent dose 5–60 g/L and the results are characterized
in Fig. 3b. It is identified that the rise in biosorbent con-
centration caused in an increase in percent biosorption of
phenol and cyanide due to the more availability of the
surface area or transferable active sites, but reduced the
biosorption due to the incomplete accumulation or over-
lapping of biosorbent, which outcomes in a reduction in
active surface area for the biosorption. It can be understood
from Fig. 3b that removal efficiency, increased with
increasing biosorbent dose for both phenol and cyanide, but
after a definite dosage, the removal efficiency was not
increased considerably (Mondal et al. 2008). Thus, the
optimum amounts of CSAC dose for additional biosorption
experiments were designated as 30 g/L for both phenol and
cyanide.
Effect of contact time
The biosorption of phenol and cyanide onto CSAC was
carried out at varying contact time (2–50 h). It is clear from
Fig. 4a that the biosorption of phenol and cyanide was fast
at the initial stage and equilibrium was attained in 42 h for
phenol and 40 h for cyanide, where 86.34 % phenol and
92.50 % cyanide was adsorbed. After equilibrium, no sig-
nificant enhancement was observed in the biosorption
Fig. 4 a Effect of contact time on % removal of phenol and cyanide. b Effect of temperature on % removal of phenol and cyanide
3248 Appl Water Sci (2017) 7:3241–3255
123

process. The fast biosorption of phenol and cyanide at the
beginning may be owing to the obtainability of huge
number of active vacant surface sites on the CSAC surface.
Therefore, the molecules of phenol and cyanide were
accumulate onto the surface of CSAC, and as a result, the
residual vacant sites were problematic to be occupied
owing to the establishment of repulsive forces between
phenol and cyanide molecules (on biosorbent surface and
in the aqueous phase) as well as fewer number of available
active vacant sites (Kumar et al. 2011; Ren et al. 2007).
Effect of temperature
The effect of temperature for the biosorption of phenol
and cyanide onto CSAC is shown in Fig. 4b. It was
detected that the biosorption of phenol decreased from
91.5 to 87.86 % and biosorption of cyanide increased
from 90.12 to 93.6 % with an increase in temperature
from 20 to 40 �C, respectively. The decreased removal
efficiency of phenol with an increase in temperature,
demonstrates an exothermic process. The decrease in
biosorption with the increase in temperature was owing to
the weakening of the attractive force between the adsor-
bate and CSAC, and comparable due to the improvement
of thermal energies of the adsorbate, therefore, production
of the attractive forces between biosorbent and adsorbate
is not strong sufficient to hold the adsorbed molecules at
the active binding sites (Mukherjee et al. 2007). The
increase in biosorption of cyanide with increase in tem-
perature is maybe due to rise in active biosorption sites
resulting from the internal bonds breaking at near the
edge of the active sites of the biosorbent surface and
shows an endothermic process (Dash et al. 2009). As the
temperature of solution increase, the viscosity of solution
start to decrease, and therefore, increase in the rate of
diffusion of adsorbate inside the pores (Mukherjee et al.
2007; Stavropoulos et al. 2015; Dash et al. 2009b, c).
Therefore, the optimum temperature was designated as
30 �C for both phenol and cyanide.
Effect of initial concentration of phenol and cyanide
The initial concentration of adsorbate offers a significant
driving force to overcome all the mass transfer resistance
of cyanide and phenol between the solid and aqueous
phase. The biosorption of phenol and cyanide onto CSAC
was calculated by changing the initial concentration at
constant biosorbent dose, contact time, temperature and
pH (Fig. 5a, b). It was established that the removal per-
centage of phenol was decreased from 99.64 to 76.39 %
as the initial concentration of phenol increased from 100
to 1000 mg/L and percentage removal of cyanide was
decreased from 98.2 to 73.4 % as the initial concentration
of cyanide increased from 10 to 100 mg/L. The high
removal efficiency at lower concentrations may be owing
to the existence of more available vacant sites on the
biosorbent than the number of phenol and cyanide ions
which exist in the solution. Though, at higher concentra-
tions, the ions of phenol and cyanide are comparatively
higher than the available vacant sites for biosorption.
Fig. 5 a Effect of initial concentration of phenol on % removal, b Effect of initial concentration of cyanide on % removal (process conditions:
biosorbent dosage of 30 g/L, pH of 8, temperature 30 �C and contact time 50 h)
Appl Water Sci (2017) 7:3241–3255 3249
123

Adsorption equilibrium isotherm study
The modeling and processing of adsorption experimental
data are essential for the process engineering (e.g., opera-
tion, optimization, design) of wastewater treatment
schemes (Kumar et al. 2011). According to the literature,
several monocomponent and binary component biosorption
models can be employed to fit experimental biosorption
data (Kumar et al. 2011).
Monocomponent equilibrium isotherm
The MPSD values of isotherm can be used to obtain the
best fit model were listed in Table 2. Comparison of
monocomponent isotherm models are given in Fig. 6a, b.
From the table and figure, the best fitted isotherm models
for phenol are evaluated in the order: (Freundlich[Red-
lich-Peterson[ Fritz-Schlunder[Toth[Langmuir), and
best fitted isotherm models for cyanide adsorption onto
CSAC are in the order: (Toth[ Fritz-Schlunder[ Red-
lich-Peterson[ Freundlich[Langmuir).
In this study, the value of RL has been found less than 1
for both phenol and cyanide indicating that the biosorption
of phenol and cyanide onto CSAC is very favorable under
prevalent operating conditions. The Freundlich isotherm
constant n were, calculated to be more than unity for both
phenol and cyanide representing that the biosorption of the
phenol and cyanide onto the CSAC is favorable (Aksu and
Akpinar 2008). However, the values of Q0 for phenol were
found to be more than that of cyanide which could be
described on the basis of higher concentration of phenol in
the binary solution.
Binary component equilibrium isotherm
For the binary component isotherm study, a binary com-
ponent aqueous solution of phenol and cyanide was used
and the simultaneous biosorption and bioaccumulation was
studied at 30 �C. It was noticed that percentage removal of
both components decreased with increased initial concen-
tration. Binary component isotherm study results demon-
strate that for 500 mg/L concentration of phenol with the
presence of 50 mg/L of cyanide, Qph was 14.85 mmol g/L.
Similarly for 100 mg/L concentration of cyanide with the
presence of 1000 mg/L of phenol, Qph was 25.46 mmol g/
L for CSAC. It is observed that capacity of competitive
biosorption is increased, which is due to fact that its
dependence on the initial concentration of the pollutants,
the surface structure of the biosorbents and the molecular
structure of the competing adsorbate (Ren et al. 2007).
Comparison of binary component isotherm models is given
in Fig. 7a, b.
It is evident from Table 2 that extended Freundlich model
indicate a better fit for experimental biosorption with low
Table 2 Monocomponent and binary component model parameters for simultaneous biosorption and bioaccumulation of phenol and cyanide
onto CSAC
Adsorbate Langmuir model Freundlich model Redlich-Peterson model
Qo b MPSD KF n MPSD KRP aRP b MPSD
Phenol 19.08 0.13 33.04 4.32 3.14 4.002 118017.12 273129 0.68 4.00
Cyanide 2.04 1.66 18.55 0.93 2.90 11.52 7.96 6.48 0.77 4.07
Adsorbate Toth model Fritz-Schlunder model
qto a n MPSD a1 a2 b1 b2 MPSD
Phenol 36304.00 0.51 0.04 5.91 2.59 -0.001 0.32 0.03 4.01
Cyanide 3.13 0.58 0.28 3.65 1.54 1.43 0.68 0.54 3.77
Adsorbate Non-modified
Langmuir
Modified Langmuir Extended Langmuir Extended Freundlich
MPSD gi;j MPSD Qo;i bi MPSD xi yi zi MPSD
Phenol 99.11 0.83 53.26 450.02 0.01 9.83 -0.0004 0.06 -0.18 8.77
Cyanide 46.56 1.03 51.43 2.58 0.55 9.27 0.0204 0.27 -0.78 6.14
Adsorbate Non-modified Redlich-
Peterson model
Modified Redlich-Peterson model
MPSD ni;j MPSD
Phenol 10.26 1.14 9.01
Cyanide 111.66 111.07 111.80
3250 Appl Water Sci (2017) 7:3241–3255
123

MPSD values for phenol and cyanide. Biosorption of phenol
followed the tendency of better fit models as: non-modified
Langmuir\modified Langmuir\ non-modified Redlich-
Peterson\ extended Langmuir\modified Redlich-Peter-
son\ extended Freundlich, whereas biosorption of cyanide
followed the trend: modified Redlich-Peterson\ non-mod-
ified Redlich-Peterson\modified Langmuir\non-
modified Langmuir\ extended Langmuir\ extended
Freundlich.
In this study, the ratio of capacities of adsorption pro-
cess (Qq,i) for phenol and cyanide was calculated as 23.58
and 1.27, hence founding the fact that both phenol and
cyanide show synergism effects.
(a) (a)
Fig. 6 a Comparison of monocomponent isotherm models for phenol, b comparison of monocomponent isotherm models for cyanide
(a) (b)
Fig. 7 a Comparison of binary component isotherm models for phenol, b comparison of binary component isotherm models for cyanide
Appl Water Sci (2017) 7:3241–3255 3251
123

Kinetic study
Kinetic data of adsorbate uptake is essential to know the
optimum operating conditions for batch process. A non-
linear regression analysis technique was used to solve the
adsorption kinetic models. Table 3 demonstrates the values
of kinetic model constants for the removal of phenol and
cyanide by S. odorifera (MTCC 5700) immobilized on the
surface of CSAC. High error values recommending that
these models (fractional power, pseudo first order, Avrami
and exponential) are not suitable for both phenol and
cyanide. The best fit model was determined on the basis of
error functions MPSD. On the basis of the lowest error
function values MPSD, the perfect fitting of the experi-
mental results was attained using Brouser–Weron–Sotot-
longo model (Fig. 8a, b) for both phenol and cyanide
among all the tried kinetic models.
On the basis of the lowest error values MPSD, Brouser–
Weron–Sototlongo kinetic model indicates better fit with
the experimental data as compared to the other models. The
better fit of Brouser–Weron–Sototlongo kinetic model
indicates that the removal of both phenol and cyanide onto
S. odorifera (MTCC 5700) immobilized on the surface of
CSAC followed chemisorption interactions type, revealing
that the rate controlling step might be chemical adsorption
comprising valency forces over exchange or distribution of
electrons between phenol and cyanide anions and S.
odorifera MTCC 5700 immobilized on to CSAC. Fur-
thermore, the Brouser–Weron–Sototlongo kinetic model
states additional notable data which is the time important to
adsorb half the maximum amount (tbws,a). Brouser–Weron–
Sototlongo kinetic model has a good fitting performance; it
states such quality data (i.e., adsorption capacity close to
experimental data, qe(BWS), and the time of half reaction
(tbws,a) which are very useful for an industrial treatment
design (Ncibi et al. 2014). For Fractal-like models, such as
Fractal-like pseudo first order, Fractal-like pseudo second
order, Fractal-like exponential, Fractal-like mixed first,
second order) the rate coefficient for adsorption is mea-
sured as a function of time using the Fractal-like idea. One
of the possible physical meanings of Fractal-like kinetics
was that adsorption of phenol and cyanide happened at
solid/solution edge. In this methodology, it was indicated
Table 3 Kinetic model parameters for simultaneous biosorption and
bioaccumulation of phenol and cyanide onto CSAC
Kinetic models Parameters Phenol Cyanide
Fractional power
model
kfp 0.9426 0.1527
v 0.7418 0.6263
MPSD 1.7384 1.2814
Pseudo first order qe 19.226 1.7059
k1 0.0336 0.0515
MPSD 1.365 1.3793
Pseudo second order qe 30.531 2.4399
k2 0.0007 0.0161
MPSD 1.4101 1.2348
Elovich model ael 1.2305 0.158
bel 0.6678 1.215
MPSD 1.1291 1.1415
Avrami model qe 19.225 1.7059
kav 0.1526 0.2024
nav 0.2201 0.2546
MPSD 1.365 1.3793
Modified second
order model
qe 34.808 2.8986
k1m 0.0173 0.0267
b1m 1.0095 1.0296
MPSD 1.2879 0.7972
Ritchie second order
model
qe 30.523 2.4399
k1R 0.0219 0.0394
MPSD 1.41 1.2348
Exponential kinetic
model
qe 23.489 1.9152
kex 0.0166 0.029
MPSD 1.4038 1.2363
Mixed first, second
order model
qe 28.797 2.2689
km 0.0027 0.0055
f2 0.8827 0.8699
MPSD 1.4096 1.2371
Fractal-like mixed
first, second order
model
qe 17.239 1.9153
feq -20.773 -14.53
kfm 0.7742 0.8039
a 0.4862 0.4405
MPSD 0.9178 0.6903
Fractal-like first
order model
qe 21.146 2.3531
kff -0.0332 -0.0527
a 0.9537 0.8051
MPSD 1.3427 0.9397
Fractal-like second
order model
qe 33.843 3.793
kfs 0.0006 0.0087
a 0.9641 0.8125
MPSD 1.3992 0.9783
Fractal-like
exponential model
qe 26.149 2.8511
kfex 0.0158 0.0255
a 0.9614 0.8187
MPSD 1.3949 0.9759
Table 3 continued
Kinetic models Parameters Phenol Cyanide
Brouser–Weron–
Sototlongo model
qe 17.524 2.0091
tbws,a 20.104 21.895
nbws 2.0871 2.0968
a 1.8118 1.4651
MPSD 0.4532 0.5475
3252 Appl Water Sci (2017) 7:3241–3255
123

that by passing time, several paths for phenol and cyanide
adsorption on adsorbent surface seems. The error values
MPSD for Fractal-like mixed first, second order model and
Brouser–Weron–Sototlongo kinetic model was better than
that other kinetic models for phenol and cyanide. Fractal-
like mixed first, second order kinetic model representing
the rate of adsorption was dependent on the initial con-
centration of adsorbate in solution and rate of agitation.
However, the Brouser–Weron–Sototlongo kinetic model
revealed the complex mechanism of removal process.
Figure 8a and b demonstrates the comparison of kinetic
models for phenol and cyanide removal, respectively.
Conclusions
Batch studies for the removal of phenol and cyanide from
the binary component aqueous solution have been carried
out using activated carbon acquired from coconut shell
with immobilization of bacterium S. odorifera (MTCC
5700). Optimum conditions for simultaneous biosorption
and bioaccumulation of phenol and cyanide were
accomplished at CSAC dosage of 30 g/L, pH of 8, and
temperature 30 �C with an initial concentration 500 mg/L
of phenol and 50 mg/L of cyanide. Under the optimal
conditions, maximum phenol and cyanide removal effi-
ciencies were acquired as 71.36 and 88.40 % from
simultaneous biosorption and bioaccumulation process. In
conclusion, a binary component system was found better
than monocomponent biosorption system for the simul-
taneous elimination of phenol and cyanide using S.
odorifera (MTCC 5700) immobilized onto CSAC
biosorbent surface. In a binary component system among
six multicomponent isotherms, extended Freundlich
model indicate a better fit for both phenol and cyanide.
Therefore, a synergism effects were exhibited for both
phenol and cyanide, in binary component system. Among
different kinetic models used in this study, Brouser–
Weron–Sototlongo kinetic model as well as Fractal-like
mixed first second order kinetic models for phenol and
cyanide found appropriate to calculate the adsorption
kinetic onto CSAC. S. odorifera (MTCC 5700) immobi-
lized on the surface of CSAC can be used as a capable
biosorbent for the removal of both phenol and cyanide
from wastewater.
Acknowledgments The authors greatly acknowledge and appreciate
the Ministry of Human Resource and Development, Government of
India (MHRD, New Delhi) for providing financial support, and the
facilities provided by IIT Roorkee, Roorkee.
Open Access This article is distributed under the terms of the
Creative Commons Attribution 4.0 International License (http://
creativecommons.org/licenses/by/4.0/), which permits unrestricted
use, distribution, and reproduction in any medium, provided you give
appropriate credit to the original author(s) and the source, provide a
link to the Creative Commons license, and indicate if changes were
made.
(a) (b)
Fig. 8 a Comparison of kinetic models for phenol, b comparison of kinetic models for cyanide
Appl Water Sci (2017) 7:3241–3255 3253
123
References
Agarwal B, Balomajumder C (2012) Coke waste water: a source of
phenol and cyanide assimilating bacteria. J Sci Tech Maneg
5(1):33–38
Agarwal B, Balomajumder C (2013) Simultaneous adsorption and
biodegradation of phenol and cyanide in multicomponent
system. Inter J Environ Eng Manage 4:233–238
Agarwal B, Balomajumder C, Thakur PK (2013) Simultaneous co-
adsorptive removal of phenol and cyanide from binary solution
using granular activated carbon. Chem Eng J 228:655–664
Akcil A (2003) Destruction of cyanide in gold mill effluents:
biological versus chemical treatments. Biotechnol Adv
21:501–511
Aksu Z, Akpinar D (2008) Simultaneous adsorption of phenol and
chromium (VI) from binary mixtures onto powdered activated
carbon. J Environ Sci Health 3:379–405
Amudaa OS, Giwa AA, Bello IA (2007) Removal of heavy metal
from industrial wastewater using modified activated coconut
shell carbon. Biochem Eng J 36:174–181
APHA (1998) Standard methods for examination of water and
wastewater, 20th edn. American Public Health Association,
Washington, DC, USA
ATSDR (2006) Agency for toxic substances and disease registry,
toxicological profile for cyanide, US, Department of Health and
Human Services, Public Health Statement
ATSDR (2008) Agency for toxic substances and disease registry,
toxicological profile for Phenol, US, Department of Health and
Human Services, Public Health Service
Busca G, Berardinelli S, Resini C, Arrighi L (2008) Technologies for
the removal of phenol from fluid streams: a short review of
recent developments. J Hazard Mater 160:265–288
Carvalho MF, Duque AF, Goncalves IC, Castro PML (2007) Adsorption
of fluorobenzene onto granular activated carbon: isotherm and
bioavailability studies. Bioresour Technol 98:3424–3430
Daffalla SB, Mukhtar HS, Shaharun M (2013) Removal of phenol
from aqueous solutions using rice husk ash. Casp J Appl Sci Res
2:36–49
Dash RR, Majumder CB, Kumar A (2008) Treatment of metal
cyanide bearing wastewater by simultaneous adsorption and
biodegradation (SAB). J Hazard Mater 152:387–396
Dash RR, Gaur A, Balomajumder C (2009a) Cyanide in industrial
wastewaters and its removal: a review on biotreatment. J Hazard
Mater 163:1–11
Dash RR, Balomajumdar C, Kumar A (2009b) Removal of cyanide
from water and wastewater using granular activated carbon.
Chem Eng J 146(1):408–413
Dash RR, Balomajumdar C, Kumar A (2009c) Removal of metal
cyanides from aqueous solutions by suspended and immobilized
cells of Rhizopus oryzae (MTCC 2541). Eng Life Sci J
9(1):53–59
Dash RR, Balomajumdar C, Kumar A (2009d) Treatment of cyanide
bearing water/wastewater by plain and biological activated
carbon. J Ind Engg Chem Res 48(7):3619–3627
Dash RR, Dash RR, Balomajumdar C (2014) Treatment of cyanide
bearing effluents by adsorption, biodegradation and combined
processes: effect of process parameters. Desalin Water Treat
52:3355–3366
Deveci H, Yazıcı EY, Alp I, Uslu T (2006) Removal of cyanide from
aqueous solutions by plain and metal-impregnated granular
activated carbons. Int J Min Process 79:198–208
Doney SC (2010) The growing human footprint on coastal and open-
ocean biogeochemistry. Science 328:1512–1516
Haerifar M, Azizian S (2013) An exponential kinetic model for
adsorption at solid/solution interface. Chem Eng J 215–216:65–71
Kilic M, Varol EA, Putun AE (2011) Adsorptive removal of phenol
from aqueous solutions on activated carbon prepared from
tobacco residues: equilibrium, kinetics and thermodynamics.
J Hazard Mater 189:397–403
Kim MY, Park D, Jeon CO, Lee SD, Park MJ (2008) Effect of HRT
on biological pre denitrification process for the simultaneous
removal of toxic pollutants form cokes wastewater. Bioresour
Technol 99:8824–8832
Kirubakaran CJ, Krishnaiah K, Seshadri SK (1991) Experimental
study of the production of activated carbon from coconut shells
in a fluidized bed reactor. Ind Eng Chem Res 30:2411–2416
Kujawski W, Warszawski A, Ratajczak W, Porebski T, Capala W
(2004) Removal of phenol from wastewater by different
separation techniques. Desal 163:287–296
Kumar S, Zafar M, Prajapati JK, Kumar S, Kannepalli S (2011)
Modeling studies on simultaneous adsorption of phenol and
resorcinol onto granular activated carbon from simulated aque-
ous solution. J Hazard Mater 185:287–294
Lin S, Juang R (2009) Adsorption of phenol and its derivatives from
water using synthetic resins and low-cost natural adsorbents: a
review. J Environ Manag 90:1336–1349
Liu J, Baozhen W, Li W, Chengji J, Cao X, Wang LM (1996)
Removal of nitrogen from coal gasification and coke plant
wastewater in anoxic–aerobic submerged biofilm-activated
sludge (SBF-AS) hybrid system. Water Sci Technol 34:17–24
Lu D, Zhang Y, Niu S, Wang L, Lin S, Wang C et al (2012) Study of
phenol biodegradation using Bacillus amyloliquefaciens strain
WJDB-1 immobilized in alginate-chitosan-alginate (ACA) micro-
capsules by electrochemical method. Biotechnol 23:209–219
Michalak I, Chojnacka K, Witek-Krowiak A (2013) State of the art
for the biosorption process—a review. Appl Biochem Biotechnol
170:1389–1416
Mondal P, Majumder CB, Mohanty B (2008) Effects of adsorbent
dose, its particle size and initial arsenic concentration on the
removal of arsenic, iron and manganese from simulated ground
water by Fe3? impregnated activated carbon. J Hazard Mater
150:695–702
Moussavi G, Khosravi R (2010) Removal of cyanide from wastewater
by adsorption onto pistachio hull wastes: parametric experi-
ments, kinetics and equilibrium analysis. J Hazard Mater
183:724–730
Mukherjee S, Kumar S, Misra AK, Fan M (2007) Removal of phenols
from water environment by activated carbon, bagasse ash and
wood charcoal. Chem Eng J 129:133–142
Ncibi MC, Ranguin R, Pintor MJ, Jeanne-Rose V, Sillanpaa M,
Gaspard S (2014) Preparation and characterization of chemically
activated carbons derived from Mediterranean Posidonia ocean-
ica (L.) fibres. J Anal Appl Pyrolysis 109:205–214
Panagou EZ, Kodogiannis VS (2009) Application of neural networks
as a nonlinear modelling technique in food mycology. Expert
Syst Appl 36:121–131
Prieto M, Hidalgo AJ, Serra L, Llama MJ (2002) Degradation of
phenol by Rhodococcus erythropolis UPV-1 immobilized on
Biolite in a packed-bed reactor. J Biotechnol 97:1–11
Ren J, Huo CF, Wen XD, Cao Z, Wang JG, Li YW et al (2007)
Adsorption of NO, NO2, pyridine and pyrrole on a-M2C(0001).
Surf Sci 601:1599–1607
Reynel-Avila HE, Mendoza-Castillo DI, Hernandez-Montoya V,
Bonilla-Petriciolet A (2011) Multicomponent removal of heavy
metals from aqueous solution using low-cost sorbents. In:
Antizar-Ladislao B, Sheikholeslami R (eds) Water production
and wastewaters treatment, vol 1. Nova Science Publisher, New
York, pp 69–99
Sawalha MF, Peralta-Videa JR, Romero-Gonzales J, Gardea-Torres-
dey JL (2006) Biosorption of Cd(II), Cr(III), and Cr(IV) by
3254 Appl Water Sci (2017) 7:3241–3255
123
saltbush (Atriplex canescens) biomass: thermodynamic and
isotherm studies. J Colloid Interface Sci 300:100–104
Silva M, Fernandes A, Mendes A, Manaia CM, Nunes OC (2004)
Preliminary feasibility study for the use of an adsorption/
bioregeneration system for molinate removal from effluents.
Water Res 38:2677–2684
Singh N, Agarwal B, Balomajumder C (2016) Simultaneous treatment
of phenol and cyanide containing aqueous solution by adsorp-
tion, biotreatment and simultaneous adsorption and biotreatment
(SAB) process. J Environ Chem Eng 4:564–575
Sodeinde OA (2012) Preparation of a locally produced activated
carbon from coconut shells and its use in reducing hexamine
cobalt (III). Inter J Chem Eng and App 3:67–71
Srihari V, Das A (2008) The kinetic and thermodynamic studies of
phenol-sorption onto three agro-based carbons. Desal
225:220–234
Stavropoulos GG, Skodras GS, Papadimitriou KG (2015) Effect of
solution chemistry on cyanide adsorption in activated carbon.
Appl Therm Eng 74:182–185
Su W, Zhou L, Zhou YP (2003) Preparation of microporous activated
carbon from coconut shells without activating agents. Carbon
41:861–863
Vedula RK, Balomajumder C (2011) Simultaneous adsorptive
removal of cyanide and phenol from industrial wastewater:
optimization of process parameters. Res J Chem Sci 4:30–39
Appl Water Sci (2017) 7:3241–3255 3255
123